
DEPARTMENT OF THE INTERIOR U.S. … · of Seismic Reflection Velocity Models By F.N. Zihlman1...
37
DEPARTMENT OF THE INTERIOR U.S. GEOLOGICAL SURVEY ISOEDIT: A Program for Interactive Editing of Seismic Reflection Velocity Models By F.N. Zihlman 1 Open-File Report 89-310A Although this program has been extensively tested, the Geological Survey cannot guarantee that it will give accurate results for all applications nor that it will work on all computer systems. This report is preliminary and has not been reviewed for conformity with U.S. Geological Survey editorial standards and stratigraphic nomenclature. Any use of trade names is for descriptive purposes only and does not imply endorsement by the U.S. Geological Survey. U.S. Geological Survey, Box 25046, Denver Federal Center, Denver, CO 80225 1989
Transcript of DEPARTMENT OF THE INTERIOR U.S. … · of Seismic Reflection Velocity Models By F.N. Zihlman1...

DEPARTMENT OF THE INTERIOR
U.S. GEOLOGICAL SURVEY
ISOEDIT: A Program for Interactive Editing
of Seismic Reflection Velocity Models
By F.N. Zihlman1
Open-File Report 89-310A
Although this program has been extensively tested, the Geological Survey cannot guarantee that it will give accurate results for all applications nor that it will work on all computer systems.
This report is preliminary and has not been reviewed for conformity with U.S. Geological Survey editorial standards and stratigraphic nomenclature. Any use of trade names is for descriptive purposes only and does not imply endorsement by the U.S. Geological Survey.
U.S. Geological Survey, Box 25046, Denver Federal Center, Denver, CO 80225
1989

CONTENTS
Page
Abstract............................................................. 1Introduction......................................................... 1Software/hardware requirements and availability...................... 1Program overview..................................................... 2Input file format.................................................... 3Output file format................................................... 3Entry of input/output file names..................................... 6Entry of data display parameters..................................... 6Starting and ending location numbers................................. 6Starting and ending time values...................................... 6Isovelocity contouring parameters.................................... 9Regional velocity displays and edits................................. 9Regional data display/edit keys...................................... 9Individual velocity function display and edits....................... 14Individual velocity function data display/edit keys.................. 20Adding a point above or belov the minimum and maximum time picks..... 20Program notes........................................................ 28
ILLUSTRATIONS
Figure 1. ISOEDIT input file format................................ 42. ISOEDIT DBF output file format........................... 53a. Input/output file name prompts with no output file name
entered.............................................. 73b. Input/output file name prompts specifying an output file
and format........................................... 84. Data display parameters prompts.......................... 105. Regional display of the input data set................... 136a. Regional display help screen describing the function key
usage................................................ 136b. Regional display help screen describing the cursor
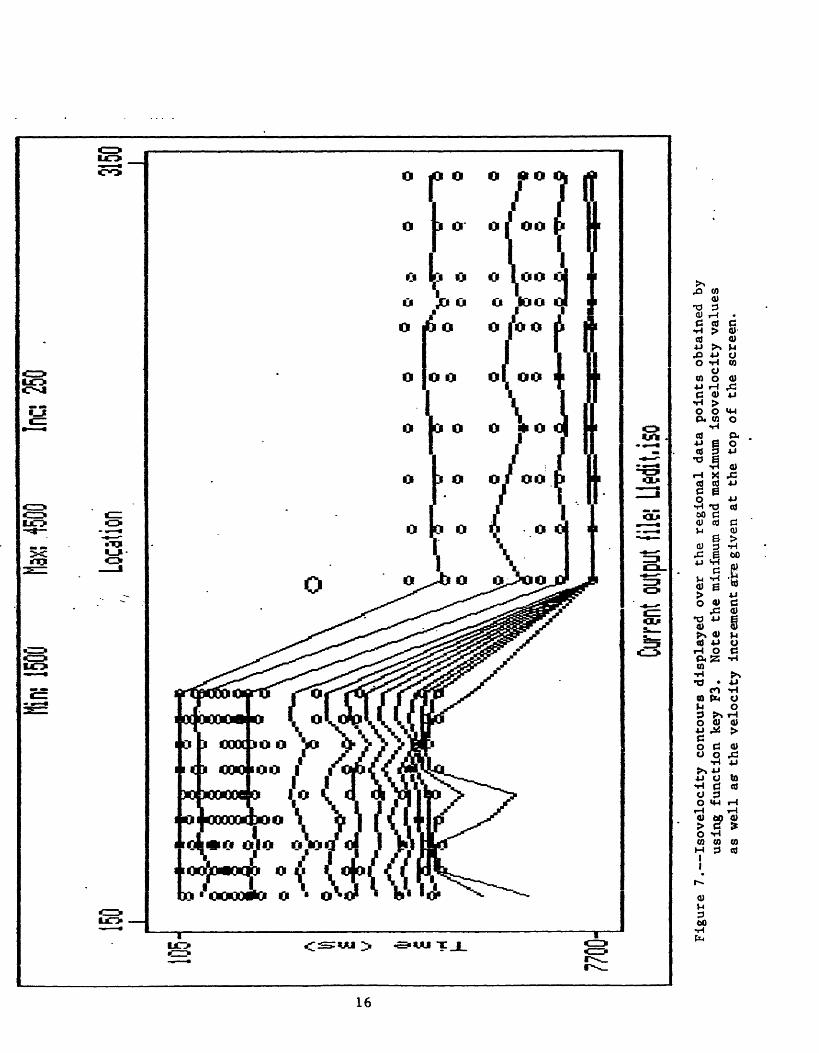
movement keys........................................ 157. Isovelocity contours displayed over the regional data
points............................................... 168. Isovelocity contours displayed without the regional data
points............................................... 179a. Regional data display with the cursor positioned over a
data point to be selected and shifted to a different time coordinate...................................... 17
9b. Regional data display after a data point has been selected and the cursor moved to a different time coordinate...................................... 17
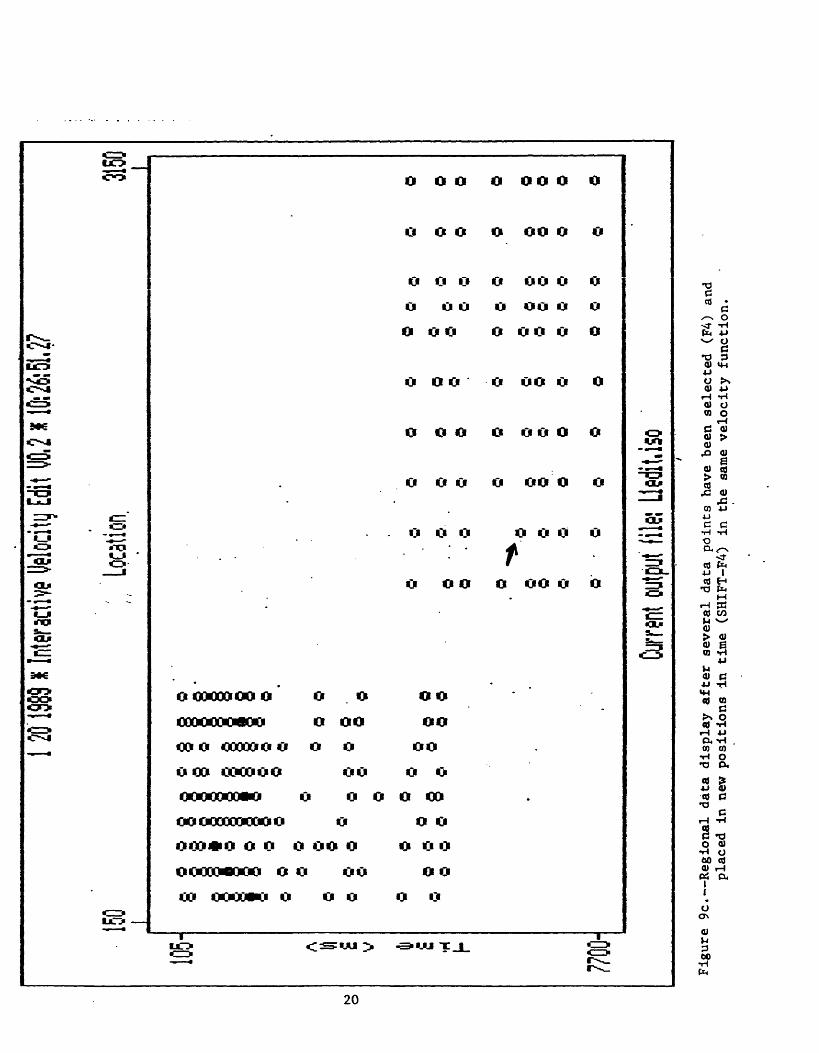
9c. Regional data display after several data points have been selected and placed at new time coordinates within the same velocity function.................... 17
10. Screen dump of a regional data display................... 18
11. Regional data display with a title bar at the bottomdisplaying the function range written to an outputfile................................................. 19
12. Individual velocity function display of the regional velocity function edited in figures 9a, 9b and 9c................................................... 22
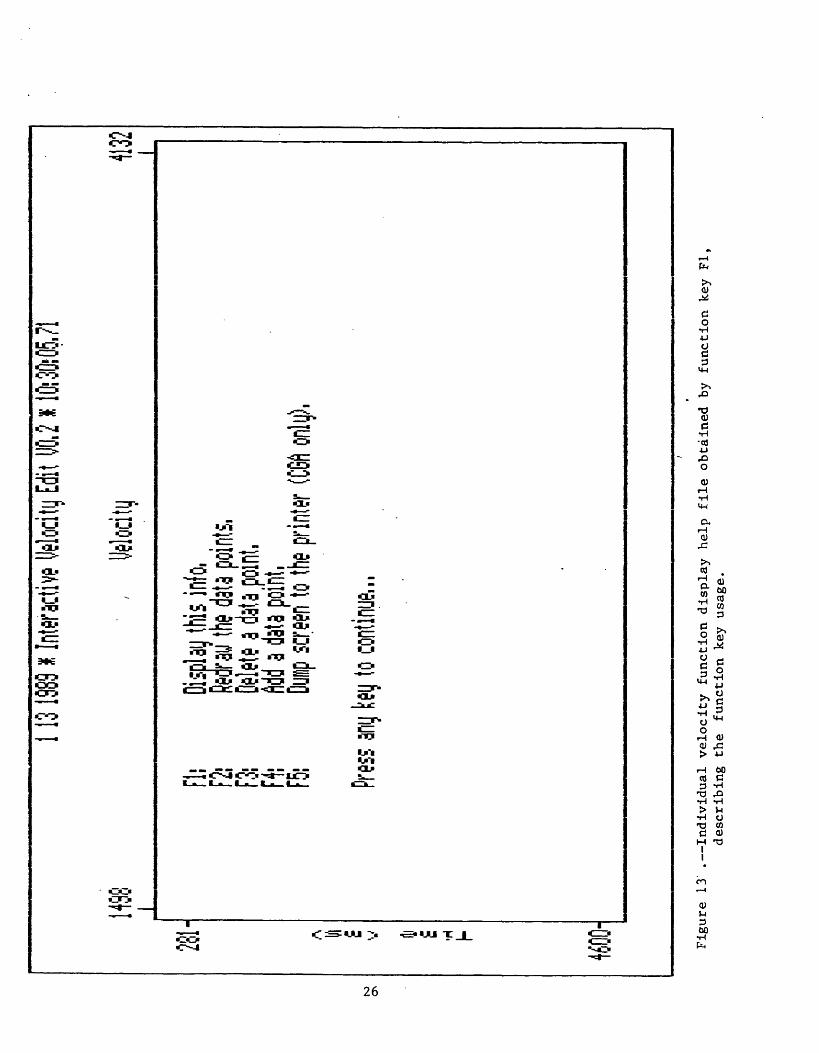
13a. Individual velocity function display help filedescribing the function key usage.................... 23
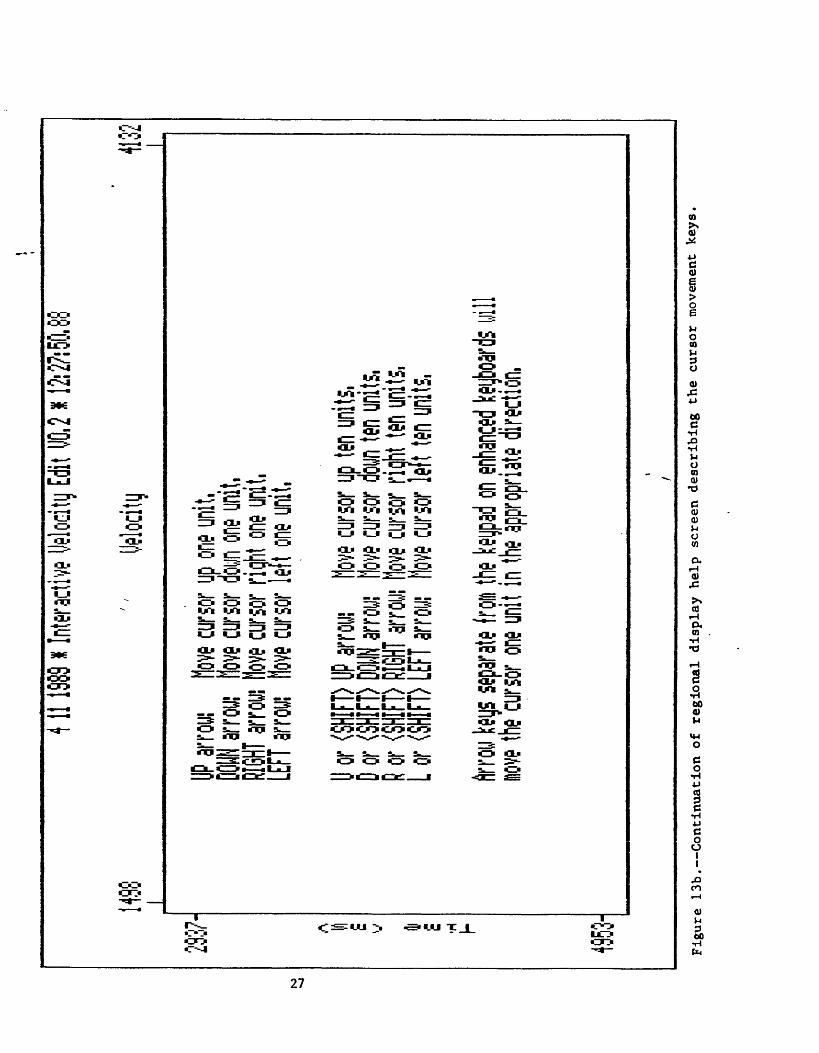
13b. Individual velocity function display help filedescribing the cursor movement keys.................. 23
14a. Individual velocity function displayed in figure 12 with the cursor positioned over a time/velocity point to be removed.................................. 24
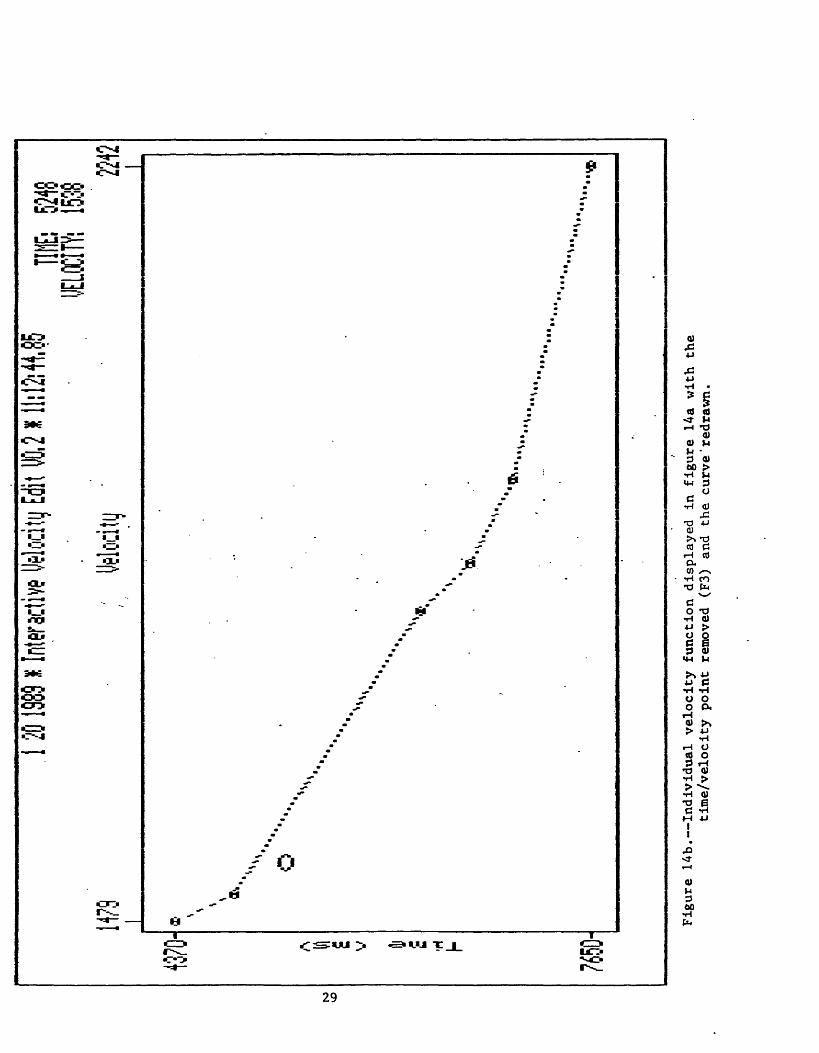
14b. Individual velocity function displayed in figure 14awith the time/velocity point removed and the curveredrawn.............................................. 24
15a. Individual velocity function of figure 14b with the cursor positioned to add a new time/velocity point................................................ 25
15b. Individual velocity function of figure 15a witha new time/velocity point added...................... 25
16. Screen dump of the individual velocity function offigure 15b........................................... 26
17. Regional display of the data set after editing the individual velocity function of figures 14-16................................................ 27
TABLES
Table 1. Cursor movement keys definitions......................... 11Table 2. Regional velocity display function keys definitions...... 12Table 3. Individual velocity function display function keys
definitions.......................................... 24
11

ISOEDIT: A PROGRAM FOR INTERACTIVE EDITING OFSEISMIC REFLECTION VELOCITY MODELS
By Frederick N. Zihlnan
ABSTRACT
ISOEDIT is an interactive velocity editing program written in the C programming language for use on PC/AT-type microcomputers. ISOEDIT takes a file of velocity functions composed of time/velocity pairs grouped by location and displays them regionally (like a conventional seismic section) or individually (velocity versus time) in CGA, EGA-VGA or Hercules resolution. Isovelocity contours may be displayed over the regional display with or without data points being displayed. Time/velocity points may be edited graphically. Time/velocity points may be shifted along the time coordinate in the regional display; added and/or removed in the individual display. CGA resolution displays may be sent to a graphics-capable printer. Edited data may be written to a file in either the input format or DISCO "DEFINE" module format for incorporation into a DISCO batch processing job.
INTRODUCTION
In 1987, we purchased four 80286 personal computers as standalone work stations serving the VAX 11/780 DISCO seismic data processing system. This resulted in a reduced interactive demand on the VAX, thus allowing more of it's resources to be used for batch data processing. ISOEDIT was written to provide users the capability to enter, inspect and edit velocity functions interactively on the PC. The functions are displayed on the PC screen and the final edited velocity functions may be output in DISCO "DEFINE" module format that can be uploaded to the VAX and incorporated into a DISCO batch processing file.
SOFTWARE/HARDWARE REQUIREMENTS AND AVAILABILITY
ISOEDIT was developed using Borland Turbo C V2.0 on a Kaypro 2861 having an Intel 80286 processor, enhanced keyboard and MS-DOS V3.21. Compatibility has been tested only with an IBM AT. Compatibility with other systems is unknown but assumed to be good.
ISOEDIT may be run on PC, XT, and AT type microcomputers using MS-DOS (PC-DOS) V2.0 or greater. The executable image is available in two versions: PC/XT type and AT type. The PC/XT type will run on AT type machines but the AT type requires an AT machine. IOSEDIT will use a math coprocessor if one is present, otherwise it will use software emulation. ISOEDIT will automatically detect and use CGA, EGA, VGA and Hercules video resolutions but will only produce a monochrome display on a color monitor. This open-file report (OF89-xxA) is available in paper copy. The executable and source code files are available as a separate open file diskette, OF89-xxB. The diskette is 5.25 inches.

TERMS USED
Below are listed some common terms and their definitions as they are used in the body of the text:
Velocity function: Seismic velocity expressed as a mathematical function of depth or time (Sheriff, 1976). It is represented by a series of time/ velocity points by location.
Velocity model: A series of velocity functions for a region (Sheriff, 1976).
Time/Velocity point: The velocity at a given point in time within a velocity function.
Individual display: A graphical display of a single velocity function. The horizontal axis represents velocity increasing from left to right. The vertical axis represents time increasing from top to bottom.
Regional display: A graphical display of all the velocity functionswithin a region comprising a velocity model. Each velocity function within the velocity model is represented by a vertical column of points representing the time/velocity values. The horizontal axis represents the locations of the individual velocity function within the velocity model. The vertical axis represents time increasing from top to bottom.
Record section: A display of seismic traces side-by-side to show the continuity of events (Sheriff, 1976).
Input file: An ascii file of velocity functions comprising a velocity model in the format necessary in order to be read by ISOEDIT.
Output file: An ascii file of time velocity functions written by ISOEDIT in either the ISOEDIT input format or in DISCO DEFINE module format.
PROGRAM OVERVIEW
ISOEDIT consists of three program sections: entry of input/output file names, entry of data display parameters and data display/edit functions. The program is started by typing ISOEDIT at the MS-DOS prompt, The user is first prompted for the input and output file names and output format. Entering "exit" or "quit" to either file name prompt will halt program execution and return the user to the MS-DOS prompt.
Once the input/output file names have been entered, the program prompts for data display parameters: the starting and ending location numbers, minimum and maximum time values to display, the starting and ending velocity values and velocity increment for isovelocity contouring. Entering "exit" to any of these prompts halts program execution, while entering "quit" will return the user to the input/output file names
prompts. All prompts offer a default response, shown vithin square brackets ([{default}]), vhich may be taken by pressing the carriage return. A response to a program prompt becomes the nev default for that prompt.
Upon successful completion of all prompts, ISOEDIT vill open the input file and read all the velocity functions vithin the starting and ending values entered. Those velocity functions found vill be displayed vith the lov location number on the left and high location number on the right. ISOEDIT is capable of automatically detecting CGA, EGA, VGA or Hercules screen resolutions and displaying the data accordingly. The user may edit the data displayed by either moving time/velocity points along the time coordinate or by adding and deleting individual time/velocity points from selected functions. Editing, redisplaying of the data points, isovelocity contouring, or data output continues until the user presses "q". Upon pressing Mq M , the user is returned to the data display parameters portion of the program. If the user has not explicitly saved the current screen of data to an output file before pressing "q", all edits to that screen vill be lost. Note that all prompt responses are case-insensitive.
INPUT FILE FORMAT
ISOEDIT input files (referred to as "ISO" files) are ascii text files consisting of velocity function location numbers (usually CDP numbers) followed by time/velocity pairs. Each velocity function is separated from the next by a blank line vhich may actually contain any whitespace, or non-printing, characters. Blank lines must appear between velocity functions and nowhere else vithin the input file. The velocity function location numbers may start in any column and must be integer values in ascending order throughout the file. Each time/velocity pair must be on a separate line vith the time value on the left and the velocity value on the right. Time/velocity pairs may start in any column and must have a minimum of one vhitespace separating the time and velocity values. Time values are traditionally given in milliseconds (the TIME axis is labeled as such in the displays) and velocity values as either meters or feet per second, though ISOEDIT vill accept practically anything given it (for example time/depth pairs). There is a maximum limit of fifty time/velocity pairs per velocity function and no limit on hov many velocity functions per input file. Figure 1 shovs the file format from a portion of an input file.
OUTPUT FILE FORMAT
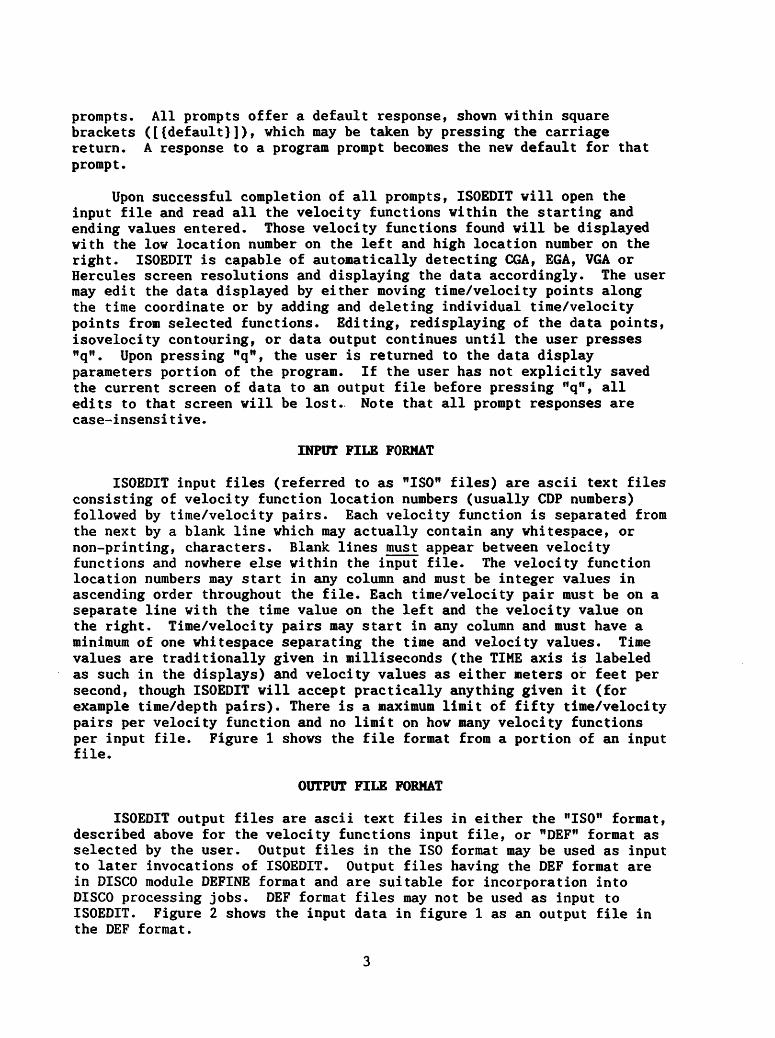
ISOEDIT output files are ascii text files in either the "ISO" format, described above for the velocity functions input file, or "DBF" format as selected by the user. Output files in the ISO format may be used as input to later invocations of ISOEDIT. Output files having the DBF format are in DISCO module DEFINE format and are suitable for incorporation into DISCO processing jobs. DBF format files may not be used as input to ISOEDIT. Figure 2 shovs the input data in figure 1 as an output file in the DBF format.

250 < Location number of the velocity185 1649 function331 1700811 1805 FIRST VELOCITY FUNCTION1277 19531453 19892029 21672827 2309
350105 1589379 1662800 1820 SECOND VELOCITY FUNCTION1307 19791995 21802329 2262
1050124 1470425 1725850 1835 LAST VELOCITY FUNCTION1372 19981671 20372646 2393
Figure 1. ISOEDIT input file format. The ellipses indicate intermediate
functions not shown.
HANDVEL 250185 1649 331 1700 811 1805 1277 19531453 1986 2029 2167 2827 2309HANDVEL 350105 1589 379 1662 800 1820 1307 19791995 2180 2329 2262
HANDVEL 1050124 1470 425 1725 850 1835 1372 19981671 2037 2646 2393
Figure 2. ISOEDIT DBF output file format. The ellipses indicate
intermediate functions not shown.
ENTRY OF INPUT/OUTPUT FILE NAMES
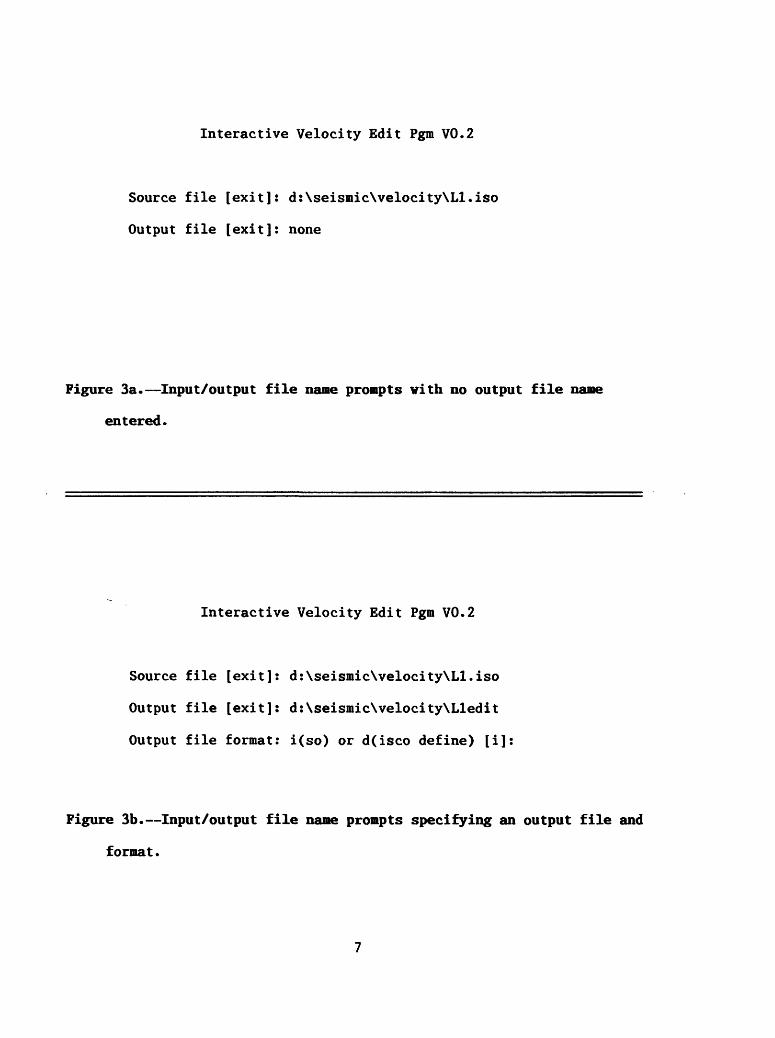
ISOEDIT will prompt the user for the input and output file names. These can be any standard MS-DOS file names and will remain in use until explicitly changed by the user or the program exited. Input files normally have a ".ISO" file suffix to indicate a file having the proper input format but may have any suffix desired. Output file names are entered with no file suffix. After the user enters the output file name the program prompts for the output file format. The user enters an "i" to indicate an output file having an "ISO" format, or a "d" to indicate a DISCO DEFINE file format. ISOEDIT will append either ".ISO" (ISO format) or ".DBF" (DEFINE format) to the output file name entered. If the user specifies an output file name for a currently existing file, that file will be written over by ISOEDIT, destroying any previous data contained in that file. If no output file is desired, the user should enter "none" in response to that program prompt. Entering either "exit" or "quit" to either file prompt will halt the program. Figure 3a shows the input/output files prompts with no output file selected. Figure 3b shows the input/output files prompts with an output file name and the output file format selected.
ENTRY OF DATA DISPLAY PARAMETERS
After accepting input and output file names, ISOEDIT will prompt the user for the starting and ending velocity function location (CDP) numbers to read from the input file, the starting and ending time range to display, the starting and ending velocity values for the isovelocity contouring and the velocity increment between contours. The user response to any prompt will become the new default value for that prompt. Entering "quit" to any prompt will return the user to the input/output file names entry portion of ISOEDIT. Entering "exit" to any prompt halts program execution. Figure 4 shows all the data display parameters prompts.
STARTING AND ENDING LOCATION NUMBERS
The user will be prompted for the starting location number and ending location numbers (usually CDP numbers) to be used as the horizontal end points for the regional data display. These should be entered as integer values with the ending value greater than the starting value. The starting location, or first CDP to display, will be located on the left of the display. The ending location, or last CDP to display, will be located on the right. ISOEDIT will read the input file and accept any velocity function whose location is within these end points, up to a maximum of twenty locations. If more than twenty functions exist within the location range specified, the twentieth velocity function read becomes the ending location number, as well as the ending location default value. All functions are displayed on the screen at their true relative horizontal position.
Interactive Velocity Edit Pgm V0.2
Source file [exit]: d:\seismic\velocity\Ll.iso
Output file [exit]: none
Figure 3a. Input/output file name prompts vith no output file name
entered.
Interactive Velocity Edit Pgm V0.2
Source file [exit]: d:\seismic\velocity\Ll.iso
Output file [exit]: d:\seismic\velocity\Lledit
Output file format: i(so) or d(isco define) [i]:
Figure 3b. Input/output file name prompts specifying an output file and
format.

Interactive Velocity Edit Pgm V0.2
input file in use: d:\seismic\velocity\Ll.iso output file in use: d:\seismic\velocity\Lledit.iso
First CDP to display [1]: 150
Last CDP to display [500]: 3150
Starting time value to display [-11:
Ending time value to display [-1]:
Starting iso-line velocity [OJ: 1500
Ending iso-line velocity [20000]: 4500
Iso-line velocity increment [1000]: 250
Figure 4. Data display parameters prompts. Default values are shown
vithin the square brackets.
8

STARTING AND ENDING TIME VALUES
The user will be prompted for the starting and ending time values to be used as the vertical end points for the data display. The starting time value will be located at the top of the display, the ending time value will be located at the bottom. These should be entered as integer values though ISOEDIT will accept floating point values and truncate them to integers. If the user enters a time value less than zero for the starting time value ISOEDIT will determine the minimum time found from those velocity functions selected and use it as the starting time value. Similarly, if the user enters an ending time less than zero ISOEDIT vill determine the maximum time from those velocity functions selected. ISOEDIT vill display all time/velocity pairs within this time and location range at horizontal and vertical scales relative to the size of the view screen.
ISOVELOCITY CONTOURING PARAMETERS
The user vill be prompted for the starting and ending velocity values and the velocity increment to be used for isovelocity contouring. These should be entered as integers though ISOEDIT vill accept floating point values and truncate them to integers. If a user enters a starting velocity less than the lovest velocity found in the velocity functions selected, it vill be adjusted to the lovest velocity found amongst those functions, which vill also become the nev starting velocity default. A similar determination vill be made if the user enters an ending velocity greater than the greatest velocity found in the velocity functions selected.
REGIONAL VELOCITY DISPLAYS AND EDITS
After ansvering all the program prompts the first display afforded the user is the regional one consisting of all the velocity points found in the input data set (figure 5) and displayed vithin the desired time range. The horizontal axis represents the location of the displayed velocity functions in space and the vertical axis the position of the velocity picks in time. Time/velocity pairs composing the individual velocity functions are represented as small circles or small squares, vith the small squares symbolizing simple velocity inversions. The larger circle represents the screen cursor vhich may be moved about the screen by the use of various keyboard keys, summarized in Table 1. Various data displays and editing functions are performed vith function keys F2 through F7, summarized in Table 2 and discussed belov. Help in use of the function keys and cursor movement is available by pressing function key Fl (figures 6a and 6b). Pressing "q" vill quit the regional display and return the user to ISOEDIT's data display parameters section.
REGIONAL DATA DISPLAY/EDIT KEYS
F2 vill redisplay the data points on the screen vithout the cursor. F2 should alvays be pressed at the end of a help session to redisplay the data points. The cursor will remain invisible until a movement key is pressed, allowing a screen dump to a printer (described below) of the data points without the cursor being displayed.
9

120198
9 * In
teractiv
e Velo
city Ed
it V0.2
* 10:2
6:51,2
?
150Loc
ation
£ v I £
??00-
e e
e e
8 *
o o o o
a o a
, o
0
G
0-3
8
e
o 08
0
o o
w so
*
o o o o 3
o o
2o
sO 0
0
§O
O
o 0 0 0 'o. o
o o o Q o
o o o o 0 0
o 0 o o 0
o o 0 o o o
o o
o o{J
0 0
O o
'-
2 o
oO Q O
O 0
O
o c>
o
Curren
t outp
ut file
1, Lled
it.iso
o o o o o o
o 0 o
Figu
re 5. Regional di
spla
y of the
inpu
t da
ta set.
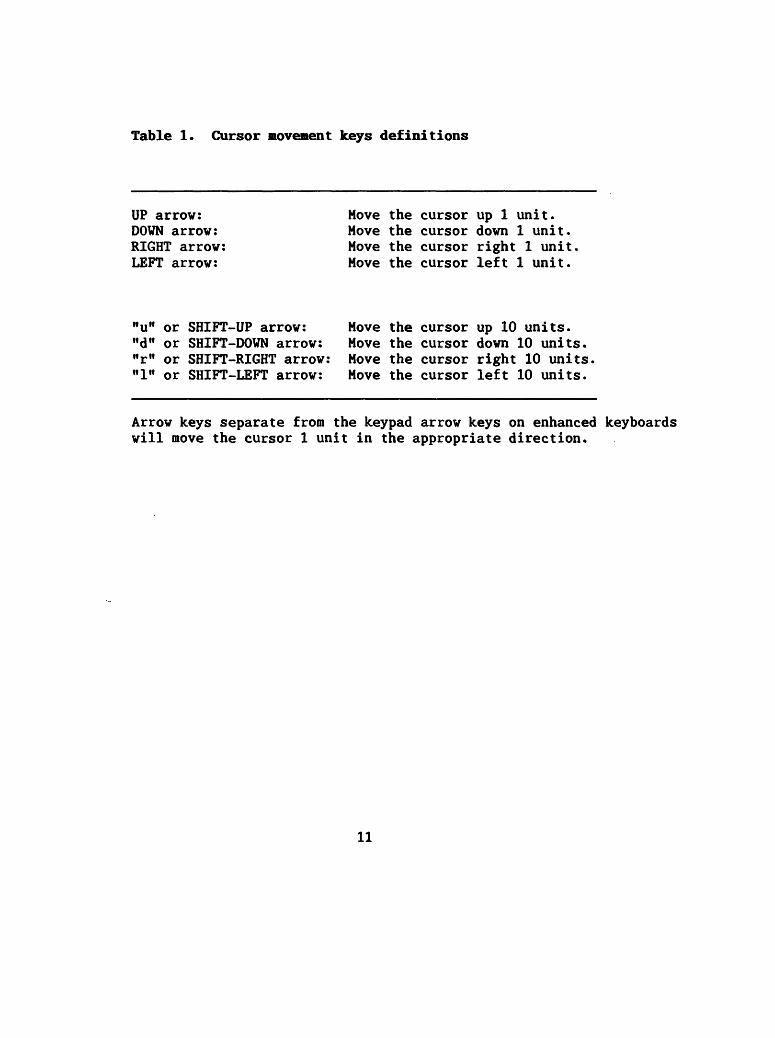
Table 1. Cursor movement keys definitions
UP arrow: DOWN arrow: RIGHT arrow: LEFT arrow:
Move the cursor up 1 unit. Move the cursor down 1 unit. Move the cursor right 1 unit Move the cursor left 1 unit.
"u" or SHIFT-UP arrow:"d" or SHIFT-DOWN arrow:"r" or SHIFT-RIGHT arrow:"1" or SHIFT-LEFT arrow:
Move the cursor up 10 units. Move the cursor down 10 units. Move the cursor right 10 units. Move the cursor left 10 units.
Arrow keys separate from the keypad arrow keys on enhanced keyboards will move the cursor 1 unit in the appropriate direction.
11
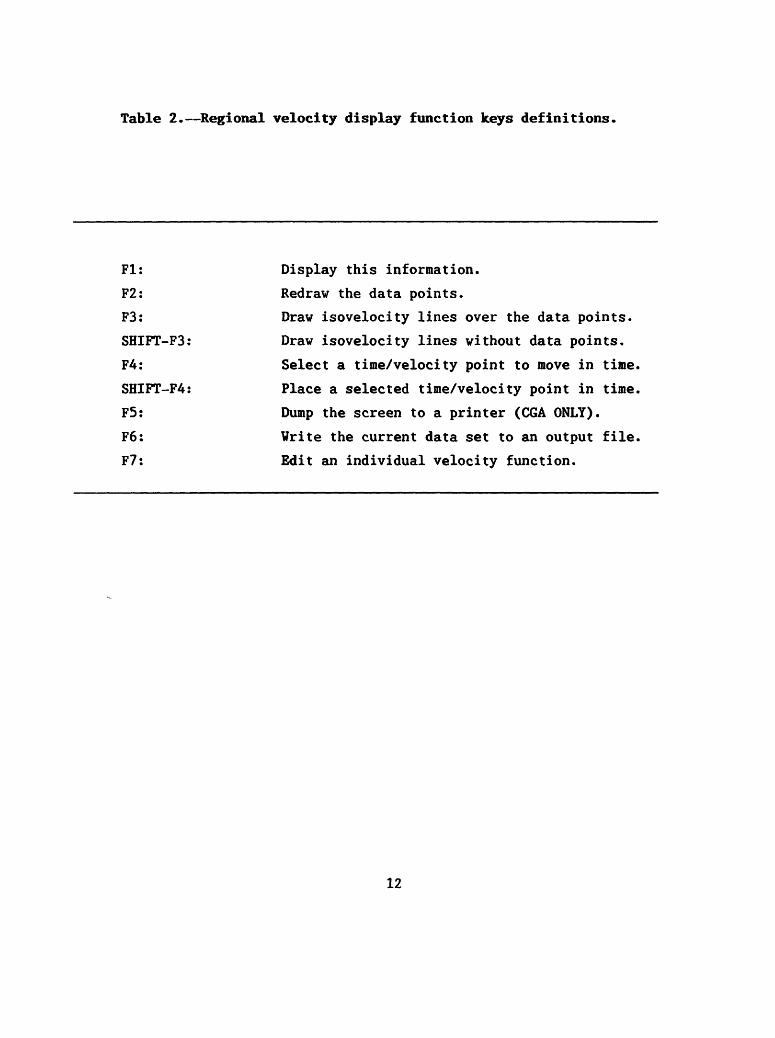
Table 2. Regional velocity display function keys definitions.
Fl:
F2:
F3:
SHIFT-F3:
FA:
SHIFT-FA:
F5:
F6:
F7:
Display this information.
Redraw the data points.
Draw isovelocity lines over the data points.
Draw isovelocity lines without data points.
Select a time/velocity point to move in time,
Place a selected time/velocity point in time,
Dump the screen to a printer (CGA ONLY).
Vrite the current data set to an output file,
Edit an individual velocity function.
12

i Inte
ractive
Velo
city Ed
it 1)0,
2* 10:
24; 07
,92
locati
on500
105-
A H £ v £ H H
Fli Dis
play t
his in
fo,F2:
Re
crau t
he dat
a poin
ts,F3:
Dra
u isov
elocity
conto
ur line
s over
the d
ata po
ints,
(SHIFl)
F3: D
ray is
oveloc
ity con
tour li
nes y
ith no
data
points
,F4i
Se
lect a
I/D
point
to nv
e in
tine,
(SHIF1
) F4:
Place
a W po
int in
time,
F5i
Duii)
screen
to th
e prin
ter (C
GA on
ly),tt\
Wri
e cur
rent s
creen
to an
output
file,
F7:
Edit i
ndivid
ual v
elocity
funct
ions,
Press
any ke
y to c
ontinu
e,,,
Figure 6a. Regional display
help sc
reen
ob
tain
ed by
using
function ke
y Fl,
desc
ribi
ng th
e function key
usage.

1131
989 *
Inter
active
Velo
city Ed
it D0.2
110:2
W,92
Locatio
n
105' £ V
UP arr
ow
Hove c
ursor
up one
unit,
DOWN a
rrou:
Move c
ursor
doun o
ne un
it,T a
rrow
Move c
ursor
riht o
ne un
it,g f
LEFT a
rrow
Move c
ursoe
left o
ne un
it,
II or (
SHIFT
) UP a
rrow
Move c
ursor
up ten
units,
D or (
SHIFT
) DOUN
arrou
: Mov
e curs
or dou
n ten
units,
R or (
SHIFT
) RIGH
T arro
u: Mov
e curs
or rih
t ten
units,
L or (
SHIFT
) LEFT
arrou
: Mov
e curs
or lef
t ten
units,
g f
ou key
s sepa
rate fro
m the
keypa
d on e
nhance
d keyb
oards
uill
love t
he cur
sor on
e unit
in the
appro
priate
direc
tion,
!
Figu
re 6b. Continuation o
f re
gion
al di
spla
y he
lp '
scre
en d
escribing
the
curs
or m
ovem
ent
keys
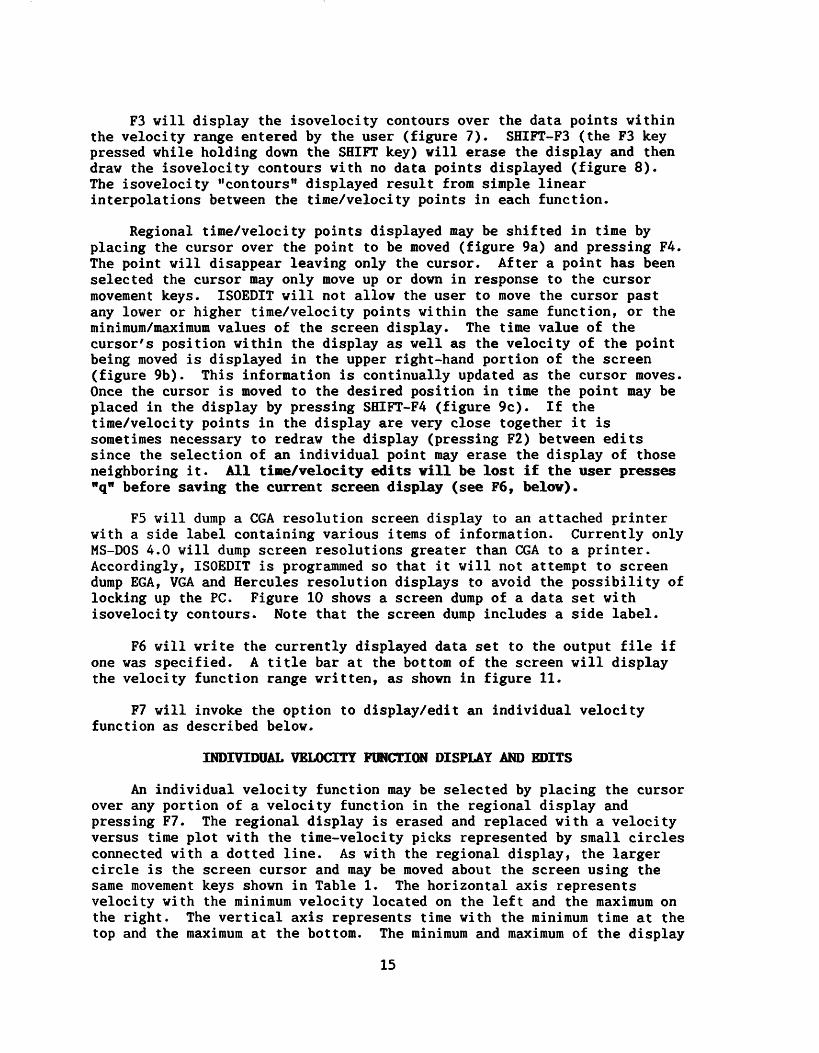
F3 will display the isovelocity contours over the data points within the velocity range entered by the user (figure 7). SHIFT-F3 (the F3 key pressed while holding down the SHIFT key) will erase the display and then draw the isovelocity contours with no data points displayed (figure 8). The isovelocity "contours" displayed result from simple linear interpolations between the time/velocity points in each function.
Regional time/velocity points displayed may be shifted in time by placing the cursor over the point to be moved (figure 9a) and pressing F4. The point will disappear leaving only the cursor. After a point has been selected the cursor may only move up or down in response to the cursor movement keys. ISOEDIT will not allow the user to move the cursor past any lower or higher time/velocity points within the same function, or the minimum/maximum values of the screen display. The time value of the cursor's position within the display as well as the velocity of the point being moved is displayed in the upper right-hand portion of the screen (figure 9b). This information is continually updated as the cursor moves. Once the cursor is moved to the desired position in time the point may be placed in the display by pressing SHIFT-FA (figure 9c). If the time/velocity points in the display are very close together it is sometimes necessary to redraw the display (pressing F2) between edits since the selection of an individual point may erase the display of those neighboring it. All time/velocity edits vill be lost if the user presses "q" before saving the current screen display (see F6, below).
F5 will dump a CGA resolution screen display to an attached printer with a side label containing various items of information. Currently only MS-DOS 4.0 will dump screen resolutions greater than CGA to a printer. Accordingly, ISOEDIT is programmed so that it will not attempt to screen dump EGA, VGA and Hercules resolution displays to avoid the possibility of locking up the PC. Figure 10 shows a screen dump of a data set with isovelocity contours. Note that the screen dump includes a side label.
F6 will write the currently displayed data set to the output file if one was specified. A title bar at the bottom of the screen will display the velocity function range written, as shown in figure 11.
F7 will invoke the option to display/edit an individual velocity function as described below.
INDIVIDUAL VELOCITY FUNCTION DISPLAY AND EDITS
An individual velocity function may be selected by placing the cursor over any portion of a velocity function in the regional display and pressing F7. The regional display is erased and replaced with a velocity versus time plot with the time-velocity picks represented by small circles connected with a dotted line. As with the regional display, the larger circle is the screen cursor and may be moved about the screen using the same movement keys shown in Table 1. The horizontal axis represents velocity with the minimum velocity located on the left and the maximum on the right. The vertical axis represents time with the minimum time at the top and the maximum at the bottom. The minimum and maximum of the display
15
Inc
150Loc
ati
105-
A 111 £ V t £ H H
7700-
a o -"
£.
"' "y
f1' '
fa
Curren
t outp
ut Ill
s Lled
it.iso
Figu
re 7.
Iso
velo
city
contou
rs d
ispl
ayed
over th
e regional d
ata
poin
ts obtained b
y us
ing
function k
ey F3.
Note th
e minimum
and ma
ximu
m is
ovel
ocit
y va
lues
as w
ell
as t
he velocity
increment ate gi
ven
at th
e to
p of th
e sc
reen
.

Mini
Max;
Inc:
150
105- £ v £ H h
7700-
Curre
nt out
put fi
le: ll
edit.i
so
Figu
re 8. Isovelocity co
ntou
rs displayed
with
out
data- po
ints
ob
tain
ed by
using
function
key
SHIFT-F3.

150 i
105-
A III £ V 1 £ H H
7700-
-
,3
£,
88
s I
*X
8
O
!
i 8
°w
o :il
e
120
0 8
8 o
_ _
\:B
3 <
3 1
!* i
f W
9
0
C
o o
a0
«
. o
a o
19& 1 « 1
: 1 S3 1
Inter
active
Velo
city Ed
it W,2
1 10:2
6:51,2
?
'/.Loc
ation
315
0 .
.
i
:'
0c
0
O0
o
O
o0
o°o
oc'5
o0
o
Oo
°°
M°0.
Oo
OO
OC
'D
o»
«
r,0
0Q
QO
O°
MO
0 00*0000
c-°
° °
? S
o0
° °
£ '
o
0
O
DO
*
a
o-^
-O
a o
o e
e o
o o
<3
0
0
0
*
DO
0
a
0
0
0
0
*
0
o
o
0
00
0
0-0
0.
OD
O
0
0
O
O
o
a
0
OD
O
o
a
Curre
nt out
put lil
e: IM
t/iso
Figu
re 9a. Regional data display
with
th
e cu
rsor
positioned ov
er a
data po
int
(arrow)
to be
selected and
shifted
alon
g the ti
me axis;

150
1201
989 *
Inter
active
IJelo
citu E
dit VQ
.2! 10
i2&5L2
7IE
: I'EL
OCITY
: 179
3
105' £ v Hi £
7700-
8 0 o
8o
o 8 o o
o o o s'°°
o o
o o
0
g
ft
O
8 o
° S
8
0 0 O o o 0
o o
o *
O 0
o 0 o o o 0 o
w o o o o o o
o o 0 0 0 0 o 0
o o o o o
o 0 o o 0 o
O 0 o
0 e
*o
a o o
S- *
°0
o
C-
O
0
O
O
0
O
0 o o o o o o
o o o 0 0
Curre
nt out
put fi
le: IM
t.iso
Figure 9b. Regional da
ta display
afte
r a
data
point
has be
en se
lect
ed (FA) and
the
curs
or moved in ti
me.
Note the
time/velocity
display
in the
upper
right-
hand
co
rner
.
150 ' i
105-
A M £ V 0 i" c H H
7700-
,-. o
oO
«
a
H
V
V
O
| 5
o5
00
0 ,3
O
Q0
o
0
*
0
'G
B fl
§ ?
1 & i S a 3
120
0 8
O
0'
ft 8
S *
0
0
M
I
I 1
IS <
: !8
1 Inte
ractive
Velo
city Ed
it VQ.2
1 10:
26:51,
27
Locatio
n 315
0"
.
,
G 3'
0*
a
0
0
5 o
o o
5o
» o
o0
o
W
W
W
O
Q
cD
C0
0
e>&
O
a
~ a
,
.
O
,;,
a
o
O
w
0
o
O
0JH
. f*l
O
j«
ft
C1
"Q
. Q
o o
' "G
O
* *
o o
o o
o o
° .*
*
5,
o
O
O
*
GO
O
*
O
O
0
O
*
a
G
O
O
0O
O
G
0
O
O
G
0
O
0
O'
' O
£i
O
o
Q
G
O
o
O
Curre
nt out
put fi
le: L
ledit.is
oFigure 9c. Regional da
ta display
after
seve
ral
data po
ints
have be
en se
lect
ed (F4) and
plac
ed in new pos
itio
ns in ti
me (SHIFT-F4) in the
same
velocity fu
ncti
on.

Min:
150
105' £ v
7700-
Has.
Inc:
Curre
nt out
put fi
le: L
ledit.is
oFigure 10. Screen d
ump
of a
regional cl
ata display
(F5)
3150
H
«C O
O
H m c i
>3
M H
H
ID
0
"U
3>
n c
H.
H
T|
rt-
ns<
~n
r~
r
m
tt r M
h*
ID
H
. Q
. Ul
H.
Q
ct
3
3
H-
H-
H-
D
3
Ul
0
CD 3
3
x x
ti
O
O
oo o -j i> C-J 4*
M

HimInc
: 250
150
105J £ v m
Curren
t outp
ut file
s IM
t.iso..
.pts u
ritten:
150 t
oFi
gure
11. Regional data di
splay
with
a ti
tle
bar
at the
bott
om d
isplaying
the
func
tion
ran
ge w
ritt
en t
o an
out
put
file
(F6).
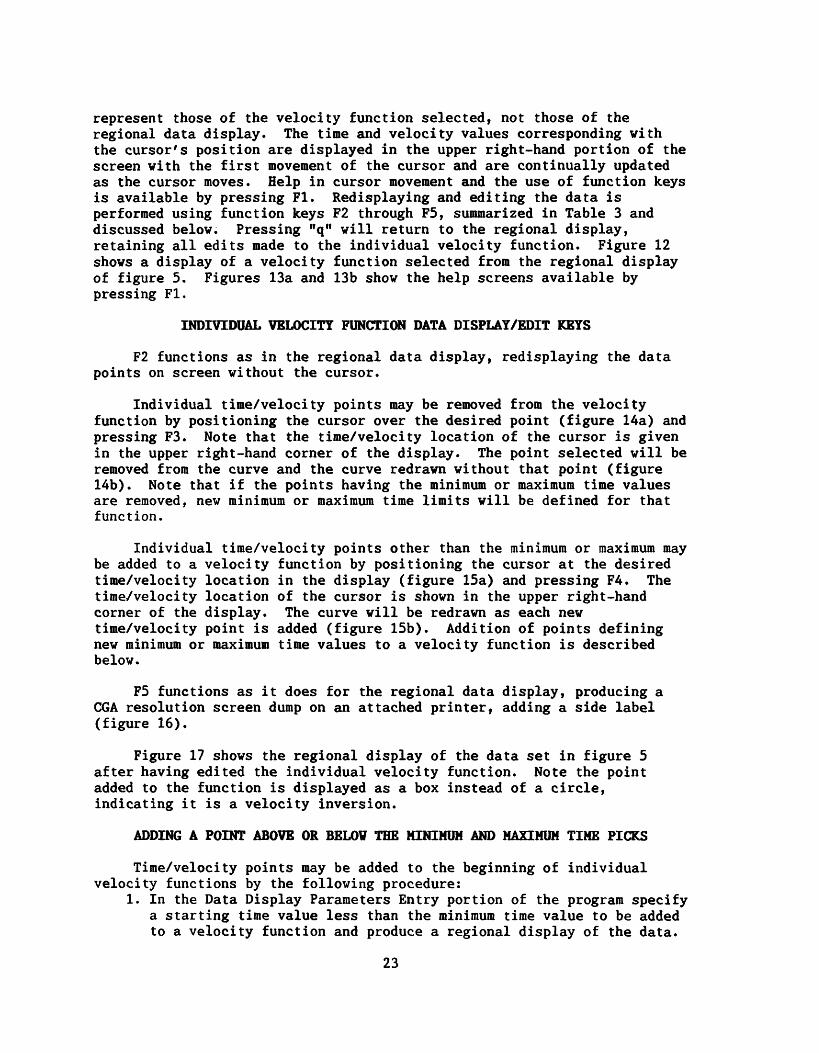
represent those of the velocity function selected, not those of the regional data display. The time and velocity values corresponding with the cursor's position are displayed in the upper right-hand portion of the screen with the first movement of the cursor and are continually updated as the cursor moves. Help in cursor movement and the use of function keys is available by pressing Fl. Redisplaying and editing the data is performed using function keys F2 through F5, summarized in Table 3 and discussed below. Pressing "q" will return to the regional display, retaining all edits made to the individual velocity function. Figure 12 shows a display of a velocity function selected from the regional display of figure 5. Figures 13a and 13b show the help screens available by pressing Fl.
INDIVIDUAL VELOCITY FUNCTION DATA DISPLAY/EDIT KEYS
F2 functions as in the regional data display, redisplaying the data points on screen without the cursor.
Individual time/velocity points may be removed from the velocity function by positioning the cursor over the desired point (figure 14a) and pressing F3. Note that the time/velocity location of the cursor is given in the upper right-hand corner of the display. The point selected will be removed from the curve and the curve redrawn without that point (figure 14b). Note that if the points having the minimum or maximum time values are removed, new minimum or maximum time limits will be defined for that function.
Individual time/velocity points other than the minimum or maximum may be added to a velocity function by positioning the cursor at the desired time/velocity location in the display (figure 15a) and pressing FA. The time/velocity location of the cursor is shown in the upper right-hand corner of the display. The curve will be redrawn as each new time/velocity point is added (figure 15b). Addition of points defining new minimum or maximum time values to a velocity function is described below.
F5 functions as it does for the regional data display, producing a CGA resolution screen dump on an attached printer, adding a side label (figure 16).
Figure 17 shows the regional display of the data set in figure 5 after having edited the individual velocity function. Note the point added to the function is displayed as a box instead of a circle, indicating it is a velocity inversion.
ADDING A POINT ABOVE OR BELOW THE MINIMUM AND MAXIMUM TIME PICKS
Time/velocity points may be added to the beginning of individual velocity functions by the following procedure:
1. In the Data Display Parameters Entry portion of the program specify a starting time value less than the minimum time value to be added to a velocity function and produce a regional display of the data.
23
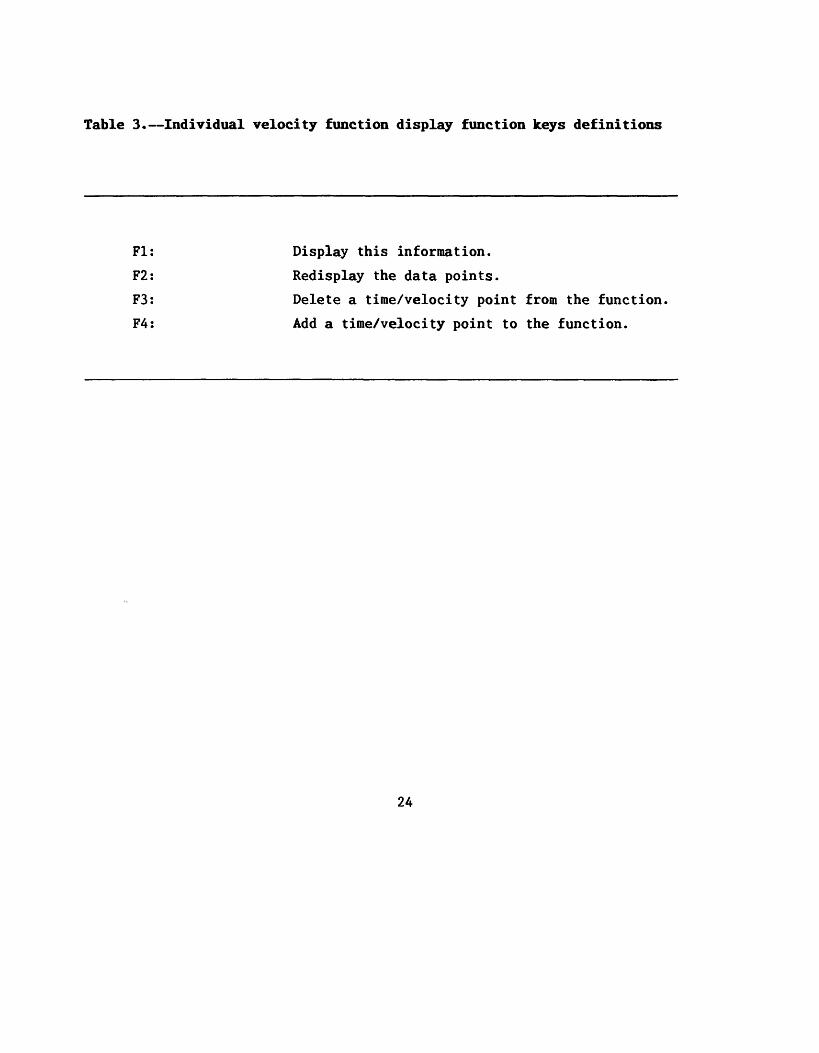
Table 3. Individual velocity function display function keys definitions
Fl: Display this information.
F2: Redisplay the data points.
F3: Delete a time/velocity point from the function,
F4: Add a time/velocity point to the function.
24

1201
9891
Intera
ctive V
elocity
Edit V
Q.2 * l
l:12M
85
Veloci
2212
» o
is\..
ft.,.
Figure 12. Individual velocity function di
spla
y of
th
at fu
ncti
on ed
ited
in
fi
gure
s 9a
, 9b,
and
9c.
1
H38 i
28h
A £ V £ H h
1600
-
Fl! F2:
F3i
Fii
F5: Press
a13 198
9 1 In
teract
ive V
elocity
Edit V
0.2 1
10:30f
05,?l
, Ve
locity
1132 i
Oisilay
this
info,
Recra
u the
data p
oints,
Delete
a dat
a poin
t, Add
a dat
a poin
t, Dum
p scre
en to
the pr
inter
(CGA o
nly),
ny key
to co
ntinue,
,,
*
Figure 13
. Individual velocity function display help file obtained by function ke
y Fl
, describing the function key
usage.
4111
9891
Inter
active
Velo
city Ed
it 1)0,2
* 12s
27:50,
88
N)
1438
A 11 £ V ri H
Veloc
ity
UP arr
ow
Move c
ursor
up one
unit,
DOWN a
rrou;
Move c
ursor
doun o
ne un
it,RIG
HT arr
oui M
ove cu
rsor r
iant o
ne un
it,LEF
T arro
w Mov
e curs
or lef
t one
unit,
0 or (
SHIFT
) UP a
rroui
Move c
ursor
up ten
units,
D or (
SHIFT
) DOUN
arrou
: Mov
e curs
or dou
n ten
units,
R or (
SHIFT
) RISH
T arro
ui Mov
e curs
or rih
t ten
units,
g ftL o
r (SH
IFT) L
EFT ar
row
Move c
ursor
left t
en un
its,
ftrrou
keys
separa
te from
the k
eypad
on enh
anced
keyboa
rds u
ill lov
e the
curso
r one
unit
in the
appro
priate
direc
tion,
Vi.
Figure 13b. Continuation of re
gion
al display
help
sc
reen
de
scri
bing
th
e cursor mo
veme
nt ke
ys.

i 20 1
989 *
Intera
ctive V
elocity
Edit 1
)0,2 *
H:i2i
4U5
; Ve
locity
VELOCI
TY:224
2
A HI £ V ll £ H
'sv
'*.
Figu
re 14
a. I
ndiv
idua
l velocity fu
ncti
on displayed in
fi
gure
12 with th
e cursor po
siti
oned
over
a ti
me/v
eloc
ity
point
to be
rem
oved
(a
rrow
).
Note
th
e time/v
eloc
ity
coor
dina
tes
of ,
tbe
cursor ar
e displaye
d in the
upper
righ
t-ha
nd corner.
i 20 1
983 1
Intera
ctive V
elocity
Edit V
G.2 * M
M
; Vel
ocity
' '
UELKIT
Yi 153
8 m137
0-
vO
A in £ £ H
h
1.
o " .
,.
"> ,
Figure 14b. Individual velocity fu
ncti
on displayed
in fi
gure
14a
with the
time
/vel
ocit
y po
int
remo
ved
(F3)
an
d the
curve'redrawn.

i 20 1
989 1
Intera
ctive V
elocity
Edit U
Q.2 * I
l!l2i44
,85. '
,; Vel
ocity
TWl
mI II
III
JQ1U
HOOT
S224
2 i437
0- z*
1. '..
'V
Figure 15a. Individual ve
loci
ty function of figure lA
b with the
cursor po
siti
oned
to
ad
d a
new
time/velocity
poin
t whose
values will be those
as sh
own
in the
uppe
r ri
ght-
hand
corner.

1201
9891
Inter
active
Velo
city E
dit VQ
.2 * 1
1:12:1
1,85
TIM[l
VELOC
ITY:
1181
' .-,
Veloc
ity 221
2
1370- A II E v £ H h
'"S
,
'*.
Figure 15b. Individual ve
loci
ty fu
ncti
on o
f figure 15a
with
a new time/velocity
poin
t ad
ded
(F4)
(arrow).

4370-
u>E v >H
H
1 20 1
989 *
Intera
ctive y
elocity
Edit U
0.2 1 I
lil2:il8
5
Mod
tyHEL
OCI1Y
: MM
Fig
ure
1
6.
Screen
du
mp
of
the
ind
ivid
ual-
velo
cit
y
fun
ctio
n o
f fi
gu
re
15b
(F5).
22i2
S...
'Si.
.
H. I
D Oi
3 t-
3
fl 0
Cn
!uH
-5 CO
3 3
M-
M'
3
D
M
t-J
£
!>
X.J
S
.J
»
O
<l
CH
K*

1201
9891
Inter
active
Velo
city Ed
it V0.2
11Q:2
&51,2
7
150
8 2 |
8 «
I 8
5
0
w 0
0 j
8 §
5 ft
! ' w.
o 5
5 5
8§
1 o |
1 o
§B
n 3
o a
a o
'" *
-o
oo
o fl
3,
0O
BB
^J
0 o
« °
« o
o0
0
o
ft o
- O
O
o
O
°
0
Q
*
B
*
go
w
' '
'W
.;
jj
l[jl
58 .0'
00
o
0
o' O
0 O
O
0
°
0 o
°
°*
°
^0
OO
.m
.O
O O
*
Z B
*
O-O
w
a
O
* «
. ' O
0
O
O
*
*
O'
. ^
^
^
0 g,
O
0 O
a
w a
O
O*O
O
O *
0 0'
0 0
*
0
o 0
0
0O
'.
0
O
0
0
O
0 0
0
0
o
o o
o o
o o
o o
&
105- s v t £
7700-
Curre
nt out
put fil
es L
ledit,i
so,,,p
ts uri
ttens
150 to
Figure 17. Regional di
spla
y of
the
data
set-after
editing
the
indi
vidu
al ve
loci
ty fu
ncti
on
of figures
14-1
6.
Note th
at th
e point
added
iti fi
gure
15b
is a velocity in
ver
si
on,
indi
cate
d by
a box
inst
ead
of a
circ
le (arrow).

2. In the desired function place the cursor over the time/velocity point currently having the minimum time value.
3. Select that point to be shifted in time by pressing F4.4. Move the cursor to the desired starting time value and place the
point there by pressing SHIFT-F4.5. Press F7 to enter the Individual Velocity Function Display/Edit mode
and adjust the velocity of that starting point by adding and deleting points (F3 and F4) as well as adding any intermediate points desired. After the function has been adjusted press "q" to return to the regional display.
Similarly, time/velocity points may be added to the end of individual velocity functions by shifting the time/velocity point in the regional display that has the maximum time value to a greater time value and then editing that function.
PROGRAM NOTES
The following ISOEDIT caveats are made to further describe the program, its functions and components.
Cursor movement within 10 screen units of the display boundaries is only allowed in 1 unit increments by means of the arrow keys alone (not shifted). The cursor will not move outside the display boundaries.
ISOEDIT was written to provide interactive modification of velocity models and not necessarily proper isovelocity contours. For each isovelocity line value (determined by user-provided starting and ending isovelocity values and the increment used between isovelocity values) the individual velocity functions are searched for a set of consecutive time/velocity pairs where the velocity of the first pair (having the lesser time value) is less than or equal to the iso-line velocity and the velocity of the second pair is greater than or equal to that iso-line velocity. The time value for the iso-line is determined by linear interpolation between the two selected time/velocity pairs. Using this method with data sets containing large and numerous velocity inversions will produce interesting displays. A future release of ISOEDIT may have a more accurate contouring algorithm.
ISOEDIT calls the ANSI.SYS device driver to clear the screen in between text displays. This file should reside in the PC's boot directory and be referred to in the CONFIG.SYS file as:
DEVICE = ANSI.SYS
which will load it when the system boots. ISOEDIT will run properly if ANSI.SYS is not present or loaded but the screen will not be cleared between text displays.
REFERENCES
Sheriff, R.E., 1976, Encyclopedic Dictionary of Exploration Geophysics, Society of Exploration Geophysicists, Tulsa, Oklahoma.
34
![880 RE F.N. [2000] 1 S.C.R. - CanLII...880 RE F.N. [2000] 1 S.C.R. F.N. Appellant F.N. Appelant v. c. Her Majesty The QueenFirst Respondent Sa Majest´e la Reine Premi`ere intim´ee](https://static.fdocuments.net/doc/165x107/5ea99ec39a1a580c2e476b90/880-re-fn-2000-1-scr-canlii-880-re-fn-2000-1-scr-fn-appellant.jpg)

![[2007]Хimija. 10 klass. Gabrieljan O.S., Maskaev F.N. i dr.](https://static.fdocuments.net/doc/165x107/568bd6261a28ab20349b0a38/2007imija-10-klass-gabrieljan-os-maskaev-fn-i-dr.jpg)