DEPARTMENT OF THE ARMY Discharge in Waters of the U.S.—Testing Manual (Inland Testing Manual)...
202
DEPARTMENT OF THE ARMY BUFFALO DISTRICT, CORPS OF ENGINEERS 1776 NIAGARA STREET BUFFALO, NEW YORK 14207-3199 REPLY TO ATTENTION OF February 24, 2016 Environmental Analysis Team SUBJECT: Cleveland Harbor, Cuyahoga County, Ohio—Revised Dredged Sediment Evaluation for Upper Cuyahoga River Channel Sediments Mr. Richard D. Blasick, P.E. Environmental Manager Division of Surface Water Ohio Environmental Protection Agency P.O. Box 1049 Columbus, Ohio 43216-1049 Dear Mr. Blasick: The U.S. Army Corps of Engineers (USACE), Buffalo District has completed a comprehensive review of analytical and biological test data generated by the Ohio Environmental Protection Agency (Ohio EPA) on Cleveland Harbor’s Upper Cuyahoga River sediments across several sampling and analysis (SSA) efforts performed in 2013, 2014 and 2015. The majority of these data were provided to USACE between September 30, 2015 and January 15, 2016. USACE review of these data revealed considerable substantive quality control and technical issues. A detailed discussion of these issues, as well as all additional appropriate Ohio EPA data, have been integrated into the revised 2016 dredged sediment evaluation (Enclosure 1), the original of which was provided in our November 20, 2015 application for Clean Water Act (CWA) Section 401 water quality certification (WQC). The revised evaluation also includes USACE 2015 data on the bioaccumulation of polychlorinated biphenyls (PCBs). USACE consideration of the additional Ohio EPA data did not change the determination that sediments dredged from the Upper Cuyahoga River Channel meet CWA Section 404(b)(1) Guidelines (40 CFR 230.11[d]) for placement at CLA-1 in Lake Erie. USACE identified two overarching issues with the data generated by Ohio EPA: (1) many of the sediment samples across the sampling events were collected from outside the Federal navigation channel dredging prism; and (2) the solid phase bioassays (acute toxicity and PCB bioaccumulation tests) did not follow appropriate laboratory methodologies and failed to yield useable data. In addition, Ohio EPA did not perform any testing relative to Section 5.1 of
Transcript of DEPARTMENT OF THE ARMY Discharge in Waters of the U.S.—Testing Manual (Inland Testing Manual)...

DEPARTMENT OF THE ARMY BUFFALO DISTRICT, CORPS OF ENGINEERS
1776 NIAGARA STREET BUFFALO, NEW YORK 14207-3199
REPLY TO ATTENTION OF
February 24, 2016 Environmental Analysis Team SUBJECT: Cleveland Harbor, Cuyahoga County, Ohio—Revised Dredged Sediment Evaluation for Upper Cuyahoga River Channel Sediments Mr. Richard D. Blasick, P.E. Environmental Manager Division of Surface Water Ohio Environmental Protection Agency P.O. Box 1049 Columbus, Ohio 43216-1049 Dear Mr. Blasick: The U.S. Army Corps of Engineers (USACE), Buffalo District has completed a comprehensive review of analytical and biological test data generated by the Ohio Environmental Protection Agency (Ohio EPA) on Cleveland Harbor’s Upper Cuyahoga River sediments across several sampling and analysis (SSA) efforts performed in 2013, 2014 and 2015. The majority of these data were provided to USACE between September 30, 2015 and January 15, 2016. USACE review of these data revealed considerable substantive quality control and technical issues. A detailed discussion of these issues, as well as all additional appropriate Ohio EPA data, have been integrated into the revised 2016 dredged sediment evaluation (Enclosure 1), the original of which was provided in our November 20, 2015 application for Clean Water Act (CWA) Section 401 water quality certification (WQC). The revised evaluation also includes USACE 2015 data on the bioaccumulation of polychlorinated biphenyls (PCBs). USACE consideration of the additional Ohio EPA data did not change the determination that sediments dredged from the Upper Cuyahoga River Channel meet CWA Section 404(b)(1) Guidelines (40 CFR 230.11[d]) for placement at CLA-1 in Lake Erie. USACE identified two overarching issues with the data generated by Ohio EPA: (1) many of the sediment samples across the sampling events were collected from outside the Federal navigation channel dredging prism; and (2) the solid phase bioassays (acute toxicity and PCB bioaccumulation tests) did not follow appropriate laboratory methodologies and failed to yield useable data. In addition, Ohio EPA did not perform any testing relative to Section 5.1 of

SUBJECT: Cleveland Harbor, Cuyahoga County, Ohio—Revised Dredged Sediment Evaluation for Upper Cuyahoga River Channel Sediments
-2-
the U.S. Environmental Protection Agency (USEPA)/USACE Evaluation of Dredged Material for Discharge in Waters of the U.S.—Testing Manual (Inland Testing Manual) (ITM). This section of formal CWA guidance is specifically directed at evaluating compliance of any discharge of dredged sediment at a specified open-water site with respect to applicable state water quality standards (WQSs). The following provides a summary of USACE concerns with the additional data generated by Ohio EPA: a. Sediment sample locations. As initially noted in our March 2, 2015 letter, many of the core sediment samples obtained from the river by Ohio EPA in April 2014 were collected from outside the Federal navigation channel dredging prism (this is illustrated in the 2016 dredged sediment evaluation). Review of the other sampling events (2013, May 2014, August 2014, October 2014, June 2015 and October 2015) also showed that many sediment samples were collected from outside the dredging prism. In general, these samples were either collected from outside channel boundaries, in areas of the authorized channel officially “not maintained” (i.e., in dredged material management unit [DMMU]-1), below dredging elevation or on channel side slopes. Data on these samples could not be included in the 2016 dredged sediment evaluation as they are not representative of the dredged sediments. USACE further notes that most of the sampling conducted by Ohio EPA across these events was biased in that it targeted sites along the boundaries of the channel (such as outfalls) rather than the shoals that are actually dredged within the Federal navigation channel. Regardless, sediment contaminant concentration data on all sites located within the dredging prism were integrated into the evaluation. b. Sediment sampling methodologies. Sediment sampling did not follow the appropriate protocols prescribed in formal guidance (USEPA/USACE 1998a and 1998b). For example, DMMUs were not utilized (the data generated by OEPA were placed into the three USACE designated DMMUs to better enable interpretation) and DMMU composite samples were not created from discrete samples collected from each individual DMMUs. Also, open-lake reference area sediments were not collected during each individual sampling event. c. Sediment testing methodologies. Ohio EPA did not follow the appropriate protocols for the sampling and testing of dredged sediments as prescribed in formal CWA guidance contained in the ITM and Great Lakes Dredged Material Testing and Evaluation Manual (GLTM). In many cases, this resulted in the generation of data that were unusable or of poor quality, and therefore could not be used for any dredged material management decision-making. Also note that many of the discrete samples contributing to the composite samples employed for the bioassays were collected from outside the dredging prism. The rationale as to why the bioassay data are unusable is presented below:

SUBJECT: Cleveland Harbor, Cuyahoga County, Ohio—Revised Dredged Sediment Evaluation for Upper Cuyahoga River Channel Sediments
-3-
1. Hyalella azteca bioassay for survival—This bioassay did not follow appropriate testing protocols prescribed in the ITM and GLTM. Sediment pore water data was not measured or monitored, and the bioassay water was not purged to preclude effects from ammonia in the bioassay. Ammonia is a naturally occurring constituent of pore water that can confound bioassays performed in the laboratory because it can be toxic. Pre-existing information on ammonia toxicity in these sediments available to Ohio EPA (i.e., previous USACE dredged sediment evaluations relating to Cleveland Harbor) reinforces the need to include sediment pore water ammonia monitoring in the bioassay procedures. It is also important to evaluate sediment pore water ammonia toxicity as it can confound the potential toxicity of persistent contaminants. In addition, the presence of a high density of native oligochaete worms in various sediment samples (see 2016 dredged sediment evaluation) may have been a factor in the observed reduced survival of H. azteca. Given this information, it is evident that sediment pore water ammonia and/or native oligochaetes were factors contributing to, or in fact driving, the reduced survival (and growth) observed, thus yielding false-positive toxicity data. 2. Lumbriculus variegatus PCB bioaccumulation experiments—This test did not follow appropriate testing protocols prescribed in the ITM and GLTM, and the data generated are not representative of the dredged sediments. Because of this it could not be used for any dredged sediment management decision-making.. This is detailed as follows: (a) Following test exposures, a fundamental requirement is to allow a standard 24-hour period for L. variegatus gut clearance; Ohio EPA’s test provided for a gut clearance of 6 hours which is 18 hours less than the standard. A 24-hour gut clearance is also recommended by the most recent American Society of Testing and Materials (ASTM) Standard Guide for Determination of the Bioaccumulation of Sediment-Associated Contaminants by Benthic Invertebrates (ASTM E1688-10). Under an assumption that the channel samples contained a significant number of native oligochaete (tubificid) worms in the sediments (as has been USACE observation since at least 2010), it is also possible that the inclusion of tubificidae genera in the tissue samples absent a minimum 24 hour gut clearance biased test PCB concentrations high due to material remaining in the gut. Furthermore, regarding replication, formal USEPA/USACE guidance requires the standard bioaccumulation experiments to be accomplished with five replicates, including quantification of PCB residues in each individual replicate. The five replicates run by Ohio EPA were composited into a single tissue sample, which resulted in no replication of the measured PCB tissue data. These two deviations from formal guidance render these data to be unusable in this case. (b) In comparison to USACE data and theoretical values, the Ohio EPA data yielded much higher PCB tissue residues relative to PCB concentrations in both channel and lake sediments. This is uncharacteristic for these sediments and unusual for any sediments with such low residual PCB concentrations. Total organic carbon (TOC)-normalized total PCB
SUBJECT: Cleveland Harbor, Cuyahoga County, Ohio—Revised Dredged Sediment Evaluation for Upper Cuyahoga River Channel Sediments
-4-
concentrations measured in both the channel and lake sediment samples infer that total PCB bioaccumulation in L. variegatus should be on order of 0.1 mg/kg. However, reported Ohio EPA L. variegatus total PCB tissue residues were on average 470 to 760% higher than would be theoretically expected based on PCB and TOC sediment concentrations alone. Such results are improbable because they are inconsistent with recent site-specific bioaccumulation data following appropriate methodologies, and greatly exceed theoretical values.
To examine this sediment-to-tissue concentration aberration further, biota-sediment accumulation factors (BSAFs) were calculated using the reported Ohio EPA L. variegatus total PCB bioaccumulation data. This yielded mean BSAFs of 5.0 for both the channel and lake sediment samples, which is over six times the mean BSAF of 0.73 generated from site-specific USACE data using appropriate test methodologies. It is also approximately four times a mean BSAF of 1.30 derived across other researchers using a standard 28-day laboratory exposure period for L. variegatus. The disparity among a BSAF of 5, and those based on site-specific data and data from other researchers, is illustrated in Enclosure 2. Even individual Ohio EPA BSAF values do not appear to reflect any apparent adsorptive influence from hard carbon (which reduces PCB bioavailability), which is to be expected in these sediments.
Enclosure 3 is a histogram (frequency distribution) of mean total PCB BSAFs from various researchers using a standard 28-day laboratory exposure period for L. variegatus. The data are heavily skewed right. Mean BSAFs of 5 based on the reported Ohio EPA data lie on the extreme right tail of the distribution, beyond the 95th percentile. In other words, 96% of the BSAFs generated by other researchers are less than or equal to 5. The harbor and lake sediment USACE BSAFs of 0.78 and 0.57 fall at the highest point of the distribution (the mode) and occur within the range of values generated by most of the researchers. Furthermore, the combined harbor/lake sediment USACE BSAF mean of 0.73 is comparable to the median of 0.88 across the BSAF distribution.
Collectively, and regardless as to whether the sediment samples were collected from within or outside the channel dredging prism, this information suggests that the Ohio EPA data are not representative of PCB bioaccumulation from channel shoals or sediments at the placement area.
d. Polycyclic aromatic hydrocarbon (PAH) sediment contamination. With respect tothe evaluation of sediment-associated PAH contamination, Ohio EPA analyzed the sediments samples across the SSA efforts for bulk concentration. USACE reiterates that the state-of-the-science approach to evaluating accurate PAH-specific toxicity in sediments is through sediment pore water measurements. USACE has now accomplished this type of testing three times on the Upper Cuyahoga River Channel sediments. Since PAHs in these channel sediments are of predominantly pyrogenic origin, PAH compounds tightly adsorb to sediment hard carbon making them less bioavailable to cause any significant toxicity. We are concerned that Ohio EPA continues to disregard this information and revert to bulk sediment concentration data. Such an


1.30
0.73
5.0
0.00
1.00
2.00
3.00
4.00
5.00
6.00
Other researchers (N=101) USACE (2013 and 2015) (N= 40) OEPA (2015) (N=9)
Mean BS
AF
Data source
ENCLOSURE 2Comparison of total PCB BSAFs based on 28‐day L. variegatus laboratory bioaccumulation experiments

0
5
10
15
20
25
30
35
0-0.5 0.51-1 1.01-1.5 1.51-2 2.01-2.5 2.51-3 3.01-3.5 3.51-4 4.01-4.5 4.51-5 5.01-5.5 5.51-6 6.01-6.5 6.51-7 7.01-7.5 7.51-8 8.01-8.5 8.51-9
Num
ber i
n in
terv
al
Mean BSAF interval
ENCLOSURE 3Mean total PCB BSAF histogram, L. variegatus 28-day laboratory
bioaccumulation data from various researchers
OEPA data
↓
USACEdata
↓

Cleveland Harbor (Upper Cuyahoga River
Channel) Dredged Sediment Evaluation—2016
EVALUATION OF CLEVELAND HARBOR (UPPER CUYAHOGA RIVER CHANNEL) DREDGED SEDIMENTS WITH RESPECT TO
SUITABILITY FOR OPEN-LAKE PLACEMENT
EXECUTIVE SUMMARY Cleveland Harbor, Ohio sediments within the reach of the Cuyahoga River Channel near the upstream Federal navigation project limit (Upper Cuyahoga River Channel) are typically dredged twice a year to maintain adequate depths for deep-draft commercial navigation. The predominant source of these sediments is erosion within the upstream portions of the Cuyahoga River watershed, including Cuyahoga Valley National Park. Like other sediments or soils within an urbanized and developed watershed or water body influenced by anthropogenic activities, these channel sediments are impacted by low concentrations of metals, nutrients, polycyclic aromatic hydrocarbons (PAHs), polychlorinated biphenyls (PCBs), pesticides and many other constituents reflective of ambient conditions in the 21st Century environment. These channel sediments were evaluated to determine their suitability for placement at a designated site in Lake Erie. During three sampling events conducted in 2014 and 2015, sediments from this reach of the harbor were sampled as dredged material management units (DMMUs) designated DMMU-1, DMMU-2a and DMMU-2b, and subjected to a suite of physical, chemical and biological tests. In addition, bottom sediments were sampled from a two-square mile deep-water area in Lake Erie proposed for the placement of these dredged sediments (open-lake placement area CLA-1). Other lake locations offshore of Cleveland were also sampled and subjected to similar testing. Depending on the sampling event and sediments sampled, testing included bulk sediment physical and chemical analyses, simultaneously extracted metals/acid volatile sulfide (SEM/AVS) analysis, PAH sediment pore water testing, standard elutriate testing, standard sediment (benthic) and elutriate (water column) bioassays, and sediment benthic bioaccumulation testing for PCBs and pesticides. Data generated from this effort were used to evaluate whether these dredged sediments meet Clean Water Act (CWA) Section 404(b)(1) Guidelines at 40 CFR 230.11(d) for placement in the open-water, including compliance with applicable state water quality standards (WQSs). To evaluate whether sediments dredged from the Upper Cuyahoga River Channel meet these Guidelines for open-lake placement with respect to contaminant-related impacts, relevant contaminant pathways were examined to evaluate fate, exposure and risks. Primary contaminant exposure pathways in the water column include the uptake of contaminants by plankton and fish as they are released from the dredged sediments during discharge. Water column toxicity tests (bioassays) using a water flea (48-hour survival of Ceriodaphnia dubia) and minnow (96-hour survival of Pimephales promelas)

Cleveland Harbor (Upper Cuyahoga River
Channel) Dredged Sediment Evaluation—2016
Page | 2
were used as measurement endpoints to assess these risks. Contaminant exposure pathways from the dredged sediments on the lake bottom include direct toxicity, and net uptake (bioaccumulation) and/or trophic transfer through bioaccumulation. Standard sediment benthic bioassays using an amphipod (10-day survival of Hyalella azteca) and midge (10-day survival and growth of Chironomus dilutus), and standard benthic bioaccumulation experiments using an oligochaete worm (28-day Lumbriculus variegatus bioaccumulation), were used to assess toxicity and bioaccumulation endpoints, respectively. With respect to benthic contaminant-related impacts after the dredged sediments are placed on the lake bottom, results of the benthic bioassays demonstrated that the channel sediments did not exhibit any toxicity when compared to reference sediments or standard criteria (H. azteca mean survival range 86 to 92%; C. dilutus mean survival range 88 to 92%; C. dilutus mean growth range 0.80 to 2.65 mg dry weight). Total PAHs were initially identified as a preliminary contaminant of concern (PCOC) because bulk concentrations in the channel sediments were at times higher than those in CLA-1 reference sediments. However, the laboratory benthic bioassays and PAH sediment pore water testing indicated that the channel sediments were protective of benthic organisms. PCBs were identified as a PCOC in the channel sediments because bulk concentrations were occasionally measured at higher concentrations than those in CLA-1 and other reference sediments. Laboratory experiments showed that the benthic bioaccumulation of total PCBs from the channel sediments (mean range 5,259 µg/kg-lipid to 8,666 µg/kg-lipid) was not significantly higher than that from CLA-1 reference sediments (mean 7403 µg/kg-lipid [excluding any suspected PCB impacted sediments]), and/or associated magnitudes of difference (MODs) (measured laboratory bioaccumulation from dredged sediments/measured laboratory bioaccumulation from reference area sediments) relative to CLA-1 reference sediments were less than a factor of 2, suggesting that such a difference is not likely to warrant ecological and human health concerns. In addition, benthic bioaccumulation of total PCBs from the channel sediments was comparable to bioaccumulation measured using regional lake background sediments collected offshore of Cleveland (surface area-weighted mean 5,188 µg/kg-lipid). Laboratory experiments showed that the benthic bioaccumulation of dichlorodiphenyldichloroethylene (DDE) from DMMU-1 (8.4 µg/kg) and DMMU-2b sediments (7.3 µg/kg) were statistically higher than those associated with the CLA-1 reference sediments (6.4 µg/kg). However, MODs relative to CLA-1 reference sediments were less than a factor of 2, suggesting that such a difference is not likely to warrant ecological and human health concerns. Laboratory experiments showed that the benthic bioaccumulation of DDE from DMMU-2b sediments (6.7 µg/kg) was not statistically different than those associated with the CLA-1 reference sediments. This information shows that open-lake placement of the channel sediments at CLA-1 would not result in any significant or ecologically

Cleveland Harbor (Upper Cuyahoga River
Channel) Dredged Sediment Evaluation—2016
Page | 3
meaningful increase in PCBs or DDE bioaccumulation in aquatic life, including in fish, and meets CWA Section 404(b)(1) Guidelines. An important consideration is the benefit resulting from strategic placement of dredged sediments within the southeast quadrant of CLA-1. Placement of this dredged sediment at this location would serve to cap and abate significant PAH-related benthic toxicity associated with existing CLA-1 sediments in that area, and result in a several-fold reduction in potential PCB bioaccumulation from sediments within a portion of that area. With respect to impacts when contaminants in the dredged sediments are released to the water column during open-lake placement, elutriate testing and water column bioassays identified ammonia-N (maximum measured elutriate concentration 19 mg/L) as a water column PCOC. It was identified as a PCOC because sediment elutriate concentrations were greater than levels protective of water column organisms, prior to consideration of dilution and dispersion during dredged sediment placement. Ammonia is a naturally occurring constituent of sediment pore water and, due to its labile and ephemeral nature, is generally not considered a contaminant of concern in the management of dredged sediments. Water quality modeling indicated that ammonia released during dredged sediment placement would rapidly dilute in the water column to levels protective of aquatic life. Therefore, ammonia-N was eliminated as a PCOC. Elutriate data and modeling indicated that the discharge of the dredged sediments at CLA-1 would be protective of aquatic life and human health, and comply with applicable State WQSs after consideration of dilution and dispersion. Across several events between 2013 and 2015, the Ohio Environmental Protection Agency (OEPA) generated data on Upper Cuyahoga River and Lake Erie sediments offshore of Cleveland. Data generated from these efforts were reviewed and considered, and some were not integrated into the evaluation due to quality control and technical issues. OEPA data integrated into this evaluation were similar to the data generated by USACE between 2012 and 2015. This evaluation indicates that the discharge of sediments dredged from DMMU-1, DMMU-2a and DMMU-2b at CLA-1 would not result in contaminant-related, unacceptable adverse effects to the aquatic ecosystem. This conclusion is analogous with the previous 2013 dredged sediment evaluation. Based on this information, it has been concluded that these dredged sediments meet CWA Section 404(b)(1) Guidelines for open-lake placement at CLA-1 as presented in 40 CFR 230.11(d).

Cleveland Harbor (Upper Cuyahoga River
Channel) Dredged Sediment Evaluation—2016
Page | 4
1.0 INTRODUCTION AND BACKGROUND Cleveland Harbor, Ohio is located on south shore of Lake Erie at the mouth and lower reach of the Cuyahoga River at Cleveland, Ohio. Federal navigation channels in the harbor are deep-draft and designed to accommodate commercial navigation, and include a River Channel, Turning Basin, Old River Channel and Outer Harbor channels. These channels have authorized depths ranging from -23 to -29 feet low water datum (LWD)1. Cleveland Harbor is situated within the designated Cuyahoga River Great Lakes Area of Concern (AOC) (U.S. Environmental Protection Agency [USEPA] 2015a). The AOC includes the lower 45 miles of the river from the Ohio Edison Dam to the mouth, and approximately 10 miles of Lake Erie shoreline from Edgewater Park to Wildwood Park on the west and east sides of Cleveland, respectively. Maintenance dredging of harbor channels requires the need to manage the resulting dredged sediments. In 2013, sediments dredged from the Upper Cuyahoga River Channel between the upstream limit (Station 799+00) and downstream upper Turning Basin (Station 736+00), which is represented by three dredged material management units (DMMUs) designated DMMU-1, DMMU-2a and DMMU-2b (Figure 1), were found to meet Clean Water Act (CWA) Section 404(b)(1) Guidelines (“contaminant determination” at 40 CFR 230.11[d]) for open-lake placement at the deep-water Lake Erie area referred to as CLA-1 (Figure 2) (USACE 2013a). In the Cuyahoga River portion of Cleveland Harbor, human alterations to the channel have enlarged channel dimensions compared to the more natural upstream sections of the river. The Cuyahoga River naturally transports a large sediment supply, which is suspended in the water column under certain water velocities and carried downstream. A primary source of sediment loading is natural erosion within the Middle Valley of the Cuyahoga River watershed, including Cuyahoga Valley National Park (USACE 2011). Erosive riverbank soils are subject to increased runoff volumes caused by urbanization of surrounding areas, resulting in streams carrying a heavy sediment load. As water enters the enlarged Upper Cuyahoga River Channel at the upstream end of Cleveland Harbor, velocities decrease significantly, resulting in the rapid deposition of the previously suspended sediment. Consequently, the Upper Cuyahoga River Channel acts as a trap for sediments that would otherwise be discharged and deposited to downstream areas, including Lake Erie. As sediments deposit through sedimentation and accumulate as shoals, they tend to obstruct deep-draft commercial navigation in the channel, thus requiring regular maintenance dredging.
1 Low Water Datum for Lake Erie is elevation 569.2 feet above mean water level at Rimouski, Quebec, Canada (International Great Lakes Datum [IGLD] 1985).

Cleveland Harbor (Upper Cuyahoga River
Channel) Dredged Sediment Evaluation—2016
Page | 5

Cleveland Harbor (Upper Cuyahoga River
Channel) Dredged Sediment Evaluation—2016
Page | 6

Cleveland Harbor (Upper Cuyahoga River
Channel) Dredged Sediment Evaluation—2016
Page | 7
Sediments within the Upper Cuyahoga River Channel generally consist of organic rich brown clayey silt, with localized areas of sand, gravel and leaf debris mixed in the sediments located immediately downstream of the upstream limit of the Federal navigation project. Lake sediments offshore of Cleveland range widely in composition, and can consist of coarse sand and gravel, shell fragments, hardpan clay, shale and clayey silt. Lake sediments at CLA-1, as well as other deep open-lake areas offshore of the harbor, are more similar to the shoaled sediments in the channel, generally consisting of brown clayey silt. Because the transition from upstream streambed to the maintained channel functions as a sediment trap, the Upper Cuyahoga River Channel experiences significantly higher shoaling rates than the rest of the harbor, estimated at more than eight feet per year in certain areas. About 200,000 cubic yards of sediment are dredged annually from this portion of the Cuyahoga River Channel, often over multiple dredging events per year, to maintain depths adequate for deep-draft commercial navigation. Cleveland Harbor is typically dredged in two phases; in the spring between May and June, and fall between October and November. The vast majority of sediments are dredged during the spring phase. About 80 percent of the harbor’s annual dredging needs are typically in the Upper Cuyahoga River Channel. There are a number of potential sources of sediment contamination within the watershed, both anthropogenic and natural. These sources include: municipal and industrial discharges, urban and agricultural runoff, combined sewer overflows, atmospheric deposition, biological production (detritus) and mineral deposits. Due to the potential for contaminant-related impacts, the vast majority of sediments dredged from harbor have been placed in Federal and non-Federal confined disposal facilities (CDFs) since about 1968. However, evaluations conducted on sediment samples obtained in 2010 to determine suitability of sediment for beneficial use concluded that sediments from the Upper River Channel would be suitable for aquatic placement scenarios (Kreitinger et al. 2011). In 2013, sediments dredged from the Upper Cuyahoga River Channel were concluded to meet contaminant-related CWA Section 404(b)(1) Guidelines for open-lake placement at CLA-1 (USACE 2013a). The objective of this report is to evaluate whether sediments dredged from Cleveland Harbor’s Upper Cuyahoga River Channel meet CWA Section 404(b)(1) Guidelines at 40 CFR 230.11(d) for open-lake placement at CLA-1 based on new data. USACE (2013a) concluded that these dredged sediments met these Guidelines. This evaluation is in accordance with the protocols and guidelines prescribed in the Great Lakes Dredged Material Testing and Evaluation Manual (Great Lakes Testing Manual [GLTM]) (USEPA/U.S. Army Corps of Engineers [USACE] 1998a) and Evaluation of Dredged Material Proposed for Discharge in Waters of the U.S.—Testing Manual (Inland Testing Manual [ITM]) (USEPA/USACE 1998b), and is specific to 40 CFR 230.11(d)

Cleveland Harbor (Upper Cuyahoga River
Channel) Dredged Sediment Evaluation—2016
Page | 8
(“contaminant determination”) (USEPA 2015b). Further, it is consistent with 33 CFR 336 toward establishment of the Federal standard relating to the least costly dredged material management alternative, consistent with sound engineering practices and selected through CWA Water Act Section 404(b)(1) Guidelines (USACE 1988). 2.0 SEDIMENT SAMPLING AND TESTING
This evaluation emphasizes 2014 and 2015 analyses performed on sediment samples collected from the Upper Cuyahoga River Channel, and open-lake nearshore and deep water areas in Lake Erie. It addresses the discharge of sediments dredged from the Upper Cuyahoga River Channel at CLA-1. This evaluation also considers relevant sediment data and information from 2012 as contained in USACE (2013a), as well as relevant data and information generated by the Ohio Environmental Protection Agency (OEPA) across several sediment sampling and analysis events performed between 2013 and 2015 (see Section 3.5). 2.1 2014 and 2015 investigations 2.1.1 Objective The overall objective of the 2014 and 2015 sediment sampling and analyses efforts was to evaluate whether sediments dredged for maintenance of the Upper Cuyahoga River Channel meet CWA Section 404(b)(1) Guidelines at 40 CFR 230.11(d), which includes compliance with applicable state water quality standards (WQSs), for open-lake placement. The 2014 investigation was implemented to address the most pressing concerns identified by OEPA in reviewing the 2013 water quality certification application for open-lake placement. As such, the 2014 sampling focused on the analyses of polycyclic aromatic hydrocarbons (PAHs) and polychlorinated biphenyls (PCBs) in Cleveland Harbor and lake sediments. Another objective of the 2014 investigation was to evaluate the variability of PAHs and PCBs in regional lake sediments offshore of Cleveland, as well as in and around the previously identified open-lake placement/reference areas. The 2015 investigation was a more standard sampling/testing effort to support dredged sediment management decisions. The details of these investigations are provided below. 2.1.2 2014 investigation a. Sampling

Cleveland Harbor (Upper Cuyahoga River
Channel) Dredged Sediment Evaluation—2016
Page | 9
Sediment sampling in 2014 was conducted across two events, June 9-11, 2014 and September 23 and 24, 2014. Harbor and lake sediments were sampled in June, and additional lake sampling was conducted in September. To characterize sediment shoals within the Upper Cuyahoga River Channel, 15 bulk surface sediment grab samples (sites CH-1 through CH-15) were collected from locations staged throughout channel boundaries (Figure A1). To characterize lake bottom sediments in Lake Erie, sediment grab samples were collected from several deep-water areas adjacent to Cleveland Harbor: CLA-1 (discrete sites CLA1-1 through CLA1-5), and additional reference areas/sites CLA-4 (discrete sites CLA4-1 through CLA4-5), CLA-7 (discrete sites CLA7-1 through CLA7-5), CLA14 (discrete sites CLA14-1 through CLA14-5) and CLAM-1 through CLAM-5 (Figure A2). Discrete sediment samples were also composited as follows (see Figures 1 and 2): DMMUs—composite DMMU-1 (discrete sites CH-1 through CH-5), composite DMMU-2a (discrete sites CH-6 through CH-10), composite DMMU-2b (discrete sites CH-11 through CH-15); proposed open-water placement area—composite CLA-1 (discrete sites CLA1-1 through CLA1-5) and reference composite CLA-4 (discrete sites CLA4-1 through CLA4-5), CLA-7 (discrete sites CLA7-1 through CLA7-5), and CLA-14 (discrete sites CLA14-1 through CLA14-5). In September, 25 additional lake sediment samples were collected from locations spaced at two-mile increments across a triangular grid extending from just outside Cleveland Harbor breakwaters to CLA-1 (LE-1 through LE-25) (Figure A3). Sediment samples were not collected from six of the proposed sampling locations (LE-5, 8, 9, 15, 17 and 18) due to poor sample recovery. b. Analyses The sediment samples were analyzed by RTI (2014a) and RTI (2014b) as follows: (1) Bulk sediment analyses
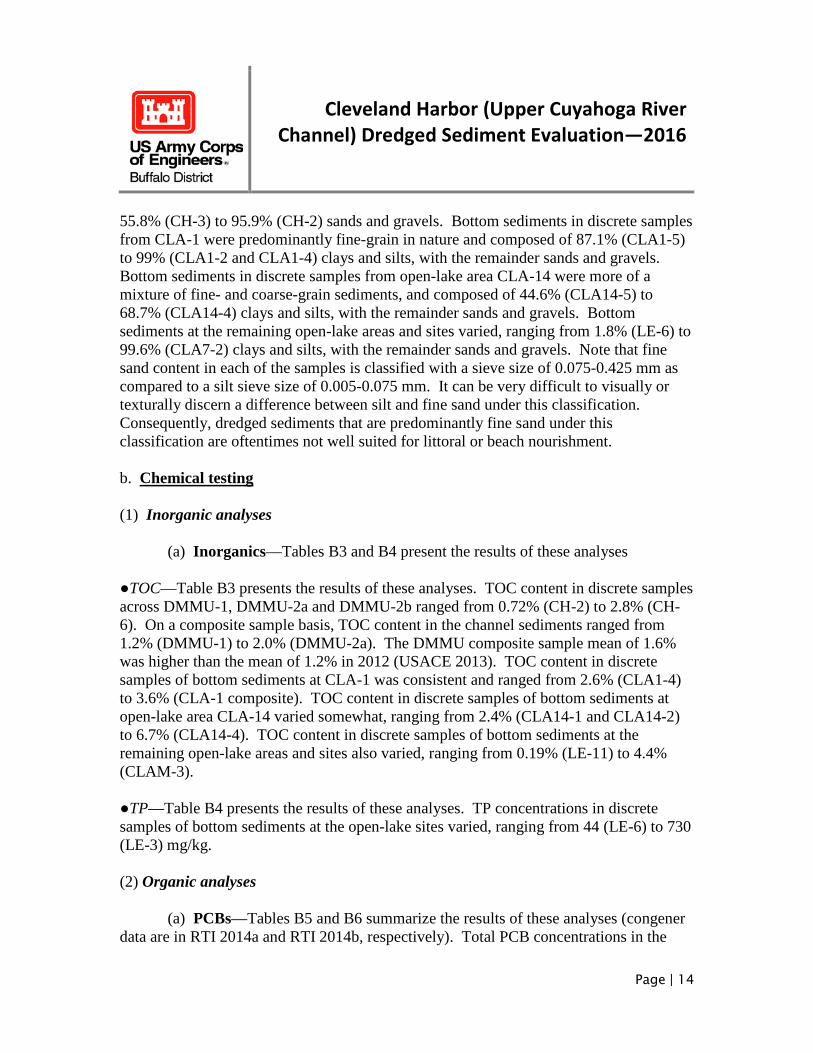
(a) Discrete samples—Discrete sediment samples from the harbor and lake were analyzed for bulk grain size (sieve and hydrometer) and percent moisture, total organic carbon (TOC), PCBs (209 congeners) and PAHs (16 USEPA priority pollutants and methylnaphthalenes). The lake samples collected in September were also analyzed for total phosphorus (TP).

Cleveland Harbor (Upper Cuyahoga River
Channel) Dredged Sediment Evaluation—2016
Page | 10
(b) Composite samples—Composite sediment samples from the harbor (DMMU-1, DMMU-2a and DMMU-2b) and lake (CLA-1, CLA-4, CLA-7 and CLA-14) were also analyzed for bulk grain size (sieve and hydrometer) and percent moisture, TOC, PCBs (209 congeners) and PAHs (16 USEPA priority pollutants and methylnaphthalenes). In addition, sediment and pore water was analyzed for 34 PAHs (18 non-alkylated parent compounds and 16 groups of generic alkylated forms) which have been identified as being generally most abundant in the environment and commonly measured (USEPA 2003). (2) Biological testing
(a) 28-day Lumbriculus variegatus bioaccumulation (from sediment)—28-day L. variegatus bioaccumulation tests for PCBs (209 congeners) were applied to harbor composite samples DMMU-1, DMMU-2a and DMMU-2b and lake composite samples CLA-1, CLA-4, CLA-7 and CLA-14. Additionally, bioaccumulation testing was applied to each discrete lake sample collected in June. A subset of samples from September were subject to bioaccumulation testing (LE-1, 3, 11, 12, 13, 19, 21, 23, 24). Lipid content in L. variegatus tissue was determined for each sample. 2.1.3 2015 investigation a. Sampling Sediment sampling in 2015 was conducted during the week of April 27, 2015. To characterize sediment shoals within the Upper Cuyahoga River Channel, 15 bulk surface sediment grab samples (sites CH-1 through CH-15) were collected from locations staged throughout the area, within the navigation channel boundaries (Figure A4). In addition, a subset samples from certain locations collected through core sampling from the sediment surface to project depth or dredging prism (CH-3, 5, 7, 9, 12 and 15). To characterize sediments in the open-waters of Lake Erie, sediment grab samples were collected from CLA-1 (discrete sites CLA1-1 through CLA1-5), and an additional reference area, CLA-4 (discrete sites CLA4-1 through CLA4-5) (Figure A5). b. Analyses The sediment samples were analyzed by RTI (2015) and USAERDC (2015a) as follows: (1) Bulk sediment analyses
Cleveland Harbor (Upper Cuyahoga River
Channel) Dredged Sediment Evaluation—2016
Page | 11
(a) Discrete samples—Discrete sediment samples from the harbor and lake were
analyzed for metals (23 target analytes list (TAL, including mercury), total cyanide, total Kjeldahl nitrogen (TKN), ammonia nitrogen (NH3), TP, pesticides, bulk grain size (sieve and hydrometer) and percent moisture, TOC, PCBs (Aroclors) and PAHs (16 USEPA priority pollutants and methylnaphthalenes). The lake samples were also analyzed for total oil and grease.
(b) Composite samples—Composite sediment samples from the harbor (DMMU-1, DMMU-2a and DMMU-2b) and lake (CLA-1 and CLA-4) were subjected to the same physical and chemical analyses as the discrete samples with the addition of the analysis of acid volatile sulfides/simultaneously extracted metals (AVS/SEM), PCBs (209 congeners) and analysis of pore water for 34 PAHs. (2) Biological testing
(a) 28-day Lumbriculus variegatus bioaccumulation (from sediment)—Standard 28-day L. variegatus bioaccumulation tests for PCBs (209 congeners) were applied to harbor composite samples DMMU-1, DMMU-2a and DMMU-2b and lake composite samples CLA-1 and CLA-4. Lipid content was determined for each sample.
(b) 10-day Hyalella azteca and Chironomus dilutus whole sediment toxicity
tests—Standard 10-day H. azteca and C. dilutus whole sediment (solid phase) toxicity tests were applied to harbor composite samples DMMU-1, DMMU-2a and DMMU-2b and lake composite samples CLA-1 and CLA-4.
(b) 48-hour Ceriodaphnia dubia and 96-hour Pimephales promelas water column toxicity tests—Standard 48-hour C. dubia and four-day P. promelas water column toxicity tests were applied to harbor composite samples DMMU-1, DMMU-2a and DMMU-2b. Based on the results of these bioassays, toxicity identification/reduction evaluation (TIE/TRE) was performed on the sediment elutriates. (3) Elutriate testing The standard elutriate test (SET) was performed on harbor composite sediment samples DMMU-1, DMMU-2a and DMMU-2b. The SET is a laboratory simulation to predict the potential release of contaminants from dredged sediments to the water column during open-water placement of dredged sediments. Elutriate preparations and lake water were analyzed for the same chemical parameters as the discrete sediment samples.

Cleveland Harbor (Upper Cuyahoga River
Channel) Dredged Sediment Evaluation—2016
Page | 12
3.0 DREDGED SEDIMENT EVALUATION 3.1 General description This evaluation focuses on sediments dredged from the upper Cuyahoga River Channel as represented by DMMU-1, DMMU-2a and DMMU-2b (Figure 1), and its placement at open-lake area CLA-1 (Figure 2). It references or integrates information from the previous 2013 dredged sediment evaluation (USACE 2013) as appropriate. The initial step toward evaluating the toxicological effects of placing any dredged sediments in the open-lake is to compare bulk contaminant concentrations in the DMMU samples to those from open-lake placement area(s). If any DMMU contaminant concentration significantly exceeds open-lake placement area sediment concentrations such that they would present a potential toxicological risk, it was identified as a preliminary contaminant of concern (PCOC) or COC, and then subjected to further testing and/or evaluation. Further testing/evaluation typically includes modeling or biological testing (bioassays). With respect to applicable state WQSs, sediment elutriate data are used to assess compliance after consideration of dilution and dispersion. Water column bioassay data are also utilized to evaluate water quality-related effects and compliance. 3.2 Site conceptual model The site conceptual model for this activity focuses on potential contaminant-related adverse impacts to the aquatic ecosystem that would occur as a result of the discharge of the dredged sediment at the deep-water open-lake area designated CLA-1. This area is two square miles and in water depths of between 50 and 60 feet. Aquatic habitat at CLA-1 consists primarily of warm water, mud-bottom (mainly silt/clay), benthic substrate with overlying water column. Some of CLA-1 has been impacted by dredged sediment as it was previously used for the placement of sediments dredged from Cleveland Harbor over 40 years ago. Bottom sediments at this area are colonized by a community of benthic invertebrates that are relatively low in species diversity and dominated by oligochaetes and chironomids. The water column at this area is used by most fish, nekton and plankton on a transient basis as required for foraging and migration. Aquatic birds use the water surface and water column on a transient basis for resting and foraging. Under this dredged sediment management alternative, sediments from Cleveland Harbor would typically be mechanically dredged from the channel using a clamshell bucket, then placed in a scow for transport and discharged at CLA-1. The dredged sediment is composed mainly of silts, clays, sands and water with residual bulk concentrations of

Cleveland Harbor (Upper Cuyahoga River
Channel) Dredged Sediment Evaluation—2016
Page | 13
contaminants and organic matter. During discharge, dredged sediment is released from the scow and descends through the water column until it hits the bottom substrate, then collapses and spreads out before coming to rest on the lake bottom. Contaminant-related impacts can occur in both the water column and benthic environs, and are assessed mainly through toxicity and bioaccumulation endpoints relative to biological receptors. Typical exposure pathways between the dredged sediment and receptors would include uptake through absorption (bioconcentration) and absorption/ingestion (bioaccumulation), and trophic transfer through bioaccumulation. With respect to contaminant-related impacts in the water column, effects require exposure to biota and include the release of dissolved contaminants from the dredged sediments and turbidity, both of which are short-term events. These effects are evaluated via comparison of elutriate contaminant concentrations, after considering the effects of dilution and dispersion in the water column by modeling of sediment elutriate data, with WQSs and toxicity criteria developed by elutriate bioassays using a minnow and water flea as representative test species. With respect to contaminant-related benthic impacts associated with the placed dredged sediments, effects require exposure to biota and include toxicity and bioaccumulation. These effects are evaluated through bulk sediment chemistry, solid phase bioassays using an amphipod and midge as representative test species, bioaccumulation experiments using an aquatic worm, and modeling. Regarding dredged sediment movement on the lake bottom, the placed sediment would behave in a manner similar to the adjacent and surrounding lake bottom sediments, whereby a thin layer of the actively bioturbated zone could resuspend and migrate from the area under severe storm conditions. Resuspended dredged sediments under these conditions would constitute a very small fraction of the regional suspended sediment load during the storm event. Any resuspended dredged sediments would mix thoroughly with the load and be indistinguishable from the regional load. Deeper depths of the open-lake placement area would serve to allay the potential for sediment erosion, resuspension and movement. 3.3 2014 investigation 3.3.1 Bulk sediment analyses a. Physical testing Tables B1and B2 present the results of these analyses. The particle size data across the DMMU-1, DMMU-2a and DMMU-2b discrete samples show that the sediments are comprised of between 4.2% (CH-2) and 98.4% (CH-14) clays and silts, with the remainder sands and gravels (on a composite sample basis, 80.8% sands/gravels in DMMU-1 to 84.8% silts and clays in DMMU-2b). Sediments within DMMU-1 and the immediately downstream Site CH-6 were more coarse-grain in nature, ranging from
Cleveland Harbor (Upper Cuyahoga River
Channel) Dredged Sediment Evaluation—2016
Page | 14
55.8% (CH-3) to 95.9% (CH-2) sands and gravels. Bottom sediments in discrete samples from CLA-1 were predominantly fine-grain in nature and composed of 87.1% (CLA1-5) to 99% (CLA1-2 and CLA1-4) clays and silts, with the remainder sands and gravels. Bottom sediments in discrete samples from open-lake area CLA-14 were more of a mixture of fine- and coarse-grain sediments, and composed of 44.6% (CLA14-5) to 68.7% (CLA14-4) clays and silts, with the remainder sands and gravels. Bottom sediments at the remaining open-lake areas and sites varied, ranging from 1.8% (LE-6) to 99.6% (CLA7-2) clays and silts, with the remainder sands and gravels. Note that fine sand content in each of the samples is classified with a sieve size of 0.075-0.425 mm as compared to a silt sieve size of 0.005-0.075 mm. It can be very difficult to visually or texturally discern a difference between silt and fine sand under this classification. Consequently, dredged sediments that are predominantly fine sand under this classification are oftentimes not well suited for littoral or beach nourishment. b. Chemical testing (1) Inorganic analyses (a) Inorganics—Tables B3 and B4 present the results of these analyses ●TOC—Table B3 presents the results of these analyses. TOC content in discrete samples across DMMU-1, DMMU-2a and DMMU-2b ranged from 0.72% (CH-2) to 2.8% (CH-6). On a composite sample basis, TOC content in the channel sediments ranged from 1.2% (DMMU-1) to 2.0% (DMMU-2a). The DMMU composite sample mean of 1.6% was higher than the mean of 1.2% in 2012 (USACE 2013). TOC content in discrete samples of bottom sediments at CLA-1 was consistent and ranged from 2.6% (CLA1-4) to 3.6% (CLA-1 composite). TOC content in discrete samples of bottom sediments at open-lake area CLA-14 varied somewhat, ranging from 2.4% (CLA14-1 and CLA14-2) to 6.7% (CLA14-4). TOC content in discrete samples of bottom sediments at the remaining open-lake areas and sites also varied, ranging from 0.19% (LE-11) to 4.4% (CLAM-3). ●TP—Table B4 presents the results of these analyses. TP concentrations in discrete samples of bottom sediments at the open-lake sites varied, ranging from 44 (LE-6) to 730 (LE-3) mg/kg. (2) Organic analyses
(a) PCBs—Tables B5 and B6 summarize the results of these analyses (congener data are in RTI 2014a and RTI 2014b, respectively). Total PCB concentrations in the

Cleveland Harbor (Upper Cuyahoga River
Channel) Dredged Sediment Evaluation—2016
Page | 15
sediment samples were determined by summing all congeners, with non-detectable concentrations valued at zero.
●PCB concentrations in lake bottom sediments—For the purposes of this evaluation, bulk sediment total PCB concentrations of up to 400 µg/kg were determined to be within the range of ambient lake bottom sediments (not influenced by past dredged sediment discharges) based on the range in measured PCB concentration between sediment samples from LE-11 and LE-10 (Table B6). This also served as the basis for assessing whether total PCB concentrations in sediment samples at assumed former dredged sediment discharge sites were significantly influenced by dredged sediments. These sites were determined to include CLA1-5 (1,450 µg/kg) within the proposed open-lake placement area, LE-3 (5,880 µg/kg) outside and adjacent to Cleveland Outer Harbor and LE-16 (968 µg/kg) just outside of CLA-14. Excluding these three sites, the average and range in total PCB concentrations across all discrete samples in Lake Erie offshore of Cleveland was 112 µg/kg (5,778 µg/kg-TOC) and 9.36 to 400 µg/kg or 248 to 25,000 µg/kg-TOC, respectively. Excluding sites from CLA-1 and CLA-14 made little difference in these values, resulting in an average and range of 102 µg/kg (6,038 µg/kg-TOC) and 9.36 to 400 µg/kg (248 to 25,000 µg/kg-TOC,) respectively. Using this approach, CLA-1 reference sediments were determined based on PCB data from CLA1-1, CLA1-2, CLA1-3 and CLA1-4, yielding a total PCB concentration mean of 156 µg/kg (5,579 µg/kg-TOC).
●Comparison of PCB concentrations in channel and lake sediments—The average total PCB concentration across all discrete samples in DMMU-1, DMMU-2a and DMMU-2b was 95 µg/kg (5,737 µg/kg-TOC) (range 32 to 300 µg/kg or 2854 to 15000 µg/kg-TOC) and comparable to the average of 102 µg/kg (6,038 µg/kg-TOC) (range 9.36 to 400 µg/kg or 248 to 25,000 µg/kg-TOC) across all discrete Lake Erie sediment samples not influenced by past dredged sediment placement. It is also comparable to the average of 112 µg/kg (5,778 µg/kg-TOC) (range 9.36 to 400 µg/kg or 248 to 25,000 µg/kg-TOC) across all discrete Lake Erie sediment samples when including samples from CLA-1 and CLA-14, and excluding samples where PCB contamination is assumed to be associated with formerly placed dredged sediments. This shows that PCB contamination in the channel sediments is consistent with (or less than) that which exists in surface Lake Erie sediments offshore of Cleveland. Total PCB concentrations in the vast majority of surface sediments sampled at CLA-1 were consistent with ambient levels (CLA1-1 through CLA1-4 average 156 µg/kg [5579 µg/kg-TOC]), indicating limited impact in these samples from former sediment placement activities. The average total PCB concentration across all discrete DMMU-1, DMMU-2a and DMMU-2b samples was lower or comparable to this average (range 104 to 236 µg/kg or 4,000 to 8,138 µg/kg-TOC). Figure 3 compares total PCB concentrations in the channel, Lake Erie and CLA-1

Cleveland Harbor (Upper Cuyahoga River
Channel) Dredged Sediment Evaluation—2016
Page | 16
FIGURE 3
*Excludes sites where PCB contamination was suspected to be influenced from past dredged sediment discharges.
reference sediments. Table 1 summarizes the total PCB data across all of the channel and lake sediment samples:
TABLE 1
PCB MEASUREMENT
LOCATION/AREA HARBOR LAKE
UPPER RIVER CHANNEL
CLA-1 REFERENCE*
CLA-14* OTHER AREAS/SITES*
DISCRETE SAMPLES
Total PCBs (µg/kg) 32 to 300 104 to 236 82 to 291 9.36 to 400
TOC-normalized PCBs (µg/kg-TOC) 2,854 to 15,000 4,000 to 8,138 2,158 to 9,700 248 to 25,000 COMPOSITE SAMPLES
Total PCBs (µg/kg) 67.9 to 144 156** 179 110 to 155
TOC-normalized PCBs (µg/kg-TOC) 5,100 to 8,471 5,579** 5,967 3,929 to 5,536 *Excludes areas/sites where PCB contamination was suspected to be influenced from past dredged sediment discharges. **Due to higher PCB contamination encountered at CLA1-5 (1,450 µg/kg) (which biased the composite sample concentration high [1,250 µg/kg]), the average value across CLA1-1 through CLA1-4 was used in lieu of the composite sample concentration.
0
1000
2000
3000
4000
5000
6000
7000
8000
Upper CuyahogaRiver Channel
Lake Erie reference* CLA-1 reference*
Aver
age
tota
l PCB
conc
entr
atio
n (±
SE) (
µg/k
g-TO
C)
Area
Comparison of total PCB concentrations in channel, and Lake Erie and CLA-1 reference sediments

Cleveland Harbor (Upper Cuyahoga River
Channel) Dredged Sediment Evaluation—2016
Page | 17
With respect to comparisons among the channel and lake sediments, there are two main points that can be concluded from the data in this table: PCB contamination in the channel sediments is within the range of PCB
contamination in Lake Erie bottom sediments not impacted by past dredged sediment placement activities.
Except for one site within CLA-1 and one site just outside of CLA-14, PCB contamination in reference sediments at open-lake areas CLA-1 and CLA-14 is within the range of PCB contamination in Lake Erie bottom sediments not impacted by past dredged sediment discharge activities.
The PCB data on the channel sediments are consistent with those presented in USACE (2013a) in which concentrations in discrete sediment samples from DMMU-1, DMMU-2a and DMMU-2b ranged from 33.3 to 333 µg/kg (composite sample range 81.4 to 95.6 µg/kg), and from 2,932 to 26,385 µg/kg-TOC (composite sample range 6,373 to 9,146 µg/kg-TOC) on a TOC-normalized basis. The PCB data on bottom sediments at open-lake areas CLA-1 (except for CLA1-5) and CLA-4 are also consistent with those presented in USACE (2013a). Based on this information, total PCBs were not identified as a PCOC in the channel sediments. However, benthic bioaccumulation testing for PCBs was nevertheless performed (see paragraph 3.3.2). (b) PAHs ●PAH concentrations in sediments—Table 2 summarizes total PAH data across all of the channel and lake sediment samples:

Cleveland Harbor (Upper Cuyahoga River
Channel) Dredged Sediment Evaluation—2016
Page | 18
TABLE 2
PAH MEASUREMENT
LOCATION/AREA HARBOR LAKE
UPPER RIVER CHANNEL
CLA-1 CLA-14 OTHER AREAS/SITES
DISCRETE SAMPLES
Total PAHs (16 USEPA priority pollutants) (µg/kg)
1,059 to 12,619 3,350 to 10,780
9,700 to 14,540 177 to 13,070
TOC-normalized PAHs (16 USEPA priority pollutants) (mg/kg-TOC)
113 to 1,753 137 to 385 441 to 539 7 to 816
COMPOSITE SAMPLES
Total PAHs (16 USEPA priority pollutants) (µg/kg)
3,180 to 6,360 6,792* 12,120* 2,470 to 2,690*
TOC-normalized PAHs (16 USEPA priority pollutants) (mg/kg-TOC)
311 to 376 243* 490* 91 to 96*
Total PAHs (34 PAH structures) (µg/kg) 8,680 to 14,110 529,750** 587,970** 9,820 to 10,320 TOC-normalized PAHs (34 PAH structures) (mg/kg-TOC)
706 to 801 14,715** 19,599** 364 to 369
*Excludes areas/sites where PAH contamination was suspected to be influenced from past dredged sediment discharges. **Sample likely impacted by past dredged sediment discharges.
• USEPA 16 priority pollutants—Tables B7 and B8 summarize the results of these analyses (see Table B9 for total PAH data on the composite sediment samples). Total PAH concentrations in the sediment samples were determined by summing the USEPA 16 priority pollutants. The average total PAH concentration across all discrete samples in DMMU-1, DMMU-2a and DMMU-2b was 5,764 µg/kg (401 mg/kg-TOC) (range 1,059 to 12,619 µg/kg or 113 to 1753 mg/kg-TOC) and higher than the average of 2,562 µg/kg (193 mg/kg-TOC) (range 177 to 13,070 µg/kg or 7 to 816 mg/kg-TOC) across all discrete Lake Erie sediment samples not impacted by past dredged sediment placement. It was also somewhat higher than the average of 4,467 µg/kg (249 mg/kg-TOC) (range 177 to 13,070 µg/kg or 7 to 816 mg/kg-TOC) across all discrete Lake Erie sediment samples (excluding samples assumed to be impacted by formerly placed dredged sediments). This shows that PAH contamination in the channel sediments is somewhat higher than that which exists in surface Lake Erie sediments offshore of Cleveland. Depending on whether the data are TOC-normalized, the average total PAH concentration across all discrete DMMU-1, DMMU-2a and DMMU-2b samples was lower or higher than the average of 6,792 µg/kg (243 mg/kg-TOC) (range 3,350 to 10,780 µg/kg or 137 to 385 mg/kg-TOC) across all discrete non-impacted sediment samples at CLA-1. Regardless of whether the bulk PAH concentrations in the channel sediments are higher or lower than those in these

Cleveland Harbor (Upper Cuyahoga River
Channel) Dredged Sediment Evaluation—2016
Page | 19
open-lake sediments, gauges of potential PAH toxicity in sediments were evaluated in the form of solid phase bioassays and analysis of sediment pore water concentrations. The PAH data on the channel sediments are overall consistent with those presented in USACE (2013a) in which concentrations in discrete sediment samples from DMMU-1, DMMU-2a and DMMU-2b ranged from 842 to 16,336 µg/kg (composite sample range 6,250 to 14,972 µg/kg), and from 183 to 778 mg/kg-TOC (composite sample range 417 to 1,682 mg/kg-TOC) on a TOC-normalized basis. The PAH data on bottom sediments at CLA-1 (except for CLA1-3 and CLA1-5) are consistent with or somewhat higher than those presented in USACE (2013a). The PAH data on bottom sediments at CLA-4 are consistent with or somewhat lower than those presented in USACE (2013a).
34 PAH structures (18 non-alkylated parent compounds and 16 groups of generic alkylated forms)—Table B9 summarizes the results of these analyses. Total PAH concentrations in the sediment samples were determined by summing the 34 PAH structures (this table also includes total PAH concentrations based on the 16 USEPA priority pollutants). Total PAH concentrations in the DMMU-1, DMMU-2a and DMMU-2b composite samples ranged from 8,680 to 13,610 µg/kg (706 to 801 mg/kg-TOC). These concentrations are comparable to or somewhat higher than those measured in the CLA-4 and CLA-7 sediments. Note that the very high total PAH concentration in the CLA-1 composite sediment sample appeared to reflect the high concentrations measured in discrete sediment samples CLA1-3 and CLA1-5.
●PAH concentrations in sediment pore water—The hydrocarbon narcosis and equilibrium partitioning (EqP) models (USEPA 2003) assume that the risk of PAH mixtures to benthic organisms is attributable to the freely dissolved PAH compound concentrations in sediment pore (interstitial) water. PAHs in the dissolved phase are those which are bioavailable and have potential to cause toxicity. The predicted measure of toxicity is an EqP sediment benchmark toxic unit final chronic value (∑ESBTUFCV). Sediments determined to have ∑ESBTUFCV <1.0 for a mixture of PAH compounds are predicted to be acceptable for the protection of benthic organisms. In this case, dissolved water concentrations in sediment pore water were directly measured using ASTM method D7363. Using direct sediment pore water concentration data, sediment interstitial water toxic unit final chronic values (∑IWTUFCV) are calculated as:

Cleveland Harbor (Upper Cuyahoga River
Channel) Dredged Sediment Evaluation—2016
Page | 20
(1) CIW PAHi
∑IWTUFCV = ∑ ________
FCVi Where: CIW PAHi = Dissolved concentration of PAH compound in sediment interstitial water (µg/L) FCVi = PAH compound-specific FCV concentration in sediment pore water (µg/L) Table B10 summarizes sediment pore water concentrations of the 34 PAH structures and associated calculated ∑IWTUFCV. Channel sediment ∑IWTUFCV were all <0.1, indicating that PAH bioavailability is low and the measured concentrations in bulk sediment are protective of benthic organisms. Lake area ∑IWTUFCV were <0.1 (CLA-4 and CLA-7), 208 (CLA-1) and 403 (CLA-14), indicating that while PAH contamination in the CLA-4 and CLA-7 sediments was protective of benthic organisms, PAH contamination in certain sediments at CLA-1 and CLA-14 are expected to be chronically toxic to benthic organisms. The ∑IWTUFCV data on channel sediments are consistent with those sampled in 2012 USACE (2013a). Although the ∑IWTUFCV for CLA-1 sediment samples in 2012 was 2.8, no acutely toxicity to H. azteca was observed in the solid phase bioassay (USACE 2013a). This result can be explained by reviewing literature on the critical body burden expected to result in toxicity to H. azteca. Sediment pore water concentrations predicted to result in a body burden of less than 13.9 µmol/g-lipid are not expected to be toxic (USEPA 2003). These CLA-1 sediments were predicted to result in a critical body burden of 6.1 µmol/g-lipid which is lower than the 13.9 µmol/g-lipid whole body concentration at which chronic effects would be expected (USACE 2013b). Therefore, the potential risk of toxicity associated with sediments sampled from CLA-1 in 2012 is insignificant, while those collected in the composite sample in 2014 are likely to be toxic with respect to PAHs. It is evident that very high ∑IWTUFCV for CLA-1 sediments sampled in 2014 was influenced by discrete sediment samples CLA1-3 and CLA1-5. For CLA-4, the ∑IWTUFCV were consistent in 2012 and 2014. Figure 7 (Paragraph 3.4.1[b][2][b]) presents a graph of the 2012, 2014 and 2015 ∑IWTUFCV data across the channel, lake reference and toxic lake sediments. These data also indicate that placement of any of the channel sediments at CLA1-5 within the southeast corner of CLA-1 would result in an abatement of acute and chronic toxicity to benthic invertebrates.

Cleveland Harbor (Upper Cuyahoga River
Channel) Dredged Sediment Evaluation—2016
Page | 21
Based on this information, PAHs were not identified as a PCOC in the channel sediments. 3.3.2 PCB bioaccumulation testing a. Results. Total PCB concentrations in tissue samples were determined by summing all congeners with non-detectable concentrations valued at zero. Results of the standard 28-day L. variegatus bioaccumulation testing for PCBs on channel and lake area sediment samples are provided in Tables B11 and B12 (congener data are in RTI 2014a and RTI 2014b, respectively). Table B11 includes bioaccumulation test data on the channel, and CLA-1 and CLA-14 sediment samples, while Table B12 includes bioaccumulation test data on sediments from CLA-1, CLA-4 and other various lake areas/sites. Table 3 summarizes the benthic bioaccumulation PCB data and corresponding bulk composite sediment sample total PCB data:
TABLE 3
PCB MEASUREMENT
LOCATION/AREA UPPER RIVER CHANNEL LAKE
DMMU-1 DMMU-2a DMMU-2b CLA-1 REFERENCE*
CLA-4 CLA-7 OTHER DISCRETE SITES**
TISSUE
Total PCBs (µg/kg)
156 105 103 195 34.8 35 13.7 to 92.7
Lipid-normalized PCBs (µg/kg-lipid)
8,666 5,259 5,261 7,403 1,558 1,648 1,211 to 4,414
SEDIMENT
Total PCBs (µg/kg)
67.9 102 144 156 117 110 9.36 to 400
TOC-normalized PCBs (µg/kg-TOC)
5,658 5,100 8,471 5,579 4,333 3,929 248 to 25,000
*The average value across CLA1-1 through CLA1-4 was used in lieu of the composite sample concentration. CLA1-5 (1,450 µg/kg) was determined to be an outlier that is not representative of reference sediments. **Excludes sites where PCB contamination was suspected to be influenced from past dredged sediment discharges.
For the purposes of statistical comparisons among the channel and lake area bioaccumulation data and comparison of the 2012 (USACE 2013a) and 2014 bioaccumulation data sets, the 2014 PCB L. variegatus tissue data were lipid-normalized. This was because a significant positive linear relationship was established between tissue PCB concentrations and lipid content (Pearson correlation, r=0.748), as well as the fact that the mean lipid content for the 2014 data (1.93±0.05%) was statistically greater than

Cleveland Harbor (Upper Cuyahoga River
Channel) Dredged Sediment Evaluation—2016
Page | 22
that of the 2012 bioaccumulation data set (1.21±0.02%) (two-sample t-test; P<0.01). The average lipid content of 1.93% for the 2014 bioaccumulation data was almost double the overall lipid content of 1% that is characteristic field-collected oligochaetes (Oliver 1984 and 1987; Ankley et al. 1992). Similar bulk sediment PCB concentrations and higher TOC content relative to the 2012 dataset indicate that it is likely that the higher lipid content increased PCB bioaccumulation by L. variegatus in the laboratory in 2014. b. Comparisons to Lake Erie sediments at open-lake placement area and other areas/sites in Lake Erie (1) CLA-1 and regional background sediments (a) Channel sediments vs. CLA-1 and regional background sediments, 2014 data—In comparison to CLA-1 reference sediments (7,403 µg/kg-lipid), mean lipid-normalized total PCB residues in L. variegatus tissues exposed to the DMMU-2a (5,259 µg/kg-lipid) and DMMU-2b (5,261 µg/kg-lipid) sediments were lower, while those exposed to the DMMU-1 sediments (8,666 µg/kg-lipid) were higher. On a sole total PCB concentration basis, residues in L. variegatus tissues exposed to all of the channel sediments (range 67.9 to 144 µg/kg) were lower than those associated with the CLA-1 reference sediments (195 µg/kg). None of the mean lipid-normalized total PCB residues in L. variegatus tissues exposed to channel sediments were significantly different in comparison to those exposed to CLA-1 reference sediments (one-tailed Wilcoxon rank sum test; P≤0.05). Therefore, placement of the channel sediments at CLA-1 meets the CWA Section 404(b)(1) Guideline and would not result in any ecologically meaningful increase in bioaccumulation of PCBs at the placement area. The data also indicate that placement of any of the channel sediments at CLA1-5 within the southeast corner of CLA-1 would result in an estimated reduction in the benthic bioaccumulation of PCBs from 55,015 to 6,395 µg/kg-lipid. Figure 4 compares mean oligochaete bioaccumulation of total PCBs from the channel sediments to regional Lake Erie sediments offshore of Cleveland (surface area-weighted), and CLA-1 reference and CLA-1 areas, respectively. It illustrates how the placement of channel sediments at CLA-1 would not result in any significant increase in benthic bioaccumulation of PCBs.

Cleveland Harbor (Upper Cuyahoga River
Channel) Dredged Sediment Evaluation—2016
Page | 23
FIGURE 4
*Surface area-weighted mean including some modeled values. **Includes one modeled value.
(b) Channel sediments vs. CLA-1 reference sediments ●2012 and 2014 data, grouped—Total PCB benthic bioaccumulation data on the channel and CLA-1 reference sediments from 2012 (USACE 2013) were grouped with those from 2014. In comparison to the grouped CLA-1 reference sediments (5,122 µg/kg-lipid), mean lipid-normalized total PCB residues in L. variegatus tissues exposed to the grouped DMMU-2a (4,888 µg/kg-lipid) and DMMU-2b (5,086 µg/kg-lipid) sediments were lower, while those exposed to the grouped DMMU-1 sediments (7,867 µg/kg-lipid) were higher. On a total PCB concentration basis, residues in L. variegatus tissues exposed to all (range 78.9 to 121 µg/kg) but the grouped DMMU-1 sediments were lower than those
0
5,000
10,000
15,000
20,000
25,000
30,000
35,000
DMMU-1 DMMU-2a DMMU-2b Lake Eriebackground*
CLA-1reference
CLA-1**
HARBOR SEDIMENTS LAKE ERIE SEDIMENTS
Mea
n to
tal P
CB co
ncen
trat
ion
in ti
ssue
(±SE
) (µg
/kg-
lipid
)
Management unit/lake area
Comparison of oligochate bioaccumulation of total PCBs from channel, Lake Erie background, CLA-1 reference and CLA-1 sediments in 2014

Cleveland Harbor (Upper Cuyahoga River
Channel) Dredged Sediment Evaluation—2016
Page | 24
associated with the grouped CLA-1 reference sediments (115 µg/kg). None of the mean lipid-normalized total PCB residues in L. variegatus tissues exposed to grouped channel sediments were significantly different in comparison to those exposed to the grouped CLA-1 reference sediments (one-tailed Wilcoxon rank sum test; P≤0.05). ●2012 vs. 2014 data—To facilitate comparison of total PCB tissue concentrations between 2012 and 2014, a linear relationship (square of Pearson’s, r >0.99) was established between the congener subset analyzed and summed in 2012, and complete list of 209 congeners summed in 2014: (2)
Total PCBs = 3.2 + 1.5(∑PCB) When the mean lipid-normalized total PCB concentrations in L. variegatus tissues across individual DMMUs in 2012 and 2014 were compared, no statistically significant differences were observed (one-tailed homoscedastic t-Test; P≤0.05). In addition, between 2012 and 2014, there were no statistically significant differences in lipid-normalized total PCB concentrations in L. variegatus tissues associated with CLA-1 reference sediments (one-tailed homoscedastic t-Test; P≤0.05). (2) Sediments at other lake areas/sites not formally used for dredged sediment discharges—This includes all 2014 areas/sites excluding those assumed to be formally used for dredged sediment discharges over four decades ago (CLA1-1, CLA1-2, CLA1-3, CLA1-4, CLA1-5, CLA14-1, CLA-14-2, CLA14-3, CLA14-4, CLA14-5, LE-3 and LE-16). Across all discrete lake sediment samples, total PCB residues in L. variegatus tissues ranged from 13.7 µg/kg (1,245 µg/kg-lipid) to 92.7 µg/kg (4,414 µg/kg-lipid). However, this range does not include a value from LE-10 sediments which possessed a higher total PCB concentration of 400 µg/kg for which bioaccumulation was not specifically measured. The theoretical bioaccumulation potential (TBP) model projection (McFarland 1984) using an empirical biota-sediment accumulation factor (BSAF) of 0.72 for Lake Erie sediments offshore of Cleveland (and assuming a 1% lipid content in oligochaetes) estimates that PCBs from the LE-10 sediment sample would bioaccumulate to 180 µg/kg (or 18,000 µg/kg-lipid). This effectively increases the range of PCB bioaccumulation in oligochaetes from these lake sediments to 13.7 to 180 µg/kg (1245 to 18,000 µg/kg-lipid). Total PCB residues in L. variegatus tissues exposed to all of the channel sediments were within the higher end of this range. Mean total PCB residues in L. variegatus tissues exposed to all of the channel sediments was significantly greater relative to sediments at CLA-4 (1,558 µg/kg-lipid) (one-tailed least significant difference

Cleveland Harbor (Upper Cuyahoga River
Channel) Dredged Sediment Evaluation—2016
Page | 25
[LSD] test; α=0.1). Collectively, this information shows that total PCB residues in L. variegatus tissues exposed to the channel and CLA-1 reference sediments is within the high end of the range of benthic bioaccumulation of PCBs from regional Lake Erie sediments offshore of Cleveland. (3) Sediments at all lake areas/sites—This includes all sites regardless of whether they may have been formerly used for dredged sediment discharges. These data represent existing regional background PCB bioaccumulation from Lake Erie sediments offshore of Cleveland. Figure 5 is a plot of combined 2012 and 2014 oligochaete PCB bioaccumulation values for channel sediments, and the 2014 values for CLA-1 reference, CLA-1 and regional lake sediments offshore of Cleveland. It illustrates how the benthic bioaccumulation of PCBs from the channel sediments is comparable to and well within the range of these designated small and large lake areas offshore of Cleveland.
FIGURE 5
NOTE: Black points designate background sites where lake surface sediments are assumed to be influenced from former dredged sediment placement.
1,000
10,000
100,000
1,000,000
Lipi
d-no
rmal
ized
tota
l PCB
con
cent
ratio
sn in
tis
sue
(µg/
kg-li
pid)
DMMU
Bioaccumulation of total PCBs in oligochaetes from harbor and various Lake Erie sediments
CLA-1 reference
RegionalLake Erie
backgroundCLA-1

Cleveland Harbor (Upper Cuyahoga River
Channel) Dredged Sediment Evaluation—2016
Page | 26
Across all discrete lake sediment samples, total PCB residues in L. variegatus and oligochaete tissue ranged from 13.7 µg/kg (1245 µg/kg-lipid) to 5,880 µg/kg (262,583 µg/kg-lipid). This range includes several TBP model-predicted values using empirical BSAFs (and assuming a 1% lipid content in oligochaetes) for sites at which bioaccumulation was not specifically measured (CLA1-5, CLA14-4, LE-2, LE-10, LE-14, LE-16, LE-22, LE-23 and LE-25). Mean lipid-normalized total PCB residues in L. variegatus tissues exposed to DMMU-2a and DMMU-2b sediments (5,259 and 5,269 µg/kg-lipid, respectively) were comparable to the surface area-weighted background mean of 5,188 µg/kg-lipid across L. variegatus and oligochaetes (Figure 4). The mean lipid-normalized total PCB residues in L. variegatus tissues exposed to the DMMU-1 sediments (8,666 µg/kg-lipid) is somewhat higher, but within the range and still comparable to this surface area-weighted mean. The magnitude of difference (MOD) (measured laboratory bioaccumulation from dredged sediments/measured laboratory bioaccumulation from reference area sediments) for the benthic bioaccumulation of PCBs from DMMU-1 and regional lake background sediments is 1.67 and less than a factor of 2. This suggests that such a difference between test and reference sediments observed in the laboratory is not likely to warrant ecological and human health concerns based on the ASTM (2010) recommended minimum detectable difference, and the factor of 2 difference measured between PCB bioaccumulation by L. variegatus in paired laboratory and field-based experiments by Beckingham and Ghosh (2010). These data demonstrate that PCB bioaccumulation risk from the channel sediments is within the range and comparable to that which currently occurs from regional Lake Erie background sediments offshore of Cleveland. Figure 4 also illustrates how the benthic bioaccumulation of PCBs from channel sediments is not substantially different from that which currently occurs from regional Lake Erie sediments offshore of Cleveland. 3.3.3 COCs No COCs were identified in the channel sediments based on data generated by USACE in 2014. 3.4 2015 investigation 3.4.1 Bulk sediment analyses a. Physical characteristics (1) Comparison of core and surface sediment grab samples—Six core samples were co-located with six surface grab samples. The cores sampled intervals consistent with the dredged prism, which was about 2.5 to 3.5 feet at the time of sampling. Consistent with

Cleveland Harbor (Upper Cuyahoga River
Channel) Dredged Sediment Evaluation—2016
Page | 27
the physical characteristics of the surface grab sediment samples, core samples consisted mainly of brown organic rich silt (generally 50 to 60%), with the remainder clays (generally 10 to 20%) and sands (generally 20 to 30%) (Table B13). This shoal material typically overlays light gray clay located below project depth. Within DMMU-1 at the upstream end of the channel, core samples consisted mainly of brown organic rich silt intermixed with comparably more fine sands. (2) Testing—Table B13 presents the results of these analyses. The particle size data across the DMMU-1, DMMU-2a and DMMU-2b discrete samples show that the sediments are comprised of between 64% (CH-3) and 80% (CH-14) clays and silts, with the remainder sands and gravels (on a composite sample basis, 72% to 80% silts and clays in DMMU-1 and DMMU-2b, respectively). Bottom sediments in discrete samples from CLA-1 were predominantly coarse-grain in nature and composed of 54% (CLA1-1) to 79% (CLA1-5) sands/gravels, with the remainder silts and clays (these differ from the 2014 results due to sampling sites differences). Bottom sediments in discrete samples from open-lake area CLA-4 were predominantly coarse-grain in nature and composed of 61% (CLA4-3) to 80% (CLA4-4) sands/gravels, with the remainder silts and clays. b. Chemical testing (1) Inorganic analyses (a) Inorganics—Table B14 presents the results of these analyses. ●TOC—TOC content in discrete samples across DMMU-1, DMMU-2a and DMMU-2b ranged from 0.19% (CH-2) to 2.9% (CH-5). On a composite sample basis, TOC content in the channel sediments ranged from 1.2% (DMMU-1) to 2.0% (DMMU-2a). The DMMU composite sample mean of 1.7% was similar to that in 2014 and higher than the composite sample mean of 1.2% in 2012 (USACE 2013). TOC content in discrete samples of bottom sediments at CLA-1 was generally consistent and ranged from 2.4% (CLA1-5) to 3.9% (CLA1-1). TOC content in discrete samples of bottom sediments at open-lake area CLA-4 was consistent and ranged from 2.8% (CLA4-1, CLA4-2 and CLA4-6) to 3.0% (CLA4-3 and CLA4-4). ●Nitrogen/ammonia—Nitrogen/ammonia concentrations in discrete samples across DMMU-1, DMMU-2a and DMMU-2b ranged from 32 (CH-2) to 380 (CH-14) mg/kg. On a composite sample basis, concentrations in the channel sediments ranged from 93 (DMMU-1) to 250 (DMMU-2b) mg/kg. Ammonia/nitrogen concentrations in discrete samples of bottom sediments at CLA-1 ranged from 210 (CLA1-3) to 420 (CLA1-2).

Cleveland Harbor (Upper Cuyahoga River
Channel) Dredged Sediment Evaluation—2016
Page | 28
Concentrations in discrete samples of bottom sediments at open-lake area CLA-4 ranged from 180 (CLA4-2) to 3,200 (CLA4-1) mg/kg. ●TKN—TKN concentrations in discrete samples across DMMU-1, DMMU-2a and DMMU-2b ranged from 260 (CH-2) to 2,300 (CH-9) mg/kg. On a composite sample basis, concentrations in the channel sediments ranged from 410 (DMMU-1) to 1,800 (DMMU-2a) mg/kg. TKN concentrations in discrete samples of bottom sediments at CLA-1 ranged from 2,500 (CLA1-1) to 5,400 (CLA1-5). Concentrations in discrete samples of bottom sediments at open-lake area CLA-4 ranged from 840 (CLA4-4) to 52,000 (CLA4-3) mg/kg. ●TP—TP concentrations in discrete samples across DMMU-1, DMMU-2a and DMMU-2b ranged from 50 (CH-1) to 250 (CH-15) mg/kg. On a composite sample basis, concentrations in the channel sediments ranged from 170 (DMMU-1) to 220 (DMMU-2a) mg/kg. TP concentrations in discrete samples of bottom sediments at CLA-1 ranged from 290 (CLA1-1) to 450 (CLA1 composite). Concentrations in discrete samples of bottom sediments at open-lake area CLA-4 ranged from 190 (CLA4-4) to 360 (CLA4 composite) mg/kg. ●Cyanide—Cyanide concentrations in discrete samples across DMMU-1, DMMU-2a and DMMU-2b ranged from 0.54 (CH-4) to 1.2 (CH-6) mg/kg. On a composite sample basis, concentrations in the channel sediments ranged from 0.54 (DMMU-2a) to 0.61 (DMMU-2b) mg/kg. Cyanide concentrations in discrete samples of bottom sediments at CLA-1 were all non-detectable (detection limit range 1.6 to 2 mg/kg). Concentrations in discrete samples of bottom sediments at open-lake area CLA-4 were all non-detectable (detection limit range 1.6 to 1.9 mg/kg). ●Oil/grease—Oil/grease concentrations in discrete samples of bottom sediments at CLA-1 ranged from non-detectable (detection limit range 370 to 410 mg/kg) to 1,800 mg/kg (CLA1-5). Concentrations in discrete samples of bottom sediments at open-lake area CLA-4 ranged from non-detectable (detection limit range 350 to 380 mg/kg) to 460 mg/kg (CLA4-4). (b) Metals—Table B15 presents the results of these analyses. The bulk concentration of most metals in discrete sediment samples from DMMU-1, DMMU-2a and DMMU-2b were comparable or lower than those at both CLA-1 and CLA-4. Arsenic was the only notable exception, which ranged in concentration from 6.1 (CH-2) to 21 (CH-9, CH-10 and DMMU-2b composite). Arsenic concentrations in discrete samples of bottom sediments at CLA-1 ranged from 7.5 (CLA1-2) to 13 (CLA1-1, CLA1-3 and CLA1 composite) mg/kg. The somewhat higher concentrations in channel

Cleveland Harbor (Upper Cuyahoga River
Channel) Dredged Sediment Evaluation—2016
Page | 29
sediments are reflective of background concentrations the Lake Erie/Ontario Lake Plain watersheds (sediment reference value [SRV] = 25 mg/kg) (OEPA 2008) and typically not of significant toxicological concern. ●SEM/AVS—Table B16 presents the result of these analyses. AVS is regarded as a key sediment partitioning phase that binds cationic metals (cadmium, copper, lead, nickel, silver and zinc) to form insoluble sulfide complexes, thereby reducing their presence in sediment interstitial water and bioavailability (Di Toro et al. 1992). Methodology from USEPA (2005) was applied to determine whether an excess of SEM relative to AVS (on a molar basis) existed in these samples. Based on that methodology, the ΣSEM/AVS model holds that when the molar concentrations of metals exceeds that of AVS (i.e., the ΣSEM-AVS difference is greater than 0.0 µmol), the solid phase concentrations of metals may not be sequestered by the presence of sulfides in the sediments, and therefore bioavailable with the subsequent potential to cause toxicity to benthic organisms. AVS was not detected in each of the DMMU samples at a detection limit of 0.63 µmol/g. Conservatively assuming that AVS is zero in each of these samples, ΣSEM-AVS values ranged from 0.75 (DMMU-1) to 0.90 µmol/g (DMMU-2a). The composite sediment samples from CLA-1 and CLA-4 yielded ΣSEM-AVS of less than 0 (range CLA1 excess AVS 5.1 µmol/g to CLA4 excess AVS 3.8 µmol/g). For the channel sediments with an excess of SEM, zinc was the major contributor among the six metals. While the ΣSEM/AVS model predicts that no toxicity to benthic organisms in sediments will occur if ΣSEM/AVS ≤0.0, it is not intended to predict whether sediments are toxic if ΣSEM/AVS >0.0. The AVS/SEM ratios across the channel sediments (range 1.19 to 1.43) were all less than 2.0, suggesting that they would not be toxic to benthic organisms if zinc is the main contributor (Burton et al. 2005). Irrespective of this, toxicity is unlikely when ΣSEM-AVS <1.7 (USEPA 2005). ◊ΣSEM-AVS model normalized to organic carbon (OC)—Normalizing ΣSEM-AVS to OC content reduces variability associated with the prediction of sediment toxicity. The excess SEM through OC normalization yielded channel sediment ΣSEM-AVS/foc ranging from 44 to 63 µmol/goc. These values fall below the OC-normalized excess SEM range of 130 µmol/goc to 3,000 µmol/goc in which toxicity to benthic organisms is considered uncertain (toxicity associated with values below 130 µmol/goc is not likely) (USEPA 2005). Given that the excess SEM is mostly attributable to zinc, the ΣSEM-AVS were <1.7 and ΣSEM-AVS/foc <130 µmol/goc, cationic metal contamination in the channel sediments was determined to be protective of benthic organisms. The results of solid phase bioassays on the channel sediments (Paragraph 3.4.2) reinforce this conclusion.

Cleveland Harbor (Upper Cuyahoga River
Channel) Dredged Sediment Evaluation—2016
Page | 30
(2) Organic analyses
(a) PCBs—Tables B17 and B18 summarize the results of these analyses. For the Aroclor analyses (Table B17) total PCB concentrations in the sediment samples were determined by summing detected Aroclor mixtures and valuing non-detectable concentrations at zero. For the congener analyses (Table B18), total PCB concentrations in the sediment samples were determined by summing all congeners, with non-detectable concentrations valued at zero.
●Comparison of PCB concentrations in channel and lake sediments—The average total PCB concentration (based on Aroclors) across all discrete samples in DMMU-1, DMMU-2a and DMMU-2b was 37.6 µg/kg (3,459 µg/kg-TOC) (range 12 to 73 µg/kg or 571 to 12,105 µg/kg-TOC) and less than the average of 107 µg/kg (3,744 µg/kg-TOC) (range non-detectable [at 28 µg/kg] to 110 µg/kg or 875 to 4,583 µg/kg-TOC) across CLA-1 sediments, and comparable to the average of 47 µg/kg (1,634 µg/kg-TOC) (range 42 to 52 µg/kg or 1,400 to 1,857 µg/kg-TOC) across CLA-4 sediments. The average total PCB concentration (based on congeners) across all composite samples in DMMU-1, DMMU-2a and DMMU-2b was 137 µg/kg (7,978 µg/kg-TOC) (range 100 to 157 µg/kg or 7,750 to 8,333 µg/kg-TOC) and somewhat higher than the composite sediment concentration of 131 µg/kg (3,970 µg/kg-TOC) in CLA-1 sediments, and higher that the composite sediment concentration of 90.6 µg/kg (3,124 µg/kg-TOC) in CLA-4 sediments. Collectively, these data show that PCB contamination in the channel sediments is consistent with or higher than that which exists in sediment at CLA-1 and CLA-4. Based on this information, total PCBs were identified as a PCOC in the channel sediments. Nevertheless, PCB contamination in the channel sediments is also within the 220 to 25,000 µg/kg-TOC concentration range of those measured in regional Lake Erie sediments offshore of Cleveland not influenced by former dredged sediment discharges (see Table 3). Collectively, this information demonstrates that PCB contamination in the channel sediments is consistent with regional lake sediments offshore of Cleveland, even when excluding those which may have been influenced by former dredged sediment discharges. Table 4 summarizes the total PCB data across all of the channel and lake area sediment samples:

Cleveland Harbor (Upper Cuyahoga River
Channel) Dredged Sediment Evaluation—2016
Page | 31
TABLE 4
PCB MEASUREMENT
LOCATION/AREA HARBOR LAKE
UPPER RIVER CHANNEL
CLA-1 REFERENCE CLA-4
DISCRETE SAMPLES (Aroclors)
Total PCBs (µg/kg) 12 to 73 28U* to 110 42 to 52
TOC-normalized PCBs (µg/kg-TOC) 571 to 12,105 875 to 4,583 1,400 to 1,857 COMPOSITE SAMPLES (Aroclors)
Total PCBs (µg/kg) 36 to 73 150 41
TOC-normalized PCBs (µg/kg-TOC) 1,800 to 6,083 4,545 1,414 COMPOSITE SAMPLES (congeners)
Total PCBs (µg/kg) 100 to 157 131 90.6
TOC-normalized PCBs (µg/kg-TOC) 7,750 to 8,333 3,970 3,124 *Non-detectable at the specified detection limit.
●Comparison of total PCB concentrations in channel sediments across 2015, 2014 and 2012—Irrespective of the identification of total PCBs as a PCOC, note that the range in TOC-normalized concentrations across the DMMU-1, DMMU-2a and DMMU-2b sediments were within the range of those measured in 2014 (5,100 to 8,471 µg/kg-TOC) and lower than the range of those measured in 2012 (8,407 to 12,625 µg/kg-TOC [USACE 2013]) on a composite sample basis. These data are graphed in Figure 6. The results of benthic bioaccumulation testing for PCBs on the channel and lake area sediments are discussed in Paragraph 3.4.3. (b) Pesticides—Table B19 summarizes the results of these analyses. Expect for dichlorodiphenyltrichloroethane (DDT), dichlorodiphenyldichloroethane (DDD) and dichlorodiphenyldichloroethylene (DDE), all pesticides were non-detectable in the channel and lake area sediments at detection limits ranging from 2 to 250 µg/kg. In the channel sediments, ∑DDT was detected only in discrete DMMU-1 sediment samples ranging from 6.9 to 16 µg/kg. Such concentrations of ∑DDT are typically not of toxicological significance, and were lower or comparable to those measured in the open-lake area sediments where detectable ∑DDT concentrations ranged from 5.1 to 49 µg/kg. In all channel and open-lake area composite sediment samples, ∑DDT was non-detectable. On a TOC-normalized basis, ∑DDT concentrations in discrete DMMU-1 sediment samples ranged from 1,500 to 2,424 µg/kg-TOC. These were within the range or comparable to the ∑DDT concentration range of 131 to 1,750 µg/kg-TOC in the open-

Cleveland Harbor (Upper Cuyahoga River
Channel) Dredged Sediment Evaluation—2016
Page | 32
FIGURE 6
lake area sediments. Even though no pesticides were identified as sediment PCOCs or COCs, benthic bioaccumulation testing for pesticides was nevertheless performed (see paragraph 3.4.4). (c) PAHs—Tables B20 and B21 summarize the results of these analyses. ●PAH concentrations in sediments—Table 5 summarizes total PAH data across all of the channel and lake sediment samples:
0
2000
4000
6000
8000
10000
12000
14000
2012 2014 2015
Tota
l PCB
con
cent
ratio
n (µ
g/kg
-TO
C)
Sample event year
Total PCB concentrations in channel sediments, 2012, 2014 and 2015
DMMU-1DMMU-2aDMMU-2b

Cleveland Harbor (Upper Cuyahoga River
Channel) Dredged Sediment Evaluation—2016
Page | 33
TABLE 5
PAH MEASUREMENT
LOCATION/AREA HARBOR LAKE
UPPER RIVER CHANNEL
CLA-1 REFERENCE* CLA-4
DISCRETE SAMPLES
Total PAHs (µg/kg) 1,008 to 10,007 1,001 to 9,650 796 to 1,045
TOC-normalized PAHs (mg/kg-TOC)
201 to 1,227 31.3 to 402 28.4 to 35.6
COMPOSITE SAMPLES
Total PAHs (µg/kg) 4,133 to 5,649 6,935 1,029
TOC-normalized PAHs (mg/kg-TOC)
230 to 344 210 35.5
*CLA-1 reference sediments (for PAHs) were determined based on lower bulk sediment concentration and no observation of oil in discrete sample (CLA1-1 was excluded as being suspected as influenced from former dredged sediment discharges).
USEPA 16 priority pollutants—Table B20 summarizes the results of these analyses. Total PAH concentrations in the sediment samples were determined by summing the USEPA 16 priority pollutants. The average total PAH concentration across all discrete samples in DMMU-1, DMMU-2a and DMMU-2b was 5,399 µg/kg (397mg/kg-TOC) to 10,007 µg/kg or 201 to 1,227 mg/kg-TOC), and comparable or higher than the averages of 5,409 µg/kg (201 mg/kg-TOC) (range 1,001 to 9,650 µg/kg or 31.3 to 402 mg/kg-TOC) and 945 µg/kg (33 mg/kg-TOC) (range 796 to 1,045 µg/kg or 1,400 to 1,857 mg/kg-TOC) for CLA-1 reference and CLA-4 sediments, respectively. However, the average total PAH concentration across DMMU composite samples of 4,793 µg/kg (285 mg/kg-TOC) was lower or comparable to the composite sample concentration for CLA-1 reference sediments (6,935 µg/kg or 210 mg/kg-TOC). This shows that PAH contamination in the channel sediments is similar or higher in comparison to the open-lake area sediments. PAH pore water analysis and solid phase bioassay data on the channel and lake area sediment samples are discussed below and in Paragraph 3.4.2, respectively.
The PAH data on the channel sediments are consistent with those in 2014 in which concentrations in discrete sediment samples from DMMU-1, DMMU-2a and DMMU-2b ranged from 1,059 to 12,619 µg/kg (composite sample range 4,665 to 7,143 µg/kg), and from 113 to 1,753 mg/kg-TOC (composite sample range 311 to 376 mg/kg-TOC) on a TOC-normalized basis (Table 2). The PAH

Cleveland Harbor (Upper Cuyahoga River
Channel) Dredged Sediment Evaluation—2016
Page | 34
data on bottom sediments at CLA-1 (except for CLA1-5) are consistent with those presented in 2014. The PAH data on CLA-4 sediments are consistent with or somewhat lower than those presented in 2014. The PAH data on the channel sediments are somewhat lower than those presented in USACE (2013a) in which concentrations in discrete sediment samples from DMMU-1, DMMU-2a and DMMU-2b ranged from 842 to 16,336 µg/kg (composite sample range 6,250 to 14,972 µg/kg), and from 183 to 778 mg/kg-TOC (composite sample range 417 to 1,682 mg/kg-TOC) on a TOC-normalized basis. The PAH data on bottom sediments at CLA-1 (except for CLA1-5) are consistent with or somewhat higher than those presented in USACE (2013a). The PAH data on bottom sediments at CLA-4 are consistent with or somewhat lower than those presented in USACE (2013a).
●Concentrations of 34 PAH structures (18 non-alkylated parent compounds and 16 groups of generic alkylated forms) in sediment pore water—Table B21 summarizes sediment pore water concentrations of the 34 PAH structures and associated calculated ∑IWTUFCV using Equation 1. Channel composite sample ∑IWTUFCV were all <0.1, indicating that PAH contamination in the sediments is protective of benthic organisms. Channel discrete sample ∑IWTUFCV ranged from <0.1 (CH-5, CH-7, CH-9 and CH-13) to 1.7 (CH-3). Although an ∑IWTU34 screening value of 1.0 is suggested by USEPA as a screening benchmark for evaluating potential toxicity of PAHs to aquatic organisms, an ∑IWTU34 greater than 1.0 may not result in toxicity due to a number of site-specific factors. In this case, PAH-related toxicity to benthic invertebrates from sediments at CH-3 is not expected because the ∑IWTU34 value of 1.7 is below the chronic toxicity critical body burden for H. azteca which is one of the most sensitive freshwater aquatic organisms to PAHs (USEPA 2003). The ∑IWTU34 screening value of 1.0 is based on the sensitivity of both saltwater and freshwater aquatic species to PAHs. The FCV believed to be protective of both saltwater and freshwater aquatic organisms is 2.24 µmol/g-lipid, while H. azteca has been determined to have a critical body burden (mean acute value for genus) of 13.9 µmol/g-lipid. In addition, data provided in USEPA (2003) have demonstrated that the acute to chronic ratio for H. azteca is near 1. An ∑IWTU34 value specific to H. azteca and protective of other freshwater invertebrates is estimated to be approximately 6. Hawthorne et al. (2007) provides additional empirical evidence that support these benchmark estimates for chronic toxicity to H. azteca (i.e., greater than 85% survival is predicted at body burdens <15 µmol/g-lipid). CLA-1 discrete sample ∑IWTUFCV ranged from <0.1 (CLA1-3 and CLA1-5) to 22.2

Cleveland Harbor (Upper Cuyahoga River
Channel) Dredged Sediment Evaluation—2016
Page | 35
(CLA1-1). This information showed that PAH contamination in sediments from CLA1-2 through CLA1-5, and in the composite sample (∑IWTUFCV = 0.3), were protective of benthic organisms. However, it indicated that PAH contamination in sediments from CLA1-5 are predicted to result in an internal benthic body burden of approximately 50 µgmol/g-lipid and therefore expected to result in chronic toxicity to H. azteca (Hawthorne et al. 2007). The ∑IWTUFCV data on channel sediments were consistent with those sampled in 2014 and 2012 (USACE 2013a). The ∑IWTUFCV data on lake area/site sediments were consistent or different than those sampled in 2014 and 2012; differences among the sampling events were attributable to sediment sampling site and actual sediments sampled. For CLA-4 sediments, the ∑IWTUFCV were consistent in 2012, 2014 and 2015. For the lake area sediments, the ∑IWTUFCV for CLA-1 sediment samples in 2012 was low at 2.8 and found to not be acutely or chronically toxic to H. azteca (USACE 2013a; USACE 2013b). Therefore, the toxicity of sediments sampled from CLA-1 in 2012 was insignificant, while those collected in the composite sample in 2014 were toxic with respect to PAHs. It is evident that very high ∑IWTUFCV for CLA-1 sediments sampled in 2014 is associated with the high values observed for discrete sediment samples CLA1-3 and CLA1-5. Figure 7 graphs the 2012, 2014 and 2015 ∑IWTUFCV data across the channel, lake reference and toxic lake sediments. Collectively, these data also indicate that placement of any of the channel sediments at CLA1-5 (2014 sample location) and CLA1-1 (2015 sample location) within the southeast quadrant of CLA-1 would result in an abatement of acute and chronic toxicity to benthic invertebrates. Based on this information, PAHs were not identified as a PCOC in the channel sediments. 3.4.2 Solid phase bioassays Solid phase bioassays measure the response of sensitive organisms to a mixture of sediment contaminants, through survival and growth endpoints. The amphipod H. azteca is a small freshwater crustacean that inhabits the water column and sediment surface, feeding on detritus. This species is an important food item for bottom feeding and water column fish in the Great Lakes. The midge fly C. dilutus burrows into sediments and are an important food item in the diets of various species of fish and waterfowl. The two species vary in sensitivity to different contaminants; H. azteca is quite sensitive to metals, while C. dilutus tends to be more sensitive to pesticides (USEPA and USACE 1998a).

Cleveland Harbor (Upper Cuyahoga River
Channel) Dredged Sediment Evaluation—2016
Page | 36
FIGURE 7
*Composite sample assumed to be biased by discrete sample CLA1-5 (2014).
0.1 1.7 0.1 0.1 2.8 0.3 0.1 0.1 1.0 0.1 0.1 0.1
403
22.2
280
0
50
100
150
200
250
300
350
400
450
DM
MU
-1 (2
015)
CH-3
(201
5)
DM
MU
-2a
(201
5)
DM
MU
-2b
(201
5)
CLA-
1 (2
012)
CLA-
1 (2
015)
CLA1
-2 (2
015)
CLA1
-3 (2
015)
CLA1
-4 (2
015)
CLA1
-5 (2
015)
CLA-
4 (2
014)
CLA-
4 (2
015)
CLA-
1 (2
014)
*
CLA1
-1 (2
015)
CLA-
14 (2
014)
UPPER RIVERCHANNEL SEDIMENTS
(worst-case, 2012-2015)
LAKE REFERENCE SEDIMENTS PAH-CONTAMINATED
LAKESEDIMENTS
PAH
toxi
c un
its (∑
IWTU
s)
Site/area
Chronic PAH-associated benthic toxicity associated with channel and offshore Lake Erie sediments
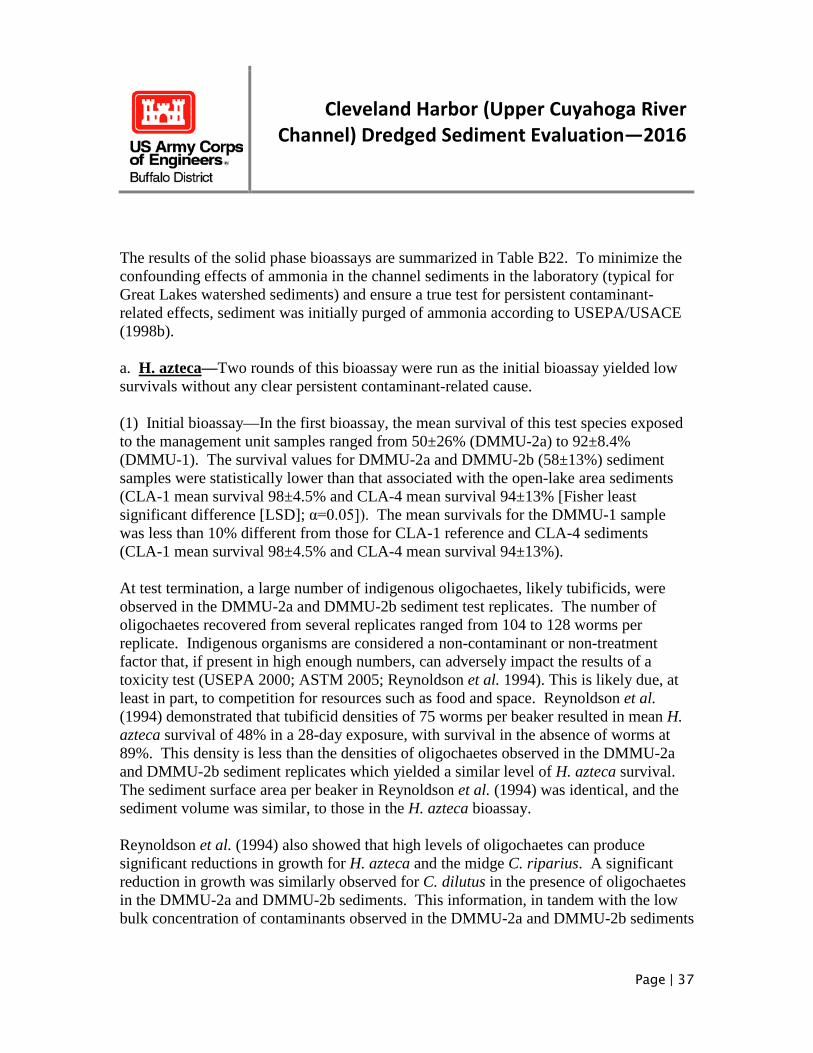
Cleveland Harbor (Upper Cuyahoga River
Channel) Dredged Sediment Evaluation—2016
Page | 37
The results of the solid phase bioassays are summarized in Table B22. To minimize the confounding effects of ammonia in the channel sediments in the laboratory (typical for Great Lakes watershed sediments) and ensure a true test for persistent contaminant-related effects, sediment was initially purged of ammonia according to USEPA/USACE (1998b). a. H. azteca—Two rounds of this bioassay were run as the initial bioassay yielded low survivals without any clear persistent contaminant-related cause. (1) Initial bioassay—In the first bioassay, the mean survival of this test species exposed to the management unit samples ranged from 50±26% (DMMU-2a) to 92±8.4% (DMMU-1). The survival values for DMMU-2a and DMMU-2b (58±13%) sediment samples were statistically lower than that associated with the open-lake area sediments (CLA-1 mean survival 98±4.5% and CLA-4 mean survival 94±13% [Fisher least significant difference [LSD]; α=0.05]). The mean survivals for the DMMU-1 sample was less than 10% different from those for CLA-1 reference and CLA-4 sediments (CLA-1 mean survival 98±4.5% and CLA-4 mean survival 94±13%). At test termination, a large number of indigenous oligochaetes, likely tubificids, were observed in the DMMU-2a and DMMU-2b sediment test replicates. The number of oligochaetes recovered from several replicates ranged from 104 to 128 worms per replicate. Indigenous organisms are considered a non-contaminant or non-treatment factor that, if present in high enough numbers, can adversely impact the results of a toxicity test (USEPA 2000; ASTM 2005; Reynoldson et al. 1994). This is likely due, at least in part, to competition for resources such as food and space. Reynoldson et al. (1994) demonstrated that tubificid densities of 75 worms per beaker resulted in mean H. azteca survival of 48% in a 28-day exposure, with survival in the absence of worms at 89%. This density is less than the densities of oligochaetes observed in the DMMU-2a and DMMU-2b sediment replicates which yielded a similar level of H. azteca survival. The sediment surface area per beaker in Reynoldson et al. (1994) was identical, and the sediment volume was similar, to those in the H. azteca bioassay. Reynoldson et al. (1994) also showed that high levels of oligochaetes can produce significant reductions in growth for H. azteca and the midge C. riparius. A significant reduction in growth was similarly observed for C. dilutus in the presence of oligochaetes in the DMMU-2a and DMMU-2b sediments. This information, in tandem with the low bulk concentration of contaminants observed in the DMMU-2a and DMMU-2b sediments

Cleveland Harbor (Upper Cuyahoga River
Channel) Dredged Sediment Evaluation—2016
Page | 38
and supporting evidence that indigenous oligochaetes could be impacting the toxicity test results, incited a re-test. (2) Follow-up bioassay—Prior to re-running the H. azteca bioassay including CLA-1 reference, CLA-4 and performance control sediments, DMMU-2a and DMMU-2b sediments were sieved to reduce the density of native oligochaetes according to USEPA (2001) guidance. Reynoldson et al. (1994) also recommended sieving sediments prior to testing when large populations of indigenous invertebrates are present, particularly oligochaetes. The number of native oligochaetes was reduced in the DMMU-2a and DMMU-2b sediments by sieving through a 1 mm sieve as one of the recommended methods for removing indigenous organisms prior to toxicity testing when the presence of indigenous organisms is suspected of negatively impacting test organisms (USEPA 2000; USEPA 2001; ASTM 2005). Note that sieving of sediments is generally believed to increase the likelihood that contaminant-related effects would be observed in a toxicity test since sieving can temporarily disrupt the equilibrium of the sediment resulting in increased bioavailability of organics and metals (USEPA 2000). In addition, contaminants are typically associated with the finer grain fraction of sediments (silts, clays, black carbon; Talley et al. 2002) due to the presence of greater surface area for contaminant adsorption; thus sieving and using the smaller fraction for testing increases the percentage of fine-grain sediment that likely contains a higher concentration of contaminants. Therefore, sieving sediments prior to bioassay testing is most likely to increase exposure to contaminants and therefore potentially result in enhanced toxicity. Consequently, the sieved sediment bioassay tests may be considered a more conservative assessment of the toxicological implications of the persistent sediment-associated contaminants. The follow-up bioassay using the sieved DMMU-2a and DMMU-2b sediment samples yielded high H. azteca survivals. Mean survivals of H. azteca exposed to the DMMU sediment samples ranged from 86±11.4% (DMMU-2b) to 92±8.4% (DMMU-2a). These survivals were less than 10% different than those for the open-lake area sediments (CLA-1 mean survival 94±5.5% and CLA-4 mean survival 92±8.4%) (USEPA/USACE 1998a). This bioassay using sieved sediments, along with the observations by Reynoldson et al. (1994) and low levels of contaminants in the sediment samples, provide strong lines of evidence that a native oligochaete worm-related factor was the cause of the reduced H. azteca survival observed in the initial bioassay. It is hypothesized that the results of the initial bioassay reflected competition for resources between H. azteca and native oligochaete worms in the laboratory. Because no persistent contaminated-related cause could be identified for the evidenced toxicity in the DMMU-2 sediments in 2010 and associated abundance of native oligochaete worms in the sediments (Kreitinger et al. 2011), native oligochaete worms (and sediment pore water ammonia) may also have been

Cleveland Harbor (Upper Cuyahoga River
Channel) Dredged Sediment Evaluation—2016
Page | 39
a factor contributing to the low survival of H. azteca (58±8.4%). b. C. dilutus—The mean survival of this test species exposed to the channel composite samples ranged from 88±13% (DMMU-2a and DMMU-2b) to 92±4.5% (DMMU-1), and was not reduced by more than 20% than that associated with the open-lake area sediments (CLA-1 mean survival 92±11% and CLA-4 mean survival 96±8.9%) (USEPA/USACE 1998a). With respect to C. dilutus growth, mean biomass expressed as mean dry weight (MDW) exposed to the channel composite samples ranged from 0.798±0.040 mg (DMMU-2b) to 2.638±0.580 mg (DMMU-1). All values exceeded a MDW of 0.6 mg (USEPA/USACE 1998a). The lower growth observed with the DMMU-2a and DMMU-2b sediments relative to all of the other channel and open-lake area composite samples was likely attributable to resource competition between C. dilutus and native oligochaetes, similar to that encountered in the initial standard 10-day solid phase H. azteca bioassay (USAERDC 2015a) (see Paragraph 3.4.2[a][2]). These solid phase bioassay data did not show any significant, persistent contaminant-related acute or sublethal toxicity associated with the channel sediments, and are similar to those presented in USACE (2013a). Figures 8 and 9 are bar graphs showing the combined 2012 and 2015 results of the standard 10-day H. azteca and C. dilutus survival bioassays, respectively. These two graphs illustrate the consistently low channel sediment toxicity across the two sampling events, and the comparability of the channel sediment toxicity test data to those of the open-lake area sediments. These results indicate that placement of sediments dredged from DMMU-1, DMMU-2a and DMMU-2b at CLA-1 would not result in any persistent contaminant-related, unacceptable adverse impacts.

Cleveland Harbor (Upper Cuyahoga River
Channel) Dredged Sediment Evaluation—2016
Page | 40
FIGURE 8
FIGURE 9
0102030405060708090
100
2012 2015 2012 2015 2012 2015 2012 2015 2012 2015
DMMU-1 DMMU-2a DMMU-2b CLA-1Reference
CLA-4
HARBOR SEDIMENTS LAKE SEDIMENTS
Mea
n su
rviv
al (±
1 st
anda
rd d
evia
tion)
(%)
DMMU or lake area/sample year
Mean survival of H. azteca exposed to channel and various lake sediments
0102030405060708090
100
2012 2015 2012 2015 2012 2015 2012 2015 2012 2015
DMMU-1 DMMU-2a DMMU-2b CLA-1Reference
CLA-4
HARBOR SEDIMENTS LAKE SEDIMENTS
Mea
n su
rviv
al (±
1 st
anda
rd d
evia
tion)
(%)
DMMU or lake area/sample year
Mean survival of C. dilutus exposed to channel and various lake sediments

Cleveland Harbor (Upper Cuyahoga River
Channel) Dredged Sediment Evaluation—2016
Page | 41
3.4.3 PCB bioaccumulation testing a. Results. Total PCB concentrations in tissue samples were determined by summing all congeners with non-detectable concentrations valued at zero. Results of the standard 28-day L. variegatus bioaccumulation testing for PCBs on channel and lake area sediment samples are provided in Table B23 (congener data are in RTI 2015). Table 6 summarizes the benthic bioaccumulation PCB data and corresponding bulk composite sediment sample total PCB data:
TABLE 6
PCB MEASUREMENT
LOCATION/AREA UPPER RIVER CHANNEL LAKE
DMMU-1 DMMU-2a DMMU-2b CLA-1 REFERENCE
CLA-4 OTHER DISCRETE
SITES* TISSUE
Total PCBs (µg/kg) 153 164 181 97 34 13.7 to 92.7
SEDIMENT
Total PCBs (µg/kg) 100 155 157 131 90.6 9.36 to 400
TOC-normalized PCBs (µg/kg-TOC)
8,333 7,750 7,850 3,970 3,124 248 to 25,000
*From Table 4; excludes sites where PCB contamination was suspected to be influenced from past dredged sediment discharges.
Due to data quality issues, lipid content data generated from the laboratory experiments could not be used for the purposes of quantifying bioaccumulation. However, lipid content data were generated on the test control sample were generated by USAERDC and are summarized in Table 7 (USAERDC 2016):
TABLE 7
CONTROL SAMPLE REPLICATE
SUBREPLICATE PERCENT LIPID
A A1 3.1 A2 1.8 A3 2.6
B B1 3.0 B2 3.3 B3 3.1
MEAN 2.8
An average lipid content of 2.8% is a higher lipid content than what is typically observed for L. variegatus cultured in the laboratory setting. As with the 2014 data (see paragraph

Cleveland Harbor (Upper Cuyahoga River
Channel) Dredged Sediment Evaluation—2016
Page | 42
3.3.2[a]), a higher lipid content would explain the higher PCB residues measured in the 2015 L. variegatus bioaccumulation experiments. The observed higher PCB tissue residues in 2015 cannot be attributed to any increase in PCB contamination as TOC-normalized concentrations of total PCBs in the channel composite samples were similar to or lower than those measured in 2012 (mean 10,251 µg/kg-TOC; range 8,407 to 12,625 µg/kg-TOC [USACE 2013a]) and 2014 (mean 6,410 µg/kg-TOC; range 5,100 to 8,471 µg/kg-TOC [Table 3]). b. Comparisons to Lake Erie sediments at open-lake placement area and other areas/sites in Lake Erie (1) CLA-1 and regional background sediments (a) Channel sediments vs. CLA-1 and regional background sediments, 2015 data—On a sole concentration (i.e., not lipid-normalized) basis, total PCB residues in L. variegatus tissues exposed to all of the channel sediments (range 153 to 181 µg/kg) were statistically higher than those associated with the CLA-1 reference sediments (97.0 µg/kg) (Fisher’s least significant difference [LSD] method one-tailed test; α=0.05). Relative to USACE (2013a), note that the higher bioaccumulation of PCBs from the DMMU sediments was greater than that measured from CLA-1 sediments is a result of a less contaminated composite sample from CLA-1, and not from more contaminated DMMU sediments. Nevertheless, the respective MODs of 1.6, 1.7 and 1.9 for the DMMU-1, DMMU-2a and DMMU-2b sediments relative to CLA-1 reference sediments were all less than a factor of 2. This suggests that such a difference between test and reference sediments observed in the laboratory is not likely to warrant ecological and human health concerns based on the ASTM (2010) recommended minimum detectable difference, and the factor of 2 difference measured between PCB bioaccumulation by L. variegatus in paired laboratory and field-based experiments by Beckingham and Ghosh (2010). Therefore, placement of the channel sediments at CLA-1 meets the CWA Section 404(b)(1) Guideline and would not result in any ecologically meaningful increase in bioaccumulation of PCBs at the placement area. Figure 10 is a graph of the MODs for the bioaccumulation of PCBs from channel sediments relative to CLA-1 reference sediments based on the 2012, 2014 and 2015 data sets, illustrating that the MOD is consistently less than a factor of 2 (average MOD=1.2). This information shows that while the benthic laboratory bioaccumulation of PCBs across years may vary from both channel and lake sediments, placement of the channel sediments at CLA-1 would not result in any ecologically meaningful increase in PCB bioaccumulation (note that the 2015 MODs were higher than those from 2012 and 2014 due to less contaminated CLA-1 reference sediments and not more contaminated channel sediments; 2015 MODs relative

Cleveland Harbor (Upper Cuyahoga River
Channel) Dredged Sediment Evaluation—2016
Page | 43
FIGURE 10
to grouped CLA-1 reference sediments from 2012, 2014 and 2015 [average total PCB tissue residue 115 µ/kg] ranged from 1.3 to 1.6). While the lipid data on the bioaccumulation experiments were not used in this case, lipid-normalized PCB bioaccumulation appraisals can nevertheless be made using the 2.8% mean value generated on the laboratory test control sample (Table 7). This yields estimated lipid-normalized total PCBs concentrations for the DMMU-1, DMMU-2a, DMMU-2b and CLA-1 sediments on the order of 5,464, 5,843, 6,472 and 3,466 µg/kg-lipid, respectively. This enables a general comparison of the 2012, 2014 and 2015 laboratory PCB bioaccumulation data using lipid-normalized values. The average across the DMMU samples of 5,926 µg/kg-lipid based on estimated values is quite similar to the
1.7
1.0 1.1
0.8
0.5 0.5
1.6 1.71.9
0
0.5
1
1.5
2
2.5
3
Tota
l PCB
tiss
sue
resi
due
MO
D
Dredged material management unit
Magnitude of difference (MOD) in laboratory L. variegatus PCB bioaccumulation from channel sediments relative to CLA-1
reference sediments

Cleveland Harbor (Upper Cuyahoga River
Channel) Dredged Sediment Evaluation—2016
Page | 44
average of 5,623 µg/kg-lipid across laboratory PCB bioaccumulation measurements from 2012 (USACE 2013a) and 2014 (Table 3). This average is also comparable to mean oligochaete bioaccumulation of total PCBs from regional Lake Erie sediments offshore of Cleveland (surface area-weighted), as well as the 2014 laboratory PCB bioaccumulation from CLA-1 reference sediments (Figure 4). Similar to the conclusions in paragraph 3.3.2(b)(1)(a), this suggests that the placement of channel sediments at CLA-1 would not result in any significant increase in benthic bioaccumulation of PCBs. Further, this information also indicates that placement of any of the channel sediments at CLA1-5 within the southeast corner of CLA-1 would result in an estimated reduction in the benthic bioaccumulation of PCBs from 55,015 to about 6,000 µg/kg-lipid. (b) Channel sediments vs. CLA-1 reference sediments, grouped 2012, 2014 and 2015 data—On a sole concentration basis, total PCB residues in L. variegatus tissues exposed to all of the channel sediments were statistically higher than those associated with the grouped CLA-1 reference sediments (109 µg/kg) (Fisher’s LSD method one-tailed test; α=0.05). Nevertheless, the respective MODs of 1.4, 1.5 and 1.7 for the DMMU-1, DMMU-2a and DMMU-2b sediments relative to CLA-1 reference sediments were consistently all less than a factor of 2. The estimated lipid-normalized values indicate that differences between laboratory PCB bioaccumulation between the channel sediments relative to the grouped CLA-1 reference sediments (estimated 4,472 µg/kg-lipid) would be less than those portrayed through sole total PCB concentration. This information suggests that no ecologically meaningful increase in PCB bioaccumulation would occur from placement of the channel sediments over CLA-1 reference sediments. (2) Sediments at other lake areas/sites not formally used for dredged sediment discharges—This includes all 2014 areas/sites excluding those assumed to be formally used for dredged sediment discharges over four decades ago. Across all discrete lake sediment samples, total PCB residues in L. variegatus tissues ranged from 13.7 µg/kg to 180 µg/kg (or 18,000 µg/kg-lipid). On a sole total PCB concentration basis, residues in L. variegatus tissues exposed to all of the channel sediments were at the high end of this range. Mean total PCB residues in L. variegatus tissues exposed to all of the channel sediments was significantly greater relative to sediments at CLA-4 (34.0 µg/kg) (Fisher’s LSD method one-tailed test; α=0.05). Collectively, this information shows that total PCB residues in L. variegatus tissues exposed to the channel and CLA-1 reference sediments is within the high end of the range of benthic bioaccumulation of PCBs from regional Lake Erie sediments offshore of Cleveland. This comparison does not consider laboratory lipid content data which would serve to lower the actual range of PCB bioaccumulation from the channel sediments (e.g., to on the order of 6,000 µg/kg-lipid).

Cleveland Harbor (Upper Cuyahoga River
Channel) Dredged Sediment Evaluation—2016
Page | 45
(3) Sediments at all lake areas/sites—This includes all sites regardless of whether they may have been formerly used for dredged sediment discharges and therefore represent existing regional background PCB bioaccumulation from Lake Erie sediments offshore of Cleveland. It is evident that like the measured 2014 data, estimated laboratory bioaccumulation of PCBs from all of the channel sediments (range 5,464 to 6,472 µg/kg-lipid) is comparable to and well within the range of PCB residues L. variegatus and oligochaete tissues associated with the designated small and large lake areas offshore of Cleveland illustrated through Figure 5 (range 13.7 µg/kg [1245 µg/kg-lipid] to 5,880 µg/kg [262,583 µg/kg-lipid] (see paragraph 3.3.2[b][3]). This estimated mean lipid-normalized total PCB residues in L. variegatus tissues exposed to all three DMMU sediments were also comparable to the surface area-weighted background mean of 5,188 µg/kg-lipid across L. variegatus and oligochaetes (Figure 4). Like the 2014 data, this information indicates that PCB bioaccumulation risk from the channel sediments is within the range and comparable to that which currently occurs from regional Lake Erie background sediments offshore of Cleveland. 3.4.4 Pesticides bioaccumulation testing a. Results. Results of the standard 28-day L. variegatus bioaccumulation testing for pesticides on channel and lake area sediment samples are provided in Table B24. DDE was detected in all the tissue samples associated all DMMU and CLA-1 sediments, but not CLA-4 sediments (at a higher detection limit). The bioaccumulation data indicated a cluster of pesticide detections (alpha-chlordane, alpha-BHC, methoxylchlor and dieldrin) in the tissue samples associated with DMMU-2a and DMMU-2b sediments, all of which required analytical qualifications. There is a substantial amount of uncertainty associated with these tissue values. First, none of these pesticides were identified as sediment COCs because they were all non-detectable in corresponding sediment samples (paragraph 3.4.1[b][2][b]; USACE 2007; USACE 2013a), also suggesting that they should not appreciably be bioaccumulating in tissue. Second, none of these pesticides were detected in L. variegatus tissues generated from previous bioaccumulation testing efforts on these channel sediments (Kreitinger et al. 2011; USACE 2013a). Third, most of the values reported that were significantly above CLA-1 sediment detection limits were qualified as “P” indicating that the relative percent difference (RPD) in concentrations yielded between the primary and secondary gas chromatography (GC) column exceeded 40%. The values reported in Table B24 represent the maximum concentrations yielded from the primary column and do not consider the lower value generated from the secondary column (RTI 2014). Table 8 below summarizes this information to illustrate these differences:

Cleveland Harbor (Upper Cuyahoga River
Channel) Dredged Sediment Evaluation—2016
Page | 46
TABLE 8
DMMU PESTICIDE REPLICATE REPORTED VALUE (µg/kg)
SECONDARY GC COLUMN VALUE
(µg/kg)
RPD (%)
DMMU-2a Alpha-Chlordane E 17 6.7 157 Methoxylchlor C 29 3.2 796
D 7.5 3 150 E 8.8 3.2 177
Dieldrin C 9.9 2.7 273 D 6.9 4.4 55 E 15 4.4 227
DMMU-2b Methoxychlor E 42 3.8 985 Dieldrin A 6.7 2.9 128
B 8.3 3.9 111 C 7.7 2.6 190 D 9.4 3.3 185 E 13 3.8 236
The data in Table 8 make it evident that use of the primary GC column data may have biased the actual tissue residues notably high. Consideration of the substantial RPDs and secondary column values in tandem with the remaining replicate values in this case suggests that actual tissue residues may approach levels of detection. This would be consistent with the corresponding sediment concentration data as well as historic data on these channel sediments. Given these data uncertainties with the fact that none of these pesticides detected in tissue were detected in the sediment samples or identified as sediment COCs, bioaccumulation was not evaluated (USEPA/USACE 1998b). Table 9 summarizes the benthic bioaccumulation and corresponding bulk composite sediment sample data for DDE:
TABLE 9
DDE MEASUREMENT
LOCATION/AREA UPPER RIVER CHANNEL LAKE
DMMU-1 DMMU-2a DMMU-2b CLA-1 REFERENCE
CLA-4
TISSUE
DDE (µg/kg) 8.4 6.7 7.3 6.4 3.8U*
SEDIMENT
DDE (µg/kg) 4.8U 5.8U 6U 5.5 12U
TOC-normalized DDE (µg/kg-TOC)
- - - 167 -
*Not detectable at the detection limit.

Cleveland Harbor (Upper Cuyahoga River
Channel) Dredged Sediment Evaluation—2016
Page | 47
b. Comparisons to Lake Erie sediments at open-lake area CLA-1 and CLA-4 On a sole concentration basis, DDE residues in L. variegatus tissues exposed to the DMMU-1 (8.4 µg/kg) and DMMU-2b sediments (7.3 µg/kg) were statistically higher than those associated with the CLA-1 reference sediments (6.4 µg/kg) (Fisher’s LSD method one-tailed test; α=0.05). However, the respective MODs of 1.3 and 1.1 for the DMMU-1 and DMMU-2b sediments relative to CLA-1 reference sediments were all less than a factor of 2. This suggests that such a difference between test and reference sediments observed in the laboratory is not likely to warrant ecological and human health concerns based on the ASTM (2010) recommended minimum detectable difference. On a sole concentration basis, DDE residues in L. variegatus tissues exposed to the DMMU-2b sediments (6.7 µg/kg) were not statistically different than those associated with the CLA-1 reference sediments (Fisher’s LSD method one-tailed test; α=0.05). Statistical comparisons to L. variegatus tissue residues associated with the CLA-4 sediments were not made because DDE concentrations were all less than a non-detectable concentration of 12 µg/kg. This information shows that placement of the channel sediments at CLA-1 meets the CWA Section 404(b)(1) Guideline and would not result in any ecologically meaningful increase in bioaccumulation of DDE at the placement area. 3.4.5 Elutriate testing a. SET (1) Metals and other inorganics—Tables B25 and B26 summarize the results of this testing for metals and other inorganics, respectively. The elutriate data show low to moderate releases of metals and other inorganics from the channel sediments. Dissolved ammonia-N concentrations across the DMMU sediment elutriates ranged from 7.1 (DMMU-1) to 19 (DMMU-2b) mg/L and exceeded the acute water quality criterion of 4.5 mg/L. Therefore, ammonia was identified as a water column PCOC and would require dilution and dispersion in the water column during dredged sediment discharge operations. With respect to the copper “R” data qualifier for the channel composite sediment samples, separate SET data showed releases of copper (total basis) from the DMMU-2a and DMMU-2b sediments at 0.009 and 0.012 mg/L, respectively (USAERDC 2015a). (a) Ammonia-N—The average dissolved ammonia level in sediment elutriate across DMMU sediments samples was 11.1 mg/L (each sample result was greater than the Ohio outside mixing zone maximum [OMZM] water quality criteria (WQC) for the protection of aquatic life of 4.5 µg/L at a pH of 8.1).

Cleveland Harbor (Upper Cuyahoga River
Channel) Dredged Sediment Evaluation—2016
Page | 48
The Short-Term (ST) FATE simulation model was employed to predict and evaluate the release of ammonia to the water column during discharge of dredged sediment in the open-water (USAERDC 2015b). Modeling assumptions include (1) clamshell bucket (mechanical) dredging with discharge of the dredged sediment via scow; (2) dredged sediment with a solids content of 45% (about 10% less than in-situ material due to water entrained during dredging); (3) use of a 1500 cubic yard (CY) scow with a bin that is 120 x 30 x 12 feet; (4) dredged sediment placement is a single discharge from a slowly moving vessel over a 40-second period; (5) use of a single rectangular two-square mile open-lake placement area in a west-to-east direction with an average water depth of 60 feet; (6) a uniform water column density of 0.999; (7) five depth-averaged current velocities (0.33, 0.66, 0.98, 1.31 and 1.64 feet per second [fps]); (8) dredged sediment was free of clumps in DMMU-1, but was predicted to have 26% clumps by volume in DMMU-2a and 38% clumps by volume in DMMU-2b; and (9) volumetrically, dredged sediment in DMMU-1 was 61% water, 0% clumps, 31% sand, 5% silt and 3% clay, the dredged sediment in DMMU-2a was 55% water, 26% clumps, 4% sand, 10% silt and 5% clay, and the dredged sediment in DMMU-2b was 47% water, 38% clumps, 2% sand, 9% silt and 4% clay; and (10) all fractions except clumps are stripped in the water column with the silt/clay fractions being cohesive. The results of the STFATE model runs are presented by USAERDC (2015b). Assuming a worst-case ammonia-N release of 19 mg/L and LC50 of 68% associated with the dredged sediment discharge and lake water background ammonia concentration of 0.1 mg/L, the STFATE model run indicated that the effluent would achieve the Ohio OMZM WQC of 4.5 µg/L within 100 feet of the point of discharge within one minute. Therefore, the WQS would be met well within the boundary of the open-lake placement area. The released and rapidly diluted concentrations of ammonia would represent insignificant risk to fish. Fairchild et al. (2005) exposed several fish species to ammonia in the laboratory over a chronic 28-day duration. The most sensitive fish species was P. promelas exposed as 4-day olds. For this species, they reported a no observed effect concentration (NOEC), lowest observed effect concentration (LOEC) and chronic value (ChV; the geometric mean of the chronic NOEC and LOEC) of 0.31, 0.60 and 0.43 mg/L unionized ammonia (NH3), respectively. At 25°C and the reported pH of 8.34, this ChV equates to a total ammonia concentration of approximately 6.3 mg/L. The ChV is considered a protective value (Adams and Rowland 2002) and is very conservative in terms of evaluating acute exposures associated with the discharge of dredged sediments from a scow. Fairchild et al. (2005) also reported no P. promelas mortality after a shorter seven day exposure period to 0.31 mg/L NH3 which translates to 3.7 mg/L total ammonia at 25°C. Therefore, after immediate mixing in the water column (see next paragraph),

Cleveland Harbor (Upper Cuyahoga River
Channel) Dredged Sediment Evaluation—2016
Page | 49
ammonia released from these sediments would not be of any significant concern with respect to fish toxicity. In summary, ample water column for ammonia dilution and dispersion is available at CLA-1. Based on this information, ammonia was eliminated as a water column PCOC. (3) PCBs—Table B27 summarizes the results of this testing. Dissolved Aroclors were not detected in any of the DMMU sediment elutriates at detection limits ranging from 0.04 to 0.11 µg/L. Such concentrations are well below those which would be expected to cause any acute toxicity. (4) Pesticides—Table B28 summarizes the results of this testing. With the exceptions of alpha endosulfan and DDE, dissolved pesticides were not detected in any of the DMMU sediment elutriates at detection limits ranging from 0.004 to 0.11 µg/L. Alpha endosulfan and DDE were measured at 0.009 and 0.024 µg/L in the DMMU-2b sediment elutriate. Such concentrations are well below those which would be expected to cause any acute toxicity. (5) PAHs—Table B29 summarizes the results of this testing. Except for fluoranthene, dissolved PAHs were not detected in any of the DMMU sediment elutriates at a detection limit of 0.16 µg/L. Fluoranthene was measured in all three sediment elutriates at 0.19 µg/L. Such concentration are well below those which would be expected to cause any acute toxicity. b. Water column bioassays Water column bioassays assess the potential toxicity of sediment associated contaminants to sensitive organisms in the water column. These tests provide information on the toxicity of contaminants not included in WQSs and indicate possible interactive effects (additive, synergistic or antagonistic) of multiple contaminants. Water column bioassays use elutriate preparations prepared by mixing sediment and water into a slurry. The slurry is allowed to settle and the supernatant decanted. The supernatant is then centrifuged to remove suspended particles. The supernatant is the elutriate, which is used as the test solution for the bioassays. The two organisms used, C. dubia and P. promelas, are common to the Great Lakes. The water flea C. dubia is an important food item for small and young fish and the minnow P. Promelas is a forage food item for larger fish. The results of the water column bioassays are summarized in Table B30. (1) C. dubia—Mean survival associated with the lake site water (96±9%) was not

Cleveland Harbor (Upper Cuyahoga River
Channel) Dredged Sediment Evaluation—2016
Page | 50
statistically different than the laboratory control (100%). The mean survival of this test species exposed to undiluted (100%) elutriate ranged from 64±33% (DMMU-2a) to 100% (DMMU-2b). Relative to the site water, the 100% DMMU-2a sediment elutriate showed a statistically lower mean survival. No other sediment elutriates showed statistically significant differences in mean survival relative to lake site water. The DMMU-2a bioassay data yielded a no observed effect concentration (NOEC) and LC50 of 50% and >100%, respectively. These bioassay data indicated acute toxicity associated with the undiluted DMMU-2a sediment elutriate. Bioassay data on the remaining sediment elutriates showed insignificant acute toxicity. (2) P. promelas—Mean survival associated with the lake site water (100%) was not statistically different than the laboratory control (98±4%). The mean survival of this test species exposed to undiluted elutriate ranged from 22±44% (DMMU-2a) and 22±26% (DMMU-2b), to 80±23% (DMMU-1). Relative to lake site water, the 100% DMMU-2a and DMMU-2b sediment elutriates showed a statistically lower mean survival. The DMMU-1 sediment elutriate did not show statistically significant differences in mean survival relative to lake site water. The DMMU-2a and DMMU-2b bioassay data yielded NOECs and LC50 values of 50% and 68%, and 50% and 75%, respectively. These bioassay data indicated acute toxicity associated with the undiluted DMMU-2a and DMMU-2b sediment elutriates. Bioassay data on the DMMU-1 sediment elutriate showed insignificant acute toxicity. Data generated from the water column bioassays strongly suggest that the significant toxicity observed for the undiluted DMMU-1, DMMU-2a and DMMU-2b sediment elutriates was attributable to ammonia. First, unionized ammonia (usually the form most responsible for causing toxicity) concentrations in the DMMU-2a and DMMU-2b sediment elutriates were above specific toxicity reference values reported in the literature. Unionized ammonia concentrations were 0.89, 0.94 and 1.38 mg/L for the DMMU-1, DMMU-2a and DMMU-2b sediment elutriates, all of which approached or exceeded LC50 of 0.56 to 0.94 g/L for P. promelas (Nimmo et al. 1989). The unionized ammonia concentrations in the three elutriates also approached or exceeded an LC50 of 1.18 mg/L for C. dubia (Andersen and Buckley 1998). In addition, there were strong correlations between elutriate unionized ammonia concentrations and survivals for both test species (P. promelas r=0.94, P<0.001; C. dubia r=0.92, P<0.001). Finally, P. promelas typically exhibits a greater sensitivity to ammonia relative to C. dubia (relative to fish, C. dubia [and other invertebrates] is typically more sensitive to most contaminants, with ammonia as an exception). A TIE/TRE was performed to determine whether contaminants other than ammonia may have contributed to the significant toxicity observed in the DMMU-2a and DMMU-2b

Cleveland Harbor (Upper Cuyahoga River
Channel) Dredged Sediment Evaluation—2016
Page | 51
sediment elutriates. TIE/TRE treatments on the undiluted elutriates included new bioassays using freshly prepared unpurged sediment, and bioassays employing zeolite column manipulation using unpurged sediment elutriate, two pH (6.5 and 7.2) manipulations for unpurged sediment elutriate, ethylenediaminetetraacetic acid (EDTA) metal chelation manipulation using purged sediment elutriate and C18 column treatment using purged sediment elutriate. As with the first round of tests, high P. promelas mortality (100%) was yielded from the undiluted DMMU-2a and DMMU-2b elutriates. In contrast to the first round of tests, C. dubia survival in the DMMU-2b elutriate was higher (88±18%) but lower for DMMU-2b sediment elutriate (20±14%) (likely due to a comparable increase in unionized ammonia concentration [2.10 mg/L]). For both elutriates, the zeolite stripping treatment removed toxicity (range of survival across both species 93±6 to 100%), suggesting that ammonia was the cause of the toxicity observed in the undiluted sediment elutriates (and that most metals and organic contaminants were not a contributor to the observed toxicity). Since zeolite can also bind some metals, the additional elutriate manipulations were designed to further evaluate potential metal-related toxicity. Those treatments were inconclusive due to either the confounding effects of high biological oxygen (BOD), low dissolved oxygen concentrations and unstable pH caused by the need to aerate elutriate waters due to biological oxygen demand (BOD) (pH treatments), or the ineffectiveness of purging to substantially lower ammonia sediment pore water concentrations, again due to BOD (EDTA and C18 column treatments). Nevertheless, SET data on the DMMU-2a and DMMU-2b sediments indicate that dissolved metal concentrations (Table 23) were protective of aquatic life. Collectively, the initial bioassay, TIE/TRE and SET chemistry data provide strong lines of evidence that ammonia was the cause of toxicity in the undiluted DMMU-2a and DMMU-2b sediment elutriates. Since ammonia was identified as the cause of the sediment elutriate toxicity, an application factor of 0.1 was applied to the LC50 data to compute limited permissible concentrations (LPCs) (as opposed to using an application factor of 0.01 if the toxicity were a result of toxicants other than ammonia). An application factor of 0.1 is appropriate for protection of P. promelas (Kennedy et al. 2015). Assuming a LPCs of 10, 6.8 and 7.5% for the dredged sediments from DMMU-1, DMMU-2a and DMMU-2b, respectively, application of the STFATE model indicated that the effluent would achieve the LPCs during the first three minutes after discharge and within 300 feet of the discharge (USAERDC 2015b). Use of an application factor of 0.01 for the dredged sediments from DMMU-1, DMMU-2a and DMMU-2b would yield LPCs of 1, 0.68 and 0.75%, respectively. Application of the STFATE model to these reduced LPCs indicated that the effluent would achieve the LPCs during the first 25 minutes after discharge and within 2,500 feet of the discharge (well within the boundaries of the placement area) for the entire range of likely currents at the site (USAERDC 2015b).

Cleveland Harbor (Upper Cuyahoga River
Channel) Dredged Sediment Evaluation—2016
Page | 52
This evaluation of channel sediment elutriate data is consistent with that presented in USACE (2013a). The SET and water column bioassay data, and modeling show that the release of contaminants from the dredged sediment to the water column during open-water placement would not result in any contaminant-related unacceptable, adverse impacts to the aquatic ecosystem. They also indicate compliance with applicable State WQSs after consideration of dilution and dispersion. 3.4.6 COCs PCBs were identified as PCOCs in the channel sediments. Ammonia-N was identified as a water column PCOC. Further evaluation eliminated these PCOCs. No COCs were identified in the channel sediments based on data generated by data generated by USACE in 2015. 3.5 OEPA investigations 3.5.1 General This section of the dredged sediment evaluation includes a review and evaluation of data generated by the OEPA on Upper Cuyahoga River and Cleveland offshore Lake Erie sediments across nine sampling/testing events accomplished in 2013, 2014 and 2015. All data generated by OEPA across these events have been considered, and appropriate data have been integrated into the evaluation and will be integrated into the CWA Section 404(b)(1) Evaluation. Most of the information on these events was provided to USACE in OEPA letter dated September 30, 2015 (OEPA 2015a). Additional information on these events was requested from OEPA in a USACE e-mail dated December 14, 2015 and provided in an e-mail dated January 4, 2016. Further information on these events was requested from OEPA in a USACE e-mail dated January 14, 2016 and provided in an e-mail dated January 15, 2016. Review of this collective information provided by OEPA demonstrated considerable substantive data quality control and technical issues. The three overarching issues are summarized as follows: a. Many of the sediment samples across the sampling events were collected from outside the Upper Cuyahoga River Channel dredging prism. In general, these samples were either collected from outside channel boundaries, in areas of the authorized channel officially “not maintained” (i.e., in DMMU-1), below dredging elevation or on channel side slopes. Data on these samples could not be included in the evaluation as they are not

Cleveland Harbor (Upper Cuyahoga River
Channel) Dredged Sediment Evaluation—2016
Page | 53
representative of the dredged sediments. It is further noted that the OEPA sites appeared to target the boundaries of the channel (such as near outfalls) rather than the shoals that are actually dredged within the Federal navigation channel. Regardless of sampling site, contaminant concentration data on all sites located within the dredging prism were integrated into the evaluation. b. Sediment sampling did not follow the appropriate protocols prescribed in formal guidance (USEPA/USACE 1998a, 1998b). For example, DMMUs were not utilized (the data generated by OEPA were placed into the three USACE designated DMMUs to better enable interpretation) and DMMU composite samples were not created from discrete samples collected from each individual DMMU. Also, open-lake reference area sediments were not collected during each individual sampling event. c. The solid phase bioassays (acute toxicity and PCB bioaccumulation tests) did not follow appropriate laboratory methodologies and failed to yield useable data. It is also important to note that the sampling/testing efforts accomplished by OEPA did not involve the performance of a SET to the Upper Cuyahoga River sediment samples. As prescribed in Section 5.1 of the ITM (USEPA/USACE 1998b), this is the test directed at evaluating compliance of any discharge of dredged sediment at a specified site with respect to applicable state WQSs. The remainder of this section addresses each individual OEPA sampling/testing event. 3.5.2 October 2013 event, Upper Cuyahoga River Channel—This effort involved the collection of discrete surface grab sediment samples from the Upper Cuyahoga River, with subsequent bulk physical and chemical analyses. Within the framework of the DMMUs, three discrete sediment samples were from DMMU-1, DMMU-2a and DMMU-2b. A total of nine discrete samples were subjected to testing. In addition, three discrete samples were composited to form three different composited samples. The sediment sampling sites are shown in Figure A6. No sediment samples were collected from any open-lake reference area for direct comparison purposes. Because of this, open-lake reference sediment contaminant concentration ranges were developed for comparison purposes and are summarized in Table B31. Chemical analyses included the nutrients nitrogen-ammonia and TP, TOC, metals, PCBs, pesticides, PAHs, volatile organic compounds (VOCs) and semi-volatile organic compounds (SVOCs). More than half of the discrete sediment samples were collected from outside the channel dredging prism, including 200013, F01A21, F01W50, F01S08 and 302580. Because these samples were not representative of the sediments that are maintenance dredged

Cleveland Harbor (Upper Cuyahoga River
Channel) Dredged Sediment Evaluation—2016
Page | 54
from the Upper Cuyahoga River Channel, the associated data (and data on the related composite samples) were not considered in the evaluation. Data on the remaining four discrete samples (200016, 302581, 302578 and F01A41) were included in the evaluation. Samples generally consisted of gray clays and silts. Evaluation of these sediment data is summarized as follows: a. Physical characteristics. Table B32 summarizes the results of the sediment grain size analyses. Each composite sediment sample subjected to grain size analysis was composed of discrete samples collected from outside the channel dredging prism. b. Chemical testing (1) Inorganic analyses (a) Inorganics—Table B33 summarizes the results of the nitrogen-ammonia, TP and TOC analyses. The upper range of TP concentrations was 1,350 mg/kg, which is comparable to open-lake reference concentrations. (b) Metals—Table B34 summarizes the results of these analyses. Copper concentrations in samples 200016 and 302578 were both 83.3 mg/kg, which exceeded the maximum open-lake reference sediment concentration. Such levels of copper in sediment are not of significant toxicological concern. Similar concentrations measured in USACE (2013a) did not result in any significant acute toxicity to H. azteca. The associated composite sample concentrations (including various discrete samples outside the dredging prism) ranged from 46.9 to 66.4 mg/kg, and were below the maximum open-lake reference sediment concentration. (2) Organic analyses
(a) PCBs—Table B35 summarizes the results of these analyses. Total PCB concentrations in the sediment samples were determined by summing all detected Aroclor mixtures. The total PCB concentration range of 106 to 244 µg/kg (3,029 to 9,365 µg/kg-TOC) was within the open-lake reference sediment concentration range. These channel sediment PCB data are consistent with those presented in USACE (2013a) and USACE (2015a) (as well as in this evaluation). Although most of the 302809 composite sample was collected from outside the dredging prism, the total PCB concentration of 2,419 µg/kg is suspect since the contributing discrete samples show total PCBs concentrations ranging from 120 to 215 µg/kg. In addition, most of the total PCB concentration is attributable to Aroclor 1254, a mixture that was not detected in any of the contributing discrete samples and has not been detected in Upper River Channel

Cleveland Harbor (Upper Cuyahoga River
Channel) Dredged Sediment Evaluation—2016
Page | 55
sediments. (b) Pesticides—Table B36 summarizes the results of these analyses. All
pesticide concentration were within the open-lake reference sediment concentration range.
(c) PAHs—Table B37 summarizes the results of these analyses. Total PAH concentrations in the sediment samples were determined by summing the 16 USEPA priority pollutant compounds. All total PAH concentrations were within the open-lake reference sediment concentration range. (d) VOCs—Table B38 summarizes the results of these analyses. Very few VOCs were detected. Acetone, a common laboratory contaminant, was measured in samples 302578 and F01A41 at 0.09 mg/kg (close to detection limits), and toluene was measured in all of the samples at concentrations ranging from 0.06 to 11.9 mg/kg. Such concentrations are not of significant toxicological concern. Similar concentrations of toluene measured in USACE (2013a) did not result in any significant acute toxicity to H. azteca. (e) SVOCs—Table B39 summarizes the results of these analyses. Very few SVOCs were detected at low levels. Bis(2-ethylhexyl)phthalate is a common laboratory contaminant. c. COCs No COCs were identified in the channel sediments based on data generated by OEPA (2013). 3.5.3 May 2014 event, Upper Cuyahoga River Channel—This effort involved the collection of discrete surface grab sediment samples from the Upper Cuyahoga River, with subsequent bulk chemical analyses. Within the framework of the DMMUs, two to four discrete sediment samples were collected from DMMU-1, DMMU-2a and DMMU-2b. A total of nine samples were subjected to testing. The sediment sampling sites are shown in Figure A7. Since sediment samples were not collected from open-lake reference areas for direct comparison purposes, open-lake reference sediment contaminant concentration ranges from Table B31 were used. Chemical analyses included the nutrients nitrogen-ammonia and TP, TOC, metals, PCBs, pesticides, PAHs, VOCs and SVOCs. One sample, 302581, was collected from outside the channel dredging prism. Because

Cleveland Harbor (Upper Cuyahoga River
Channel) Dredged Sediment Evaluation—2016
Page | 56
this sample was not representative of the sediments that are maintenance dredged from the Upper Cuyahoga River Channel, the associated data were not considered in the evaluation. Data on the remaining eight samples (200013, F01A21, F01A42, F01W50, F01S08, 302578, 302579 and 302580) were included in the evaluation. Sampled sediments were generally comprised of gray brown silty clays. Evaluation of these sediment data is summarized as follows: a. Inorganic analyses (1) Inorganics—Table B40 summarizes the results of the nitrogen-ammonia, TP and TOC analyses. All concentrations of ammonia-nitrogen and TP were within the open-lake reference sediment concentration range. (2) Metals—Table B41 summarizes the results of these analyses. All metal concentrations were within the open-lake reference sediment concentration range. b. Organic analyses (1) PCBs—Table B42 summarizes the results of these analyses. Total PCB concentrations in the sediment samples were determined by summing all detected Aroclor mixtures. The total PCB concentration range of 46.8 to 158 µg/kg (2,753 to 12,177 µg/kg-TOC) was within the open-lake reference sediment concentration range. These channel sediment PCB data are consistent with those presented in USACE (2013a) and USACE (2015a) (as well as in this evaluation). (2) Pesticides—Table B43 summarizes the results of these analyses. Except for DDD, DDE and DDT, all pesticide concentrations were non-detectable. DDE and DDT were measured in all of the samples with ∑DDT concentrations ranging from 26.9 to 53.6 µg/kg (1,029 to 3,007 µg/kg-TOC). The 53.6 µg/kg concentration in sample 301579 is comparable to the maximum open-lake reference sediment concentration. However, on a TOC-normalized concentration basis, most of the samples (range 1,829 to 3,007 µg/kg-TOC) exceeded the maximum open-lake reference sediment concentration. Projections based on the TPB model (McFarland 1984) using empirical ∑DDT BSAFs (and assuming a 1% lipid content in oligochaetes) indicate that bioaccumulation from the three DMMU sediments would consistently be on the order 9 µg/kg. This is within the range of ∑DDT bioaccumulation predicted for open-lake reference area sediments (1.3 to 17 µg/kg). ∑DDT bioaccumulation from the Upper Cuyahoga River Channel sediments based on 2015 bioaccumulation data is evaluated in Section 3.3.4.

Cleveland Harbor (Upper Cuyahoga River
Channel) Dredged Sediment Evaluation—2016
Page | 57
(3) PAHs—Table B44 summarizes the results of these analyses. Total PAH concentrations in the sediment samples were determined by summing the 16 USEPA priority pollutant compounds. All total PAH concentrations were within the open-lake reference sediment concentration range. (4) VOCs—Table B45 summarizes the results of these analyses. Very few VOCs were detected. Acetone, a common laboratory contaminant, was measured in samples F01W40 and F01S08 at 0.10 mg/kg (close to detection limits), and toluene was measured in samples 302578 and 302579 at concentrations ranging from 0.35 to 3.11 mg/kg. Such concentrations are not of significant toxicological concern. Similar concentrations of toluene measured in USACE (2013a) did not result in any significant acute toxicity to H. azteca. (5) SVOCs—Table B46 summarizes the results of these analyses. Very few SVOCs were detected. c. COCs No COCs were identified in the channel sediments based on data generated by OEPA (2014a). 3.5.4 April 2014 event, Upper Cuyahoga River Channel—This effort involved the collection of discrete and vibro-core sediment samples from the Upper Cuyahoga River, with subsequent bulk chemical analyses. Within the framework of the DMMUs, six to eight discrete sediment samples were collected from DMMU-1, DMMU-2a and DMMU-2b. A total of 21 samples were subjected to testing. The sediment sampling sites are shown in Figure A8. Since sediment samples were not collected from open-lake reference areas for direct comparison purposes, open-lake reference sediment contaminant concentration ranges from Table B31 were used. Chemical analyses included the nutrients nitrogen-ammonia and TP, TOC, metals, PCBs, pesticides, PAHs, VOCs and SVOCs. As noted in a March 2, 2015 USACE letter to OEPA (USACE 2015b), it is evident that portions of many of the core sediment samples obtained from the river in this event were collected from outside the Federal navigation channel's dredging prism. Figure A9 illustrates this. Also, the complete lack of elevation data for the sample’s “50%/50% top and bottom of core split” and bottom of core made it impossible to accurately decipher what portion of the top and bottom samples were collected from within or outside the actual dredging prism. The lack of such fundamental information required making certain assumptions as to what core samples could reasonably be expected to be

Cleveland Harbor (Upper Cuyahoga River
Channel) Dredged Sediment Evaluation—2016
Page | 58
representative of sediments subject to maintenance dredging. Given this limited available information, it was determined that 14 of the 21 of the samples were collected from outside the dredging prism; these samples included 200013, F01A21, F01A42 (top and bottom), F01W50 (discrete and bottom), F01S08 (bottom), 302581 (bottom), 302578 (top and bottom), 302579 (bottom), 302580 (bottom) and F01A41 (top and bottom). Because these samples were not representative of the sediments that are maintenance dredged from the Upper Cuyahoga River Channel, the associated data were not considered in the evaluation. Data on the remaining seven samples 200016, 302582 (top and bottom), F01S08 (top), 302579 (top) and 302580 (top) were included in the evaluation. Evaluation of these sediment data is summarized as follows: a. Inorganic analyses (1) Inorganics—Table B47 summarizes the results of the nitrogen-ammonia, TP and TOC analyses. All concentrations of ammonia-nitrogen and TP were within the open-lake reference sediment concentration range. (2) Metals—Table B48 summarizes the results of the sediment grain size analyses. All metal concentrations were within the open-lake reference sediment concentration range. b. Organic analyses (1) PCBs—Table B49 summarizes the results of these analyses. Total PCB concentrations in the sediment samples were determined by summing all detected Aroclor mixtures. The total PCB concentration range of 37.4 to 143 µg/kg (3,177 to 8,400 µg/kg-TOC) was within the open-lake reference sediment concentration range. These channel sediment PCB data are consistent with those presented in USACE (2013a) and USACE (2015a) (as well as in this evaluation). (2) Pesticides—Table B50 summarizes the results of these analyses. Except for DDD, DDE and DDT, all pesticide concentrations were non-detectable. DDD, DDE and DDT were measured in most or all of the samples with ∑DDT concentrations ranging from 5.8 to 54.2 µg/kg (483 to 3,011 µg/kg-TOC). The 54.2 µg/kg concentration in sample F01508 (top) is comparable to the maximum open-lake reference sediment concentration. However, on a TOC-normalized concentration basis, samples 302582 (top), F01S08 (top) and 302580 (top) (range 1,913 to 3,007 µg/kg-TOC) exceeded the maximum open-lake reference sediment concentration. Projections based on the TPB model (McFarland 1984) using empirical ∑DDT BSAFs (and assuming a 1% lipid content in oligochaetes) indicate that bioaccumulation from the DMMU-2b sediments (where average TOC-normalized ∑DDT concentrations exceeded the maximum open-lake reference sediment
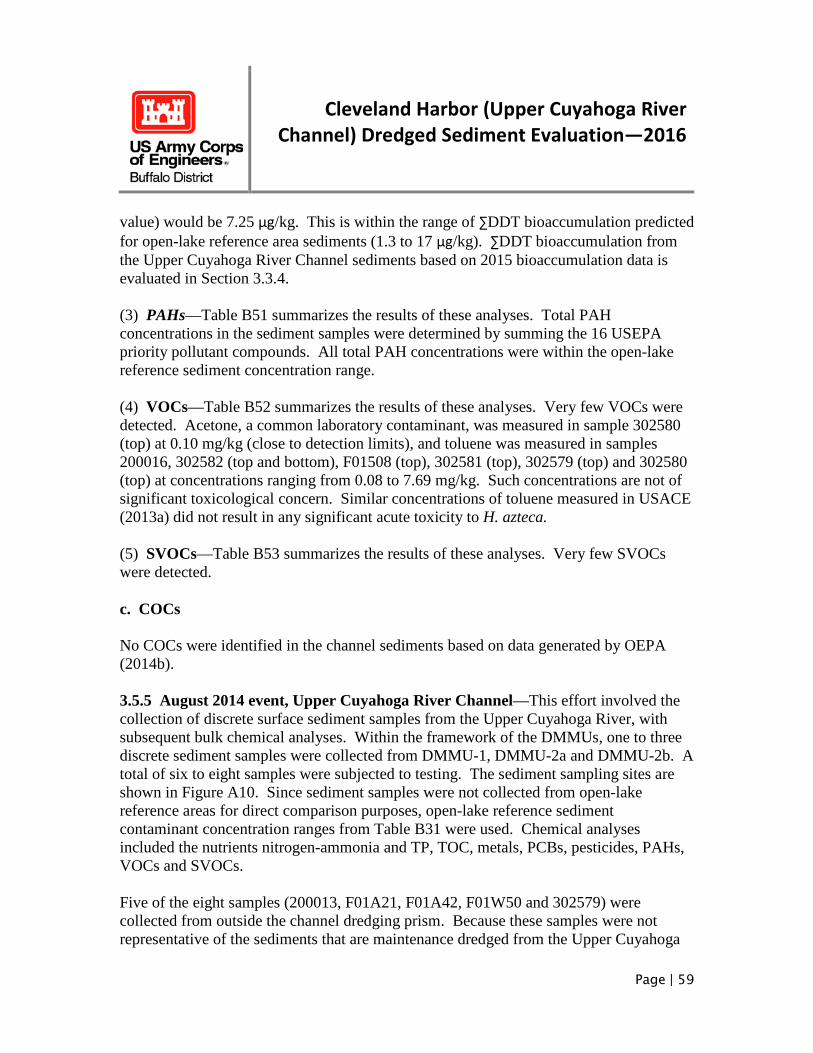
Cleveland Harbor (Upper Cuyahoga River
Channel) Dredged Sediment Evaluation—2016
Page | 59
value) would be 7.25 µg/kg. This is within the range of ∑DDT bioaccumulation predicted for open-lake reference area sediments (1.3 to 17 µg/kg). ∑DDT bioaccumulation from the Upper Cuyahoga River Channel sediments based on 2015 bioaccumulation data is evaluated in Section 3.3.4. (3) PAHs—Table B51 summarizes the results of these analyses. Total PAH concentrations in the sediment samples were determined by summing the 16 USEPA priority pollutant compounds. All total PAH concentrations were within the open-lake reference sediment concentration range. (4) VOCs—Table B52 summarizes the results of these analyses. Very few VOCs were detected. Acetone, a common laboratory contaminant, was measured in sample 302580 (top) at 0.10 mg/kg (close to detection limits), and toluene was measured in samples 200016, 302582 (top and bottom), F01508 (top), 302581 (top), 302579 (top) and 302580 (top) at concentrations ranging from 0.08 to 7.69 mg/kg. Such concentrations are not of significant toxicological concern. Similar concentrations of toluene measured in USACE (2013a) did not result in any significant acute toxicity to H. azteca. (5) SVOCs—Table B53 summarizes the results of these analyses. Very few SVOCs were detected. c. COCs No COCs were identified in the channel sediments based on data generated by OEPA (2014b). 3.5.5 August 2014 event, Upper Cuyahoga River Channel—This effort involved the collection of discrete surface sediment samples from the Upper Cuyahoga River, with subsequent bulk chemical analyses. Within the framework of the DMMUs, one to three discrete sediment samples were collected from DMMU-1, DMMU-2a and DMMU-2b. A total of six to eight samples were subjected to testing. The sediment sampling sites are shown in Figure A10. Since sediment samples were not collected from open-lake reference areas for direct comparison purposes, open-lake reference sediment contaminant concentration ranges from Table B31 were used. Chemical analyses included the nutrients nitrogen-ammonia and TP, TOC, metals, PCBs, pesticides, PAHs, VOCs and SVOCs. Five of the eight samples (200013, F01A21, F01A42, F01W50 and 302579) were collected from outside the channel dredging prism. Because these samples were not representative of the sediments that are maintenance dredged from the Upper Cuyahoga

Cleveland Harbor (Upper Cuyahoga River
Channel) Dredged Sediment Evaluation—2016
Page | 60
River Channel, none of the associated data were considered in the evaluation. Data on the remaining three samples (F01S08, 302578 and 302580) were included in the evaluation. Sampled sediments generally consisted of brown gray silts with some sands. Evaluation of these sediment data is summarized as follows: a. Inorganic analyses (1) Inorganics—Table B54 summarizes the results of the nitrogen-ammonia, TP and TOC analyses. All concentrations of ammonia-nitrogen and TP were within the open-lake reference sediment concentration range. (2) Metals—Table B55 summarizes the results of the sediment grain size analyses. All metal concentrations were within the open-lake reference sediment concentration range. b. Organic analyses (1) PCBs—Table B56 summarizes the results of these analyses. Total PCB concentrations in the sediment samples were determined by summing all detected Aroclor mixtures. The total PCB concentration range of 65.5 to 290 µg/kg (3,447 to 9,145 µg/kg-TOC) was within the open-lake reference sediment concentration range. These channel sediment PCB data are consistent with those presented in USACE (2013a) and USACE (2015a) as well as in this evaluation. (2) Pesticides—Table B57 summarizes the results of these analyses. Except for DDE and DDT, all pesticide concentrations were non-detectable. ∑DDT concentrations were all below the maximum open-lake reference sediment concentration. (3) PAHs—Table B58 summarizes the results of these analyses. Total PAH concentrations in the sediment samples were determined by summing the 16 USEPA priority pollutant compounds. All total PAH concentrations were within the open-lake reference sediment concentration range. (4) VOCs—Table B59 summarizes the results of these analyses. Very few VOCs were detected. Acetone, a common laboratory contaminant, was measured in samples F01S08, 302578 and 302580 at concentrations ranging from 0.07 to 0.09 mg/kg (close to detection limits). (5) SVOCs—Table B60 summarizes the results of these analyses. Very few SVOCs were detected.

Cleveland Harbor (Upper Cuyahoga River
Channel) Dredged Sediment Evaluation—2016
Page | 61
c. COCs No COCs were identified in the channel sediments based on data generated by OEPA (2014c). 3.5.6 October 2014 event, Upper Cuyahoga River Channel—This effort involved the collection of discrete surface sediment grab samples from the Upper Cuyahoga River, with subsequent bulk physical and chemical analyses. Within the framework of the DMMUs, three to four discrete sediment samples were collected from DMMU-1, DMMU-2a and DMMU-2b. A total of three to 10 discrete samples were subjected to testing. The sediment sampling sites are shown in Figure A11. Since sediment samples were not collected from open-lake reference areas for direct comparison purposes, open-lake reference sediment contaminant concentration ranges from Table B31 were used. Chemical analyses included the nutrients nitrogen-ammonia and TP, TOC, metals, PCBs, pesticides, PAHs, VOCs and SVOCs. One of the 10 samples (302579) was collected from outside the channel dredging prism. Because this samples was not representative of the sediments that are maintenance dredged from the Upper Cuyahoga River Channel, the associated data (and data on the related composite sample) were not considered in the evaluation. Data on the remaining nine samples (200016, F01A21-east, F01A21-west, F01A42, F01W50, F01S08, 302581, 302578 and 302580) were included in the evaluation. Samples generally consisted of gray brown silts and clays, with some sands. Evaluation of these sediment data is summarized as follows: a. Physical characteristics. Table B61 summarizes the results of the sediment grain size analyses. Composite samples 302809 and 302808 were composed of silts and clays. Composite sample 302810 was composed of comparably more sands (42 to 72%), with the remainder silts and clays. b. Chemical testing (1) Inorganic analyses (a) Inorganics—Table B62 summarizes the results of the nitrogen-ammonia, TP and TOC analyses. The TP concentration in sample F01A21-west was 1,330 mg/kg but was very close to the maximum open-lake reference concentration. (b) Metals—Table B63 summarizes the results of these analyses. The chromium concentration in sample 302578 was 84.5 mg/kg, which exceeded the maximum open-

Cleveland Harbor (Upper Cuyahoga River
Channel) Dredged Sediment Evaluation—2016
Page | 62
lake reference sediment concentration. Such levels of chromium in sediment are not of significant toxicological concern. The composite sample concentration (including discrete sample 302579 outside the dredging prism) was 44.8 mg/kg. (2) Organic analyses (a) PCBs—Table B64 summarizes the results of these analyses. Total PCB concentrations in the sediment samples were determined by summing all detected Aroclor mixtures. The total PCB concentration range of 106 to 294 µg/kg (5,391 to 12,258 µg/kg-TOC) was within the open-lake reference sediment concentration range. These channel sediment PCB data are consistent with those presented in USACE (2013a) and USACE (2015a) as well as in this evaluation.
(b) Pesticides—Table B65 summarizes the results of these analyses. Except for DDE and DDT, all pesticide concentrations were non-detectable. ∑DDT concentrations were all below the maximum open-lake reference sediment concentration. (c) PAHs—Table B66 summarizes the results of these analyses. Total PAH concentrations in the sediment samples were determined by summing the 16 USEPA priority pollutant compounds. All total PAH concentrations were within the open-lake reference sediment concentration range. (d) VOCs—Table B67 summarizes the results of these analyses. Very few VOCs were detected. Acetone, a common laboratory contaminant, was measured in samples 302578 and 302580 at concentrations ranging from 0.12 to 0.18 mg/kg (close to detection limits). Toluene was measured in samples 200013, F01A21-west, F01A42, 302581 and F01508 at concentrations ranging from 0.07 to 1.0 mg/kg. Such concentrations are not of significant toxicological concern. Similar concentrations of toluene measured in USACE (2013a) did not result in any significant acute toxicity to H. azteca. (e) SVOCs—Table B68 summarizes the results of these analyses. Very few SVOCs were detected. c. COCs No COCs were identified in the channel sediments based on data generated by OEPA (2014d). 3.5.7 April 2015 event, Upper Cuyahoga River Channel—This effort involved the

Cleveland Harbor (Upper Cuyahoga River
Channel) Dredged Sediment Evaluation—2016
Page | 63
collection of discrete surface and gravity core sediment samples from the Upper Cuyahoga River, with subsequent bulk physical and chemical analyses. Discrete samples were composited into two composite samples from each DMMU. A total of six composite samples were subjected to testing. The sediment sampling sites are shown in Figure A12. Since sediment samples were not collected from open-lake reference areas for direct comparison purposes, open-lake reference sediment contaminant concentration ranges from Table B31 were used. Chemical analyses included the nutrients nitrogen-ammonia and TP, TOC, metals, PCBs, pesticides, PAHs and VOCs. Four of the six samples (F01A21, 200013, F01W50 and 302580) consisted of discrete samples that were collected from outside the channel dredging prism. Because these samples were not representative of the sediments that are maintenance dredged from the Upper Cuyahoga River Channel, the associated data were not considered in the evaluation. Data on the remaining two samples (302581 and 302578) were included in the evaluation. Evaluation of these sediment data is summarized as follows: a. Physical characteristics. Table B69 summarizes the results of the sediment grain size analyses. The samples were comprised of 99% silts and clays. b. Chemical testing (1) Inorganic analyses (a) Inorganics—Table B70 summarizes the results of the nitrogen-ammonia, TP and TOC analyses. All concentrations of ammonia-nitrogen and TP were within the open-lake reference sediment concentration range. (b) Metals—Table B71 summarizes the results of these analyses. All metal concentrations were within the open-lake reference sediment concentration range. (2) Organic analyses (a) PCBs—Table B72 summarizes the results of these analyses. Total PCB concentrations in the sediment samples were determined by summing all detected Aroclor mixtures. The total PCB concentration range of 116 to 139 µg/kg (5,043 to 8,176 µg/kg-TOC) was within the open-lake reference sediment concentration range. These channel sediment PCB data are consistent with those presented in USACE (2013a) and USACE (2015a) as well as in this evaluation.
(b) Pesticides—Table B73 summarizes the results of these analyses. Except for

Cleveland Harbor (Upper Cuyahoga River
Channel) Dredged Sediment Evaluation—2016
Page | 64
DDD, DDE and DDT, all pesticide concentrations were non-detectable. ∑DDT concentrations were comparable to open-lake reference sediment concentration. (c) PAHs—Table B74 summarizes the results of these analyses. Total PAH concentrations in the sediment samples were determined by summing the 16 USEPA priority pollutant compounds. All total PAH concentrations were within the open-lake reference sediment concentration range. (d) VOCs—Table B75 summarizes the results of these analyses. Very few VOCs were detected. Acetone, a common laboratory contaminant, was measured in sample 302581 at 0.12 mg/kg (close to detection limits). Toluene was measured in samples 302581 and 302578 at concentrations ranging from 2.6 to 3.8 mg/kg. Such concentrations are not of significant toxicological concern. Similar concentrations of toluene measured in USACE (2013a) did not result in any significant acute toxicity to H. azteca. c. COCs No COCs were identified in the channel sediments based on data generated by OEPA (2015b). 3.5.8 October 2015 event, Upper Cuyahoga River Channel—This effort involved the collection of discrete surface and core sediment samples from the Upper Cuyahoga River, with subsequent bulk physical and chemical analyses. The recovered length of core samples was about 10 to 15 inches. Two to four discrete sediment samples were collected from DMMU-1, DMMU-2a and DMMU-2b. A total of six to 12 samples were subjected to testing. The sediment sampling sites are shown in Figure A13. Since sediment samples were not collected from open-lake reference areas for direct comparison purposes, open-lake reference sediment contaminant concentration ranges from Table B31 were used. Chemical analyses included the nutrients nitrogen-ammonia and TP, TOC, metals, PCBs, pesticides and PAHs. Eight of the 12 samples (F01A21 core, F01A21 grab, F01W50 core, F01W50 grab, 302581 core, 302581 grab, 302580 core and 302580 grab) were collected from outside the channel dredging prism. Because these samples were not representative of the sediments that are maintenance dredged from the Upper Cuyahoga River Channel, the associated data (and data on the related composite sample) were not considered in the evaluation. Data on the remaining four samples (200013 core, 200013 grab, 302578 core and 302578 grab) were included in the evaluation. Sampled sediments generally consisted of gray brown silts. Evaluation of these sediment data is summarized as

Cleveland Harbor (Upper Cuyahoga River
Channel) Dredged Sediment Evaluation—2016
Page | 65
follows: a. Physical characteristics. Table B76 summarizes the results of the sediment grain size analyses. The samples were comprised of between 52.4 and 100% silts and clays, with the remainder sands. b. Chemical testing (1) Inorganic analyses (a) Inorganics—Table B77 summarizes the results of these analyses. All concentrations of ammonia-nitrogen and TP were within the open-lake reference sediment concentration range. (b) Metals—Table B78 summarizes the results of these analyses. All metal concentrations were within the open-lake reference sediment concentration range. (2) Organic analyses (a) PCBs—Table B79 summarizes the results of these analyses. Total PCB concentrations in the sediment samples were determined by summing all detected Aroclor mixtures. The total PCB concentration range of 51 to 129 µg/kg (699 to 6,450 µg/kg-TOC) was within the open-lake reference sediment concentration range. These channel sediment PCB data are consistent with those presented in USACE (2013a) and USACE (2015a) as well as in this evaluation.
(b) Pesticides—Table B80 summarizes the results of these analyses. Except for DDE and DDT, all pesticide concentrations were non-detectable. ∑DDT concentrations were all below the maximum open-lake reference sediment concentration. (c) PAHs—Table B81 summarizes the results of these analyses. Total PAH concentrations in the sediment samples were determined by summing the 16 USEPA priority pollutant compounds. All total PAH concentrations were within the open-lake reference sediment concentration range. c. COCs No COCs were identified in the channel sediments based on data generated by OEPA (2015c). No significant differences were noted in sediment contaminant concentrations among core and surface grab samples.

Cleveland Harbor (Upper Cuyahoga River
Channel) Dredged Sediment Evaluation—2016
Page | 66
3.5.9 May and June 2015 events, Lake Erie and CLA-1 vicinity—In May 2015, surface grab sediment samples were collected for analysis across open-lake sites adjacent to Cleveland Harbor. Ten out of a possible 12 sediment samples were collected and analyzed (LE-1 through LE-11), along with two composite sediment samples (COMP-1 [LE-1 through LE-6] and COMP-2 [LE-7 through LE-11]. No sample was collected from LE-5 as planned (only mussel shells were recovered) and no sample was collected from LE-12 due to unsafe sampling conditions. The sediment sampling sites are shown in Figure A14. In June 2015, multicore sediment samples were collected for analysis within and adjacent to CLA-1. Multicore sediment samples were collected from eight of nine planned sample locations (CLA1-0, CLA1-0.5E, CLA1-1.5E, CLA1-1S, CLA0.5W, CLA1-1.5W, CLA1-1N and CLA1-2N). These sample locations were staged in north, south, east and west directions from the center of CLA-1, in half a mile and then mile increments. Core samples were subdivided into top and bottom samples for analysis, along with a composite of the top samples and bottom samples. Due to poor sediment recovery, the core from CLA1-1S was not split into top and bottom sections and no sample was collected from CLA1-2S, as planned. However, along with the composited core for location CLA1-1S, a discrete sample located at a depth of three inches was also analyzed for PAHs. Chemical analyses of samples included the nutrients nitrogen-ammonia and TP, TOC, metals, PCBs (as Aroclors), pesticides, PAHs and VOCs. Additionally, the composite samples were subjected to grain size analysis, 10-day H. azteca solid phase bioassays and 28-day L. variegatus bioaccumulation tests (tissue samples were analyzed for PCBs [as congeners] and lipid content) (Section 3.5.10 addresses this biological testing). a. Physical description and analysis. Surface grab samples consist mainly of brown/gray silty sands. Multicore sample recovery generally ranged from 15 to 20 inches in depth, with the CLA1-1S sample being 10 inches. The core samples in and around CLA-1 generally consisted of gray silty clays with varying sand content. Samples CLA1-0.5W, CLA1-0, CLA1-1S and LE-10 were identified in the field logs as potentially evidencing petroleum contamination. These locations are in the vicinity of sites previously identified by USACE (2015c) as being impacted by petroleum within and to the south of CLA-1. Tables B82 and 83 summarize the results of the sediment grain size analyses. The composite of surface samples LE-7 through LE-11, and the composite of CLA-1 and vicinity core samples were primarily fine-grain, being composed of over 99% silts and clays. The LE-1 through LE-6 composite sample was more coarse-grain, being composed of 45% sands with the remainder silts and clays. b. Chemical testing

Cleveland Harbor (Upper Cuyahoga River
Channel) Dredged Sediment Evaluation—2016
Page | 67
(1) Inorganic analyses (a) Inorganics—Tables B84 and 85 summarize the results of these analyses. Nitrogen-ammonia, TOC and TP concentrations were similar among the two sampling events. However, TP concentrations (up to 1,370 mg/kg) were comparatively greater than the concentrations measured by USACE (2015a). (b) Metals—Tables B86 and 87 summarize the results of these analyses. Metal concentrations across the two events were generally consistent with previous evaluations, with the exception of several of the CLA-1 cores which indicated elevated levels of cadmium, copper, lead and zinc. Higher metal concentrations were present in the core samples suspected of petroleum contamination as well as in sample CLA1-1.5E, both in the top and bottom sections of cores. (2) Organic analyses (a) PCBs—Table B88 and 89 summarizes the results of these analyses. Total PCB concentrations across all samples ranged from non-detectable to 260 µg/kg (8,387 µg/kg-TOC), which is consistent with the data from USACE (2013a) and USACE (2015a) (as well as in this evaluation.
(b) Pesticides—Tables B90 and 91 summarize the results of these analyses. Pesticides were generally non-detectable, with the exception of two CLA-1 samples for DDE (18.3 and 32.9 µg/kg). USACE (2015a) (as well as in this evaluation) indicated similar ∑DDT concentrations when detected (ranging up to 49 µg/kg within CLA-4). (c) PAHs—Tables B92 and 93 summarize the results of these analyses. Total PAH concentrations were comparatively elevated in samples LE-10 (37,930 µg/kg), the bottom of core samples CLA1-0.5E (102,770 µg/kg) and CLA1-1.5E (40,170 µg/kg), the top sections of core samples CLA1-1.5E (402,970 µg/kg), and the top and bottom section of CLA1-1S (124,400 µg/kg and 134,720 µg/kg). Of these samples, possible petroleum contamination was noted for samples LE-10 and CLA1-1S.
• Total PAH concentrations consistent with background lake sediments. Total PAH concentrations in the remaining samples, not suspected of being impacted by petroleum contamination, ranged from 780 to 27,680 µg/kg, which is consistent with previous evaluations of lake sediments (USACE 2013a; USACE 2015a [as well as in this evaluation). Total PAH concentrations in Samples LE-8 and LE-11 ranged up to 18,350 and 12,340 µg/kg, which were within the range of concentrations in open-lake reference sediments (Table B31). Similarly, the total
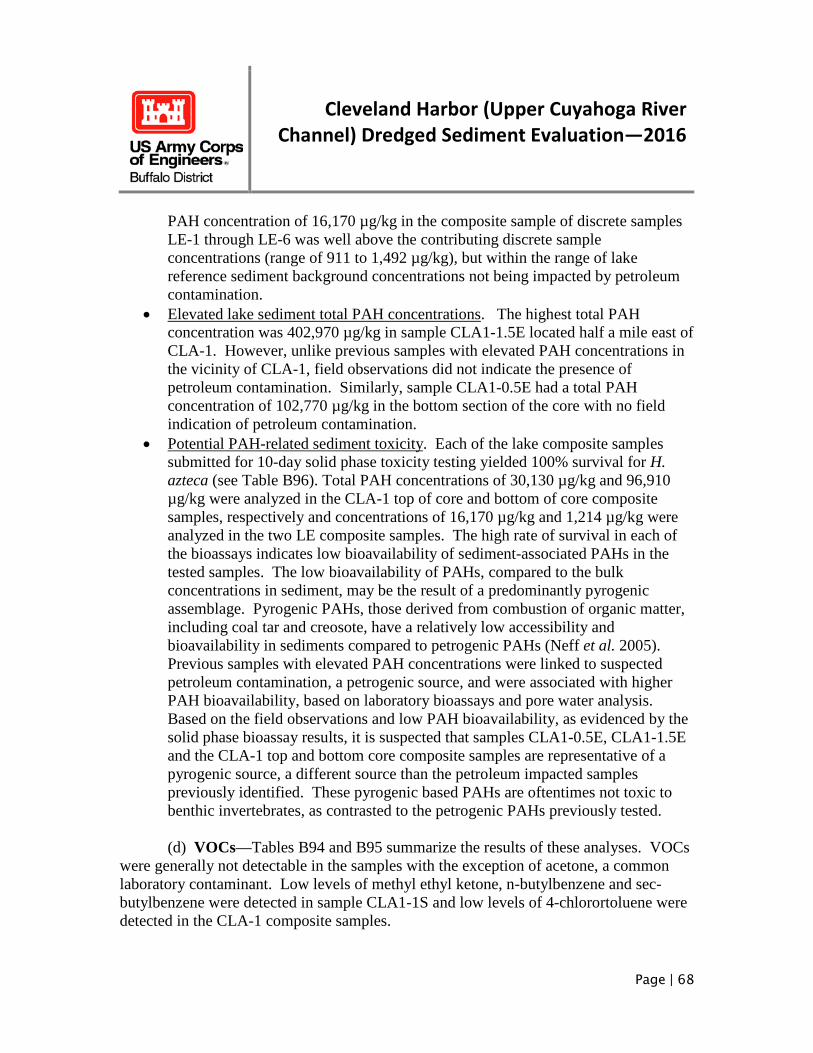
Cleveland Harbor (Upper Cuyahoga River
Channel) Dredged Sediment Evaluation—2016
Page | 68
PAH concentration of 16,170 µg/kg in the composite sample of discrete samples LE-1 through LE-6 was well above the contributing discrete sample concentrations (range of 911 to 1,492 µg/kg), but within the range of lake reference sediment background concentrations not being impacted by petroleum contamination.
• Elevated lake sediment total PAH concentrations. The highest total PAH concentration was 402,970 µg/kg in sample CLA1-1.5E located half a mile east of CLA-1. However, unlike previous samples with elevated PAH concentrations in the vicinity of CLA-1, field observations did not indicate the presence of petroleum contamination. Similarly, sample CLA1-0.5E had a total PAH concentration of 102,770 µg/kg in the bottom section of the core with no field indication of petroleum contamination.
• Potential PAH-related sediment toxicity. Each of the lake composite samples submitted for 10-day solid phase toxicity testing yielded 100% survival for H. azteca (see Table B96). Total PAH concentrations of 30,130 µg/kg and 96,910 µg/kg were analyzed in the CLA-1 top of core and bottom of core composite samples, respectively and concentrations of 16,170 µg/kg and 1,214 µg/kg were analyzed in the two LE composite samples. The high rate of survival in each of the bioassays indicates low bioavailability of sediment-associated PAHs in the tested samples. The low bioavailability of PAHs, compared to the bulk concentrations in sediment, may be the result of a predominantly pyrogenic assemblage. Pyrogenic PAHs, those derived from combustion of organic matter, including coal tar and creosote, have a relatively low accessibility and bioavailability in sediments compared to petrogenic PAHs (Neff et al. 2005). Previous samples with elevated PAH concentrations were linked to suspected petroleum contamination, a petrogenic source, and were associated with higher PAH bioavailability, based on laboratory bioassays and pore water analysis. Based on the field observations and low PAH bioavailability, as evidenced by the solid phase bioassay results, it is suspected that samples CLA1-0.5E, CLA1-1.5E and the CLA-1 top and bottom core composite samples are representative of a pyrogenic source, a different source than the petroleum impacted samples previously identified. These pyrogenic based PAHs are oftentimes not toxic to benthic invertebrates, as contrasted to the petrogenic PAHs previously tested.
(d) VOCs—Tables B94 and B95 summarize the results of these analyses. VOCs were generally not detectable in the samples with the exception of acetone, a common laboratory contaminant. Low levels of methyl ethyl ketone, n-butylbenzene and sec-butylbenzene were detected in sample CLA1-1S and low levels of 4-chlorortoluene were detected in the CLA-1 composite samples.

Cleveland Harbor (Upper Cuyahoga River
Channel) Dredged Sediment Evaluation—2016
Page | 69
3.5.10 Benthic bioassay 2015 (April, May and June) event, Upper River Channel, Lake Erie and CLA-1 vicinity—An H. azteca 10-day acute bioassay (using survival and growth as measurement endpoints) and L. variegatus 28-day PCB bioaccumulation test following the methodologies presented in USEPA (2000) were applied to channel and lake sediments offshore of Cleveland. The following composite sediment samples, composed of several discrete surface and/or core sediment samples, were used in this testing: F01A21, 200013, F01W50, 302581, 302580 and 302578 (channel sediments); LE 1 through LE-6 and LE 7 through LE-11 (Lake Erie sediments); and top and bottom of core samples (CLA-1 and vicinity sediments). a. H. azteca 10-day acute bioassay. Table B96 summarizes the results of this bioassay. The mean survival of H. azteca ranged between 16 and 40% across all composite channel sediment samples, all of which were statistically lower than those associated with the reference sediments (all 100%). However, there were several major methodological issues with the conduct of this bioassay. (1) Appropriate testing/evaluation guidance—This bioassay did not follow appropriate formal USEPA/USACE testing and evaluation guidance prescribed in the GLTM and ITM (USEPA/USACE 1998a, 1998b). For example, sediment pore water data in the bioassay was not measured or monitored, and the bioassay water was not purged to preclude effects from ammonia in the bioassay (ammonia is a naturally occurring constituent of pore water that can quite readily confound bioassays performed in the laboratory). These procedures accomplish two main things: (1) most importantly, they ensure that the toxicity of any persistent sediment contaminant(s) is not confounded by toxicity caused by ammonia in the test; and (2) they provide evidence that ammonia may be a contributor to any observed toxicity. Pre-existing information on ammonia toxicity in these sediments available to OEPA (e.g., Kreitinger et al. 2011; USACE 2013a) underscores the need to include sediment pore water ammonia monitoring in the bioassay procedures. (2) Effects of sediment pore water ammonia in laboratory testing—No sediment pore water ammonia reduction procedures were performed. Therefore, it is highly likely that sediment pore water ammonia was a factor contributing to, or potentially driving, the reduced survival and growth observed. Note that while the growth of this H. azteca was measured, it is not an accepted measurement endpoint used for evaluating whether dredged sediment meets CWA Section 404(b)(1) Guidelines for open-lake placement due to the absence of interpretive guidance. (3) Effects of native organisms in laboratory testing—As documented in USACE (2015a) (as well as in this evaluation), it is likely that the presence of native oligochaetes

Cleveland Harbor (Upper Cuyahoga River
Channel) Dredged Sediment Evaluation—2016
Page | 70
in many of the sediment samples within at least DMMU-2a and DMMU-2b played some role in the observed reduced survival of H. azteca. (4) Consideration of other relevant lines of evidence—Irrespective of the accuracy of the location of the collected sediment samples, a review of the bulk chemistry, in tandem with existing information, fails to suggest any clear sediment contaminants of concern (COCs). In addition, there were no evident trends among sediment contaminant concentrations and H. azteca survival. Regarding PAH contamination, the state-of-the-science approach to evaluating accurate PAH-specific toxicity is through sediment pore water measurements (USEPA 2003). This has been accomplished on the Upper Cuyahoga River Channel sediments three times by USACE (USACE 2013a; USACE 2015a [as well as in this evaluation]), which consistently indicated insignificant PAH-related toxicity. Weight-of-the-evidence (WOE) shows that PAHs in these channel sediments are of predominantly pyrogenic origin; because of this, the PAHs tightly adsorb to hard carbon and are therefore less bioavailable, which prevents them from causing any significant toxicity. Based on the above information, it is concluded that the H. azteca bioassay failed to follow appropriate test procedures, and WOE indicates that the test yielded false-positive results on the Upper Cuyahoga River sediments. b. L. variegatus 28-day PCB bioaccumulation test. Total PCB concentrations in tissue samples were determined by summing all congeners with non-detectable concentrations valued at zero. Table B97 summarizes the results of this test. Total PCB residues in L. variegatus tissues exposed to the channel composite sediment samples ranged from 225 to 362 µg/kg. These were statistically greater than those exposed to composited open-lake sediment samples (range 34.9 to 108 µg/kg), and much higher than those yielded from standard 28-day PCB L. variegatus bioaccumulation tests on channel sediments in USACE (2013) and USACE (2015) (as well as in this evaluation). However, there were several major methodological issues with the conduct of this bioaccumulation test. This test did not follow appropriate formal USEPA/USACE testing and evaluation guidance (USEPA/USACE 1998a, 1998b), and the data generated do not appear to be representative of PCB bioaccumulation from the channel or lake sediments. This is detailed as follows: (1) Appropriate testing/evaluation guidance (a) Gut clearance—Following test exposures, a fundamental requirement is to allow a standard 24-hour period for L. variegatus gut clearance; OEPA’s test provided for

Cleveland Harbor (Upper Cuyahoga River
Channel) Dredged Sediment Evaluation—2016
Page | 71
a gut clearance of 6 hours which is 18 hours less than the standard required in formal guidance (USEPA/USACE 1998a, 1998b). A 24-hour gut clearance is also recommended by the most recent American Society of Testing and Materials (ASTM) (ASTM 2010). Under an assumption that the channel samples contained a significant number of native oligochaete (tubificid) (as has been USACE observation since at least 2010), it is also possible that the inclusion of tubificidae genera in the tissue samples absent a minimum 24-hour gut clearance biased test PCB concentrations high due to material remaining in the gut (e.g., Gillis et al. 2004). (b) Sample replication—Five test bioaccumulation replicates were composited into a single sample for PCB analysis. USEPA/USACE (1998a, 1998b) requires the standard bioaccumulation experiments to be conducted with five replicates, including quantification of PCB residues in each individual replicate. The five replicates run by OEPA were composited into a single tissue sample, which resulted in no replication of the measured PCB tissue data. Due to lack of replication, no statistical comparisons to any open-lake reference area sediments could be conducted. This also effects lipid-normalization as there is unequal tissue and lipid mass in individual replicates. The average of lipid-normalized replicate tissue concentrations is not equal to the total PCB mass divided by the total lipid mass in the composite tissue sample. It will be biased by larger tissue masses of the individual replicates. (2) PCB bioaccumulation data (a) L. variegatus tissue residues relative to sediment—In comparison to USACE (2013a and 2015a [as well as data in this evaluation]) data and theoretical values, OEPA’s data yielded much higher PCB tissue residues relative to PCB concentrations in both channel and lake sediment samples. This is uncharacteristic for these sediments and sediments with such residual concentrations of PCBs.
• One initial issue with the PCB data generated is the use of less precise Aroclor mixtures (i.e., instead of congener data) to quantify total PCBs in the sediment samples. In addition, non-detectable data were yielded from the lake sediment samples due to high detection limits (i.e., 51 to 79.4 µg/kg). Performance of PCB congener analyses would have been a superior method to quantify sediment PCB concentration for the bioaccumulation test with improved precision, and would have added value to the test results.
• A more compelling anomaly is that TOC-normalized total PCB concentrations measured in the channel sediment samples infer that total PCB bioaccumulation from these channel sediments in L. variegatus should be on order of 0.1 mg/kg. This is based on application of the TBP model (McFarland 1984) employing the

Cleveland Harbor (Upper Cuyahoga River
Channel) Dredged Sediment Evaluation—2016
Page | 72
use of a mean empirical, site-specific BSAF (USACE 2013a; USACE 2015a [as well as in this evaluation]). However, reported L. variegatus total PCB tissue residues were on average approximately five times higher than the TBP values. This indicates that the reported tissue values, on average, were 470 to 760% higher than would be theoretically expected based on PCB and TOC sediment concentrations alone. Such results are improbable because they are inconsistent with recent site-specific bioaccumulation data using appropriate methodologies (USACE 2013a; USACE 2015a [as well as in this evaluation]) and greatly exceed theoretical values.
(b) Estimated bioavailability—BSAFs for L. variegatus using these reported data were calculated to discern total PCB bioavailability and further examine the bioaccumulation data generated. This yielded mean BSAFs of 5.0 (range 2.14 to 8; N=9) for both the channel and lake sediment samples (the lake BSAFs in this case would likely be higher given that they were based on reported but high non-detectable levels of PCBs in sediment). A BSAF of 5 is over six times the mean BSAF of 0.73 (N=40) generated from site-specific data using appropriate test methodologies (USACE 2013a; USACE 2015a [as well as in this evaluation]). It is also approximately four times a mean BSAF of 1.30 (N=101) derived across other researchers using a standard 28-day laboratory exposure period for L. variegatus with mixed 24- and 6-hour gut clearance periods (i.e., Ankley et al. 1992; Call et al. 1993; Pickard et al. 2001; Burkhard et al. 2015) as contained in the BSAF database (USAERDC 2016). The disparity between such inordinately high mean BSAF values, and those from site-specific data and data from other researchers, is illustrated in Figure 11. In addition, the individual BSAFs alone do not reflect the diminution of PCB bioavailability attributable to the presence of hard carbon in these sediments.

Cleveland Harbor (Upper Cuyahoga River
Channel) Dredged Sediment Evaluation—2016
Page | 73
FIGURE 11
Figure 12 is a histogram (frequency distribution) of mean total PCB BSAFs from researchers using a standard 28-day laboratory exposure period for L. variegatus with mixed 24- and 6-hour gut clearance periods. The data are skewed right with about 90% of all mean BSAFs falling within the 0.1 to 2.0 range. The mean total PCB BSAFs for harbor and lake sediments of 0.78 and 0.57 based on data from USACE (2013a) and USACE (2015a) (as well as in this evaluation) are at the mode (high point of the distribution) and fall within the range of values generated by most of the researchers, with the combined harbor/lake sediment mean of 0.73 being comparable to the median of 0.88 across the BSAF distribution. In contrast, the mean total PCB BSAFs of 5 for harbor and lake sediments based on data reported from OEPA (2015f) fall on the right tail extreme of the distribution beyond the 95th percentile (96% of the BSAFs are less than or equal to 5), and are almost 6-fold greater than the distribution median value.
1.30
0.73
5.0
0.00
1.00
2.00
3.00
4.00
5.00
6.00
Other researchers(N=101)
USACE (2013a and 2015)(N= 40)
OEPA (2015f) (N=9)
Mea
n BS
AF
Data source
Comparison of total PCB BSAFs based on 28-day L. variegatus laboratory bioaccumulation
experiments

Cleveland Harbor (Upper Cuyahoga River
Channel) Dredged Sediment Evaluation—2016
Page | 74
FIGURE 12
Collectively, this data set suggests that the OEPA test results are not representative of PCB bioaccumulation from channel shoals or sediments in Lake Erie. Based on this information, it is concluded that the L. variegatus bioassay failed to follow appropriate test procedures, and WOE indicates that the test yielded improbable results on Upper Cuyahoga River and Lake Erie sediments. 4.0 CONCLUSION Based on data from RTI (2014a, 2014b, 2015) and USAERDC (2015a) in tandem with USACE (2013a) and other relevant information such as from OEPA (2013, 2014a, 2014b, 2014c, 2014d, 2015b, 2015c, 2015d, 2015e and 2015f), contamination and toxicity associated with Cleveland Harbor Upper Cuyahoga River Channel sediments, as represented by DMMU-1, DMMU-2a and DMMU-2b, has been shown to be comparable
0
5
10
15
20
25
30
35
Num
ber i
n in
terv
al
Interval of mean BSAFs
Mean total PCB BSAF histogram, L. variegatus 28-day laboratory bioaccumulation data from various researchers
OEPA data
↓
USACEdata
↓

Cleveland Harbor (Upper Cuyahoga River
Channel) Dredged Sediment Evaluation—2016
Page | 75
relative to open-lake reference area sediments and/or would not represent any appreciable increased toxicological risk to the affected aquatic ecosystem when placed at CLA-1. Therefore, it is concluded that all sediments dredged from DMMU-1, DMMU-2a and DMMU-2b meet CWA Section 404(b)(1) guidelines at 40 CFR 230.11(d) for open-lake placement at CLA-1. In an effort to abate existing PAH-related toxicity and/or reduce bioaccumulation of PCBs from impacted lake sediments encountered at CLA1-5 (2014 sample location) and CLA1-1 (sample location), dredged sediment discharge should be conducted within the southeast quadrant of CLA-1 to create a thin layer cap over those sediments. Therefore, placement of Upper Cuyahoga River Channel dredged sediments in portions of CLA-1 would be a beneficial use of the material. 5.0 REFERENCES Adams WJ, Rowland CD (2002) Aquatic Toxicology Test Methods. In: D.J Hoffman, B.A. Rattner, G.A. Burton and J. Cairns (eds.), Handbook of Ecotoxicology. Boca Raton, Florida: Lewis Publishers. Andersen HB, Buckley JA (1998) Acute toxicity of ammonia to Ceriodaphnia dubia and a procedure to improve control survival. Bull Environ Contam Toxicol 61:116-122. Ankley GT, Cook PM, Carslon AR, Call DJ, Swenson JA, Corcoran HF, Hoke RA (1992) Bioaccumulation of PCBs by oligochaetes and fishes: comparisons of laboratory and field studies. Canadian J Fish Aquat Sci 49:2080-2085. ASTM (2005) Measuring the Toxicity of Sediment-Associated Contaminants with Freshwater Invertebrates. ASTM Standard E1706-05. ASTM (2010) Standard Guide for Determination of the Bioaccumulation of Sediment-Associated Contaminants by Benthic Invertebrates. ASTM Standard E1688-10. Beckingham B, Ghosh U (2010) Comparison of field and laboratory exposures of Lumbriculus variegatus to polychlorinated biphenyl-impacted river sediments. Environ Tox Chem 29:2851-2858. Burkhard LP, Hubin-Barrows D, Billa N, Highland T, Hockett JR, Mount DR, Norberg-King TJ, Hawthorne S, Miller DJ, Grabanski CB (2015) Sediment bioaccumulation test with Lumbriculus variegatus: effects of feeding. Arch Environ Contam Toxicol 68:696–706. Burton GA, Nguyen LTH, Janssen C, Baudo R, McWilliam R (2005) Field validation of

Cleveland Harbor (Upper Cuyahoga River
Channel) Dredged Sediment Evaluation—2016
Page | 76
sediment zinc toxicity. Environ Toxicol Chem 24:541-553. Call DJ, Rau DM, Thompson DR, Kahl MD (1993) A Study of PCB Bioaccumulation from Waukegan Harbor, Lake Michigan Sediments by the Oligochaete Lumbriculus variegatus. Report prepared by Lake Superior Research Institute, University of Wisconsin-Superior for USACE, Chicago District. Di Toro DM, Mahony JD, Hansen DJ, Scott KJ, Carlson AR, Ankley GT (1992) Acid volatile sulfide predicts the acute toxicity of cadmium and nickel in sediments. Environ Sci Technol 26:96-101. Fairchild JF, Allert AL, Sappington LC, Waddell B (2005) Chronic toxicity of un-ionized ammonia to early life-states of endangered Colorado Pikeminnow (Ptychocheilus lucius) and Razorback sucker (Xyrauchen texanus) compared to the surrogate Fathead minnow (Pimephales promelas). Arch Environ Contam Toxicol 49:378-384. Gillis PL, Dixon DG, Borgmann U, Reynoldson TB (2004) Uptake and depuration of cadmium, nickel and lead in laboratory-exposed Tubifex and corresponding changes in the concentration of a metallothionein-like protein. Environ Toxicol Chem 23:76-85. Hawthorne SB, Azzolina NA, Neuhauser EF, Kreitinger JP (2007) Predicting bioavailability of sediment polycyclic aromatic hydrocarbons to Hyalella azteca using equilibrium partitioning, supercritical fluid extraction and pore water concentrations. Environ. Sci. Technol. 41:6297-6304. Kennedy AJ, Lotufo GR, Steevens JA (2015) Review of dredged elutriate application factors: relevance to acute-to-chronic protection, contaminant and endpoint specificity. ERDC/EL TR-15-10. http://oai.dtic.mil/oai/oai?verb=getRecord&metadataPrefix=html&identifier=ADA621370 Kreitinger JP, Price RA, Borrowman TD, Kennedy AJ, Brandon DL, Bourne M (2011) Evaluation of Beneficial Use Suitability for Cleveland Harbor Dredged Material: Interim Capacity Management and Long-Term Planning. Vicksburg, Mississippi: USAERDC. McFarland VA (1984) Activity-based evaluation of potential bioaccumulation from sediments. In: Montgomery RL, Leach JW (eds.), Dredging '84, vol. 1. American Society of Civil Engineers, New York, pp 461-467.
Cleveland Harbor (Upper Cuyahoga River
Channel) Dredged Sediment Evaluation—2016
Page | 77
Nimmo DWR, Link D, Parrish LP (1989) Comparison of on-site and laboratory toxicity tests: derivation of site-specific criteria for unionized ammonia in a Colorado transitional stream. Environ Toxicol Chem 8:1177-1189. Neff JM, Stout SA, Gunstert DG (2005) Ecological risk assessment of polycyclic aromatic hydrocarbons in sediments: identifying sources and ecological hazard. Integr Environ Assess Manag 1: 22-33. OEPA (2008) Guidance for Conducting Ecological Risk Assessments. Division of Environmental Response and Revitalization. DERR-00-RR- 031. http://www.epa.ohio.gov/portals/30/rules/RR-031.pdf OEPA (2015a) Letter to USACE dated September 30, 2015 (Subject: Complete 2014 and 2015 Sampling Results from the Cuyahoga River and Lake Erie). OEPA (2015b) Analytical data on surface grab and core sediment samples collected from the Upper Cuyahoga River, Cleveland Harbor, Ohio in April 2015. Data provided by OEPA to USACE. OEPA (2015c) Analytical data on surface grab and core sediment samples collected from the Upper Cuyahoga River, Cleveland Harbor, Ohio in October 2015. Data provided by OEPA to USACE. OEPA (2015d) Analytical data on surface grab sediment samples collected from Lake Erie offshore of Cleveland, Ohio in May 2015. Data provided by OEPA to USACE. OEPA (2015e) Analytical on core sediment samples collected from the Lake Erie CLA-1 vicinity offshore of Cleveland, Ohio in June 2015. Data provided by OEPA to USACE. OEPA (2015f) Bioassay data on core and grab sediment samples collected from the Upper Cuyahoga River, Lake Erie and CLA-1 vicinity, Cleveland Harbor, Ohio in April. May and June 2015. Data provided by OEPA to USACE. OEPA (2014a) Analytical data on surface grab sediment samples collected from the Upper Cuyahoga River, Cleveland Harbor, Ohio. Data provided by OEPA to USACE. OEPA (2014b) Analytical data on core sediment samples collected from the Upper Cuyahoga River, Cleveland Harbor, Ohio. Data provided by OEPA to USACE.

Cleveland Harbor (Upper Cuyahoga River
Channel) Dredged Sediment Evaluation—2016
Page | 78
OEPA (2014c) Analytical data on surface grab sediment samples collected from the Upper Cuyahoga River, Cleveland Harbor, Ohio. Data provided by OEPA to USACE. OEPA (2014d) Analytical data on surface grab sediment samples collected from the Upper Cuyahoga River, Cleveland Harbor, Ohio. Data provided by OEPA to USACE. OEPA (2013) Analytical data on surface grab sediment samples collected from the Upper Cuyahoga River, Cleveland Harbor, Ohio. Data provided by OEPA to USACE. Oliver BG (1984) Uptake of chlorinated organics from anthropogenically contaminated sediments by oligochaete worms. Canadian J Fish Aquat Sci 41:878-883. Oliver BG (1987) Biouptake of chlorinated hydrocarbons from laboratory spiked and field sediments by oligochaete worms. Environ Sci Technol 21:785-790. Pickard SW, Irvine KN, Yaksich SM, McFarland VA (2001) Bioaccumulation potential of sediment-associated polychlorinated biphenyls (PCBs) in Ashtabula Harbor, Ohio. J Great Lakes Res 27:44-59. Reynoldson TB, Day KE, Clarke C, Milani D (1994) Effects of indigenous animals on chronic endpoints in freshwater sediment toxicity tests. Environ Toxicol Chem 13:973-977. RTI (2014a) Analytical data on sediment collected from Cleveland Harbor Upper River Channel and open-lake areas in Lake Erie. RTI (2014b) Analytical data on sediments collected from Lake Erie offshore of Cleveland. RTI (2015) Analytical data on sediments collected from Cleveland Harbor Federal navigation channels and open-lake areas in Lake Erie. Talley JW, Ghosh U, Tucker SG, Furey FS, Luthy RG (2002) Particle-scale understanding of the bioavailability of PAHs in sediment. Environ Sci Technol 6: 477-483. USACE (1988) Title 33, Chapter II, Part 336, Factors to be Considered in the Evaluation of Army Corps of Engineers Dredging Projects Involving the Discharge of Dredged

Cleveland Harbor (Upper Cuyahoga River
Channel) Dredged Sediment Evaluation—2016
Page | 79
Material into Waters of the United States and Ocean Waters. http://www.law.cornell.edu/cfr/text/33/336. USACE (2007) Evaluation of Federal Navigation Channel Sediments with Respect to their Suitability for Open-lake Placement—Cleveland Harbor, Cuyahoga County, Ohio. Technical report prepared by USACE-Buffalo District. USACE (2011) Section 729 Watershed Study, Cuyahoga River, Ohio. Initial Watershed Assessment. Report prepared by USACE-Buffalo District. USACE (2013a) Evaluation of Cleveland Harbor Federal Navigation Channel (Upper Cuyahoga River Channel) Sediments with Respect to Suitability for Open-lake Placement. Technical report prepared by USACE-Buffalo District. USACE (2013b) Letter to OEPA dated December 20, 2013 (Subject: Cleveland Harbor, Cuyahoga County, Ohio—Open-lake Placement of Material Dredged from the Upper Cuyahoga River Channel). USACE (2015a) Evaluation of Cleveland Harbor Federal Navigation Channel (Upper Cuyahoga River Channel) Sediments with Respect to Suitability for Open-lake Placement. Technical report prepared by USACE-Buffalo District. USACE (2015b) Letter to OEPA dated March 2, 2015 (Subject: Cleveland Harbor, Cuyahoga County, Ohio—Spring 2015 Field Sampling Plan for Cuyahoga River/Old River Channels). USACE (2013c) Letter to OEPA dated November 20, 2013 (Subject: Cleveland Harbor, Cuyahoga County, Ohio—Request for Section 401 Water Quality Certification for Discharges of Dredged Sediments Associated with the Scheduled 2016 Maintenance Dredging Project). USAERDC (2016) Tier 3 Biological Testing of Cleveland Harbor Federal Navigation Channel Sediments. Technical report. USAERDC (2015b) Short-Term Fate (STFATE) Modeling Approach and Results for Evaluation of Contaminant Release During Open-Water Placement of Sediments Dredged from the Cleveland Harbor Upper Cuyahoga River Channel. Technical Memorandum (draft) dated October 30, 2015. USAERDC (2016) Biota-Sediment Accumulation Factor Database.

Cleveland Harbor (Upper Cuyahoga River
Channel) Dredged Sediment Evaluation—2016
Page | 80
http://el.erdc.usace.army.mil/bsaf/index.cfm USEPA/USACE (1998a) Great Lakes Dredged Material Testing and Evaluation Manual. http://greatlakesdredging.net/files/1998-usace-dredged-material-testing-manual-all.pdf USEPA/USACE (1998b) Evaluation of Dredged Material for Discharge in Waters of the U.S.—Testing Manual. http://water.epa.gov/type/oceb/oceandumping/dredgedmaterial/testing.cfm USEPA (2000) Methods for Measuring the Toxicity and Bioaccumulation of Sediment-associated Contaminants with Freshwater Invertebrates, Second Edition. EPA 600/R-99/064. USEPA (2001) Methods for Collection, Storage and Manipulation of Sediments for Chemical and Toxicological Analyses: Technical Manual. EPA-823-B-01-002. USEPA (2003) Procedures for the Derivation of Equilibrium Partitioning Sediment Benchmarks (ESBs) for the Protection of Benthic Organisms: PAH Mixtures. USEPA, Office of Research and Development, Washington, DC. EPA/600/R-02/013.
USEPA (2005) Procedures for the Derivation of Equilibrium Partitioning Sediment Benchmarks (ESBs) for the Protection of Benthic Organisms: Metal Mixtures (Cadmium, Copper, Lead, Nickel, Silver and Zinc). USEPA, Office of Research and Development, Washington, DC. EPA/600/R-02/011. http://www.epa.gov/nheerl/download_files/publications/metalsESB_022405.pdf. USEPA (2015a) Great Lakes Area of Concern—Cuyahoga River. http://www.epa.gov/greatlakes/aoc/cuyahoga.html. USEPA (2015b) Title 40, Chapter 1, Subchapter H, Part 230, Section 230.11, Factual Determinations. http://www.law.cornell.edu/cfr/text/40/230.11

APPENDIX A
FIGURES


U.S. ARMY ENGINEER DISTRICTCORPS OF ENGINEERSBUFFALO, NY
&% &% &% &% &%
&%
&%
&%
&%
&%
&%
&%
&%
&%
&%14-CH-15
14-CH-14
14-CH-13
14-CH-12
14-CH-11
14-CH-10
14-CH-09
14-CH-08
14-CH-07
14-CH-06
14-CH-05
14-CH-04
14-CH-0314-CH-02
14-CH-01
DMMU-2b
DMMU-1
DMMU-2a
I- 490
Inde
pend
ence
Rd
W 3
rd S
t
Quigl
ey R
d
W 7th St
W 5th St
Clark Ave
Dille Ave
Rockefeller AveState Rte 14
State Rte 43
N Clark Ave
Eggers Ave
W 6th Pl
W 6th St
E 37 St
W 4th St
Scotham Ave
Mary Ave
E 33rd St
E 34th St
Houston Ave
St O
lga
Ave
Leedy Ct
W 5th S
t
I- 490
Document Path: Z:\Branch_Folders\Environmental\Misc_Projects\HarborEnvironmental\Cleveland\2015\141015_2014SedSamp.mxd
FIGURE A1
DREDGED MATERIAL MANAGEMENT UNITS AND SAMPLINGSITES FOR 2014 ANALYSES OF UPPER CUYAHOGA RIVER
CHANNEL SEDIMENTS
CLEVELAND, OHIODocument Name: 141015_2014SedSamp.mxdDrawn By: H5TDESPMDate Saved: 06 Nov 2015Time Saved: 7:42:11 AM
³
0 500 1,000250Feet
Legend
&% Sediment Sample Location
Federal Navigation Channel
Dredged Material Management Unit

U.S. ARMY ENGINEER DISTRICTCORPS OF ENGINEERSBUFFALO, NY
&% &%
&%
&%
&%&% &% &% &%
&%
&%
&%
&%
&%
&%
&%&%
&%&%
&%
&%&%
&%
&%
&%14-CLAM-5
14-CLAM-4
14-CLAM-3
14-CLAM-2 14-CLAM-1
14-CLA7-5
14-CLA7-4
14-CLA7-3
14-CLA7-214-CLA7-1
14-CLA4-5
14-CLA4-4
14-CLA4-3
14-CLA4-2
14-CLA4-1
14-CLA1-5
14-CLA1-4
14-CLA1-3
14-CLA1-214-CLA1-1
14-CLA14-5
14-CLA14-414-CLA14-3
14-CLA14-2
14-CLA14-1
Lake Erie
Document Path: Z:\Branch_Folders\Environmental\Misc_Projects\HarborEnvironmental\Cleveland\2015\141015_2014CLASamp.mxd
FIGURE A2
SAMPLING SITES FOR 2014 ANALYSES OF SEDIMENTS AT PROPOSED-OPEN LAKE PLACEMENT AREA CLA-1, AND OTHER
LAKE AREAS AND SITES OFFSHORE OF CLEVELAND
CLEVELAND, OHIODocument Name: 141015_2014CLASamp.mxdDrawn By: H5TDESPMDate Saved: 06 Nov 2015Time Saved: 8:51:09 AM
Source: NOAA / NOS / Office of Coast Survey
0 1 20.5Miles
³
Legend
&% Sediment Sample Location
Federal Navigation Channel

U.S. ARMY ENGINEER DISTRICTCORPS OF ENGINEERSBUFFALO, NY
&%
&%
&%
&%
&%
&%
&%
&%
&%
&%
&%
&%
&%
&%
&%
&%
&%
&%
&%14-LE-25
14-LE-24
14-LE-23
14-LE-22
14-LE-21
14-LE-20
14-LE-19
14-LE-16
14-LE-14
14-LE-13
14-LE-12
14-LE-11
14-LE-10
14-LE-07
14-LE-06
14-LE-04
14-LE-03
14-LE-02
14-LE-01
Lake Erie
Document Path: Z:\Branch_Folders\Environmental\Misc_Projects\HarborEnvironmental\Cleveland\2015\141015_2014LakeSamp.mxd
FIGURE A3
SAMPLING SITES FOR 2014 ANALYSES OF REGIONAL LAKE ERIESEDIMENTS OFFSHORE OF CLEVELAND
CLEVELAND, OHIODocument Name: 141015_2014LakeSamp.mxdDrawn By: H5TDESPMDate Saved: 16 Oct 2015Time Saved: 11:24:16 AM
Source: NOAA / NOS / Office of Coast Survey
0 1 20.5Miles
³
Legend
&% Sediment Sample Location
Federal Navigation Channel

U.S. ARMY ENGINEER DISTRICTCORPS OF ENGINEERSBUFFALO, NY
&% &% &% &%&%
&%
&%
&%
&%
&%
&%
&%
&%
&%
&%
&*
&*
&*
&*
&*
&*15-CH-15
15-CH-14
15-CH-13
15-CH-12
15-CH-11
15-CH-10
15-CH-09
15-CH-08
15-CH-07
15-CH-06
15-CH-0515-CH-04
15-CH-03
15-CH-02
15-CH-01
DMMU-2b
DMMU-1
DMMU-2a
Document Path: Z:\Branch_Folders\Environmental\Misc_Projects\HarborEnvironmental\Cleveland\2015\141015_2015SedSamp_1.mxd
FIGURE A4
DREDGED MATERIAL MANAGEMENT UNITS AND SAMPLINGSITES FOR 2015 ANALYSES OF UPPER CUYAHOGA RIVER
CHANNEL SEDIMENTS
CLEVELAND, OHIODocument Name: 141015_2015SedSamp_1.mxdDrawn By: H5TDESPMDate Saved: 06 Nov 2015Time Saved: 8:59:18 AM
³
0 500 1,000250Feet
Legend
&* Sediment Core Sample Location
&% Sediment Sample Location
Federal Navigation Channel
Dredged Material Management Unit

&%
&%&%
&%
&%
&%
&%&%
&% &% 15-CLA4-515-CLA4-4
15-CLA4-3 15-CLA4-2
15-CLA4-1
15-CLA1-5
15-CLA1-4
15-CLA1-315-CLA1-2
15-CLA1-1
U.S. ARMY ENGINEER DISTRICTCORPS OF ENGINEERSBUFFALO, NY
Document Path: Z:\Branch_Folders\Environmental\Misc_Projects\HarborEnvironmental\Cleveland\2015\141015_2015LakeSamp.mxd
FIGURE A5
SAMPLING SITES FOR 2015 ANALYSES OF SEDIMENTS AT PROPOSED OPEN LAKE PLACEMENT AREA CLA-1 AND OTHER
LAKE AREAS OFFSHORE OF CLEVELAND
CLEVELAND, OHIODocument Name: 141015_2015LakeSamp.mxdDrawn By: H5TDESPMDate Saved: 16 Oct 2015Time Saved: 11:35:27 AM
Source: NOAA / NOS / Office of Coast Survey
0 1 20.5Miles
³
Legend
&% Sediment Sample Location
Federal Navigation Channel

U.S. ARMY ENGINEER DISTRICTCORPS OF ENGINEERSBUFFALO, NY
&%
&%
&%
&%
&%
&%&%
&%
&%
DMMU-2b
DMMU-1
DMMU-2a
E-13-10-F01A21E-13-10-200016
E-13-10-F01W50
E-13-10-F01S08
E-13-10-302580
E-13-10-F01A41
E-13-10-302578
E-13-10-200013
E-13-10-302581
Document Path: Z:\Branch_Folders\Environmental\Misc_Projects\HarborEnvironmental\Cleveland\2016\250116_OEPA1013.mxd
FIGURE A6
DREDGED MATERIAL MANAGEMENT UNITS AND SAMPLINGSITES FOR OCTOBER 2013 OEPA ANALYSES OF UPPER CUYAHOGA RIVER
CHANNEL SEDIMENTS
CLEVELAND, OHIODocument Name: 250116_OEPA1013.mxdDrawn By: H5TDESPMDate Saved: 25 Jan 2016Time Saved: 1:59:13 PM
³
0 500 1,000250Feet
Legend
&* Sediment Core Sample Location
&% Sediment Sample Location
Federal Navigation Channel
Dredged Material Management Unit
Area Not Maintained

U.S. ARMY ENGINEER DISTRICTCORPS OF ENGINEERSBUFFALO, NY
&*
&*
&*
&*
&*
&*
&*&*
&*&*
&*&*
DMMU-2b
DMMU-1
DMMU-2a
E-14-04-F01A21
E-14-04-200016E-14-04-F01A42
E-14-04-302582 E-14-04-F01W50
E-14-04-302581
E-14-04-F01S08
E-14-04-302580
E-14-04-F01A41
E-14-04-302579
E-14-04-302578
E-14-04-200013
Document Path: Z:\Branch_Folders\Environmental\Misc_Projects\HarborEnvironmental\Cleveland\2016\250116_OEPA0414.mxd
FIGURE A7
DREDGED MATERIAL MANAGEMENT UNITS AND SAMPLINGSITES FOR APRIL 2014 OEPA ANALYSES OF UPPER CUYAHOGA RIVER
CHANNEL SEDIMENTS
CLEVELAND, OHIODocument Name: 250116_OEPA0414.mxdDrawn By: H5TDESPMDate Saved: 17 Feb 2016Time Saved: 11:06:33 AM
³
0 500 1,000250Feet
Legend
&* Sediment Core Sample Location
&% Sediment Sample Location
Federal Navigation Channel
Dredged Material Management Unit
Area Not Maintained

&%
&%
&%
&%
&%
&%
&%
&%
&%
&%
&%
&%
!<
!<
!<
!<
!<
!<
T'
D
I
E'C'F'
J
BA
H'
U
A' B'
C
D'
EF
G'
GH
I'
J'
QQ'
T
U'
K
K'
L'
LM'
M
N'
N
O'O
P'P
R'R
S'S
DISCLAIMER - While the United States Army Corps of Engineers,(hereinafter referred to USACE) has made a reasonable effort to insure the accuracy of the maps and associated data, its should beexplicitly noted that USACE makes no warranty, representation orguaranty, either express or implied, as to the content, sequence,accuracy, timeliness or completeness of any of the data providedherein. The USACE, its officers, agents, employees, or servantsshall assume no liability of any nature for any errors, omissions, orinaccuracies in the information provided regardless of how caused.The USACE, its officers, agents, employees or servants shallassume no liability for any decisions made or actions taken or nottaken by the user of the maps and associated data in relianceupon any information or data furnished here. By using these mapsand associated data the user does so entirely at their own risk andexplicitly acknowledges that he/she is aware of and agrees to bebound by this disclaimer and agrees not to present any claim ordemand of any nature against the USACE, its officers, agents,employees or servants in any forum whatsoever for any damagesof any nature whatsoever that may result from or may be caused inany way by the use of the maps and associated data.
STUDY AREA
Document Name: CrossSection_Layout.mxdDrawn By: H5TDESPMDate Saved: 08 Jan 2016Time Saved: 8:54:07 PM
U P P E R C U Y A H O G A R I V E R C H A N N E L - C L E V E L A N D , O H I OU P P E R C U Y A H O G A R I V E R C H A N N E L - C L E V E L A N D , O H I OC R O S S S E C T I O N S F O R O E P A S A M P L E L O C A T I O N SC R O S S S E C T I O N S F O R O E P A S A M P L E L O C A T I O N S
( O C T O B E R 2 0 1 3 - M A Y 2 0 1 5 )( O C T O B E R 2 0 1 3 - M A Y 2 0 1 5 )
A A'
Legend!< Ponar Grab Composite Sample
Ponar Grab Discrete Sample
&% Vibro-Core Sample Location
Cross Section Location
Navigation Channel
0 800400Feet
±
NOTE: Dredge limit depths include advancemaintenance and 1 foot of overdepth and1 on 2 sideslopes.
E-15
-04-
3025
80
100
530
540
550
560
570
E-14
-04-
F01W
50
E-13
-10-
F01W
50
E-14
-08-
F01W
50
0 100 200 300
530
540
550
560
570
E-14
-10-
2000
16
E-14
-04-
2000
16
E-14
-04-
F01A
21
E-14
-05-
2000
13
E-14
-10-
F01A
21
100 200
530
540
550
560
570
E-14
-08-
3025
81
E-14
-04-
F01S
08
100
530
540
550
560
570
E-14
-10 -
F01A
42
E-14
-04-
3025
82
E-14
-05-
F01W
50
E-14
-04-
F01A
42
0 100 200 300
530
540
550
560
570
E-14
-10-
3025
80
E-14
-08-
3025
80
E-13
-10-
F01A
41
0 100
530
540
550
560
570
E-13
-10-
3025
81
100520
530
540
550
560
570
580
E-13
-10-
2000
16
E-14
-08-
2000
13
0 100 200
530
540
550
560
570
E-14
-05-
F01A
42
E-14
-10-
2000
13
E-13
-10-
2000
13
0 100 200
530
540
550
560
570
E-13
-10-
3025
80
100
530
540
550
560
570
E-14
-04-
F01A
41
E-14
-05-
3025
80
100 200
530
540
550
560
570
E-14
-10-
3025
81
0 100
530
540
550
560
570
E-15
-04-
2000
13
E-14
-04-
2000
13
100 200
530
540
550
560
570
E-14
-04-
3025
80
100
530
540
550
560
570
E-14
-05 -
3 025
79
E-14
-08-
3025
79
100 200
530
540
550
560
570
E-14
-04-
3025
81
100
530
540
550
560
570
E-13
-10-
F01S
08
E-14
-05-
F01S
08
E-14
-08-
F015
08
100 200
530
540
550
560
570
E-14
-04-
3025
78
E-13
-10-
3025
78
E-14
-08-
3025
78
E-14
-10-
3025
78
100 200 300 400 500 600 700 800 900 1000
530
540
550
560
570
580
E-14
-10 -
F01W
5 0
E-15
-04-
F01W
50
100 200
530
540
550
560
570
E-14
-08-
F01A
21
E-14
-05-
F01A
21
E-13
-10-
F01A
21
100 200
530
540
550
560
570
E-14
-10-
F01S
08
0 100
530
540
550
560
570
B B'
C C'
D D'
E E'
F F'
G G'
H H'
I I'
J J'
K K'
L L'
M M'
N N'
O O'
P P'
Q Q'
R R'
S S'
U U'
T T'
Cross Section Legend(The cross sections were drawn at 2X verticalexaggeration.)
Assumed Top of Core
Assumed Bottom of Core
10' Core Length
Water Depth at Time of Sample
Channel Dredging Limits
Mean Lake Elevation on 10/03/13
Mean Lake Elevation on 04/24/14
Mean Lake Elevation on 05/05/14
Mean Lake Elevation on 08/14/14
Mean Lake Elevation on 10/29/14
Mean Lake Elevation on 04/30/15
FIGURE A8

U.S. ARMY ENGINEER DISTRICTCORPS OF ENGINEERSBUFFALO, NY
&%
&%
&%
&%
&%
&%&%
&%&%
DMMU-2b
DMMU-1
DMMU-2a
E-14-05-F01A21
E-14-05-200013
E-14-05-302581
E-14-05-F01S08
E-14-05-302578
E-14-05-F01A42
E-14-05-F01W50
E-14-05-302580
E-14-05-302579
Document Path: Z:\Branch_Folders\Environmental\Misc_Projects\HarborEnvironmental\Cleveland\2016\250116_OEPA0514.mxd
FIGURE A9
DREDGED MATERIAL MANAGEMENT UNITS AND SAMPLINGSITES FOR MAY 2014 OEPA ANALYSES OF UPPER CUYAHOGA RIVER
CHANNEL SEDIMENTS
CLEVELAND, OHIODocument Name: 250116_OEPA0514.mxdDrawn By: H5TDESPMDate Saved: 17 Feb 2016Time Saved: 11:08:03 AM
³
0 500 1,000250Feet
Legend
&* Sediment Core Sample Location
&% Sediment Sample Location
Federal Navigation Channel
Dredged Material Management Unit
Area Not Maintained

U.S. ARMY ENGINEER DISTRICTCORPS OF ENGINEERSBUFFALO, NY
&%
&%
&%
&%
&%
&%
&%&%
&%
DMMU-2b
DMMU-1
DMMU-2a
E-14-08-F01A21
E-14-08-200013
E-14-08-F01A42
E-14-08-F01W50
E-14-08-302580
E-14-08-302578
E-14-08-302579
E-14-08-302581
E-14-08-F01508
Document Path: Z:\Branch_Folders\Environmental\Misc_Projects\HarborEnvironmental\Cleveland\2016\250116_OEPA0814.mxd
FIGURE A10
DREDGED MATERIAL MANAGEMENT UNITS AND SAMPLINGSITES FOR AUGUST 2014 OEPA ANALYSES OF UPPER CUYAHOGA RIVER
CHANNEL SEDIMENTS
CLEVELAND, OHIODocument Name: 250116_OEPA0814.mxdDrawn By: H5TDESPMDate Saved: 17 Feb 2016Time Saved: 11:09:45 AM
³
0 500 1,000250Feet
Legend
&* Sediment Core Sample Location
&% Sediment Sample Location
Federal Navigation Channel
Dredged Material Management Unit
Area Not Maintained

U.S. ARMY ENGINEER DISTRICTCORPS OF ENGINEERSBUFFALO, NY
&%
&%
&%
&%
&%
&%
&%&%&%&%
E-14-10-F01A21
E-14-10-200016
E-14-10-F01S08
E-14-10-302580
E-14-10-302578
E-14-10-302579
E-14-10-200013 E-14-10-F01A42
E-14-10-F01W50
E-14-10-302581
Document Path: Z:\Branch_Folders\Environmental\Misc_Projects\HarborEnvironmental\Cleveland\2016\250116_OEPA1014.mxd
FIGURE A11
DREDGED MATERIAL MANAGEMENT UNITS AND SAMPLINGSITES FOR OCTOBER 2014 OEPA ANALYSES OF UPPER CUYAHOGA RIVER
CHANNEL SEDIMENTS
CLEVELAND, OHIODocument Name: 250116_OEPA1014.mxdDrawn By: H5TDESPMDate Saved: 17 Feb 2016Time Saved: 11:12:14 AM
³
0 500 1,000250Feet
Legend
&* Sediment Core Sample Location
&% Sediment Sample Location
Federal Navigation Channel
Dredged Material Management Unit
Area Not Maintained
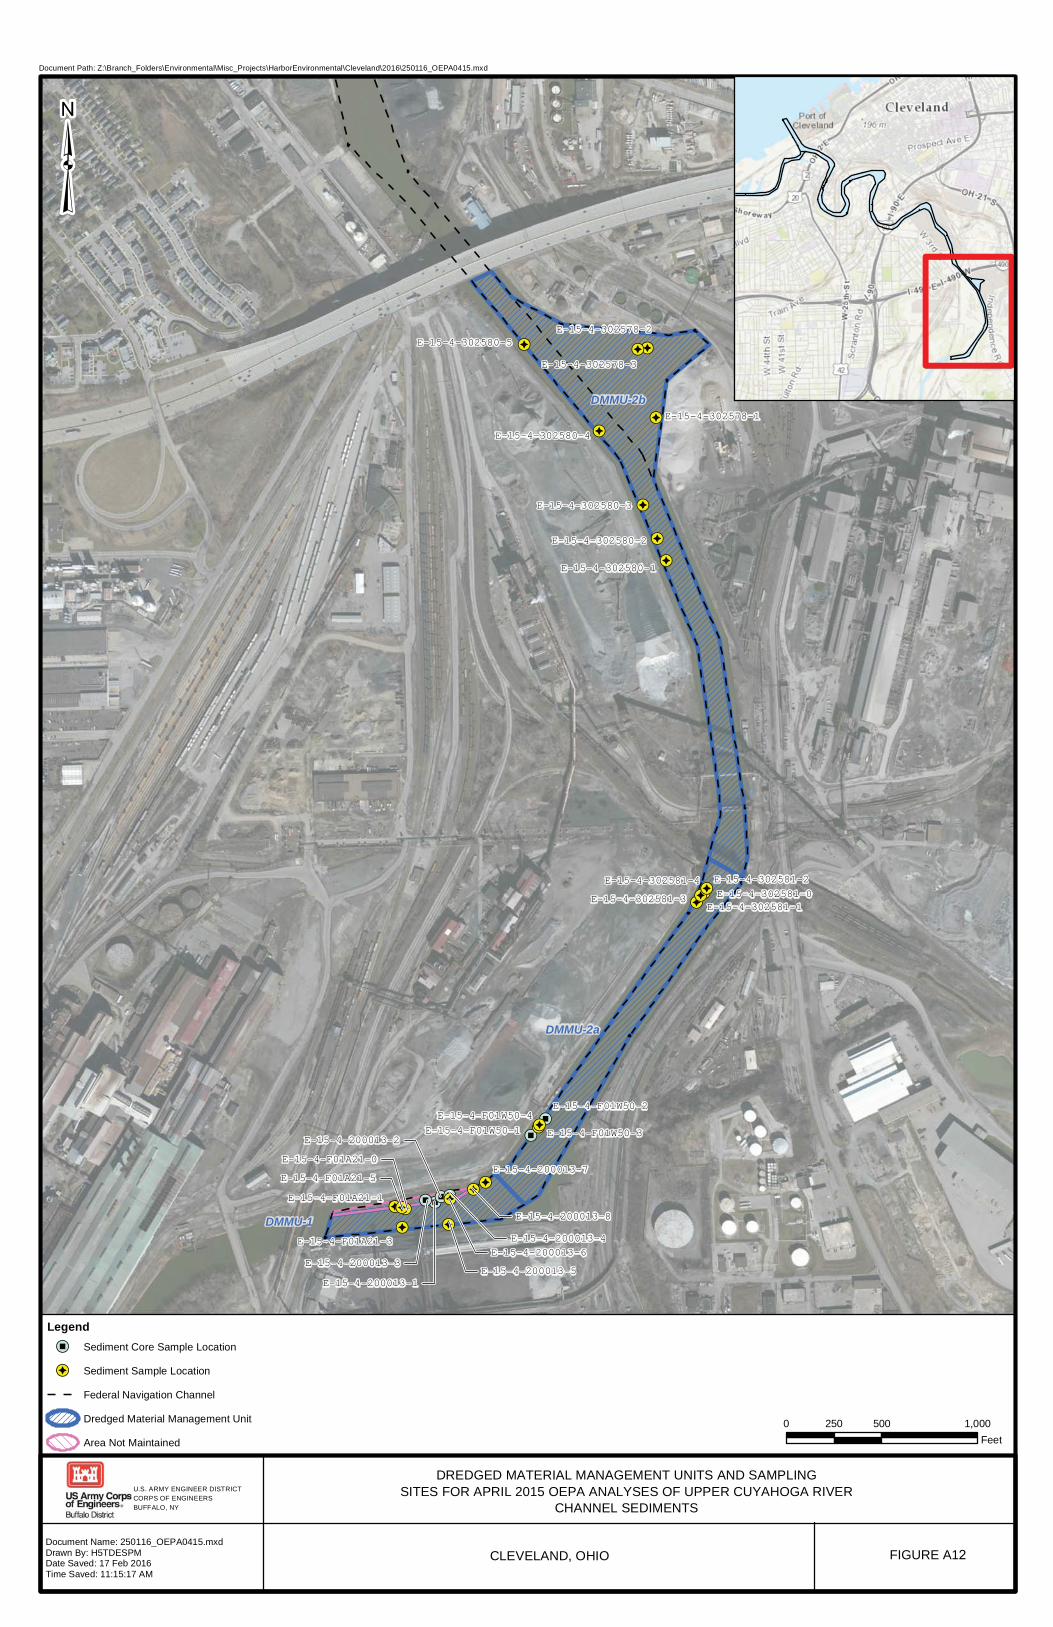
U.S. ARMY ENGINEER DISTRICTCORPS OF ENGINEERSBUFFALO, NY
&%
&%&%
&%&%&%&%&%
&*&*&%&%
&*&*&* &*
&%
&%&%&%
&%&%
&%
&%
&%
&%
&%
&%
&%
DMMU-2b
DMMU-1
DMMU-2a
E-15-4-302580-5
E-15-4-302580-4
E-15-4-302580-3
E-15-4-302580-2
E-15-4-302580-1
E-15-4-F01A21-5
E-15-4-F01A21-3
E-15-4-F01A21-1E-15-4-200013-8
E-15-4-F01W50-4E-15-4-F01W50-3
E-15-4-302581-4E-15-4-302581-3
E-15-4-302578-3
E-15-4-302578-1
E-15-4-F01A21-0E-15-4-200013-7
E-15-4-200013-6E-15-4-200013-5
E-15-4-200013-4
E-15-4-200013-3
E-15-4-200013-2
E-15-4-200013-1
E-15-4-F01W50-2
E-15-4-F01W50-1
E-15-4-302581-0E-15-4-302581-2
E-15-4-302581-1
E-15-4-302578-2
Document Path: Z:\Branch_Folders\Environmental\Misc_Projects\HarborEnvironmental\Cleveland\2016\250116_OEPA0415.mxd
FIGURE A12
DREDGED MATERIAL MANAGEMENT UNITS AND SAMPLINGSITES FOR APRIL 2015 OEPA ANALYSES OF UPPER CUYAHOGA RIVER
CHANNEL SEDIMENTS
CLEVELAND, OHIODocument Name: 250116_OEPA0415.mxdDrawn By: H5TDESPMDate Saved: 17 Feb 2016Time Saved: 11:15:17 AM
³
0 500 1,000250Feet
Legend
&* Sediment Core Sample Location
&% Sediment Sample Location
Federal Navigation Channel
Dredged Material Management Unit
Area Not Maintained

U.S. ARMY ENGINEER DISTRICTCORPS OF ENGINEERSBUFFALO, NY
&*
&*
&*
&*
&* &*E-15-10-200013E-15-10-F01A21
E-15-10-F01W50
E-15-10-302581
E-15-10-302580
E-15-10-302578
Document Path: Z:\Branch_Folders\Environmental\Misc_Projects\HarborEnvironmental\Cleveland\2016\250116_OEPA1015.mxd
FIGURE A13
DREDGED MATERIAL MANAGEMENT UNITS AND SAMPLINGSITES FOR OCTOBER 2015 OEPA ANALYSES OF UPPER CUYAHOGA RIVER
CHANNEL SEDIMENTS
CLEVELAND, OHIODocument Name: 250116_OEPA1015.mxdDrawn By: H5TDESPMDate Saved: 17 Feb 2016Time Saved: 11:17:28 AM
³
0 500 1,000250Feet
Legend
&* Sediment Core/Grab Sample Location
Federal Navigation Channel
Dredged Material Management Unit
Area Not Maintained

&*
&*
&* &* &* &* &*
&*
&%
&%
&%
&%
&%
&%
&%
&%
&%
&%
E-15-LE-9
E-15-LE-8
E-15-LE-7
E-15-LE-6
E-15-LE-4
E-15-LE-3
E-15-LE-2
E-15-LE-1
E-15-LE-11
E-15-LE-10
E-15-CLA1-0
E-15-CLA1-1S
E-15-CLA1-2N
E-15-CLA1-1N
E-15-CLA1-1.5E
E-15-CLA1-0.5E
E-15-CLA1-0.5W
E-15-CLA1-1.5W
Lake Erie
U.S. ARMY ENGINEER DISTRICTCORPS OF ENGINEERSBUFFALO, NY
Document Path: Z:\Branch_Folders\Environmental\Misc_Projects\HarborEnvironmental\Cleveland\2016\141015_2015LakeSamp.mxd
FIGURE A14
SAMPLING SITES FOR 2015 OEPA ANALYSES OF REGIONAL LAKE ERIESEDIMENTS OFFSHORE OF CLEVELAND
CLEVELAND, OHIODocument Name: 141015_2015LakeSamp.mxdDrawn By: H5TDESPMDate Saved: 19 Feb 2016Time Saved: 10:24:56 AM
Source: NOAA / NOS / Office of Coast Survey
0 1 20.5Miles
³
Legend
&* Sediment Core Sample Location
&% Sediment Grab Sample Location
Federal Navigation Channel

APPENDIX B
TABLES


CH-1 CH-2 CH-3 CH-4 CH-5 DMMU-1 Comp CH-6 CH-7 CH-8 CH-9 CH-10 DMMU-2a Comp CH-11 CH-12 CH-13 CH-14 CH-15 DMMU-2b Comp
CLAY 2 1.2 16.3 12.6 12 7.3 3.4 22.4 27.3 27.3 24.8 25.3 17.8 26.4 27.8 40.2 28.6 24.3
SILT 5.5 3 27.9 24.2 15.7 11.9 42.1 44.4 59.5 60.9 60.2 52.2 35.3 68.1 66 58.2 68.5 60.5
FINE SAND 6 15.4 44 60.2 67.4 25.3 50.5 32 12.4 10.7 13.6 21 45 4.8 5.5 1.4 2.6 14.1
COARSE SAND 36.7 21.2 0.7 0.2 0.3 17.6 1 0.1 0 0.1 0.1 0.3 0.2 0.1 0 0 0 0
MEDIUM SAND 23.1 45.7 10.9 2.8 3.6 21.9 2.4 1.1 0.4 0.7 1 1.1 1.5 0.4 0.4 0.1 0.2 0.7
FINE GRAVEL 24.7 13.6 0.2 0 0 15.2 0 0 0 0 0 0 0 0 0 0 0 0
COARSE GRAVEL 2 0 0 0 0.9 0.8 0 0 0 0 0 0 0 0 0 0 0 0
TOTAL CLAYS/SILTS 7.5 4.2 44.2 36.8 27.7 19.2 45.5 66.8 86.8 88.2 85 77.5 53.1 94.5 93.8 98.4 97.1 84.8TOTAL SANDS/GRAVELS 92.5 95.9 55.8 63.2 72.2 80.8 53.9 33.2 12.8 11.5 14.7 22.4 46.7 5.3 5.9 1.5 2.8 14.8
CLA1-1 CLA1-2 CLA1-3 CLA1-4 CLA1-5 CLA-1 Comp CLA14-1 CLA14-2 CLA14-3 CLA14-4 CLA14-5 CLA-14 Comp CLA4-1 CLA4-2 CLA4-3 CLA4-4 CLA4-5 CLA-4 Comp
CLAY 74.8 70.8 60.5 70.1 41.2 51.2 43.4 43.5 46.3 31.1 24 35.2 72.3 70.3 65 67.5 73.3 69.6
SILT 23.6 28.2 29.9 28.9 45.9 39.4 22.6 17.1 20.3 37.6 20.6 26.5 27.1 29.2 23.2 29.7 25.8 27.2
FINE SAND 1.2 0.8 8.1 0.6 9.2 5.9 26.9 26.3 24.1 15.1 40.6 27.9 0.4 0.3 6.3 1.4 0.5 1.6
COARSE SAND 0 0 0.1 0 0.5 0.3 0.3 0.7 0.9 2 1.7 1.5 0.1 0 0.3 0 0.1 0.3
MEDIUM SAND 0.2 0.1 1.5 0.4 1.8 3.1 6.5 11.9 7.6 7.2 12.4 8.4 0.2 0.1 5.1 1.4 0.3 1.4
FINE GRAVEL 0 0 0 0 1.4 0 0.2 0.5 0.7 4.6 0.7 0.6 0 0 0.1 0 0 0
COARSE GRAVEL 0 0 0 0 0 0 0 0 0 2.4 0 0 0 0 0 0 0 0
TOTAL CLAYS/SILTS 98.4 99 90.4 99 87.1 90.6 66 60.6 66.6 68.7 44.6 61.7 99.4 99.5 88.2 97.2 99.1 96.8TOTAL SANDS/GRAVELS 1.4 0.9 9.7 1 12.9 9.3 33.9 39.4 33.3 31.3 55.4 38.4 0.7 0.4 11.8 2.8 0.9 3.3
CLA7-1 CLA7-2 CLA7-3 CLA7-4 CLA7-5 CLA-7 Comp CLAM-1 CLAM-2 CLAM-3 CLAM-4 CLAM-5
CLAY 62.3 77.5 77.8 69.5 68.4 73.6 66.4 67.2 11.9 75.7 71.7
SILT 36.9 22.1 21.2 27.4 29.1 24.6 32.3 30.9 7.6 23 25.1
FINE SAND 0.3 0.3 0.8 2.5 1.7 1.2 0.9 1.5 56.3 0.5 2.5
COARSE SAND 0 0 0 0 0 0 0 0 9.9 0 0.1
MEDIUM SAND 0.2 0.1 0.1 0.6 0.8 0.5 0.3 0.4 10.7 0.7 0.7
FINE GRAVEL 0 0 0 0 0 0 0 0 3.6 0 0
COARSE GRAVEL 0 0 0 0 0 0 0 0 0 0 0
TOTAL CLAYS/SILTS 99.2 99.6 99 96.9 97.5 98.2 98.7 98.1 19.5 98.7 96.8TOTAL SANDS/GRAVELS 0.5 0.4 0.9 3.1 2.5 1.7 1.2 1.9 80.5 1.2 3.3
TABLE B1: Bulk grain size distribution on Cleveland Harbor Upper Cuyahoga River Channel and Lake Erie sediments (RTI 2014a)
DMMU-1 DMMU-2a DMMU-2bPARTICLE SIZE (%)
UPPER RIVER CHANNEL
PARTICLE SIZE (%)
LAKE AREA
PARTICLE SIZE (%)
LAKE AREA
CLA-1 CLA-14 CLA-4
CLA-7 CLAM

LE-1 LE-2 LE-3 LE-4 LE-6 LE-7 LE-10 LE-11 LE-12 LE-13 LE-14 LE-16 LE-19 LE-20 LE-21 LE-22 LE-23 LE-24 LE-25
CLAY 11.8 38.9 8.9 45.8 1.6 6.7 22.7 4.1 45.2 7.3 3.5 17.9 62.5 34.8 36 45.8 51.7 36.4 34.3
SILT 10.1 33.9 7.7 13.1 0.2 3.9 58.7 1.1 17.7 3.6 2.3 24.3 24.5 15.8 14.8 21 22.3 15.7 20.6
FINE SAND 77.2 7.9 39.9 30.3 12.4 16.3 12.3 10.1 11.5 41 15.1 39.9 3.4 13.2 14.7 7.3 6.2 16.1 13.9
MEDIUM SAND 0.7 12.3 20.2 7.2 65.6 57.9 5.7 69.6 24 33.9 40.4 14.9 9.3 33.5 32.2 24.6 18.9 30.1 29.5
COARSE SAND 0.1 1.6 7.7 0.8 13.1 10.1 0 8.6 1.5 9.3 19.1 1.4 0.3 2.6 2.3 1.3 0.9 1.6 1.6
FINE GRAVEL 0 5.3 14.6 2.9 7.2 5.1 0 1.8 0 3.3 15.4 1.6 0 0 0 0 0 0 0
COARSE GRAVEL 0 0 0.9 0 0 0 0 4.6 0 1.6 4.2 0 0 0 0 0 0 0 0
TOTAL CLAYS/SILTS 21.9 72.8 16.6 58.9 1.8 10.6 81.4 5.2 62.9 10.9 5.8 42.2 87 50.6 50.8 66.8 74 52.1 54.9
TOTAL SANDS/GRAVELS 78 27.1 83.3 41.2 98.3 89.4 18 94.7 37 89.1 94.2 57.8 13 49.3 49.2 33.2 26 47.8 45
TABLE B2: Bulk grain size distribution of lake sediment samples offshore of Cleveland (RTI 2014b)
PARTICLE SIZE (%)LAKE SITE

CH-1 CH-2 CH-3 CH-4 CH-5 DMMU-1 Comp CH-6 CH-7 CH-8 CH-9 CH-10 DMMU-2a Comp CH-11 CH-12 CH-13 CH-14 CH-15 DMMU-2b Comp
TOC (%) 0.94 0.72 1.80 1.10 1.50 1.20 2.80 1.80 1.80 2.10 1.90 2.00 2.00 1.60 1.50 1.70 1.40 1.70PERCENT MOISTURE 20 17 41 35 41 29 41 40 44 45 43 42 36 41 37 47 37 40
CLA1-1 CLA1-2 CLA1-3 CLA1-4 CLA1-5 CLA-1 Comp CLA14-1 CLA14-2 CLA14-3 CLA14-4 CLA14-5 CLA-14 Comp CLA4-1 CLA4-2 CLA4-3 CLA4-4 CLA4-5 CLA-4 Comp
TOC (%) 2.90 2.80 2.80 2.60 3.40 3.60 2.40 2.40 2.70 6.70 3.00 3.00 2.60 2.50 2.40 2.50 2.60 2.70PERCENT MOISTURE 73 70 68 71 49 65 63 66 60 39 48 56 72 73 72 72 73 72
CLA7-1 CLA7-2 CLA7-3 CLA7-4 CLA7-5 CLA-7 Comp CLAM-1 CLAM-2 CLAM-3 CLAM-4 CLAM-5
TOC (%) 2.60 2.60 2.80 3.10 3.00 2.80 2.70 2.80 4.40 0.46 2.80PERCENT MOISTURE 75 74 74 75 74 74 72 72 32 75 74
PARAMETER
LAKE AREA
PARAMETER
UPPER RIVER CHANNEL
PARAMETER
LAKE AREA
CLA-7 CLAM
TABLE B3: Bulk total organic carbon (TOC) and moisture data on Cleveland Harbor Upper Cuyahoga River Channel and Lake Erie sediments (RTI 2014a)
DMMU-1 DMMU-2a DMMU-2b
CLA-1 CLA-14 CLA-4

LE-1 LE-2 LE-3 LE-4 LE-6 LE-7 LE-10 LE-11 LE-12 LE-13 LE-14 LE-16 LE-19 LE-20 LE-21 LE-22 LE-23 LE-24 LE-25
TOC (%) 0.36 2.4 3.1 0.4 0.41 0.44 1.6 0.19 2.2 0.29 1.4 4.3 2.76 2.7 2.7 3 3.1 2.7 3.3
PHOSPHORUS, TOTAL (mg/kg) 120 230 730 98 44 110 280 59 370 100 180 500 400 380 450 460 430 480 550
PERCENT MOISTURE 77.2 31 52 19 26 20 36 44 28 74 43 46 75 72 76 76 76 76 78
TABLE B4: Bulk total phosphorus, total organic carbon (TOC) and percent moisture data on Lake Erie sediments offshore of Cleveland (RTI 2014b)
PARAMETERLAKE SITE

CH-1 CH-2 CH-3 CH-4 CH-5 DMMU-1 Comp CH-6 CH-7 CH-8 CH-9 CH-10 DMMU-2a Comp CH-11 CH-12 CH-13 CH-14 CH-15 DMMU-2b Comp
TOTAL PCBs (µg/kg) 38 32 77 85 75 68 80 110 90 119 80 102 300 102 83 70 82 144
TOC (%) 0.94 0.72 1.80 1.10 1.50 1.20 2.80 1.80 1.80 2.10 1.90 2.00 2.00 1.60 1.50 1.70 1.40 1.70TOC-NORMALIZED CONCENTRATION (µg/kg-TOC) 3989 4375 4250 7736 4993 5658 2854 6111 5006 5667 4211 5100 15000 6375 5533 4094 5864 8471
CLA1-1 CLA1-2 CLA1-3 CLA1-4 CLA1-5 CLA-1 Comp CLA14-1 CLA14-2 CLA14-3 CLA14-4 CLA14-5 CLA-14 Comp CLA4-1 CLA4-2 CLA4-3 CLA4-4 CLA4-5 CLA-4 Comp
TOTAL PCBs (µg/kg) 236 116 169 104 1,450 1,240 52 100 82 156 291 179 109 75 102 77 89 117
TOC (%) 2.90 2.80 2.80 2.60 3.40 3.60 2.40 2.40 2.70 6.70 3.00 3.00 2.60 2.50 2.40 2.50 2.60 2.70TOC-NORMALIZED CONCENTRATION (µg/kg-TOC) 8138 4143 6036 4000 42647 34444 2158 4167 3030 2328 9700 5967 4192 2984 4250 3080 3431 4333
CLA7-1 CLA7-2 CLA7-3 CLA7-4 CLA7-5 CLA-7 Comp CLAM-1 CLAM-2 CLAM-3 CLAM-4 CLAM-5
TOTAL PCBs (µg/kg) 103 123 109 131 121 110 136 262 10.9 109 155
TOC (%) 2.60 2.60 2.80 3.10 3.00 2.80 2.70 2.80 4.40 0.46 2.80TOC-NORMALIZED CONCENTRATION (µg/kg-TOC) 3962 4731 3893 4226 4033 3929 5037 9357 248 23696 5536
PARAMETER
LAKE AREA
CLA-7 CLAM
DMMU-2b
PARAMETER
LAKE AREA
CLA-1 CLA-14 CLA-4
TABLE B5: Bulk total PCB data (sum of congeners) on Cleveland Harbor Upper Cuyahoga River Channel and Lake Erie sediments (RTI 2014a)
PARAMETER
UPPER RIVER CHANNEL
DMMU-1 DMMU-2a

LE-1 LE-2 LE-3 LE-4 LE-6 LE-7 LE-10 LE-11 LE-12 LE-13 LE-14 LE-16 LE-19 LE-20 LE-21 LE-22 LE-23 LE-24 LE-25
TOTAL PCBs (µg/kg) 28.6 105 5,880 57.7 38.6 27.7 400 9.36 101 15.8 38.4 968 100 92 111 117 109 60.2 152
TOC (%) 0.36 2.4 3.1 0.4 0.41 0.44 1.6 0.19 2.2 0.29 1.4 4.3 2.76 2.7 2.7 3 3.1 2.7 3.3TOC-NORMALIZED CONCENTRATION (µg/kg-TOC) 7944 4375 189677 14425 9415 6295 25000 4926 4591 5448 2743 22512 3623 3407 4111 3900 3516 2230 4606
TABLE B6: Bulk total PCB data (sum of congeners) on Lake Erie sediments offshore of Cleveland (RTI 2014b)
PARAMETERLAKE SITE

CH-1 CH-2 CH-3 CH-4 CH-5 CH-6 CH-7 CH-8 CH-9 CH-10 CH-11 CH-12 CH-13 CH-14 CH-15
2-METHYLNAPHTHALENE 20 17 16 13 17 17 23 21 30 66 28 25 18 19 26
ACENAPHTHENE 8.6 34 19 23 25 28 28 24 36 110 54 22 21 47 U1 21
ACENAPHTHYLENE 5.3 8.4 41 U 18 14 33 26 18 21 23 31 17 18 16 16
ANTHRACENE 20 250 49 76 72 140 110 71 110 120 220 62 73 43 60
BENZO(A)ANTHRACENE 72 1200 240 310 330 520 490 370 570 480 740 300 360 250 330
BENZO(A)PYRENE 82 1200 250 330 350 540 560 410 600 510 750 340 420 290 390
BENZO(B)FLUORANTHENE 170 1700 420 500 640 900 990 780 1300 970 1200 670 750 590 780
BENZO(G,H,I)PERYLENE 30 280 190 210 220 280 260 250 310 240 300 180 180 140 200
BENZO(K)FLUORANTHENE 54 640 170 210 220 290 400 240 330 300 440 220 290 170 260
CHRYSENE 91 960 310 360 420 580 600 470 730 570 780 380 480 310 450
DIBENZ(A,H)ANTHRACENE 6.1 U 41 82 89 94 110 80 100 120 110 120 81 86 65 81
FLUORANTHENE 200 2600 670 790 940 1300 1300 980 1500 1400 1900 820 960 630 960
FLUORENE 12 42 27 38 30 47 44 33 53 130 90 31 34 22 34
INDENO(1,2,3-C,D)PYRENE 35 330 220 250 260 310 270 280 370 280 350 200 240 180 220
NAPHTHALENE 15 14 41 U 38 U 41 U 17 24 21 24 130 28 25 18 19 26
PHENANTHRENE 94 820 290 370 380 600 510 400 590 790 950 330 390 240 370
PYRENE 170 2500 480 590 670 1100 1000 710 1100 980 1400 600 710 470 690
TOTAL PAHs 1,059 12,619 3,417 4,164 4,665 6,795 6,692 5,157 7,764 7,143 9,353 4,278 5,030 3,435 4,888
TOC CONTENT (%) 0.94 0.72 1.80 1.10 1.50 2.80 1.80 1.80 2.10 1.90 2.00 1.60 1.50 1.70 1.40TOC-NORMALIZED CONCENTRATION (mg/kg-TOC) 113 1,753 190 379 311 243 372 287 370 376 468 267 335 202 349
CLA1-1 CLA1-2 CLA1-3 CLA1-4 CLA1-5 CLA14-1 CLA14-2 CLA14-3 CLA14-4 CLA14-5 CLA4-1 CLA4-2 CLA4-3 CLA4-4 CLA4-5
2-METHYLNAPHTHALENE 76 76 160 24 640 140 56 83 6400 310 16 13 16 12 13
ACENAPHTHENE 120 210 370 64 4900 670 240 650 32000 6300 14 12 13 11 9.8
ACENAPHTHYLENE 66 130 240 47 610 290 140 230 400 U 960 14 13 15 9.5 11
ANTHRACENE 210 560 620 140 5000 1200 340 630 14000 6400 32 29 30 22 28
BENZO(A)ANTHRACENE 420 800 2300 250 5400 2000 870 1100 11000 8300 120 130 120 93 100
BENZO(A)PYRENE 440 810 1800 270 5300 1800 980 1200 9200 7200 140 140 130 100 120
BENZO(B)FLUORANTHENE 730 1300 2600 450 5900 2900 1400 1800 10000 11000 220 190 190 150 170
BENZO(G,H,I)PERYLENE 150 210 620 110 4000 460 260 310 6600 2100 130 110 110 83 87
BENZO(K)FLUORANTHENE 290 410 940 140 2000 760 590 610 4400 3100 83 89 73 54 59
CHRYSENE 520 830 2100 280 5800 1900 840 1100 9400 7500 150 130 130 110 100
DIBENZ(A,H)ANTHRACENE 61 100 270 51 1100 200 120 140 1500 850 30 31 31 17 22
FLUORANTHENE 1100 1800 5000 620 13000 4400 1400 2000 27000 15000 240 240 220 190 200
FLUORENE 120 340 190 100 6700 870 200 770 23000 6700 29 18 26 21 18
INDENO(1,2,3-C,D)PYRENE 170 260 690 120 3600 530 310 360 5500 2300 100 93 110 77 80
NAPHTHALENE 150 220 360 78 1900 440 240 240 3000 1100 28 22 31 20 21
PHENANTHRENE 520 1300 1000 370 17000 2900 670 1800 50000 15000 100 89 86 69 76
PYRENE 980 1500 3900 460 11000 3300 1100 1600 24000 15000 200 190 190 140 160
TOTAL PAHs 6,047 10,780 23,000 3,550 93,210 24,620 9,700 14,540 230,600 108,810 1,630 1,526 1,505 1,167 1,262
TOC CONTENT (%) 2.90 2.80 2.80 2.60 3.40 2.40 2.20 2.70 6.70 3.00 2.60 2.50 2.40 2.50 2.60TOC-NORMALIZED CONCENTRATION (mg/kg-TOC) 209 385 821 137 2,741 1,026 441 539 3,442 3,627 62.7 61.0 62.7 46.7 48.5
CLA7-1 CLA7-2 CLA7-3 CLA7-4 CLA7-5 CLAM-1 CLAM-2 CLAM-3 CLAM-4 CLAM-5
2-METHYLNAPHTHALENE 13 13 13 15 16 18 16 2 23 19 U
ACENAPHTHENE 9.2 19 U 13 11 13 13 14 4.9 42 19 U
ACENAPHTHYLENE 10 10 18 19 23 27 23 5.4 34 19 U
ANTHRACENE 28 29 28 29 29 43 33 8.8 94 12
BENZO(A)ANTHRACENE 96 97 100 110 120 170 130 29 170 45
BENZO(A)PYRENE 110 110 120 120 140 180 140 25 200 42
BENZO(B)FLUORANTHENE 160 150 220 230 280 320 260 38 350 64
BENZO(G,H,I)PERYLENE 80 78 78 81 83 89 68 11 97 36
BENZO(K)FLUORANTHENE 50 66 74 69 81 140 86 16 120 28
CHRYSENE 97 100 130 130 150 190 140 26 200 45
DIBENZ(A,H)ANTHRACENE 29 19 31 37 36 41 35 9.8 43 19 U
FLUORANTHENE 180 180 220 230 260 350 260 46 410 78
FLUORENE 20 18 23 24 28 36 29 6.4 52 7.7
INDENO(1,2,3-C,D)PYRENE 76 74 91 86 93 110 79 17 110 30
NAPHTHALENE 24 21 23 27 30 27 36 4.9 46 9
PHENANTHRENE 72 64 76 81 89 110 95 22 260 30
PYRENE 140 150 180 190 210 290 230 37 310 77
TOTAL PAHs 1,181 1,166 1,425 1,474 1,665 2,136 1,658 307 2,538 504
TOC CONTENT (%) 2.60 2.60 2.80 3.10 3.00 2.70 2.80 4.40 0.46 2.80TOC-NORMALIZED CONCENTRATION (mg/kg-TOC) 45.4 44.8 50.9 47.5 55.5 79.1 59.2 7.0 552 18.0
1 Not detected at the specified detection limit.
PAH COMPOUND (µg/kg)
LAKE AREA
CLA-7 CLAM
TABLE B7: Bulk PAH data (sum of 16 USEPA Priority Pollutants) on Cleveland Harbor Upper Cuyahoga River Channel and Lake Erie sediments (RTI 2014a)
DMMU-1 DMMU-2a DMMU-2b
CLA-1 CLA-14 CLA-4
PAH COMPOUND (µg/kg)
UPPER RIVER CHANNEL
PAH COMPOUND (µg/kg)
LAKE AREA

LE-1 LE-2 LE-3 LE-4 LE-6 LE-7 LE-10 LE-11 LE-12 LE-13 LE-14 LE-16 LE-19 LE-20 LE-21 LE-22 LE-23 LE-24 LE-25
2-METHYLNAPHTHALENE 12 U1 47 5,100 16 10 U 21 36 16 32 U 11 U 66 3,700 33 U 29 U 34 U 33 U 34 U 59 95
ACENAPHTHENE 11 U 25 1,800 35 9 27 26 10 U 29 U 10 U 170 11,000 30 U 27 U 30 U 30 U 31 U 660 92
ACENAPHTHYLENE 10 U 26 1,100 33 13 57 35 9.7 U 30 37 210 1,600 29 U 25 U 29 U 29 U 29 U 180 81
ANTHRACENE 22 72 1,900 100 34 100 90 11 U 45 31 470 12,000 34 32 33 U 37 43 430 200
BENZO(A)ANTHRACENE 53 310 1,900 260 77 250 280 15 170 150 1,100 13,000 140 130 110 130 160 920 440
BENZO(A)PYRENE 64 470 1,800 300 79 320 350 15 280 210 1,000 11,000 200 210 150 230 250 1,400 660
BENZO(B)FLUORANTHENE 130 800 2,200 410 140 460 570 39 510 340 1,300 15,000 440 470 350 480 500 2,000 1,200
BENZO(G,H,I)PERYLENE 56 290 710 U 120 26 120 140 16 U 140 71 360 4,500 97 87 67 94 110 510 230
BENZO(K)FLUORANTHENE 32 200 1000 U 130 37 100 160 24 U 150 76 350 4,500 110 92 79 140 140 520 290
CHRYSENE 76 400 2,000 240 93 240 290 20 190 150 810 12,000 140 150 110 170 170 830 430
DIBENZ(A,H)ANTHRACENE 38 U 100 1600 U 54 32 U 43 61 36 U 100 U 36 U 180 2400 U 110 U 95 U 110 U 110 U 110 U 110 U 120 U
FLUORANTHENE 190 800 5,200 530 180 510 670 32 360 190 2,100 37,000 270 280 210 300 310 1,900 870
FLUORENE 13 U 41 2,400 45 12 43 57 13 U 36 U 13 U 220 11,000 38 U 34 U 39 U 38 U 39 U 310 42 U
INDENO(1,2,3-C,D)PYRENE 42 290 520 U 130 26 120 160 12 U 150 88 400 4,300 110 100 78 110 130 580 250
NAPHTHALENE 9.3 U 51 29,000 34 22 36 45 12 39 11 250 11,000 46 26 29 48 44 230 230
PHENANTHRENE 81 300 6,800 180 69 190 240 15 110 47 1,000 42,000 90 86 74 100 110 1,300 500
PYRENE 140 580 4,700 450 180 390 530 29 300 160 1,500 33,000 220 220 170 260 260 1,300 740
TOTAL PAHs 886 4,755 60,800 3,051 997 3,006 3,704 177 2,474 1,561 11,420 222,900 1,897 1,883 1,427 2,099 2,227 13,070 6,213
TOC CONTENT (%) 0.36 2.4 3.1 0.4 0.41 0.44 1.6 0.19 2.2 0.29 1.4 4.3 2.76 2.7 2.7 3 3.1 2.7 3.3
TOC-NORMALIZED CONCENTRATION (mg/kg-TOC) 246 198 1961 763 243 683 232 93.2 112 538 816 5184 68.7 69.7 52.9 70.0 71.8 484 188
TABLE B8: Bulk PAH data (16 USEPA Priority Pollutants) on Lake Erie sediments offshore of Cleveland (RTI 2014b)
PAH COMPOUND (µg/kg)LAKE SITE
1 Not detected at the specified detection limit.

DMMU-1 DMMU-2a DMMU-2b CLA-14 Comp CLA-1 Comp CLA-4 Comp CLA-7 Comp
1-METHYLNAPHTHALENE 60 40 50 1,870 220 20 20
2-METHYLNAPHTHALENE 130 110 110 1,900 790 60 70
ACENAPHTHENE 20 U 60 50 10,890 3,250 30 40
ACENAPHTHYLENE 40 60 50 1,330 1,100 50 60
ANTHRACENE 130 250 280 15,040 9,050 140 160
BENZO(A)ANTHRACENE 180 390 450 8,390 5,250 160 190
BENZO(A)PYRENE 210 440 480 7,530 4,350 180 230
BENZO(B,K)FLUORANTHENE 450 830 830 8,640 5,300 310 380
BENZO(G,H,I)PERYLENE 190 390 380 3,760 2,470 160 180
CHRYSENE 330 610 590 7,680 5,180 240 280
DIBENZ(A,H)ANTHRACENE 30 60 70 930 530 30 10 U1
FLUORANTHENE 480 910 980 16,190 10,690 290 310
FLUORENE 30 70 70 7,560 4,040 50 60
INDENO(1,2,3-C,D)PYRENE 210 460 470 5,920 3,390 190 200
NAPHTHALENE 140 160 120 2,890 2,520 130 40
PHENANTHRENE 310 550 650 21,950 13,000 210 230
PYRENE 450 840 890 15,080 10,040 300 330
PERYLENE 160 290 300 3,900 2,600 580 600
BENZO(E)PYRENE 240 410 390 3,720 2,390 160 220
C1 - CHRYSENE 370 640 640 13,140 9,450 370 390
C1 - FLUORANTHENE/PYRENE 260 490 470 15,730 10,510 270 290
C1 - FLUORENE 120 180 160 9,820 9,210 230 200
C1 - PHENANTHRENE/ANTHRACENE 270 390 380 20,450 17,730 310 360
C2 - CHRYSENE 340 610 490 17,860 15,930 100 U 100 U
C2 - FLUORENE 140 220 220 12,730 13,050 320 280
C2 - NAPHTHALENE 510 550 480 36,270 14,480 630 830
C2 - PHENANTHRENE/ANTHRACENE 1,130 1,740 1,520 102,830 118,410 1,860 1,990
C3 - CHRYSENE 200 U 200 U 200 U 10,320 11,020 200 U 200 U
C3 - FLUORENE 40 U 40 U 40 U 19,900 22,440 40 U 40 U
C3 - NAPHTHALENE 300 310 310 46,440 36,100 370 410
C3 - PHENANTHRENE/ANTHRACENE 680 1,030 840 59,430 74,800 950 940
C4 - CHRYSENE 200 U 200 U 200 U 200 U 200 U 200 U 200 U
C4 - NAPHTHALENE 490 610 540 46,520 46,030 750 810
C4 - PHENANTHRENE/ANTHRACENE 300 410 350 31,360 44,430 470 220
Total (34: 18 non-alkylated parent compounds and 16 groups of generic alkylated forms) 8,680 14,110 13,610 587,970 529,750 9,820 10,320
TOC (%) 1.20 2.00 1.70 3.00 3.60 2.70 2.80
TOC-NORMALIZED CONCENTRATION (MG/KG-TOC) 723 706 801 19,599 14,715 364 369Total (16 PRIORITY POLLUTANTS) 3,310 6,190 6,470 135,680 80,950 2,530 2,760
TABLE B9: Bulk PAH data (34: 18 non-alkylated parent compounds and 16 groups of generic alkylated forms, and 16 priority pollutants) on Cleveland Harbor Upper Cuyahoga River Channel and Lake Erie sediments (RTI 2014a)
PAH compound (µg/kg)LAKE AREAUPPER RIVER CHANNEL

DMMU-1 TU DMMU-2a TU DMMU-2b TU CLA-14 Comp TU CLA-1 Comp TU CLA-4 Comp TU CLA-7 Comp TU
1-METHYLNAPHTHALENE 0.16 0.0021 0.1 0.0013 0.21 0.0028 24.74 0.33 1.53 0.02 0.05 U1 0.05 U 75.37
2-METHYLNAPHTHALENE 0.15 0.0021 0.13 0.0018 0.4 0.0055 6.64 0.09 0.85 0.01 0.05 U 0.05 U 72.16
ACENAPHTHENE 0.1 U 0.1 U 0.1 U 45.17 0.81 20.19 0.36 0.1 U 0.1 U 55.85
ACENAPHTHYLENE 0.2 U 0.2 U 0.2 U 1.92 0.01 1.13 0.00 0.2 U 0.2 U 306.9
ANTHRACENE 0.05 U 0.05 U 0.05 U 7.79 0.38 9.19 0.44 0.05 U 0.05 U 20.73
BENZO(A)ANTHRACENE 0.001 U 0.001 U 0.001 U 2.06 0.93 0.49 0.22 0.001 U 0.001 U 2.227
BENZO(A)PYRENE 0.008 U 0.008 U 0.008 U 0.95 0.99 0.25 0.26 0.008 U 0.008 U 0.9573
BENZO(B,K)FLUORANTHENE 0.005 U 0.005 U 0.005 U 1.46 2.28 0.39 0.61 0.005 U 0.005 U 0.6415
BENZO(E)PYRENE 0.005 U 0.005 U 0.005 U 0.45 0.50 0.12 0.13 0.005 U 0.005 U 0.9008
BENZO(G,H,I)PERYLENE 0.001 U 0.001 U 0.001 U 0.59 1.34 0.16 0.36 0.001 U 0.001 U 0.4391
C1 - CHRYSENE 0.005 U 0.005 U 0.005 U 1.48 1.73 0.36 0.42 0.005 U 0.005 U 0.8557
C1 - FLUORANTHENE/PYRENE 0.01 U 0.01 U 0.01 U 5.56 1.14 5.62 1.15 0.01 U 0.01 U 4.887
C1 - FLUORENE 0.02 U 0.02 U 0.02 U 16.86 1.21 21.3 1.52 0.02 U 0.02 U 13.99
C1 - PHENANTHRENE/ANTHRACENE 0.02 U 0.02 U 0.02 U 33.9 4.56 46.16 6.21 0.02 U 0.02 U 7.436
C2 - CHRYSENE 0.01 U 0.01 U 0.01 U 2.58 5.34 0.88 1.82 0.01 U 0.01 U 0.4827
C2 - FLUORENE 0.05 U 0.05 U 0.05 U 21.58 4.07 38.43 7.24 0.05 U 0.05 U 5.305
C2 - NAPHTHALENE 0.15 U 0.15 U 0.15 U 146.81 4.85 80.97 2.68 0.15 U 0.15 U 30.24
C2 - PHENANTHRENE/ANTHRACENE 0.05 U 0.05 U 0.05 U 51.34 16.05 93.37 29.19 0.05 U 0.05 U 3.199
C3 - CHRYSENE 0.01 U 0.01 U 0.01 U 0.01 U 0.01 U 0.01 U 0.01 U 0.1675
C3 - FLUORENE 0.06 U 0.06 U 0.06 U 31.38 16.38 53.92 28.14 0.06 U 0.06 U 1.916
C3 - NAPHTHALENE 0.05 U 0.05 U 0.05 U 285.68 25.74 366.39 33.01 0.05 U 0.05 U 11.1
C3 - PHENANTHRENE/ANTHRACENE 0.04 U 0.04 U 0.04 U 37.7 30.02 75.08 59.78 0.04 U 0.04 U 1.256
C4 - CHRYSENE 0.01 U 0.01 U 0.01 U 0.01 U 0.01 U 0.01 U 0.01 U 0.07062
C4 - NAPHTHALENE 0.15 U 0.15 U 0.15 U 238.12 54.06 370.84 84.19 0.15 U 0.15 U 4.4048
C4 - PHENANTHRENE/ANTHRACENE 0.02 U 0.02 U 0.02 U 55.79 99.73 78.43 140.20 0.02 U 0.02 U 0.5594
CHRYSENE 0.001 U 0.001 U 0.001 U 1.69 0.83 0.41 0.20 0.001 U 0.001 U 2.042
DIBENZ(A,H)ANTHRACENE 0.002 U 0.002 U 0.002 U 0.16 0.57 0.03 0.11 0.002 U 0.002 U 0.2825
FLUORANTHENE 0.01 U 0.01 U 0.03 0.0042 8.51 1.20 7.87 1.11 0.01 U 0.01 U 7.109
FLUORENE 0.04 U 0.04 U 0.04 U 17.99 0.46 11.58 0.29 0.04 U 0.04 U 39.3
INDENO(1,2,3-C,D)PYRENE 0.001 U 0.001 U 0.001 U 0.41 1.49 0.1 0.36 0.001 U 0.001 U 0.275
NAPHTHALENE 0.12 0.0006 0.22 0.0011 0.49 0.0025 3.49 0.02 2.4 0.01 0.1 U 0.1 U 193.5
PERYLENE 0.004 U 0.004 U 0.004 U 0.17 0.19 0.03 0.03 0.004 U 0.004 U 0.9008
PHENANTHRENE 0.1 U 0.1 U 0.1 U 36.72 1.92 31.27 1.63 0.1 U 0.1 U 19.13
PYRENE 0.01 U 0.02 0.0020 0.01 U 9.22 0.91 8.31 0.82 0.01 U 0.01 U 10.11
Total USEPA Toxic Units
PAH compound (ug/L)
TABLE B10: PAH (34: 18 non-alkylated parent compounds and 16 groups of generic alkylated forms) pore water concentrations in Cleveland Harbor Upper Cuyahoga River Channel and Lake Erie sediments with calculated USEPA Toxic Units (RTI 2014a)
PAH FCV (ug/L)
<0.1 <0.1 <0.1
UPPER RIVER CHANNEL LAKE AREA
280 403 <0.1 <0.1

Total PCBs (µg/kg-tissue) Lipid (%) Lipid-normalized Total PCBs (µg/kg-lipid)
A 216 1.6 13500B 161 1.9 8474C 125 1.8 6944D 142 1.8 7889E 137 2.1 6524
156 1.84 8666A 93.5 1.7 5500B 96.1 2.1 4576C 117 2.1 5571D 126 2.1 6000E 92.9 2.0 4645
105 2.00 5259A 96.5 1.9 5079B 101 1.8 5611C 109 1.9 5737D 83.9 2.0 4195E 125 2.2 5682
103 1.96 5261A 269 2.4 11208B 120 2.7 4444C 285 3.0 9500D 107 2.4 4458E
195 2.63 7403A 35.6 2.5 1424B 34.1 2.3 1483C 36.9 2.2 1677D 32.8 2.1 1562E 34.5 2.1 1643
34.8 2.24 1558
117 (composite)
MEAN
1 Values across four discrete sites; composite sample result was biased by one discrete sample with higher bulk sediment concentrations (above ambient lake conditions) of total PCBs (CLA-1-5, 1450 µg/kg).
MEAN
CLA-4
CLA-11
DMMU-167.9 (composite)
102 (composite)
144 (composite)
156 (average)
MEAN
DMMU-2a
MEAN
DMMU-2b
MEAN
TABLE B11. Results of standard 28-day Lumbriculus variegatus bioaccumulation experiments on Lake Cleveland Harbor Upper Cuyahoga River Channel and open-lake area sediments (RTI 2014a).
Management Unit/Area
Replicate
Tissue Measurement Total PCB Concentration in Sediment (µg/kg-
sediment)

Total PCBs (µg/kg-tissue) Lipid (%) Lipid-normalized Total PCBs (µg/kg-lipid)
R-A 650 4.1 15854R-B 690 3.1 22258R-C 668 3.2 20875R-D 681 3.1 21968R-E 721 4.2 17167
682 3.54 19624 1240 (composite)D-1 269 2.4 11208 236D-2 120 2.7 4444 116D-3 285 3 9500 169D-4 107 2.4 4458 104D-5 1450*
195 2.63 7403 156D-1 91.6 3 3053 51.8D-2 145 2.3 6304 100D-3 163 2.3 7087 81.8D-4 156D-5 343 4 8575 291
186 2.90 6255 136R-A 35.6 2.5 1424R-B 34.1 2.3 1483R-C 36.9 2.2 1677R-D 32.8 2.1 1562R-E 34.5 2.1 1643
34.8 2.24 1558 117 (composite)D-1 34.9 2.4 1454 109D-2 32.6 1.9 1716 74.6D-3 58.7 2.6 2258 102D-4 41.1 2.2 1868 77D-5 33.9 2.2 1541 89.2
40.2 2.26 1767 90.4R-A 37.3 2.5 1492R-B 32.3 1.9 1700R-C 33.1 2.3 1439R-D 37.5 2.1 1786R-E 34.6 1.9 1821
35.0 2.14 1648 110 (composite)D-1 32.1 2 1605 103D-2 32.1 1.9 1689 123D-3 34.7 2 1735 109D-4 40.6 2.1 1933 131D-5 35.6 2 1780 121
35.0 2.00 1749 117D-1 53.5 2.3 2326 136D-2 92.7 2.1 4414 262D-3 23.0 1.9 1211 10.9D-4 49.3 2 2465 109D-5 56.3 2.2 2559 155
55.0 2.10 2595 135D-1 13.7 1.1 1245 28.6D2 105D-3 3151 1.2 262583* 5880*D-4 57.7D-6 38.6D-7 27.7
D-10 400D-11 29.4 1 2940 9.36D-12 20.7 1 2070 101D-13 21.0 1.1 1909 15.8D-14 38.4D-16 968*D-19 19.3 0.9 2144 100D-20 19.7 1 1970 92D-21 20.1 1 2010 111D-22 117D-23 109D-24 40.6 1.1 3691 60.2D-25 152
371 1.04 2247 68
*Value not included in mean.
MEAN
MEAN
MEAN
Total PCB Concentration in Sediment (µg/kg-
sediment)
CHLE
MEAN
CLA-7
MEAN
CLA-7
MEAN
CLAM
MEAN
CLA-14
TABLE B12. Results of standard 28-day Lumbriculus variegatus bioaccumulation experiments on Lake Erie sediments offshore of Cleveland (RTI 2014b).
CLA-1
CLA-1
CLA-4
Area
Tissue MeasurementReplicate (R ) or Discrete Site (D)
MEAN
CLA-4
MEAN

CH-1 CH-2 CH-3 CH-3 CORE CH-4 CH-5 CH-5 COREDMMU-1
COMPCH-6 CH-7 CH-7 CORE CH-8 CH-9 CH-9 CORE CH-10
DMMU-2a COMP
CH-11 CH-12 CH-12 CORE CH-13 CH-14 CH-15 CH-15 COREDMMU-2b
COMP
CLAY 14 3.6 14 4.4 9.7 14 9.3 6.4 17 13 10 14 24 16 20 13 17 21 18 19 16 13 14 5.1
SILT 57 72 52 60 59 55 56 66 56 65 59 62 52 51 58 67 54 54 56 53 60 68 66 69
FINE SAND 19 16 18 13 22 16 25 12 11 11 18 8.1 5.9 8.3 6.5 9.7 8.2 3.7 5.7 4.6 5 5 4.6 5
MEDIUM SAND 9.1 6.7 6.6 13 5 7.8 4.6 8.1 8 5.3 5.7 6.8 7.8 6.6 7.4 6.1 12 7.4 6.3 9.4 8.4 7 5.1 6.4
COARSE SAND 0.9 1.7 7.6 7.8 3.9 6 4.6 5.1 7.7 5.9 6.2 9.2 9.6 17 6.7 4.2 8.2 13 14 14 9.9 6.8 9.3 14
FINE GRAVEL 0.1 0.1 1 2 0.3 0.9 0.7 1.8 0.3 0.2 0.4 0.4 1 1.3 0.4 0.1 0.7 0.3 0.7 0.8 0.5 0.5 0.3 0.9
COARSE GRAVEL 0 0 0 0 0 0 0 0 0 0 0 0 0 0 0 0 0 0 0 0 0 0 0 0
TOTAL SILT/CLAY 71 76 64 64 69 65 72 72 73 69 76 76 67 78 78 80 71 74 72 72 76 80 74 74
TOTAL SAND/GRAVEL 29 25 36 36 31 35 27 27 27 30 25 25 33 21 21 20 29 27 29 29 24 19 26 26
CLA1-1 CLA1-2 CLA1-3 CLA1-4 CLA1-5 CLA1 COMP CLA4-1 CLA4-2 CLA4-3 CLA4-4 CLA4-5 CLA4 COMP
CLAY 6.7 15 13 7.1 10 6.5 17 7.1 44 15 16 16
SILT 40 7.8 14 16 11 23 8.7 16 0 5 11 8.5
FINE SAND 16 2.9 5.9 5.1 7.3 6.2 2.6 2.1 4.7 3.1 4.6 3
MEDIUM SAND 12 13 20 24 26 17 2.9 1.1 13 9.5 13 13
COARSE SAND 22 42 30 24 24 31 40 44 32 36 39 37
FINE GRAVEL 3.6 19 17 24 22 16 28 30 11 31 17 23
COARSE GRAVEL 0 0 0 0 0 0 0 0 0 0 0 0
TOTAL SILT/CLAY 47 23 27 23 21 30 26 23 44 20 27 25
TOTAL SAND/GRAVEL 54 77 73 77 79 70 74 77 61 80 74 76
TABLE B13: Bulk grain size distribution on Cleveland Harbor Upper Cuyahoga River Channel and Lake Erie sediments (RTI 2015)
DMMU-1 DMMU-2a DMMU-2b
UPPER RIVER CHANNEL
PARTICLE SIZE (%)
CLA-1PARTICLE SIZE (%)
LAKE AREA
CLA-4

CH-1 CH-2 CH-3 CH-4 CH-5DMMU-1
COMPCH-6 CH-7 CH-8 CH-9 CH-10
DMMU-2a COMP
CH-11 CH-12 CH-13 CH-14 CH-15DMMU-2b
COMP
CYANIDE 0.65 U1 0.63 U 0.78 0.54 0.66 0.6 1.2 0.68 0.7 0.79 0.73 0.54 0.87 0.61 0.75 0.91 U 0.76 U 0.61
NITROGEN, AMMONIA 140 32 150 140 200 93 340 260 170 200 200 240 340 210 290 380 220 250
NITROGEN, TOTAL KJELDAHL (TKN) 350 260 1,800 1,500 1,900 410 2,000 1,600 1,400 2,300 1,900 1,800 2,200 860 960 1,100 1,200 1,500
PHOSPHORUS, TOTAL (AS P) 50 54 170 180 210 170 240 220 170 170 190 220 190 190 190 190 250 210
TOTAL ORGANIC CARBON 4,600 1,900 5,900 6,600 29,000 12,000 22,000 20,000 16,000 23,000 21,000 20,000 20,000 20,000 19,000 18,000 18,000 20,000
PERCENT MOISTURE 25 24 48 35 46 32 46 42 39 47 44 43 45 43 44 45 44 44
CLA1-1 CLA1-2 CLA1-3 CLA1-4 CLA1-5 CLA1 COMP CLA4-1 CLA4-2 CLA4-3 CLA4-4 CLA4-5 CLA4 COMP
CYANIDE 1.6 U 1.9 U 1.8 U 1.8 U 1.9 U 2 U 1.9 U 1.6 U 1.8 U 1.6 U 1.8 U 1.6 U
NITROGEN, AMMONIA 250 420 210 290 340 300 3200 180 330 250 280 250
NITROGEN, TOTAL KJELDAHL (TKN) 2,500 3,700 2,900 4,400 5,400 3,200 2,600 3,000 52,000 840 2,400 3,100
PHOSPHORUS, TOTAL (AS P) 290 420 440 430 440 450 200 310 290 190 260 360
TOTAL OIL & GREASE 1,800 450 410 U 370 U 410 U 390 U 360 U 380 U 380 U 460 350 U 430
TOTAL ORGANIC CARBON 39,000 32,000 32,000 29,000 24,000 33,000 28,000 28,000 30,000 30,000 28,000 29,000
PERCENT MOISTURE 68 77 76 73 76 75 73 74 74 72 72 73
CLA-1 CLA-4
TABLE B14: Bulk inorganics data on Cleveland Harbor Upper Cuyahoga River Channel and Lake Erie sediments (RTI 2015)
PARAMETER (mg/kg)
PARAMETER (mg/kg)
LAKE AREA
DMMU-1 DMMU-2a DMMU-2b
UPPER RIVER CHANNEL

CH-1 CH-2 CH-3 CH-4 CH-5DMMU-1
COMPCH-6 CH-7 CH-8 CH-9 CH-10
DMMU-2a COMP
CH-11 CH-12 CH-13 CH-14 CH-15DMMU-2b
COMP
ALUMINUM 4,900 3,400 12,000 12,000 11,000 8,900 15,000 12,000 12,000 15,000 15,000 14,000 15,000 14,000 15,000 15,000 16,000 16,000
ANTIMONY 0.98 0.96 1.8 1.1 1.3 1.4 1.6 1.5 1.6 1.8 1.5 1.7 2.2 1 1.8 1.8 2 1.5
ARSENIC 10 6.1 18 14 17 13 19 18 18 21 21 18 20 20 19 20 20 21
BARIUM 25 18 76 72 67 49 94 71 66 83 78 76 88 75 83 81 84 81
BERYLLIUM 0.05 U1 0.044 U 0.069 U 0.049 U 0.063 U 0.062 U 0.064 U 0.061 U 0.057 U 0.06 U 0.067 U 0.061 U 0.062 U 0.051 U 0.069 U 0.058 U 0.071 U 0.058 U
CADMIUM 0.078 0.044 U 0.42 0.2 0.37 0.17 0.32 0.28 0.43 0.34 0.19 0.22 0.29 0.14 0.18 0.9 0.46 0.26
CALCIUM 7,200 4,200 11,000 11,000 11,000 11,000 17,000 12,000 12,000 14,000 13,000 13,000 16,000 12,000 13,000 12,000 14,000 15,000
CHROMIUM, TOTAL 18 6.3 19 17 18 13 22 18 17 22 20 20 24 19 22 24 22 23
COBALT 5.6 4.1 10 9.3 9.9 7.6 11 10 10 12 12 11 12 12 12 11 12 12
COPPER 14 13 39 30 37 28 43 37 34 43 36 39 41 34 37 39 41 40
IRON 18,000 19,000 30,000 26,000 29,000 23,000 34,000 32,000 32,000 37,000 34,000 33,000 34,000 31,000 31,000 36,000 42,000 38,000
LEAD 12 14 32 22 31 21 35 31 28 33 29 30 33 24 28 33 37 32
MAGNESIUM 3,100 1,800 5,200 5,900 5,200 3,800 8,400 6,800 6,800 8,100 7,800 7,200 8,500 7,100 7,400 7,800 8,700 8,900
MANGANESE 390 210 830 700 650 500 830 710 720 860 810 760 820 670 690 860 1,000 820
MERCURY 0.013 0.007 0.11 0.11 0.1 0.054 0.099 0.091 0.069 0.07 0.078 0.064 0.076 0.07 0.065 0.11 0.12 0.077
NICKEL 24 16 29 28 28 26 37 29 29 35 33 32 38 32 36 33 33 35
POTASSIUM 770 520 1,900 2,200 1,900 1,300 2,500 1,900 1,800 2,500 2,500 2,300 2,900 2,200 2,900 2,400 2,300 2,600
SELENIUM 1.5 U 1.3 U 2.1 U 1.5 U 1.9 U 1.9 U 1.9 U 1.8 U 1.7 U 1.8 U 2 U 1.8 U 1.9 U 1.5 U 2.1 U 1.7 U 2.1 U 1.7 U
SILVER 0.25 U 0.22 U 0.34 U 0.25 U 0.32 U 0.31 U 0.32 U 0.31 U 0.29 U 0.3 U 0.33 U 0.3 U 0.31 U 0.25 U 0.34 U 0.29 U 0.36 U 0.29 U
SODIUM 100 88 240 220 220 160 280 240 240 260 250 240 310 270 280 280 260 280
THALLIUM 0.99 U 0.87 U 1.4 U 0.98 U 1.3 U 1.2 U 1.3 U 1.2 U 1.1 U 1.2 U 1.3 U 1.2 U 1.2 U 1 U 1.4 U 1.2 U 1.4 U 1.2 U
VANADIUM 17 8.7 25 25 25 18 29 25 24 30 29 29 33 29 32 29 28 31
ZINC 84 82 160 120 160 120 180 150 140 170 140 150 170 130 140 190 180 170
CLA1-1 CLA1-2 CLA1-3 CLA1-4 CLA1-5 CLA1 COMP CLA4-1 CLA4-2 CLA4-3 CLA4-4 CLA4-5 CLA4 COMP
ALUMINUM 25,000 34,000 30,000 32,000 33,000 31,000 32,000 33,000 34,000 28,000 27,000 27,000
ANTIMONY 3.7 1.6 2.3 3.8 3.5 2.4 1.8 2.7 1.8 1.5 2.7 1.3
ARSENIC 13 7.5 13 9.2 9.8 13 5.5 7.6 7.8 8.4 7.8 7.1
BARIUM 120 140 150 150 150 150 140 150 150 130 130 140
BERYLLIUM 0.14 U 0.087 0.077 0.16 U 0.17 U 0.13 U 0.69 0.63 0.53 0.45 0.46 0.45
CADMIUM 1.7 1.5 2.1 1.9 1.9 2.2 1.5 1.7 1.7 1.5 1.4 1.6
CALCIUM 890 1,100 1,200 1,300 1,200 13,000 15,000 16,000 14,000 13,000 13,000 14,000
CHROMIUM, TOTAL 53 55 60 59 60 61 56 61 58 53 49 54
COBALT 14 16 17 18 17 17 16 17 17 15 14 16
COPPER 73 50 62 62 61 65 50 55 53 49 46 51
IRON 80,000 43,000 49,000 48,000 47,000 46,000 44,000 46,000 45,000 41,000 40,000 38,000
LEAD 62 53 66 62 63 66 46 52 51 45 41 47
MAGNESIUM 900 1,300 15,000 1,300 1,300 16,000 16,000 17,000 14,000 15,000 14,000 14,000
MANGANESE 660 600 580 650 560 640 560 580 610 530 690 570
MERCURY 0.26 0.33 0.4 0.33 0.29 0.31 0.35 0.28 0.28 0.75 0.25 0.27
NICKEL 56 64 71 69 68 70 61 67 65 60 56 63
POTASSIUM 5,000 7,100 6,900 6,300 7,100 6,400 6,900 6,900 7,300 6,500 5,300 4,900
SELENIUM 4.3 U 4.9 U 4.2 U 4.8 U 5 U 3.9 U 4.2 U 4.5 U 5 U 3.9 U 3.4 U 3.6 U
SILVER 0.72 U 0.81 U 0.69 U 0.8 U 0.83 U 0.65 U 0.71 U 0.75 U 0.84 U 0.65 U 0.57 U 0.6 U
SODIUM 170 240 250 220 250 250 260 280 240 230 220 240
THALLIUM 2.9 U 3.2 U 2.8 U 3.2 U 3.3 U 2.6 U 2.8 U 3 U 3.3 U 2.6 U 2.3 U 2.4 U
VANADIUM 61 77 73 74 79 78 71 78 74 67 63 66
ZINC 250 220 270 270 260 280 200 220 210 190 180 200
1 Not detected at the specified detection limit
CLA-1 CLA-4
TABLE B15: Bulk metals data on Cleveland Harbor Upper Cuyahoga River Channel and Lake Erie sediments (RTI 2015)
METAL (mg/kg)
METAL (mg/kg)
LAKE AREA
DMMU-1 DMMU-2a DMMU-2b
UPPER RIVER CHANNEL

DMMU-1 COMP
DMMU-2a COMP
DMMU-2b COMP CLA1-1 CLA1-2 CLA1-3 CLA1-4 CLA1-5 CLA1-COMP CLA4-COMP
CADMIUM 0.0013 0.00232 0.00234 0.01 0.003 0.004 0.004 0.004 0.00382 0.00316
COPPER 0.116 0.151 0.148 0.186 0.087 0.075 0.098 0.081 0.0895 0.0874
LEAD 0.0504 0.0591 0.0582 0.139 0.041 0.062 0.059 0.061 0.056 0.0509
MERCURY 0 U 0 U 0 U 0 U 0 U 0 U 0 U 0 U 0 U 0 U
NICKEL 0.0696 0.107 0.0816 0.122 0.069 0.092 0.211 0.089 0.207 0.0891
ZINC 0.513 0.579 0.595 1.76 0.336 0.516 0.541 0.53 0.479 0.397
∑SEM 0.750 0.898 0.885 2.217 0.536 0.749 0.913 0.765 0.835 0.628
AVS 0.63U 0.63U 0.63U 4.424 1.069 1.494 1.822 1.526 5.1 3.8
∑SEM-AVS2,3 0.75 0.898 0.885 -2.207 -0.533 -0.745 -0.909 -0.761 -4.265 -3.172
Foc 0.012 0.02 0.02 0.039 0.032 0.032 0.029 0.024 0.033 0.029(∑SEM-AVS)/Foc4
63 45 44
2 Sediment metal concentrations are protective of benthic organisms if ∑SEM-AVS ≤ 0 µmol/g3 Toxicity is unlikely when ∑SEM-AVS < 1.7 µmol/g4 Toxicity is unlikely when (∑SEM-AVS)/Foc < 130 µmol/g-oc
LAKE AREA
TABLE B16: AVS/SEM data on Cleveland Harbor Upper Cuyahoga River Channel and Lake Erie sediments (RTI 2015)
UPPER RIVER CHANNEL
AVS/SEM (µmol/g)
1 Not detected at the specified detection limit

CH-1 CH-2 CH-3 CH-4 CH-5DMMU-1
COMPCH-6 CH-7 CH-8 CH-9 CH-10
DMMU-2a COMP
CH-11 CH-12 CH-13 CH-14 CH-15DMMU-2b
COMP
AROCLOR-1016 8.8 U1 8.7 U 13 U 10 U 12 U 9.5 U 12 U 11 U 11 U 12 U 12 U 12 U 12 U 11 U 12 U 12 U 12 U 12 U
AROCLOR-1221 8.8 U 8.7 U 13 U 10 U 12 U 9.5 U 12 U 11 U 11 U 12 U 12 U 12 U 12 U 11 U 12 U 12 U 12 U 12 U
AROCLOR-1232 8.8 U 8.7 U 13 U 10 U 12 U 9.5 U 12 U 11 U 11 U 12 U 12 U 12 U 12 U 11 U 12 U 12 U 12 U 12 U
AROCLOR-1242 20 18 23 21 12 U 58 12 U 15 17 12 U 12 U 12 U 30 11 U 12 U 29 13 20
AROCLOR-1248 8.8 U 8.7 U 13 U 10 U 12 U 9.5 U 12 U 11 U 11 U 12 U 12 U 12 U 12 U 11 U 12 U 12 U 12 U 12 U
AROCLOR-1254 8.8 U 8.7 U 13 U 10 U 12 U 9.5 U 12 U 11 U 11 U 12 U 12 U 12 U 12 U 11 U 12 U 12 U 12 U 12 U
AROCLOR-1260 8.9 4.2 27 15 18 15 31 17 31 27 12 36 32 19 13 29 24 53
AROCLOR-1262 8.8 U 8.7 U 13 U 10 U 12 U 9.5 U 12 U 11 U 11 U 12 U 12 U 12 U 12 U 11 U 12 U 12 U 12 U 12 U
TOTAL PCBs 29 23 50 36 18 73 31 32 48 27 12 36 62 19 13 58 37 73
TOC (%) 0.46 0.19 0.59 0.66 2.9 1.2 2.2 2 1.6 2.3 2.1 2 2 2 1.9 1.8 1.8 2
TOC-NORMALIZED CONCENTRATION (µg/kg-TOC) 6304 12105 8475 5455 621 6083 1409 1600 3000 1174 571 1800 3100 950 684 3222 2056 3650
CLA1-1 CLA1-2 CLA1-3 CLA1-4 CLA1-5 CLA1 COMP CLA4-1 CLA4-2 CLA4-3 CLA4-4 CLA4-5 CLA4 COMP
AROCLOR-1016 20 U 28 U 28 U 24 U 27 U 26 U 25 U 25 U 26 U 24 U 23 U 24 U
AROCLOR-1221 20 U 28 U 28 U 24 U 27 U 26 U 25 U 25 U 26 U 24 U 23 U 24 U
AROCLOR-1232 20 U 28 U 28 U 24 U 27 U 26 U 25 U 25 U 26 U 24 U 23 U 24 U
AROCLOR-1242 20 U 28 U 28 U 24 U 27 U 26 U 25 U 25 U 26 U 24 U 23 U 24 U
AROCLOR-1248 20 U 28 U 28 U 24 U 27 U 26 U 25 U 25 U 26 U 24 U 23 U 24 U
AROCLOR-1254 89 28 U 28 U 61 110 150 52 46 42 50 51 41
AROCLOR-1260 20 U 28 U 28 U 24 U 27 U 26 U 25 U 25 U 26 U 24 U 23 U 24 U
AROCLOR-1262 20 U 28 U 28 U 24 U 27 U 26 U 25 U 25 U 26 U 24 U 23 U 24 U
TOTAL PCBs 89 28 U 28 U 61 110 150 52 46 42 50 51 41
TOC (%) 3.9 3.2 3.2 2.9 2.4 3.3 2.8 2.8 3 3 2.8 2.9
TOC-NORMALIZED CONCENTRATION (µg/kg-TOC) 2282 875 875 2103 4583 4545 1857 1643 1400 1667 1821 1414
CLA-1 CLA-4
TABLE B17: Bulk PCB data on Cleveland Harbor Upper Cuyahoga River Channel and Lake Erie sediments (RTI 2015)
AROCLOR (µg/kg)
AROCLOR (µg/kg)
LAKE AREA
DMMU-1 DMMU-2a DMMU-2b
UPPER RIVER CHANNEL

DMMU-1 COMP
DMMU-2a COMP
DMMU-2b COMP
CLA1 COMP CLA4 COMP
2,2',3,3',4,4',5,5',6,6'-DECACHLOROBIPHENYL 0.231 0.469 0.463 0.94 0.341
2,2',3,3',4,4',5,5',6-NONACHLOROBIPHENYL 0.276 0.647 0.581 0.66 0.289
2,2',3,3',4,4',5,5'-OCTACHLOROBIPHENYL 0.853 2.04 1.92 0.904 0.579
2,2',3,3',4,4',5,6,6'-NONACHLOROBIPHENYL 0.04 0.093 0.074 U1 0.121 0.063
2,2',3,3',4,4',5',6-OCTACHLOROBIPHENYL 0.502 1.16 1.07 0.471 0.312
2,2',3,3',4,4',5,6-OCTACHLOROBIPHENYL 0.368 0.905 0.8 0.349 0.239
2,2',3,3',4,4',5-HEPTACHLOROBIPHENYL 1.43 3.27 3.27 1.46 1.05
2,2',3,3',4,4',6,6'-OCTACHLOROBIPHENYL 0.054 0.094 0.063 0.034 0.023
2,2',3,3',4,4',6-HpCB & 2,2',3,3',4,5,6-HpCB (PCB171&PCB173) 0.464 1.08 1.06 0.447 0.303
2,2',3,3',4,4'-HxCB1 & 2,3,4,4',5,6-HxCB (PCB128&PCB166) 0.494 0.934 0.845 1.15 0.756
2,2',3,3',4,5,5',6,6'-NONACHLOROBIPHENYL 0.073 0.175 0.15 0.249 0.101
2,2',3,3',4,5,5',6-OcCB & 2,2',3,3',4,5,5',6'-OcCB (PCB198&PCB199) 1.04 2.45 2.27 1.26 0.753
2,2',3,3',4,5,5'-HEPTACHLOROBIPHENYL 0.273 0.598 0.616 0.303 0.221
2,2',3,3',4,5,6,6'-OCTACHLOROBIPHENYL 0.089 0.306 0.294 0.122 0.063
2,2,3,3,4,5,6,6-OCTACHLOROBIPHENYL 0.126 0.304 0.28 0.137 0.079
2,2',3,3',4,5',6'-HEPTACHLOROBIPHENYL 0.952 2.24 2.2 0.973 0.656
2,2',3,3',4,5',6-HEPTACHLOROBIPHENYL 0.102 0.173 0.161 0.065 0.052
2,2',3,3',4,5,6'-HEPTACHLOROBIPHENYL 1.87 4.44 4.37 1.53 1.01
2,2',3,3',4,5'-HEXACHLOROBIPHENYL 0.198 0.384 0.348 0.567 0.3942,2',3,3',4,5-HxCB & 2,2',3,4,4',5'-HxCB1 & 2,3,3',4',5,6-HxCB (PCB129&PCB138&PCB163) 4.78 9.61 9.47 7.86 5.31
2,2',3,3',4,6,6'-HEPTACHLOROBIPHENYL 0.237 0.548 0.554 0.17 0.109
2,2',3,3',4,6'-HEXACHLOROBIPHENYL 1.57 2.97 2.91 2.31 1.46
2,2',3,3',4,6-HEXACHLOROBIPHENYL 0.049 0.096 0.082 0.087 0.047
2,2',3,3',4-PENTACHLOROBIPHENYL 0.375 0.487 0.466 0.849 0.597
2,2',3,3',5,5',6,6'-OCTACHLOROBIPHENYL 0.151 0.363 0.33 0.225 0.11
2,2',3,3',5,5',6-HEPTACHLOROBIPHENYL 0.338 0.819 0.826 0.348 0.223
2,2',3,3',5,5'-HEXACHL0ROBIPHENYL 0.044 0.105 0.1 0.11 U 0.072
2,2',3,3',5,6,6'-HEPTACHLOROBIPHENYL 0.809 1.75 1.77 0.557 0.362
2,2',3,3',5,6-HxCB & 2,2',3,4,5,6'-HxCB (PCB134&PCB143) 0.202 0.401 0.356 0.311 0.17
2,2',3,3',5,6'-HxCB & 2,2',3,5,5',6-HxCB (PCB135&PCB151) 1.96 4.15 4.19 1.87 1.18
2,2',3,3',5-PeCB & 2,2',4,4',5-PeCB (PCB83&PCB99) 1.51 2.12 2.03 3.25 2.15
2,2',3,3',6,6'-HEXACHLOROBIPHENYL 0.7 1.33 1.32 0.559 0.318
2,2',3,3',6-PENTACHLOROBIPHENYL 0.867 0.983 0.969 1.37 0.8512,2',3,3'-TeCB & 2,2',3,4-TeCB & 2,3',4',6-TeCB (PCB40&PCB41&PCB71) 1.67 1.62 1.8 1.54 1.07
2,2',3,4,4',5,5',6-OCTACHLOROBIPHENYL 0.6 1.47 1.39 0.728 0.397
2,2',3,4,4',5,5'-HpCB1 & 2,3,3',4',5,5',6-HpCB (PCB180&PCB193) 3.83 8.3 8.51 3.37 2.37
2,2',3,4,4',5,6,6'-OCTACHLOROBIPHENYL 0.002 U 0.005 U 0.006 U 0.004 U 0.001 U
2,2',3,4,4',5',6-HEPTACHLOROBIPHENYL 1.14 2.3 2.31 0.847 0.636
2,2',3,4,4',5,6'-HEPTACHLOROBIPHENYL 0.001 U 0.004 U 0.005 U 0.013 0.003 U
2,2',3,4,4',5,6-HEPTACHLOROBIPHENYL 0.011 U 0.007 U 0.009 U 0.017 U 0.004 U
2,2',3,4,4',5-HEXACHLOROBIPHENYL 0.13 U 0.233 0.16 0.257 0.225
2,2',3,4,4',6,6'-HEPTACHLOROBIPHENYL 0.001 U 0.003 U 0.004 U 0.004 U 0.002 U
2,2',3,4,4',6-HxCB & 2,2',3,4,4',6'-HxCB (PCB139&PCB140) 0.045 0.083 0.07 0.11 0.0622,2',3,4,4'-PeCB & 2,3,4,5,6-PeCB & 2,3,4',5,6-PeCB (PCB85&PCB116&PCB117) 0.665 0.718 0.563 1.01 0.828
2,2',3,4',5,5',6-HEPTACHLOROBIPHENYL 2.02 5.04 5.2 2.03 1.3
2,2',3,4,5,5',6-HEPTACHLOROBIPHENYL 0.002 U 0.008 U 0.01 U 0.008 U 0.004 U
2,2',3,4',5,5'-HEXACHLOROBIPHENYL 0.551 1.11 1.1 1.09 0.773
2,2',3,4,5,5'-HEXACHLOROBIPHENYL 1.05 2.38 2.34 1.04 0.646
2,2',3,4',5,6,6'-HEPTACHLOROBIPHENYL 0.003 0.004 U 0.005 U 0.005 U 0.003
2,2',3,4,5,6,6'-HEPTACHLOROBIPHENYL 0.001 U 0.003 U 0.004 U 0.004 U 0 U
2,2',3,4',5,6'-HEXACHLOROBIPHENYL 0.001 U 0.004 U 0.003 U 0.009 0.006
2,2',3,4,5',6-HEXACHLOROBIPHENYL 0.184 0.549 0.543 0.226 0.088
2,2',3,4,5,6-HEXACHLOROBIPHENYL 0.002 U 0.006 U 0.007 U 0.009 U 0.001 U
2,2',3,4',5,6-HxCB & 2,2',3,4',5',6-HxCB (PCB147&PCB149) 4.25 8.45 8.38 4.67 3.042,2',3,4',5-PeCB & 2,2',4,5,5'-PeCB1 & 2,3,3',5',6-PeCB (PCB90&PCB101&PCB113) 3.19 4.9 4.88 5.32 3.51
2,2',3,4',6,6'-HEXACHLOROBIPHENYL 0.003 0.005 U 0.002 U 0.007 U 0.004 U
2,2',3,4,6,6'-HEXACHLOROBIPHENYL 0.001 U 0.002 U 0.002 U 0.003 U 0.001 U
2,2',3,4,6-PeCB & 2,2',3,4',6-PeCB (PCB88&PCB91) 0.524 0.593 0.595 0.758 0.506
2,2',3,4,6'-PENTACHLOROBIPHENYL 0.056 0.059 0.06 0.077 0.048
2,2',3,4'-TETRACHLOROBIPHENYL 1.12 1.08 1.19 0.98 0.758
2,2',3,5,5'-PENTACHLOROBIPHENYL 0.554 0.783 0.785 1.03 0.701
2,2',3,5,6,6'-HEXACHLOROBIPHENYL 0.002 U 0.003 U 0.002 U 0.003 U 0.002 U2,2',3,5,6-PeCB & 2,2',3',4,6-PeCB & 2,2',4,4',6-PeCB & 2,2',4,5,6'-PeCB (PCB93&PCB98&PCB100&PCB102) 0.164 0.176 0.177 0.211 0.135
2,2',3,5,6'-PENTACHLOROBIPHENYL 0.023 U 0.024 0.026 0.026 U 0.015 U2,2',3,5'-TeCB1 & 2,2',3,4'-TeCB & 2,3,5,6-TeCB (PCB44&PCB47&PCB65) 3.43 3.26 3.49 2.77 2.13
2,2',3,5-TETRACHLOROBIPHENYL 0.169 0.158 0.164 0.109 0.075
2,2',3,6,6'-PENTACHLOROBIPHENYL 0.035 0.031 0.033 0.028 0.014
2,2',3,6-TeCB & 2,2',4,6'-TeCB (PCB45&PCB51) 0.787 0.645 0.685 0.355 0.234
2,2',3,6'-TETRACHLOROBIPHENYL 0.222 0.171 0.191 0.14 0.09
2,2',3-TRICHLOROBIPHENYL 0.771 0.54 0.569 0.287 0.247
2,2',4,4',5,5'-HxCB1 & 2,3',4,4',5',6-HxCB (PCB153&PCB168) 4.14 8.8 8.8 5.55 3.74
2,2,4,4,5,6-HEXACHLOROBIPHENYL 0.011 0.032 U 0.02 U 0.059 U 0.04
2,2',4,4',6,6'-HEXACHLOROBIPHENYL 0.001 U 0.002 U 0.002 U 0.003 U 0.001 U
2,2',4,5',6-PENTACHLOROBIPHENYL 0.021 0.022 0.026 0.046 0.028
2,2',4,5'-TeCB & 2',3,3',4,5-PeCB (PCB49&PCB69) 2.14 2.17 2.37 1.83 1.38
2,2',4,5-TETRACHLOROBIPHENYL 0.504 0.451 0.514 0.424 0.282
2,2',4,6,6'-PENTACHLOROBIPHENYL 0.001 U 0.002 U 0.002 U 0.002 U 0.001 U
2,2',4,6-TeCB & 2,2',5,6'-TeCB (PCB50&PCB53) 0.591 0.495 0.541 0.326 0.202
2,2',4-TRICHLOROBIPHENYL 0.863 0.699 0.655 0.326 0.288
2,2',5,5'-TETRACHLOROBIPHENYL 3.46 3.36 3.6 3.29 2.27
2,2',5-TrCB1 & 2,4,6-TrCB (PCB18&PCB30) 1.44 1.08 1.16 0.684 0.509
2,2',6,6'-TETRACHLOROBIPHENYL 0.016 0.005 U 0.008 U 0.007 U 0.002
2,2',6-TRICHLOROBIPHENYL 0.353 0.253 0.257 0.061 0.045
2,2'-DICHLOROBIPHENYL 0.567 0.459 0.405 0.137 0.102
2,3,3',4,4',5,5',6-OCTACHLOROBIPHENYL 0.035 0.097 0.107 0.035 U 0.028
2,3,3',4,4',5,5'-HEPTACHLOROBIPHENYL 0.048 0.129 0.128 0.082 0.054
2,3,3',4,4',5',6-HEPTACHLOROBIPHENYL 0.058 0.135 0.141 0.054 0.03
2,3,3',4,4',5,6-HEPTACHLOROBIPHENYL 0.309 0.71 0.7 0.301 0.21
2,3,3',4,4',5-HxCB2 & 2,3,3',4,4',5'-HxCB2 (PCB156&PCB157) 0.365 0.793 0.703 0.839 0.573
2,3,3',4,4',6-HEXACHLOROBIPHENYL 0.377 0.779 0.757 0.578 0.383
2,3,3',4,4'-PENTACHLOROBIPHENYL 0.944 1.59 1.35 2.49 1.91
2,3,3',4,5,5',6-HEPTACHLOROBIPHENYL 0.002 U 0.006 U 0.008 U 0.006 U 0.003 U
2,3,3',4',5,5'-HEXACHLOROBIPHENYL 0.007 U 0.011 U 0.013 0.048 0.03
2,3,3',4,5,5'-HEXACHLOROBIPHENYL 0.065 0.004 U 0.005 U 0.054 0.037
2,3,3',4',5',6-HEXACHLOROBIPHENYL 0.313 0.652 0.668 0.502 0.315
2,3,3',4,5',6-HEXACHLOROBIPHENYL 0.001 U 0.004 U 0.005 U 0.006 U 0.001 U
2,3,3',4,5,6-HEXACHLOROBIPHENYL 0.001 U 0.004 U 0.005 U 0.007 U 0.001 U
2,3,3',4,5'-PeCB & 2',3,4,5,5'-PeCB (PCB108&PCB124) 0.082 0.136 0.122 0.23 0.161
2',3,3',4,5-PENTACHLOROBIPHENYL 0.034 0.059 0.051 0.092 0.065
2,3,3',4',5-PENTACHLOROBIPHENYL 0.135 0.234 0.22 0.465 0.368
2,3,3',4,5-PENTACHLOROBIPHENYL 0.001 U 0.003 U 0.004 U 0.006 U 0.001 U
2,3,3',4',6-PeCB & 2,3,4,4',6-PeCB (PCB110&PCB115) 3.81 6.1 6.11 9.22 5.76
2,3,3',4'-TETRACHLOROBIPHENYL 1.34 1.55 1.76 2.35 1.73
2,3,3',4-TETRACHLOROBIPHENYL 0.016 0.012 U 0.028 U 0.004 U 0.002 U
2,3,3',5,5',6-HEXACHLOROBIPHENYL 0.001 U 0.004 U 0.005 U 0.007 U 0.003 U
2,3,3',5,5'-PENTACHLOROBIPHENYL 0 U 0.003 U 0.004 U 0.005 U 0.004 U
2,3',3,5,6-PENTACHLOROBIPHENYL 2.86 3.91 3.94 3.45 2.09
2,3,3',5,6-PENTACHLOROBIPHENYL 0 U 0.003 U 0.004 U 0.003 U 0 U
2,3,3',5'-TETRACHLOROBIPHENYL 0.001 U 0.004 U 0.005 U 0.16 0.096
2,3,3',5-TETRACHLOROBIPHENYL 0.001 U 0.011 0.015 0.019 0.015
2,3,3',6-TeCB & 2,3,4,6-TeCB & 2,4,4',6-TeCB (PCB59&PCB62&PCB75) 0.328 0.315 0.323 0.313 0.236
2,3,3'-TrCB & 2,4,4'-TrCB1 (PCB20&PCB28) 3.13 3.28 3.62 2.79 2.46
2,3',4,4',5,5'-HEXACHLOROBIPHENYL 0.128 0.289 0.228 0.345 0.239
2,3',4,4',5'-PENTACHLOROBIPHENYL 0.046 0.075 0.039 0.094 0.049
2,3',4,4',5-PENTACHLOROBIPHENYL 2.03 3.29 3.14 5.73 4
2,3,4,4',5-PENTACHLOROBIPHENYL 0.043 0.091 0.07 0.109 0.077
2,3',4,4'-TETRACHLOROBIPHENYL 2.48 2.98 3.27 4.55 3.33
2,3,4,4'-TETRACHLOROBIPHENYL 0.56 0.659 0.787 0.886 0.705
2,3',4,5,5'-PENTACHLOROBIPHENYL 0.003 U 0.008 0.006 U 0.035 0.024
2,3',4,5',6-PENTACHLOROBIPHENYL 0 U 0.003 U 0.004 U 0.004 U 0 U2,3,4,5-TeCB & 2,3',4',5-TeCB & 2,4,4',5-TeCB & 2',3,4',5-TeCB (PCB61&PCB70&PCB74&PCB76) 3.81 4.4 4.9 7.01 5.06
2,3',4,5'-TETRACHLOROBIPHENYL 0.014 0.014 0.018 0.042 0.029
2,3',4,5-TETRACHLOROBIPHENYL 0.071 0.084 0.096 0.112 0.083
2,3,4',5-TETRACHLOROBIPHENYL 0.089 0.104 0.107 0.138 0.102
2,3,4',6-TETRACHLOROBIPHENYL 1.69 1.68 1.82 1.67 1.28
2,3,4-TrCB & 2',3,4-TrCB (PCB21&PCB33) 0.683 0.595 0.722 0.841 0.581
2,3',4-TRICHLOROBIPHENYL 0.317 0.324 0.333 0.259 0.249
2,3,4'-TRICHLOROBIPHENYL 0.928 0.877 1.07 0.662 0.571
2,3',5,5'-TETRACHLOROBIPHENYL 0.022 0.024 0.028 0.059 0.04
2,3',5',6-TETRACHLOROBIPHENYL 0.001 U 0.002 U 0.003 U 0.003 U 0 U
2,3',5-TrCB & 2,4,5-TrCB (PCB26&PCB29) 0.547 0.583 0.578 0.412 0.374
2',3,5-TRICHLOROBIPHENYL 0.012 0.011 U 0.013 U 0.018 0.001 U
2,3,5-TRICHLOROBIPHENYL 0.002 U 0.006 U 0.008 U 0.003 U 0.001 U
2,3',6-TRICHLOROBIPHENYL 0.218 0.18 0.178 0.084 0.072
2,3,6-TRICHLOROBIPHENYL 0.001 U 0.008 U 0.011 U 0.009 U 0.002 U
2,3'-DICHLOROBIPHENYL 0.263 0.188 0.197 0.16 U 0.099
2,3-DICHLOROBIPHENYL 0.031 U 0.006 U 0.008 U 0.025 U 0.006 U
2,4',5-TRICHLOROBIPHENYL 2.13 2.13 2.33 1.79 1.57
2,4',6-TRICHLOROBIPHENYL 0.829 0.723 0.757 0.238 0.203
2,4'-DICHLOROBIPHENYL 0.493 0.54 0.566 0.43 0.225
2,4-DICHLOROBIPHENYL 0.04 0.033 U 0.032 0.03 U 0.018 U
2,5-DICHLOROBIPHENYL 0.055 0.038 0.037 0.033 U 0.019 U
2,6-DICHLOROBIPHENYL 0.03 U 0.022 0.013 U 0.015 U 0.006 U
2-CHLOROBIPHENYL 0.073 0.057 0.064 0.044 0.029
3,3',4,4',5,5'-HEXACHLOROBIPHENYL 0.002 U 0.005 U 0.006 U 0.005 U 0.001 U
3,3',4,4',5-PENTACHLOROBIPHENYL 0.008 U 0.019 0.011 U 0.051 U 0.045
3,3',4,4'-TETRACHLOROBIPHENYL 0.268 0.369 0.411 0.837 0.645
3,3',4,5,5'-PENTACHLOROBIPHENYL 0.002 U 0.006 0.005 0.005 U 0.005
3,3',4,5'-TETRACHLOROBIPHENYL 0.024 0.028 0.03 0.087 0.054
3,3',4,5-TETRACHLOROBIPHENYL 0.001 U 0.003 U 0.004 U 0.003 U 0.002 U
3,3',4-TRICHLOROBIPHENYL 0.029 0.036 0.039 0.079 0.065
3,3',5,5'-TETRACHLOROBIPHENYL 0.001 U 0.003 U 0.004 U 0.003 U 0.002 U
3,3',5-TRICHLOROBIPHENYL 0 U 0.005 U 0.006 U 0.002 U 0.001 U
3,3'-DICHLOROBIPHENYL 0.113 0.132 0.169 0.362 0.454
3,4,4',5-TETRACHLOROBIPHENYL 0.008 U 0.012 U 0.013 U 0.014 0.013
3,4,4'-TRICHLOROBIPHENYL 0.884 1.1 1.23 1.48 1.2
3,4',5-TRICHLOROBIPHENYL 0.014 0.012 U 0.014 0.013 U 0.014
3,4,5-TRICHLOROBIPHENYL 0.002 U 0.006 U 0.007 U 0.002 U 0.002 U
3,4-DiCB & 3,4-DiCB (PCB12&PCB13) 0.113 0.098 0.119 0.22 0.155
3,5-DICHLOROBIPHENYL 0.004 U 0.005 U 0.007 U 0.022 U 0.006 U
3-CHLOROBIPHENYL 0.005 U 0.002 U 0.008 U 0.099 0.062
4,4'-DICHLOROBIPHENYL 0.672 0.652 0.705 0.959 0.792
4-CHLOROBIPHENYL 0.025 0.019 0.028 0.096 0.039PentaCB-PCB86 & PCB87 & PCB97 & PCB109 & PCB119 & PCB125 1.94 2.62 2.52 3.62 2.54
TOTAL PCBs 100 155 157 131 90.6
TOC (%) 1.2 2 2 3.3 2.9
TOC-NORMALIZED CONCENTRATION (µg/kg-TOC) 8333 7750 7850 3970 3124
TABLE B18: PCB congener distributions and total PCB congener sums for Cleveland Harbor Upper Cuyahoga River Channel and Lake Erie sediments (RTI 2015)
LAKE AREAUPPER RIVER CHANNELPCB CONGENER (ng/g)

CH-1 CH-2 CH-3 CH-4 CH-5DMMU-1
COMPCH-6 CH-7 CH-8 CH-9 CH-10
DMMU-2a COMP
CH-11 CH-12 CH-13 CH-14 CH-15DMMU-2b
COMP
ALDRIN 4.4 U1 4.4 U 6.3 U 5.1 U 6 U 4.8 U 6.1 U 5.8 U 5.3 U 6.3 U 5.8 U 5.8 U 6.1 U 5.7 U 5.8 U 6 U 5.8 U 6 U
ALPHA BHC (ALPHA HEXACHLOROCYCLOHEXANE) 4.4 U 4.4 U 6.3 U 5.1 U 6 U 4.8 U 6.1 U 5.8 U 5.3 U 6.3 U 5.8 U 5.8 U 6.1 U 5.7 U 5.8 U 6 U 5.8 U 6 U
ALPHA ENDOSULFAN 4.4 U 4.4 U 6.3 U 5.1 U 6 U 4.8 U 6.1 U 5.8 U 5.3 U 6.3 U 5.8 U 5.8 U 6.1 U 5.7 U 5.8 U 6 U 5.8 U 6 U
ALPHA-CHLORDANE 4.4 U 4.4 U 6.3 U 5.1 U 6 U 4.8 U 6.1 U 5.8 U 5.3 U 6.3 U 5.8 U 5.8 U 6.1 U 5.7 U 5.8 U 6 U 5.8 U 6 U
BETA BHC (BETA HEXACHLOROCYCLOHEXANE) 4.4 U 4.4 U 6.3 U 5.1 U 6 U 4.8 U 6.1 U 5.8 U 5.3 U 6.3 U 5.8 U 5.8 U 6.1 U 5.7 U 5.8 U 6 U 5.8 U 6 U
BETA ENDOSULFAN 4.4 U 4.4 U 6.3 U 5.1 U 6 U 4.8 U 6.1 U 5.8 U 5.3 U 6.3 U 5.8 U 5.8 U 6.1 U 5.7 U 5.8 U 6 U 5.8 U 6 U
CHLORDANE 88 U 87 U 130 U 100 U 120 U 95 U 120 U 110 U 110 U 120 U 120 U 120 U 120 U 110 U 120 U 120 U 120 U 120 U
DELTA BHC (DELTA HEXACHLOROCYCLOHEXANE) 4.4 U 4.4 U 6.3 U 5.1 U 6 U 4.8 U 6.1 U 5.8 U 5.3 U 6.3 U 5.8 U 5.8 U 6.1 U 5.7 U 5.8 U 6 U 5.8 U 6 U
DIELDRIN 4.4 U 4.4 U 6.3 U 5.1 U 6 U 4.8 U 6.1 U 5.8 U 5.3 U 6.3 U 5.8 U 5.8 U 6.1 U 5.7 U 5.8 U 6 U 5.8 U 6 U
ENDOSULFAN SULFATE 4.4 U 4.4 U 6.3 U 5.1 U 6 U 4.8 U 6.1 U 5.8 U 5.3 U 6.3 U 5.8 U 5.8 U 6.1 U 5.7 U 5.8 U 6 U 5.8 U 6 U
ENDRIN 4.4 U 4.4 U 6.3 U 5.1 U 6 U 4.8 U 6.1 U 5.8 U 5.3 U 6.3 U 5.8 U 5.8 U 6.1 U 5.7 U 5.8 U 6 U 5.8 U 6 U
ENDRIN ALDEHYDE 4.4 U 4.4 U 6.3 U 5.1 U 6 U 4.8 U 6.1 U 5.8 U 5.3 U 6.3 U 5.8 U 5.8 U 6.1 U 5.7 U 5.8 U 6 U 5.8 U 6 U
ENDRIN KETONE 4.4 U 4.4 U 6.3 U 5.1 U 6 U 4.8 U 6.1 U 5.8 U 5.3 U 6.3 U 5.8 U 5.8 U 6.1 U 5.7 U 5.8 U 6 U 5.8 U 6 U
GAMMA BHC (LINDANE) 4.4 U 4.4 U 6.3 U 5.1 U 6 U 4.8 U 6.1 U 5.8 U 5.3 U 6.3 U 5.8 U 5.8 U 6.1 U 5.7 U 5.8 U 6 U 5.8 U 6 U
GAMMA-CHLORDANE 4.4 U 4.4 U 6.3 U 5.1 U 6 U 4.8 U 6.1 U 5.8 U 5.3 U 6.3 U 5.8 U 5.8 U 6.1 U 5.7 U 5.8 U 6 U 5.8 U 6 U
HEPTACHLOR 4.4 U 4.4 U 6.3 U 5.1 U 6 U 4.8 U 6.1 U 5.8 U 5.3 U 6.3 U 5.8 U 5.8 U 6.1 U 5.7 U 5.8 U 6 U 5.8 U 6 U
HEPTACHLOR EPOXIDE 4.4 U 4.4 U 6.3 U 5.1 U 6 U 4.8 U 6.1 U 5.8 U 5.3 U 6.3 U 5.8 U 5.8 U 6.1 U 5.7 U 5.8 U 6 U 5.8 U 6 U
METHOXYCHLOR 4.4 U 4.4 U 6.3 U 5.1 U 6 U 4.8 U 6.1 U 5.8 U 5.3 U 6.3 U 5.8 U 5.8 U 6.1 U 5.7 U 5.8 U 6 U 5.8 U 6 U
TOXAPHENE 88 U 87 U 130 U 100 U 120 U 95 U 120 U 110 U 110 U 120 U 120 U 120 U 120 U 110 U 120 U 120 U 120 U 120 U
DDD (DICHLORODIPHENYLDICHLORETHANE) 4.4 U 4.4 U 6.3 U 5.1 U 6 U 4.8 U 6.1 U 5.8 U 5.3 U 6.3 U 5.8 U 5.8 U 6.1 U 5.7 U 5.8 U 6 U 5.8 U 6 U
DDE (DICHLORODIPHENYLDICHLORETHYLENE) 2.9 4.4 U 6.3 U 16 6 U 4.8 U 6.1 U 5.8 U 5.3 U 6.3 U 5.8 U 5.8 U 6.1 U 5.7 U 5.8 U 6 U 5.8 U 6 U
DDT (DICHLORODIPHENYLTRICHLOROETHANE) 4 4.4 U 6.3 U 5.1 U 6 U 4.8 U 6.1 U 5.8 U 5.3 U 6.3 U 5.8 U 5.8 U 6.1 U 5.7 U 5.8 U 6 U 5.8 U 6 U
∑DDT 6.9 ND ND 16 ND ND ND ND ND ND ND ND ND ND ND ND ND ND
TOC (%) 0.46 0.66
TOC-NORMALIZED ∑DDT CONCENTRATIONS (µg/kg-TOC) 1500 2424
CLA1-1 CLA1-2 CLA1-3 CLA1-4 CLA1-5 CLA1 COMP CLA4-1 CLA4-2 CLA4-3 CLA4-4 CLA4-5 CLA4 COMP
ALDRIN 2 U 2.8 U 2.8 U 2.4 U 2.7 U 2.6 U 12 U 13 U 13 U 12 U 12 U 12 U
ALPHA BHC (ALPHA HEXACHLOROCYCLOHEXANE) 2 U 2.8 U 2.8 U 2.4 U 2.7 U 2.6 U 12 U 13 U 13 U 12 U 12 U 12 U
ALPHA ENDOSULFAN 2 U 2.8 U 2.8 U 2.4 U 2.7 U 2.6 U 12 U 13 U 13 U 12 U 12 U 12 U
ALPHA-CHLORDANE 2 U 2.8 U 2.8 U 2.4 U 2.7 U 2.6 U 12 U 13 U 13 U 12 U 12 U 12 U
BETA BHC (BETA HEXACHLOROCYCLOHEXANE) 2 U 2.8 U 2.8 U 2.4 U 2.7 U 2.6 U 12 U 13 U 13 U 12 U 12 U 12 U
BETA ENDOSULFAN 2 U 2.8 U 2.8 U 2.4 U 2.7 U 2.6 U 12 U 13 U 13 U 12 U 12 U 12 U
CHLORDANE 40 U 56 U 55 U 49 U 54 U 51 U 250 U 250 U 260 U 240 U 230 U 240 U
DELTA BHC (DELTA HEXACHLOROCYCLOHEXANE) 2 U 2.8 U 2.8 U 2.4 U 2.7 U 2.6 U 12 U 13 U 13 U 12 U 12 U 12 U
DIELDRIN 2 U 2.8 U 2.8 U 2.4 U 2.7 U 2.6 U 12 U 13 U 13 U 12 U 12 U 12 U
ENDOSULFAN SULFATE 3.5 2.8 U 2.8 U 1.8 2.5 3.4 12 U 13 U 13 U 12 U 12 U 12 U
ENDRIN 2 U 2.8 U 2.8 U 2.2 2.7 U 2.6 U 12 U 13 U 13 U 12 U 12 U 12 U
ENDRIN ALDEHYDE 2 U 2.8 U 2.8 U 1.8 2.7 U 3.4 20 13 U 13 U 12 U 12 U 12 U
ENDRIN KETONE 2 U 2.8 U 2.8 U 2.4 U 2.7 U 2.6 U 12 U 13 U 13 U 12 U 12 U 12 U
GAMMA BHC (LINDANE) 2 U 2.8 U 2.8 U 1.7 2.7 U 2.6 U 12 U 13 U 13 U 12 U 12 U 12 U
GAMMA-CHLORDANE 2 U 2.8 U 2.8 U 2.4 U 2.7 U 2.6 U 12 U 13 U 13 U 12 U 12 U 12 U
HEPTACHLOR 2 U 2.8 U 2.8 U 2.4 U 2.7 U 2.6 U 12 U 13 U 13 U 12 U 12 U 12 U
HEPTACHLOR EPOXIDE 2 U 2.8 U 2.8 U 1.5 2.7 U 2.6 U 12 U 13 U 13 U 12 U 12 U 12 U
METHOXYCHLOR 2 U 2.8 U 2.8 U 2.4 U 2.7 U 2.6 U 12 U 13 U 13 U 12 U 12 U 12 U
TOXAPHENE 40 U 56 U 55 U 49 U 54 U 51 U R R R R R R
DDD (DICHLORODIPHENYLDICHLORETHANE) 5.1 4 2.8 U 3 4.7 4.5 12 U 13 U 13 U 12 U 12 12 U
DDE (DICHLORODIPHENYLDICHLORETHYLENE) 2 U 4.3 2.8 U 4.9 7.6 5.5 12 U 13 U 27 12 U 18 12 U
DDT (DICHLORODIPHENYLTRICHLOROETHANE) 2 U 2.8 U 2.8 U 7.9 2.7 U 2.6 U 12 U 13 U 13 U 12 U 19 12 U
∑DDT 5.1 8.3 ND 15.8 12.3 10 ND ND 27 ND 49 ND
TOC (%) 3.9 3.2 2.9 2.4 3.3 3 2.8
TOC-NORMALIZED ∑DDT CONCENTRATIONS (µg/kg-TOC) 131 259 545 513 303 900 1750
DMMU-2b
UPPER RIVER CHANNEL
TABLE B19: Bulk pesticides data on Cleveland Harbor Upper Cuyahoga River Channel and Lake Erie sediments (RTI 2015)
1 Not detected at the specified detection limit2 Rejected data (MS/MSD and LCS %REC < LCL, high potential of low bias)
CLA-1 CLA-4
PESTICIDE (µg/kg)
PESTICIDE (µg/kg)
LAKE AREA
DMMU-1 DMMU-2a

CH-1 CH-2 CH-3 CH-3 CORE CH-4 CH-5 CH-5 COREDMMU-1
COMPCH-6 CH-7 CH-7 CORE CH-8 CH-9 CH-9 CORE CH-10
DMMU-2a COMP
CH-11 CH-12 CH-12 CORE CH-13 CH-14 CH-15 CH-15 COREDMMU-2b
COMP
2-METHYLNAPHTHALENE 11 27 53 220 68 35 87 29 40 30 59 36 33 52 27 28 35 24 78 35 39 37 56 30
ACENAPHTHENE 5.7 63 52 15 91 34 50 31 56 22 22 20 27 26 20 20 39 17 51 24 20 20 31 23
ACENAPHTHYLENE 4 6 26 6.9 39 20 22 16 25 19 19 20 27 18 14 18 24 15 32 14 16 21 22 19
ANTHRACENE 15 100 150 40 290 110 160 85 170 74 76 75 100 81 58 72 94 51 140 72 68 71 89 75
BENZO(A)ANTHRACENE 74 240 480 74 670 480 430 290 650 320 330 320 390 360 280 300 510 260 480 350 250 250 400 340
BENZO(A)PYRENE 79 310 550 65 650 570 450 350 790 400 400 400 480 450 350 390 750 360 580 510 340 300 500 490
BENZO(B)FLUORANTHENE 120 370 890 110 900 1100 820 580 1600 720 750 760 890 970 650 790 1400 640 1300 950 600 500 1100 960
BENZO(G,H,I)PERYLENE 66 220 270 36 260 290 170 130 410 200 150 210 250 160 200 160 450 200 200 270 160 140 200 230
BENZO(K)FLUORANTHENE 44 110 260 29 330 310 220 250 450 210 250 260 310 250 240 250 420 210 300 250 210 160 310 320
CHRYSENE 88 230 560 76 640 640 480 350 940 410 430 420 530 500 400 410 850 400 650 580 340 310 590 510
DIBENZ(A,H)ANTHRACENE 12 50 69 15 76 70 60 44 120 47 54 60 59 49 43 56 120 61 58 75 51 47 62 70
FLUORANTHENE 180 510 1100 210 1400 1300 1200 760 1900 810 900 870 1100 970 800 830 1700 830 1300 1200 670 630 1100 1000
FLUORENE 6.2 38 63 21 130 49 80 33 72 27 39 34 37 44 25 26 53 25 81 36 27 28 54 30
INDENO(1,2,3-C,D)PYRENE 53 180 250 36 250 37 190 140 390 190 180 200 210 150 170 160 430 180 210 270 150 130 210 220
NAPHTHALENE 8.8 40 50 140 70 35 67 24 44 29 52 33 28 43 24 26 50 28 93 31 38 31 53 32
PHENANTHRENE 82 370 670 150 1100 620 690 410 890 370 390 380 470 440 350 380 730 360 660 490 310 270 530 460
PYRENE 170 460 1000 160 1200 1100 970 640 1500 720 780 710 870 1100 700 710 1300 610 1500 920 570 520 1300 870
TOTAL PAHs 1,008 3,297 6,440 1,184 8,096 6,765 6,059 4,133 10,007 4,568 4,822 4,772 5,778 5,611 4,324 4,598 8,920 4,247 7,635 6,042 3,820 3,428 6,551 5,649
TOC (%) 0.46 0.19 2.4 0.59 0.66 2.3 2.9 1.2 2.2 1.7 2 1.6 2.3 1.8 2.1 2 2 1.8 2 1.9 1.8 1.8 1.8 2
TOC-NORMALIZED CONCENTRATION (mg/kg-TOC) 219 1735 268 201 1227 294 209 344 455 269 241 298 251 312 206 230 446 236 382 318 212 190 364 282
CLA1-1 CLA1-2 CLA1-3 CLA1-4 CLA1-5 CLA1 COMP CLA4-1 CLA4-2 CLA4-3 CLA4-4 CLA4-5 CLA4 COMP
2-METHYLNAPHTHALENE 190 17 33 86 110 78 9.8 14 12 9.4 8.3 13
ACENAPHTHENE 360 21 U 34 140 150 120 18 U 19 U 19 U 18 U 18 U 18 U
ACENAPHTHYLENE 390 11 44 84 150 85 11 7.7 9.1 11 7.1 9.6
ANTHRACENE 930 21 88 480 320 250 16 14 18 19 17 22
BENZO(A)ANTHRACENE 1900 71 220 670 740 500 74 67 66 89 74 79
BENZO(A)PYRENE 2000 90 260 640 1000 640 85 67 79 95 83 91
BENZO(B)FLUORANTHENE 2400 120 320 790 1200 770 130 98 120 130 130 130
BENZO(G,H,I)PERYLENE 1200 84 200 420 720 440 100 67 71 80 79 68
BENZO(K)FLUORANTHENE 760 53 95 230 390 300 48 38 39 56 47 60
CHRYSENE 2000 73 220 620 740 540 73 60 78 90 84 81
DIBENZ(A,H)ANTHRACENE 350 15 57 110 170 110 38 18 25 26 22 19
FLUORANTHENE 3100 150 350 1300 1200 1000 150 120 140 160 150 160
FLUORENE 390 9.8 33 180 120 120 12 7.7 9.1 7 11 9.6
INDENO(1,2,3-C,D)PYRENE 1100 64 170 360 630 420 82 55 58 70 65 63
NAPHTHALENE 580 39 120 250 390 230 21 22 22 18 20 22
PHENANTHRENE 1800 60 180 900 630 550 47 45 49 54 53 65
PYRENE 2900 140 320 1100 1100 860 110 110 120 140 140 150
Total PAHs 22,160 1,001 2,711 8,274 9,650 6,935 997 796 903 1,045 982 1,029
TOC (%) 3.9 3.2 3.2 2.9 2.4 3.3 2.8 2.8 3 3 2.8 2.9
TOC-NORMALIZED CONCENTRATION (mg/kg-TOC) 568 31.3 84.7 285 402 210 35.6 28.4 30.1 34.8 35.1 35.5
1 Not detected at the specified detection limit
CLA-1 CLA-4
TABLE B20: Bulk PAH data (sum of 16 USEPA Priority Pollutants) on Cleveland Harbor Upper Cuyahoga River Channel and Lake Erie sediments (RTI 2015)
PAH COMPOUND (µg/kg)
UPPER RIVER CHANNEL
PAH COMPOUND (µg/kg)
LAKE AREA
DMMU-1 DMMU-2a DMMU-2b

CLA1-2 CLA4-COMP
1-METHYLNAPHTHALENE 0.05 U1 0.05 U 0.05 U 0.05 U 0.05 U 0.05 U 0.05 U 0.05 U 0.05 U 0.05 U 0.05 U 0.05 U 0.05 U 0.05 U 0.05 U 0.05 U 75.37
2-METHYLNAPHTHALENE 0.05 U 0.05 U 0.05 U 0.05 U 0.05 U 0.05 U 0.05 U 0.05 U 0.05 U 0.05 U 0.05 U 0.05 U 0.05 U 0.05 U 0.05 U 0.05 U 72.16
ACENAPHTHENE 0.1 U 0.1 U 0.1 U 0.24 0.004 0.1 U 0.1 U 0.1 U 0.1 0.002 0.1 U 2.47 0.044 0.1 U 0.1 U 0.24 0.004 0.1 U 0.1 U 0.1 U 55.85
ACENAPHTHYLENE 0.2 U 0.2 U 0.2 U 0.2 U 0.2 U 0.2 U 0.2 U 0.2 U 0.2 U 0.52 0.002 0.2 U 0.2 U 0.2 U 0.2 U 0.2 U 0.2 U 306.9
ANTHRACENE 0.05 U 0.05 U 0.05 U 0.05 U 0.05 U 0.05 U 0.05 U 0.05 U 0.05 U 0.39 0.019 0.05 U 0.05 U 0.05 U 0.05 U 0.05 U 0.05 U 20.73
BENZO(A)ANTHRACENE 0.001 U 0.001 U 0.001 U 0.001 U 0.001 U 0.001 U 0.001 U 0.001 U 0.001 U 0.05 0.022 0.001 U 0.001 U 0.001 U 0.001 U 0.001 U 0.001 U 2.227
BENZO(A)PYRENE 0.008 U 0.008 U 0.008 U 0.008 U 0.008 U 0.008 U 0.008 U 0.008 U 0.008 U 0.008 U 0.008 U 0.008 U 0.008 U 0.008 U 0.008 U 0.008 U 0.9573
BENZO(B,K)FLUORANTHENE 0.005 U 0.005 U 0.005 U 0.005 U 0.005 U 0.005 U 0.005 U 0.005 U 0.005 U 0.005 U 0.005 U 0.005 U 0.005 U 0.005 U 0.005 U 0.005 U 0.6415
BENZO(E)PYRENE 0.005 U 0.005 U 0.005 U 0.005 U 0.005 U 0.005 U 0.005 U 0.005 U 0.005 U 0.005 U 0.005 U 0.005 U 0.005 U 0.005 U 0.005 U 0.005 U 0.9008
BENZO(G,H,I)PERYLENE 0.001 U 0.001 U 0.001 U 0.001 U 0.001 U 0.001 U 0.001 U 0.001 U 0.001 U 0.001 U 0.001 U 0.001 U 0.001 U 0.001 U 0.001 U 0.001 U 0.4391
C1 - CHRYSENE 0.005 U 0.005 U 0.005 U 0.005 U 0.005 U 0.005 U 0.005 U 0.005 U 0.005 U 0.005 U 0.005 U 0.005 U 0.005 U 0.005 U 0.005 U 0.005 U 0.8557
C1 - FLUORANTHENE/PYRENE 0.01 U 0.01 U 0.01 U 0.11 0.023 0.01 U 0.01 U 0.01 U 0.01 U 0.01 U 0.53 0.108 0.01 U 0.01 U 0.01 U 0.01 U 0.01 U 0.01 U 4.887
C1 - FLUORENE 0.02 U 0.02 U 0.02 U 0.02 U 0.02 U 0.02 U 0.02 U 0.02 U 0.02 U 2.25 0.161 0.02 U 0.02 U 0.02 U 0.02 U 0.02 U 0.02 U 13.99
C1 - PHENANTHRENE/ANTHRACENE 0.02 U 0.02 U 0.02 U 0.3 0.040 0.02 U 0.02 U 0.02 U 0.02 U 0.02 U 2.62 0.352 0.02 U 0.02 U 0.39 0.052 0.02 U 0.48 0.065 0.02 U 7.436
C2 - CHRYSENE 0.01 U 0.01 U 0.01 U 0.01 U 0.01 U 0.01 U 0.01 U 0.01 U 0.01 U 0.01 U 0.01 U 0.01 U 0.01 U 0.01 U 0.01 U 0.01 U 0.4827
C2 - FLUORENE 0.05 U 0.05 U 0.05 U 0.05 U 0.05 U 0.05 U 0.05 U 0.05 U 0.05 U 3.09 0.582 0.05 U 0.05 U 0.05 U 0.05 U 0.05 U 0.05 U 5.305
C2 - NAPHTHALENE 0.15 U 0.15 U 0.15 U 0.15 U 0.15 U 0.15 U 0.15 U 0.15 U 0.15 U 7.06 0.233 0.15 U 0.15 U 1.19 0.039 0.15 U 1.61 0.053 0.15 U 30.24
C2 - PHENANTHRENE/ANTHRACENE 0.05 U 0.05 U 0.05 U 1.66 0.519 0.05 U 0.05 U 0.05 U 0.05 U 0.05 U 5.18 1.619 0.05 U 0.05 U 0.05 U 0.05 U 0.05 U 0.05 U 3.199
C3 - CHRYSENE 0.01 U 0.01 U 0.01 U 0.01 U 0.01 U 0.01 U 0.01 U 0.01 U 0.01 U 0.01 U 0.01 U 0.01 U 0.01 U 0.01 U 0.01 U 0.01 U 0.1675
C3 - FLUORENE 0.06 U 0.06 U 0.06 U 0.06 U 0.06 U 0.06 U 0.06 U 0.06 U 0.06 U 3.39 1.769 0.06 U 0.06 U 0.06 U 0.06 U 0.06 U 0.06 U 1.916
C3 - NAPHTHALENE 0.05 U 0.05 U 0.05 U 0.05 U 0.05 U 0.05 U 0.05 U 0.05 U 0.05 U 27.78 2.503 0.05 U 0.05 U 2.81 0.253 0.05 U 1.64 0.148 0.05 U 11.1
C3 - PHENANTHRENE/ANTHRACENE 0.04 U 0.04 U 0.04 U 1.33 1.059 0.04 U 0.04 U 0.04 U 0.04 U 0.04 U 4.27 3.400 0.04 U 0.04 U 0.04 U 0.04 U 0.04 U 0.04 U 1.256
C4 - CHRYSENE 0.01 U 0.01 U 0.01 U 0.01 U 0.01 U 0.01 U 0.01 U 0.01 U 0.01 U 0.01 U 0.01 U 0.01 U 0.01 U 0.01 U 0.01 U 0.01 U 0.07062
C4 - NAPHTHALENE 0.15 U 0.15 U 0.15 U 0.15 U 0.15 U 0.15 U 0.15 U 0.15 U 0.15 U 24.21 5.981 0.15 U 0.15 U 2.64 0.652 0.15 U 0.15 U 0.15 U 4.048
C4 - PHENANTHRENE/ANTHRACENE 0.02 U 0.02 U 0.02 U 0.02 U 0.02 U 0.02 U 0.02 U 0.02 U 0.02 U 2.81 5.023 0.02 U 0.02 U 0.02 U 0.02 U 0.02 U 0.02 U 0.5594
CHRYSENE 0.001 U 0.001 U 0.001 U 0.001 U 0.001 U 0.001 U 0.001 U 0.001 U 0.001 U 0.08 0.039 0.001 U 0.001 U 0.001 U 0.001 U 0.001 U 0.001 U 2.042
DIBENZ(A,H)ANTHRACENE 0.002 U 0.002 U 0.002 U 0.002 U 0.002 U 0.002 U 0.002 U 0.002 U 0.002 U 0.002 U 0.002 U 0.002 U 0.002 U 0.002 U 0.002 U 0.002 U 0.2825
FLUORANTHENE 0.09 0.013 0.09 0.013 0.09 0.013 0.05 0.007 0.07 0.010 0.05 0.007 0.06 0.008 0.06 0.008 0.05 0.007 0.95 0.134 0.01 U 0.02 0.003 0.09 0.013 0.04 0.006 0.05 0.007 0.01 U 7.109
FLUORENE 0.04 U 0.04 U 0.04 U 0.07 0.002 0.04 U 0.04 U 0.04 U 0.04 U 0.04 U 1.48 0.038 0.04 U 0.04 U 0.09 0.002 0.04 U 0.07 0.002 0.04 U 39.3
INDENO(1,2,3-C,D)PYRENE 0.001 U 0.001 U 0.001 U 0.001 U 0.001 U 0.001 U 0.001 U 0.001 U 0.001 U 0.001 U 0.001 U 0.001 U 0.001 U 0.001 U 0.001 U 0.001 U 0.275
NAPHTHALENE 0.31 0.002 0.1 U 0.1 U 0.23 0.001 0.15 0.001 0.1 U 0.1 U 0.24 0.001 0.13 0.001 0.42 0.002 0.1 U 0.1 U 0.1 U 0.1 U 0.11 0.001 0.1 U 193.5
PERYLENE 0.004 U 0.004 U 0.004 U 0.004 U 0.004 U 0.004 U 0.004 U 0.004 U 0.004 U 0.004 U 0.004 U 0.004 U 0.004 U 0.004 U 0.004 U 0.004 U 0.9008
PHENANTHRENE 0.13 0.007 0.1 U 0.1 U 0.27 0.014 0.1 U 0.1 U 0.1 U 0.11 0.006 0.1 U 2.09 0.109 0.1 U 0.1 U 0.2 0.010 0.1 U 0.15 0.008 0.1 U 19.13
PYRENE 0.07 0.007 0.07 0.007 0.07 0.007 0.09 0.009 0.1 0.010 0.11 0.011 0.13 0.013 0.12 0.012 0.12 0.012 0.76 0.075 0.01 U 0.03 0.003 0.08 0.008 0.04 0.004 0.05 0.005 0.01 U 10.11
∑TU <0.1 <0.1
PAH FCV (µg/L)PAH COMPOUND (µg/L)UPPER RIVER CHANNEL UPPER RIVER CHANNEL (DISCRETE CORE SAMPLES) LAKE AREA
CH-9 CLA1-1 CLA1-3
1.7 <0.1 <0.1
CH-5CH-3 CH-7
<0.1
CH-12
<0.1
CH-15
<0.1
1 Not detected at the specified detection limit
TABLE B21: PAH (34: 18 non-alkylated parent compounds and 16 groups of generic alkylated forms) pore water concentrations in Cleveland Harbor Upper Cuyahoga River Channel and Lake Erie sediments with calculated USEPA Toxic Units (RTI 2015)
<0.1
DMMU-2a DMMU-2b
<0.1
DMMU-1
<0.1 22.2 0.3
CLA1-COMPCLA1-4
1.0<0.1
CLA1-5
<0.1

DMMU-1 DMMU-2a DMMU-2b CLA-1 CLA-4Initial 92±8.4 50±25.51 58±131 98±4.5 94±13.4 98±4.5
Follow-up2 92±8.4 86±11.4 94±5.5 92±8.4 90±10Mean Survival (%) Initial 92±4.5 88±13 88±13 92±11 96±8.9 100
Mean Growth (mass, mg DW)
Initial 2.638±0.580 1.448±0.283 0.798±0.040 1.864±0.158 1.849±0.376 1.986±0.185
1 Lower survival was statistically significant.2 Bioassay re-run following removal of native worms from sediment samples.
C. dilutus
TABLE B22. Results of standard 10-day Hyalella azteca and Chironomus dilutus solid phase bioassays (±1 standard deviation [SD] from the mean) on Cleveland Harbor Upper Cuyahoga River Channel and open-lake area sediments (USAERDC 2015).
Test SpeciesMeasurement
EndpointUpper River Channel Lake Area
Control
H. azteca Mean Survival (%)
Bioassay

A 151B 132C 134D 143E 205
153A 125B 189C 136D 168E 200
164A 155B 137C 140D 186E 288
181A 75.0B 97.4C 83.8D 109E 120
97.0A 34.8B 34.9C 31.4D 30.7E 38.1
34.0
TABLE B23. Results of standard 28-day Lumbriculus variegatus PCB bioaccumulation experiments on Cleveland Harbor Upper Cuyahoga River Channel and open-lake area sediments (USAERDC 2016).
AREA
UPPER RIVER CHANNEL
LAKE
TOTAL PCB CONCENTRATION IN TISSUE (µg/kg-tissue)
MEAN
CLA-4
MEAN
MEAN
DMMU-2a
MEAN
DMMU-2b
MEAN
CLA-1
DMMU-1
MANAGEMENT UNIT/LAKE AREA
REPLICATETOTAL PCB CONCENTRATION IN
SEDIMENT (COMPOSITE SAMPLE) (µg/kg-sediment)
131
90.6
100
156
157

A B C D EDDD 4.6U1 4.7U 3.8U 3.9U 4.4UDDE 8.3 P2 8.8 8.8 7.6 8.5 8.4DDT 4.6U 4.7U 3.8U 3.9U 4.4U
ALPHA-CHLORDANE 2.6U 2.6U 2.1U 2.2U 2.4UALPHA-BHC 2.0U 2.0U 1.7U 1.7U 1.9U
METHOXYLCHLOR 2.6U 2.7U 2.2U 2.2U 2.5UDIELDRIN 2.5U 2.5U 2.1U 2.1U 2.4U
DDD 3.3U 3.4U 3.5U 2.7U 4.1UDDE 7.4 6 5.7 Pm3 6.0 P 8.3 P 6.7DDT 3.3U 3.4U 3.5U 2.7U 4.1U
ALPHA-CHLORDANE 1.9U 1.9U 2.0U 1.5U 17 P 4.5ALPHA-BHC 1.5U 1.5U 2.7 J4P 2.1 JP 2.7 JP 1.8
METHOXYLCHLOR 1.9U 1.9U 29 P 7.5 P 8.8 P 9.4DIELDRIN 1.8U 1.8U 9.9 P 6.9 P 15 P 6.7
DDD 3.4U 3.1U 3.2U 4.3U 3.1UDDE 7.6 P 6.3 P 6.1 P 7.4 P 9.0 P 7.3DDT 3.4U 3.1U 3.2U 4.3U 3.1U
ALPHA-CHLORDANE 9.4 m 3.3 JP 4.6 6.7 6.1 m 6ALPHA-BHC 2.1 JP 2.2 JP 1.4U 2.5 JP 2 JP 1.9
METHOXYLCHLOR 2.0U 5 3.1 J 5.4 42 P 11.3DIELDRIN 6.7 P 8.3 P 7.7 P 9.4 P 13 P 9
DDD 5.3U 4.3U 4.1U 4.2U 3.5UDDE 5.3U 7 5.9 6.1 6.5 6.4DDT 5.3U 4.3U 4.1U 4.2U 3.5U
ALPHA-CHLORDANE 2.9U 2.4U 2.3U 2.4U 2.0UALPHA-BHC 2.3U 1.9U 1.8U 1.8U 1.5U
METHOXYLCHLOR 3.0U 2.5U 2.3U 2.4U 2.0UDIELDRIN 2.8U 2.3U 2.2U 2.3U 1.9U
DDD 5.2U 4.9U 3.8U 3.7U 3.8UDDE 5.2U 4.9U 3.8U 3.7U 3.8UDDT 5.2U 4.9U 3.8U 3.7U 3.8U
ALPHA-CHLORDANE 2.9U 2.7U 2.1U 2.1U 2.1UALPHA-BHC 2.3U 2.1U 1.7U 1.6U 1.7U
METHOXYLCHLOR 3.0U 2.8U 2.2U 2.1U 2.2UDIELDRIN 2.8U 2.6U 2.1U 2.0U 2.0U
1 Not detected at the specified detection limit2 Second GC column RPD exceeds 40%3 Manual Integration used to determine area response4 Estimated value
TABLE B24. Results of standard 28-day Lumbriculus variegatus pesticides bioaccumulation experiments on Cleveland Harbor Upper Cuyahoga River Channel and open-lake area sediments (USAERDC 2016).
LAKE
UPPER RIVER CHANNEL
AREAMANAGEMENT UNIT/LAKE
AREAPESTICIDE
CONCENTRATION IN TISSUE (µg/kg)
DMMU-1
DMMU-2a
DMMU-2b
CLA-1
REPLICATE
CLA-4
MEAN

CLA-1 CLA-4 DMMU-1 DMMU-2a DMMU-2bALUMINUM 0.018 0.043 0.3 0.12 0.44ANTIMONY 0.001 U1 0.001 U 0.001 U 0.001 U 0.001 U 0.9ARSENIC 0.001 0.001 0.018 0.035 0.047 0.34BARIUM 0.021 0.017 0.25 0.25 0.28 2BERYLLIUM R2 0.001 U 0.001 U 0.001 U 0.001 UCADMIUM 0.001 U 0.001 0.001 U 0.001 U 0.001 U 0.0043CALCIUM 37 32 52 74 80CHROMIUM, TOTAL 0.001 0.001 0.001 0.001 0.003 0.57COBALT 0.001 U 0.001 U 0.001 0.001 0.002 0.22COPPER 0.002 0.001 R R R 0.013IRON 0.12 U 0.092 3.1 5.3 9.9LEAD 0.001 U 0.001 U 0.003 0.002 0.004 0.097MAGNESIUM 9 8.7 11 15 16MANGANESE 0.002 0.001 1.9 2.8 2.5MERCURY 0 0 0 0 U 0 U 0.0014NICKEL 0.002 0.002 0.006 0.006 0.006 0.47POTASSIUM 1.4 1.3 4.9 6.1 7.5SELENIUM 0.003 U 0.003 U 0.003 U 0.002 0.003 USILVER R 0.001 U 0.001 U 0.001 U 0.001 USODIUM 9.4 9.2 25 32 35THALLIUM 0.001 U 0.001 U 0.001 U 0.001 U 0.001 U 0.079VANADIUM 0.001 U 0.001 U 0.001 0.001 0.002 0.15ZINC 0.003 0.003 0.021 0.021 0.023 0.12
1 Not detected at the specified detection limit.
OMZM WATER QUALITY CRITERION
(mg/L)
TABLE B25: Metal SET data on Cleveland Harbor Upper Cuyahoga River Channel sediments (RTI 2015)
METAL (mg/L)
2 Strong method blank bias.
LAKE WATER UPPER RIVER CHANNEL

CLA-1 CLA-4 DMMU-1 DMMU-2a DMMU-2b
CYANIDE 0.014 0.009 0.016 0.015 0.014 0.022NITROGEN, AMMONIA 0.1 0.1 5.7 8.7 19 4.5NITROGEN, TOTAL KJELDAHL (TKN) 6.9 0.95 5 8 14PHOSPHORUS, TOTAL (AS P) 0.011 0.008 0.19 0.28 0.32 1
PARAMETER (mg/L)
LAKE WATER UPPER RIVER CHANNEL OMZM WATER QUALITY CRITERION
(mg/L)
TABLE B26: Nutrient and cyanide SET data on Cleveland Harbor Upper Cuyahoga River Channel sediments (RTI 2015)

CLA-1 CLA-4 DMMU-1 DMMU-2a DMMU-2bAroclor 1016 0.041 U1 0.042 U 0.043 U 0.043 U 0.043 UAroclor 1221 0.041 U 0.042 U 0.043 U 0.043 U 0.043 UArcolor 1232 0.041 U 0.042 U 0.043 U 0.043 U 0.043 UAroclor 1242 0.041 U 0.042 U 0.043 U 0.043 U 0.043 UAroclor 1248 0.041 U 0.042 U 0.043 U 0.043 U 0.043 UAroclor 1254 0.041 U 0.042 U 0.043 U 0.043 U 0.043 UAroclor 1260 0.041 U 0.042 U 0.043 U 0.043 U 0.043 UAroclor 1262 0.051 U 0.053 U 0.053 U 0.054 U 0.054 UAroclor 1268 0.1 U 0.11 U 0.11 U 0.11 U 0.11 UTOTAL PCBs (SUM OF AROCLORS) 0 U 0 U 0 U 0 U 0 U
1 Not detected at the specified detection limit.
TABLE B27: PCB SET data on Cleveland Harbor Upper Cuyahoga River Channel sediments (RTI 2015)
PCB (µg/L)LAKE WATER UPPER RIVER CHANNEL

CLA-1 CLA-4 DMMU-1 DMMU-2a DMMU-2b
ALDRIN 0.004 U1 0.004 U 0.004 U 0.004 U 0.004 UALPHA BHC (ALPHA HEXACHLOROCYCLOHEXANE) 0.004 U 0.004 U 0.004 U 0.004 U 0.004 UALPHA ENDOSULFAN 0.004 U 0.004 U 0.004 U 0.004 U 0.009ALPHA-CHLORDANE 0.004 U 0.004 U 0.004 U 0.004 U 0.004 UBETA BHC (BETA HEXACHLOROCYCLOHEXANE) 0.004 U 0.004 U 0.004 U 0.004 U 0.004 UBETA ENDOSULFAN 0.004 U 0.004 U 0.004 U 0.004 U 0.004 UCHLORDANE 0.1 U 0.11 U 0.11 U 0.11 U 0.11 UDDD (DICHLORODIPHENYLDICHLORETHANE) 0.004 U 0.004 U 0.004 U 0.004 U 0.004 UDDE (DICHLORODIPHENYLDICHLORETHYLENE) 0.004 U 0.004 U 0.004 U 0.004 U 0.024 1.1 2
DDT (DICHLORODIPHENYLTRICHLOROETHANE) 0.004 U 0.004 U 0.004 U 0.004 U 0.004 UDELTA BHC (DELTA HEXACHLOROCYCLOHEXANE) 0.004 U 0.004 U 0.004 U 0.004 U 0.004 UDIELDRIN 0.004 U 0.004 U 0.004 U 0.004 U 0.004 UENDOSULFAN SULFATE 0.004 U 0.004 U 0.004 U 0.004 U 0.004 UENDRIN 0.004 U 0.004 U 0.004 U 0.004 U 0.004 UENDRIN ALDEHYDE 0.004 U 0.004 U 0.004 U 0.004 U 0.004 UENDRIN KETONE 0.004 U 0.004 U 0.004 U 0.004 U 0.004 UGAMMA BHC (LINDANE) 0.004 U 0.004 U 0.004 U 0.004 U 0.004 UGAMMA-CHLORDANE 0.004 U 0.004 U 0.004 U 0.004 U 0.004 UHEPTACHLOR 0.004 U 0.004 U 0.004 U 0.004 U 0.004 UHEPTACHLOR EPOXIDE 0.004 U 0.004 U 0.004 U 0.004 U 0.004 UMETHOXYCHLOR 0.004 U 0.004 U 0.004 U 0.004 U 0.004 UTOXAPHENE 0.1 U 0.11 U 0.11 U 0.11 U 0.11 U
2 Federal criteria maximum concentration (CMC).
TABLE B28: Pesticide SET data on Cleveland Harbor Upper Cuyahoga River Channel sediments (RTI 2015)
1 Not detected at the specified detection limit.
PESTICIDE (µg/L)
LAKE WATER UPPER RIVER CHANNEL OMZM WATER QUALITY CRITERION
(µg/L)
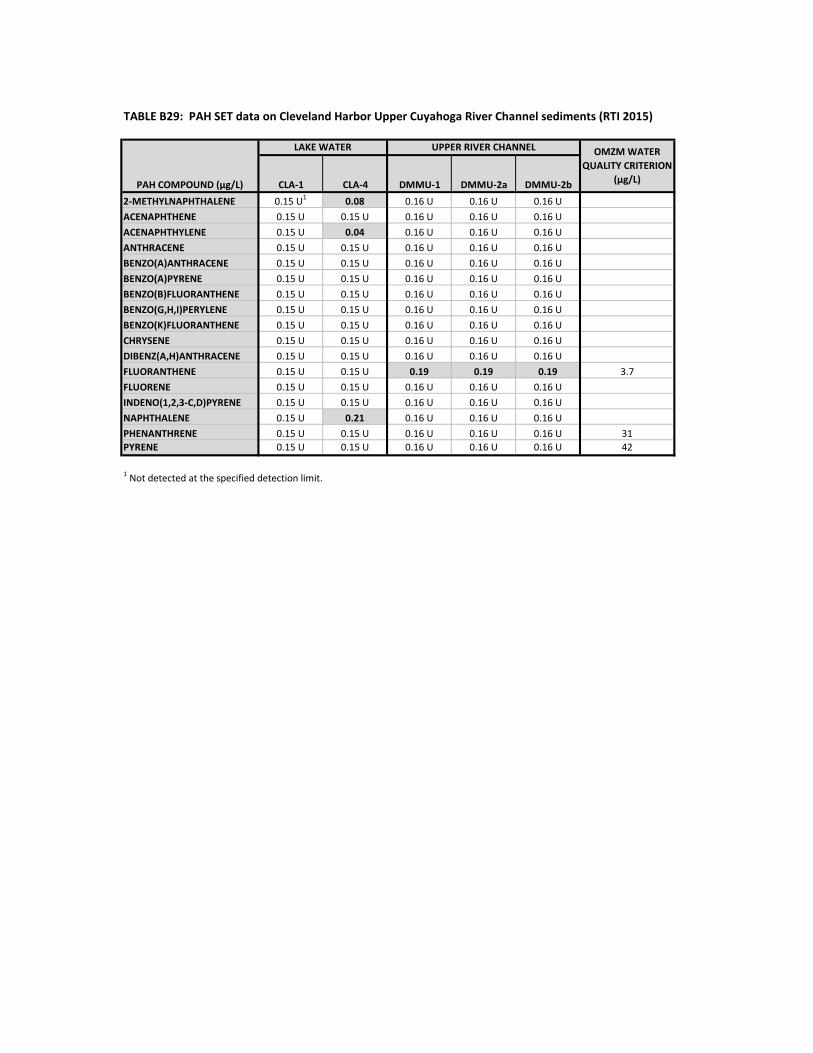
CLA-1 CLA-4 DMMU-1 DMMU-2a DMMU-2b2-METHYLNAPHTHALENE 0.15 U1 0.08 0.16 U 0.16 U 0.16 UACENAPHTHENE 0.15 U 0.15 U 0.16 U 0.16 U 0.16 UACENAPHTHYLENE 0.15 U 0.04 0.16 U 0.16 U 0.16 UANTHRACENE 0.15 U 0.15 U 0.16 U 0.16 U 0.16 UBENZO(A)ANTHRACENE 0.15 U 0.15 U 0.16 U 0.16 U 0.16 UBENZO(A)PYRENE 0.15 U 0.15 U 0.16 U 0.16 U 0.16 UBENZO(B)FLUORANTHENE 0.15 U 0.15 U 0.16 U 0.16 U 0.16 UBENZO(G,H,I)PERYLENE 0.15 U 0.15 U 0.16 U 0.16 U 0.16 UBENZO(K)FLUORANTHENE 0.15 U 0.15 U 0.16 U 0.16 U 0.16 UCHRYSENE 0.15 U 0.15 U 0.16 U 0.16 U 0.16 UDIBENZ(A,H)ANTHRACENE 0.15 U 0.15 U 0.16 U 0.16 U 0.16 UFLUORANTHENE 0.15 U 0.15 U 0.19 0.19 0.19 3.7FLUORENE 0.15 U 0.15 U 0.16 U 0.16 U 0.16 UINDENO(1,2,3-C,D)PYRENE 0.15 U 0.15 U 0.16 U 0.16 U 0.16 UNAPHTHALENE 0.15 U 0.21 0.16 U 0.16 U 0.16 UPHENANTHRENE 0.15 U 0.15 U 0.16 U 0.16 U 0.16 U 31PYRENE 0.15 U 0.15 U 0.16 U 0.16 U 0.16 U 42
TABLE B29: PAH SET data on Cleveland Harbor Upper Cuyahoga River Channel sediments (RTI 2015)
OMZM WATER QUALITY CRITERION
(µg/L)
1 Not detected at the specified detection limit.
PAH COMPOUND (µg/L)
LAKE WATER UPPER RIVER CHANNEL

Survival (%) NOEC (%) LC50 (%)Survival (%),
TRE1 Survival (%) NOEC (%) LC50 (%)Survival (%),
TRE1
DMMU-1 13 N/A N/A 98±4 N/A25 N/A N/A 88±4 N/A50 92±11 N/A 92±8 N/A
100 96±9 N/A 80±232 N/ADMMU-2a 13 N/A N/A 98±4 N/A
25 84±9 N/A 100 N/A50 84±22 N/A 90±7 N/A
100 64±33 100 22±44 93±6DMMU-2b 13 N/A N/A 96±9 N/A
25 92±18 N/A 98±4 N/A50 100 N/A 88±13 N/A
100 100 100 22±26 97±6Control N/A 100 N/A N/A N/A 98±4 N/A N/A N/ALake Site Water N/A 96±9 N/A N/A N/A 100 N/A N/A N/A
2Boldface denotes reduced values that are ≥10% or statistically significant from lake site water.
Measurement Endpoint
Test SpeciesP. promelas
Measurement Endpoint
1Survival following toxicity reduction evaluation (TRE) bioassay using zeolite-treated 100% elutriates to reduce ammonia concentrations; zeolite removed all acute toxicity observed in initial bioassay. Sediment elutriate data re-confirm no other contaminant cause of acute toxicity.
100 50 75N/A
TABLE B30. Results of 48-hour Ceriodaphnia dubia and 96-hour Pimephales promelas elutriate bioassays (±1 standard deviation [SD] from the mean) on Cleveland Harbor Upper Cuyahoga River Channel sediments and lake water (USAERDC 2015).
Sample
Elutriate Concentration
(%)
C. dubia
68
100 50 >100N/A
>10050 50

MINIMUM MAXIMUM MINIMUM MAXIMUM
ALUMINUM mg/kg 14,400 34,000 5,720 34,000ANTIMONY mg/kg 1.6 3.8 1.5 2.7ARSENIC mg/kg 7.5 15.7 4.77 76.9BARIUM mg/kg 105 150 47.7 188BERYLLIUM mg/kg 0.077 0.96 0.321 1.07CADMIUM mg/kg 1.5 4.66 0.728 2.88CALCIUM mg/kg 1,100 14,100 4,340 16,000CHROMIUM, TOTAL mg/kg 43.8 60.6 12.6 61COBALT mg/kg 11.9 18 6.08 17COPPER mg/kg 50 69.1 12.2 55IRON mg/kg 33,900 49,000 18,300 70,900LEAD mg/kg 53 108 15.7 73.5MAGNESIUM mg/kg 1,300 15,000 3,710 17,000MANGANESE mg/kg 528 981 401 1540MERCURY mg/kg 0.07 0.4 0.04 0.75MOLYBDENUM mg/kg 1.07 1.69 1.1 1.3NICKEL mg/kg 44.6 71 16.7 67POTASSIUM mg/kg 2,610 7,100 2,900 7,300SELENIUM mg/kg 1.36 1.76 1.51 1.57SILVER mg/kg 0.5 0.79 0.47 5.38SODIUM mg/kg 172 250 161 280THALLIUM mg/kg 0.46 0.53 0.45 0.48TITANIUM mg/kg 73 73 37 93VANADIUM mg/kg 30.6 79 32.9 78ZINC mg/kg 220 466 72.9 261CYANIDE mg/kg 0.8 1 0.89 0.91NITROGEN, AMMONIA mg/kg 104 420 60.4 3200NITROGEN, TOTAL KJELDAHL (TKN) mg/kg 1,850 5,400 840 52,000PHOSPHORUS, TOTAL (AS P) mg/kg 420 1280 44 1130TOTAL OIL & GREASE mg/kg 450 450 460 460TOTAL ORGANIC CARBON (TOC) % 2.4 3.2 0.19 4.4ENDOSULFAN SULFATE µg/kg 1.8 2.5ENDRIN µg/kg 2.2 2.2ENDRIN ALDEHYDE µg/kg 1.8 1.8 20 20GAMMA BHC (LINDANE) µg/kg 1.7 1.7HEPTACHLOR EPOXIDE µg/kg 1.5 1.5TOTAL PAHs µg/kg 1,003 27,230 193 33,399TOC-NORMALIZED TOTAL PAHs mg/kg-OC 31 939 7 1,336TOTAL PCBs µg/kg 58.1 236 9.36 400TOC-NORMALIZED TOTAL PCBs µg/kg-OC 2,003 8,138 248 25,000∑DDT µg/kg 7.55 17.6 7.11 49TOC-NORMALIZED ∑DDT µg/kg-OC 259 704 284 1,750
1 Excludes all bottom core samples and samples that are potentially toxic to benthic organisms.
TABLE B31. Bulk sediment contaminant concentrations at open-lake reference areas offshore of Cleveland, Ohio (based on data from USACE 2013a, USACE 2015a, OEPA 2015d and OEPA 2015e).
CLA-1 (REFERENCE) LAKE ERIECONTAMINANT UNITS
REFERENCE SEDIMENT1

DMMU-1 DMMU-2a DMMU-2b
302808 (COMP) 302809 (COMP) 302810 (COMP)
CLAY 11 12 11
CLAYPAN SOIL 5.7 5.9 5.6
MEDIUM CLAY 3.8 5.9 5.6
VERY FINE SILT 5.7 9.8 11
FINE SILT 27 29 28
MEDIUM SILT 11 12 11
COARSE SILT 35 25 27
TOTAL SILT/CLAY 99 100 99
TOTAL COARSE SAND 0 0 0
PARTICLE SIZE (%)
UPPER RIVER
TABLE B32: Bulk grain size distribution on Cleveland Harbor Upper Cuyahoga River sediments (surface samples) (OEPA 2013) (yellow highlight indicates that sediment sample was not collected from the channel dredging prism).

200013 200016 F01A21 302810 (COMP) F01W50 302581 F01S08 302809 (COMP) 302578 302580 F01A41 302808 (COMP)
NITROGEN, AMMONIA 270 380 450 240 320 290 280 340 210 190 250 290
PHOSPHORUS, TOTAL (AS P) 1,050 1,350 1,560 952 1,240 1,170 1,170 1,110 989 794 1,210 1,100
TOTAL ORGANIC CARBON (%) 2.7 3.5 3.3 2.2 3.9 2.9 2.7 2.9 2.3 2 2.6 2.8
TABLE B33: Bulk inorganics data on Cleveland Harbor Upper Cuyahoga River sediments (surface samples) (OEPA 2013) (yellow highlight indicates that sediment sample was not collected from the channel dredging prism).
INORGANIC (mg/kg)
UPPER RIVER
DMMU-1 DMMU-2a DMMU-2b

200013 200016 F01A21 302810 (COMP) F01W50 302581 F01S08 302809 (COMP) 302578 302580 F01A41 302808 (COMP)
ALUMINUM 10700 11200 10400 10100 9420 9630 9610 12000 11200 6190 14400 9770
ANTIMONY 2.45 U1 1.37 U 2.09 U 1.55 U 1.71 U 1.58 U 1.63 U 1.52 U 1.37 U 1.17 U 1.73 U 1.55 U
ARSENIC 19.4 16.2 19.8 15.5 16.6 16.5 16.9 15.9 16.2 11.7 18.3 15.2
BARIUM 89.9 73.2 97.2 72 79.2 75.2 76.9 78 73.2 51.4 95 92.7
BERYLLIUM 0.602 0.572 0.642 0.553 0.568 0.536 0.586 0.61 0.572 0.39 0.693 0.49
CADMIUM 1.44 1.41 1.62 1.26 1.8 1.24 1.16 1.21 1.41 0.857 1.54 1.21
CALCIUM 16000 14700 16700 14900 18500 14500 14900 14500 14700 12000 16100 44200
CHROMIUM, TOTAL 25.8 62.6 26.4 34.8 25.6 22.6 23 24.5 62.6 15.9 29.6 255
COBALT 12.5 10.9 12.9 10.7 10.6 10.9 11.4 10.2 10.9 7.94 11.8 9.14
COPPER 54.1 83.3 67.4 66.4 54.6 54.1 49.8 52.7 83.3 54.4 57.5 46.9
IRON 33400 29900 33600 29300 28600 29000 29900 29000 29900 21000 33500 45900
LEAD 55.2 48.4 62.4 47.9 54 51.3 48.9 46.9 48.4 37.4 54.4 37.9
MAGNESIUM 6940 6490 7180 6290 6210 6180 6320 6180 6490 4580 7120 14500
MANGANESE 910 661 1100 653 747 808 765 739 661 478 740 3660
MERCURY 0.12 0.133 0.163 0.098 0.196 0.116 0.167 0.115 0.133 0.085 0.121 0.124
NICKEL 34.8 35.8 35.9 30.5 30.6 30.7 31.5 30.6 35.8 25.1 33.3 26.1
POTASSIUM 2450 U 1790 2090 U 1550 U 1710 U 1580 U 1630 U 2260 1790 1170 U 2780 1550 U
SELENIUM 2.45 U 1.37 U 2.09 U 1.55 U 1.71 U 1.58 U 1.63 U 1.52 U 1.37 U 1.17 U 1.73 U 1.55 U
SILVER 0.245 U 0.151 0.228 0.161 0.199 0.177 0.194 0.159 0.151 0.124 0.196 0.159
SODIUM 6120 U 3420 U 5230 U 3860 U 4280 U 3940 U 4080 U 3790 U 3420 U 2930 U 4330 U 3870 U
STRONTIUM 37 U 32 38 32 37 31 32 34 32 24 39 53
TITANIUM 61 U 34 U 52 U 39 U 43 U 39 U 41 U 41 34 U 29 U 44 298
VANADIUM 61 U 34 U 52 U 39 U 43 U 39 U 41 U 38 U 34 U 29 U 43 U 193
ZINC 243 395 253 284 218 202 202 196 395 152 238 181
TABLE B34: Bulk metals data on Cleveland Harbor Upper Cuyahoga River sediments (surface samples) (OEPA 2013) (yellow highlight indicates that sediment sample was not collected from the channel dredging prism).
1 Not detected at the specified detection limit
METAL (mg/kg)
UPPER RIVER
DMMU-1 DMMU-2a DMMU-2b

200013 200016 F01A21 302810 (COMP) F01W50 302581 F01S08 302809 (COMP) 302578 302580 F01A41 302808 (COMP)
AROCLOR 1016 36.1 U1 43.1 U 43.3 U 34.3 U 42.5 U 33.7 U 38.3 U 38.9 U 37.5 U 29.5 U 56.8 U 41.5 U
AROCLOR 1221 36.1 U 43.1 U 43.3 U 34.3 U 42.5 U 33.7 U 38.3 U 38.9 U 37.5 U 29.5 U 56.8 U 41.5 U
AROCLOR 1232 36.1 U 43.1 U 43.3 U 34.3 U 42.5 U 33.7 U 38.3 U 38.9 U 37.5 U 29.5 U 56.8 U 41.5 U
AROCLOR 1242 43 43.1 U 56.2 55.5 51.6 37.3 52.4 58 43.5 72.8 80.5 50.9
AROCLOR 1248 36.1 U 43.1 U 43.3 U 34.3 U 42.5 U 33.7 U 38.3 U 38.9 U 37.5 U 29.5 U 56.8 U 41.5 U
AROCLOR 1254 36.1 U 43.1 U 43.3 U 34.3 U 42.5 U 33.7 U 38.3 U 2,110 37.5 U 29.5 U 56.8 U 41.5 U
AROCLOR 1260 88.9 106 106 98.3 112 82.9 163 251 104 71.1 163 118
TOTAL PCBs 132 106 162 154 164 120 215 2419 148 144 244 169
TOC (%) 2.7 3.5 3.3 2.2 3.9 2.9 2.7 2.9 2.3 2 2.6 2.8
TOC-NORMALIZED CONCENTRATION (µg/kg-TOC) 4,885 3,029 4,915 6,991 4,195 4,145 7,978 83,414 6,413 7,195 9,365 6,032
TABLE B35: Bulk PCB data on Cleveland Harbor Upper Cuyahoga River sediments (surface samples) (OEPA 2013) (yellow highlight indicates that sediment sample was not collected from the channel dredging prism).
1 Not detected at the specified detection limit
AROCLOR (µg/kg)
UPPER RIVER
DMMU-1 DMMU-2a DMMU-2b

200013 200016 F01A21 302810 (COMP) F01W50 302581 F01S08 302809 (COMP) 302578 302580 F01A41 302808 (COMP)
ALDRIN 7.2 U1 8.6 U 8.7 U 6.9 U 8.5 U 6.7 U 7.7 U 7.8 U 7.5 U 5.9 U 11.4 U 8.3 U
ALPHA BHC (ALPHA HEXACHLOROCYCLOHEXANE) 7.2 U 8.6 U 8.7 U 6.9 U 8.5 U 6.7 U 7.7 U 7.8 U 7.5 U 5.9 U 11.4 U 8.3 U
ALPHA ENDOSULFAN 7.2 U 8.6 U 8.7 U 6.9 U 8.5 U 6.7 U 7.7 U 7.8 U 7.5 U 5.9 U 11.4 U 8.3 U
BETA BHC (BETA HEXACHLOROCYCLOHEXANE) 7.2 U 8.6 U 8.7 U 6.9 U 8.5 U 6.7 U 7.7 U 7.8 U 7.5 U 5.9 U 11.4 U 8.3 U
BETA ENDOSULFAN 7.2 U 8.6 U 8.7 U 6.9 U 8.5 U 6.7 U 7.7 U 7.8 U 7.5 U 5.9 U 11.4 U 8.3 U
DELTA BHC (DELTA HEXACHLOROCYCLOHEXANE) 7.2 U 8.6 U 8.7 U 6.9 U 8.5 U 6.7 U 7.7 U 7.8 U 7.5 U 5.9 U 11.4 U 8.3 U
DIELDRIN 7.2 U 8.6 U 8.7 U 6.9 U 8.5 U 6.7 U 7.7 U 7.8 U 7.5 U 5.9 U 11.4 U 8.3 U
ENDOSULFAN SULFATE 7.2 U 8.6 U 8.7 U 6.9 U 8.5 U 6.7 U 7.7 U 7.8 U 7.5 U 5.9 U 11.4 U 8.3 U
ENDRIN 7.2 U 8.6 U 8.7 U 6.9 U 8.5 U 6.7 U 7.7 U 7.8 U 7.5 U 5.9 U 11.4 U 8.3 U
ENDRIN ALDEHYDE 7.2 UJ 8.6 UJ 8.7 UJ 6.9 U 8.5 UJ 6.7 U 7.7 U 7.8 U 7.5 U 5.9 U 11.4 U 8.3 UJ
GAMMA BHC (LINDANE) 7.2 U 8.6 U 8.7 U 6.9 U 8.5 U 6.7 U 7.7 U 7.8 U 7.5 U 5.9 U 11.4 U 8.3 U
HEPTACHLOR 7.2 U 8.6 U 8.7 U 6.9 U 8.5 U 6.7 U 7.7 U 7.8 U 7.5 U 5.9 U 11.4 U 8.3 U
HEPTACHLOR EPOXIDE 7.2 U 8.6 U 8.7 U 6.9 U 8.5 U 6.7 U 7.7 U 7.8 U 7.5 U 5.9 U 11.4 U 8.3 U
METHOXYCHLOR 7.2 U 8.6 U 8.7 U 6.9 U 8.5 U 6.7 U 7.7 U 7.8 U 7.5 U 5.9 U 11.4 U 8.3 U
MIREX 7.2 U 8.6 U 8.7 U 6.9 U 8.5 U 6.7 U 7.7 U 7.8 U 7.5 U 5.9 U 11.4 U 8.3 U
DDD (DICHLORODIPHENYLDICHLORETHANE) 7.2 U 8.6 U 8.7 U 6.9 U 8.5 U 6.7 U 7.7 U 9.2 7.5 U 5.9 U 11.4 U 8.3 U
DDE (DICHLORODIPHENYLDICHLORETHYLENE) 13.9 16.4 16.8 14.3 16 12.8 7.7 U 7.8 U 15.4 5.9 U 11.4 U 13.5DDT (DICHLORODIPHENYLTRICHLOROETHANE) 7.2 U 8.6 U 8.7 U 6.9 U 8.5 U 6.7 U 7.7 U 7.8 U 7.5 U 5.9 U 11.4 U 8.3 U
TOTAL DDT 13.9 16.4 16.8 14.3 16 12.8 9.2 15.4 13.5
TOC (%) 2.7 3.5 3.3 2.2 3.9 2.9 2.7 2.9 2.3 2 2.6 2.8
TOC-NORMALIZED CONCENTRATION (µg/kg-TOC) 515 469 509 650 410 441 317 670 482
TABLE B36: Bulk pesticides data on Cleveland Harbor Upper Cuyahoga River sediments (surface samples) (OEPA 2013) (yellow highlight indicates that sediment sample was not collected from the channel dredging prism).
1 Not detected at the specified detection limit
DMMU-2aPESTICIDE (µg/kg)
UPPER RIVER
DMMU-1 DMMU-2b

200013 200016 F01A21 302810 (COMP) F01W50 302581 F01S08 302809 (COMP) 302578 302580 F01A41 302808 (COMP)
ACENAPHTHENE 0.18 U1 0.22 U 0.22 U 0.17 U 0.21 U 0.17 U 0.19 U 0.19 U 0.19 U 0.15 U 0.28 U 0.21 U
ACENAPHTHYLENE 0.18 U 0.22 U 0.22 U 0.17 U 0.21 U 0.17 U 0.19 U 0.19 U 0.19 U 0.15 U 0.28 U 0.21 U
ANTHRACENE 0.25 0.27 0.25 0.2 0.42 0.21 0.61 0.23 0.19 U 0.28 0.34 0.22
BENZO(A)ANTHRACENE 0.84 0.9 0.87 0.71 1.34 0.69 0.73 0.8 0.63 0.88 1.11 0.75
BENZO(A)PYRENE 0.77 0.95 0.89 0.82 1.2 0.95 0.9 0.83 0.82 1.12 1.42 0.69
BENZO(B)FLUORANTHENE 1.22 1.26 1.3 1.17 1.75 1.02 1.17 1.32 1.17 1.37 1.88 1.04
BENZO(G,H,I)PERYLENE 0.29 0.37 0.33 0.31 0.45 0.35 0.33 0.33 0.38 0.4 0.52 0.26
BENZO(K)FLUORANTHENE 0.57 0.81 0.69 0.61 0.92 0.71 0.83 0.58 0.71 0.8 1.12 0.63
CHRYSENE 1.25 1.32 1.29 1.06 1.86 1.09 1.11 1.22 0.95 1.2 1.66 1.17
DIBENZ(A,H)ANTHRACENE 0.18 U 0.22 U 0.22 U 0.17 U 0.21 U 0.17 U 0.19 U 0.19 U 0.19 U 0.15 U 0.28 U 0.21 U
FLUORANTHENE 2.2 2.25 2.17 1.68 3.37 1.81 1.77 1.99 1.41 2.21 2.74 1.9
FLUORENE 0.18 U 0.22 U 0.22 U 0.17 U 0.21 U 0.17 U 0.19 U 0.19 U 0.19 U 0.18 0.28 U 0.21 U
INDENO(1,2,3-C,D)PYRENE 0.3 0.37 0.33 0.32 0.45 0.34 0.35 0.33 0.39 0.44 0.55 0.27
NAPHTHALENE 0.18 U 0.22 U 0.22 U 0.31 0.21 U 0.17 U 1.9 0.41 U 0.073 U 0.51 0.42 0.21 U
PHENANTHRENE 1.17 1.28 1.2 1.02 2.3 0.98 1.15 1.16 0.82 1.37 1.61 1.06
PYRENE 1.84 2.01 1.8 1.37 3.32 1.48 1.42 1.65 1.15 1.78 2.22 1.61
TOTAL PAHs 10.7 11.8 11.1 9.6 17.4 9.6 12.3 10.4 8.4 12.5 15.6 9.6
TOTAL ORGANIC CARBON (%) 2.7 3.5 3.3 2.2 3.9 2.9 2.7 2.9 2.3 2 2.6 2.8
TOC-NORMALIZED CONCENTRATION (mg/kg-TOC) 396 337 337 435 446 332 454 360 367 627 600 343
TABLE B37: Bulk PAH data on Cleveland Harbor Upper Cuyahoga River sediments (surface samples) (OEPA 2013) (yellow highlight indicates that sediment sample was not collected from the channel dredging prism).
1 Not detected at the specified detection limit
PAH COMPOUND (mg/kg)
UPPER RIVER
DMMU-1 DMMU-2a DMMU-2b

200013 200016 F01A21 302810 (COMP) F01W50 302581 F01S08 302809 (COMP) 302578 302580 F01A41 302808 (COMP)
1,1,1,2-TETRACHLOROETHANE 0.37 U1 0.46 U 0.45 U 0.055 U 0.45 U 0.4 U 0.37 U 0.41 U 0.073 U 0.061 U 0.05 U 0.4 U
1,1,2,2-TETRACHLOROETHANE 0.37 U 0.46 U 0.45 U 0.055 U 0.45 U 0.4 U 0.37 U 0.41 U 0.073 U 0.061 U 0.05 U 0.4 U
1,1,2-TRICHLOROETHANE 0.37 U 0.46 U 0.45 U 0.055 U 0.45 U 0.4 U 0.37 U 0.41 U 0.073 U 0.061 U 0.05 U 0.4 U
1,1-DICHLOROETHANE 0.37 U 0.46 U 0.45 U 0.055 U 0.45 U 0.4 U 0.37 U 0.41 U 0.073 U 0.061 U 0.05 U 0.4 U
1,1-DICHLOROETHENE 0.37 U 0.46 U 0.45 U 0.055 U 0.45 U 0.4 U 0.37 U 0.41 U 0.073 U 0.061 U 0.05 U 0.4 U
1,1-DICHLOROPROPENE 0.37 U 0.46 U 0.45 U 0.055 U 0.45 U 0.4 U 0.37 U 0.41 U 0.073 U 0.061 U 0.05 U 0.4 U
1,2,3-TRICHLOROBENZENE 0.37 U 0.46 U 0.45 U 0.055 U 0.45 U 0.4 U 0.37 U 0.41 U 0.073 U 0.061 U 0.05 U 0.4 U
1,2,3-TRICHLOROPROPANE 0.37 U 0.46 U 0.45 U 0.055 U 0.45 U 0.4 U 0.37 U 0.41 U 0.073 U 0.061 U 0.05 U 0.4 U
1,2,4-TRIMETHYLBENZENE 0.37 U 0.46 U 0.45 U 0.055 U 0.45 U 0.4 U 0.37 U 0.41 U 0.073 U 0.061 U 0.05 U 0.4 U
1,2-DIBROMO-3-CHLOROPROPANE 0.37 U 0.46 U 0.45 U 0.055 U 0.45 U 0.4 U 0.37 U 0.41 U 0.073 U 0.061 U 0.05 U 0.4 U
1,2-DIBROMOETHANE (ETHYLENE DIBROMIDE) 0.37 U 0.46 U 0.45 U 0.055 U 0.45 U 0.4 U 0.37 U 0.41 U 0.073 U 0.061 U 0.05 U 0.4 U
1,2-DICHLOROETHANE 0.37 U 0.46 U 0.45 U 0.055 U 0.45 U 0.4 U 0.37 U 0.41 U 0.073 U 0.061 U 0.05 U 0.4 U
1,2-DICHLOROPROPANE 0.37 U 0.46 U 0.45 U 0.055 U 0.45 U 0.4 U 0.37 U 0.41 U 0.073 U 0.061 U 0.05 U 0.4 U
1,3,5-TRIMETHYLBENZENE (MESITYLENE) 0.37 U 0.46 U 0.45 U 0.055 U 0.45 U 0.4 U 0.37 U 0.41 U 0.073 U 0.061 U 0.05 U 0.4 U
1,3-DICHLOROPROPANE 0.37 U 0.46 U 0.45 U 0.055 U 0.45 U 0.4 U 0.37 U 0.41 U 0.073 U 0.061 U 0.05 U 0.4 U
2,2-DICHLOROPROPANE 0.37 U 0.46 U 0.45 U 0.055 U 0.45 U 0.4 U 0.37 U 0.41 U 0.073 U 0.061 U 0.05 U 0.4 U
2-CHLOROTOLUENE 0.37 U 0.46 U 0.45 U 0.055 U 0.45 U 0.4 U 0.37 U 0.41 U 0.073 U 0.061 U 0.05 U 0.4 U
2-HEXANONE 0.37 U 0.46 U 0.45 U 0.055 U 0.45 U 0.4 U 0.37 U 0.41 U 0.073 U 0.061 U 0.05 U 0.4 U
4-CHLOROTOLUENE 0.37 U 0.46 U 0.45 U 0.055 U 0.45 U 0.4 U 0.37 U 0.41 U 0.073 U 0.061 U 0.05 U 0.4 U
ACETONE 0.37 U 0.46 U 0.45 U 0.095 0.45 U 0.4 U 0.37 U 0.41 U 0.092 0.14 0.089 0.4 U
BENZENE 0.37 U 0.46 U 0.45 U 0.055 U 0.45 U 0.4 U 0.37 U 0.41 U 0.073 U 0.061 U 0.05 U 0.4 U
BROMOBENZENE 0.37 U 0.46 U 0.45 U 0.055 U 0.45 U 0.4 U 0.37 U 0.41 U 0.073 U 0.061 U 0.05 U 0.4 U
BROMOFORM 0.37 U 0.46 U 0.45 U 0.055 U 0.45 U 0.4 U 0.37 U 0.41 U 0.073 U 0.061 U 0.05 U 0.4 U
BROMOMETHANE 0.37 U 0.46 U 0.45 U 0.055 U 0.45 U 0.4 U 0.37 U 0.41 U 0.073 U 0.061 U 0.05 U 0.4 U
CARBON DISULFIDE 0.37 U 0.46 U 0.45 U 0.055 U 0.45 U 0.4 U 0.37 U 0.41 U 0.073 U 0.061 U 0.05 U 0.4 U
CARBON TETRACHLORIDE 0.37 U 0.46 U 0.45 U 0.055 U 0.45 U 0.4 U 0.37 U 0.41 U 0.073 U 0.061 U 0.05 U 0.4 U
CHLOROBENZENE 0.37 U 0.46 U 0.45 U 0.055 U 0.45 U 0.4 U 0.37 U 0.41 U 0.073 U 0.061 U 0.05 U 0.4 U
CHLOROETHANE 0.37 U 0.46 U 0.45 U 0.055 U 0.45 U 0.4 U 0.37 U 0.41 U 0.073 U 0.061 U 0.05 U 0.4 U
CHLOROFORM 0.37 U 0.46 U 0.45 U 0.055 U 0.45 U 0.4 U 0.37 U 0.41 U 0.073 U 0.061 U 0.05 U 0.4 U
CIS-1,2-DICHLOROETHYLENE 0.37 U 0.46 U 0.45 U 0.055 U 0.45 U 0.4 U 0.37 U 0.41 U 0.073 U 0.061 U 0.05 U 0.4 U
CIS-1,3-DICHLOROPROPENE 0.37 U 0.46 U 0.45 U 0.055 U 0.45 U 0.4 U 0.37 U 0.41 U 0.073 U 0.061 U 0.05 U 0.4 U
CYMENE 0.37 U 0.46 U 0.45 U 0.055 U 0.45 U 0.4 U 0.37 U 0.41 U 0.073 U 0.061 U 0.05 U 0.4 U
DIBROMOCHLOROMETHANE 0.37 U 0.46 U 0.45 U 0.055 U 0.45 U 0.4 U 0.37 U 0.41 U 0.073 U 0.061 U 0.05 U 0.4 U
DIBROMOMETHANE 0.37 U 0.46 U 0.45 U 0.055 U 0.45 U 0.4 U 0.37 U 0.41 U 0.073 U 0.061 U 0.05 U 0.4 U
DICHLORODIFLUOROMETHANE 0.37 U 0.46 U 0.45 U 0.055 U 0.45 U 0.4 U 0.37 U 0.41 U 0.073 U 0.061 U 0.05 U 0.4 U
ETHYLBENZENE 0.37 U 0.46 U 0.45 U 0.055 U 0.45 U 0.4 U 0.37 U 0.41 U 0.073 U 0.061 U 0.05 U 0.4 U
ISOPROPYLBENZENE (CUMENE) 0.37 U 0.46 U 0.45 U 0.055 U 0.45 U 0.4 U 0.37 U 0.41 U 0.073 U 0.061 U 0.05 U 0.4 U
M+P-XYLENE 0.37 U 0.46 U 0.45 U 0.055 U 0.45 U 0.4 U 0.37 U 0.41 U 0.073 U 0.061 U 0.05 U 0.4 U
METHYL ETHYL KETONE (2-BUTANONE) 0.37 U 0.46 U 0.45 U 0.055 U 0.45 U 0.4 U 0.37 U 0.41 U 0.073 U 0.061 U 0.05 U 0.4 U
METHYL ISOBUTYL KETONE (4-METHYL-2-PENTANONE) 0.37 U 0.46 U 0.45 U 0.055 U 0.45 U 0.4 U 0.37 U 0.41 U 0.073 U 0.061 U 0.05 U 0.4 U
METHYLENE CHLORIDE 0.37 U 0.46 U 0.45 U 0.055 U 0.45 U 0.4 U 0.37 U 0.41 U 0.073 U 0.061 U 0.05 U 0.4 U
N-BUTYLBENZENE 0.37 U 0.46 U 0.45 U 0.055 U 0.45 U 0.4 U 0.37 U 0.41 U 0.073 U 0.061 U 0.05 U 0.4 U
N-PROPYLBENZENE 0.37 U 0.46 U 0.45 U 0.055 U 0.45 U 0.4 U 0.37 U 0.41 U 0.073 U 0.061 U 0.05 U 0.4 U
O-XYLENE (1,2-DIMETHYLBENZENE) 0.37 U 0.46 U 0.45 U 0.055 U 0.45 U 0.4 U 0.37 U 0.41 U 0.073 U 0.061 U 0.05 U 0.4 U
SEC-BUTYLBENZENE 0.37 U 0.46 U 0.45 U 0.055 U 0.45 U 0.4 U 0.37 U 0.41 U 0.073 U 0.061 U 0.05 U 0.4 U
STYRENE 0.37 U 0.46 U 0.45 U 0.055 U 0.45 U 0.4 U 0.37 U 0.41 U 0.073 U 0.061 U 0.05 U 0.4 U
T-BUTYLBENZENE 0.37 U 0.46 U 0.45 U 0.055 U 0.45 U 0.4 U 0.37 U 0.41 U 0.073 U 0.061 U 0.05 U 0.4 U
TETRACHLOROETHYLENE(PCE) 0.37 U 0.46 U 0.45 U 0.055 U 0.45 U 0.4 U 0.37 U 0.41 U 0.073 U 0.061 U 0.05 U 0.4 U
TOLUENE 8.61 11.9 15.3 0.055 U 6.68 9.09 1.11 5.57 0.073 U 0.066 0.056 12.1
TRANS-1,2-DICHLOROETHENE 0.37 U 0.46 U 0.45 U 0.055 U 0.45 U 0.4 U 0.37 U 0.41 U 0.073 U 0.061 U 0.05 U 0.4 U
TRANS-1,3-DICHLOROPROPENE 0.37 U 0.46 U 0.45 U 0.055 U 0.45 U 0.4 U 0.37 U 0.41 U 0.073 U 0.061 U 0.05 U 0.4 U
TRICHLOROETHANE 0.37 U 0.46 U 0.45 U 0.055 U 0.45 U 0.4 U 0.37 U 0.41 U 0.073 U 0.061 U 0.05 U 0.4 U
TRICHLOROETHYLENE (TCE) 0.37 U 0.46 U 0.45 U 0.055 U 0.45 U 0.4 U 0.37 U 0.41 U 0.073 U 0.061 U 0.05 U 0.4 U
TRICHLOROFLUOROMETHANE 0.37 U 0.46 U 0.45 U 0.055 U 0.45 U 0.4 U 0.37 U 0.41 U 0.073 U 0.061 U 0.05 U 0.4 U
VINYL CHLORIDE 0.37 U 0.46 U 0.45 U 0.055 U 0.45 U 0.4 U 0.37 U 0.41 U 0.073 U 0.061 U 0.05 U 0.4 U
DMMU-2b
TABLE B38: Bulk VOC data on Cleveland Harbor Upper Cuyahoga River sediments (surface samples) (OEPA 2013) (yellow highlight indicates that sediment sample was not collected from the channel dredging prism).
1 Not detected at the specified detection limit
VOC (mg/kg)
UPPER RIVER
DMMU-1 DMMU-2a

200013 200016 F01A21 302810 (COMP) F01W50 302581 F01S08 302809 (COMP) 302578 302580 F01A41 302808 (COMP)
1,2,4,5-TETRACHLOROBENZENE 0.18 U1 0.22 U 0.22 U 0.17 U 0.21 U 0.17 U 0.19 U 0.19 U 0.19 U 0.15 U 0.28 U 0.21 U
1,2,4-TRICHLOROBENZENE 0.18 U 0.22 U 0.22 U 0.055 U 0.21 U 0.17 U 0.19 U 0.41 U 0.073 U 0.061 U 0.05 U 0.21 U
1,2-DICHLOROBENZENE 0.18 U 0.22 U 0.22 U 0.055 U 0.21 U 0.17 U 0.19 U 0.41 U 0.073 U 0.061 U 0.05 U 0.21 U
1,3-DICHLOROBENZENE 0.18 U 0.22 U 0.22 U 0.055 U 0.21 U 0.17 U 0.19 U 0.41 U 0.073 U 0.061 U 0.05 U 0.21 U
1,3-DINITROBENZENE 0.18 U 0.22 U 0.22 U 0.17 U 0.21 U 0.17 U 0.19 U 0.19 U 0.19 U 0.15 U 0.28 U 0.21 U
1,4-DICHLOROBENZENE 0.18 U 0.22 U 0.22 U 0.055 U 0.21 U 0.17 U 0.19 U 0.41 U 0.073 U 0.061 U 0.05 U 0.21 U
1,4-NAPHTHOQUINONE 0.18 U 0.22 U 0.22 U 0.17 U 0.21 U 0.17 U 0.19 U 0.19 U 0.19 U 0.15 U 0.28 U 0.21 U
2,3,4,6-TETRACHLOROPHENOL 0.18 U 0.22 U 0.22 U 0.17 U 0.21 U 0.17 U 0.19 U 0.19 U 0.19 U 0.15 U 0.28 U 0.21 U
2,4,5-TRICHLOROPHENOL 0.18 U 0.22 U 0.22 U 0.17 U 0.21 U 0.17 U 0.19 U 0.19 U 0.19 U 0.15 U 0.28 U 0.21 U
2,4,6-TRICHLOROPHENOL 0.18 U 0.22 U 0.22 U 0.17 U 0.21 U 0.17 U 0.19 U 0.19 U 0.19 U 0.15 U 0.28 U 0.21 U
2,4-DICHLOROPHENOL 0.18 U 0.22 U 0.22 U 0.17 U 0.21 U 0.17 U 0.19 U 0.19 U 0.19 U 0.15 U 0.28 U 0.21 U
2,4-DIMETHYLPHENOL 0.18 U 0.22 U 0.22 U 0.17 U 0.21 U 0.17 U 0.19 U 0.19 U 0.19 U 0.15 U 0.28 U 0.21 U
2,4-DINITROPHENOL 0.9 U 1.1 U 1.1 U 0.9 U 1.1 U 0.8 U 1 U 1 U 0.9 U 0.7 U 1.4 U 1 U
2,4-DINITROTOLUENE 0.18 U 0.22 U 0.22 U 0.17 U 0.21 U 0.17 U 0.19 U 0.19 U 0.19 U 0.15 U 0.28 U 0.21 U
2,6-DICHLOROPHENOL 0.18 U 0.22 U 0.22 U 0.17 U 0.21 U 0.17 U 0.19 U 0.19 U 0.19 U 0.15 U 0.28 U 0.21 U
2,6-DINITROTOLUENE 0.18 U 0.22 U 0.22 U 0.17 U 0.21 U 0.17 U 0.19 U 0.19 U 0.19 U 0.15 U 0.28 U 0.21 U
2-ACETYLAMINOFLUORENE 0.18 U 0.22 U 0.22 U 0.17 U 0.21 U 0.17 U 0.19 U 0.19 U 0.19 U 0.15 U 0.28 U 0.21 U
2-CHLORONAPHTHALENE 0.18 U 0.22 U 0.22 U 0.17 U 0.21 U 0.17 U 0.19 U 0.19 U 0.19 U 0.15 U 0.28 U 0.21 U
2-CHLOROPHENOL 0.18 U 0.22 U 0.22 U 0.17 U 0.21 U 0.17 U 0.19 U 0.19 U 0.19 U 0.15 U 0.28 U 0.21 U
2-METHYLNAPHTHALENE 0.18 U 0.22 U 0.22 U 0.17 U 0.21 U 0.17 U 0.24 0.19 U 0.19 U 0.16 0.28 U 0.21 U
2-METHYLPHENOL (O-CRESOL) 0.18 U 0.22 U 0.22 U 0.17 U 0.21 U 0.17 U 0.19 U 0.19 U 0.19 U 0.15 U 0.28 U 0.21 U
2-NITROANILINE 0.18 U 0.22 U 0.22 U 0.17 U 0.21 U 0.17 U 0.19 U 0.19 U 0.19 U 0.15 U 0.28 U 0.21 U
2-NITROPHENOL 0.18 U 0.22 U 0.22 U 0.17 U 0.21 U 0.17 U 0.19 U 0.19 U 0.19 U 0.15 U 0.28 U 0.21 U
2-PICOLINE (ALPHA-PICOLINE) 0.18 U 0.22 U 0.22 U 0.17 U 0.21 U 0.17 U 0.19 U 0.19 U 0.19 U 0.15 U 0.28 U 0.21 U
3,3'-DICHLOROBENZIDINE 0.9 U 1.1 U 1.1 U 0.9 U 1.1 U 0.8 U 1 U 1 U 0.9 U 0.7 U 1.4 U 1 U
3-METHYLCHOLANTHRENE 0.18 U 0.22 U 0.22 U 0.17 U 0.21 U 0.17 U 0.19 U 0.19 U 0.19 U 0.15 U 0.28 U 0.21 U
4,6-DINITRO-2-METHYLPHENOL 0.18 U 0.22 U 0.22 U 0.17 UJ 0.21 U 0.17 U 0.19 UJ 0.19 U 0.19 UJ 0.15 UJ 0.28 UJ 0.21 U
4-BROMOPHENYL PHENYL ETHER 0.18 U 0.22 U 0.22 U 0.17 U 0.21 U 0.17 U 0.19 U 0.19 U 0.19 U 0.15 U 0.28 U 0.21 U
4-CHLORO-3-METHYLPHENOL 0.18 U 0.22 U 0.22 U 0.17 U 0.21 U 0.17 U 0.19 U 0.19 U 0.19 U 0.15 U 0.28 U 0.21 U
4-CHLOROPHENOL 0.18 U 0.22 U 0.22 U 0.17 U 0.21 U 0.17 U 0.19 U 0.19 U 0.19 U 0.15 U 0.28 U 0.21 U
4-METHYLPHENOL (P-CRESOL) 6.07 8.21 8.18 0.23 4.54 2.82 0.41 2.53 0.19 U 0.15 U 0.85 7.47
4-NITROANILINE 0.18 U 0.22 U 0.22 U 0.17 U 0.21 U 0.17 U 0.19 U 0.19 U 0.19 U 0.15 U 0.28 U 0.21 U
4-NITROPHENOL 0.9 U 1.1 U 1.1 U 0.9 U 1.1 U 0.8 U 1 U 1 U 0.9 U 0.7 U 1.4 U 1 U
7,12-DIMETHYLBENZ(A)ANTHRACENE 0.9 U 1.1 U 1.1 U 0.9 U 1.1 U 0.8 U 1 U 1 U 0.9 U 0.7 U 1.4 U 1 U
ACETOPHENONE 0.18 U 0.22 U 0.22 U 0.17 U 0.21 U 0.17 U 0.19 U 0.19 U 0.19 U 0.15 U 0.28 U 0.21 U
ANILINE (PHENYLAMINE, AMINOBENZENE) 0.9 U 1.1 U 1.1 U 0.9 U 1.1 U 0.8 U 1 U 1 U 0.9 U 0.7 U 1.4 U 1 U
BENZYL ALCOHOL 0.18 U 0.22 U 0.22 U 0.17 U 0.21 U 0.17 U 0.19 U 0.19 U 0.19 U 0.15 U 0.28 U 0.21 U
BENZYL BUTYL PHTHALATE 0.18 U 0.22 U 0.22 U 0.17 U 0.21 U 0.17 U 0.19 U 0.19 U 0.19 U 0.15 U 0.28 U 0.21 U
BIS(2-CHLOROETHOXY) METHANE 0.18 U 0.22 U 0.22 U 0.17 U 0.21 U 0.17 U 0.19 U 0.19 U 0.19 U 0.15 U 0.28 U 0.21 U
BIS(2-CHLOROETHYL) ETHER (2-CHLOROETHYL ETHER) 0.18 U 0.22 U 0.22 U 0.17 U 0.21 U 0.17 U 0.19 U 0.19 U 0.19 U 0.15 U 0.28 U 0.21 U
BIS(2-CHLOROISOPROPYL) ETHER 0.18 U 0.22 U 0.22 U 0.17 U 0.21 U 0.17 U 0.19 U 0.19 U 0.19 U 0.15 U 0.28 U 0.21 U
BIS(2-ETHYLHEXYL) PHTHALATE 0.85 1.11 1.17 0.84 1.06 0.85 0.94 0.94 0.85 0.51 1.57 1.07
DIBENZOFURAN 0.18 U 0.22 U 0.22 U 0.17 U 0.21 U 0.17 U 0.19 U 0.19 U 0.19 U 0.15 U 0.28 U 0.21 U
DIETHYL PHTHALATE 0.18 U 0.22 U 0.22 U 0.17 U 0.21 U 0.17 U 0.19 0.19 U 0.19 U 0.15 U 0.28 U 0.21 U
DIMETHYL PHTHALATE 0.18 U 0.22 U 0.22 U 0.17 U 0.21 U 0.17 U 0.19 U 0.19 U 0.19 U 0.15 U 0.28 U 0.21 U
DI-N-BUTYL PHTHALATE 0.18 U 0.22 U 0.22 U 0.17 U 0.21 U 0.17 U 0.19 U 0.19 U 0.19 U 0.15 U 0.28 U 0.21 U
DI-N-OCTYLPHTHALATE 0.18 U 0.22 U 0.22 U 0.17 U 0.21 U 0.17 U 0.19 U 0.19 U 0.19 U 0.15 U 0.28 U 0.21 U
DINOSEB 0.18 U 0.22 U 0.22 U 0.17 U 0.21 U 0.17 U 0.19 U 0.19 U 0.19 U 0.15 U 0.28 U 0.21 U
DIPHENYLAMINE 0.18 U 0.22 U 0.22 U 0.17 U 0.21 U 0.17 U 0.19 U 0.19 U 0.19 U 0.15 U 0.28 U 0.21 U
ETHYL METHANESULFONATE 0.18 U 0.22 U 0.22 U 0.17 U 0.21 U 0.17 U 0.19 U 0.19 U 0.19 U 0.15 U 0.28 U 0.21 U
HEXACHLOROBENZENE 0.18 U 0.22 U 0.22 U 0.17 U 0.21 U 0.17 U 0.19 U 0.19 U 0.19 U 0.15 U 0.28 U 0.21 U
HEXACHLOROBUTADIENE 0.18 U 0.22 U 0.22 U 0.055 U 0.21 U 0.17 U 0.19 U 0.41 U 0.073 U 0.061 U 0.05 U 0.21 U
HEXACHLOROCYCLOPENTADIENE 0.18 U 0.22 U 0.22 U 0.17 U 0.21 U 0.17 U 0.19 U 0.19 U 0.19 U 0.15 U 0.28 U 0.21 U
HEXACHLOROETHANE 0.18 U 0.22 U 0.22 U 0.17 U 0.21 U 0.17 U 0.19 U 0.19 U 0.19 U 0.15 U 0.28 U 0.21 U
HEXACHLOROPROPENE 0.18 U 0.22 U 0.22 U 0.17 U 0.21 U 0.17 U 0.19 U 0.19 U 0.19 U 0.15 U 0.28 U 0.21 U
ISOPHORONE 0.18 U 0.22 U 0.22 U 0.17 U 0.21 U 0.17 U 0.19 U 0.19 U 0.19 U 0.15 U 0.28 U 0.21 U
METHYL METHANESULFONATE 0.18 U 0.22 U 0.22 U 0.17 U 0.21 U 0.17 U 0.19 U 0.19 U 0.19 U 0.15 U 0.28 U 0.21 U
NITROBENZENE 0.18 U 0.22 U 0.22 U 0.17 U 0.21 U 0.17 U 0.19 U 0.19 U 0.19 U 0.15 U 0.28 U 0.21 U
N-NITROSO-DI-N-BUTYLAMINE 0.18 U 0.22 U 0.22 U 0.17 U 0.21 U 0.17 U 0.19 U 0.19 U 0.19 U 0.15 U 0.28 U 0.21 U
N-NITROSODI-N-PROPYLAMINE 0.18 U 0.22 U 0.22 U 0.17 U 0.21 U 0.17 U 0.19 U 0.19 U 0.19 U 0.15 U 0.28 U 0.21 U
N-NITROSOMORPHOLINE 0.18 U 0.22 U 0.22 U 0.17 U 0.21 U 0.17 U 0.19 U 0.19 U 0.19 U 0.15 U 0.28 U 0.21 U
N-NITROSOPIPERIDINE 0.18 U 0.22 U 0.22 U 0.17 U 0.21 U 0.17 U 0.19 U 0.19 U 0.19 U 0.15 U 0.28 U 0.21 U
N-NITROSOPYRROLIDINE 0.18 U 0.22 U 0.22 U 0.17 U 0.21 U 0.17 U 0.19 U 0.19 U 0.19 U 0.15 U 0.28 U 0.21 U
P-DIMETHYLAMINOAZOBENZENE 0.18 U 0.22 U 0.22 U 0.17 U 0.21 U 0.17 U 0.19 U 0.19 U 0.19 U 0.15 U 0.28 U 0.21 U
PENTACHLOROBENZENE 0.18 U 0.22 U 0.22 U 0.17 U 0.21 U 0.17 U 0.19 U 0.19 U 0.19 U 0.15 U 0.28 U 0.21 U
PENTACHLOROPHENOL 0.18 UJ 0.22 UJ 0.22 UJ 0.17 UJ 0.21 UJ 0.17 UJ 0.19 UJ 0.19 UJ 0.19 UJ 0.15 UJ 0.28 UJ 0.21 UJ
PHENACETIN 0.18 U 0.22 U 0.22 U 0.17 U 0.21 U 0.17 U 0.19 U 0.19 U 0.19 U 0.15 U 0.28 U 0.21 U
PHENOL 0.18 0.52 0.35 0.17 U 0.5 0.17 U 0.19 U 0.19 U 0.19 U 0.15 U 0.28 U 0.39
PRONAMIDE 0.18 U 0.22 U 0.22 U 0.17 U 0.21 U 0.17 U 0.19 U 0.19 U 0.19 U 0.15 U 0.28 U 0.21 USAFROLE 0.18 U 0.22 U 0.22 U 0.17 U 0.21 U 0.17 U 0.19 U 0.19 U 0.19 U 0.15 U 0.28 U 0.21 U
TABLE B39: Bulk SVOC data on Cleveland Harbor Upper Cuyahoga River sediments (surface samples) (OEPA 2013) (yellow highlight indicates that sediment sample was not collected from the channel dredging prism).
1 Not detected at the specified detection limit
SVOC (mg/kg)
UPPER RIVER
DMMU-1 DMMU-2a DMMU-2b

200013 F01A21 F01A42 F01W50 F01S08 302578 302579 302580 302581
NITROGEN, AMMONIA 100 43 170 220 1,100 680 210 320 91
PHOSPHORUS, TOTAL (AS P) 699 441 623 793 670 798 790 674 705
TOTAL ORGANIC CARBON (%) 3.8 1.2 1.4 1.5 1.3 2.0 1.8 1.7 1.6
TABLE B40: Bulk inorganics data on Cleveland Harbor Upper Cuyahoga River sediments (surface samples collected in May) (OEPA 2014a) (yellow highlight indicates that sediment sample was not collected from the channel dredging prism).
DMMU-1 DMMU-2a DMMU-2bINORGANIC (mg/kg)
UPPER RIVER

200013 F01A21 F01A42 F01W50 F01S08 302578 302579 302580 302581
ALUMINUM 5,590 3,500 4,970 7,860 7,900 10,100 9,040 10,300 5,860
ANTIMONY 0.8 U1 0.8 U 0.8 U 0.8 U 0.8 U 0.8 U 0.8 U 0.8 U 0.8 U
ARSENIC 14.4 9.2 10.5 15 15 17.4 16 17.6 12.8
BARIUM 62.4 31.1 44.5 69.6 67.1 85.7 75.3 83.3 59.7
BERYLLIUM 0.409 0.268 0.327 0.484 0.501 0.596 0.533 0.583 0.434
CADMIUM 0.725 0.387 0.502 0.641 0.657 0.992 0.732 0.669 0.594
CALCIUM 8,110 5,330 7,400 9,400 10,600 13,300 11,300 11,600 9,420
CHROMIUM, TOTAL 14 8.62 10.9 14.5 14.4 44.5 16.7 16.2 12.3
COBALT 7.9 4.95 5.86 8.78 8.8 10.2 9.33 10.6 7.59
COPPER 25.8 14.3 20.5 24.9 24.1 33.5 25.9 26.5 24.1
IRON 22,300 14,500 17,700 25,200 25,600 33,200 30,500 31,100 21,700
LEAD 28.4 16.5 23.2 26.7 25.6 34.8 30.4 28.4 27.1
MAGNESIUM 3,750 2,390 3,170 4,640 5,030 6,450 5,710 5,980 4,130
MANGANESE 666 312 428 679 650 652 640 787 561
MERCURY 0.095 0.037 0.064 0.079 0.066 0.132 0.079 0.109 0.077
NICKEL 19.4 12.9 15.2 21.5 21.9 27.7 24.2 26.3 19
POTASSIUM 800 U 800 U 800 U 800 U 800 U 1380 1270 1500 800 U
SELENIUM 0.8 U 0.8 U 0.8 U 0.8 U 0.8 U 0.8 U 0.8 U 0.8 U 0.8 U
SILVER 0.177 0.08 U 0.149 0.152 0.137 0.179 0.166 0.144 0.147
SODIUM 2000 U 2000 U 2000 U 2000 U 2000 U 2000 U 2000 U 2000 U 2000 U
STRONTIUM 12 U 12 U 17 24 24 29 25 28 22
TITANIUM 20 U 20 U 25 20 U 20 U 20 U 20 U 20 U 20 U
VANADIUM 20 U 20 U 20 U 20 U 20 U 20 U 20 U 20 U 20 U
ZINC 138 92.7 112 131 127 246 151 138 127
1 Not detected at the specified detection limit
TABLE B41: Bulk metals data on Cleveland Harbor Upper Cuyahoga River sediments (surface samples collected in May) (OEPA 2014a) (yellow highlight indicates that sediment sample was not collected from the channel dredging prism).
METAL (mg/kg)
UPPER RIVER
DMMU-1 DMMU-2a DMMU-2b

200013 F01A21 F01A42 F01W50 F01S08 302578 302579 302580 302581
AROCLOR 1016 20 U1 20 U 20 U 20 U 20 U 20 U 20 U 20 U 20 UAROCLOR 1221 20 U 20 U 20 U 20 U 20 U 20 U 20 U 20 U 20 UAROCLOR 1232 20 U 20 U 20 U 20 U 20 U 20 U 20 U 20 U 20 UAROCLOR 1242 20 U 34 28.6 45.4 36.3 38.5 20 U 20 U 33.6AROCLOR 1248 20 U 20 U 20 U 20 U 20 U 20 U 20 U 20 U 20 UAROCLOR 1254 20 U 20 U 20 U 20 U 20 U 20 U 20 U 20 U 20 U
AROCLOR 1260 56.4 32 36.4 54.3 122 83.9 68.4 46.8 116
TOTAL PCBs 56.4 66 65 99.7 158 122 68.4 46.8 150
TOC (%) 3.8 1.2 1.4 1.5 1.3 2 1.8 1.7 1.6
TOC-NORMALIZED CONCENTRATION (µg/kg-TOC) 1,484 5,500 4,643 6,647 12,177 6,120 3,800 2,753 9,350
1 Not detected at the specified detection limit
TABLE B42: Bulk PCB data on Cleveland Harbor Upper Cuyahoga River sediments (surface samples collected in May) (OEPA 2014a) (yellow highlight indicates that sediment sample was not collected from the channel dredging prism).
DMMU-1 DMMU-2a DMMU-2b
UPPER RIVER
AROCLOR (µg/kg)

200013 F01A21 F01A42 F01W50 F01S08 302578 302579 302580 302581
ALDRIN 4 U1 4 U 4 U 4 U 4 U 4 U 4 U 4 U 4 UALPHA BHC (ALPHA HEXACHLOROCYCLOHEXANE) 4 U 4 U 4 U 4 U 4 U 4 U 4 U 4 U 4 UALPHA ENDOSULFAN 4 U 4 U 4 U 4 U 4 U 4 U 4 U 4 U 4 UBETA BHC (BETA HEXACHLOROCYCLOHEXANE) 4 U 4 U 4 U 4 U 4 U 4 U 4 U 4 U 4 UBETA ENDOSULFAN 4 U 4 U 4 U 4 U 4 U 4 U 4 U 4 U 4 UDELTA BHC (DELTA HEXACHLOROCYCLOHEXANE) 4 U 4 U 4 U 4 U 4 U 4 U 4 U 4 U 4 UDIELDRIN 4 U 4 U 4 U 4 U 4 U 4 U 4 U 4 U 4 UENDOSULFAN SULFATE 4 U 4 U 4 U 4 U 4 U 4 U 4 U 4 U 4 UENDRIN 4 U 4 U 4 U 4 U 4 U 4 U 4 U 4 U 4 UENDRIN ALDEHYDE 4 U 4 U 4 U 4 U 4 U 4 U 4 U 4 U 4 UGAMMA BHC (LINDANE) 4 U 4 U 4 U 4 U 4 U 4 U 4 U 4 U 4 UHEPTACHLOR 4 U 4 U 4 U 4 U 4 U 4 U 4 U 4 U 4 UHEPTACHLOR EPOXIDE 4 U 4 U 4 U 4 U 4 U 4 U 4 U 4 U 4 UHEXACHLOROBENZENE 4 U 4 U 4 U 4 U 4 U 4 U 4 U 4 U 4 UMETHOXYCHLOR 4 U 4 U 4 U 4 U 4 U 4 U 4 U 4 U 4 UMIREX 4 U 4 U 4 U 4 U 4 U 4 U 4 U 4 U 4 UDDD (DICHLORODIPHENYLDICHLORETHANE) 4 U 4 U 4 U 4 U 4 U 4 U 4 U 4 U 4 UDDE (DICHLORODIPHENYLDICHLORETHYLENE) 17.8 12.5 19.8 18 18.3 21 19.3 14.3 19.4DDT (DICHLORODIPHENYLTRICHLOROETHANE) 21.3 14.4 22.3 22.4 16.2 22.1 34.3 16.8 24.7
TOTAL DDT 39.1 26.9 42.1 40.4 34.5 43.1 53.6 31.1 44.1
TOC (%) 3.8 1.2 1.4 1.5 1.3 2 1.8 1.7 1.6TOC-NORMALIZED CONCENTRATION (µg/kg-TOC) 1,029 2,242 3,007 2,693 2,654 2,155 2,978 1,829 2,756
1 Not detected at the specified detection limit
TABLE B43: Bulk pesticide data on Cleveland Harbor Upper Cuyahoga River sediments (surface samples collected in May) (OEPA 2014a) (yellow highlight indicates that sediment sample was not collected from the channel dredging prism).
PESTICIDE (µg/kg)
UPPER RIVER
DMMU-1 DMMU-2a DMMU-2b

200013 F01A21 F01A42 F01W50 F01S08 302578 302579 302580 302581
ACENAPHTHENE 0.72 U1 0.54 U 0.56 U 0.76 U 0.64 U 0.70 U 0.68 U 0.71 U 0.63 U
ACENAPHTHYLENE 0.72 U 0.54 U 0.56 U 0.76 U 0.64 U 0.70 U 0.68 U 0.71 U 0.63 U
ANTHRACENE 0.72 U 0.54 U 0.56 U 0.76 U 0.64 U 0.70 U 0.68 U 0.71 U 0.63 U
BENZO(A)ANTHRACENE 0.72 U 0.54 U 0.56 U 0.76 U 0.64 U 0.70 U 0.68 U 0.71 U 0.63 U
BENZO(A)PYRENE 0.72 U 0.54 U 0.56 U 0.76 U 0.64 U 0.70 U 0.68 U 0.71 U 0.63 U
BENZO(B)FLUORANTHENE 0.72 U 0.54 U 0.56 U 0.76 U 0.64 U 0.74 0.68 U 0.71 U 0.63 U
BENZO(G,H,I)PERYLENE 0.72 U 0.54 U 0.56 U 0.76 U 0.64 U 0.70 U 0.68 U 0.71 U 0.63 U
BENZO(K)FLUORANTHENE 0.72 U 0.54 U 0.56 U 0.76 U 0.64 U 0.70 U 0.68 U 0.71 U 0.63 U
CHRYSENE 0.72 U 0.54 U 0.56 U 0.76 U 0.64 U 0.70 U 0.68 U 0.71 U 0.63 U
DIBENZ(A,H)ANTHRACENE 0.72 U 0.54 U 0.56 U 0.76 U 0.64 U 0.70 U 0.68 U 0.71 U 0.63 U
DIBENZOFURAN 0.72 U 0.54 U 0.56 U 0.76 U 0.64 U 0.70 U 0.68 U 0.71 U 0.63 U
FLUORANTHENE 0.95 0.57 1.04 1.05 0.66 1.17 0.8 0.71 U 0.92
FLUORENE 0.72 U 0.54 U 0.56 U 0.76 U 0.64 U 0.70 U 0.68 U 0.71 U 0.63 U
INDENO(1,2,3-C,D)PYRENE 0.72 U 0.54 U 0.56 U 0.76 U 0.64 U 0.70 U 0.68 U 0.71 U 0.63 U
NAPHTHALENE 0.72 U 0.54 U 0.56 U 0.76 U 0.64 U 0.70 U 0.68 U 0.71 U 0.63 U
PHENANTHRENE 0.72 U 0.54 U 0.61 0.76 U 0.64 U 0.70 U 0.68 U 0.71 U 0.63 U
PYRENE 0.79 0.54 U 0.86 0.86 0.64 U 0.91 0.68 U 0.71 U 0.77
TOTAL PAHs 0.95 0.57 1.65 1.05 0.66 1.91 0.8 0.92
TOTAL ORGANIC CARBON (%) 3.8 1.2 1.4 1.5 1.3 2 1.8 1.7 1.6
TOC-NORMALIZED CONCENTRATION (mg/kg-TOC) 25 48 118 70 51 96 44 58
1 Not detected at the specified detection limit
TABLE B44: Bulk PAH data on Cleveland Harbor Upper Cuyahoga River sediments (surface samples collected in May) (OEPA 2014a) (yellow highlight indicates that sediment sample was not collected from the channel dredging prism).
PAH COMPOUND (mg/kg)
UPPER RIVER
DMMU-1 DMMU-2a DMMU-2b

200013 F01A21 F01A42 F01W50 F01S08 302578 302579 302580 302581
1,1,1,2-TETRACHLOROETHANE 0.04 U1 0.04 U 0.04 U 0.04 U 0.04 U 0.2 U 0.2 U 0.04 U 0.04 U
1,1,2,2-TETRACHLOROETHANE 0.04 U 0.04 U 0.04 U 0.04 U 0.04 U 0.2 U 0.2 U 0.04 U 0.04 U
1,1,2-TRICHLOROETHANE 0.04 U 0.04 U 0.04 U 0.04 U 0.04 U 0.2 U 0.2 U 0.04 U 0.04 U
1,1-DICHLOROETHANE 0.04 U 0.04 U 0.04 U 0.04 U 0.04 U 0.2 U 0.2 U 0.04 U 0.04 U
1,1-DICHLOROETHENE 0.04 U 0.04 U 0.04 U 0.04 U 0.04 U 0.2 U 0.2 U 0.04 U 0.04 U
1,1-DICHLOROPROPENE 0.04 U 0.04 U 0.04 U 0.04 U 0.04 U 0.2 U 0.2 U 0.04 U 0.04 U
1,2,3-TRICHLOROBENZENE 0.04 U 0.04 U 0.04 U 0.04 U 0.04 U 0.2 U 0.2 U 0.04 U 0.04 U
1,2,3-TRICHLOROPROPANE 0.04 U 0.04 U 0.04 U 0.04 U 0.04 U 0.2 U 0.2 U 0.04 U 0.04 U
1,2,4-TRICHLOROBENZENE 0.04 U 0.04 U 0.04 U 0.04 U 0.04 U 0.2 U 0.2 U 0.04 U 0.04 U
1,2,4-TRIMETHYLBENZENE 0.04 U 0.04 U 0.04 U 0.04 U 0.04 U 0.2 U 0.2 U 0.04 U 0.04 U
1,2-DIBROMO-3-CHLOROPROPANE 0.04 U 0.04 U 0.04 U 0.04 U 0.04 U 0.2 U 0.2 U 0.04 U 0.04 U
1,2-DIBROMOETHANE (ETHYLENE DIBROMIDE) 0.04 U 0.04 U 0.04 U 0.04 U 0.04 U 0.2 U 0.2 U 0.04 U 0.04 U
1,2-DICHLOROBENZENE 0.04 U 0.04 U 0.04 U 0.04 U 0.04 U 0.2 U 0.2 U 0.04 U 0.04 U
1,2-DICHLOROETHANE 0.04 U 0.04 U 0.04 U 0.04 U 0.04 U 0.2 U 0.2 U 0.04 U 0.04 U
1,2-DICHLOROPROPANE 0.04 U 0.04 U 0.04 U 0.04 U 0.04 U 0.2 U 0.2 U 0.04 U 0.04 U
1,3,5-TRIMETHYLBENZENE (MESITYLENE) 0.04 U 0.04 U 0.04 U 0.04 U 0.04 U 0.2 U 0.2 U 0.04 U 0.04 U
1,3-DICHLOROBENZENE 0.04 U 0.04 U 0.04 U 0.04 U 0.04 U 0.2 U 0.2 U 0.04 U 0.04 U
1,3-DICHLOROPROPANE 0.04 U 0.04 U 0.04 U 0.04 U 0.04 U 0.2 U 0.2 U 0.04 U 0.04 U
1,4-DICHLOROBENZENE 0.04 U 0.04 U 0.04 U 0.04 U 0.04 U 0.2 U 0.2 U 0.04 U 0.04 U
2,2-DICHLOROPROPANE 0.04 U 0.04 U 0.04 U 0.04 U 0.04 U 0.2 U 0.2 U 0.04 U 0.04 U
2-CHLOROTOLUENE 0.04 U 0.04 U 0.04 U 0.04 U 0.04 U 0.2 U 0.2 U 0.04 U 0.04 U
2-HEXANONE 0.04 U 0.04 U 0.04 U 0.04 U 0.04 U 0.2 U 0.2 U 0.04 U 0.04 U
4-CHLOROTOLUENE 0.04 U 0.04 U 0.04 U 0.04 U 0.04 U 0.2 U 0.2 U 0.04 U 0.04 U
ACETONE 0.05 U 0.05 U 0.05 U 0.099 0.097 0.2 U 0.2 U 0.05 U 0.097
BENZENE 0.04 U 0.04 U 0.04 U 0.04 U 0.04 U 0.2 U 0.2 U 0.04 U 0.04 U
BROMOBENZENE 0.04 U 0.04 U 0.04 U 0.04 U 0.04 U 0.2 U 0.2 U 0.04 U 0.04 U
BROMOCHLOROMETHANE 0.04 U 0.04 U 0.04 U 0.04 U 0.04 U 0.2 U 0.2 U 0.04 U 0.04 U
BROMODICHLOROMETHANE 0.04 U 0.04 U 0.04 U 0.04 U 0.04 U 0.2 U 0.2 U 0.04 U 0.04 U
BROMOFORM 0.04 U 0.04 U 0.04 U 0.04 U 0.04 U 0.2 U 0.2 U 0.04 U 0.04 U
BROMOMETHANE 0.04 U 0.04 U 0.04 U 0.04 U 0.04 U 0.2 U 0.2 U 0.04 U 0.04 U
CARBON DISULFIDE 0.04 U 0.04 U 0.04 U 0.04 U 0.04 U 0.2 U 0.2 U 0.04 U 0.04 U
CARBON TETRACHLORIDE 0.04 U 0.04 U 0.04 U 0.04 U 0.04 U 0.2 U 0.2 U 0.04 U 0.04 U
CHLOROBENZENE 0.04 U 0.04 U 0.04 U 0.04 U 0.04 U 0.2 U 0.2 U 0.04 U 0.04 U
CHLOROETHANE 0.04 U 0.04 U 0.04 U 0.04 U 0.04 U 0.2 U 0.2 U 0.04 U 0.04 U
CHLOROFORM 0.04 U 0.04 U 0.04 U 0.04 U 0.04 U 0.2 U 0.2 U 0.04 U 0.04 U
CHLOROMETHANE 0.04 U 0.04 U 0.04 U 0.04 U 0.04 U 0.2 U 0.2 U 0.04 U 0.04 U
CIS-1,2-DICHLOROETHYLENE 0.04 U 0.04 U 0.04 U 0.04 U 0.04 U 0.2 U 0.2 U 0.04 U 0.04 U
CIS-1,3-DICHLOROPROPENE 0.04 U 0.04 U 0.04 U 0.04 U 0.04 U 0.2 U 0.2 U 0.04 U 0.04 U
DIBROMOCHLOROMETHANE 0.04 U 0.04 U 0.04 U 0.04 U 0.04 U 0.2 U 0.2 U 0.04 U 0.04 U
DIBROMOMETHANE 0.04 U 0.04 U 0.04 U 0.04 U 0.04 U 0.2 U 0.2 U 0.04 U 0.04 U
DICHLORODIFLUOROMETHANE 0.04 U 0.04 U 0.04 U 0.04 U 0.04 U 0.2 U 0.2 U 0.04 U 0.04 U
ETHYLBENZENE 0.04 U 0.04 U 0.04 U 0.04 U 0.04 U 0.2 U 0.2 U 0.04 U 0.04 U
HEXACHLOROBUTADIENE 0.04 U 0.04 U 0.04 U 0.04 U 0.04 U 0.2 U 0.2 U 0.04 U 0.04 U
ISOPROPYLBENZENE (CUMENE) 0.04 U 0.04 U 0.04 U 0.04 U 0.04 U 0.2 U 0.2 U 0.04 U 0.04 U
M+P-XYLENE 0.04 U 0.04 U 0.04 U 0.04 U 0.04 U 0.2 U 0.2 U 0.04 U 0.04 U
METHYL ETHYL KETONE (2-BUTANONE) 0.04 U 0.04 U 0.04 U 0.04 U 0.04 U 0.2 U 0.2 U 0.04 U 0.04 UMETHYL ISOBUTYL KETONE (4-METHYL-2-PENTANONE) 0.04 U 0.04 U 0.04 U 0.04 U 0.04 U 0.2 U 0.2 U 0.04 U 0.04 U
METHYLENE CHLORIDE 0.04 U 0.04 U 0.04 U 0.04 U 0.04 U 0.2 U 0.2 U 0.04 U 0.04 U
NAPHTHALENE 0.04 U 0.04 U 0.04 U 0.04 U 0.04 U 0.2 U 0.2 U 0.04 U 0.04 U
N-BUTYLBENZENE 0.04 U 0.04 U 0.04 U 0.04 U 0.04 U 0.2 U 0.2 U 0.04 U 0.04 U
N-PROPYLBENZENE 0.04 U 0.04 U 0.04 U 0.04 U 0.04 U 0.2 U 0.2 U 0.04 U 0.04 U
O-XYLENE (1,2-DIMETHYLBENZENE) 0.04 U 0.04 U 0.04 U 0.04 U 0.04 U 0.2 U 0.2 U 0.04 U 0.04 U
P-CYMENE (P-ISOPROPYLTOLUENE) 0.04 U 0.04 U 0.04 U 0.04 U 0.04 U 0.2 U 0.2 U 0.04 U 0.04 U
SEC-BUTYLBENZENE 0.04 U 0.04 U 0.04 U 0.04 U 0.04 U 0.2 U 0.2 U 0.04 U 0.04 U
STYRENE 0.04 U 0.04 U 0.04 U 0.04 U 0.04 U 0.2 U 0.2 U 0.04 U 0.04 U
T-BUTYLBENZENE 0.04 U 0.04 U 0.04 U 0.04 U 0.04 U 0.2 U 0.2 U 0.04 U 0.04 U
TETRACHLOROETHYLENE(PCE) 0.04 U 0.04 U 0.04 U 0.04 U 0.04 U 0.2 U 0.2 U 0.04 U 0.04 U
TOLUENE 0.04 U 0.04 U 0.04 U 0.04 U 0.04 U 3.11 0.35 0.04 U 0.04 U
TRANS-1,2-DICHLOROETHENE 0.04 U 0.04 U 0.04 U 0.04 U 0.04 U 0.2 U 0.2 U 0.04 U 0.04 U
TRANS-1,3-DICHLOROPROPENE 0.04 U 0.04 U 0.04 U 0.04 U 0.04 U 0.2 U 0.2 U 0.04 U 0.04 U
TRICHLOROETHANE 0.04 U 0.04 U 0.04 U 0.04 U 0.04 U 0.2 U 0.2 U 0.04 U 0.04 U
TRICHLOROETHYLENE (TCE) 0.04 U 0.04 U 0.04 U 0.04 U 0.04 U 0.2 U 0.2 U 0.04 U 0.04 U
TRICHLOROFLUOROMETHANE 0.04 U 0.04 U 0.04 U 0.04 U 0.04 U 0.2 U 0.2 U 0.04 U 0.04 U
VINYL CHLORIDE 0.04 U 0.04 U 0.04 U 0.04 U 0.04 U 0.2 U 0.2 U 0.04 U 0.04 U
1 Not detected at the specified detection limit
TABLE B45: Bulk VOC data on Cleveland Harbor Upper Cuyahoga River sediments (surface samples collected in May) (OEPA 2014a) (yellow highlight indicates that sediment sample was not collected from the channel dredging prism).
VOCs (mg/kg)
UPPER RIVER
DMMU-1 DMMU-2a DMMU-2b

200013 F01A21 F01A42 F01W50 F01S08 302578 302579 302580 302581
1,2,4,5-TETRACHLOROBENZENE 0.4 U1 0.4 U 0.4 U 0.4 U 0.4 U 0.4 U 0.4 U 0.4 U 0.4 U
1,2,4-TRICHLOROBENZENE 0.4 UJ 0.4 UJ 0.4 U 0.4 U 0.4 U 0.4 UJ 0.4 UJ 0.4 UJ 0.4 UJ
1,2-DICHLOROBENZENE 0.4 U 0.4 U 0.4 U 0.4 U 0.4 U 0.4 U 0.4 U 0.4 U 0.4 U
1,3-DICHLOROBENZENE 0.4 U 0.4 U 0.4 U 0.4 U 0.4 U 0.4 U 0.4 U 0.4 U 0.4 U
1,3-DINITROBENZENE 0.4 U 0.4 U 0.4 U 0.4 U 0.4 U 0.4 U 0.4 U 0.4 U 0.4 U
1,4-DICHLOROBENZENE 0.4 U 0.4 U 0.4 U 0.4 U 0.4 U 0.4 U 0.4 U 0.4 U 0.4 U
1,4-NAPHTHOQUINONE 0.4 U 0.4 U 0.4 U 0.4 U 0.4 U 0.4 U 0.4 U 0.4 U 0.4 U
2,3,4,6-TETRACHLOROPHENOL 0.4 U 0.4 U 0.4 U 0.4 U 0.4 U 0.4 U 0.4 U 0.4 U 0.4 U
2,4,5-TRICHLOROPHENOL 0.4 U 0.4 U 0.4 U 0.4 U 0.4 U 0.4 U 0.4 U 0.4 U 0.4 U
2,4,6-TRICHLOROPHENOL 0.4 U 0.4 U 0.4 U 0.4 U 0.4 U 0.4 U 0.4 U 0.4 U 0.4 U
2,4-DICHLOROPHENOL 0.4 U 0.4 U 0.4 U 0.4 U 0.4 U 0.4 U 0.4 U 0.4 U 0.4 U
2,4-DIMETHYLPHENOL 0.4 U 0.4 U 0.4 U 0.4 U 0.4 U 0.4 U 0.4 U 0.4 U 0.4 U
2,4-DINITROPHENOL R R 2 U 2 U 2 U R R R R
2,4-DINITROTOLUENE 0.4 U 0.4 U 0.4 U 0.4 U 0.4 U 0.4 U 0.4 U 0.4 U 0.4 U
2,6-DICHLOROPHENOL 0.4 U 0.4 U 0.4 U 0.4 U 0.4 U 0.4 U 0.4 U 0.4 U 0.4 U
2,6-DINITROTOLUENE 0.4 UJ 0.4 UJ 0.4 U 0.4 U 0.4 U 0.4 UJ 0.4 UJ 0.4 UJ 0.4 UJ
2-ACETYLAMINOFLUORENE 0.4 U 0.4 U 0.4 U 0.4 U 0.4 U 0.4 U 0.4 U 0.4 U 0.4 U
2-CHLORONAPHTHALENE 0.4 U 0.4 U 0.4 U 0.4 U 0.4 U 0.4 U 0.4 U 0.4 U 0.4 U
2-CHLOROPHENOL 0.4 UJ 0.4 UJ 0.4 U 0.4 U 0.4 U 0.4 UJ 0.4 UJ 0.4 UJ 0.4 UJ
2-METHYLNAPHTHALENE 0.4 U 0.4 U 0.4 U 0.4 U 0.4 U 0.4 U 0.4 U 0.4 U 0.4 U
2-METHYLPHENOL (O-CRESOL) 0.4 U 0.4 U 0.4 U 0.4 U 0.4 U 0.4 U 0.4 U 0.4 U 0.4 U
2-NITROANILINE 0.4 U 0.4 U 0.4 U 0.4 U 0.4 U 0.4 U 0.4 U 0.4 U 0.4 U
2-NITROPHENOL 0.4 U 0.4 U 0.4 U 0.4 U 0.4 U 0.4 U 0.4 U 0.4 U 0.4 U
2-PICOLINE (ALPHA-PICOLINE) 0.4 U 0.4 U 0.4 U 0.4 U 0.4 U 0.4 U 0.4 U 0.4 U 0.4 U
3,3'-DICHLOROBENZIDINE 2 U 2 U 2 U 2 U 2 U 2 U 2 U 2 U 2 U
3/4-METHYLPHENOL 0.83 0.4 U 2.2 3.37 1.82 4.97 2.71 0.73 1.46
3-METHYLCHOLANTHRENE 0.4 U 0.4 U 0.4 U 0.4 U 0.4 U 0.4 U 0.4 U 0.4 U 0.4 U
4,6-DINITRO-2-METHYLPHENOL 0.4 UJ 0.4 UJ 0.4 UJ 0.4 UJ 0.4 UJ 0.4 UJ 0.4 UJ 0.4 UJ 0.4 UJ
4-BROMOPHENYL PHENYL ETHER 0.4 U 0.4 U 0.4 U 0.4 U 0.4 U 0.4 U 0.4 U 0.4 U 0.4 U
4-CHLORO-3-METHYLPHENOL 0.4 UJ 0.4 UJ 0.4 U 0.4 U 0.4 U 0.4 UJ 0.4 UJ 0.4 UJ 0.4 UJ
4-CHLOROPHENYL PHENYL ETHER 0.4 U 0.4 U 0.4 U 0.4 U 0.4 U 0.4 U 0.4 U 0.4 U 0.4 U
4-NITROANILINE 0.4 U 0.4 U 0.4 U 0.4 U 0.4 U 0.4 U 0.4 U 0.4 U 0.4 U
4-NITROPHENOL 2 UJ 2 UJ 2 U 2 U 2 U 2 UJ 2 UJ 2 UJ 2 UJ
7,12-DIMETHYLBENZ(A)ANTHRACENE 2 U 2 U 2 U 2 U 2 U 2 U 2 U 2 U 2 U
ACETOPHENONE 0.4 U 0.4 U 0.4 U 0.4 U 0.4 U 0.4 U 0.4 U 0.4 U 0.4 U
ANILINE (PHENYLAMINE, AMINOBENZENE) 2 U 2 U 2 U 2 U 2 U 2 U 2 U 2 U 2 U
BENZYL ALCOHOL 0.4 U 0.4 U 0.4 U 0.4 U 0.4 U 0.4 U 0.4 U 0.4 U 0.4 U
BENZYL BUTYL PHTHALATE 0.4 U 0.4 U 0.4 U 0.4 U 0.4 U 0.4 U 0.4 U 0.4 U 0.4 U
BIS(2-CHLOROETHOXY) METHANE 0.4 U 0.4 U 0.4 U 0.4 U 0.4 U 0.4 U 0.4 U 0.4 U 0.4 UBIS(2-CHLOROETHYL) ETHER (2-CHLOROETHYL ETHER) 0.4 U 0.4 U 0.4 U 0.4 U 0.4 U 0.4 U 0.4 U 0.4 U 0.4 U
BIS(2-CHLOROISOPROPYL) ETHER 0.4 U 0.4 U 0.4 U 0.4 U 0.4 U 0.4 U 0.4 U 0.4 U 0.4 U
BIS(2-ETHYLHEXYL) PHTHALATE 0.4 U 0.4 U 0.4 U 0.4 U 0.4 U 0.4 U 0.4 U 0.4 U 0.4 U
DIETHYL PHTHALATE 0.4 U 0.4 U 0.4 U 0.4 U 0.4 U 0.4 U 0.4 U 0.4 U 0.4 U
DIMETHYL PHTHALATE 0.4 U 0.4 U 0.4 U 0.4 U 0.4 U 0.4 U 0.4 U 0.4 U 0.4 U
DI-N-BUTYL PHTHALATE 0.4 U 0.4 U 0.4 U 0.4 U 0.4 U 0.4 U 0.4 U 0.4 U 0.4 U
DI-N-OCTYLPHTHALATE 0.4 U 0.4 U 0.4 U 0.4 U 0.4 U 0.4 U 0.4 U 0.4 U 0.4 U
DINOSEB R R 0.4 U 0.4 U 0.4 U R R R R
DIPHENYLAMINE 0.4 U 0.4 U 0.4 U 0.4 U 0.4 U 0.4 U 0.4 U 0.4 U 0.4 U
ETHYL METHANESULFONATE 0.4 U 0.4 U 0.4 U 0.4 U 0.4 U 0.4 U 0.4 U 0.4 U 0.4 U
HEXACHLOROBENZENE 0.4 U 0.4 U 0.4 U 0.4 U 0.4 U 0.4 U 0.4 U 0.4 U 0.4 U
HEXACHLOROBUTADIENE 0.4 U 0.4 U 0.4 U 0.4 U 0.4 U 0.4 U 0.4 U 0.4 U 0.4 U
HEXACHLOROCYCLOPENTADIENE 0.4 U 0.4 U 0.4 U 0.4 U 0.4 U 0.4 U 0.4 U 0.4 U 0.4 U
HEXACHLOROETHANE 0.4 U 0.4 U 0.4 U 0.4 U 0.4 U 0.4 U 0.4 U 0.4 U 0.4 U
HEXACHLOROPROPENE 0.4 U 0.4 U 0.4 U 0.4 U 0.4 U 0.4 U 0.4 U 0.4 U 0.4 U
ISOPHORONE 0.4 U 0.4 U 0.4 U 0.4 U 0.4 U 0.4 U 0.4 U 0.4 U 0.4 U
METHYL METHANESULFONATE 0.4 U 0.4 U 0.4 U 0.4 U 0.4 U 0.4 U 0.4 U 0.4 U 0.4 U
NITROBENZENE 0.4 U 0.4 U 0.4 U 0.4 U 0.4 U 0.4 U 0.4 U 0.4 U 0.4 U
N-NITROSO-DI-N-BUTYLAMINE 0.4 U 0.4 U 0.4 U 0.4 U 0.4 U 0.4 U 0.4 U 0.4 U 0.4 U
N-NITROSODI-N-PROPYLAMINE 0.4 U 0.4 U 0.4 U 0.4 U 0.4 U 0.4 U 0.4 U 0.4 U 0.4 U
N-NITROSOMORPHOLINE 0.4 U 0.4 U 0.4 U 0.4 U 0.4 U 0.4 U 0.4 U 0.4 U 0.4 U
N-NITROSOPIPERIDINE 0.4 U 0.4 U 0.4 U 0.4 U 0.4 U 0.4 U 0.4 U 0.4 U 0.4 U
N-NITROSOPYRROLIDINE 0.4 U 0.4 U 0.4 U 0.4 U 0.4 U 0.4 U 0.4 U 0.4 U 0.4 U
P-DIMETHYLAMINOAZOBENZENE 0.4 U 0.4 U 0.4 U 0.4 U 0.4 U 0.4 U 0.4 U 0.4 U 0.4 U
PENTACHLOROBENZENE 0.4 U 0.4 U 0.4 U 0.4 U 0.4 U 0.4 U 0.4 U 0.4 U 0.4 U
PENTACHLOROPHENOL 0.4 UJ 0.4 UJ 0.4 UJ 0.4 UJ 0.4 UJ 0.4 UJ 0.4 UJ 0.4 UJ 0.4 UJ
PHENACETIN 0.4 U 0.4 U 0.4 U 0.4 U 0.4 U 0.4 U 0.4 U 0.4 U 0.4 U
PHENOL 0.4 U 0.4 U 0.4 U 0.4 U 0.4 U 0.4 U 0.4 U 0.4 U 0.4 U
PRONAMIDE 0.4 U 0.4 U 0.4 U 0.4 U 0.4 U 0.4 U 0.4 U 0.4 U 0.4 U
SAFROLE 0.4 U 0.4 U 0.4 U 0.4 U 0.4 U 0.4 U 0.4 U 0.4 U 0.4 U
TABLE B46: Bulk SVOC data on Cleveland Harbor Upper Cuyahoga River sediments (surface samples collected in May) (OEPA 2014a) (yellow highlight indicates that sediment sample was not collected from the channel dredging prism).
1 Not detected at the specified detection limit
SVOC (mg/kg)
UPPER RIVER
DMMU-1 DMMU-2a DMMU-2b

TOP BOTTOM TOP BOTTOM DISCRETE BOTTOM TOP BOTTOM TOP BOTTOM TOP BOTTOM TOP BOTTOM TOP BOTTOM TOP BOTTOM
NITROGEN, AMMONIA 390 900 26 450 980 320 280 630 420 540 380 440 510 330 680 330 370 470 390 320 740
PHOSPHORUS, TOTAL (AS P) 734 288 374 858 885 941 824 911 672 935 953 1,010 921 1,100 2,620 947 832 869 893 1,030 1070
TOTAL ORGANIC CARBON (%) 2.0 1.2 1.0 2.2 2.0 2.4 3.1 1.9 0.2 2.2 1.9 1.8 2.0 2.0 3.8 2.4 2.2 1.7 1.6 2.0 1.9
F01A42 302582
TABLE B47: Bulk inorganics data on Cleveland Harbor Upper Cuyahoga River sediments (core samples collected in April) (OEPA 2014b) (highlighting indicates that sediment sample was not collected from the channel dredging prism; yellow is outside the DMMU boundary while orange is below the dredging depth).
F01A41F01W50 F01S08 302581 302578 302579 302580INORGANIC (mg/kg)
UPPER RIVER
DMMU-1 DMMU-2a DMMU-2b
200013 200016 F01A21

TOP BOTTOM TOP BOTTOM DISCRETE BOTTOM TOP BOTTOM TOP BOTTOM TOP BOTTOM TOP BOTTOM TOP BOTTOM TOP BOTTOM
ALUMINUM 6,680 2,800 3,620 8,410 8,460 7,800 6,550 7,990 8,660 7,970 8,340 9,230 8,470 8,990 10,800 8,850 9,410 7,080 7,180 6,100 9,770
ANTIMONY 0.8 U1 0.8 U 0.8 U 0.8 U 0.8 U 0.8 U 0.8 U 0.8 U 0.8 U 0.8 U 1.15 0.8 U 0.8 U 0.8 U 8.48 0.8 U 0.8 U 0.8 U 0.8 U 0.8 U 0.8 U
ARSENIC 12.4 6.83 8.01 14.8 14.4 14.5 13.6 14.2 14.5 15.2 14.9 16.3 15.5 14.8 20.1 15.6 15.8 13.7 13.7 11.5 14.9
BARIUM 60.8 29.7 31.2 72.1 77.6 76.2 66.5 66.2 65.9 73.5 75 83.2 75.6 73.1 150 82.6 77 69.4 68.5 66.6 80.2
BERYLLIUM 0.404 0.225 0.321 0.53 0.515 0.503 0.423 0.553 0.496 0.483 0.49 0.556 0.543 0.517 0.674 0.56 0.569 0.447 0.465 0.46 0.584
CADMIUM 0.867 0.488 1.13 0.959 1.15 1.05 0.957 1.08 1.68 1.03 0.998 1.13 1.17 1.12 16.9 1.14 0.98 0.94 1.08 1.11 1.15
CALCIUM 10,100 4,600 6,940 13,300 13,400 10,200 10,700 14,500 12,600 11,000 14,700 15,100 15,300 14,000 18,900 14,100 13,400 13,600 13,400 14,800 14,500
CHROMIUM, TOTAL 15 7.84 7.83 17.9 19.2 18.5 15.9 20.9 16.2 18 18.5 21.7 19.1 22.8 141 20.3 18.9 17 17.7 18.4 20.7
COBALT 7.13 4.19 4.45 9.54 9.04 8.31 7.84 8.8 8.88 8.2 8.99 9.87 9.69 9.39 13.4 9.53 10.1 8.29 8.69 8.47 9.13
COPPER 35.4 13.3 22 38.3 38.7 36.1 35.4 37.9 35.6 35.2 44.8 45.3 40.6 39.6 138 40.2 36.7 39.7 44.9 42.1 41.9
IRON 22,600 11,900 13,900 27,300 25,400 24,300 23,400 26,400 27,200 26,400 27,300 30,400 28,100 29,300 74,300 29,400 30,100 25,800 25,600 22,800 27,800
LEAD 33.6 16.8 31.4 50.9 40.1 36.6 37.6 36.8 42.7 38.4 40.7 45.3 40.2 39.6 240 41.1 36.6 37 40.2 37.9 42.1
MAGNESIUM 4,560 2,030 2,530 5,760 5,360 4,740 4,540 5,460 5,600 5,090 5,780 6,230 5,950 6,200 5,820 6,200 6,230 5,400 5,530 5,250 5,970
MANGANESE 518 222 279 786 681 534 602 681 653 614 712 761 698 630 952 699 784 566 566 620 605
MERCURY 0.07 0.036 0.08 U 0.085 0.226 0.094 0.091 0.115 0.091 0.1 0.088 0.098 0.087 0.072 0.224 0.093 0.092 0.93 0.094 0.148 0.097
NICKEL 21.7 15.2 15.1 28 27.9 25.1 23.6 27.1 29.8 24.5 27.5 27.9 31.1 26.6 80.2 27.9 28.8 24.3 26.1 23.6 33
POTASSIUM 800 U 800 U 800 U 1,290 1,490 1,440 800 U 1,190 1,320 1,300 1,280 1,510 1,360 1,370 1,820 1,400 1,440 800 U 800 U 800 U 1,760
SELENIUM 0.8 U 0.8 U 0.8 U 0.8 U 0.8 U 0.8 U 0.8 U 0.8 U 0.8 U 0.8 U 0.8 U 0.8 U 0.8 U 0.8 U 0.8 U 0.8 U 0.8 U 0.8 U 0.8 U 0.8 U 0.8 U
SILVER 0.233 0.08 U 0.09 0.252 0.267 0.197 0.201 0.284 0.29 0.289 0.234 0.269 0.255 0.279 2.24 0.278 0.228 0.242 0.3 0.279 0.318
SODIUM 2000 U 2000 U 2000 U 2000 U 2000 U 2000 U 2000 U 2000 U 2000 U 2000 U 2000 U 2000 U 2000 U 2000 U 2000 U 2000 U 2000 U 2000 U 2000 U 2000 U 2000 U
STRONTIUM 24 12 U 12 U 28 31 27 25 30 26 28 33 33 33 29 45 34 30 28 28 30 32
TITANIUM 20 U 20 U 20 U 20 U 20 U 20 U 20 U 20 U 20 U 31 20 U 20 U 20 U 20 U 37 20 U 20 U 20 U 20 U 20 U 20 U
VANADIUM 20 U 20 U 20 U 20 U 20 U 20 U 20 U 20 U 20 U 20 U 20 U 20 U 20 U 20 U 28 20 U 20 U 20 U 20 U 20 U 20 U
ZINC 156 78.9 86.1 173 183 180 175 186 173 171 171 206 191 239 865 200 183 175 186 179 197
TABLE B48: Bulk metals data on Cleveland Harbor Upper Cuyahoga River sediments (core samples collected in April) (OEPA 2014b) (highlighting indicates that sediment sample was not collected from the channel dredging prism; yellow is outside the DMMU boundary while orange is below the dredging depth).
1 Not detected at the specified detection limit
302582 F01A41200013 200016 F01A21
F01A42 F01S08F01W50METAL (mg/kg)
UPPER RIVER
DMMU-1 DMMU-2a DMMU-2b
302578 302579 302580302581

TOP BOTTOM TOP BOTTOM DISCRETE BOTTOM TOP BOTTOM TOP BOTTOM TOP BOTTOM TOP BOTTOM TOP BOTTOM TOP BOTTOM
AROCLOR 1016 20 U1 20 U 20 U 20 U 20 U 20 U 20 U 20 U 20 U 20 U 20 U 20 U 20 U 20 U 20 U 20 U 20 U 20 U 20 U 20 U 20 UAROCLOR 1221 20 U 20 U 20 U 20 U 20 U 20 U 20 U 20 U 20 U 20 U 20 U 20 U 20 U 20 U 20 U 20 U 20 U 20 U 20 U 20 U 20 UAROCLOR 1232 20 U 20 U 20 U 20 U 20 U 20 U 20 U 20 U 20 U 20 U 20 U 20 U 20 U 20 U 20 U 20 U 20 U 20 U 20 U 20 U 20 UAROCLOR 1242 63.2 37.4 26.6 45.6 62.3 58.6 50 46.9 152 48.2 43.4 43 41 47.9 2,620 45.3 36.3 56.3 66.3 61.5 59.9AROCLOR 1248 20 U 20 U 20 U 20 U 20 U 20 U 20 U 20 U 20 U 20 U 20 U 20 U 20 U 20 U 20 U 20 U 20 U 20 U 20 U 20 U 20 UAROCLOR 1254 20 U 20 U 20 U 20 U 20 U 20 U 20 U 20 U 20 U 20 U 20 U 20 U 20 U 20 U 20 U 20 U 20 U 20 U 20 U 20 U 20 UAROCLOR 1260 97.5 20 U 20 U 84.9 77.1 64.5 79.6 89.8 97.7 90.3 93.1 97.7 79.2 84.8 741 68.9 66.5 86.5 92.5 103 82.5
TOTAL PCBs 160.7 37.4 26.6 130.5 139.4 123.1 129.6 136.7 249.7 138.5 136.5 140.7 120.2 132.7 3,361 114.2 102.8 142.8 158.8 164.5 142.4TOC (%) 2 1.2 1 2.2 2 2.4 3.1 1.9 0.2 2.2 1.9 1.8 2 2 3.8 2.4 2.2 1.7 1.6 2 1.9
TOC-NORMALIZED CONCENTRATION (µg/kg-TOC) 8,035 3,117 2,660 5,932 6,970 5,129 4,181 7,195 124,850 6,295 7,184 7,817 6,010 6,635 88,447 4,758 4,673 8,400 9,925 8,225 7,495
DMMU-2b
200013 200016 F01A21F01A42 302582
TABLE B49: Bulk PCB data on Cleveland Harbor Upper Cuyahoga River sediments (core samples collected in April) (OEPA 2014b) (highlighting indicates that sediment sample was not collected from the channel dredging prism; yellow is outside the DMMU boundary while orange is below the dredging depth).
1 Not detected at the specified detection limit
F01A41F01W50 F01S08 302581 302578 302579 302580AROCLOR (µg/kg)
UPPER RIVERDMMU-1 DMMU-2a

TOP BOTTOM TOP BOTTOM DISCRETE BOTTOM TOP BOTTOM TOP BOTTOM TOP BOTTOM TOP BOTTOM TOP BOTTOM TOP BOTTOM
ALDRIN 4 U1 4 U 4 U 4 U 4 U 4 U 4 U 4 U 4 U 4 U 4 U 4 U 4 U 4 U 4 U 4 U 11.7 4 U 4 U 4 U 4 UALPHA BHC (ALPHA HEXACHLOROCYCLOHEXANE) 4 U 4 U 4 U 4 U 4 U 4 U 4 U 4 U 4 U 4 U 4 U 4 U 4 U 4 U 4 U 4 U 4 U 4 U 4 U 4 U 4 UALPHA ENDOSULFAN 4 U 4 U 4 U 4 U 4 U 4 U 4 U 4 U 4 U 4 U 4 U 4 U 4 U 4 U 4 U 4 U 4 U 4 U 4 U 4 U 4 UBETA BHC (BETA HEXACHLOROCYCLOHEXANE) 4 U 4 U 4 U 4 U 4 U 4 U 4 U 4 U 4 U 4 U 4 U 4 U 4 U 4 U 4 U 4 U 4 U 4 U 4 U 4 U 4 UBETA ENDOSULFAN 4 U 4 U 4 U 4 U 4 U 4 U 4 U 4 U 4 U 4 U 4 U 4 U 4 U 4 U 4 U 4 U 4 U 4 U 4 U 4 U 4 U
DELTA BHC (DELTA HEXACHLOROCYCLOHEXANE) 4 U 4 U 4 U 4 U 4 U 4 U 4 U 4 U 4 U 4 U 4 U 4 U 4 U 4 U 4 U 4 U 4 U 4 U 4 U 4 U 4 UDIELDRIN 4 U 4 U 4 U 4 U 4 U 4 U 4 U 4 U 4 U 4 U 4 U 4 U 4 U 4 U 4 U 4 U 4 U 4 U 4 U 4 U 4 UENDOSULFAN SULFATE 4 U 4 U 4 U 4 U 4 U 4 U 4 U 4 U 4 U 4 U 4 U 4 U 4 U 4 U 4 U 4 U 4 U 4 U 4 U 4 U 4 UENDRIN 4 U 4 U 4 U 4 U 4 U 4 U 4 U 4 U 4 U 4 U 4 U 4 U 4 U 4 U 4 U 4 U 4 U 4 U 4 U 4 U 4 UENDRIN ALDEHYDE 4 U 4 U 4 U 4 U 4 U 4 U 4 U 4 U 4 U 4 U 4 U 4 U 4 U 4 U 4 U 4 U 4 U 4 U 4 U 4 U 4 UGAMMA BHC (LINDANE) 4 U 4 U 4 U 4 U 4 U 4 U 4 U 4 U 4 U 4 U 4 U 4 U 4 U 4 U 4 U 4 U 4 U 4 U 4 U 4 U 4 UHEPTACHLOR 4 U 4 U 4 U 4 U 4 U 4 U 4 U 4 U 4 U 4 U 4 U 4 U 4 U 4 U 4 U 4 U 4 U 4 U 4 U 4 U 4 UHEPTACHLOR EPOXIDE 4 U 4 U 4 U 4 U 4 U 4 U 4 U 4 U 4 U 4 U 4 U 4 U 4 U 4 U 4 U 4 U 4 U 4 U 4 U 4 U 4 UHEXACHLOROBENZENE 4 U 4 U 4 U 4 U 4 U 4 U 4 U 4 U 4 U 4 U 4 U 4 U 4 U 4 U 4 U 4 U 4 U 4 U 8.6 4 U 4 UMETHOXYCHLOR 4 U 4 U 4 U 4 U 4 U 4 U 4 U 4 U 4 U 4 U 4 U 4 U 4 U 4 U 4 U 4 U 4 U 4 U 4 U 4 U 4 UMIREX 4 U 4 U 4 U 4 U 4 U 4 U 4 U 4 U 4 U 4 U 4 U 4 U 4 U 4 U 4 U 4 U 4 U 4 U 4 U 4 U 4 UDDD (DICHLORODIPHENYLDICHLORETHANE) 7.4 4 U 4 U 4 U 4 U 4 U 6.4 4 U 8.8 4 U 4 U 8.5 4 U 7.2 8.1 4 U 7.2 7.2 4 U 4 U 7.4
DDE (DICHLORODIPHENYLDICHLORETHYLENE) 15.5 5.8 6.6 13 17.6 21.5 14.5 21.1 13 15.6 15.4 22.8 18.3 17 4 U 18.2 16.3 18 13.7 18.5 17.5DDT (DICHLORODIPHENYLTRICHLOROETHANE) 8.1 4 U 7.5 4 U 4 U 24.4 8.5 13.8 4 U 10.7 7.2 22.9 8 7.4 4 U 11.4 6.8 8.8 4 U 12.6 4 U
TOTAL DDT 31 5.8 14.1 13 17.6 45.9 29.4 34.9 21.8 26.3 22.6 54.2 26.3 31.6 8.1 29.6 30.3 34 13.7 31.1 24.9TOC (%) 2.0 1.2 1.0 2.2 2.0 2.4 3.1 1.9 0.2 2.2 1.9 1.8 2.0 2.0 3.8 2.4 2.2 1.7 1.6 2.0 1.9TOC-NORMALIZED CONCENTRATION (µg/kg-TOC) 1,550 483 1,410 591 880 1,913 948 1,837 10,900 1,195 1,189 3,011 1,315 1,580 213 1,233 1,377 2,000 856 1,555 1,311
200016 F01A21302578
DMMU-1 DMMU-2a DMMU-2b
TABLE B50: Bulk pesticides data on Cleveland Harbor Upper Cuyahoga River sediments (core samples collected in April) (OEPA 2014b) (highlighting indicates that sediment sample was not collected from the channel dredging prism; yellow is outside the DMMU boundary while orange is below the dredging depth).
1 Not detected at the specified detection limit
UPPER RIVER
F01A41PESTICIDE (µg/kg)
F01W50 302580302581302582F01A42 F01S08 302579200013

TOP BOTTOM TOP BOTTOM DISCRETE BOTTOM TOP BOTTOM TOP BOTTOM TOP BOTTOM TOP BOTTOM TOP BOTTOM TOP BOTTOM
ACENAPHTHENE 0.4 U1 0.4 U 0.4 U 0.4 U 0.4 U 0.4 U 0.4 U 0.4 U 0.4 U 0.4 U 0.4 U 0.4 U 0.4 U 0.4 U 1.75 0.4 U 0.4 U 0.4 U 0.4 U 0.4 U 0.4 U
ACENAPHTHYLENE 0.4 U 0.4 U 0.4 U 0.4 U 0.4 U 0.4 U 0.4 U 0.4 U 0.4 U 0.4 U 0.4 U 0.4 U 0.4 U 0.4 U 0.4 U 0.4 U 0.4 U 0.4 U 0.4 U 0.4 U 0.4 U
ANTHRACENE 0.4 U 0.4 U 0.4 U 0.4 U 0.4 U 0.4 U 0.4 U 0.4 U 0.4 U 0.4 U 0.4 U 0.4 U 0.4 U 0.4 U 2.94 0.4 U 0.4 U 0.4 U 0.4 U 0.4 U 0.4 U
BENZO(A)ANTHRACENE 0.74 0.4 U 0.4 U 0.4 U 0.69 0.4 U 0.72 1.55 1.43 0.67 0.87 0.79 0.92 0.4 U 4.3 0.4 U 0.4 U 1.76 1.4 0.72 0.77
BENZO(A)PYRENE 1 0.4 U 0.4 U 0.88 1.1 0.83 0.88 1.82 1.69 0.98 1.34 1.09 1.31 1.75 4.03 1.92 1.41 1.92 1.83 1 1.11
BENZO(B)FLUORANTHENE 1.14 0.4 U 0.4 U 1.08 1.36 1.11 0.98 2.11 2.07 1.1 1.76 1.43 1.41 2.25 4.43 2.54 1.92 2.34 2.21 1.22 1.32
BENZO(G,H,I)PERYLENE 0.93 0.4 U 0.4 U 0.84 1.12 0.86 0.82 1.36 1.24 0.96 1.34 1.03 1.3 1.42 1.41 1.46 0.4 U 1.42 1.39 0.98 1.11
BENZO(K)FLUORANTHENE 0.87 0.4 U 0.4 U 0.75 1.03 0.4 U 0.84 1.45 1.37 0.89 1.09 0.79 1.19 1.72 3.4 1.95 0.4 U 1.38 1.78 0.85 1.06
CHRYSENE 1.08 0.4 U 0.4 U 0.92 1.23 1.1 1.09 2.12 1.98 1.06 1.42 1.16 1.46 2.08 5.42 2.46 1.79 2.23 2.27 1.1 1.24
DIBENZ(A,H)ANTHRACENE 0.4 U 0.4 U 0.4 U 0.4 U 0.4 U 0.4 U 0.4 U 0.4 U 0.4 U 0.4 U 0.4 U 0.4 U 0.4 U 0.4 U 0.4 U 0.4 U 0.4 U 0.4 U 0.4 U 0.4 U 0.4 U
FLUORANTHENE 1.98 1.11 0.59 1.55 2.19 2.21 1.99 4.87 4.14 1.9 2.54 2.05 2.51 3.69 11.2 4.65 3.27 4.68 4.21 1.82 2.14
FLUORENE 0.4 U 0.4 U 0.4 U 0.4 U 0.4 U 0.4 U 0.4 U 0.4 U 0.4 U 0.4 U 0.4 U 0.4 U 0.4 U 0.4 U 3.78 0.4 U 0.4 U 0.4 U 0.4 U 0.4 U 0.4 U
INDENO(1,2,3-C,D)PYRENE 0.79 0.4 U 0.4 U 0.71 1 0.74 0.71 1.32 1.22 0.82 1.17 0.94 1.08 0.4 U 1.44 1.41 0.4 U 1.3 1.36 0.88 0.95
NAPHTHALENE 0.4 U 0.4 U 0.4 U 0.4 U 0.4 U 0.4 U 0.4 U 0.4 U 0.4 U 0.4 U 0.4 U 0.4 U 0.4 U 0.4 U 2.84 0.4 U 0.4 U 0.4 U 0.4 U 0.4 U 0.4 U
PHENANTHRENE 1.25 0.4 U 0.4 U 0.7 0.93 1.13 0.94 3.68 3.04 0.96 1.21 1.2 0.98 1.65 10.5 2.34 1.4 3.54 2.09 1.02 1.06
PYRENE 1.65 0.4 U 0.4 U 1.29 1.75 1.7 1.6 3.74 3.46 1.51 2.02 1.61 2.33 2.95 9.79 3.64 2.64 3.66 3.37 1.5 1.73
TOTAL PAHs 11.43 1.11 0.59 8.72 12.4 9.68 10.57 24.02 21.64 10.85 14.76 12.09 14.49 17.51 67.23 22.37 12.43 24.23 21.91 11.09 12.49
TOTAL ORGANIC CARBON (%) 2.0 1.2 1.0 2.2 2.0 2.4 3.1 1.9 0.2 2.2 1.9 1.8 2.0 2.0 3.8 2.4 2.2 1.7 1.6 2.0 1.9
TOC-NORMALIZED CONCENTRATION (mg/kg-TOC) 572 93 59 396 620 403 341 1,264 10,820 493 777 672 725 876 1,769 932 565 1,425 1,369 555 657
DMMU-2b
200013 200016 F01A21F01A42 302582
TABLE B51: Bulk PAH data on Cleveland Harbor Upper Cuyahoga River sediments (core samples collected in April) (OEPA 2014b) (highlighting indicates that sediment sample was not collected from the channel dredging prism; yellow is outside the DMMU boundary while orange is below the dredging depth).
1 Not detected at the specified detection limit
F01A41F01W50 F01S08 302581 302578 302579 302580PAH COMPOUND (mg/kg)
UPPER RIVER
DMMU-1 DMMU-2a

TOP BOTTOM TOP BOTTOM DISCRETE BOTTOM TOP BOTTOM TOP BOTTOM TOP BOTTOM TOP BOTTOM TOP BOTTOM TOP BOTTOM
1,1,1,2-TETRACHLOROETHANE 0.2 U1 0.2 U 0.2 U 0.2 U 0.04 U 0.2 U 0.2 U 0.04 U 0.04 U 0.2 U 0.04 U 0.2 U 0.04 U 0.04 U 0.04 U 0.2 U 0.04 U 0.04 UJ 0.04 U 0.04 U 0.04 U
1,1,2,2-TETRACHLOROETHANE 0.2 U 0.2 U 0.2 U 0.2 U 0.04 U 0.2 U 0.2 U 0.04 U 0.04 U 0.2 U 0.04 U 0.2 U 0.04 U 0.04 U 0.04 U 0.2 U 0.04 U 0.04 UJ 0.04 U 0.04 U 0.04 U
1,1,2-TRICHLOROETHANE 0.2 U 0.2 U 0.2 U 0.2 U 0.04 U 0.2 U 0.2 U 0.04 U 0.04 U 0.2 U 0.04 U 0.2 U 0.04 U 0.04 U 0.04 U 0.2 U 0.04 U 0.04 UJ 0.04 U 0.04 U 0.04 U
1,1-DICHLOROETHANE 0.2 U 0.2 U 0.2 U 0.2 U 0.04 U 0.2 U 0.2 U 0.04 U 0.04 U 0.2 U 0.04 U 0.2 U 0.04 U 0.04 U 0.04 U 0.2 U 0.04 U 0.04 UJ 0.04 U 0.04 U 0.04 U
1,1-DICHLOROETHENE 0.2 U 0.2 U 0.2 U 0.2 U 0.04 U 0.2 U 0.2 U 0.04 U 0.04 U 0.2 U 0.04 U 0.2 U 0.04 U 0.04 U 0.04 U 0.2 U 0.04 U 0.04 UJ 0.04 U 0.04 U 0.04 U
1,1-DICHLOROPROPENE 0.2 U 0.2 U 0.2 U 0.2 U 0.04 U 0.2 U 0.2 U 0.04 U 0.04 U 0.2 U 0.04 U 0.2 U 0.04 U 0.04 U 0.04 U 0.2 U 0.04 U 0.04 UJ 0.04 U 0.04 U 0.04 U
1,2,3-TRICHLOROBENZENE 0.2 U 0.2 U 0.2 U 0.2 U 0.04 UJ 0.2 U 0.2 U 0.04 UJ 0.04 U 0.2 U 0.04 UJ 0.2 U 0.04 U 0.04 U 0.04 U 0.2 U 0.04 U 0.04 UJ 0.04 U 0.04 U 0.04 U
1,2,3-TRICHLOROPROPANE 0.2 U 0.2 U 0.2 U 0.2 U 0.04 U 0.2 U 0.2 U 0.04 U 0.04 U 0.2 U 0.04 U 0.2 U 0.04 U 0.04 U 0.04 U 0.2 U 0.04 U 0.04 UJ 0.04 U 0.04 U 0.04 U
1,2,4-TRICHLOROBENZENE 0.2 U 0.2 U 0.2 U 0.2 U 0.04 U 0.2 U 0.2 U 0.04 U 0.04 U 0.2 U 0.04 U 0.2 U 0.04 U 0.04 U 0.04 U 0.2 U 0.04 U 0.04 UJ 0.04 U 0.04 U 0.04 U
1,2,4-TRIMETHYLBENZENE 0.2 U 0.2 U 0.2 U 0.2 U 0.04 U 0.2 U 0.2 U 0.04 U 0.04 U 0.2 U 0.04 U 0.2 U 0.04 U 0.04 U 0.208 0.2 U 0.04 U 0.04 UJ 0.04 U 0.04 U 0.04 U
1,2-DIBROMO-3-CHLOROPROPANE 0.2 U 0.2 U 0.2 U 0.2 U 0.04 U 0.2 U 0.2 U 0.04 U 0.04 U 0.2 U 0.04 U 0.2 U 0.04 U 0.04 U 0.04 U 0.2 U 0.04 U 0.04 UJ 0.04 U 0.04 U 0.04 U
1,2-DIBROMOETHANE (ETHYLENE DIBROMIDE) 0.2 U 0.2 U 0.2 U 0.2 U 0.04 U 0.2 U 0.2 U 0.04 U 0.04 U 0.2 U 0.04 U 0.2 U 0.04 U 0.04 U 0.04 U 0.2 U 0.04 U 0.04 UJ 0.04 U 0.04 U 0.04 U
1,2-DICHLOROBENZENE 0.2 U 0.2 U 0.2 U 0.2 U 0.04 U 0.2 U 0.2 U 0.04 U 0.04 U 0.2 U 0.04 U 0.2 U 0.04 U 0.04 U 0.04 U 0.2 U 0.04 U 0.04 UJ 0.04 U 0.04 U 0.04 U
1,2-DICHLOROETHANE 0.2 U 0.2 U 0.2 U 0.2 U 0.04 U 0.2 U 0.2 U 0.04 U 0.04 U 0.2 U 0.04 U 0.2 U 0.04 U 0.04 U 0.04 U 0.2 U 0.04 U 0.04 UJ 0.04 U 0.04 U 0.04 U
1,2-DICHLOROPROPANE 0.2 U 0.2 U 0.2 U 0.2 U 0.04 U 0.2 U 0.2 U 0.04 U 0.04 U 0.2 U 0.04 U 0.2 U 0.04 U 0.04 U 0.04 U 0.2 U 0.04 U 0.04 UJ 0.04 U 0.04 U 0.04 U
1,3,5-TRIMETHYLBENZENE (MESITYLENE) 0.2 U 0.2 U 0.2 U 0.2 U 0.04 U 0.2 U 0.2 U 0.04 U 0.04 U 0.2 U 0.04 U 0.2 U 0.04 U 0.04 U 0.116 0.2 U 0.04 U 0.04 UJ 0.04 U 0.04 U 0.04 U
1,3-DICHLOROBENZENE 0.2 U 0.2 U 0.2 U 0.2 U 0.04 U 0.2 U 0.2 U 0.04 U 0.04 U 0.2 U 0.04 U 0.2 U 0.04 U 0.04 U 0.04 U 0.2 U 0.04 U 0.04 UJ 0.04 U 0.04 U 0.04 U
1,3-DICHLOROPROPANE 0.2 U 0.2 U 0.2 U 0.2 U 0.04 U 0.2 U 0.2 U 0.04 U 0.04 U 0.2 U 0.04 U 0.2 U 0.04 U 0.04 U 0.04 U 0.2 U 0.04 U 0.04 UJ 0.04 U 0.04 U 0.04 U
1,4-DICHLOROBENZENE 0.2 U 0.2 U 0.2 U 0.2 U 0.04 U 0.2 U 0.2 U 0.04 U 0.04 U 0.2 U 0.04 U 0.2 U 0.04 U 0.04 U 0.04 U 0.2 U 0.04 U 0.04 UJ 0.04 U 0.04 U 0.04 U
2,2-DICHLOROPROPANE 0.2 U 0.2 U 0.2 U 0.2 U 0.04 U 0.2 U 0.2 U 0.04 U 0.04 U 0.2 U 0.04 U 0.2 U 0.04 U 0.04 U 0.04 U 0.2 U 0.04 U 0.04 UJ 0.04 U 0.04 U 0.04 U
2-CHLOROTOLUENE 0.2 U 0.2 U 0.2 U 0.2 U 0.04 U 0.2 U 0.2 U 0.04 U 0.04 U 0.2 U 0.04 U 0.2 U 0.04 U 0.04 U 0.04 U 0.2 U 0.04 U 0.04 UJ 0.04 U 0.04 U 0.04 U
2-HEXANONE 0.2 U 0.2 U 0.2 U 0.2 U 0.04 U 0.2 U 0.2 U 0.04 U 0.04 U 0.2 U 0.04 U 0.2 U 0.04 U 0.04 U 0.04 U 0.2 U 0.04 U 0.04 UJ 0.04 U 0.04 U 0.04 U
4-CHLOROTOLUENE 0.2 U 0.2 U 0.2 U 0.2 U 0.04 U 0.2 U 0.2 U 0.04 U 0.04 U 0.2 U 0.04 U 0.2 U 0.04 U 0.04 U 0.04 U 0.2 U 0.04 U 0.04 UJ 0.04 U 0.04 U 0.04 U
ACETONE 0.2 U 0.2 U 0.2 U 0.2 U 0.068 0.2 U 0.2 U 0.072 0.121 0.2 U 0.139 0.2 U 0.092 0.105 0.129 0.2 U 0.05 U 0.098 0.076 0.102 0.083
BENZENE 0.2 U 0.2 U 0.2 U 0.2 U 0.04 U 0.2 U 0.2 U 0.04 U 0.04 U 0.2 U 0.04 U 0.2 U 0.04 U 0.04 U 0.04 U 0.2 U 0.04 U 0.04 UJ 0.04 U 0.04 U 0.04 U
BROMOBENZENE 0.2 U 0.2 U 0.2 U 0.2 U 0.04 U 0.2 U 0.2 U 0.04 U 0.04 U 0.2 U 0.04 U 0.2 U 0.04 U 0.04 U 0.04 U 0.2 U 0.04 U 0.04 UJ 0.04 U 0.04 U 0.04 U
BROMOCHLOROMETHANE 0.2 U 0.2 U 0.2 U 0.2 U 0.04 U 0.2 U 0.2 U 0.04 U 0.04 U 0.2 U 0.04 U 0.2 U 0.04 U 0.04 U 0.04 U 0.2 U 0.04 U 0.04 UJ 0.04 U 0.04 U 0.04 U
BROMODICHLOROMETHANE 0.2 U 0.2 U 0.2 U 0.2 U 0.04 U 0.2 U 0.2 U 0.04 U 0.04 U 0.2 U 0.04 U 0.2 U 0.04 U 0.04 U 0.04 U 0.2 U 0.04 U 0.04 UJ 0.04 U 0.04 U 0.04 U
BROMOFORM 0.2 U 0.2 U 0.2 U 0.2 U 0.04 U 0.2 U 0.2 U 0.04 U 0.04 U 0.2 U 0.04 U 0.2 U 0.04 U 0.04 U 0.04 U 0.2 U 0.04 U 0.04 UJ 0.04 U 0.04 U 0.04 U
BROMOMETHANE 0.2 U 0.2 U 0.2 U 0.2 U 0.04 U 0.2 U 0.2 U 0.04 U 0.04 U 0.2 U 0.04 U 0.2 U 0.04 U 0.04 U 0.04 U 0.2 U 0.04 U 0.04 UJ 0.04 U 0.04 U 0.04 U
CARBON DISULFIDE 0.2 U 0.2 U 0.2 U 0.2 U 0.04 U 0.2 U 0.2 U 0.04 U 0.04 U 0.2 U 0.04 U 0.2 U 0.04 U 0.04 U 0.04 U 0.2 U 0.04 U 0.04 UJ 0.04 U 0.04 U 0.04 U
CARBON TETRACHLORIDE 0.2 U 0.2 U 0.2 U 0.2 U 0.04 U 0.2 U 0.2 U 0.04 U 0.04 U 0.2 U 0.04 U 0.2 U 0.04 U 0.04 U 0.04 U 0.2 U 0.04 U 0.04 UJ 0.04 U 0.04 U 0.04 U
CHLOROBENZENE 0.2 U 0.2 U 0.2 U 0.2 U 0.04 U 0.2 U 0.2 U 0.04 UJ 0.04 U 0.2 U 0.04 U 0.2 U 0.04 U 0.04 U 0.04 U 0.2 U 0.04 U 0.04 UJ 0.04 U 0.04 U 0.04 U
CHLOROETHANE 0.2 U 0.2 U 0.2 U 0.2 U 0.04 U 0.2 U 0.2 U 0.04 U 0.04 U 0.2 U 0.04 U 0.2 U 0.04 U 0.04 U 0.04 U 0.2 U 0.04 U 0.04 UJ 0.04 U 0.04 U 0.04 U
CHLOROFORM 0.2 U 0.2 U 0.2 U 0.2 U 0.04 U 0.2 U 0.2 U 0.04 U 0.04 U 0.2 U 0.04 U 0.2 U 0.04 U 0.04 U 0.04 U 0.2 U 0.04 U 0.04 UJ 0.04 U 0.04 U 0.04 U
CHLOROMETHANE 0.2 U 0.2 U 0.2 U 0.2 U 0.04 U 0.2 U 0.2 U 0.04 U 0.04 U 0.2 U 0.04 U 0.2 U 0.04 U 0.04 U 0.04 U 0.2 U 0.04 U 0.04 UJ 0.04 U 0.04 U 0.04 U
CIS-1,2-DICHLOROETHYLENE 0.2 U 0.2 U 0.2 U 0.2 U 0.04 U 0.2 U 0.2 U 0.04 U 0.04 U 0.2 U 0.04 U 0.2 U 0.04 U 0.04 U 0.04 U 0.2 U 0.04 U 0.04 UJ 0.04 U 0.04 U 0.04 U
CIS-1,3-DICHLOROPROPENE 0.2 U 0.2 U 0.2 U 0.2 U 0.04 U 0.2 U 0.2 U 0.04 U 0.04 U 0.2 U 0.04 U 0.2 U 0.04 U 0.04 U 0.04 U 0.2 U 0.04 U 0.04 UJ 0.04 U 0.04 U 0.04 U
DIBROMOCHLOROMETHANE 0.2 U 0.2 U 0.2 U 0.2 U 0.04 U 0.2 U 0.2 U 0.04 U 0.04 U 0.2 U 0.04 U 0.2 U 0.04 U 0.04 U 0.04 U 0.2 U 0.04 U 0.04 UJ 0.04 U 0.04 U 0.04 U
DIBROMOMETHANE 0.2 U 0.2 U 0.2 U 0.2 U 0.04 U 0.2 U 0.2 U 0.04 U 0.04 U 0.2 U 0.04 U 0.2 U 0.04 U 0.04 U 0.04 U 0.2 U 0.04 U 0.04 UJ 0.04 U 0.04 U 0.04 U
DICHLORODIFLUOROMETHANE 0.2 U 0.2 U 0.2 U 0.2 U 0.04 U 0.2 U 0.2 U 0.04 U 0.04 U 0.2 U 0.04 U 0.2 U 0.04 U 0.04 U 0.04 U 0.2 U 0.04 U 0.04 UJ 0.04 U 0.04 U 0.04 U
ETHYLBENZENE 0.2 U 0.2 U 0.2 U 0.2 U 0.04 U 0.2 U 0.2 U 0.04 U 0.04 U 0.2 U 0.04 U 0.2 U 0.04 U 0.04 U 0.04 U 0.2 U 0.04 U 0.04 UJ 0.04 U 0.04 U 0.04 U
HEXACHLOROBUTADIENE 0.2 U 0.2 U 0.2 U 0.2 U 0.04 U 0.2 U 0.2 U 0.04 U 0.04 U 0.2 U 0.04 U 0.2 U 0.04 U 0.04 U 0.04 U 0.2 U 0.04 U 0.04 UJ 0.04 U 0.04 U 0.04 U
ISOPROPYLBENZENE (CUMENE) 0.2 U 0.2 U 0.2 U 0.2 U 0.04 U 0.2 U 0.2 U 0.04 U 0.04 U 0.2 U 0.04 U 0.2 U 0.04 U 0.04 U 0.04 U 0.2 U 0.04 U 0.04 UJ 0.04 U 0.04 U 0.04 U
M+P-XYLENE 0.2 U 0.2 U 0.2 U 0.2 U 0.04 U 0.2 U 0.2 U 0.04 U 0.04 U 0.2 U 0.04 U 0.2 U 0.04 U 0.04 U 0.04 U 0.2 U 0.04 U 0.04 UJ 0.04 U 0.04 U 0.04 U
METHYL ETHYL KETONE (2-BUTANONE) 0.2 U 0.2 U 0.2 U 0.2 U 0.04 U 0.2 U 0.2 U 0.04 U 0.04 U 0.2 U 0.04 U 0.2 U 0.04 U 0.04 U 0.04 U 0.2 U 0.04 U 0.04 UJ 0.04 U 0.04 U 0.04 UMETHYL ISOBUTYL KETONE (4-METHYL-2-PENTANONE) 0.2 U 0.2 U 0.2 U 0.2 U 0.04 U 0.2 U 0.2 U 0.04 U 0.04 U 0.2 U 0.04 U 0.2 U 0.04 U 0.04 U 0.04 U 0.2 U 0.04 U 0.04 UJ 0.04 U 0.04 U 0.04 U
METHYLENE CHLORIDE 0.2 U 0.2 U 0.2 U 0.2 U 0.04 U 0.2 U 0.2 U 0.04 U 0.04 U 0.2 U 0.04 U 0.2 U 0.04 U 0.04 U 0.04 U 0.2 U 0.04 U 0.04 UJ 0.04 U 0.04 U 0.04 U
NAPHTHALENE 0.2 U 0.2 U 0.2 U 0.2 U 0.04 U 0.2 U 0.2 U 0.04 U 0.04 U 0.2 U 0.04 U 0.2 U 0.04 U 0.04 U 0.069 0.2 U 0.04 U 0.04 UJ 0.04 U 0.04 U 0.04 U
N-BUTYLBENZENE 0.2 U 0.2 U 0.2 U 0.2 U 0.04 U 0.2 U 0.2 U 0.04 U 0.04 U 0.2 U 0.04 U 0.2 U 0.04 U 0.04 U 0.04 U 0.2 U 0.04 U 0.04 UJ 0.04 U 0.04 U 0.04 U
N-PROPYLBENZENE 0.2 U 0.2 U 0.2 U 0.2 U 0.04 U 0.2 U 0.2 U 0.04 U 0.04 U 0.2 U 0.04 U 0.2 U 0.04 U 0.04 U 0.04 U 0.2 U 0.04 U 0.04 UJ 0.04 U 0.04 U 0.04 U
O-XYLENE (1,2-DIMETHYLBENZENE) 0.2 U 0.2 U 0.2 U 0.2 U 0.04 U 0.2 U 0.2 U 0.04 U 0.04 U 0.2 U 0.04 U 0.2 U 0.04 U 0.04 U 0.04 U 0.2 U 0.04 U 0.04 UJ 0.04 U 0.04 U 0.04 U
P-CYMENE (P-ISOPROPYLTOLUENE) 0.2 U 0.2 U 0.2 U 0.2 U 0.04 U 0.2 U 0.2 U 0.04 U 0.04 U 0.2 U 0.04 U 0.2 U 0.04 U 0.04 U 0.04 U 0.2 U 0.04 U 0.04 UJ 0.04 U 0.04 U 0.04 U
SEC-BUTYLBENZENE 0.2 U 0.2 U 0.2 U 0.2 U 0.04 U 0.2 U 0.2 U 0.04 U 0.04 U 0.2 U 0.04 U 0.2 U 0.04 U 0.04 U 0.04 U 0.2 U 0.04 U 0.04 UJ 0.04 U 0.04 U 0.04 U
STYRENE 0.2 U 0.2 U 0.2 U 0.2 U 0.04 U 0.2 U 0.2 U 0.04 U 0.04 U 0.2 U 0.04 U 0.2 U 0.04 U 0.04 U 0.04 U 0.2 U 0.04 U 0.04 UJ 0.04 U 0.04 U 0.04 U
T-BUTYLBENZENE 0.2 U 0.2 U 0.2 U 0.2 U 0.04 U 0.2 U 0.2 U 0.04 U 0.04 U 0.2 U 0.04 U 0.2 U 0.04 U 0.04 U 0.04 U 0.2 U 0.04 U 0.04 UJ 0.04 U 0.04 U 0.04 U
TETRACHLOROETHYLENE(PCE) 0.2 U 0.2 U 0.2 U 0.2 U 0.04 U 0.2 U 0.2 U 0.04 U 0.04 U 0.2 U 0.04 U 0.2 U 0.04 U 0.04 U 0.04 U 0.2 U 0.04 U 0.04 UJ 0.04 U 0.04 U 0.04 U
TOLUENE 0.83 0.78 1.86 10 0.04 U 2.86 4.41 0.04 UJ 0.04 U 7.21 0.04 U 0.88 0.04 U 0.04 U 0.04 U 7.69 0.04 U 0.083 0.04 U 0.061 0.04 U
TRANS-1,2-DICHLOROETHENE 0.2 U 0.2 U 0.2 U 0.2 U 0.04 U 0.2 U 0.2 U 0.04 U 0.04 U 0.2 U 0.04 U 0.2 U 0.04 U 0.04 U 0.04 U 0.2 U 0.04 U 0.04 UJ 0.04 U 0.04 U 0.04 U
TRANS-1,3-DICHLOROPROPENE 0.2 U 0.2 U 0.2 U 0.2 U 0.04 U 0.2 U 0.2 U 0.04 U 0.04 U 0.2 U 0.04 U 0.2 U 0.04 U 0.04 U 0.04 U 0.2 U 0.04 U 0.04 UJ 0.04 U 0.04 U 0.04 U
TRICHLOROETHANE 0.2 U 0.2 U 0.2 U 0.2 U 0.04 U 0.2 U 0.2 U 0.04 U 0.04 U 0.2 U 0.04 U 0.2 U 0.04 U 0.04 U 0.04 U 0.2 U 0.04 U 0.04 UJ 0.04 U 0.04 U 0.04 U
TRICHLOROETHYLENE (TCE) 0.2 U 0.2 U 0.2 U 0.2 U 0.04 U 0.2 U 0.2 U 0.04 U 0.04 U 0.2 U 0.04 U 0.2 U 0.04 U 0.04 U 0.04 U 0.2 U 0.04 U 0.04 UJ 0.04 U 0.04 U 0.04 U
TRICHLOROFLUOROMETHANE 0.2 U 0.2 U 0.2 U 0.2 U 0.04 U 0.2 U 0.2 U 0.04 U 0.04 U 0.2 U 0.04 U 0.2 U 0.04 U 0.04 U 0.04 U 0.2 U 0.04 U 0.04 UJ 0.04 U 0.04 U 0.04 U
VINYL CHLORIDE 0.2 U 0.2 U 0.2 U 0.2 U 0.04 U 0.2 U 0.2 U 0.04 U 0.04 U 0.2 U 0.04 U 0.2 U 0.04 U 0.04 U 0.04 U 0.2 U 0.04 U 0.04 UJ 0.04 U 0.04 U 0.04 U
DMMU-1 DMMU-2a
TABLE B52: Bulk VOC data on Cleveland Harbor Upper Cuyahoga River sediments (core samples collected in April) (OEPA 2014b) (highlighting indicates that sediment sample was not collected from the channel dredging prism; yellow is outside the DMMU boundary while orange is below the dredging depth).
1 Not detected at the specified detection limit
DMMU-2b
F01A41VOC (mg/kg)
F01W50 302580302581302582F01A42 F01S08 302579200013 200016 F01A21
302578
UPPER RIVER

TOP BOTTOM TOP BOTTOM DISCRETE BOTTOM TOP BOTTOM TOP BOTTOM TOP BOTTOM TOP BOTTOM TOP BOTTOM TOP BOTTOM
1,2,4,5-TETRACHLOROBENZENE 0.4 U1 0.4 U 0.4 U 0.4 U 0.4 U 0.4 U 0.4 U 0.4 U 0.4 U 0.4 U 0.4 U 0.4 U 0.4 U 0.4 U 0.4 U 0.4 U 0.4 U 0.4 U 0.4 U 0.4 U 0.4 U
1,2,4-TRICHLOROBENZENE 0.4 U 0.4 U 0.4 U 0.4 U 0.4 U 0.4 U 0.4 U 0.4 U 0.4 U 0.4 U 0.4 U 0.4 U 0.4 U 0.4 U 0.4 U 0.4 U 0.4 U 0.4 U 0.4 U 0.4 U 0.4 U
1,2-DICHLOROBENZENE 0.4 U 0.4 U 0.4 U 0.4 U 0.4 U 0.4 U 0.4 U 0.4 U 0.4 U 0.4 U 0.4 U 0.4 U 0.4 U 0.4 U 0.4 U 0.4 U 0.4 U 0.4 U 0.4 U 0.4 U 0.4 U
1,3-DICHLOROBENZENE 0.4 U 0.4 U 0.4 U 0.4 U 0.4 U 0.4 U 0.4 U 0.4 U 0.4 U 0.4 U 0.4 U 0.4 U 0.4 U 0.4 U 0.4 U 0.4 U 0.4 U 0.4 U 0.4 U 0.4 U 0.4 U
1,3-DINITROBENZENE 0.4 U 0.4 U 0.4 U 0.4 U 0.4 U 0.4 U 0.4 U 0.4 U 0.4 U 0.4 U 0.4 U 0.4 U 0.4 U 0.4 U 0.4 U 0.4 U 0.4 U 0.4 U 0.4 U 0.4 U 0.4 U
1,4-DICHLOROBENZENE 0.4 U 0.4 U 0.4 U 0.4 U 0.4 U 0.4 U 0.4 U 0.4 U 0.4 U 0.4 U 0.4 U 0.4 U 0.4 U 0.4 U 0.4 U 0.4 U 0.4 U 0.4 U 0.4 U 0.4 U 0.4 U
1,4-NAPHTHOQUINONE 0.4 U 0.4 U 0.4 U 0.4 U 0.4 U 0.4 U 0.4 U 0.4 U 0.4 U 0.4 U 0.4 U 0.4 U 0.4 U 0.4 U 0.4 U 0.4 U 0.4 U 0.4 U 0.4 U 0.4 U 0.4 U
2,3,4,6-TETRACHLOROPHENOL 0.4 U 0.4 U 0.4 U 0.4 U 0.4 U 0.4 U 0.4 U 0.4 U 0.4 U 0.4 U 0.4 U 0.4 U 0.4 U 0.4 U 0.4 U 0.4 U 0.4 U 0.4 U 0.4 U 0.4 U 0.4 U
2,4,5-TRICHLOROPHENOL 0.4 U 0.4 U 0.4 U 0.4 U 0.4 U 0.4 U 0.4 U 0.4 U 0.4 U 0.4 U 0.4 U 0.4 U 0.4 U 0.4 U 0.4 U 0.4 U 0.4 U 0.4 U 0.4 U 0.4 U 0.4 U
2,4,6-TRICHLOROPHENOL 0.4 U 0.4 U 0.4 U 0.4 U 0.4 U 0.4 U 0.4 U 0.4 U 0.4 U 0.4 U 0.4 U 0.4 U 0.4 U 0.4 U 0.4 U 0.4 U 0.4 U 0.4 U 0.4 U 0.4 U 0.4 U
2,4-DICHLOROPHENOL 0.4 U 0.4 U 0.4 U 0.4 U 0.4 U 0.4 U 0.4 U 0.4 U 0.4 U 0.4 U 0.4 U 0.4 U 0.4 U 0.4 U 0.4 U 0.4 U 0.4 U 0.4 U 0.4 U 0.4 U 0.4 U
2,4-DIMETHYLPHENOL 0.4 U 0.4 U 0.4 U 0.4 U 0.4 U 0.4 U 0.4 U 0.4 U 0.4 U 0.4 U 0.4 U 0.4 U 0.4 U 0.4 U 0.4 U 0.4 U 0.4 U 0.4 U 0.4 U 0.4 U 0.4 U
2,4-DINITROPHENOL 2 U 2 U 2 U 2 U 2 U 2 U 2 U 2 U 2 U 2 U 2 U 2 U 2 U 2 U 2 U 2 U 2 U 2 U 2 U 2 U 2 U
2,4-DINITROTOLUENE 0.4 U 0.4 U 0.4 U 0.4 U 0.4 U 0.4 U 0.4 U 0.4 U 0.4 U 0.4 U 0.4 U 0.4 U 0.4 U 0.4 U 0.4 U 0.4 U 0.4 U 0.4 U 0.4 U 0.4 U 0.4 U
2,6-DICHLOROPHENOL 0.4 U 0.4 U 0.4 U 0.4 U 0.4 U 0.4 U 0.4 U 0.4 U 0.4 U 0.4 U 0.4 U 0.4 U 0.4 U 0.4 U 0.4 U 0.4 U 0.4 U 0.4 U 0.4 U 0.4 U 0.4 U
2,6-DINITROTOLUENE 0.4 U 0.4 U 0.4 U 0.4 U 0.4 U 0.4 U 0.4 U 0.4 U 0.4 U 0.4 U 0.4 U 0.4 U 0.4 U 0.4 U 0.4 U 0.4 U 0.4 U 0.4 U 0.4 U 0.4 U 0.4 U
2-ACETYLAMINOFLUORENE 0.4 U 0.4 U 0.4 U 0.4 U 0.4 U 0.4 U 0.4 U 0.4 U 0.4 U 0.4 U 0.4 U 0.4 U 0.4 U 0.4 U 0.4 U 0.4 U 0.4 U 0.4 U 0.4 U 0.4 U 0.4 U
2-CHLORONAPHTHALENE 0.4 U 0.4 U 0.4 U 0.4 U 0.4 U 0.4 U 0.4 U 0.4 U 0.4 U 0.4 U 0.4 U 0.4 U 0.4 U 0.4 U 0.4 U 0.4 U 0.4 U 0.4 U 0.4 U 0.4 U 0.4 U
2-CHLOROPHENOL 0.4 U 0.4 U 0.4 U 0.4 U 0.4 U 0.4 U 0.4 U 0.4 U 0.4 U 0.4 U 0.4 U 0.4 U 0.4 U 0.4 U 0.4 U 0.4 U 0.4 U 0.4 U 0.4 U 0.4 U 0.4 U
2-METHYLNAPHTHALENE 0.4 U 0.4 U 0.4 U 0.4 U 0.4 U 0.4 U 0.4 U 0.4 U 0.4 U 0.4 U 0.4 U 0.4 U 0.4 U 0.4 U 0.4 U 0.4 U 0.4 U 0.4 U 0.4 U 0.4 U 0.4 U
2-METHYLPHENOL (O-CRESOL) 0.4 U 0.4 U 0.4 U 0.4 U 0.4 U 0.4 U 0.4 U 0.4 U 0.4 U 0.4 U 0.4 U 0.4 U 0.4 U 0.4 U 0.4 U 0.4 U 0.4 U 0.4 U 0.4 U 0.4 U 0.4 U
2-NITROANILINE 0.4 U 0.4 U 0.4 U 0.4 U 0.4 U 0.4 U 0.4 U 0.4 U 0.4 U 0.4 U 0.4 U 0.4 U 0.4 U 0.4 U 0.4 U 0.4 U 0.4 U 0.4 U 0.4 U 0.4 U 0.4 U
2-NITROPHENOL 0.4 U 0.4 U 0.4 U 0.4 U 0.4 U 0.4 U 0.4 U 0.4 U 0.4 U 0.4 U 0.4 U 0.4 U 0.4 U 0.4 U 0.4 U 0.4 U 0.4 U 0.4 U 0.4 U 0.4 U 0.4 U
2-PICOLINE (ALPHA-PICOLINE) 0.4 U 0.4 U 0.4 U 0.4 U 0.4 U 0.4 U 0.4 U 0.4 U 0.4 U 0.4 U 0.4 U 0.4 U 0.4 U 0.4 U 0.4 U 0.4 U 0.4 U 0.4 U 0.4 U 0.4 U 0.4 U
3,3'-DICHLOROBENZIDINE 2 U 2 U 2 U 2 U 2 U 2 U 2 U 2 U 2 U 2 U 2 U 2 U 2 U 2 U 2 U 2 U 2 U 2 U 2 U 2 U 2 U
3/4-METHYLPHENOL 3.57 0.4 U 1.72 0.83 0.4 U 18.6 3.73 0.4 U 0.4 U 11.9 0.4 U 2.93 0.4 U 1.5 0.4 U 22.2 0.4 U 2.15 0.4 U 2.09 0.4 U
3-METHYLCHOLANTHRENE 0.4 U 0.4 U 0.4 U 0.4 U 0.4 U 0.4 U 0.4 U 0.4 U 0.4 U 0.4 U 0.4 U 0.4 U 0.4 U 0.4 U 0.4 U 0.4 U 0.4 U 0.4 U 0.4 U 0.4 U 0.4 U
4,6-DINITRO-2-METHYLPHENOL 0.4 UJ 0.4 UJ 0.4 UJ 0.4 UJ 0.4 UJ 0.4 UJ 0.4 UJ 0.4 UJ 0.4 UJ 0.4 UJ 0.4 UJ 0.4 UJ 0.4 UJ 0.4 UJ 0.4 UJ 0.4 UJ 0.4 UJ 0.4 UJ 0.4 UJ 0.4 UJ 0.4 UJ
4-BROMOPHENYL PHENYL ETHER 0.4 U 0.4 U 0.4 U 0.4 U 0.4 U 0.4 U 0.4 U 0.4 U 0.4 U 0.4 U 0.4 U 0.4 U 0.4 U 0.4 U 0.4 U 0.4 U 0.4 U 0.4 U 0.4 U 0.4 U 0.4 U
4-CHLORO-3-METHYLPHENOL 0.4 U 0.4 U 0.4 U 0.4 U 0.4 U 0.4 U 0.4 U 0.4 U 0.4 U 0.4 U 0.4 U 0.4 U 0.4 U 0.4 U 0.4 U 0.4 U 0.4 U 0.4 U 0.4 U 0.4 U 0.4 U
4-CHLOROPHENYL PHENYL ETHER 0.4 U 0.4 U 0.4 U 0.4 U 0.4 U 0.4 U 0.4 U 0.4 U 0.4 U 0.4 U 0.4 U 0.4 U 0.4 U 0.4 U 0.4 U 0.4 U 0.4 U 0.4 U 0.4 U 0.4 U 0.4 U
4-NITROANILINE 0.4 U 0.4 U 0.4 U 0.4 U 0.4 U 0.4 U 0.4 U 0.4 U 0.4 U 0.4 U 0.4 U 0.4 U 0.4 U 0.4 U 0.4 U 0.4 U 0.4 U 0.4 U 0.4 U 0.4 U 0.4 U
4-NITROPHENOL 2 U 2 U 2 U 2 U 2 U 2 U 2 U 2 U 2 U 2 U 2 U 2 U 2 U 2 U 2 U 2 U 2 U 2 U 2 U 2 U 2 U
7,12-DIMETHYLBENZ(A)ANTHRACENE 2 U 2 U 2 U 2 U 2 U 2 U 2 U 2 U 2 U 2 U 2 U 2 U 2 U 2 U 2 U 2 U 2 U 2 U 2 U 2 U 2 U
ACETOPHENONE 0.4 U 0.4 U 0.4 U 0.4 U 0.4 U 0.4 U 0.4 U 0.4 U 0.4 U 0.4 U 0.4 U 0.4 U 0.4 U 0.4 U 0.4 U 0.4 U 0.4 U 0.4 U 0.4 U 0.4 U 0.4 U
ANILINE (PHENYLAMINE, AMINOBENZENE) 2 U 2 U 2 U 2 U 2 U 2 U 2 U 2 U 2 U 2 U 2 U 2 U 2 U 2 U 2 U 2 U 2 U 2 U 2 U 2 U 2 U
BENZYL ALCOHOL 0.4 U 0.4 U 0.4 U 0.4 U 0.4 U 0.4 U 0.4 U 0.4 U 0.4 U 0.4 U 0.4 U 0.4 U 0.4 U 0.4 U 0.4 U 0.4 U 0.4 U 0.4 U 0.4 U 0.4 U 0.4 U
BENZYL BUTYL PHTHALATE 0.4 U 0.4 U 0.4 U 0.4 U 0.4 U 0.4 U 0.4 U 0.4 U 0.4 U 0.4 U 0.4 U 0.4 U 0.4 U 0.4 U 0.4 U 0.4 U 0.4 U 0.4 U 0.4 U 0.4 U 0.4 U
BIS(2-CHLOROETHOXY) METHANE 0.4 U 0.4 U 0.4 U 0.4 U 0.4 U 0.4 U 0.4 U 0.4 U 0.4 U 0.4 U 0.4 U 0.4 U 0.4 U 0.4 U 0.4 U 0.4 U 0.4 U 0.4 U 0.4 U 0.4 U 0.4 UBIS(2-CHLOROETHYL) ETHER (2-CHLOROETHYL ETHER) 0.4 U 0.4 U 0.4 U 0.4 U 0.4 U 0.4 U 0.4 U 0.4 U 0.4 U 0.4 U 0.4 U 0.4 U 0.4 U 0.4 U 0.4 U 0.4 U 0.4 U 0.4 U 0.4 U 0.4 U 0.4 U
BIS(2-CHLOROISOPROPYL) ETHER 0.4 U 0.4 U 0.4 U 0.4 U 0.4 U 0.4 U 0.4 U 0.4 U 0.4 U 0.4 U 0.4 U 0.4 U 0.4 U 0.4 U 0.4 U 0.4 U 0.4 U 0.4 U 0.4 U 0.4 U 0.4 U
BIS(2-ETHYLHEXYL) PHTHALATE 0.67 0.4 U 0.4 U 0.4 U 0.89 0.94 0.79 0.84 1.68 0.84 0.88 0.95 0.97 1.96 19.7 2.09 1.61 1.01 2.07 1.12 1.05
DIBENZOFURAN 0.4 U 0.4 U 0.4 U 0.4 U 0.4 U 0.4 U 0.4 U 0.4 U 0.4 U 0.4 U 0.4 U 0.4 U 0.4 U 0.4 U 1.69 0.4 U 0.4 U 0.4 U 0.4 U 0.4 U 0.4 U
DIETHYL PHTHALATE 0.4 U 0.4 U 0.4 U 0.4 U 0.4 U 0.4 U 0.4 U 0.4 U 0.4 U 0.4 U 0.4 U 0.4 U 0.4 U 0.4 U 0.4 U 0.4 U 0.4 U 0.4 U 0.4 U 0.4 U 0.4 U
DIMETHYL PHTHALATE 0.4 U 0.4 U 0.4 U 0.4 U 0.4 U 0.4 U 0.4 U 0.4 U 0.4 U 0.4 U 0.4 U 0.4 U 0.4 U 0.4 U 0.4 U 0.4 U 0.4 U 0.4 U 0.4 U 0.4 U 0.4 U
DI-N-BUTYL PHTHALATE 0.4 U 0.4 U 0.4 U 0.4 U 0.4 U 0.4 U 0.4 U 0.4 U 0.4 U 0.4 U 0.4 U 0.4 U 0.4 U 0.4 U 0.4 U 0.4 U 0.4 U 0.4 U 0.4 U 0.4 U 0.4 U
DI-N-OCTYLPHTHALATE 0.4 U 0.4 U 0.4 U 0.4 U 0.4 U 0.4 U 0.4 U 0.4 U 0.4 U 0.4 U 0.4 U 0.4 U 0.4 U 0.4 U 0.4 U 0.4 U 0.4 U 0.4 U 0.4 U 0.4 U 0.4 U
DINOSEB 0.4 U 0.4 UJ 0.4 U 0.4 U 0.4 U 0.4 U 0.4 U 0.4 U 0.4 UJ 0.4 U 0.4 U 0.4 U 0.4 U 0.4 UJ 0.4 UJ 0.4 UJ 0.4 UJ 0.4 U 0.4 UJ 0.4 U 0.4 U
DIPHENYLAMINE 0.4 U 0.4 U 0.4 U 0.4 U 0.4 U 0.4 U 0.4 U 0.4 U 0.4 U 0.4 U 0.4 U 0.4 U 0.4 U 0.4 U 0.4 U 0.4 U 0.4 U 0.4 U 0.4 U 0.4 U 0.4 U
ETHYL METHANESULFONATE 0.4 U 0.4 U 0.4 U 0.4 U 0.4 U 0.4 U 0.4 U 0.4 U 0.4 U 0.4 U 0.4 U 0.4 U 0.4 U 0.4 U 0.4 U 0.4 U 0.4 U 0.4 U 0.4 U 0.4 U 0.4 U
HEXACHLOROBENZENE 0.4 U 0.4 U 0.4 U 0.4 U 0.4 U 0.4 U 0.4 U 0.4 U 0.4 U 0.4 U 0.4 U 0.4 U 0.4 U 0.4 U 0.4 U 0.4 U 0.4 U 0.4 U 0.4 U 0.4 U 0.4 U
HEXACHLOROBUTADIENE 0.4 U 0.4 U 0.4 U 0.4 U 0.4 U 0.4 U 0.4 U 0.4 U 0.4 U 0.4 U 0.4 U 0.4 U 0.4 U 0.4 U 0.4 U 0.4 U 0.4 U 0.4 U 0.4 U 0.4 U 0.4 U
HEXACHLOROCYCLOPENTADIENE 0.4 U 0.4 U 0.4 U 0.4 U 0.4 U 0.4 U 0.4 U 0.4 U 0.4 U 0.4 U 0.4 U 0.4 U 0.4 U 0.4 U 0.4 U 0.4 U 0.4 U 0.4 U 0.4 U 0.4 U 0.4 U
HEXACHLOROETHANE 0.4 U 0.4 U 0.4 U 0.4 U 0.4 U 0.4 U 0.4 U 0.4 U 0.4 U 0.4 U 0.4 U 0.4 U 0.4 U 0.4 U 0.4 U 0.4 U 0.4 U 0.4 U 0.4 U 0.4 U 0.4 U
HEXACHLOROPROPENE 0.4 U 0.4 U 0.4 U 0.4 U 0.4 U 0.4 U 0.4 U 0.4 U 0.4 U 0.4 U 0.4 U 0.4 U 0.4 U 0.4 U 0.4 U 0.4 U 0.4 U 0.4 U 0.4 U 0.4 U 0.4 U
ISOPHORONE 0.4 U 0.4 U 0.4 U 0.4 U 0.4 U 0.4 U 0.4 U 0.4 U 0.4 U 0.4 U 0.4 U 0.4 U 0.4 U 0.4 U 0.4 U 0.4 U 0.4 U 0.4 U 0.4 U 0.4 U 0.4 U
METHYL METHANESULFONATE 0.4 U 0.4 U 0.4 U 0.4 U 0.4 U 0.4 U 0.4 U 0.4 U 0.4 U 0.4 U 0.4 U 0.4 U 0.4 U 0.4 U 0.4 U 0.4 U 0.4 U 0.4 U 0.4 U 0.4 U 0.4 U
NITROBENZENE 0.4 U 0.4 U 0.4 U 0.4 U 0.4 U 0.4 U 0.4 U 0.4 U 0.4 U 0.4 U 0.4 U 0.4 U 0.4 U 0.4 U 0.4 U 0.4 U 0.4 U 0.4 U 0.4 U 0.4 U 0.4 U
N-NITROSO-DI-N-BUTYLAMINE 0.4 U 0.4 U 0.4 U 0.4 U 0.4 U 0.4 U 0.4 U 0.4 U 0.4 U 0.4 U 0.4 U 0.4 U 0.4 U 0.4 U 0.4 U 0.4 U 0.4 U 0.4 U 0.4 U 0.4 U 0.4 U
N-NITROSODI-N-PROPYLAMINE 0.4 U 0.4 U 0.4 U 0.4 U 0.4 U 0.4 U 0.4 U 0.4 U 0.4 U 0.4 U 0.4 U 0.4 U 0.4 U 0.4 U 0.4 U 0.4 U 0.4 U 0.4 U 0.4 U 0.4 U 0.4 U
N-NITROSOMORPHOLINE 0.4 U 0.4 U 0.4 U 0.4 U 0.4 U 0.4 U 0.4 U 0.4 U 0.4 U 0.4 U 0.4 U 0.4 U 0.4 U 0.4 U 0.4 U 0.4 U 0.4 U 0.4 U 0.4 U 0.4 U 0.4 U
N-NITROSOPIPERIDINE 0.4 U 0.4 U 0.4 U 0.4 U 0.4 U 0.4 U 0.4 U 0.4 U 0.4 U 0.4 U 0.4 U 0.4 U 0.4 U 0.4 U 0.4 U 0.4 U 0.4 U 0.4 U 0.4 U 0.4 U 0.4 U
N-NITROSOPYRROLIDINE 0.4 U 0.4 U 0.4 U 0.4 U 0.4 U 0.4 U 0.4 U 0.4 U 0.4 U 0.4 U 0.4 U 0.4 U 0.4 U 0.4 U 0.4 U 0.4 U 0.4 U 0.4 U 0.4 U 0.4 U 0.4 U
P-DIMETHYLAMINOAZOBENZENE 0.4 U 0.4 U 0.4 U 0.4 U 0.4 U 0.4 U 0.4 U 0.4 U 0.4 U 0.4 U 0.4 U 0.4 U 0.4 U 0.4 U 0.4 U 0.4 U 0.4 U 0.4 U 0.4 U 0.4 U 0.4 U
PENTACHLOROBENZENE 0.4 U 0.4 U 0.4 U 0.4 U 0.4 U 0.4 U 0.4 U 0.4 U 0.4 U 0.4 U 0.4 U 0.4 U 0.4 U 0.4 U 0.4 U 0.4 U 0.4 U 0.4 U 0.4 U 0.4 U 0.4 U
PENTACHLOROPHENOL 0.4 UJ 0.4 UJ 0.4 UJ 0.4 UJ 0.4 UJ 0.4 UJ 0.4 UJ 0.4 UJ 0.4 UJ 0.4 UJ 0.4 UJ 0.4 UJ 0.4 UJ 0.4 UJ 0.4 UJ 0.4 UJ 0.4 UJ 0.4 UJ 0.4 UJ 0.4 UJ 0.4 UJ
PHENACETIN 0.4 U 0.4 U 0.4 U 0.4 U 0.4 U 0.4 U 0.4 U 0.4 U 0.4 U 0.4 U 0.4 U 0.4 U 0.4 U 0.4 U 0.4 U 0.4 U 0.4 U 0.4 U 0.4 U 0.4 U 0.4 U
PHENOL 0.4 U 0.4 U 0.4 U 0.4 U 0.4 U 0.4 U 0.4 U 0.4 U 0.4 U 0.4 U 0.4 U 0.4 U 0.4 U 0.4 U 0.4 U 0.4 U 0.4 U 0.4 U 0.4 U 0.4 U 0.4 U
PRONAMIDE 0.4 U 0.4 U 0.4 U 0.4 U 0.4 U 0.4 U 0.4 U 0.4 U 0.4 U 0.4 U 0.4 U 0.4 U 0.4 U 0.4 U 0.4 U 0.4 U 0.4 U 0.4 U 0.4 U 0.4 U 0.4 U
SAFROLE 0.4 U 0.4 U 0.4 U 0.4 U 0.4 U 0.4 U 0.4 U 0.4 U 0.4 U 0.4 U 0.4 U 0.4 U 0.4 U 0.4 U 0.4 U 0.4 U 0.4 U 0.4 U 0.4 U 0.4 U 0.4 U
DMMU-2b
200013 200016 F01A21F01A42 302582
TABLE B53: Bulk SVOC data on Cleveland Harbor Upper Cuyahoga River sediments (core samples collected in April) (OEPA 2014b) (highlighting indicates that sediment sample was not collected from the channel dredging prism; yellow is outside the DMMU boundary while orange is below the dredging depth).
1 Not detected at the specified detection limit
F01A41F01W50 F01S08 302581 302578 302579 302580SVOC (mg/kg)
UPPER RIVER
DMMU-1 DMMU-2a

DMMU-1
F01A42 F01W50 F01S08 302578 302579 302580
NITROGEN, AMMONIA 230 120 190 190 220 270
PHOSPHORUS, TOTAL (AS P) 744 590 624 750 43.7 49.5
TOTAL ORGANIC CARBON (%) 2.2 1.9 1.9 2 1.5 2
TABLE B54: Bulk inorganics data on Cleveland Harbor Upper Cuyahoga River sediments (surface samples collected in August) (OEPA 2014c) (yellow highlight indicates that sediment sample was not collected from the channel dredging prism).
INORGANIC (mg/kg)
UPPER RIVER
DMMU-2a DMMU-2b

DMMU-1
F01A42 F01W50 F01S08 302578 302579 302580ALUMINUM 12,100 6,770 9,930 11,400 7,560 9,300ANTIMONY 0.8 U1 0.8 U 0.8 U 0.8 U 0.8 U 0.8 UARSENIC 20.9 15.1 15.6 17 12.9 16.1BARIUM 87 63.3 74.6 74.7 54.9 66BERYLLIUM 0.687 0.485 0.594 0.622 0.473 0.556CADMIUM 1.01 1.05 0.965 3.52 0.729 1.08CALCIUM 14,400 23,100 13,000 14,500 11,700 14,600CHROMIUM, TOTAL 21.1 22.3 19 52.5 15.4 18.6COBALT 12.3 8.23 9.3 11 8.08 9.95COPPER 36.5 35.1 32 40.4 24.4 36.7IRON 36,100 26,800 29,700 33,000 24,800 30,400LEAD 35.2 33.3 32.9 39.4 24.8 35.2MAGNESIUM 7,210 6,120 5,890 6,970 5,450 6,460MANGANESE 960 740 723 703 502 660MERCURY 0.064 0.196 0.107 0.06 0.069 0.09NICKEL 32.4 25.1 25.8 35 21.9 28POTASSIUM 2,210 800 U 1,760 1,960 800 U 1,550SELENIUM 0.8 U 0.8 U 0.8 U 0.8 U 0.8 U 0.8 USILVER 0.225 0.19 0.193 0.21 0.157 0.245SODIUM 2000 U 2000 U 2000 U 2000 U 2000 U 2000 USTRONTIUM 35 36 29 30 23 29TITANIUM 20 U 20 U 20 U 20 U 20 U 20 UVANADIUM 20 U 20 U 20 U 20 U 20 U 20 UZINC 182 187 188 260 146 179
TABLE B55: Bulk metals data on Cleveland Harbor Upper Cuyahoga River sediments (surface samples collected in August) (OEPA 2014c) (yellow highlight indicates that sediment sample was not collected from the channel dredging prism).
1 Not detected at the specified detection limit
UPPER RIVER
METAL (mg/kg) DMMU-2a DMMU-2b

200013 F01A21 F01A42 F01W50 F01S08 302578 302579 302580
AROCLOR 1016 20 U1 20 U 20 U 20 U 20 U 20 U 20 U 20 U
AROCLOR 1221 20 U 20 U 20 U 20 U 20 U 20 U 20 U 20 U
AROCLOR 1232 20 U 20 U 20 U 20 U 20 U 20 U 20 U 20 U
AROCLOR 1242 42 49.2 20 U 61.2 20 U 20 U 20 U 38.9
AROCLOR 1248 20 U 20 U 20 U 20 U 20 U 20 U 20 U 20 U
AROCLOR 1254 20 U 20 U 20 U 20 U 20 U 20 U 20 U 20 U
AROCLOR 1260 248 81.2 126 115 65.5 103 67.6 144
TOTAL PCBs 290 130.4 126 176.2 65.5 103 67.6 182.9
TOTAL ORGANIC CARBON (%) 2.2 1.9 1.9 2.0 1.5 2.0
TOC-NORMALIZED CONCENTRATION (µg/kg-TOC) 5,727 9,274 3,447 5,150 4,507 9,145
TABLE B56: Bulk PCB data on Cleveland Harbor Upper Cuyahoga River sediments (surface samples collected in August) (OEPA 2014c) (yellow highlight indicates that sediment sample was not collected from the channel dredging prism).
1 Not detected at the specified detection limit
AR0CLOR (µg/kg) DMMU-2a
UPPER RIVER
DMMU-2bDMMU-1

200013 F01A21 F01A42 F01W50 F01S08 302578 302579 302580
ALDRIN 4 U1 4 U 4 U 4 U 4 U 4 U 4 U 4 U
ALPHA BHC (ALPHA HEXACHLOROCYCLOHEXANE) 4 U 4 U 4 U 4 U 4 U 4 U 4 U 4 U
ALPHA ENDOSULFAN 4 U 4 U 4 U 4 U 4 U 4 U 4 U 4 U
BETA BHC (BETA HEXACHLOROCYCLOHEXANE) 4 U 4 U 4 U 4 U 4 U 4 U 4 U 4 U
BETA ENDOSULFAN 4 U 4 U 4 U 4 U 4 U 4 U 4 U 4 U
DELTA BHC (DELTA HEXACHLOROCYCLOHEXANE) 4 U 4 U 4 U 4 U 4 U 4 U 4 U 4 U
DIELDRIN 4 U 4 U 4 U 4 U 4 U 4 U 4 U 4 U
ENDOSULFAN SULFATE 4 U 4 U 4 U 4 U 4 U 4 U 4 U 4 U
ENDRIN 4 U 4 U 4 U 4 U 4 U 4 U 4 U 4 U
ENDRIN ALDEHYDE 4 U 4 U 4 U 4 U 4 U 4 U 4 U 4 U
GAMMA BHC (LINDANE) 4 U 4 U 4 U 4 U 4 U 4 U 4 U 4 U
HEPTACHLOR 4 U 4 U 4 U 4 U 4 U 4 U 4 U 4 U
HEPTACHLOR EPOXIDE 4 U 4 U 4 U 4 U 4 U 4 U 4 U 4 U
HEXACHLOROBENZENE 4 U 4 U 4 U 4 U 4 U 4 U 4 U 4 U
METHOXYCHLOR 4 U 4 U 4 U 4 U 4 U 4 U 4 U 4 U
MIREX 4 U 4 U 4 U 4 U 4 U 4 U 4 U 4 U
DDD (DICHLORODIPHENYLDICHLORETHANE) 4 U 4 U 4 U 4 U 4 U 4 U 4 U 4 U
DDE (DICHLORODIPHENYLDICHLORETHYLENE) 10.3 13.1 4 U 10.1 14.4 11.2 15.5 11.8DDT (DICHLORODIPHENYLTRICHLOROETHANE) 4 U 4 U 4 U 4 U 4 U 4 U 15.6 4 U
TOTAL DDT 10.3 13.1 10.1 14.4 11.2 31.1 11.8
TOTAL ORGANIC CARBON (%) 2.2 1.9 1.9 2.0 1.5 2.0TOC-NORMALIZED CONCENTRATION (µg/kg-TOC) 532 758 560 2073 590
TABLE B57: Bulk pesticides data on Cleveland Harbor Upper Cuyahoga River sediments (surface samples collected in August) (OEPA 2014c) (yellow highlight indicates that sediment sample was not collected from the channel dredging prism).
1 Not detected at the specified detection limit
UPPER RIVER
DMMU-1 DMMU-2a DMMU-2bPESTICIDE (µg/kg)

200013 F01A21 F01A42 F01W50 F01S08 302578 302579 302580
ACENAPHTHENE 0.4 U1 0.4 U 0.4 U 0.4 U 0.4 U 0.4 U 0.4 U 0.4 U
ACENAPHTHYLENE 0.4 U 0.4 U 0.4 U 0.4 U 0.4 U 0.4 U 0.4 U 0.4 U
ANTHRACENE 0.4 U 0.4 U 0.4 U 0.4 U 0.4 U 0.4 U 0.4 U 0.4 U
BENZO(A)ANTHRACENE 0.4 U 0.4 U 0.4 U 1.24 0.4 U 0.4 U 0.4 U 0.78
BENZO(A)PYRENE 0.4 U 0.4 U 0.4 U 1.38 0.7 0.79 0.7 1
BENZO(B)FLUORANTHENE 0.95 1.05 0.93 1.57 0.97 1.16 1 1.32
BENZO(G,H,I)PERYLENE 0.4 U 0.4 U 0.4 U 1.12 0.7 0.79 0.72 0.98
BENZO(K)FLUORANTHENE 0.4 U 0.4 U 0.4 U 1.22 0.4 U 0.4 U 0.4 U 0.89
CHRYSENE 0.8 0.92 0.82 1.6 0.88 1 0.83 1.14
DIBENZ(A,H)ANTHRACENE 0.4 U 0.4 U 0.4 U 0.4 U 0.4 U 0.4 U 0.4 U 0.4 U
FLUORANTHENE 1.38 1.72 1.46 3.3 1.59 1.76 1.5 1.99
FLUORENE 0.4 U 0.4 U 0.4 U 0.4 U 0.4 U 0.4 U 0.4 U 0.4 U
INDENO(1,2,3-C,D)PYRENE 0.4 U 0.4 U 0.4 U 0.95 0.4 U 0.4 U 0.4 U 0.8
NAPHTHALENE 0.4 U 0.4 U 0.4 U 0.4 U 0.4 U 0.4 U 0.4 U 0.4 U
PHENANTHRENE 0.4 U 0.4 U 0.4 U 1.62 0.4 U 0.4 U 0.64 0.81
PYRENE 1.12 1.35 1.17 2.63 1.27 1.38 1.15 1.61
TOTAL PAHs 4.25 5.04 4.38 16.63 6.11 6.88 6.54 11.32
TOTAL ORGANIC CARBON (%) 2.2 1.9 1.9 2.0 1.5 2.0
TOC-NORMALIZED CONCENTRATION (mg/kg-TOC) 199 875 322 344 436 566
TABLE B58: Bulk PAH data on Cleveland Harbor Upper Cuyahoga River sediments (surface samples collected in August) (OEPA 2014c) (yellow highlight indicates that sediment sample was not collected from the channel dredging prism).
1 Not detected at the specified detection limit
UPPER RIVER
DMMU-1 DMMU-2a DMMU-2bPAH COMPOUND (mg/kg)

200013 F01A21 F01A42 F01W50 F01S08 302578 302579 302580
1,1,1,2-TETRACHLOROETHANE 0.2 U1 0.2 U 0.04 U 0.04 U 0.04 U 0.04 U 0.04 U 0.04 U
1,1,2,2-TETRACHLOROETHANE 0.2 U 0.2 U 0.04 U 0.04 U 0.04 U 0.04 U 0.04 U 0.04 U
1,1,2-TRICHLOROETHANE 0.2 U 0.2 U 0.04 U 0.04 U 0.04 U 0.04 U 0.04 U 0.04 U
1,1-DICHLOROETHANE 0.2 U 0.2 U 0.04 U 0.04 U 0.04 U 0.04 U 0.04 U 0.04 U
1,1-DICHLOROETHENE 0.2 U 0.2 U 0.04 U 0.04 U 0.04 U 0.04 U 0.04 U 0.04 U
1,1-DICHLOROPROPENE 0.2 U 0.2 U 0.04 U 0.04 U 0.04 U 0.04 U 0.04 U 0.04 U
1,2,3-TRICHLOROBENZENE 0.2 U 0.2 U 0.04 U 0.04 U 0.04 U 0.04 U 0.04 U 0.04 U
1,2,3-TRICHLOROPROPANE 0.2 U 0.2 U 0.04 U 0.04 U 0.04 U 0.04 U 0.04 U 0.04 U
1,2,4-TRICHLOROBENZENE 0.2 U 0.2 U 0.04 U 0.04 U 0.04 U 0.04 U 0.04 U 0.04 U
1,2,4-TRIMETHYLBENZENE 0.2 U 0.2 U 0.04 U 0.04 U 0.04 U 0.04 U 0.04 U 0.04 U
1,2-DIBROMO-3-CHLOROPROPANE 0.2 U 0.2 U 0.04 U 0.04 U 0.04 U 0.04 U 0.04 U 0.04 U1,2-DIBROMOETHANE (ETHYLENE DIBROMIDE) 0.2 U 0.2 U 0.04 U 0.04 U 0.04 U 0.04 U 0.04 U 0.04 U
1,2-DICHLOROBENZENE 0.2 U 0.2 U 0.04 U 0.04 U 0.04 U 0.04 U 0.04 U 0.04 U
1,2-DICHLOROETHANE 0.2 U 0.2 U 0.04 U 0.04 U 0.04 U 0.04 U 0.04 U 0.04 U
1,2-DICHLOROPROPANE 0.2 U 0.2 U 0.04 U 0.04 U 0.04 U 0.04 U 0.04 U 0.04 U
1,3,5-TRIMETHYLBENZENE (MESITYLENE) 0.2 U 0.2 U 0.04 U 0.04 U 0.04 U 0.04 U 0.04 U 0.04 U
1,3-DICHLOROBENZENE 0.2 U 0.2 U 0.04 U 0.04 U 0.04 U 0.04 U 0.04 U 0.04 U
1,3-DICHLOROPROPANE 0.2 U 0.2 U 0.04 U 0.04 U 0.04 U 0.04 U 0.04 U 0.04 U
1,4-DICHLOROBENZENE 0.2 U 0.2 U 0.04 U 0.04 U 0.04 U 0.04 U 0.04 U 0.04 U
2,2-DICHLOROPROPANE 0.2 U 0.2 U 0.04 U 0.04 U 0.04 U 0.04 U 0.04 U 0.04 U
2-CHLOROTOLUENE 0.2 U 0.2 U 0.04 U 0.04 U 0.04 U 0.04 U 0.04 U 0.04 U
2-HEXANONE 0.2 U 0.2 U 0.04 U 0.04 U 0.04 U 0.04 U 0.04 U 0.04 U
4-CHLOROTOLUENE 0.2 U 0.2 U 0.04 U 0.04 U 0.04 U 0.04 U 0.04 U 0.04 U
ACETONE 0.2 U 0.2 U 0.096 0.05 U 0.079 0.094 0.05 U 0.071
BENZENE 0.2 U 0.2 U 0.04 U 0.04 U 0.04 U 0.04 U 0.04 U 0.04 U
BROMOBENZENE 0.2 U 0.2 U 0.04 U 0.04 U 0.04 U 0.04 U 0.04 U 0.04 U
BROMOCHLOROMETHANE 0.2 U 0.2 U 0.04 U 0.04 U 0.04 U 0.04 U 0.04 U 0.04 U
BROMODICHLOROMETHANE 0.2 U 0.2 U 0.04 U 0.04 U 0.04 U 0.04 U 0.04 U 0.04 U
BROMOFORM 0.2 U 0.2 U 0.04 U 0.04 U 0.04 U 0.04 U 0.04 U 0.04 U
BROMOMETHANE 0.2 U 0.2 U 0.04 U 0.04 U 0.04 U 0.04 U 0.04 U 0.04 U
CARBON DISULFIDE 0.2 UJ 0.2 UJ 0.04 U 0.04 U 0.04 U 0.04 U 0.04 U 0.04 U
CARBON TETRACHLORIDE 0.2 U 0.2 U 0.04 U 0.04 U 0.04 U 0.04 U 0.04 U 0.04 U
CHLOROBENZENE 0.2 U 0.2 U 0.04 U 0.04 U 0.04 U 0.04 U 0.04 U 0.04 U
CHLOROETHANE 0.2 U 0.2 U 0.04 U 0.04 U 0.04 U 0.04 U 0.04 U 0.04 U
CHLOROFORM 0.2 U 0.2 U 0.04 U 0.04 U 0.04 U 0.04 U 0.04 U 0.04 U
CHLOROMETHANE 0.2 U 0.2 U 0.04 U 0.04 U 0.04 U 0.04 U 0.04 U 0.04 U
CIS-1,2-DICHLOROETHYLENE 0.2 U 0.2 U 0.04 U 0.04 U 0.04 U 0.04 U 0.04 U 0.04 U
CIS-1,3-DICHLOROPROPENE 0.2 U 0.2 U 0.04 U 0.04 U 0.04 U 0.04 U 0.04 U 0.04 U
DIBROMOCHLOROMETHANE 0.2 U 0.2 U 0.04 U 0.04 U 0.04 U 0.04 U 0.04 U 0.04 U
DIBROMOMETHANE 0.2 U 0.2 U 0.04 U 0.04 U 0.04 U 0.04 U 0.04 U 0.04 U
DICHLORODIFLUOROMETHANE 0.2 U 0.2 U 0.04 U 0.04 U 0.04 U 0.04 U 0.04 U 0.04 U
ETHYLBENZENE 0.2 U 0.2 U 0.04 U 0.04 U 0.04 U 0.04 U 0.04 U 0.04 U
HEXACHLOROBUTADIENE 0.2 U 0.2 U 0.04 U 0.04 U 0.04 U 0.04 U 0.04 U 0.04 U
ISOPROPYLBENZENE (CUMENE) 0.2 U 0.2 U 0.04 U 0.04 U 0.04 U 0.04 U 0.04 U 0.04 U
M+P-XYLENE 0.2 U 0.2 U 0.04 U 0.04 U 0.04 U 0.04 U 0.04 U 0.04 U
METHYL ETHYL KETONE (2-BUTANONE) 0.48 0.38 0.04 U 0.04 U 0.04 U 0.04 U 0.04 U 0.04 UMETHYL ISOBUTYL KETONE (4-METHYL-2-PENTANONE) 0.2 U 0.2 U 0.04 U 0.04 U 0.04 U 0.04 U 0.04 U 0.04 U
METHYLENE CHLORIDE 0.2 U 0.2 U 0.04 U 0.04 U 0.04 U 0.04 U 0.04 U 0.04 U
NAPHTHALENE 0.2 U 0.2 U 0.04 U 0.04 U 0.04 U 0.04 U 0.04 U 0.04 U
N-BUTYLBENZENE 0.2 U 0.2 U 0.04 U 0.04 U 0.04 U 0.04 U 0.04 U 0.04 U
N-PROPYLBENZENE 0.2 U 0.2 U 0.04 U 0.04 U 0.04 U 0.04 U 0.04 U 0.04 U
O-XYLENE (1,2-DIMETHYLBENZENE) 0.2 U 0.2 U 0.04 U 0.04 U 0.04 U 0.04 U 0.04 U 0.04 U
P-CYMENE (P-ISOPROPYLTOLUENE) 0.2 U 0.2 U 0.04 U 0.04 U 0.04 U 0.04 U 0.04 U 0.04 U
SEC-BUTYLBENZENE 0.2 U 0.2 U 0.04 U 0.04 U 0.04 U 0.04 U 0.04 U 0.04 U
STYRENE 0.2 U 0.2 U 0.04 U 0.04 U 0.04 U 0.04 U 0.04 U 0.04 U
T-BUTYLBENZENE 0.2 U 0.2 U 0.04 U 0.04 U 0.04 U 0.04 U 0.04 U 0.04 U
TETRACHLOROETHYLENE(PCE) 0.2 U 0.2 U 0.04 U 0.04 U 0.04 U 0.04 U 0.04 U 0.04 U
TOLUENE 1.37 3.41 0.04 U 0.04 U 0.04 U 0.04 U 0.04 U 0.04 U
TRANS-1,2-DICHLOROETHENE 0.2 U 0.2 U 0.04 U 0.04 U 0.04 U 0.04 U 0.04 U 0.04 U
TRANS-1,3-DICHLOROPROPENE 0.2 U 0.2 U 0.04 U 0.04 U 0.04 U 0.04 U 0.04 U 0.04 U
TRICHLOROETHANE 0.2 U 0.2 U 0.04 U 0.04 U 0.04 U 0.04 U 0.04 U 0.04 U
TRICHLOROETHYLENE (TCE) 0.2 U 0.2 U 0.04 U 0.04 U 0.04 U 0.04 U 0.04 U 0.04 U
TRICHLOROFLUOROMETHANE 0.2 U 0.2 U 0.04 U 0.04 U 0.04 U 0.04 U 0.04 U 0.04 U
VINYL CHLORIDE 0.2 U 0.2 U 0.04 U 0.04 U 0.04 U 0.04 U 0.04 U 0.04 U
TABLE B59: Bulk VOC data on Cleveland Harbor Upper Cuyahoga River sediments (surface samples collected in August) (OEPA 2014c) (yellow highlight indicates that sediment sample was not collected from the channel dredging prism).
1 Not detected at the specified detection limit
UPPER RIVER
DMMU-1 DMMU-2a DMMU-2bVOC (mg/kg)

200013 F01A21 F01A42 F01S08 F01W50 302578 302579 302580
1,2,4,5-TETRACHLOROBENZENE 0.4 U1 0.4 U 0.4 U 0.4 U 0.4 U 0.4 U 0.4 U 0.4 U
1,2,4-TRICHLOROBENZENE 0.4 U 0.4 U 0.4 U 0.4 U 0.4 U 0.4 U 0.4 U 0.4 U
1,2-DICHLOROBENZENE 0.4 U 0.4 U 0.4 U 0.4 U 0.4 U 0.4 U 0.4 U 0.4 U
1,3-DICHLOROBENZENE 0.4 U 0.4 U 0.4 U 0.4 U 0.4 U 0.4 U 0.4 U 0.4 U
1,3-DINITROBENZENE 0.4 U 0.4 U 0.4 U 0.4 U 0.4 U 0.4 U 0.4 U 0.4 U
1,4-DICHLOROBENZENE 0.4 U 0.4 U 0.4 U 0.4 U 0.4 U 0.4 U 0.4 U 0.4 U
1,4-NAPHTHOQUINONE 0.4 U 0.4 U 0.4 U 0.4 U 0.4 U 0.4 U 0.4 U 0.4 U
2,3,4,6-TETRACHLOROPHENOL 0.4 U 0.4 U 0.4 U 0.4 U 0.4 U 0.4 U 0.4 U 0.4 U
2,4,5-TRICHLOROPHENOL 0.4 U 0.4 U 0.4 U 0.4 U 0.4 U 0.4 U 0.4 U 0.4 U
2,4,6-TRICHLOROPHENOL 0.4 U 0.4 U 0.4 U 0.4 U 0.4 U 0.4 U 0.4 U 0.4 U
2,4-DICHLOROPHENOL 0.4 U 0.4 U 0.4 U 0.4 U 0.4 U 0.4 U 0.4 U 0.4 U
2,4-DIMETHYLPHENOL 0.4 U 0.4 U 0.4 U 0.4 U 0.4 U 0.4 U 0.4 U 0.4 U
2,4-DINITROPHENOL 2 U 2 U 2 U 2 U 2 U 2 U 2 U 2 U
2,4-DINITROTOLUENE 0.4 U 0.4 U 0.4 U 0.4 U 0.4 U 0.4 U 0.4 U 0.4 U
2,6-DICHLOROPHENOL 0.4 U 0.4 U 0.4 U 0.4 U 0.4 U 0.4 U 0.4 U 0.4 U
2,6-DINITROTOLUENE 0.4 U 0.4 U 0.4 U 0.4 U 0.4 U 0.4 U 0.4 U 0.4 U
2-ACETYLAMINOFLUORENE 0.4 U 0.4 U 0.4 U 0.4 U 0.4 U 0.4 U 0.4 U 0.4 U
2-CHLORONAPHTHALENE 0.4 U 0.4 U 0.4 U 0.4 U 0.4 U 0.4 U 0.4 U 0.4 U
2-CHLOROPHENOL 0.4 U 0.4 U 0.4 U 0.4 U 0.4 U 0.4 U 0.4 U 0.4 U
2-METHYLNAPHTHALENE 0.4 U 0.4 U 0.4 U 0.4 U 0.4 U 0.4 U 0.4 U 0.4 U
2-METHYLPHENOL (O-CRESOL) 0.4 U 0.4 U 0.4 U 0.4 U 0.4 U 0.4 U 0.4 U 0.4 U
2-NITROANILINE 0.4 U 0.4 U 0.4 U 0.4 U 0.4 U 0.4 U 0.4 U 0.4 U
2-NITROPHENOL 0.4 U 0.4 U 0.4 U 0.4 U 0.4 U 0.4 U 0.4 U 0.4 U
2-PICOLINE (ALPHA-PICOLINE) 0.4 U 0.4 U 0.4 U 0.4 U 0.4 U 0.4 U 0.4 U 0.4 U
3,3'-DICHLOROBENZIDINE 2 U 2 U 2 U 2 U 2 U 2 U 2 U 2 U
3/4-METHYLPHENOL 0.4 U 0.4 U 0.4 U 0.4 U 0.4 U 0.4 U 0.4 U 0.4 U
3-METHYLCHOLANTHRENE 0.4 U 0.4 U 0.4 U 0.4 U 0.4 U 0.4 U 0.4 U 0.4 U
4,6-DINITRO-2-METHYLPHENOL 0.4 U 0.4 U 0.4 U 0.4 U 0.4 U 0.4 U 0.4 U 0.4 U
4-BROMOPHENYL PHENYL ETHER 0.4 U 0.4 U 0.4 U 0.4 U 0.4 U 0.4 U 0.4 U 0.4 U
4-CHLORO-3-METHYLPHENOL 0.4 U 0.4 U 0.4 U 0.4 U 0.4 U 0.4 U 0.4 U 0.4 U
4-CHLOROPHENYL PHENYL ETHER 0.4 U 0.4 U 0.4 U 0.4 U 0.4 U 0.4 U 0.4 U 0.4 U
4-NITROANILINE 0.4 U 0.4 U 0.4 U 0.4 U 0.4 U 0.4 U 0.4 U 0.4 U
4-NITROPHENOL 2 U 2 U 2 U 2 U 2 U 2 U 2 U 2 U
7,12-DIMETHYLBENZ(A)ANTHRACENE 2 U 2 U 2 U 2 U 2 U 2 U 2 U 2 U
ACETOPHENONE 0.4 U 0.4 U 0.4 U 0.4 U 0.4 U 0.4 U 0.4 U 0.4 UANILINE (PHENYLAMINE, AMINOBENZENE) 2 U 2 U 2 U 2 U 2 U 2 U 2 U 2 U
BENZYL ALCOHOL 0.4 U 0.4 U 0.4 U 0.4 U 0.4 U 0.4 U 0.4 U 0.4 U
BENZYL BUTYL PHTHALATE 0.4 U 0.4 U 0.4 U 0.4 U 0.4 U 0.4 U 0.4 U 0.4 U
BIS(2-CHLOROETHOXY) METHANE 0.4 U 0.4 U 0.4 U 0.4 U 0.4 U 0.4 U 0.4 U 0.4 UBIS(2-CHLOROETHYL) ETHER (2-CHLOROETHYL ETHER) 0.4 U 0.4 U 0.4 U 0.4 U 0.4 U 0.4 U 0.4 U 0.4 U
BIS(2-CHLOROISOPROPYL) ETHER 0.4 U 0.4 U 0.4 U 0.4 U 0.4 U 0.4 U 0.4 U 0.4 U
BIS(2-ETHYLHEXYL) PHTHALATE 0.4 U 0.4 U 0.4 U 0.4 U 0.4 U 0.89 0.4 U 0.82
DIBENZOFURAN 0.4 U 0.4 U 0.4 U 0.4 U 0.4 U 0.4 U 0.4 U 0.4 U
DIETHYL PHTHALATE 0.4 U 0.4 U 0.4 U 0.4 U 0.4 U 0.4 U 0.4 U 0.4 U
DIMETHYL PHTHALATE 0.4 U 0.4 U 0.4 U 0.4 U 0.4 U 0.4 U 0.4 U 0.4 U
DI-N-BUTYL PHTHALATE 0.4 U 0.4 U 0.4 U 0.4 U 0.4 U 0.4 U 0.4 U 0.4 U
DI-N-OCTYLPHTHALATE 0.4 U 0.4 U 0.4 U 0.4 U 0.4 U 0.4 U 0.4 U 0.4 U
DINOSEB 0.4 U 0.4 U 0.4 U 0.4 U 0.4 U 0.4 U 0.4 U 0.4 U
DIPHENYLAMINE 0.4 U 0.4 U 0.4 U 0.4 U 0.4 U 0.4 U 0.4 U 0.4 U
ETHYL METHANESULFONATE 0.4 U 0.4 U 0.4 U 0.4 U 0.4 U 0.4 U 0.4 U 0.4 U
HEXACHLOROBENZENE 0.4 U 0.4 U 0.4 U 0.4 U 0.4 U 0.4 U 0.4 U 0.4 U
HEXACHLOROBUTADIENE 0.4 U 0.4 U 0.4 U 0.4 U 0.4 U 0.4 U 0.4 U 0.4 U
HEXACHLOROCYCLOPENTADIENE 0.4 U 0.4 U 0.4 U 0.4 U 0.4 U 0.4 U 0.4 U 0.4 U
HEXACHLOROETHANE 0.4 U 0.4 U 0.4 U 0.4 U 0.4 U 0.4 U 0.4 U 0.4 U
HEXACHLOROPROPENE 0.4 U 0.4 U 0.4 U 0.4 U 0.4 U 0.4 U 0.4 U 0.4 U
ISOPHORONE 0.4 U 0.4 U 0.4 U 0.4 U 0.4 U 0.4 U 0.4 U 0.4 U
METHYL METHANESULFONATE 0.4 U 0.4 U 0.4 U 0.4 U 0.4 U 0.4 U 0.4 U 0.4 U
NITROBENZENE 0.4 U 0.4 U 0.4 U 0.4 U 0.4 U 0.4 U 0.4 U 0.4 U
N-NITROSO-DI-N-BUTYLAMINE 0.4 U 0.4 U 0.4 U 0.4 U 0.4 U 0.4 U 0.4 U 0.4 U
N-NITROSODI-N-PROPYLAMINE 0.4 U 0.4 U 0.4 U 0.4 U 0.4 U 0.4 U 0.4 U 0.4 U
N-NITROSOMORPHOLINE 0.4 U 0.4 U 0.4 U 0.4 U 0.4 U 0.4 U 0.4 U 0.4 U
N-NITROSOPIPERIDINE 0.4 U 0.4 U 0.4 U 0.4 U 0.4 U 0.4 U 0.4 U 0.4 U
N-NITROSOPYRROLIDINE 0.4 U 0.4 U 0.4 U 0.4 U 0.4 U 0.4 U 0.4 U 0.4 U
P-DIMETHYLAMINOAZOBENZENE 0.4 U 0.4 U 0.4 U 0.4 U 0.4 U 0.4 U 0.4 U 0.4 U
PENTACHLOROBENZENE 0.4 U 0.4 U 0.4 U 0.4 U 0.4 U 0.4 U 0.4 U 0.4 U
PENTACHLOROPHENOL 0.4 U 0.4 U 0.4 U 0.4 U 0.4 U 0.4 U 0.4 U 0.4 U
PHENACETIN 0.4 U 0.4 U 0.4 U 0.4 U 0.4 U 0.4 U 0.4 U 0.4 U
PHENOL 0.4 U 0.4 U 0.4 U 0.4 U 0.4 U 0.4 U 0.4 U 0.4 U
PRONAMIDE 0.4 U 0.4 U 0.4 U 0.4 U 0.4 U 0.4 U 0.4 U 0.4 U
SAFROLE 0.4 U 0.4 U 0.4 U 0.4 U 0.4 U 0.4 U 0.4 U 0.4 U
TABLE B60: Bulk SVOC data on Cleveland Harbor Upper Cuyahoga River sediments (surface samples collected in August) (OEPA 2014c) (yellow highlight indicates that sediment sample was not collected from the channel dredging prism).
1 Not detected at the specified detection limit
UPPER RIVER
DMMU-1 DMMU-2a DMMU-2bSVOC (mg/kg)
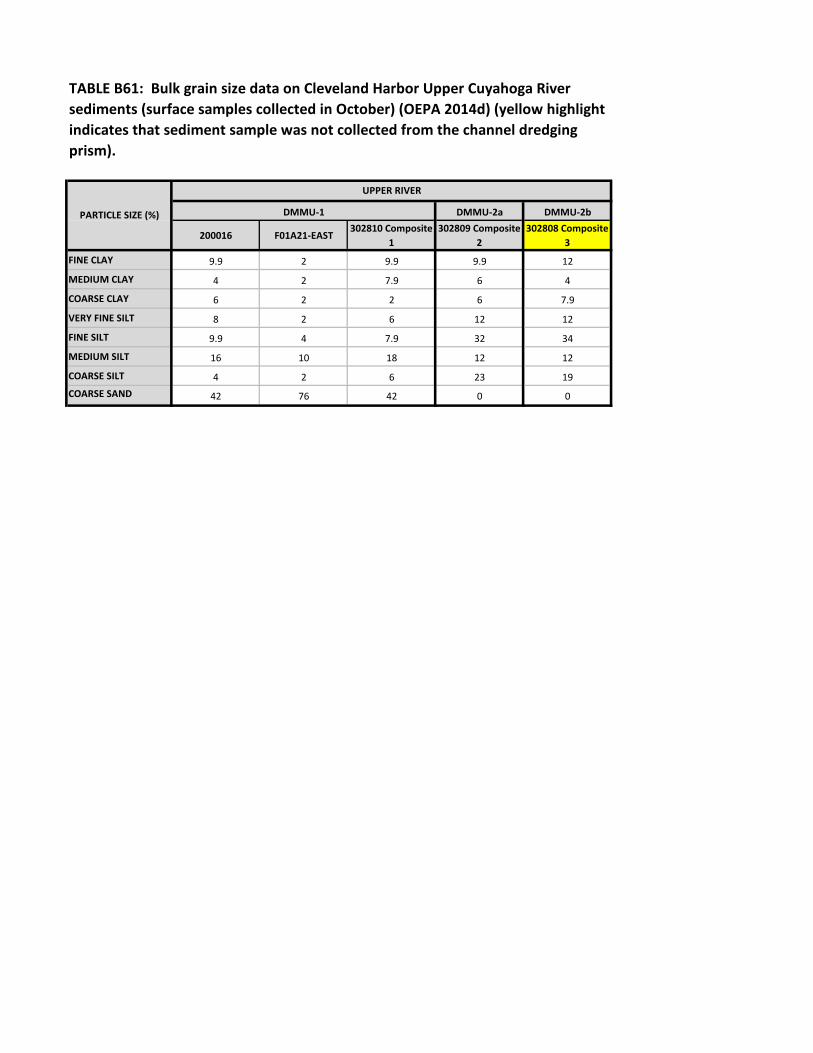
DMMU-2a DMMU-2b
200016 F01A21-EAST302810 Composite
1 302809 Composite
2302808 Composite
3
FINE CLAY 9.9 2 9.9 9.9 12
MEDIUM CLAY 4 2 7.9 6 4
COARSE CLAY 6 2 2 6 7.9
VERY FINE SILT 8 2 6 12 12
FINE SILT 9.9 4 7.9 32 34
MEDIUM SILT 16 10 18 12 12
COARSE SILT 4 2 6 23 19COARSE SAND 42 76 42 0 0
PARTICLE SIZE (%) DMMU-1
UPPER RIVER
TABLE B61: Bulk grain size data on Cleveland Harbor Upper Cuyahoga River sediments (surface samples collected in October) (OEPA 2014d) (yellow highlight indicates that sediment sample was not collected from the channel dredging prism).

200016 F01A21-EAST F01A21-WEST F01A42302810
Composite 1 F01W50 F01S08 302581
302809 Composite 2
302578 302579 302580302808
Composite 3
NITROGEN, AMMONIA 140 87 320 370 230 330 240 210 240 140 140 320 170
PHOSPHORUS, TOTAL (AS P) 637 566 1330 757 751 827 811 757 791 639 672 963 810
TOTAL ORGANIC CARBON 1.8 1.8 2.9 2.4 2.2 2.2 2.4 2.3 2.4 2.1 2 2.4 2.2
pH 7.2 7.8 7.2 7.2 7.3 7.3 7.5 7.5 7.4 7.6 7.8 7.8 7.5
TABLE B62. Bulk inorganics data on Cleveland Harbor Upper Cuyahoga River sediments (surface samples collected in October) (OEPA 2014d) (yellow highlight indicates that sediment sample was not collected from the channel dredging prism).
INORGANIC (mg/kg)
UPPER RIVER
DMMU-1 DMMU-2a DMMU-2b

200016 F01A21-EAST F01A21-WEST F01A42302810
Composite 1 F01W50 F01S08 302581
302809 Composite 2
302578 302579 302580302808
Composite 3
ALUMINUM 6,350 4,280 10,300 9,440 7,350 10,700 10,300 11,100 9,050 9,850 8,900 10,200 8,670ARSENIC 14.5 10.2 18.6 18.5 16.8 19.1 16.9 19 17.2 15.5 13.1 16.6 14.9BARIUM 49 35.2 94.9 73.4 62 79.4 76.1 76.9 72.3 70.8 61.9 78.5 68BERYLLIUM 0.392 0.333 0.668 0.552 0.487 0.632 0.652 0.64 0.575 0.595 0.582 0.618 0.565CADMIUM 0.641 0.679 2.02 0.925 0.825 1.07 1.09 1.01 0.952 1.42 0.93 1.23 1.19CALCIUM 8,920 11,800 18,800 12,300 11,700 14,800 16,000 14,700 14,600 15,200 13,700 17,000 15,200CHROMIUM, TOTAL 12.1 11.7 23 18.1 21.2 20.3 20.2 19.4 18.2 84.5 20.9 20.6 44.8COBALT 8 5.82 11.3 9.7 8.84 10.6 10.5 10.5 10.4 10.1 8.93 10.2 10.1COPPER 33.1 24.5 45.3 31.6 35.9 40.3 43.4 38.9 39.3 40.2 28.6 44 40.4IRON 24,200 16,900 33,400 30,500 28,400 33,400 32,000 33,200 31,100 30,700 26,600 32,000 29,500LEAD 42.7 22.1 39.1 33.3 30.4 41 35.4 35.6 35.1 38.5 28.1 36.7 34.1MAGNESIUM 4,390 4,680 7,180 5,890 5,360 6,680 6,730 6,850 6,400 6,630 6,050 6,840 6,490MANGANESE 609 370 947 811 802 813 729 830 753 658 552 676 630MERCURY 0.066 0.045 0.096 0.066 0.085 0.09 0.089 0.079 0.088 0.089 0.067 0.065 0.079NICKEL 22.2 27.3 35.3 26.3 26.4 28.8 31.6 29.9 29.2 28.8 25.3 30.6 29POTASSIUM 800 U1 800 U 800 U 1,580 800 U 1,830 1,760 1,970 1,410 1,590 1,560 1,850 800 USELENIUM 0.8 U 0.8 U 0.8 U 0.8 U 0.8 U 0.8 U 0.8 U 0.8 U 0.8 U 0.8 U 0.8 U 0.8 U 0.8 USODIUM 2000 U 2000 U 2000 U 2000 U 2000 U 2000 U 2000 U 2000 U 2000 U 2000 U 2000 U 2000 U 2000 USTRONTIUM 18 19 39 26 23 32 32 30 29 29 27 35 29TITANIUM 20 U 20 U 20 U 20 U 20 U 20 U 20 U 20 U 20 U 20 U 20 U 20 U 20 UVANADIUM 20 U 20 U 20 U 20 U 20 U 20 U 20 U 20 U 20 U 20 U 20 U 20 U 20 UZINC 152 143 232 174 186 195 204 188 194 330 186 213 255
TABLE B63. Bulk metals data on Cleveland Harbor Upper Cuyahoga River sediments (surface samples collected in October) (OEPA 2014d) (yellow highlight indicates that sediment sample was not collected from the channel dredging prism).
1 Not detected at the specified detection limit
METAL (mg/kg)
UPPER RIVER
DMMU-1 DMMU-2a DMMU-2b

200016 F01A21-EAST F01A21-WEST F01A42 302810 Composite 1
F01W50 302581 F01S08 302809 Composite 2
302578 302579 302580 302808 Composite 3
AROCLOR 1016 20 U1 20 U 20 U 20 U 20 U 20 U 20 U 20 U 20 U 20 U 20 U 20 U 20 U
AROCLOR 1221 20 U 20 U 20 U 20 U 20 U 20 U 20 U 20 U 20 U 20 U 20 U 20 U 20 U
AROCLOR 1232 20 U 20 U 20 U 20 U 20 U 20 U 20 U 20 U 20 U 20 U 20 U 20 U 20 U
AROCLOR 1242 41.2 64 68.3 59.2 66 65.1 71.2 78.7 69.7 65.5 44.8 47.4 74.4
AROCLOR 1248 20 U 20 U 20 U 20 U 20 U 20 U 20 U 20 U 20 U 20 U 20 U 20 U 20 U
AROCLOR 1254 20 U 20 U 20 U 20 U 20 U 20 U 20 U 20 U 20 U 20 U 20 U 20 U 20 U
AROCLOR 1260 128 42.2 86 235 158 131 165 105 123 95.8 69.6 89.6 94.4
TOTAL PCBs 169 106 154 294 224 196 236 184 193 161 114 137 169
TOTAL ORGANIC CARBON (%) 1.8 1.8 2.9 2.4 2.2 2.2 2.4 2.3 2.4 2.1 2.0 2.4 2.2TOC-NORMALIZED CONCENTRATION (µg/kg-TOC) 9,400 5,900 5,321 12,258 10,182 8,914 9,842 7,987 8,029 7,681 5,720 5,708 7,673
TABLE B64. Bulk PCB data on Cleveland Harbor Upper Cuyahoga River sediments (surface samples collected in October) (OEPA 2014d) (yellow highlight indicates that sediment sample was not collected from the channel dredging prism).
1 Not detected at the specified detection limit
AR0CLOR (µg/kg)
UPPER RIVER
DMMU-1 DMMU-2a DMMU-2b

200016 F01A21-EAST F01A21-WEST F01A42302810
Composite 1 F01W50 302581 F01S08302809
Composite 2 302578 302579 302580302808
Composite 3
ALDRIN 4 U1 4 U 4 U 4 U 4 U 4 U 4 U 4 U 4 U 4 U 4 U 4 U 4 U
ALPHA BHC (ALPHA HEXACHLOROCYCLOHEXANE) 4 U 4 U 4 U 4 U 4 U 4 U 4 U 4 U 4 U 4 U 4 U 4 U 4 U
ALPHA ENDOSULFAN 4 U 4 U 4 U 4 U 4 U 4 U 4 U 4 U 4 U 4 U 4 U 4 U 4 U
BETA BHC (BETA HEXACHLOROCYCLOHEXANE) 4 U 4 U 4 U 4 U 4 U 4 U 4 U 4 U 4 U 4 U 4 U 4 U 4 U
BETA ENDOSULFAN 4 U 4 U 4 U 4 U 4 U 4 U 4 U 4 U 4 U 4 U 4 U 4 U 4 U
DELTA BHC (DELTA HEXACHLOROCYCLOHEXANE) 4 U 4 U 4 U 4 U 4 U 4 U 4 U 4 U 4 U 4 U 4 U 4 U 4 U
DIELDRIN 4 U 4 U 4 U 4 U 4 U 4 U 4 U 4 U 4 U 4 U 4 U 4 U 4 U
ENDOSULFAN SULFATE 4 U 4 U 4 U 4 U 4 U 4 U 4 U 4 U 4 U 4 U 4 U 4 U 4 U
ENDRIN 4 U 4 U 4 U 4 U 4 U 4 U 4 U 4 U 4 U 4 U 4 U 4 U 4 U
ENDRIN ALDEHYDE 4 U 4 U 4 U 4 U 4 U 4 U 4 U 4 U 4 U 4 U 4 U 4 U 4 U
GAMMA BHC (LINDANE) 4 U 4 U 4 U 4 U 4 U 4 U 4 U 4 U 4 U 4 U 4 U 4 U 4 U
HEPTACHLOR 4 U 4 U 4 U 4 U 4 U 4 U 4 U 4 U 4 U 4 U 4 U 4 U 4 U
HEPTACHLOR EPOXIDE 4 U 4 U 4 U 4 U 4 U 4 U 4 U 4 U 4 U 4 U 4 U 4 U 4 U
HEXACHLOROBENZENE 4 U 4 U 4 U 4 U 4 U 4 U 4 U 4 U 4 U 4 U 4 U 4 U 4 U
METHOXYCHLOR 4 U 4 U 4 U 4 U 4 U 4 U 4 U 4 U 4 U 4 U 4 U 4 U 4 U
MIREX 4 U 4 U 4 U 4 U 4 U 4 U 4 U 4 U 4 U 4 U 4 U 4 U 4 U
DDD (DICHLORODIPHENYLDICHLORETHANE) 4 U 4 U 4 U 4 U 4 U 4 U 4 U 4 U 4 U 4 U 4 U 4 U 4 U
DDE (DICHLORODIPHENYLDICHLORETHYLENE) 8.2 10.2 14.6 11.5 10.2 14.4 10.7 14.5 12.1 10.3 11.9 13.5 12.5
DDT (DICHLORODIPHENYLTRICHLOROETHANE) 4 U 10.8 9.4 4 U 4 U 4 U 4 U 4 U 13.7 4 U 6.4 7.2 12.7
TOTAL DDT 8.2 21 24 11.5 10.2 14.4 25.2 10.3 14.5 18.3 20.7 10.7 25.8
TOTAL ORGANIC CARBON (%) 1.8 1.8 2.9 2.4 2.2 2.2 2.4 2.3 2.4 2.1 2.0 2.4 2.2
TOC-NORMALIZED CONCENTRATION (µg/kg-TOC) 456 1,167 828 479 464 655 1,050 448 604 871 1,035 446 1,173
TABLE B65. Bulk pesticides data on Cleveland Harbor Upper Cuyahoga River sediments (surface samples collected in October) (OEPA 2014d) (yellow highlight indicates that sediment sample was not collected from the channel dredging prism).
1 Not detected at the specified detection limit
PESTICIDE (µg/kg)
UPPER RIVER
DMMU-1 DMMU-2a DMMU-2b

200016 F01A21-EAST F01A21-WEST F01A42302810
Composite 1 F01W50 302581 F01S08
302809 Composite 2
302578 302579 302580302808
Composite 3
ACENAPHTHENE 0.4 U1 0.4 U 0.4 U 0.4 U 0.4 U 0.4 U 0.4 U 0.4 U 0.4 U 0.4 U 0.4 U 0.4 U 0.4 U
ACENAPHTHYLENE 0.4 U 0.4 U 0.4 U 0.4 U 0.4 U 0.4 U 0.4 U 0.4 U 0.4 U 0.4 U 0.4 U 0.4 U 0.4 U
ANTHRACENE 0.4 U 0.4 U 0.4 U 0.4 U 0.4 U 0.4 U 0.4 U 0.4 U 0.4 U 0.4 U 0.4 U 0.4 U 0.4 U
BENZO(A)ANTHRACENE 0.4 U 1.04 0.4 U 0.4 U 0.63 0.4 U 0.4 U 0.4 U 0.4 U 0.4 U 0.64 0.4 U 0.4 U
BENZO(A)PYRENE 0.4 U 1.12 0.83 0.75 0.84 0.4 U 0.4 U 0.4 U 0.86 0.4 U 0.81 0.72 0.74
BENZO(B)FLUORANTHENE 0.61 1.17 1 0.88 0.91 0.4 U 0.84 0.76 1 0.81 0.95 0.87 0.89
BENZO(G,H,I)PERYLENE 0.4 U 0.84 0.83 0.79 0.8 0.4 U 0.4 U 0.4 U 0.86 0.4 U 0.76 0.72 0.4 U
BENZO(K)FLUORANTHENE 0.4 U 0.93 0.4 U 0.68 0.69 0.4 U 0.4 U 0.4 U 0.4 U 0.4 U 0.69 0.4 U 0.4 U
CHRYSENE 0.64 1.19 0.92 0.88 0.86 0.4 U 0.83 0.86 0.84 0.82 0.93 0.9 0.87
DIBENZ(A,H)ANTHRACENE 0.4 U 0.4 U 0.4 U 0.4 U 0.4 U 0.4 U 0.4 U 0.4 U 0.4 U 0.4 U 0.4 U 0.4 U 0.4 U
FLUORANTHENE 1.21 2.88 1.68 1.68 1.68 1.13 1.39 1.47 1.52 1.39 1.72 1.78 1.53
FLUORENE 0.4 U 0.4 U 0.4 U 0.4 U 0.4 U 0.4 U 0.4 U 0.4 U 0.4 U 0.4 U 0.4 U 0.4 U 0.4 U
INDENO(1,2,3-C,D)PYRENE 0.4 U 0.72 0.4 U 0.4 U 0.65 0.4 U 0.4 U 0.4 U 0.4 U 0.4 U 0.64 0.4 U 0.4 U
NAPHTHALENE 0.4 U 0.4 U 0.4 U 0.4 U 0.4 U 0.4 U 0.4 U 0.4 U 0.4 U 0.4 U 0.4 U 0.4 U 0.4 U
PHENANTHRENE 0.67 1.88 0.4 U 0.9 0.83 0.4 U 0.4 U 0.4 U 0.4 U 0.4 U 0.7 0.77 0.4 U
PYRENE 0.95 2.19 1.38 1.32 1.3 0.87 1.1 1.15 1.18 1.15 1.32 1.38 1.19
Total PAHs 4.08 13.96 6.64 7.88 9.19 2.00 4.16 4.24 6.26 4.17 9.16 7.14 5.22
TOTAL ORGANIC CARBON (%) 1.8 1.8 2.9 2.4 2.2 2.2 2.4 2.3 2.4 2.1 2.0 2.4 2.2
TOC-NORMALIZED CONCENTRATION (mg/kg-TOC) 227 776 229 328 418 91 173 184 261 199 458 298 237
TABLE B66. Bulk PAH data on Cleveland Harbor Upper Cuyahoga River sediments (surface samples collected in October) (OEPA 2014d) (yellow highlight indicates that sediment sample was not collected from the channel dredging prism).
1 Not detected at the specified detection limit
PAH COMPOUND (mg/kg)
UPPER RIVER
DMMU-1 DMMU-2a DMMU-2b

200016 F01A21-EAST F01A21-WEST F01A42 302810 Composite 1
F01W50 302581 F01S08 302809 Composite 2
302578 302579 302580 302808 Composite 3
1,1,1,2-TETRACHLOROETHANE 0.2 U1 0.04 U 0.2 U 0.04 U 0.04 U 0.04 U 0.2 U 0.2 U 0.2 U 0.04 U 0.04 U 0.04 U 0.04 U
1,1,2,2-TETRACHLOROETHANE 0.2 U 0.04 U 0.2 U 0.04 U 0.04 U 0.04 U 0.2 U 0.2 U 0.2 U 0.04 U 0.04 U 0.04 U 0.04 U
1,1,2-TRICHLOROETHANE 0.2 U 0.04 U 0.2 U 0.04 U 0.04 U 0.04 U 0.2 U 0.2 U 0.2 U 0.04 U 0.04 U 0.04 U 0.04 U
1,1-DICHLOROETHANE 0.2 U 0.04 U 0.2 U 0.04 U 0.04 U 0.04 U 0.2 U 0.2 U 0.2 U 0.04 U 0.04 U 0.04 U 0.04 U
1,1-DICHLOROETHENE 0.2 U 0.04 U 0.2 U 0.04 U 0.04 U 0.04 U 0.2 U 0.2 U 0.2 U 0.04 U 0.04 U 0.04 U 0.04 UJ
1,1-DICHLOROPROPENE 0.2 U 0.04 U 0.2 U 0.04 U 0.04 U 0.04 U 0.2 U 0.2 U 0.2 U 0.04 U 0.04 U 0.04 U 0.04 U
1,2,3-TRICHLOROBENZENE 0.2 U 0.04 U 0.2 U 0.04 U 0.04 U 0.04 U 0.2 U 0.2 U 0.2 U 0.04 U 0.04 U 0.04 U 0.04 U
1,2,3-TRICHLOROPROPANE 0.2 U 0.04 U 0.2 U 0.04 U 0.04 U 0.04 U 0.2 U 0.2 U 0.2 U 0.04 U 0.04 U 0.04 U 0.04 U
1,2,4-TRICHLOROBENZENE 0.2 U 0.04 U 0.2 U 0.04 U 0.04 U 0.04 U 0.2 U 0.2 U 0.2 U 0.04 U 0.04 U 0.04 U 0.04 U
1,2,4-TRIMETHYLBENZENE 0.2 U 0.04 U 0.2 U 0.04 U 0.04 U 0.04 U 0.2 U 0.2 U 0.2 U 0.04 U 0.04 U 0.04 U 0.04 U
1,2-DIBROMO-3-CHLOROPROPANE 0.2 U 0.04 U 0.2 U 0.04 U 0.04 U 0.04 U 0.2 U 0.2 U 0.2 U 0.04 U 0.04 U 0.04 U 0.04 U1,2-DIBROMOETHANE (ETHYLENE DIBROMIDE) 0.2 U 0.04 U 0.2 U 0.04 U 0.04 U 0.04 U 0.2 U 0.2 U 0.2 U 0.04 U 0.04 U 0.04 U 0.04 U
1,2-DICHLOROBENZENE 0.2 U 0.04 U 0.2 U 0.04 U 0.04 U 0.04 U 0.2 U 0.2 U 0.2 U 0.04 U 0.04 U 0.04 U 0.04 U
1,2-DICHLOROETHANE 0.2 U 0.04 U 0.2 U 0.04 U 0.04 U 0.04 U 0.2 U 0.2 U 0.2 U 0.04 U 0.04 U 0.04 U 0.04 U
1,2-DICHLOROPROPANE 0.2 U 0.04 U 0.2 U 0.04 U 0.04 U 0.04 U 0.2 U 0.2 U 0.2 U 0.04 U 0.04 U 0.04 U 0.04 U
1,3,5-TRIMETHYLBENZENE (MESITYLENE) 0.2 U 0.04 U 0.2 U 0.04 U 0.04 U 0.04 U 0.2 U 0.2 U 0.2 U 0.04 U 0.04 U 0.04 U 0.04 U
1,3-DICHLOROBENZENE 0.2 U 0.04 U 0.2 U 0.04 U 0.04 U 0.04 U 0.2 U 0.2 U 0.2 U 0.04 U 0.04 U 0.04 U 0.04 U
1,3-DICHLOROPROPANE 0.2 U 0.04 U 0.2 U 0.04 U 0.04 U 0.04 U 0.2 U 0.2 U 0.2 U 0.04 U 0.04 U 0.04 U 0.04 U
1,4-DICHLOROBENZENE 0.2 U 0.04 U 0.2 U 0.04 U 0.04 U 0.04 U 0.2 U 0.2 U 0.2 U 0.04 U 0.04 U 0.04 U 0.04 U
2,2-DICHLOROPROPANE 0.2 U 0.04 U 0.2 U 0.04 U 0.04 U 0.04 U 0.2 U 0.2 U 0.2 U 0.04 U 0.04 U 0.04 U 0.04 U
2-CHLOROTOLUENE 0.2 U 0.04 U 0.2 U 0.04 U 0.04 U 0.04 U 0.2 U 0.2 U 0.2 U 0.04 U 0.04 U 0.04 U 0.04 U
2-HEXANONE 0.2 U 0.04 U 0.2 U 0.04 U 0.04 U 0.04 U 0.2 U 0.2 U 0.2 U 0.04 U 0.04 U 0.04 U 0.04 U
4-CHLOROTOLUENE 0.2 U 0.04 U 0.2 U 0.04 U 0.04 U 0.04 U 0.2 U 0.2 U 0.2 U 0.04 U 0.04 U 0.04 U 0.04 U
ACETONE 0.2 U 0.05 U 0.2 U 0.05 U 0.05 U 0.05 U 0.2 U 0.2 U 0.2 U 0.106 0.075 0.175 0.119
BENZENE 0.2 U 0.04 U 0.2 U 0.04 U 0.04 U 0.04 U 0.2 U 0.2 U 0.2 U 0.04 U 0.04 U 0.04 U 0.04 U
BROMOBENZENE 0.2 U 0.04 U 0.2 U 0.04 U 0.04 U 0.04 U 0.2 U 0.2 U 0.2 U 0.04 U 0.04 U 0.04 U 0.04 U
BROMOCHLOROMETHANE 0.2 U 0.04 U 0.2 U 0.04 U 0.04 U 0.04 U 0.2 U 0.2 U 0.2 U 0.04 U 0.04 U 0.04 U 0.04 U
BROMODICHLOROMETHANE 0.2 U 0.04 U 0.2 U 0.04 U 0.04 U 0.04 U 0.2 U 0.2 U 0.2 U 0.04 U 0.04 U 0.04 U 0.04 U
BROMOFORM 0.2 U 0.04 U 0.2 U 0.04 U 0.04 U 0.04 U 0.2 U 0.2 U 0.2 U 0.04 U 0.04 U 0.04 U 0.04 U
BROMOMETHANE 0.2 U 0.04 U 0.2 U 0.04 U 0.04 U 0.04 U 0.2 U 0.2 U 0.2 U 0.04 U 0.04 U 0.04 U 0.04 U
CARBON DISULFIDE 0.2 U 0.04 U 0.2 U 0.04 U 0.04 U 0.04 U 0.2 U 0.2 U 0.2 U 0.04 U 0.04 U 0.04 U 0.04 U
CARBON TETRACHLORIDE 0.2 U 0.04 U 0.2 U 0.04 U 0.04 U 0.04 U 0.2 U 0.2 U 0.2 U 0.04 U 0.04 U 0.04 U 0.04 U
CHLOROBENZENE 0.2 U 0.04 U 0.2 U 0.04 U 0.04 U 0.04 U 0.2 U 0.2 U 0.2 U 0.04 U 0.04 U 0.04 U 0.04 U
CHLOROETHANE 0.2 U 0.04 U 0.2 U 0.04 U 0.04 U 0.04 U 0.2 U 0.2 U 0.2 U 0.04 U 0.04 U 0.04 U 0.04 U
CHLOROFORM 0.2 U 0.04 U 0.2 U 0.04 U 0.04 U 0.04 U 0.2 U 0.2 U 0.2 U 0.04 U 0.04 U 0.04 U 0.04 U
CHLOROMETHANE 0.39 0.04 U 0.66 0.04 U 0.04 U 0.04 U 0.42 0.63 0.74 0.04 U 0.04 U 0.04 U 0.04 U
CIS-1,2-DICHLOROETHYLENE 0.2 U 0.04 U 0.2 U 0.04 U 0.04 U 0.04 U 0.2 U 0.2 U 0.2 U 0.04 U 0.04 U 0.04 U 0.04 U
CIS-1,3-DICHLOROPROPENE 0.2 U 0.04 U 0.2 U 0.04 U 0.04 U 0.04 U 0.2 U 0.2 U 0.2 U 0.04 U 0.04 U 0.04 U 0.04 U
DIBROMOCHLOROMETHANE 0.2 U 0.04 U 0.2 U 0.04 U 0.04 U 0.04 U 0.2 U 0.2 U 0.2 U 0.04 U 0.04 U 0.04 U 0.04 U
DIBROMOMETHANE 0.2 U 0.04 U 0.2 U 0.04 U 0.04 U 0.04 U 0.2 U 0.2 U 0.2 U 0.04 U 0.04 U 0.04 U 0.04 U
DICHLORODIFLUOROMETHANE 0.2 U 0.04 U 0.2 U 0.04 U 0.04 U 0.04 U 0.2 U 0.2 U 0.2 U 0.04 U 0.04 U 0.04 U 0.04 U
ETHYLBENZENE 0.2 U 0.04 U 0.2 U 0.04 U 0.04 U 0.04 U 0.2 U 0.2 U 0.2 U 0.04 U 0.04 U 0.04 U 0.04 U
HEXACHLOROBUTADIENE 0.2 U 0.04 U 0.2 U 0.04 U 0.04 U 0.04 U 0.2 U 0.2 U 0.2 U 0.04 U 0.04 U 0.04 U 0.04 U
ISOPROPYLBENZENE (CUMENE) 0.2 U 0.04 U 0.2 U 0.04 U 0.04 U 0.04 U 0.2 U 0.2 U 0.2 U 0.04 U 0.04 U 0.04 U 0.04 U
M+P-XYLENE 0.2 U 0.04 U 0.2 U 0.04 U 0.04 U 0.04 U 0.2 U 0.2 U 0.2 U 0.04 U 0.04 U 0.04 U 0.04 U
METHYL ETHYL KETONE (2-BUTANONE) 0.2 U 0.04 U 0.2 U 0.04 U 0.04 U 0.04 U 0.2 U 0.2 U 0.2 U 0.04 U 0.04 U 0.04 U 0.04 UMETHYL ISOBUTYL KETONE (4-METHYL-2-PENTANONE) 0.2 U 0.04 U 0.2 U 0.04 U 0.04 U 0.04 U 0.2 U 0.2 U 0.2 U 0.04 U 0.04 U 0.04 U 0.04 U
METHYLENE CHLORIDE 0.2 U 0.04 U 0.2 U 0.04 U 0.04 U 0.04 U 0.2 U 0.2 U 0.2 U 0.04 U 0.04 U 0.04 U 0.04 U
NAPHTHALENE 0.2 U 0.04 U 0.2 U 0.04 U 0.04 U 0.04 U 0.2 U 0.2 U 0.2 U 0.04 U 0.04 U 0.04 U 0.04 U
N-BUTYLBENZENE 0.2 U 0.04 U 0.2 U 0.04 U 0.04 U 0.04 U 0.2 U 0.2 U 0.2 U 0.04 U 0.04 U 0.04 U 0.04 U
N-PROPYLBENZENE 0.2 U 0.04 U 0.2 U 0.04 U 0.04 U 0.04 U 0.2 U 0.2 U 0.2 U 0.04 U 0.04 U 0.04 U 0.04 U
O-XYLENE (1,2-DIMETHYLBENZENE) 0.2 U 0.04 U 0.2 U 0.04 U 0.04 U 0.04 U 0.2 U 0.2 U 0.2 U 0.04 U 0.04 U 0.04 U 0.04 U
P-CYMENE (P-ISOPROPYLTOLUENE) 0.2 U 0.04 U 0.2 U 0.04 U 0.04 U 0.04 U 0.2 U 0.2 U 0.2 U 0.04 U 0.04 U 0.04 U 0.04 U
SEC-BUTYLBENZENE 0.2 U 0.04 U 0.2 U 0.04 U 0.04 U 0.04 U 0.2 U 0.2 U 0.2 U 0.04 U 0.04 U 0.04 U 0.04 U
STYRENE 0.2 U 0.04 U 0.2 U 0.04 U 0.04 U 0.04 U 0.2 U 0.2 U 0.2 U 0.04 U 0.04 U 0.04 U 0.04 U
T-BUTYLBENZENE 0.2 U 0.04 U 0.2 U 0.04 U 0.04 U 0.04 U 0.2 U 0.2 U 0.2 U 0.04 U 0.04 U 0.04 U 0.04 U
TETRACHLOROETHYLENE(PCE) 0.2 U 0.04 U 0.2 U 0.04 U 0.04 U 0.04 U 0.2 U 0.2 U 0.2 U 0.04 U 0.04 U 0.04 U 0.04 U
TOLUENE 0.55 0.04 U 0.92 0.069 0.133 0.04 U 0.93 1 0.86 0.04 U 0.04 U 0.04 U 0.04 U
TRANS-1,2-DICHLOROETHENE 0.2 U 0.04 U 0.2 U 0.04 U 0.04 U 0.04 U 0.2 U 0.2 U 0.2 U 0.04 U 0.04 U 0.04 U 0.04 U
TRANS-1,3-DICHLOROPROPENE 0.2 U 0.04 U 0.2 U 0.04 U 0.04 U 0.04 U 0.2 U 0.2 U 0.2 U 0.04 U 0.04 U 0.04 U 0.04 U
TRICHLOROETHANE 0.2 U 0.04 U 0.2 U 0.04 U 0.04 U 0.04 U 0.2 U 0.2 U 0.2 U 0.04 U 0.04 U 0.04 U 0.04 U
TRICHLOROETHYLENE (TCE) 0.2 U 0.04 U 0.2 U 0.04 U 0.04 U 0.04 U 0.2 U 0.2 U 0.2 U 0.04 U 0.04 U 0.04 U 0.04 U
TRICHLOROFLUOROMETHANE 0.2 U 0.04 U 0.2 U 0.04 U 0.04 U 0.04 U 0.2 U 0.2 U 0.2 U 0.04 U 0.04 U 0.04 U 0.04 U
VINYL CHLORIDE 0.2 U 0.04 U 0.2 U 0.04 U 0.04 U 0.04 U 0.2 U 0.2 U 0.2 U 0.04 U 0.04 U 0.04 U 0.04 U
TABLE B67. Bulk VOC data on Cleveland Harbor Upper Cuyahoga River sediments (surface samples collected in October) (OEPA 2014d) (yellow highlight indicates that sediment sample was not collected from the channel dredging prism).
1 Not detected at the specified detection limit
VOC (mg/kg)
UPPER RIVER
DMMU-1 DMMU-2a DMMU-2b

200016 F01A21-EAST F01A21-WEST F01A42 302810 Composite 1
F01S08 302581 F01W50 302809 Composite 2
302578 302579 302580 302808 Composite 3
1,2,4,5-TETRACHLOROBENZENE 0.4 U1 0.4 U 0.4 U 0.4 U 0.4 U 0.4 U 0.4 U 0.4 U 0.4 U 0.4 U 0.4 U 0.4 U 0.4 U
1,2,4-TRICHLOROBENZENE 0.4 U 0.4 U 0.4 U 0.4 U 0.4 U 0.4 U 0.4 U 0.4 U 0.4 U 0.4 U 0.4 U 0.4 U 0.4 U
1,2-DICHLOROBENZENE 0.4 U 0.4 U 0.4 U 0.4 U 0.4 U 0.4 U 0.4 U 0.4 U 0.4 U 0.4 U 0.4 U 0.4 U 0.4 U
1,3-DICHLOROBENZENE 0.4 U 0.4 U 0.4 U 0.4 U 0.4 U 0.4 U 0.4 U 0.4 U 0.4 U 0.4 U 0.4 U 0.4 U 0.4 U
1,3-DINITROBENZENE 0.4 U 0.4 U 0.4 U 0.4 U 0.4 U 0.4 U 0.4 U 0.4 U 0.4 U 0.4 U 0.4 U 0.4 U 0.4 U
1,4-DICHLOROBENZENE 0.4 U 0.4 U 0.4 U 0.4 U 0.4 U 0.4 U 0.4 U 0.4 U 0.4 U 0.4 U 0.4 U 0.4 U 0.4 U
1,4-NAPHTHOQUINONE 0.4 U 0.4 U 0.4 U 0.4 U 0.4 U 0.4 U 0.4 U 0.4 U 0.4 U 0.4 U 0.4 U 0.4 U 0.4 U
2,3,4,6-TETRACHLOROPHENOL 0.4 U 0.4 U 0.4 U 0.4 U 0.4 U 0.4 U 0.4 U 0.4 U 0.4 U 0.4 U 0.4 U 0.4 U 0.4 U
2,4,5-TRICHLOROPHENOL 0.4 U 0.4 U 0.4 U 0.4 U 0.4 U 0.4 U 0.4 U 0.4 U 0.4 U 0.4 U 0.4 U 0.4 U 0.4 U
2,4,6-TRICHLOROPHENOL 0.4 U 0.4 U 0.4 U 0.4 U 0.4 U 0.4 U 0.4 U 0.4 U 0.4 U 0.4 U 0.4 U 0.4 U 0.4 U
2,4-DICHLOROPHENOL 0.4 U 0.4 U 0.4 U 0.4 U 0.4 U 0.4 U 0.4 U 0.4 U 0.4 U 0.4 U 0.4 U 0.4 U 0.4 U
2,4-DIMETHYLPHENOL 0.4 U 0.4 U 0.4 U 0.4 U 0.4 U 0.4 U 0.4 U 0.4 U 0.4 U 0.4 U 0.4 U 0.4 U 0.4 U
2,4-DINITROPHENOL 2 U 2 U 2 U 2 U 2 U 2 U 2 U 2 U 2 U 2 U 2 U 2 U 2 U
2,4-DINITROTOLUENE 0.4 U 0.4 U 0.4 U 0.4 U 0.4 U 0.4 U 0.4 U 0.4 U 0.4 U 0.4 U 0.4 U 0.4 U 0.4 U
2,6-DICHLOROPHENOL 0.4 U 0.4 U 0.4 U 0.4 U 0.4 U 0.4 U 0.4 U 0.4 U 0.4 U 0.4 U 0.4 U 0.4 U 0.4 U
2,6-DINITROTOLUENE 0.4 U 0.4 U 0.4 U 0.4 U 0.4 U 0.4 U 0.4 U 0.4 U 0.4 U 0.4 U 0.4 U 0.4 U 0.4 U
2-ACETYLAMINOFLUORENE 0.4 U 0.4 U 0.4 U 0.4 U 0.4 U 0.4 U 0.4 U 0.4 U 0.4 U 0.4 U 0.4 U 0.4 U 0.4 U
2-CHLORONAPHTHALENE 0.4 U 0.4 U 0.4 U 0.4 U 0.4 U 0.4 U 0.4 U 0.4 U 0.4 U 0.4 U 0.4 U 0.4 U 0.4 U
2-CHLOROPHENOL 0.4 U 0.4 U 0.4 U 0.4 U 0.4 U 0.4 U 0.4 U 0.4 U 0.4 UJ 0.4 U 0.4 U 0.4 U 0.4 U
2-METHYLNAPHTHALENE 0.4 U 0.4 U 0.4 U 0.4 U 0.4 U 0.4 U 0.4 U 0.4 U 0.4 U 0.4 U 0.4 U 0.4 U 0.4 U
2-METHYLPHENOL (O-CRESOL) 0.4 U 0.4 U 0.4 U 0.4 U 0.4 U 0.4 U 0.4 U 0.4 U 0.4 U 0.4 U 0.4 U 0.4 U 0.4 U
2-NITROANILINE 0.4 U 0.4 U 0.4 U 0.4 U 0.4 U 0.4 U 0.4 U 0.4 U 0.4 U 0.4 U 0.4 U 0.4 U 0.4 U
2-NITROPHENOL 0.4 U 0.4 U 0.4 U 0.4 U 0.4 U 0.4 U 0.4 U 0.4 U 0.4 U 0.4 U 0.4 U 0.4 U 0.4 U
2-PICOLINE (ALPHA-PICOLINE) 0.4 U 0.4 U 0.4 U 0.4 U 0.4 U 0.4 U 0.4 U 0.4 U 0.4 U 0.4 U 0.4 U 0.4 U 0.4 U
3,3'-DICHLOROBENZIDINE 2 U 2 U 2 U 2 U 2 U 2 U 2 U 2 U 2 U 2 U 2 U 2 U 2 U
3/4-METHYLPHENOL 0.4 U 0.4 U 5.68 0.4 U 0.65 0.93 0.84 0.4 U 0.4 U 0.4 U 0.4 U 0.4 U 0.4 U
3-METHYLCHOLANTHRENE 0.4 U 0.4 U 0.4 U 0.4 U 0.4 U 0.4 U 0.4 U 0.4 U 0.4 U 0.4 U 0.4 U 0.4 U 0.4 U
4,6-DINITRO-2-METHYLPHENOL 0.4 UJ 0.4 U 0.4 U 0.4 U 0.4 U 0.4 U 0.4 UJ 0.4 U 0.4 U 0.4 UJ 0.4 UJ 0.4 UJ 0.4 UJ
4-BROMOPHENYL PHENYL ETHER 0.4 U 0.4 U 0.4 U 0.4 U 0.4 U 0.4 U 0.4 U 0.4 U 0.4 U 0.4 U 0.4 U 0.4 U 0.4 U
4-CHLORO-3-METHYLPHENOL 0.4 U 0.4 U 0.4 U 0.4 U 0.4 U 0.4 U 0.4 U 0.4 U 0.4 UJ 0.4 U 0.4 U 0.4 U 0.4 U
4-CHLOROPHENYL PHENYL ETHER 0.4 U 0.4 U 0.4 U 0.4 U 0.4 U 0.4 U 0.4 U 0.4 U 0.4 U 0.4 U 0.4 U 0.4 U 0.4 U
4-NITROANILINE 0.4 U 0.4 U 0.4 U 0.4 U 0.4 U 0.4 U 0.4 U 0.4 U 0.4 U 0.4 U 0.4 U 0.4 U 0.4 U
4-NITROPHENOL 2 U 2 U 2 U 2 U 2 U 2 U 2 U 2 U 2 U 2 U 2 U 2 U 2 U
7,12-DIMETHYLBENZ(A)ANTHRACENE 2 U 2 U 2 U 2 U 2 U 2 U 2 U 2 U 2 U 2 U 2 U 2 U 2 U
ACETOPHENONE 0.4 U 0.4 U 0.4 U 0.4 U 0.4 U 0.4 U 0.4 U 0.4 U 0.4 U 0.4 U 0.4 U 0.4 U 0.4 UANILINE (PHENYLAMINE, AMINOBENZENE) 2 U 2 U 2 U 2 U 2 U 2 U 2 U 2 U 2 U 2 U 2 U 2 U 2 U
BENZYL ALCOHOL 0.4 U 0.4 U 0.4 U 0.4 U 0.4 U 0.4 U 0.4 U 0.4 U 0.4 U 0.4 U 0.4 U 0.4 U 0.4 U
BENZYL BUTYL PHTHALATE 0.4 U 0.4 U 0.4 U 0.4 U 0.4 U 0.4 U 0.4 U 0.4 U 0.4 U 0.4 U 0.4 U 0.4 U 0.4 U
BIS(2-CHLOROETHOXY) METHANE 0.4 U 0.4 U 0.4 U 0.4 U 0.4 U 0.4 U 0.4 U 0.4 U 0.4 U 0.4 U 0.4 U 0.4 U 0.4 UBIS(2-CHLOROETHYL) ETHER (2-CHLOROETHYL ETHER) 0.4 U 0.4 U 0.4 U 0.4 U 0.4 U 0.4 U 0.4 U 0.4 U 0.4 U 0.4 U 0.4 U 0.4 U 0.4 U
BIS(2-CHLOROISOPROPYL) ETHER 0.4 U 0.4 U 0.4 U 0.4 U 0.4 U 0.4 U 0.4 U 0.4 U 0.4 U 0.4 U 0.4 U 0.4 U 0.4 U
BIS(2-ETHYLHEXYL) PHTHALATE 0.4 U 0.4 U 0.4 U 0.4 U 0.4 U 0.75 0.4 U 0.4 U 0.4 U 0.77 0.4 U 0.75 0.4 U
DIBENZOFURAN 0.4 U 0.4 U 0.4 U 0.4 U 0.4 U 0.4 U 0.4 U 0.4 U 0.4 U 0.4 U 0.4 U 0.4 U 0.4 U
DIETHYL PHTHALATE 0.4 U 0.4 U 0.4 U 0.4 U 0.4 U 0.4 U 0.4 U 0.4 U 0.4 U 0.4 U 0.4 U 0.4 U 0.4 U
DIMETHYL PHTHALATE 0.4 U 0.4 U 0.4 U 0.4 U 0.4 U 0.4 U 0.4 U 0.4 U 0.4 U 0.4 U 0.4 U 0.4 U 0.4 U
DI-N-BUTYL PHTHALATE 0.4 U 0.4 U 0.4 U 0.4 U 0.4 U 0.4 U 0.4 U 0.4 U 0.4 U 0.4 U 0.4 U 0.4 U 0.4 U
DI-N-OCTYLPHTHALATE 0.4 U 0.4 U 0.4 U 0.4 U 0.4 U 0.4 U 0.4 U 0.4 U 0.4 U 0.4 U 0.4 U 0.4 U 0.4 U
DINOSEB 0.4 U 0.4 U 0.4 U 0.4 U 0.4 U 0.4 U 0.4 U 0.4 U 0.4 U 0.4 U 0.4 U 0.4 U 0.4 U
DIPHENYLAMINE 0.4 U 0.4 U 0.4 U 0.4 U 0.4 U 0.4 U 0.4 U 0.4 U 0.4 U 0.4 U 0.4 U 0.4 U 0.4 U
ETHYL METHANESULFONATE 0.4 U 0.4 U 0.4 U 0.4 U 0.4 U 0.4 U 0.4 U 0.4 U 0.4 U 0.4 U 0.4 U 0.4 U 0.4 U
HEXACHLOROBENZENE 0.4 U 0.4 U 0.4 U 0.4 U 0.4 U 0.4 U 0.4 U 0.4 U 0.4 U 0.4 U 0.4 U 0.4 U 0.4 U
HEXACHLOROBUTADIENE 0.4 U 0.4 U 0.4 U 0.4 U 0.4 U 0.4 U 0.4 U 0.4 U 0.4 U 0.4 U 0.4 U 0.4 U 0.4 U
HEXACHLOROCYCLOPENTADIENE 0.4 U 0.4 U 0.4 U 0.4 U 0.4 U 0.4 U 0.4 U 0.4 U 0.4 U 0.4 U 0.4 U 0.4 U 0.4 U
HEXACHLOROETHANE 0.4 U 0.4 U 0.4 U 0.4 U 0.4 U 0.4 U 0.4 U 0.4 U 0.4 U 0.4 U 0.4 U 0.4 U 0.4 U
HEXACHLOROPROPENE 0.4 U 0.4 U 0.4 U 0.4 U 0.4 U 0.4 U 0.4 U 0.4 U 0.4 U 0.4 U 0.4 U 0.4 U 0.4 U
ISOPHORONE 0.4 U 0.4 U 0.4 U 0.4 U 0.4 U 0.4 U 0.4 U 0.4 U 0.4 U 0.4 U 0.4 U 0.4 U 0.4 U
METHYL METHANESULFONATE 0.4 U 0.4 U 0.4 U 0.4 U 0.4 U 0.4 U 0.4 U 0.4 U 0.4 U 0.4 U 0.4 U 0.4 U 0.4 U
NITROBENZENE 0.4 U 0.4 U 0.4 U 0.4 U 0.4 U 0.4 U 0.4 U 0.4 U 0.4 U 0.4 U 0.4 U 0.4 U 0.4 U
N-NITROSO-DI-N-BUTYLAMINE 0.4 U 0.4 U 0.4 U 0.4 U 0.4 U 0.4 U 0.4 U 0.4 U 0.4 U 0.4 U 0.4 U 0.4 U 0.4 U
N-NITROSODI-N-PROPYLAMINE 0.4 U 0.4 U 0.4 U 0.4 U 0.4 U 0.4 U 0.4 U 0.4 U 0.4 U 0.4 U 0.4 U 0.4 U 0.4 U
N-NITROSOMORPHOLINE 0.4 U 0.4 U 0.4 U 0.4 U 0.4 U 0.4 U 0.4 U 0.4 U 0.4 U 0.4 U 0.4 U 0.4 U 0.4 U
N-NITROSOPIPERIDINE 0.4 U 0.4 U 0.4 U 0.4 U 0.4 U 0.4 U 0.4 U 0.4 U 0.4 U 0.4 U 0.4 U 0.4 U 0.4 U
N-NITROSOPYRROLIDINE 0.4 U 0.4 U 0.4 U 0.4 U 0.4 U 0.4 U 0.4 U 0.4 U 0.4 U 0.4 U 0.4 U 0.4 U 0.4 U
P-DIMETHYLAMINOAZOBENZENE 0.4 U 0.4 U 0.4 U 0.4 U 0.4 U 0.4 U 0.4 U 0.4 U 0.4 U 0.4 U 0.4 U 0.4 U 0.4 U
PENTACHLOROBENZENE 0.4 U 0.4 U 0.4 U 0.4 U 0.4 U 0.4 U 0.4 U 0.4 U 0.4 U 0.4 U 0.4 U 0.4 U 0.4 U
PENTACHLOROPHENOL 0.4 U 0.4 U 0.4 U 0.4 U 0.4 U 0.4 U 0.4 U 0.4 U 0.4 U 0.4 U 0.4 U 0.4 U 0.4 U
PHENACETIN 0.4 U 0.4 U 0.4 U 0.4 U 0.4 U 0.4 U 0.4 U 0.4 U 0.4 U 0.4 U 0.4 U 0.4 U 0.4 U
PHENOL 0.4 U 0.4 U 0.4 U 0.4 U 0.4 U 0.4 U 0.4 U 0.4 U 0.4 UJ 0.4 U 0.4 U 0.4 U 0.4 U
PRONAMIDE 0.4 U 0.4 U 0.4 U 0.4 U 0.4 U 0.4 U 0.4 U 0.4 U 0.4 U 0.4 U 0.4 U 0.4 U 0.4 U
SAFROLE 0.4 U 0.4 U 0.4 U 0.4 U 0.4 U 0.4 U 0.4 U 0.4 U 0.4 U 0.4 U 0.4 U 0.4 U 0.4 U
TABLE B68. Bulk SVOC data on Cleveland Harbor Upper Cuyahoga River sediments (surface samples collected in October) (OEPA 2014d) (yellow highlight indicates that sediment sample was not collected from the channel dredging prism).
1 Not detected at the specified detection limit
SVOC (mg/kg)
UPPER RIVER
DMMU-1 DMMU-2a DMMU-2b

F01A21 200013 F01W50 302581 302580 302578
FINE CLAY 8 6.1 12 12 12 12
MEDIUM CLAY 2 2 6.1 8.1 4 6
COARSE CLAY 2 4 4 4 6.1 4
VERY FINE SILT 4 2 6.1 8.1 8.1 12
FINE SILT 6 6.1 28 32 34 38
MEDIUM SILT 14 12 10 14 14 14
COARSE SILT 4 4 33 21 21 13
SILT/CLAY 40 36.2 99.2 99.2 99.2 99COARSE SAND 60 64 0 0 0 0
TABLE B69: Bulk grain size data on Cleveland Harbor Upper Cuyahoga River sediments (surface and core composite samples collected in April) (OEPA 2015b) (yellow highlight indicates that sediment sample was not collected from the channel dredging prism).
UPPER RIVER
DMMU-1 DMMU-2a DMMU-2bPARTICLE SIZE (%)

F01A21 200013 F01W50 302581 302580 302578
NITROGEN, AMMONIA 100 130 210 170 190 610
PHOSPHORUS, TOTAL (AS P) 658 616 865 796 844 867
TOTAL ORGANIC CARBON (%) 2.2 2.2 2.5 1.7 1.8 2.3
pH (SU) 7.4 7.3 7.4 7.6 7.6 7.5
TABLE B70: Bulk inorganics data on Cleveland Harbor Upper Cuyahoga River sediments (surface and core composite samples collected in April) (OEPA 2015b) (yellow highlight indicates that sediment sample was not collected from the channel dredging prism).
INORGANIC (mg/kg)
UPPER RIVER
DMMU-1 DMMU-2a DMMU-2b

F01A21 200013 F01W50 302581 302580 302578
ALUMINUM 4,660 4,830 7,850 7,710 7,420 9,110
ARSENIC 9.48 9.92 13.9 13.9 13.4 15.5
BARIUM 44.8 41.5 65.8 63.5 62.3 76.6
BERYLLIUM 0.281 0.291 0.447 0.419 0.379 0.472
CADMIUM 0.551 0.562 0.718 0.626 0.729 1.33
CALCIUM 6,550 7,140 9,910 9,820 9,800 11,400
CHROMIUM, TOTAL 9.79 10.1 15.1 13.6 13.9 26.3
COBALT 5.55 5.67 7.87 7.97 7.63 9.21
COPPER 19.5 21 26.6 23.3 25.4 33.1
IRON 16,200 16,300 24,000 24,100 23,600 27,800
LEAD 20.5 21.1 27.3 24.4 28.6 53.9
MAGNESIUM 2,930 2,960 4,630 4,750 4,610 5,470
MANGANESE 390 367 563 548 509 589
MERCURY 0.049 0.032 0.094 0.068 0.08 0.087
NICKEL 14.1 15.8 21 20.4 20.4 24.9
POTASSIUM 800 U1 800 U 800 U 800 U 800 U 1340
SELENIUM 0.8 U 0.8 U 0.8 U 0.8 U 0.8 U 0.8 U
SODIUM 2000 U 2000 U 2000 U 2000 U 2000 U 2000 U
STRONTIUM 12 U 19 24 23 23 27
TITANIUM 20 U 20 U 20 U 20 U 20 U 20 U
VANADIUM 20 U 20 U 20 U 20 U 20 U 20 U
ZINC 105 111 146 131 141 222
TABLE B71: Bulk metals data on Cleveland Harbor Upper Cuyahoga River sediments (surface and core composite samples collected in April) (OEPA 2015b) (yellow highlight indicates that sediment sample was not collected from the channel dredging prism).
1 Not detected at the specified detection limit
METALS (mg/kg)
UPPER RIVER
DMMU-1 DMMU-2a DMMU-2b

F01A21 200013 F01W50 302581 302578 302580
AROCLOR 1016 29.7 U1 29 U 33.1 U 32.3 U 33.8 U 32.3 U
AROCLOR 1221 29.7 U 29 U 33.1 U 32.3 U 33.8 U 32.3 U
AROCLOR 1232 29.7 U 29 U 33.1 U 32.3 U 33.8 U 32.3 U
AROCLOR 1242 54.3 36 33.1 U 32.3 U 33.8 U 32.3 U
AROCLOR 1248 29.7 U 29 U 33.1 U 32.3 U 33.8 U 32.3 U
AROCLOR 1254 29.7 U 409 33.1 U 32.3 U 33.8 U 32.3 UAROCLOR 1260 63 142 130 139 151 116
TOTAL PCBs 117 587 130 139 151 116
TOC (%) 2.2 2.2 2.5 1.7 1.8 2.3TOC-NORMALIZED PCBs (µg/kg-TOC) 5,332 26,682 5,200 8,176 8,389 5,043
TABLE B72: Bulk PCB data on Cleveland Harbor Upper Cuyahoga River sediments (surface and core composite samples collected in April) (OEPA 2015b) (yellow highlight indicates that sediment sample was not collected from the channel dredging prism).
1 Not detected at the specified detection limit
AROCLOR (µg/kg)
UPPER RIVER
DMMU-1 DMMU-2a DMMU-2b

F01A21 200013 F01W50 302581 302580 302578ALDRIN 5.9 U1 5.8 U 6.6 U 6.5 U 6.5 U 6.8 UALPHA BHC (ALPHA HEXACHLOROCYCLOHEXANE) 5.9 U 5.8 U 6.6 U 6.5 U 6.5 U 6.8 UALPHA ENDOSULFAN 5.9 U 5.8 U 6.6 U 6.5 U 6.5 U 6.8 UBETA BHC (BETA HEXACHLOROCYCLOHEXANE) 5.9 U 5.8 U 6.6 U 6.5 U 6.5 U 6.8 UBETA ENDOSULFAN 5.9 U 5.8 U 6.6 U 6.5 U 6.5 U 6.8 UDELTA BHC (DELTA HEXACHLOROCYCLOHEXANE) 5.9 U 5.8 U 6.6 U 6.5 U 6.5 U 6.8 UDIELDRIN 5.9 U 5.8 U 6.6 U 6.5 U 6.5 U 6.8 UENDOSULFAN SULFATE 5.9 U 5.8 U 6.6 U 6.5 U 6.5 U 6.8 UENDRIN 5.9 U 5.8 U 6.6 U 6.5 U 6.5 U 6.8 UENDRIN ALDEHYDE 5.9 U 5.8 U 6.6 U 6.5 U 6.5 U 6.8 UGAMMA BHC (LINDANE) 5.9 U 5.8 U 6.6 U 6.5 U 6.5 U 6.8 UHEPTACHLOR 5.9 U 5.8 U 6.6 U 6.5 U 6.5 U 6.8 UHEPTACHLOR EPOXIDE 5.9 U 5.8 U 6.6 U 6.5 U 6.5 U 6.8 UHEXACHLOROBENZENE 5.9 U 5.8 U 6.6 U 6.5 U 6.5 U 6.8 UMETHOXYCHLOR 5.9 U 5.8 U 6.6 U 6.5 U 6.5 U 6.8 UMIREX 5.9 U 5.8 U 6.6 U 6.5 U 6.5 U 6.8 UDDD (DICHLORODIPHENYLDICHLORETHANE) 5.9 U 6.4 6.6 U 6.5 U 6.5 U 6.8 UDDE (DICHLORODIPHENYLDICHLORETHYLENE) 16.2 11.7 20.6 19.8 19.6 19.4DDT (DICHLORODIPHENYLTRICHLOROETHANE) 10.3 4 U 14.4 14.7 14.2 14.3
TOTAL DDT 26.5 18.1 35 34.5 33.8 33.7
TOC (%) 2.2 2.2 2.5 1.7 1.8 2.3TOC-NORMALIZED TOTAL DDT (µg/kg-TOC) 1,205 823 1,400 2,029 1,878 1,465
1 Not detected at the specified detection limit
TABLE B73: Bulk pesticide data on Cleveland Harbor Upper Cuyahoga River sediments (surface and core composite samples collected in April) (OEPA 2015b) (yellow highlight indicates that sediment sample was not collected from the channel dredging prism).
PESTICIDE (µg/kg)UPPER RIVER
DMMU-1 DMMU-2a DMMU-2b
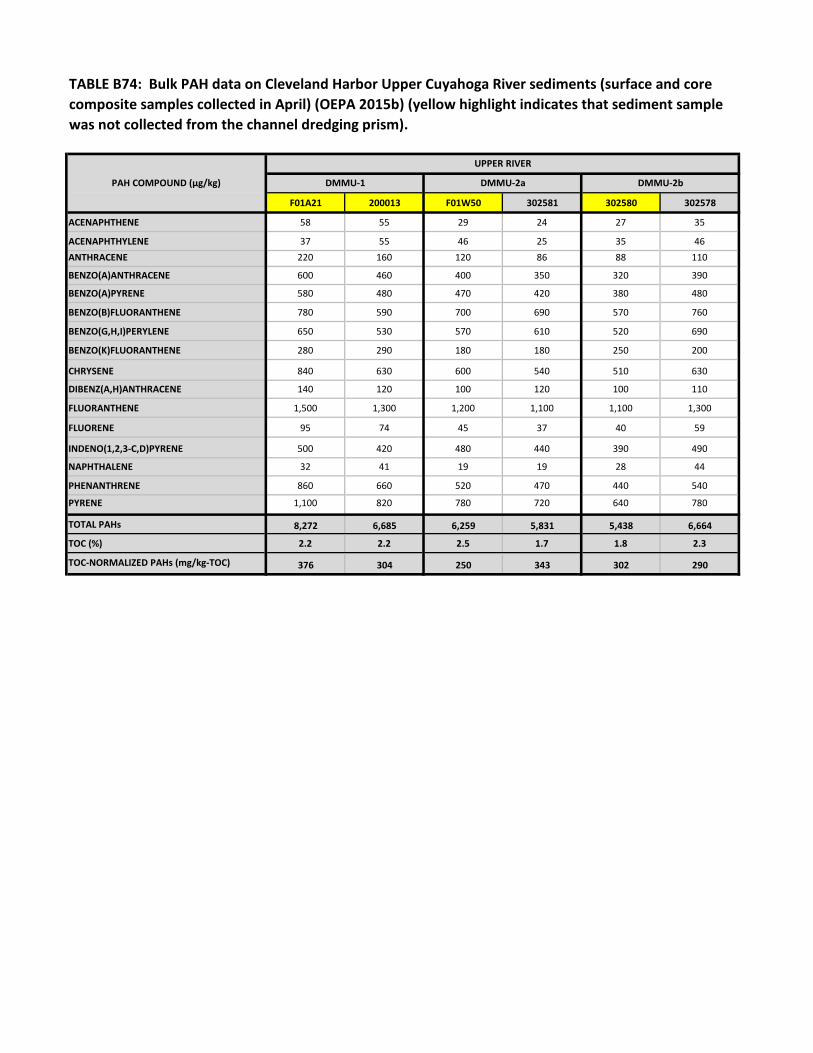
F01A21 200013 F01W50 302581 302580 302578
ACENAPHTHENE 58 55 29 24 27 35
ACENAPHTHYLENE 37 55 46 25 35 46ANTHRACENE 220 160 120 86 88 110
BENZO(A)ANTHRACENE 600 460 400 350 320 390
BENZO(A)PYRENE 580 480 470 420 380 480
BENZO(B)FLUORANTHENE 780 590 700 690 570 760
BENZO(G,H,I)PERYLENE 650 530 570 610 520 690
BENZO(K)FLUORANTHENE 280 290 180 180 250 200
CHRYSENE 840 630 600 540 510 630
DIBENZ(A,H)ANTHRACENE 140 120 100 120 100 110
FLUORANTHENE 1,500 1,300 1,200 1,100 1,100 1,300
FLUORENE 95 74 45 37 40 59
INDENO(1,2,3-C,D)PYRENE 500 420 480 440 390 490
NAPHTHALENE 32 41 19 19 28 44
PHENANTHRENE 860 660 520 470 440 540
PYRENE 1,100 820 780 720 640 780
TOTAL PAHs 8,272 6,685 6,259 5,831 5,438 6,664
TOC (%) 2.2 2.2 2.5 1.7 1.8 2.3
TOC-NORMALIZED PAHs (mg/kg-TOC) 376 304 250 343 302 290
TABLE B74: Bulk PAH data on Cleveland Harbor Upper Cuyahoga River sediments (surface and core composite samples collected in April) (OEPA 2015b) (yellow highlight indicates that sediment sample was not collected from the channel dredging prism).
PAH COMPOUND (µg/kg)
UPPER RIVER
DMMU-1 DMMU-2a DMMU-2b

F01A21 200013 F01W50 302581 302580 302578
1,1,1,2-TETRACHLOROETHANE 0.04 U1 0.2 U 0.2 U 0.04 U 0.2 U 0.2 U
1,1,2,2-TETRACHLOROETHANE 0.04 U 0.2 U 0.2 U 0.04 U 0.2 U 0.2 U
1,1,2-TRICHLOROETHANE 0.04 U 0.2 U 0.2 U 0.04 U 0.2 U 0.2 U
1,1-DICHLOROETHANE 0.04 U 0.2 U 0.2 U 0.04 U 0.2 U 0.2 U
1,1-DICHLOROETHENE 0.04 U 0.2 U 0.2 U 0.04 U 0.2 U 0.2 U
1,1-DICHLOROPROPENE 0.04 U 0.2 U 0.2 U 0.04 U 0.2 U 0.2 U
1,2,3-TRICHLOROBENZENE 0.04 U 0.2 U 0.2 U 0.04 U 0.2 U 0.2 U
1,2,3-TRICHLOROPROPANE 0.04 U 0.2 U 0.2 U 0.04 U 0.2 U 0.2 U
1,2,4-TRICHLOROBENZENE 0.04 U 0.2 U 0.2 U 0.04 U 0.2 U 0.2 U
1,2,4-TRIMETHYLBENZENE 0.04 U 0.2 U 0.2 U 0.04 U 0.2 U 0.2 U
1,2-DIBROMO-3-CHLOROPROPANE 0.04 U 0.2 U 0.2 U 0.04 U 0.2 U 0.2 U
1,2-DIBROMOETHANE (ETHYLENE DIBROMIDE) 0.04 U 0.2 U 0.2 U 0.04 U 0.2 U 0.2 U
1,2-DICHLOROBENZENE 0.04 U 0.2 U 0.2 U 0.04 U 0.2 U 0.2 U
1,2-DICHLOROETHANE 0.04 U 0.2 U 0.2 U 0.04 U 0.2 U 0.2 U
1,2-DICHLOROPROPANE 0.04 U 0.2 U 0.2 U 0.04 U 0.2 U 0.2 U
1,3,5-TRIMETHYLBENZENE (MESITYLENE) 0.04 U 0.2 U 0.2 U 0.04 U 0.2 U 0.2 U
1,3-DICHLOROBENZENE 0.04 U 0.2 U 0.2 U 0.04 U 0.2 U 0.2 U
1,3-DICHLOROPROPANE 0.04 U 0.2 U 0.2 U 0.04 U 0.2 U 0.2 U
1,4-DICHLOROBENZENE 0.04 U 0.2 U 0.2 U 0.04 U 0.2 U 0.2 U
2,2-DICHLOROPROPANE 0.04 U 0.2 U 0.2 U 0.04 U 0.2 U 0.2 U
2-CHLOROTOLUENE 0.04 U 0.2 U 0.2 U 0.04 U 0.2 U 0.2 U
2-HEXANONE 0.04 U 0.2 U 0.2 U 0.04 U 0.2 U 0.2 U
4-CHLOROTOLUENE 0.04 U 0.2 U 0.2 U 0.04 U 0.2 U 0.2 U
ACETONE 0.05 U 0.2 U 0.2 U 0.118 0.59 0.2 U
BENZENE 0.04 U 0.2 U 0.2 U 0.04 U 0.2 U 0.2 U
BROMOBENZENE 0.04 U 0.2 U 0.2 U 0.04 U 0.2 U 0.2 U
BROMOCHLOROMETHANE 0.04 U 0.2 U 0.2 U 0.04 U 0.2 U 0.2 U
BROMODICHLOROMETHANE 0.04 U 0.2 U 0.2 U 0.04 U 0.2 U 0.2 U
BROMOFORM 0.04 U 0.2 U 0.2 U 0.04 U 0.2 U 0.2 U
BROMOMETHANE 0.04 U 0.2 U 0.2 U 0.04 U 0.2 U 0.2 U
CARBON DISULFIDE 0.04 U 0.2 U 0.2 U 0.04 U 0.2 U 0.2 U
CARBON TETRACHLORIDE 0.04 U 0.2 U 0.2 U 0.04 U 0.2 U 0.2 U
CHLOROBENZENE 0.04 U 0.2 U 0.2 U 0.04 U 0.2 U 0.2 U
CHLOROETHANE 0.04 U 0.2 U 0.2 U 0.04 U 0.2 U 0.2 U
CHLOROFORM 0.04 U 0.2 U 0.2 U 0.04 U 0.2 U 0.2 U
CHLOROMETHANE 0.04 U 0.2 U 0.37 0.04 U 0.32 0.2 U
CIS-1,2-DICHLOROETHYLENE 0.04 U 0.2 U 0.2 U 0.04 U 0.2 U 0.2 U
CIS-1,3-DICHLOROPROPENE 0.04 U 0.2 U 0.2 U 0.04 U 0.2 U 0.2 U
DIBROMOCHLOROMETHANE 0.04 U 0.2 U 0.2 U 0.04 U 0.2 U 0.2 U
DIBROMOMETHANE 0.04 U 0.2 U 0.2 U 0.04 U 0.2 U 0.2 U
DICHLORODIFLUOROMETHANE 0.04 U 0.2 U 0.2 U 0.04 U 0.2 U 0.2 U
ETHYLBENZENE 0.04 U 0.2 U 0.2 U 0.04 U 0.2 U 0.2 U
HEXACHLOROBUTADIENE 0.04 U 0.2 U 0.2 U 0.04 U 0.2 U 0.2 U
ISOPROPYLBENZENE (CUMENE) 0.04 U 0.2 U 0.2 U 0.04 U 0.2 U 0.2 U
M+P-XYLENE 0.04 U 0.2 U 0.2 U 0.04 U 0.2 U 0.2 U
METHYL ETHYL KETONE (2-BUTANONE) 0.04 U 0.2 U 0.2 U 0.04 U 0.2 U 0.29
METHYL ISOBUTYL KETONE (4-METHYL-2-PENTANONE) 0.04 U 0.2 U 0.2 U 0.04 U 0.2 U 0.2 U
METHYLENE CHLORIDE 0.04 U 0.2 U 0.2 U 0.04 U 0.2 U 0.2 U
NAPHTHALENE 0.04 U 0.2 U 0.2 U 0.04 U 0.2 U 0.2 U
N-BUTYLBENZENE 0.04 U 0.2 U 0.2 U 0.04 U 0.2 U 0.2 U
N-PROPYLBENZENE 0.04 U 0.2 U 0.2 U 0.04 U 0.2 U 0.2 U
O-XYLENE (1,2-DIMETHYLBENZENE) 0.04 U 0.2 U 0.2 U 0.04 U 0.2 U 0.2 U
P-CYMENE (P-ISOPROPYLTOLUENE) 0.04 U 0.2 U 0.2 U 0.04 U 0.2 U 0.2 U
SEC-BUTYLBENZENE 0.04 U 0.2 U 0.2 U 0.04 U 0.2 U 0.2 U
STYRENE 0.04 U 0.2 U 0.2 U 0.2 U 0.04 U 0.2 U
T-BUTYLBENZENE 0.04 U 0.2 U 0.2 U 0.2 U 0.04 U 0.2 U
TETRACHLOROETHYLENE(PCE) 0.04 U 0.2 U 0.2 U 0.2 U 0.04 U 0.2 U
TOLUENE 0.04 U 9.44 11.4 3.8 0.112 2.56
TRANS-1,2-DICHLOROETHENE 0.04 U 0.2 U 0.2 U 0.2 U 0.04 U 0.2 U
TRANS-1,3-DICHLOROPROPENE 0.04 U 0.2 U 0.2 U 0.2 U 0.04 U 0.2 U
TRICHLOROETHANE 0.04 U 0.2 U 0.2 U 0.2 U 0.04 U 0.2 U
TRICHLOROETHYLENE (TCE) 0.04 U 0.2 U 0.2 U 0.2 U 0.04 U 0.2 U
TRICHLOROFLUOROMETHANE 0.04 U 0.2 U 0.2 U 0.2 U 0.04 U 0.2 U
VINYL CHLORIDE 0.04 U 0.2 U 0.2 U 0.2 U 0.04 U 0.2 U
TABLE B75: Bulk VOC data on Cleveland Harbor Upper Cuyahoga River sediments (surface and core composite samples collected in April) (OEPA 2015b) (yellow highlight indicates that sediment sample was not collected from the channel dredging prism).
1 Not detected at the specified detection limit
VOC (mg/kg)
UPPER RIVER
DMMU-1 DMMU-2a DMMU-2b

F01A21 Grab 200013 Grab F01W50 Grab 302581 Grab 302580 Grab 302578 Grab
FINE CLAY 6 12 14 8.1 8.1 15
MEDIUM CLAY 4 4.1 4 14 6.1 7.6
COARSE CLAY 2 6.1 6.1 4 4 7.6
VERY FINE SILT 4 2 10 8.1 8.1 15
FINE SILT 4 8.1 24 28 26 31
MEDIUM SILT 10 16 10 12 14 7.6
COARSE SILT 2 4.1 31 25 33 16
SILT/CLAY 32 52.4 99.1 99.2 99.3 99.8COARSE SAND 68 47 0 0 0 0
TABLE B76: Bulk grain size data on Cleveland Harbor Upper Cuyahoga River sediments (surface and core composite samples collected in October) (OEPA 2015c)
UPPER RIVER
DMMU-1 DMMU-2a DMMU-2bPARTICLE SIZE (%)

F01A21 Core F01A21 Grab 200013 Core 200013 Grab F01W50 Core F01W50 Grab 302581 Core 302581 Grab 302580 Core 302580 Grab 302578 Core 302578 Grab
NITROGEN, AMMONIA 240 79 93 79 160 110 230 170 230 120 230 110
PHOSPHORUS, TOTAL (AS P) 659 539 515 638 812 960 819 799 774 615 931 753
TOTAL ORGANIC CARBON (%) 1.4 2.3 2.0 2.6 2.1 2.0 1.5 1.6 1.6 7.3 1.8 1.8
pH (SU) 7.3 7.7 7.2 7.4 7.4 7.5 7.4 7.4 7.4 1.8 7.4 7.5
TABLE B77: Bulk inorganics data on Cleveland Harbor Upper Cuyahoga River sediments (surface and core samples collected in October) (OEPA 2015c) (yellow highlight indicates that sediment sample was not collected from the channel dredging prism).
UPPER RIVER
DMMU-2bINORGANIC (mg/kg) DMMU-1 DMMU-2a
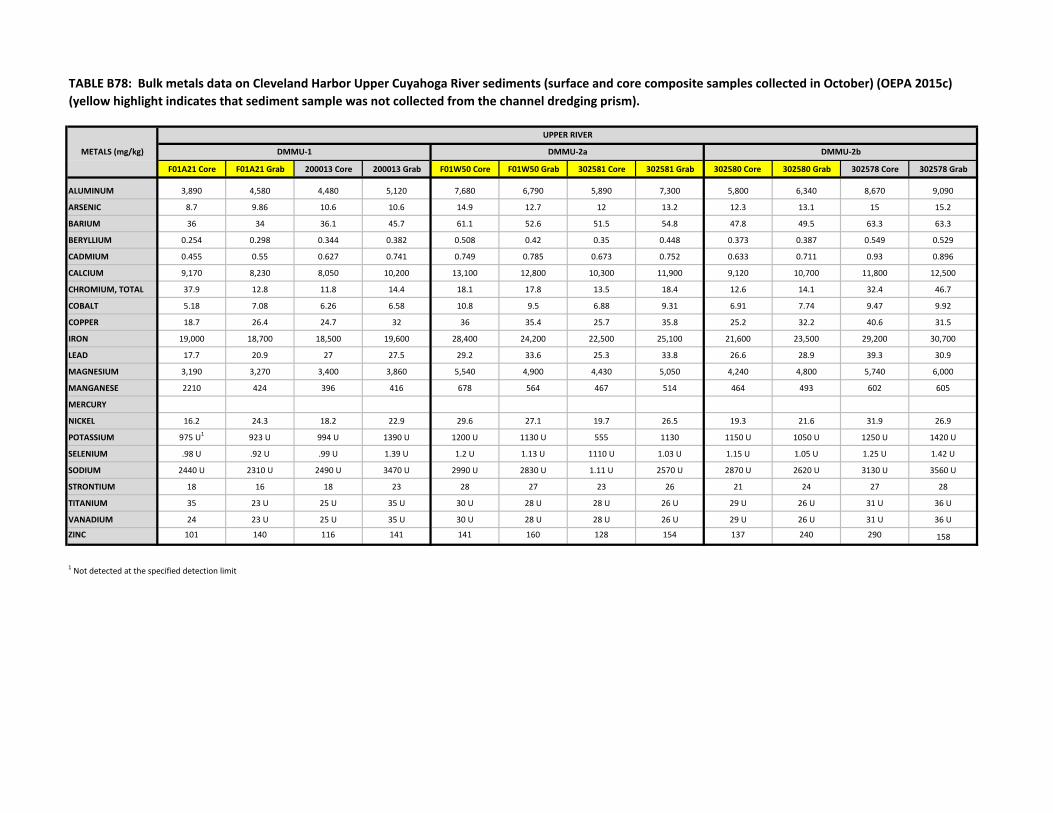
F01A21 Core F01A21 Grab 200013 Core 200013 Grab F01W50 Core F01W50 Grab 302581 Core 302581 Grab 302580 Core 302580 Grab 302578 Core 302578 Grab
ALUMINUM 3,890 4,580 4,480 5,120 7,680 6,790 5,890 7,300 5,800 6,340 8,670 9,090
ARSENIC 8.7 9.86 10.6 10.6 14.9 12.7 12 13.2 12.3 13.1 15 15.2
BARIUM 36 34 36.1 45.7 61.1 52.6 51.5 54.8 47.8 49.5 63.3 63.3
BERYLLIUM 0.254 0.298 0.344 0.382 0.508 0.42 0.35 0.448 0.373 0.387 0.549 0.529
CADMIUM 0.455 0.55 0.627 0.741 0.749 0.785 0.673 0.752 0.633 0.711 0.93 0.896
CALCIUM 9,170 8,230 8,050 10,200 13,100 12,800 10,300 11,900 9,120 10,700 11,800 12,500
CHROMIUM, TOTAL 37.9 12.8 11.8 14.4 18.1 17.8 13.5 18.4 12.6 14.1 32.4 46.7
COBALT 5.18 7.08 6.26 6.58 10.8 9.5 6.88 9.31 6.91 7.74 9.47 9.92
COPPER 18.7 26.4 24.7 32 36 35.4 25.7 35.8 25.2 32.2 40.6 31.5
IRON 19,000 18,700 18,500 19,600 28,400 24,200 22,500 25,100 21,600 23,500 29,200 30,700
LEAD 17.7 20.9 27 27.5 29.2 33.6 25.3 33.8 26.6 28.9 39.3 30.9
MAGNESIUM 3,190 3,270 3,400 3,860 5,540 4,900 4,430 5,050 4,240 4,800 5,740 6,000
MANGANESE 2210 424 396 416 678 564 467 514 464 493 602 605
MERCURY
NICKEL 16.2 24.3 18.2 22.9 29.6 27.1 19.7 26.5 19.3 21.6 31.9 26.9
POTASSIUM 975 U1 923 U 994 U 1390 U 1200 U 1130 U 555 1130 1150 U 1050 U 1250 U 1420 U
SELENIUM .98 U .92 U .99 U 1.39 U 1.2 U 1.13 U 1110 U 1.03 U 1.15 U 1.05 U 1.25 U 1.42 U
SODIUM 2440 U 2310 U 2490 U 3470 U 2990 U 2830 U 1.11 U 2570 U 2870 U 2620 U 3130 U 3560 U
STRONTIUM 18 16 18 23 28 27 23 26 21 24 27 28
TITANIUM 35 23 U 25 U 35 U 30 U 28 U 28 U 26 U 29 U 26 U 31 U 36 U
VANADIUM 24 23 U 25 U 35 U 30 U 28 U 28 U 26 U 29 U 26 U 31 U 36 U
ZINC 101 140 116 141 141 160 128 154 137 240 290 158
UPPER RIVER
DMMU-2b
TABLE B78: Bulk metals data on Cleveland Harbor Upper Cuyahoga River sediments (surface and core composite samples collected in October) (OEPA 2015c) (yellow highlight indicates that sediment sample was not collected from the channel dredging prism).
1 Not detected at the specified detection limit
METALS (mg/kg) DMMU-1 DMMU-2a
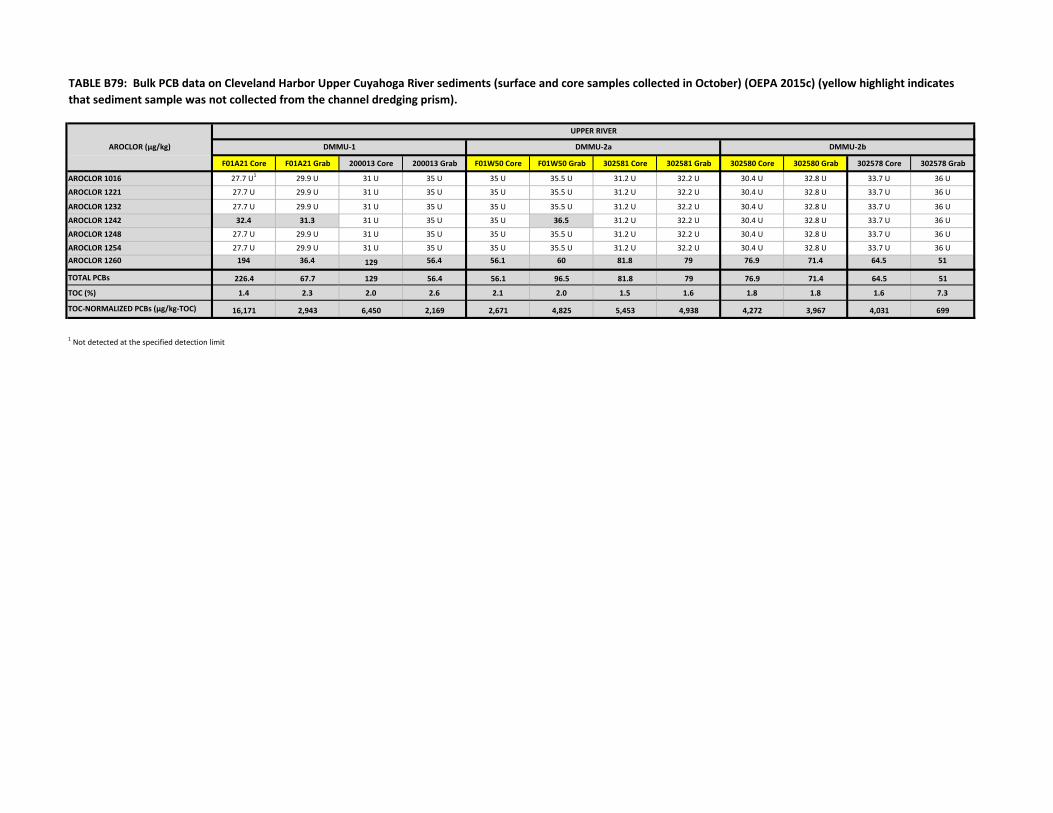
F01A21 Core F01A21 Grab 200013 Core 200013 Grab F01W50 Core F01W50 Grab 302581 Core 302581 Grab 302580 Core 302580 Grab 302578 Core 302578 Grab
AROCLOR 1016 27.7 U1 29.9 U 31 U 35 U 35 U 35.5 U 31.2 U 32.2 U 30.4 U 32.8 U 33.7 U 36 U
AROCLOR 1221 27.7 U 29.9 U 31 U 35 U 35 U 35.5 U 31.2 U 32.2 U 30.4 U 32.8 U 33.7 U 36 U
AROCLOR 1232 27.7 U 29.9 U 31 U 35 U 35 U 35.5 U 31.2 U 32.2 U 30.4 U 32.8 U 33.7 U 36 U
AROCLOR 1242 32.4 31.3 31 U 35 U 35 U 36.5 31.2 U 32.2 U 30.4 U 32.8 U 33.7 U 36 U
AROCLOR 1248 27.7 U 29.9 U 31 U 35 U 35 U 35.5 U 31.2 U 32.2 U 30.4 U 32.8 U 33.7 U 36 U
AROCLOR 1254 27.7 U 29.9 U 31 U 35 U 35 U 35.5 U 31.2 U 32.2 U 30.4 U 32.8 U 33.7 U 36 UAROCLOR 1260 194 36.4 129 56.4 56.1 60 81.8 79 76.9 71.4 64.5 51
TOTAL PCBs 226.4 67.7 129 56.4 56.1 96.5 81.8 79 76.9 71.4 64.5 51
TOC (%) 1.4 2.3 2.0 2.6 2.1 2.0 1.5 1.6 1.8 1.8 1.6 7.3
TOC-NORMALIZED PCBs (µg/kg-TOC) 16,171 2,943 6,450 2,169 2,671 4,825 5,453 4,938 4,272 3,967 4,031 699
TABLE B79: Bulk PCB data on Cleveland Harbor Upper Cuyahoga River sediments (surface and core samples collected in October) (OEPA 2015c) (yellow highlight indicates that sediment sample was not collected from the channel dredging prism).
1 Not detected at the specified detection limit
AROCLOR (µg/kg) DMMU-2b
UPPER RIVER
DMMU-1 DMMU-2a
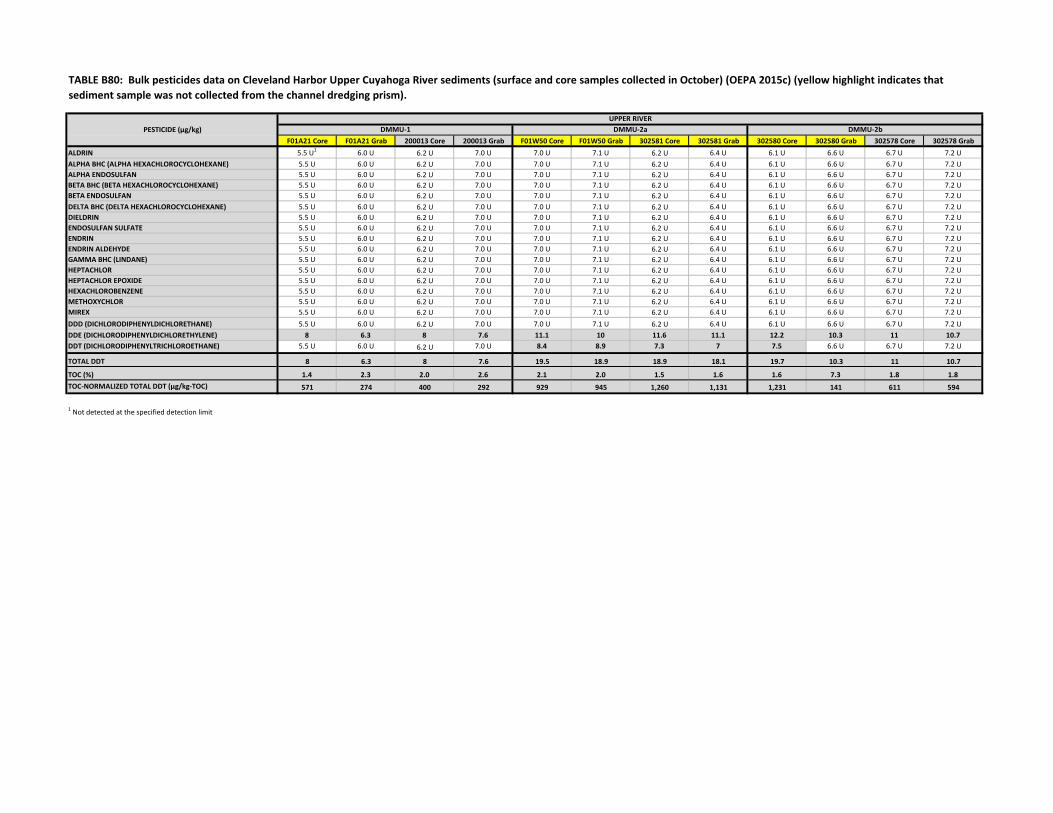
F01A21 Core F01A21 Grab 200013 Core 200013 Grab F01W50 Core F01W50 Grab 302581 Core 302581 Grab 302580 Core 302580 Grab 302578 Core 302578 GrabALDRIN 5.5 U1 6.0 U 6.2 U 7.0 U 7.0 U 7.1 U 6.2 U 6.4 U 6.1 U 6.6 U 6.7 U 7.2 UALPHA BHC (ALPHA HEXACHLOROCYCLOHEXANE) 5.5 U 6.0 U 6.2 U 7.0 U 7.0 U 7.1 U 6.2 U 6.4 U 6.1 U 6.6 U 6.7 U 7.2 UALPHA ENDOSULFAN 5.5 U 6.0 U 6.2 U 7.0 U 7.0 U 7.1 U 6.2 U 6.4 U 6.1 U 6.6 U 6.7 U 7.2 UBETA BHC (BETA HEXACHLOROCYCLOHEXANE) 5.5 U 6.0 U 6.2 U 7.0 U 7.0 U 7.1 U 6.2 U 6.4 U 6.1 U 6.6 U 6.7 U 7.2 UBETA ENDOSULFAN 5.5 U 6.0 U 6.2 U 7.0 U 7.0 U 7.1 U 6.2 U 6.4 U 6.1 U 6.6 U 6.7 U 7.2 UDELTA BHC (DELTA HEXACHLOROCYCLOHEXANE) 5.5 U 6.0 U 6.2 U 7.0 U 7.0 U 7.1 U 6.2 U 6.4 U 6.1 U 6.6 U 6.7 U 7.2 UDIELDRIN 5.5 U 6.0 U 6.2 U 7.0 U 7.0 U 7.1 U 6.2 U 6.4 U 6.1 U 6.6 U 6.7 U 7.2 UENDOSULFAN SULFATE 5.5 U 6.0 U 6.2 U 7.0 U 7.0 U 7.1 U 6.2 U 6.4 U 6.1 U 6.6 U 6.7 U 7.2 UENDRIN 5.5 U 6.0 U 6.2 U 7.0 U 7.0 U 7.1 U 6.2 U 6.4 U 6.1 U 6.6 U 6.7 U 7.2 UENDRIN ALDEHYDE 5.5 U 6.0 U 6.2 U 7.0 U 7.0 U 7.1 U 6.2 U 6.4 U 6.1 U 6.6 U 6.7 U 7.2 UGAMMA BHC (LINDANE) 5.5 U 6.0 U 6.2 U 7.0 U 7.0 U 7.1 U 6.2 U 6.4 U 6.1 U 6.6 U 6.7 U 7.2 UHEPTACHLOR 5.5 U 6.0 U 6.2 U 7.0 U 7.0 U 7.1 U 6.2 U 6.4 U 6.1 U 6.6 U 6.7 U 7.2 UHEPTACHLOR EPOXIDE 5.5 U 6.0 U 6.2 U 7.0 U 7.0 U 7.1 U 6.2 U 6.4 U 6.1 U 6.6 U 6.7 U 7.2 UHEXACHLOROBENZENE 5.5 U 6.0 U 6.2 U 7.0 U 7.0 U 7.1 U 6.2 U 6.4 U 6.1 U 6.6 U 6.7 U 7.2 UMETHOXYCHLOR 5.5 U 6.0 U 6.2 U 7.0 U 7.0 U 7.1 U 6.2 U 6.4 U 6.1 U 6.6 U 6.7 U 7.2 UMIREX 5.5 U 6.0 U 6.2 U 7.0 U 7.0 U 7.1 U 6.2 U 6.4 U 6.1 U 6.6 U 6.7 U 7.2 UDDD (DICHLORODIPHENYLDICHLORETHANE) 5.5 U 6.0 U 6.2 U 7.0 U 7.0 U 7.1 U 6.2 U 6.4 U 6.1 U 6.6 U 6.7 U 7.2 UDDE (DICHLORODIPHENYLDICHLORETHYLENE) 8 6.3 8 7.6 11.1 10 11.6 11.1 12.2 10.3 11 10.7DDT (DICHLORODIPHENYLTRICHLOROETHANE) 5.5 U 6.0 U 6.2 U 7.0 U 8.4 8.9 7.3 7 7.5 6.6 U 6.7 U 7.2 U
TOTAL DDT 8 6.3 8 7.6 19.5 18.9 18.9 18.1 19.7 10.3 11 10.7
TOC (%) 1.4 2.3 2.0 2.6 2.1 2.0 1.5 1.6 1.6 7.3 1.8 1.8TOC-NORMALIZED TOTAL DDT (µg/kg-TOC) 571 274 400 292 929 945 1,260 1,131 1,231 141 611 594
1 Not detected at the specified detection limit
TABLE B80: Bulk pesticides data on Cleveland Harbor Upper Cuyahoga River sediments (surface and core samples collected in October) (OEPA 2015c) (yellow highlight indicates that sediment sample was not collected from the channel dredging prism).
PESTICIDE (µg/kg)UPPER RIVER
DMMU-1 DMMU-2a DMMU-2b

F01A21 Cores F01A21 Grabs 200013 Cores 200013 Grabs F01W50 Cores F01W50 Grabs 302581 Cores 302581 Grabs 302580 Cores 302580 Grabs 302578 Cores 302578 Grabs
ACENAPHTHENE 550 U1 600 U 610 U 700 U 690 U 710 U 620 U 640 U 610 U 660 U 680 U 720 U
ACENAPHTHYLENE 550 U 600 U 610 U 700 U 690 U 710 U 620 U 640 U 610 U 660 U 680 U 720 UANTHRACENE 550 U 600 U 610 U 700 U 690 U 710 U 620 U 640 U 610 U 660 U 680 U 720 U
BENZO(A)ANTHRACENE 550 U 600 U 610 U 870 690 U 710 U 620 U 640 U 610 U 660 U 680 U 720 U
BENZO(A)PYRENE 550 U 600 U 610 U 1,060 690 U 720 650 740 710 690 680 U 720 U
BENZO(B)FLUORANTHENE 590 600 U 720 1,270 840 890 920 1,000 910 870 870 720 U
BENZO(G,H,I)PERYLENE 550 U 600 U 610 U 1,060 690 U 730 710 790 700 680 710 720 U
BENZO(K)FLUORANTHENE 550 U 600 U 610 U 1,000 690 U 710 U 620 U 740 650 660 U 680 U 720 U
CHRYSENE 580 600 U 630 1,170 750 800 760 890 820 810 760 720 U
DIBENZ(A,H)ANTHRACENE 550 U 600 U 610 U 700 U 690 U 710 U 620 U 640 U 610 U 660 U 680 U 720 U
FLUORANTHENE 1,090 620 1,210 2,210 1,340 1,520 1,450 1,640 1,630 1,440 1,330 1,070
FLUORENE 550 U 600 U 610 U 700 U 690 U 710U 620 U 640 U 610 U 660 U 680 U 720 U
INDENO(1,2,3-C,D)PYRENE 550 U 600 U 610 U 1,120 691 U 760 720 830 740 720 720 720 U
NAPHTHALENE 550 U 600 U 610 U 700 U 692 U 710 U 620 U 640 U 610 U 660 U 680 U 720 U
PHENANTHRENE 550 U 600 U 610 U 1,070 693 U 710 U 620 U 640 U 760 660 U 680 U 720 UPYRENE 860 600 U 880 1,640 1,070 1,190 1,140 1,180 1,290 1,170 1,030 760
TOTAL PAHs 3,120 620 3,440 12,470 4,000 4,400 6,350 7,070 8,210 6,380 5,420 1,830
TOC (%) 1.4 2.3 2.0 2.6 2.1 2.0 1.5 1.6 1.6 7.3 1.8 1.8
TOC-NORMALIZED PAHs (mg/kg-TOC) 223 27 172 480 190 220 423 442 513 87 301 102
1 Not detected at the specified detection limit
TABLE B81: Bulk PAH data on Cleveland Harbor Upper Cuyahoga River sediments (surface and core samples collected in October) (OEPA 2015c) (yellow highlight indicates that sediment sample was not collected from the channel dredging prism).
PAH COMPOUND (µg/kg)
UPPER RIVER
DMMU-1 DMMU-2a DMMU-2b

Composite 1 LE-1-6
Composite 2 LE-7-11
FINE CLAY 22 33
MEDIUM CLAY 6.1 12
COARSE CLAY 6.1 6.2
VERY FINE SILT 6.1 14
FINE SILT 10 6.2
MEDIUM SILT 2 0
COARSE SILT 2 28
SILT/CLAY 54.3 99.4COARSE SAND 45 0
TABLE B82: Bulk grain size data on Lake Erie sediments (surface samples collected in May) (OEPA 2015d)
PARTICLE SIZE (%)
LAKE ERIE

TOP CORE COMPOSITE
BOTTOM CORE COMPOSITE
FINE CLAY 30 29
MEDIUM CLAY 13 12
COARSE CLAY 6.4 8.2
VERY FINE SILT 15 16
FINE SILT 6.4 8.2
MEDIUM SILT 0 6.1
COARSE SILT 29 20
SILT/CLAY 99.8 99.5COARSE SAND 0 0
TABLE B83: Bulk grain size data on CLA-1 vicinity sediments (core composite samples collected in June) (OEPA 2015e)
PARTICLE SIZE (%)
CLA-1 AND ADJACENT AREAS

LE-1 LE-2 LE-3 LE-4 LE-6LE-COMP-1 (LE 1-
6)LE-7 LE-8 LE-9 LE-10 LE-11
LE-COMP-2 (LE 7-11)
NITROGEN, AMMONIA 330 270 870 85 190 160 230 65 130 190 700 210
PHOSPHORUS, TOTAL (AS P) 991 952 913 622 1,130 800 1,020 743 116 881 936 814
TOTAL ORGANIC CARBON (%) 2.9 2.7 2.6 1.6 2.7 2.5 2.1 1.6 2.2 2.6 2.3 3.8
pH (SU) 7.5 7.6 7.4 7.5 7.5 7.7 7.8 7.4 7.7 7.5 7.6 7.5
INORGANIC (mg/kg)
LAKE ERIE
TABLE B84: Bulk inorganics data on Lake Erie sediments (surface samples collected in May) (OEPA 2015d)

CLA1-1S
TOP BOTTOM TOP BOTTOM TOP BOTTOM TOP BOTTOM TOP BOTTOM TOP BOTTOM TOP BOTTOM TOP
NITROGEN, AMMONIA 300 350 230 270 230 230 310 220 180 210 150 690 260 470 110 180 170
PHOSPHORUS, TOTAL (AS P) 1,190 1,180 1,280 977 1,370 1,170 1,280 841 1,100 709 1,050 991 1,120 703 751 1,150 970
TOTAL ORGANIC CARBON (%) 2.9 3.2 2.9 2.7 3.1 2.7 3.1 2.0 2.8 1.9 3.0 2.2 3.0 1.2 3.2 3.3 5.9
pH (SU) 7.5 7.5 7.6 7.4 7.5 7.2 7.6 7.4 7.5 7.5 7.5 7.6 7.5 7.5 7.8 7.6 7.5
BOTTOM CORE COMPOSITE
TABLE B85: Bulk inorganics data on CLA-1 vicinity sediments (core samples collected in June) (OEPA 2015e)
INORGANIC (mg/kg)
CLA-1 & ADJACENT AREAS
CLA 1-0 CLA 1-0.5E CLA 1-1.5E CLA 1-0.5W CLA 1-1.5W CLA 1-1N CLA1-2N TOP CORE COMPOSITE

LE-1 LE-2 LE-3 LE-4 LE-6LE-COMP-1 (LE 1-
6)LE-7 LE-8 LE-9 LE-10 LE-11
LE-COMP-2 (LE 7-11)
ALUMINUM 18600 19600 20300 5720 18800 10200 13900 6250 9910 15600 10100 14300
ARSENIC 8.48 8.37 7.73 4.77 7.53 21.6 11.6 12 76.9 12.5 17.3 6.21
BARIUM 127 126 131 60.1 125 97 97.5 47.7 188 130 97.4 97.7
BERYLLIUM 1.01 0.973 1.07 0.321 1.01 0.687 0.782 0.441 0.75 0.87 0.647 0.744
CADMIUM 2.59 2.86 2.61 0.728 2.38 1.64 1.7 0.928 1.39 2.38 1.9 1.82
CALCIUM 12,200 14200 13200 4340 12000 8360 12000 4890 7730 11500 8950 9250
CHROMIUM, TOTAL 44.4 44.6 43.7 12.6 39.3 25.4 27.9 21.3 20.8 38 27 31.6
COBALT 12.4 11.6 12 6.08 11.5 9.56 10.1 6.36 12.6 10.9 10 9.18
COPPER 42.3 41.4 39.4 12.2 37.8 28 28 22 21.3 42.9 30.1 29.1
IRON 33400 34200 34600 18300 33000 37100 31500 31700 70900 40600 34900 25800
LEAD 57 56.8 50.8 15.7 46.6 51.9 32.6 39.6 38.9 58.8 44.2 38.2
MAGNESIUM 11600 12600 11800 3810 11000 6800 9100 3710 6330 9320 7260 8380
MANGANESE 557 531 530 401 531 701 664 402 1540 640 696 432
MERCURY 0.1 0.196 0.277 0.042 0.234 0.16 0.183 0.112 0.112 0.229 0.163 0.232
NICKEL 48 47.5 47.1 16.7 43.5 33.2 33.2 20.8 35.3 38.8 34.9 34.2
POTASSIUM 3410 3600 3590 800 U 3380 800 U1 800 U 800 U 800 U 2880 800 U 2660
SELENIUM 0.8 U 0.8 U 0.8 U 0.8 U 0.8 U 0.8 U 0.8 U 0.8 U 0.8 U 0.8 U 0.8 U 0.8 U
SODIUM 2000 U 2000 U 2000 U 2000 U 2000 U 2000 U 2000 U 2000 U 2000 U 2000 U 2000 U 2000 U
STRONTIUM 12 U 12 U 12 U 12 U 12 U 12 U 12 U 12 U 12 U 33 12 U 12 U
TITANIUM 89 93 78 39 81 20 U 20 U 37 20 U 83 20 U 69
VANADIUM 20 U 20 U 20 U 20 U 20 U 20 U 20 U 20 U 20 U 20 U 20 U 20 U
ZINC 227 231 218 72.9 204 183 153 126 175 259 191 158
METALS (mg/kg)LAKE ERIE
TABLE B86: Bulk metals data on Lake Erie sediments (surface samples collected in May) (OEPA 2015d)
1 Not detected at the specified detection limit

CLA1-1S
TOP BOTTOM TOP BOTTOM TOP BOTTOM TOP BOTTOM TOP BOTTOM TOP BOTTOM TOP BOTTOM TOP
ALUMINUM 14,900 12,600 15,600 10,900 13,800 12,300 19,800 18,100 15,300 14,400 16,000 14,300 16,700 14,200 5840 17200 16700
ARSENIC 7.71 12.3 13.6 9.31 13.7 17.9 17.8 8.88 7.98 6.26 8.84 8.81 9.21 4.39 17.5 12.1 17
BARIUM 122 139 125 119 115 111 143 127 122 109 128 118 132 109 90.9 113 137
BERYLLIUM 0.827 0.826 0.86 0.908 0.842 0.823 1.05 0.888 0.921 0.779 0.917 0.858 0.948 0.706 0.37 0.897 0.843
CADMIUM 2.8 5.77 3.55 2.86 3.81 5.37 5.18 2.56 2.84 1.98 2.84 3.02 2.88 1.28 8.02 3.46 8.89
CALCIUM 13,600 11,800 14,100 12,500 13,100 11,400 12,600 8,630 11,900 8,690 12,100 8,930 11,900 7,710 7760 10500 11600
CHROMIUM, TOTAL 40.4 53.8 43.8 35.6 49.7 49 61.4 31.7 43.3 27.6 43.6 33.2 45.3 22.3 57.6 45.8 67.4
COBALT 11.8 11.7 11.9 9.49 11.3 11.1 13 11.9 12.4 11.8 12.6 11.8 12.6 12.3 7.53 10.6 10.8
COPPER 45.3 78.5 54.7 43.5 78.3 80.5 62.1 37 46 32.4 45.7 43.4 47.1 26 79.3 47.2 88.6
IRON 35,100 38,100 41,600 28,100 44,100 44,800 46,000 34,800 32,300 30,300 34,200 32,100 34,400 29,400 40400 40500 50400
LEAD 62.8 121 92.9 79.4 93.4 135 125 62.5 65.6 41.7 62.8 79.6 66.7 28.1 188 71.3 186
MAGNESIUM 11,400 9,480 10,700 8,940 10,200 8,630 10,800 9,670 11,100 9,500 11,200 9,210 11,300 9,100 2970 9050 8040
MANGANESE 759 722 981 663 763 782 793 601 586 510 708 573 689 488 628 678 722
MERCURY 0.332 0.377 0.379 0.266 0.354 0.311 0.44 0.186 0.314 0.118 0.324 0.186 0.324 0.072 0.327 0.311 0.299
NICKEL 45.5 51 44.6 41.3 48 43.2 54.6 37 50.7 37.1 48.8 39.1 50.2 34.7 56.5 41.4 67
POTASSIUM 1,510 1,255 2,670 800 U 1,350 1,075 3,710 3,130 1,605 1,270 1,470 1,230 1,720 2,320 800 U 3480 3190
SELENIUM 1.51 1.26 0.8 U1 0.8 U 1.35 1.08 0.8 U 0.8 U 1.605 1.27 1.47 1.23 1.72 1 0.8 U 0.8 U 0.8 U
SODIUM 3,780 3,140 2000 U 2000 U 3,380 2,690 2000 U 2000 U 4,015 3,170 3,680 3,080 4,295 2,505 2000 U 2000 U 2000 U
STRONTIUM 22.5 19 12 U 12 U 20.5 16 12 U 12 U 24 19 22 18.5 26 15 21 12 U 35
TITANIUM 76 U 63 U 73 20 UJ 68 U 54 U 107 67 80 U 63 U 74 U 62 U 86 U 50 U 46 102 92
VANADIUM 76 U 63 U 20 U 20 U 68 U 54 U 20 U 20 U 80 U 63 U 74 U 62 U 86 U 50 U 20 U 20 U 20 U
ZINC 284 534 406 270 436 555 667 265 247 188 258 320 261 143 879 396 867
BOTTOM CORE COMPOSITE
TABLE B87: Bulk metals data on CLA-1 vicinity sediments (core Samples collected in June) (OEPA 2015e)
1 Not detected at the specified detection limit
METALS (mg/kg)
CLA-1 AND ADJACENT AREAS
CLA 1-0 CLA 1-0.5E CLA 1-1.5E CLA 1-0.5W CLA 1-1.5W CLA 1-1N CLA1-2N TOP CORE COMPOSITE

LE-1 LE-2 LE-3 LE-4 LE-6Composite (LE-
1-LE6) LE-7 LE-8 LE-9 LE-10 LE-11Composite (LE7-
LE11)
AROCLOR 1016 82.6 U1 76.1 U 73.0 U 31.3 U 74.6 U 51.0 U 59.1 U 35.2 U 45.8 U 54.6 U 48.2 U 65.8 U
AROCLOR 1221 82.6 U 76.1 U 73.0 U 31.3 U 74.6 U 51.0 U 59.1 U 35.2 U 45.8 U 54.6 U 48.2 U 65.8 U
AROCLOR 1232 82.6 U 76.1 U 73.0 U 31.3 U 74.6 U 51.0 U 59.1 U 35.2 U 45.8 U 54.6 U 48.2 U 65.8 U
AROCLOR 1242 82.6 U 76.1 U 73.0 U 31.3 U 74.6 U 51.0 U 59.1 U 35.2 U 45.8 U 54.6 U 48.2 U 65.8 U
AROCLOR 1248 82.6 U 76.1 U 73.0 U 31.3 U 74.6 U 51.0 U 59.1 U 35.2 U 45.8 U 54.6 U 48.2 U 65.8 U
AROCLOR 1254 82.6 U 87.7 76.5 31.3 U 77.7 51.0 U 59.1 U 35.7 45.8 U 54.6 U 48.2 U 65.8 U
AROCLOR 1260 82.6 U 76.1 U 76.1U 31.3 U 74.6 U 51.0 U 59.1 U 35.2 U 45.8 U 54.6 U 48.2 U 65.8 U
Total PCBs 87.7 76.5 77.7 35.7
TOC (%) 2.9 2.7 2.6 1.6 2.7 2.5 2.1 1.6 2.2 2.6 2.3 3.8
TOC-NORMALIZED PCBs (µg/kg-TOC) 3,248 2,942 2,878 2,231
AROCLOR (µg/kg)LAKE ERIE
TABLE B88: Bulk PCB data on Lake Erie sediments (surface samples collected in May) (OEPA 2015d)
1 Not detected at the specified detection limit

CLA1-1S
TOP BOTTOM TOP BOTTOM TOP BOTTOM TOP BOTTOM TOP BOTTOM TOP BOTTOM TOP BOTTOM TOP
AROCLOR 1016 77 U1 69 U 49.4 U 57.9 U 68 U 47 U 73.8 U 67.8 85 U 64 U 87 U 68 U 87 U 60 U 25.2 U 84.4 U 79.4 U
AROCLOR 1221 77 U 69 U 49.4 U 57.9 U 68 U 47 U 73.8 U 67.8 85 U 64 U 87 U 68 U 87 U 60 U 25.2 U 84.4 U 79.4 U
AROCLOR 1232 77 U 69 U 49.4 U 57.9 U 68 U 47 U 73.8 U 67.8 85 U 64 U 87 U 68 U 87 U 60 U 25.2 U 84.4 U 79.4 U
AROCLOR 1242 77 U 69 U 49.4 U 57.9 U 68 U 47 U 73.8 U 67.8 85 U 64 U 87 U 68 U 87 U 60 U 25.2 U 84.4 U 79.4 U
AROCLOR 1248 77 U 69 U 49.4 U 57.9 U 68 U 47 U 73.8 U 67.8 85 U 64 U 87 U 68 U 87 U 60 U 25.2 U 84.4 U 79.4 U
AROCLOR 1254 77 U 248 58.1 88.8 260 47 U 181 67.8 88.7 64 U 87 U 68 U 87 U 60 U 25.2 U 104 79.4 U
AROCLOR 1260 77 U 69 U 49.4 U 57.9 U 68 U 47 U 73.8 U 67.8 85 U 64 U 87 U 68 U 87 U 60 U 37.6 84.4 U 79.4 U
TOTAL PCBs 248 58.1 88.8 260 181 88.7 37.6 104
TOC (%) 2.9 3.2 2.9 2.7 3.1 2.7 3.1 2.0 2.8 1.9 3.0 2.2 3.0 1.2 3.2 3.3 5.9
TOC-NORMALIZED PCBs (µg/kg-TOC) 7,750 2,003 3,289 8,387 5,839 3,168 1,175 3,152
BOTTOM CORE COMPOSITE
TABLE B89: Bulk PCB data on CLA-1 vicinity sediments (core samples collected in June) (OEPA 2015e)
1 Not detected at the specified detection limit
AROCLOR (µg/kg)
CLA-1 AND ADJACENT AREAS
CLA 1-0 CLA 1-0.5E CLA 1-1.5E CLA 1-0.5W CLA 1-1.5W CLA 1-1N CLA1-2N TOP CORE COMPOSITE

LE-1 LE-2 LE-3 LE-4 LE-6LE-COMP-1
(LE 1-6)LE-7 LE-8 LE-9 LE-10 LE-11
LE-COMP-2 (LE 7-11)
ALDRIN 16.5 U1 15.2 U 14.6 U 6.3 U 14.9 U 10.2 U 11.8 U 7.0 U 9.2 U 10.9 U 9.6 U 13.2 UALPHA BHC (ALPHA HEXACHLOROCYCLOHEXANE) 16.5 U 15.2 U 14.6 U 6.3 U 14.9 U 10.2U 11.8 U 7.0 U 9.2 U 10.9 U 9.6U 13.2 UALPHA ENDOSULFAN 16.5 U 15.2 U 14.6 U 6.3 U 14.9 U 10.2 U 11.8 U 7.0 U 9.2 U 10.9 U 9.6 U 13.2 UBETA BHC (BETA HEXACHLOROCYCLOHEXANE) 16.5 U 15.2 U 14.6 U 6.3 U 14.9 U 10.2U 11.8 U 7.0 U 9.2 U 10.9 U 9.6U 13.2 UBETA ENDOSULFAN 16.5 U 15.2 U 14.6 U 6.3 U 14.9 U 10.2 U 11.8 U 7.0 U 9.2 U 10.9 U 9.6 U 13.2 UDELTA BHC (DELTA HEXACHLOROCYCLOHEXANE) 16.5 U 15.2 U 14.6 U 6.3 U 14.9 U 10.2U 11.8 U 7.0 U 9.2 U 10.9 U 9.6U 13.2 UDIELDRIN 16.5 U 15.2 U 14.6 U 6.3 U 14.9 U 10.2 U 11.8 U 7.0 U 9.2 U 10.9 U 9.6 U 13.2 UENDOSULFAN SULFATE 16.5 U 15.2 U 14.6 U 6.3 U 14.9 U 10.2U 11.8 U 7.0 U 9.2 U 10.9 U 9.6U 13.2 UENDRIN 16.5 U 15.2 U 14.6 U 6.3 U 14.9 U 10.2 U 11.8 U 7.0 U 9.2 U 10.9 U 9.6 U 13.2 UENDRIN ALDEHYDE 16.5 U 15.2 U 14.6 U 6.3 U 14.9 U 10.2U 11.8 U 7.0 U 9.2 U 10.9 U 9.6U 13.2 UGAMMA BHC (LINDANE) 16.5 U 15.2 U 14.6 U 6.3 U 14.9 U 10.2 U 11.8 U 7.0 U 9.2 U 10.9 U 9.6 U 13.2 UHEPTACHLOR 16.5 U 15.2 U 14.6 U 6.3 U 14.9 U 10.2U 11.8 U 7.0 U 9.2 U 10.9 U 9.6U 13.2 UHEPTACHLOR EPOXIDE 16.5 U 15.2 U 14.6 U 6.3 U 14.9 U 10.2 U 11.8 U 7.0 U 9.2 U 10.9 U 9.6 U 13.2 UHEXACHLOROBENZENE 16.5 U 15.2 U 14.6 U 6.3 U 14.9 U 10.2U 11.8 U 7.0 U 9.2 U 10.9 U 9.6U 13.2 UMETHOXYCHLOR 16.5 U 15.2 U 14.6 U 6.3 U 14.9 U 10.2 U 11.8 U 7.0 U 9.2 U 10.9 U 9.6 U 13.2 UMIREX 16.5 U 15.2 U 14.6 U 6.3 U 14.9 U 10.2U 11.8 U 7.0 U 9.2 U 10.9 U 9.6U 13.2 UDDD (DICHLORODIPHENYLDICHLORETHANE) 16.5 U 15.2 U 14.6 U 6.3 U 14.9 U 10.2 U 11.8 U 7.0 U 9.2 U 10.9 U 9.6 U 13.2 UDDE (DICHLORODIPHENYLDICHLORETHYLENE) 16.5 U 15.2 U 14.6 U 6.3 U 14.9 U 10.2U 11.8 U 7.0 U 9.2 U 10.9 U 9.6U 13.2 UDDT (DICHLORODIPHENYLTRICHLOROETHANE) 16.5 U 15.2 U 14.6 U 6.3 U 14.9 U 10.2 U 11.8 U 7.0 U 9.2 U 10.9 U 9.6 U 13.2 U
TOTAL DDTTOC (%) 2.9 2.7 2.6 1.6 2.7 2.5 2.1 1.6 2.2 2.6 2.3 3.8TOC-NORMALIZED TOTAL DDT (µg/kg-TOC)
PESTICIDE (µg/kg)LAKE ERIE
1 Not detected at the specified detection limit
TABLE B90: Bulk pesticides data on Lake Erie sediments (surface samples collected in May) (OEPA 2015d)

CLA1-1STOP BOTTOM TOP BOTTOM TOP BOTTOM TOP BOTTOM TOP BOTTOM TOP BOTTOM TOP BOTTOM TOP
ALDRIN 15.4 U1 13.8 U 9.9 U 11.6 U 13.7 U 9.4 U 14.8 U 13.6 U 17 U 12.8 U 17.3 U 13.6 U 17.3 U 12.0 U 5 U 16.9 U 15.9 UALPHA BHC (ALPHA HEXACHLOROCYCLOHEXANE) 15.4 U 13.8 U 9.9 U 11.6 U 13.7 U 9.4 U 14.8 U 13.6 U 17 U 12.8 U 17.3 U 13.6 U 17.3 U 12.0 U 5 U 16.9 U 15.9 UALPHA ENDOSULFAN 15.4 U 13.8 U 9.9 U 11.6 U 13.7 U 9.4 U 14.8 U 13.6 U 17 U 12.8 U 17.3 U 13.6 U 17.3 U 12.0 U 5 U 16.9 U 15.9 UBETA BHC (BETA HEXACHLOROCYCLOHEXANE) 15.4 U 13.8 U 9.9 U 11.6 U 13.7 U 9.4 U 14.8 U 13.6 U 17 U 12.8 U 17.3 U 13.6 U 17.3 U 12.0 U 5 U 16.9 U 15.9 UBETA ENDOSULFAN 15.4 U 13.8 U 9.9 U 11.6 U 13.7 U 9.4 U 14.8 U 13.6 U 17 U 12.8 U 17.3 U 13.6 U 17.3 U 12.0 U 5 U 16.9 U 15.9 UDELTA BHC (DELTA HEXACHLOROCYCLOHEXANE) 15.4 U 13.8 U 9.9 U 11.6 U 13.7 U 9.4 U 14.8 U 13.6 U 17 U 12.8 U 17.3 U 13.6 U 17.3 U 12.0 U 5 U 16.9 U 15.9 UDIELDRIN 15.4 U 13.8 U 9.9 U 11.6 U 13.7 U 9.4 U 14.8 U 13.6 U 17 U 12.8 U 17.3 U 13.6 U 17.3 U 12.0 U 5 U 16.9 U 15.9 UENDOSULFAN SULFATE 15.4 U 13.8 U 9.9 U 11.6 U 13.7 U 9.4 U 14.8 U 13.6 U 17 U 12.8 U 17.3 U 13.6 U 17.3 U 12.0 U 5 U 16.9 U 15.9 UENDRIN 15.4 U 13.8 U 9.9 U 11.6 U 13.7 U 9.4 U 14.8 U 13.6 U 17 U 12.8 U 17.3 U 13.6 U 17.3 U 12.0 U 5 U 16.9 U 15.9 UENDRIN ALDEHYDE 15.4 U 13.8 U 9.9 U 11.6 U 13.7 U 9.4 U 14.8 U 13.6 U 17 U 12.8 U 17.3 U 13.6 U 17.3 U 12.0 U 5 U 16.9 U 15.9 UGAMMA BHC (LINDANE) 15.4 U 13.8 U 9.9 U 11.6 U 13.7 U 9.4 U 14.8 U 13.6 U 17 U 12.8 U 17.3 U 13.6 U 17.3 U 12.0 U 5 U 16.9 U 15.9 UHEPTACHLOR 15.4 U 13.8 U 9.9 U 11.6 U 13.7 U 9.4 U 14.8 U 13.6 U 17 U 12.8 U 17.3 U 13.6 U 17.3 U 12.0 U 5 U 16.9 U 15.9 UHEPTACHLOR EPOXIDE 15.4 U 13.8 U 9.9 U 11.6 U 13.7 U 9.4 U 14.8 U 13.6 U 17 U 12.8 U 17.3 U 13.6 U 17.3 U 12.0 U 5 U 16.9 U 15.9 UHEXACHLOROBENZENE 15.4 U 13.8 U 9.9 U 11.6 U 13.7 U 9.4 U 14.8 U 13.6 U 17 U 12.8 U 17.3 U 13.6 U 17.3 U 12.0 U 5 U 16.9 U 15.9 UMETHOXYCHLOR 15.4 U 13.8 U 9.9 U 11.6 U 13.7 U 9.4 U 14.8 U 13.6 U 17 U 12.8 U 17.3 U 13.6 U 17.3 U 12.0 U 5 U 16.9 U 15.9 UMIREX 15.4 U 13.8 U 9.9 U 11.6 U 13.7 U 9.4 U 14.8 U 13.6 U 17 U 12.8 U 17.3 U 13.6 U 17.3 U 12.0 U 5 U 16.9 U 15.9 UDDD (DICHLORODIPHENYLDICHLORETHANE) 15.4 U 13.8 U 9.9 U 11.6 U 13.7 U 9.4 U 14.8 U 13.6 U 17 U 12.8 U 17.3 U 13.6 U 17.3 U 12.0 U 5 U 16.9 U 15.9 UDDE (DICHLORODIPHENYLDICHLORETHYLENE) 15.4 U 18.3 9.9 U 11.6 U 13.7 U 9.4 U 32.9 13.6 U 17 U 12.8 U 17.3 U 13.6 U 17.3 U 12.0 U 5 U 16.9 U 15.9 UDDT (DICHLORODIPHENYLTRICHLOROETHANE) 15.4 U 13.8 U 9.9 U 11.6 U 13.7 U 9.4 U 14.8 U 13.6 U 17 U 12.8 U 17.3 U 13.6 U 17.3 U 12.0 U 5 U 16.9 U 15.9 UTOTAL DDT 18.3 32.9TOC (%) 2.9 3.2 2.9 2.7 3.1 2.7 3.1 2.0 2.8 1.9 3.0 2.2 3.0 1.2 3.2 3.3 5.9TOC-NORMALIZED TOTAL DDT (µg/kg-TOC) 572 1,061
1 Not detected at the specified detection limit
TABLE B91: Bulk pesticides data on CLA-1 vicinity sediments (core samples collected in June) (OEPA 2015e)
BOTTOM CORE COMPOSITE
PESTICIDE (µg/kg)CLA-1 AND ADJACENT AREAS
CLA 1-0 CLA 1-0.5E CLA 1-1.5E CLA 1-0.5W CLA 1-1.5W CLA 1-1N CLA1-2N TOP CORE COMPOSITE

LE-1 LE-2 LE-3 LE-4 LE-6 LE-COMP-1 (LE 1-6)
LE-7 LE-8 LE-9 LE-10 LE-11 LE-COMP-2 (LE 7-11)
ACENAPHTHENE 6.8 U1 10 11 9 13 180 13 610 59 380 160 12
ACENAPHTHYLENE 10 15 11 19 18 300 15 220 130 800 290 16
ANTHRACENE 21 25 29 43 27 620 33 1,000 200 1,500 430 27
BENZO(A)ANTHRACENE 59 74 83 120 110 1,400 85 1,600 470 3,600 1,100 81
BENZO(A)PYRENE 79 100 100 150 130 1,800 110 1,700 550 3,900 1,300 100
BENZO(B)FLUORANTHENE 110 150 180 190 210 1,800 160 1,800 610 4,300 1,300 170
BENZO(G,H,I)PERYLENE 82 90 81 94 120 1,300 88 1,200 410 2,900 940 99
BENZO(K)FLUORANTHENE 47 38 34 46 52 780 44 710 230 1,800 540 52
CHRYSENE 92 100 110 130 130 1,500 110 1,500 600 3,700 1,000 110
DIBENZ(A,H)ANTHRACENE 17 25 28 21 32 320 23 290 120 750 230 27
FLUORANTHENE 120 140 160 160 190 1,900 170 2,500 630 4,500 1,600 150
FLUORENE 9.3 U 14 16 12 19 180 20 310 73 380 150 17
INDENO(1,2,3-C,D)PYRENE 64 74 75 86 100 1,100 76 1,100 370 2,600 860 80
NAPHTHALENE 23 27 29 21 33 440 28 310 130 920 310 26
PHENANTHRENE 57 62 72 66 78 950 78 1,500 330 2,200 830 67
PYRENE 130 160 190 190 230 1,600 190 2,000 570 3,700 1,300 180
TOTAL PAHs 911 1,104 1,209 1,357 1,492 16,170 1,243 18,350 5,482 37,930 12,340 1,214
TOC (%) 2.9 2.7 2.6 1.6 2.7 2.5 2.1 1.6 2.2 2.6 2.3 3.8
TOC-NORMALIZED PAHs (mg/kg-TOC) 31 41 47 85 55 647 59 1,147 249 1,459 537 32
TABLE B92: Bulk PAH data on Lake Erie sediments (surface samples collected in May) (OEPA 2015d)
PAH COMPOUND (µg/kg)LAKE ERIE
1 Not detected at the specified detection limit

TOP BOTTOM TOP BOTTOM TOP BOTTOM TOP BOTTOM TOP BOTTOM TOP BOTTOM TOP BOTTOM TOP DISCRETE
ACENAPHTHENE 110 690 600 2,500 970 570 530 160 17 17 17 42 17 6 6,200 8,100 510 5,600
ACENAPHTHYLENE 54 310 470 790 2,700 730 160 85 17 22 20 57 9.1 U1 7 1,200 1,200 290 760
ANTHRACENE 200 740 1,200 5,700 9,800 1,600 710 160 32 43 43 120 22 18 7,400 9,200 1,200 5,900
BENZO(A)ANTHRACENE 280 1,500 2,200 7,800 49,000 3,400 1,100 320 97 110 95 310 74 56 7,900 7,700 2,600 5,800
BENZO(A)PYRENE 300 1,300 2,300 5,400 36,000 3,900 950 320 120 120 130 330 80 62 5,500 4,700 3,100 4,100
BENZO(B)FLUORANTHENE 360 1,500 2,500 6,400 43,000 4,200 1,100 460 190 200 190 410 150 120 6,500 5,300 3,300 5,200
BENZO(G,H,I)PERYLENE 230 1,000 1,800 3,600 19,000 2,800 700 330 120 130 130 260 97 69 3,500 2,700 2,200 2,500
BENZO(K)FLUORANTHENE 160 640 1,000 2,400 16,000 1,300 420 160 57 73 68 160 40 36 2,400 1,700 1,300 1,600
CHRYSENE 330 1,500 2,300 6,700 48,000 3,400 1,300 390 130 110 130 350 64 57 7,900 7,600 2,800 6,100
DIBENZ(A,H)ANTHRACENE 44 260 450 880 3,800 660 190 100 8.4 U 6.2 U 8.3 U 76 8.8 U 5.5 U 1,100 720 430 650
FLUORANTHENE 590 2,600 3,600 18,000 64,000 5,500 2,500 650 190 200 170 420 170 120 18,000 21,000 3,200 14,000
FLUORENE 120 470 680 3,300 1,100 510 230 84 17 26 19 60 19 6.6 U 7,300 9,400 590 5,400
INDENO(1,2,3-C,D)PYRENE 200 870 1,400 3,100 18,000 2,600 580 290 100 110 110 220 83 63 2,900 2,200 2,000 2,100
NAPHTHALENE 180 750 780 2,200 14,000 1,300 410 160 38 50 39 140 86 19 1,600 1,200 610 1,200
PHENANTHRENE 480 2,500 2,900 21,000 5,600 3,700 2,300 480 89 120 97 280 84 49 30,000 36,000 3,000 22,000
PYRENE 600 2,000 3,500 13,000 72,000 4,000 2,200 520 200 190 200 470 140 97 15,000 16,000 3,000 14,000
TOTAL PAHs 4,238 18,630 27,680 102,770 402,970 40,170 15,380 4,669 1,414 1,521 1,458 3,705 1,126 780 124,400 134,720 30,130 96,910
TOC (%) 2.9 3.2 2.9 2.7 3.1 2.7 3.1 2.0 2.8 1.9 3.0 2.2 3.0 1.2 3.2 3.3 5.9TOC-NORMALIZED PAHs (mg/kg-TOC) 146 582 954 3,806 12,999 1,488 496 233 51 80 49 168 38 65 3,888 913 1,643
TOP COPE SAMPLE
BOTTOM CORE SAMPLE
1 Not detected at the specified detection limit
TABLE B93: Bulk PAH data on CLA-1 vicinity sediments (core samples collected in June) (OEPA 2015e)
PAH COMPOUND (µg/kg)
CLA-1 AND ADJACENT AREAS
CLA 1-0 CLA 1-0.5E CLA 1-1.5E CLA 1-0.5W CLA 1-1.5W CLA 1-1N CLA1-2N CLA1-1S

LE-1 LE-2 LE-3 LE-4 LE-6 LE-COMP-1 (LE 1-6)
LE-7 LE-8 LE-9 LE-10 LE-11 LE-COMP-2 (LE 7-11)
1,1,1,2-TETRACHLOROETHANE 0.04 U1 0.04 U 0.04 U 0.04 U 0.04 U 0.04 U 0.04 U 0.04 U 0.04 U 0.04 U 0.04 U 0.04 U
1,1,2,2-TETRACHLOROETHANE 0.04 U 0.04 U 0.04 U 0.04 U 0.04 U 0.04 U 0.04 U 0.04 U 0.04 U 0.04 U 0.04 U 0.04 U
1,1,2-TRICHLOROETHANE 0.04 U 0.04 U 0.04 U 0.04 U 0.04 U 0.04 U 0.04 U 0.04 U 0.04 U 0.04 U 0.04 U 0.04 U
1,1-DICHLOROETHANE 0.04 U 0.04 U 0.04 U 0.04 U 0.04 U 0.04 U 0.04 U 0.04 U 0.04 U 0.04 U 0.04 U 0.04 U
1,1-DICHLOROETHENE 0.04 U 0.04 U 0.04 U 0.04 U 0.04 U 0.04 U 0.04 U 0.04 U 0.04 U 0.04 U 0.04 U 0.04 U
1,1-DICHLOROPROPENE 0.04 U 0.04 U 0.04 U 0.04 U 0.04 U 0.04 U 0.04 U 0.04 U 0.04 U 0.04 U 0.04 U 0.04 U
1,2,3-TRICHLOROBENZENE 0.04 U 0.04 U 0.04 U 0.04 U 0.04 U 0.04 U 0.04 U 0.04 U 0.04 U 0.04 U 0.04 U 0.04 U
1,2,3-TRICHLOROPROPANE 0.04 U 0.04 U 0.04 U 0.04 U 0.04 U 0.04 U 0.04 U 0.04 U 0.04 U 0.04 U 0.04 U 0.04 U
1,2,4-TRICHLOROBENZENE 0.04 U 0.04 U 0.04 U 0.04 U 0.04 U 0.04 U 0.04 U 0.04 U 0.04 U 0.04 U 0.04 U 0.04 U
1,2,4-TRIMETHYLBENZENE 0.04 U 0.04 U 0.04 U 0.04 U 0.04 U 0.04 U 0.04 U 0.04 U 0.04 U 0.04 U 0.04 U 0.04 U
1,2-DIBROMO-3-CHLOROPROPANE 0.04 U 0.04 U 0.04 U 0.04 U 0.04 U 0.04 U 0.04 U 0.04 U 0.04 U 0.04 U 0.04 U 0.04 U
1,2-DIBROMOETHANE (ETHYLENE DIBROMIDE) 0.04 U 0.04 U 0.04 U 0.04 U 0.04 U 0.04 U 0.04 U 0.04 U 0.04 U 0.04 U 0.04 U 0.04 U
1,2-DICHLOROBENZENE 0.04 U 0.04 U 0.04 U 0.04 U 0.04 U 0.04 U 0.04 U 0.04 U 0.04 U 0.04 U 0.04 U 0.04 U
1,2-DICHLOROETHANE 0.04 U 0.04 U 0.04 U 0.04 U 0.04 U 0.04 U 0.04 U 0.04 U 0.04 U 0.04 U 0.04 U 0.04 U
1,2-DICHLOROPROPANE 0.04 U 0.04 U 0.04 U 0.04 U 0.04 U 0.04 U 0.04 U 0.04 U 0.04 U 0.04 U 0.04 U 0.04 U
1,3,5-TRIMETHYLBENZENE (MESITYLENE) 0.04 U 0.04 U 0.04 U 0.04 U 0.04 U 0.04 U 0.04 U 0.04 U 0.04 U 0.04 U 0.04 U 0.04 U
1,3-DICHLOROBENZENE 0.04 U 0.04 U 0.04 U 0.04 U 0.04 U 0.04 U 0.04 U 0.04 U 0.04 U 0.04 U 0.04 U 0.04 U
1,3-DICHLOROPROPANE 0.04 U 0.04 U 0.04 U 0.04 U 0.04 U 0.04 U 0.04 U 0.04 U 0.04 U 0.04 U 0.04 U 0.04 U
1,4-DICHLOROBENZENE 0.04 U 0.04 U 0.04 U 0.04 U 0.04 U 0.04 U 0.04 U 0.04 U 0.04 U 0.04 U 0.04 U 0.04 U
2,2-DICHLOROPROPANE 0.04 U 0.04 U 0.04 U 0.04 U 0.04 U 0.04 U 0.04 U 0.04 U 0.04 U 0.04 U 0.04 U 0.04 U
2-CHLOROTOLUENE 0.04 U 0.04 U 0.04 U 0.04 U 0.04 U 0.04 U 0.04 U 0.04 U 0.04 U 0.04 U 0.04 U 0.04 U
2-HEXANONE 0.04 U 0.04 U 0.04 U 0.04 U 0.04 U 0.04 U 0.04 U 0.04 U 0.04 U 0.04 U 0.04 U 0.04 U
4-CHLOROTOLUENE 0.04 U 0.04 U 0.04 U 0.04 U 0.04 U 0.04 U 0.04 U 0.04 U 0.04 U 0.04 U 0.04 U 0.04 U
ACETONE 0.172 0.184 0.05 U 0.05 U 0.168 0.05 U 0.05 U 0.096 0.05 U 0.05 U 0.05 U 0.16
BENZENE 0.04 U 0.04 U 0.04 U 0.04 U 0.04 U 0.04 U 0.04 U 0.04 U 0.04 U 0.04 U 0.04 U 0.04 U
BROMOBENZENE 0.04 U 0.04 U 0.04 U 0.04 U 0.04 U 0.04 U 0.04 U 0.04 U 0.04 U 0.04 U 0.04 U 0.04 U
BROMOCHLOROMETHANE 0.04 U 0.04 U 0.04 U 0.04 U 0.04 U 0.04 U 0.04 U 0.04 U 0.04 U 0.04 U 0.04 U 0.04 U
BROMODICHLOROMETHANE 0.04 U 0.04 U 0.04 U 0.04 U 0.04 U 0.04 U 0.04 U 0.04 U 0.04 U 0.04 U 0.04 U 0.04 U
BROMOFORM 0.04 U 0.04 U 0.04 U 0.04 U 0.04 U 0.04 U 0.04 U 0.04 U 0.04 U 0.04 U 0.04 U 0.04 U
BROMOMETHANE 0.04 U 0.04 U 0.04 U 0.04 U 0.04 U 0.04 U 0.04 U 0.04 U 0.04 U 0.04 U 0.04 U 0.04 U
CARBON DISULFIDE 0.04 U 0.04 U 0.04 U 0.04 U 0.04 U 0.04 U 0.04 U 0.04 U 0.04 U 0.04 U 0.04 U 0.04 U
CARBON TETRACHLORIDE 0.04 U 0.04 U 0.04 U 0.04 U 0.04 U 0.04 U 0.04 U 0.04 U 0.04 U 0.04 U 0.04 U 0.04 U
CHLOROBENZENE 0.04 U 0.04 U 0.04 U 0.04 U 0.04 U 0.04 U 0.04 U 0.04 U 0.04 U 0.04 U 0.04 U 0.04 U
CHLOROETHANE 0.04 U 0.04 U 0.04 U 0.04 U 0.04 U 0.04 U 0.04 U 0.04 U 0.04 U 0.04 U 0.04 U 0.04 U
CHLOROFORM 0.04 U 0.04 U 0.04 U 0.04 U 0.04 U 0.04 U 0.04 U 0.04 U 0.04 U 0.04 U 0.04 U 0.04 U
CHLOROMETHANE 0.04 U 0.04 U 0.04 U 0.04 U 0.04 U 0.04 U 0.04 U 0.04 U 0.04 U 0.04 U 0.04 U 0.04 U
CIS-1,2-DICHLOROETHYLENE 0.04 U 0.04 U 0.04 U 0.04 U 0.04 U 0.04 U 0.04 U 0.04 U 0.04 U 0.04 U 0.04 U 0.04 U
CIS-1,3-DICHLOROPROPENE 0.04 U 0.04 U 0.04 U 0.04 U 0.04 U 0.04 U 0.04 U 0.04 U 0.04 U 0.04 U 0.04 U 0.04 U
DIBROMOCHLOROMETHANE 0.04 U 0.04 U 0.04 U 0.04 U 0.04 U 0.04 U 0.04 U 0.04 U 0.04 U 0.04 U 0.04 U 0.04 U
DIBROMOMETHANE 0.04 U 0.04 U 0.04 U 0.04 U 0.04 U 0.04 U 0.04 U 0.04 U 0.04 U 0.04 U 0.04 U 0.04 U
DICHLORODIFLUOROMETHANE 0.04 U 0.04 U 0.04 U 0.04 U 0.04 U 0.04 U 0.04 U 0.04 U 0.04 U 0.04 U 0.04 U 0.04 U
ETHYLBENZENE 0.04 U 0.04 U 0.04 U 0.04 U 0.04 U 0.04 U 0.04 U 0.04 U 0.04 U 0.04 U 0.04 U 0.04 U
HEXACHLOROBUTADIENE 0.04 U 0.04 U 0.04 U 0.04 U 0.04 U 0.04 U 0.04 U 0.04 U 0.04 U 0.04 U 0.04 U 0.04 U
ISOPROPYLBENZENE (CUMENE) 0.04 U 0.04 U 0.04 U 0.04 U 0.04 U 0.04 U 0.04 U 0.04 U 0.04 U 0.04 U 0.04 U 0.04 U
M+P-XYLENE 0.04 U 0.04 U 0.04 U 0.04 U 0.04 U 0.04 U 0.04 U 0.04 U 0.04 U 0.04 U 0.04 U 0.04 U
METHYL ETHYL KETONE (2-BUTANONE) 0.04 U 0.04 U 0.04 U 0.04 U 0.04 U 0.04 U 0.04 U 0.04 U 0.04 U 0.04 U 0.04 U 0.04 U
METHYL ISOBUTYL KETONE (4-METHYL-2-PENTANONE) 0.04 U 0.04 U 0.04 U 0.04 U 0.04 U 0.04 U 0.04 U 0.04 U 0.04 U 0.04 U 0.04 U 0.04 U
METHYLENE CHLORIDE 0.04 U 0.04 U 0.04 U 0.04 U 0.04 U 0.04 U 0.04 U 0.04 U 0.04 U 0.04 U 0.04 U 0.04 U
NAPHTHALENE 0.04 U 0.04 U 0.04 U 0.04 U 0.04 U 0.04 U 0.04 U 0.04 U 0.04 U 0.04 U 0.04 U 0.04 U
N-BUTYLBENZENE 0.04 U 0.04 U 0.04 U 0.04 U 0.04 U 0.04 U 0.04 U 0.04 U 0.04 U 0.04 U 0.04 U 0.04 U
N-PROPYLBENZENE 0.04 U 0.04 U 0.04 U 0.04 U 0.04 U 0.04 U 0.04 U 0.04 U 0.04 U 0.04 U 0.04 U 0.04 U
O-XYLENE (1,2-DIMETHYLBENZENE) 0.04 U 0.04 U 0.04 U 0.04 U 0.04 U 0.04 U 0.04 U 0.04 U 0.04 U 0.04 U 0.04 U 0.04 U
P-CYMENE (P-ISOPROPYLTOLUENE) 0.04 U 0.04 U 0.04 U 0.04 U 0.04 U 0.04 U 0.04 U 0.04 U 0.04 U 0.04 U 0.04 U 0.04 U
SEC-BUTYLBENZENE 0.04 U 0.04 U 0.04 U 0.04 U 0.04 U 0.04 U 0.04 U 0.04 U 0.04 U 0.04 U 0.04 U 0.04 U
STYRENE 0.04 U 0.04 U 0.04 U 0.04 U 0.04 U 0.04 U 0.04 U 0.04 U 0.04 U 0.04 U 0.04 U 0.04 U
T-BUTYLBENZENE 0.04 U 0.04 U 0.04 U 0.04 U 0.04 U 0.04 U 0.04 U 0.04 U 0.04 U 0.04 U 0.04 U 0.04 U
TETRACHLOROETHYLENE(PCE) 0.04 U 0.04 U 0.04 U 0.04 U 0.04 U 0.04 U 0.04 U 0.04 U 0.04 U 0.04 U 0.04 U 0.04 U
TOLUENE 0.04 U 0.04 U 0.04 U 0.04 U 0.04 U 0.04 U 0.04 U 0.04 U 0.04 U 0.04 U 0.04 U 0.04 U
TRANS-1,2-DICHLOROETHENE 0.04 U 0.04 U 0.04 U 0.04 U 0.04 U 0.04 U 0.04 U 0.04 U 0.04 U 0.04 U 0.04 U 0.04 U
TRANS-1,3-DICHLOROPROPENE 0.04 U 0.04 U 0.04 U 0.04 U 0.04 U 0.04 U 0.04 U 0.04 U 0.04 U 0.04 U 0.04 U 0.04 U
TRICHLOROETHANE 0.04 U 0.04 U 0.04 U 0.04 U 0.04 U 0.04 U 0.04 U 0.04 U 0.04 U 0.04 U 0.04 U 0.04 U
TRICHLOROETHYLENE (TCE) 0.04 U 0.04 U 0.04 U 0.04 U 0.04 U 0.04 U 0.04 U 0.04 U 0.04 U 0.04 U 0.04 U 0.04 U
TRICHLOROFLUOROMETHANE 0.04 U 0.04 U 0.04 U 0.04 U 0.04 U 0.04 U 0.04 U 0.04 U 0.04 U 0.04 U 0.04 U 0.04 U
VINYL CHLORIDE 0.04 U 0.04 U 0.04 U 0.04 U 0.04 U 0.04 U 0.04 U 0.04 U 0.04 U 0.04 U 0.04 U 0.04 U
VOC (mg/kg)LAKE ERIE
1 Not detected at the specified detection limit
TABLE B94: Bulk VOC data on Lake Erie sediments (surface samples collected in May) (OEPA 2015d)

CLA1-1S
TOP BOTTOM TOP BOTTOM TOP BOTTOM TOP BOTTOM TOP BOTTOM TOP BOTTOM TOP BOTTOM TOP
4-CHLOROTOLUENE ND1 ND ND ND ND ND ND ND ND ND ND ND ND ND ND 0.139 0.144
ACETONE ND ND ND 0.156 ND 0.163 0.18 0.223 ND ND ND ND 0.13 ND 0.156 ND ND
CHLOROMETHANE ND ND ND ND ND ND ND ND ND ND ND ND ND ND ND ND ND
METHYL ETHYL KETONE (2-BUTANONE) ND ND ND ND ND ND ND ND ND ND ND ND ND ND 0.055 ND ND
N-BUTYLBENZENE ND ND ND ND ND ND ND ND ND ND ND ND ND ND 0.07 ND ND
SEC-BUTYLBENZENE ND ND ND ND ND ND ND ND ND ND ND ND ND ND 0.058 ND ND
TOLUENE ND ND ND ND ND ND ND ND ND ND ND ND ND ND ND ND ND
1 Not detected at the specified detection limit
TABLE B95: Bulk VOC data on CLA-1 vicinity sediments (core samples collected in June) (OEPA 2015e)
TOP CORE COMPOSITE
BOTTOM CORE COMPOSITE
VOC (mg/kg)
CLA-1 AND ADJACENT AREAS
CLA 1-0 CLA 1-0.5E CLA 1-1.5E CLA 1-0.5W CLA 1-1.5W CLA 1-1N CLA1-2N
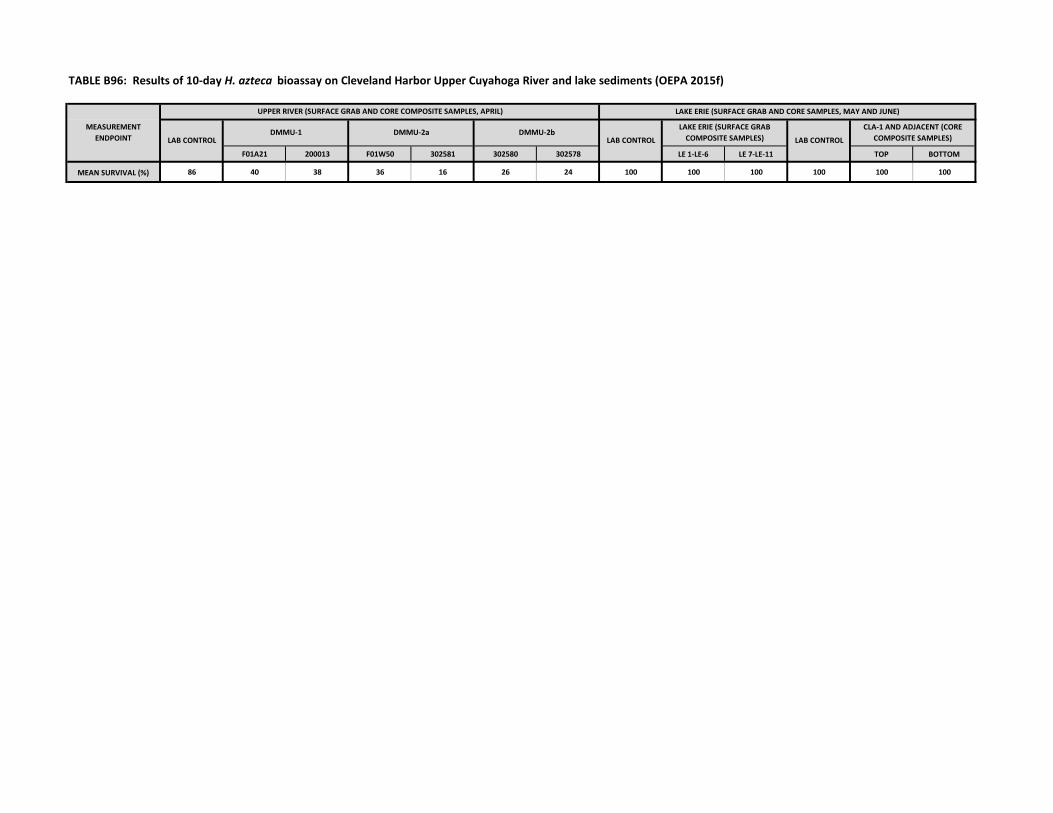
F01A21 200013 F01W50 302581 302580 302578 LE 1-LE-6 LE 7-LE-11 TOP BOTTOM
MEAN SURVIVAL (%) 86 40 38 36 16 26 24 100 100 100 100 100 100
TABLE B96: Results of 10-day H. azteca bioassay on Cleveland Harbor Upper Cuyahoga River and lake sediments (OEPA 2015f)
CLA-1 AND ADJACENT (CORE COMPOSITE SAMPLES)LAB CONTROL
UPPER RIVER (SURFACE GRAB AND CORE COMPOSITE SAMPLES, APRIL)
LAB CONTROL LAB CONTROLDMMU-1 DMMU-2a DMMU-2b
LAKE ERIE (SURFACE GRAB COMPOSITE SAMPLES)
LAKE ERIE (SURFACE GRAB AND CORE SAMPLES, MAY AND JUNE)
MEASUREMENT ENDPOINT

F01A21 200013 F01W50 302581 302580 302578 LE 1-LE-6 LE 7-LE-11 TOP BOTTOM
PCB209 0.16 0.21 0.067 0 U 0 U 0.15 0.41 0.16 0.23 0.25
PCB206 0.28 0.26 0.21 0.19 0.13 0.23 0.21 0.12 0.16 0.18
PCB194 1.2 0.93 1.1 1 0.65 1 0.21 0.14 0.13 0.094
PCB207 0.033 0.025 0.031 0 U 0.026 0.038 0.03 0.031 0.024 0.024
PCB196 0.58 0.44 0.57 0.55 0.33 0.52 0.11 0.053 0.07 0.059
PCB195 0.64 0.48 0.59 0.52 0.34 0.56 0.12 0.084 0.1 0.057
PCB170 3.3 2.7 3.1 2.8 1.8 2.8 0.39 0.26 0.4 0.31
PCB197 0.048 0.046 0.068 0.029 0.019 0.06 0.016 0.015 0.011 0.011
PCB171 1 0.89 1.1 0.89 0.52 0.98 0.12 0.085 0.14 0.13
PCB128 1.1 1.3 1.2 0.82 0.63 1.1 0.3 0.17 0.43 0.43
PCB208 0.086 0.062 0.069 0.053 0.042 0.076 0.11 0.074 0.091 0.13
PCB199 2.1 1.7 1.9 1.7 1 2 0.51 0.44 0.55 0.42
PCB198 2.1 1.7 1.9 1.7 1 2 0.51 0.44 0.55 0.42
PCB172 0.77 0.51 0.63 0.54 0.36 0.6 0.088 0.058 0.076 0.055
PCB200 0.21 0.17 0.19 0.19 0.099 0.21 0.038 0.037 0.045 0.032
PCB201 0.21 0.15 0.17 0.12 0.1 0.21 0.048 0.044 0.059 0.039
PCB177 2.4 2.3 2.6 2.3 1.4 2.4 0.33 0.29 0.34 0.32
PCB175 0.14 0.13 0.19 0.11 0.083 0.16 0.016 0.015 0.018 0.013
PCB174 4.8 4.2 4.8 3.8 2.6 4.2 0.4 0.25 0.4 0.37
PCB173 1 0.89 1.1 0.89 0.52 0.98 0.12 0.085 0.14 0.13
PCB130 0.36 0.43 0.44 0.26 0.27 0.36 0.15 0.1 0.2 0.18
PCB129 13 15 14 11 7.7 12 2.1 1.3 3.6 3.3
PCB176 0.62 0.57 0.68 0.51 0.29 0.62 0.075 0.056 0.084 0.06
PCB132 2.9 3.2 3.5 3.1 2.3 2.7 0.56 0.36 0.87 0.81
PCB131 0.077 0.11 0.13 0.059 0 U1 0.091 0.019 0.013 0.036 0.033
PCB82 0.43 0.55 0.39 0.27 0.23 0.37 0.2 0.12 0.37 0.25
PCB202 0.32 0.25 0.34 0.21 0.17 0.33 0.12 0.086 0.095 0.11
PCB178 0.93 0.89 1.1 0.85 0.48 0.99 0.14 0.12 0.16 0.13
PCB133 0.16 0.18 0.23 0.082 0.12 0.17 0.043 0.038 0.052 0.045
PCB179 2.4 2.2 2.7 2.3 1.4 2.4 0.27 0.22 0.31 0.29
PCB135 8.8 9.5 10 7.4 5.1 10 1 0.65 1.9 1.8
PCB134 0.54 0.72 0.8 0.6 0.41 0.56 0.097 0.07 0.16 0.16
PCB83 1.9 3.1 2 1.2 1.3 1.9 0.9 0.49 1.8 1.4
PCB136 1.8 2 2.4 2.1 1.5 2 0.18 0.17 0.41 0.41
PCB84 0.8 1.2 0.82 0.71 0.91 0.77 0.32 0.16 0.67 0.6
PCB40 1.2 1.7 1.1 1 1.6 0.94 0.2 0.14 0.46 0.27
PCB203 1.1 0.77 0.9 0.8 0.49 0.95 0.29 0.21 0.26 0.22
PCB180 7.1 5.3 5.9 6.2 3.8 5.2 0.57 0.22 0.4 0.35
PCB204 0 U 0 U 0 U 0 U 0 U 0 U 0 U 0 U 0 U 0 U
PCB183 3.6 2.8 3.3 2.9 1.7 3 0.33 0.2 0.39 0.36
PCB182 0 U 0 U 0 U 0.041 0.051 0 U 0 U 0.005 0 U 0.013
PCB181 0.024 0.032 0.035 0 U 0 U 0.021 0 U 0.007 0.006 0 U
PCB137 0.15 0.22 0.13 0.086 0.1 0.15 0.058 0.012 0.052 0.05
PCB138 13 15 14 11 7.7 12 2.1 1.3 3.6 3.3
PCB184 0 U 0 U 0 U 0 U 0 U 0.007 0.004 0 U 0 U 0 U
PCB140 0.064 0.13 0.11 0 U 0 U 0.079 0.031 0.014 0.055 0.052
PCB139 0.064 0.13 0.11 0 U 0 U 0.079 0.031 0.014 0.055 0.052
PCB85 0.6 0.89 0.59 0.35 0.41 0.61 0.27 0.15 0.58 0.47
PCB187 13 14 15 11 6.9 15 1.7 1.2 2.4 2.2
PCB185 3.6 2.8 3.3 2.9 1.7 3 0.33 0.2 0.39 0.36
PCB146 2.2 1.9 2 1.4 1.2 1.8 0.39 0.29 0.57 0.46
PCB141 4.1 2.8 3.1 2.5 1.8 2.4 0.19 0.084 0.19 0.18
PCB188 0 U 0 U 0 U 0 U 0 U 0 U 0 U 0 U 0 U 0 U
PCB186 0 U 0 U 0 U 0 U 0 U 0 U 0 U 0 U 0 U 0 U
PCB149 14 17 19 15 10 16 1.8 1.2 3.5 3.4
PCB148 0 U 0 U 0 U 0 U 0 U 0 U 0 U 0 U 0 U 0 U
PCB147 14 17 19 15 10 16 1.8 1.2 3.5 3.4
PCB144 0.66 0.65 0.91 0.77 0.43 0.72 0.08 0.045 0.15 0.15
PCB143 0.54 0.72 0.8 0.6 0.41 0.56 0.097 0.07 0.16 0.16
PCB142 0 U 0 U 0 U 0 U 0 U 0 U 0 U 0 U 0 U 0 U
PCB97 2.2 3.2 2.3 1.5 1.8 2 0.81 0.45 1.8 1.2
PCB90 6.5 7.8 6.8 5.8 5 5.7 1.4 0.78 3.2 2.4
PCB87 2.2 3.2 2.3 1.5 1.8 2 0.81 0.45 1.8 1.2
PCB86 2.2 3.2 2.3 1.5 1.8 2 0.81 0.45 1.8 1.2
PCB150 0 U 0 U 0 U 0 U 0 U 0.007 0 U 0 U 0 U 0 U
PCB145 0 U 0 U 0 U 0 U 0 U 0 U 0 U 0 U 0 U 0 U
PCB91 0.55 0.84 0.61 0.37 0.52 0.58 0.2 0.14 0.48 0.43
PCB89 0.041 0.078 0.044 0 U 0 U 0.047 0.018 0.01 0.041 0.016
PCB88 0.55 0.84 0.61 0.37 0.52 0.58 0.2 0.14 0.48 0.43
PCB98 0.12 0.22 0.17 0.13 0.085 0.15 0.051 0.029 0.12 0.096
PCB42 0.58 0.9 0.61 0.46 0.63 0.51 0.099 0.074 0.21 0.11
PCB41 1.2 1.7 1.1 1 1.6 0.94 0.2 0.14 0.46 0.27
PCB151 8.8 9.5 10 7.4 5.1 10 1 0.65 1.9 1.8
PCB92 0.81 1.2 1 0.76 0.61 0.95 0.31 0.2 0.62 0.47
PCB152 0 U 0 U 0 U 0 U 0 U 0 U 0 U 0 U 0 U 0 U
PCB94 0.014 0.023 0 U 0 U 0 U 0.026 0 U 0 U 0.015 0 U
PCB93 0.027 0.034 0.1 0.09 0.078 0.034 0 U 0.008 0.033 0.028
PCB44 2.3 3.3 2.3 2.2 3 1.9 0.35 0.24 0.92 0.49
PCB43 0.098 0.15 0.13 0.08 0.19 0.1 0.017 0.007 0.038 0.023
PCB96 0.02 0.036 0.024 0 U 0 U 0.023 0 U 0.006 0.014 0 U
PCB46 0.14 0.19 0.17 0.13 0.25 0.14 0.023 0.017 0.058 0.037
PCB45 0.46 0.71 0.57 0.41 0.85 0.45 0.056 0.04 0.16 0.11
PCB16 0.27 0.27 0.22 0.15 0.39 0.25 0.04 0.023 0.084 0.056
PCB153 13 13 14 11 7.8 11 1.6 1.1 2.5 2.1
PCB154 0 U 0.083 0.11 0 U 0 U 0.059 0.009 0.03 0.044 0.037
PCB99 1.9 3.1 2 1.2 1.3 1.9 0.9 0.49 1.8 1.4
PCB155 0 U 0 U 0 U 0 U 0 U 0 U 0 U 0 U 0 U 0 U
PCB100 0.027 0.034 0.1 0.09 0.078 0.034 0 U 0.008 0.033 0.028
PCB47 2.3 3.3 2.3 2.2 3 1.9 0.35 0.24 0.92 0.49
PCB101 6.5 7.8 6.8 5.8 5 5.7 1.4 0.78 3.2 2.4
PCB103 0.021 0.027 0 U 0 U 0 U 0.036 0 U 0 U 0.03 0.025
PCB102 0.12 0.22 0.17 0.13 0.085 0.15 0.051 0.029 0.12 0.096
PCB49 1.5 2.2 1.5 1.4 2.1 1.2 0.21 0.15 0.61 0.35
PCB48 0.39 0.55 0.42 0.33 0.57 0.31 0.053 0.047 0.15 0.067
PCB104 0 U 0 U 0 U 0 U 0 U 0 U 0 U 0 U 0 U 0 U
PCB51 0.46 0.71 0.57 0.41 0.85 0.45 0.056 0.04 0.16 0.11
PCB50 0.38 0.58 0.39 0.47 0.61 0.34 0.054 0.036 0.15 0.12
PCB17 0.34 0.42 0.3 0.23 0.66 0.33 0.049 0.024 0.12 0.081
PCB52 3.2 4.8 3.4 3.3 4.5 2.7 0.54 0.35 1.7 1.1
PCB53 0.38 0.58 0.39 0.47 0.61 0.34 0.054 0.036 0.15 0.12
PCB18 0.68 0.79 0.59 0.63 1.3 0.63 0.11 0.054 0.24 0.15
PCB54 0 U 0 U 0 U 0 U 0 U 0 U 0 U 0 U 0 U 0 U
PCB19 0.13 0.13 0.086 0.082 0.19 0.12 0 U 0.008 0.033 0.03
PCB4 0.11 0.12 0.09 0 U 0.19 0.11 0.021 0 U 0.021 0.021
PCB205 0.072 0.09 0.09 0.061 0 U 0.088 0.02 0.018 0.016 0.011
PCB189 0.1 0.09 0.091 0.065 0.041 0.094 0.021 0.015 0.02 0.021
PCB191 0.17 0.15 0.22 0.12 0.072 0.17 0.017 0.007 0.011 0 U
PCB190 0.74 0.64 0.75 0.62 0.46 0.74 0.12 0.071 0.13 0.089
PCB157 0.58 0.75 0.63 0.41 0.34 0.57 0.2 0.091 0.28 0.24
PCB156 0.58 0.75 0.63 0.41 0.34 0.57 0.2 0.091 0.28 0.24
PCB158 0.87 1 1 0.79 0.5 0.78 0.15 0.067 0.21 0.21
PCB105 0.94 1.4 0.79 0.53 0.58 0.77 0.41 0.19 0.8 0.62
PCB193 7.1 5.3 5.9 6.2 3.8 5.2 0.57 0.22 0.4 0.35
PCB192 0 U 0 U 0 U 0 U 0 U 0 U 0 U 0 U 0 U 0 U
PCB162 0.013 0.029 0.02 0 U 0 U 0.032 0.013 0.011 0.017 0.012
PCB159 0.11 0.12 0.18 0.14 0.067 0.13 0.009 0.008 0.006 0.011
PCB164 0.89 1 1.1 0.67 0.44 0.88 0.15 0.1 0.25 0.22
PCB163 13 15 14 11 7.7 12 2.1 1.3 3.6 3.3
PCB161 0 U 0 U 0 U 0 U 0 U 0 U 0 U 0 U 0 U 0 U
PCB160 13 15 14 11 7.7 12 2.1 1.3 3.6 3.3
PCB122 0.05 0.077 0.055 0 U 0 U 0.042 0.021 0.014 0.037 0.017
PCB107 0.14 0.29 0.17 0.11 0.13 0.19 0.1 0.054 0.21 0.13
PCB108 0.12 0.19 0.1 0.069 0 U 0.13 0.056 0.034 0.11 0.082
PCB106 0 U 0.005 0 U 0 U 0 U 0 U 0 U 0 U 0 U 0 U
PCB110 4.9 7.1 5 3.5 3.8 4.8 1.9 1 4 3.7
PCB109 2.2 3.2 2.3 1.5 1.8 2 0.81 0.45 1.8 1.2
PCB56 0.79 1 0.64 0.53 0.64 0.54 0.18 0.13 0.39 0.19
PCB55 0.044 0.074 0.09 0 U 0.12 0.051 0.013 0.003 0.024 0.014
PCB165 0.01 0.013 0 U 0 U 0 U 0.006 0 U 0 U 0.003 0 U
PCB111 0 U 0.018 0.006 0 U 0 U 0 U 0.005 0.002 0.007 0 U
PCB95 5.3 7.6 6.4 5.8 4.5 5.8 1.1 0.64 3 2.9
PCB113 6.5 7.8 6.8 5.8 5 5.7 1.4 0.78 3.2 2.4
PCB112 0 U 0 U 0 U 0 U 0 U 0 U 0 U 0 U 0 U 0 U
PCB58 0.005 0.034 0 U 0 U 0 U 0.004 0 U 0 U 0.054 0 U
PCB57 0.012 0.02 0 U 0 U 0 U 0.01 0 U 0 U 0 U 0 U
PCB59 0.22 0.35 0.22 0.17 0.3 0.19 0.044 0.031 0.092 0.071
PCB20 1.3 1.8 1 0.94 1.8 0.89 0.21 0.15 0.44 0.27
PCB167 0.25 0.29 0.25 0.13 0.15 0.25 0.073 0.04 0.1 0.082
PCB168 13 13 14 11 7.8 11 1.6 1.1 2.5 2.1
PCB166 1.1 1.3 1.2 0.82 0.63 1.1 0.3 0.17 0.43 0.43
PCB123 0.045 0.084 0.043 0 U 0.049 0.06 0.018 0.013 0.046 0.048
PCB118 2.4 4.2 2.5 1.6 1.9 2.1 0.99 0.45 2.2 1.6
PCB114 0.062 0.094 0.074 0 U 0 U 0.063 0.018 0.013 0.048 0.036
PCB119 2.2 3.2 2.3 1.5 1.8 2 0.81 0.45 1.8 1.2
PCB115 4.9 7.1 5 3.5 3.8 4.8 1.9 1 4 3.7
PCB66 1.8 2.5 1.5 1.2 1.5 1.2 0.36 0.27 0.9 0.51
PCB60 0.37 0.54 0.34 0.24 0.29 0.27 0.069 0.059 0.17 0.1
PCB124 0.12 0.19 0.1 0.069 0 U 0.13 0.056 0.034 0.11 0.082
PCB120 0.016 0.025 0.007 0 U 0 U 0.007 0.015 0.01 0.015 0.013
PCB125 2.2 3.2 2.3 1.5 1.8 2 0.81 0.45 1.8 1.2
PCB121 0 U 0 U 0 U 0 U 0 U 0 U 0 U 0 U 0 U 0 U
PCB117 0.6 0.89 0.59 0.35 0.41 0.61 0.27 0.15 0.58 0.47
PCB116 0.6 0.89 0.59 0.35 0.41 0.61 0.27 0.15 0.58 0.47
PCB76 2.9 4.2 2.4 1.9 2.8 2.1 0.62 0.4 1.8 0.99
PCB70 2.9 4.2 2.4 1.9 2.8 2.1 0.62 0.4 1.8 0.99
PCB68 0.013 0.016 0.014 0 U 0 U 0.013 0 U 0.003 0.009 0.007
PCB67 0.054 0.067 0.06 0 U 0.045 0.05 0.009 0.009 0.032 0.014
PCB63 0.064 0.11 0.076 0.06 0.081 0.063 0.02 0.01 0.04 0.019
PCB61 2.9 4.2 2.4 1.9 2.8 2.1 0.62 0.4 1.8 0.99
PCB71 1.2 1.7 1.1 1 1.6 0.94 0.2 0.14 0.46 0.27
PCB69 1.5 2.2 1.5 1.4 2.1 1.2 0.21 0.15 0.61 0.35
PCB64 0.92 1.5 0.99 0.91 1.3 0.86 0.18 0.14 0.45 0.28
PCB62 0.22 0.35 0.22 0.17 0.3 0.19 0.044 0.031 0.092 0.071
PCB33 0.39 0.45 0.32 0.27 0.64 0.25 0.082 0.049 0.17 0.1
PCB25 0.12 0.18 0.12 0.072 0.15 0.095 0.013 0.015 0.039 0.013
PCB22 0.35 0.53 0.3 0.28 0.39 0.23 0.051 0.044 0.11 0.06
PCB21 0.39 0.45 0.32 0.27 0.64 0.25 0.082 0.049 0.17 0.1
PCB72 0.019 0.05 0.035 0 U 0 U 0.02 0.008 0.008 0.018 0.01
PCB73 0.098 0.15 0.13 0.08 0.19 0.1 0.017 0.007 0.038 0.023
PCB65 2.3 3.3 2.3 2.2 3 1.9 0.35 0.24 0.92 0.49
PCB34 0 U 0.013 0 U 0 U 0 U 0.005 0.002 0 U 0.005 0 U
PCB26 0.24 0.33 0.21 0.15 0.33 0.18 0.04 0.024 0.086 0.044
PCB23 0 U 0 U 0 U 0 U 0 U 0 U 0 U 0 U 0 U 0 U
PCB27 0.085 0.094 0.091 0.075 0.099 0.083 0.012 0.006 0.027 0 U
PCB24 0.007 0.014 0.012 0 U 0 U 0.018 0 U 0 U 0.004 0 U
PCB6 0.052 0.049 0.03 0.08 0.085 0.052 0.016 0.009 0.029 0.009
PCB5 0 U 0 U 0 U 0 U 0 U 0 U 0 U 0 U 0 U 0 U
PCB74 2.9 4.2 2.4 1.9 2.8 2.1 0.62 0.4 1.8 0.99
PCB75 0.22 0.35 0.22 0.17 0.3 0.19 0.044 0.031 0.092 0.071
PCB28 1.3 1.8 1 0.94 1.8 0.89 0.21 0.15 0.44 0.27
PCB31 1 1.4 0.82 0.84 1.4 0.71 0.14 0.097 0.35 0.2
PCB29 0.24 0.33 0.21 0.15 0.33 0.18 0.04 0.024 0.086 0.044
PCB32 0.39 0.53 0.34 0.28 0.55 0.39 0.035 0.018 0.11 0.064
PCB30 0.68 0.79 0.59 0.63 1.3 0.63 0.11 0.054 0.24 0.15
PCB8 0.17 0.13 0.11 0.15 0.3 0.13 0.037 0.018 0.061 0.042
PCB7 0.011 0.017 0 U 0 U 0 U 0.011 0 U 0 U 0.009 0.014
PCB9 0.011 0.014 0 U 0.034 0 U 0.019 0.008 0.007 0.012 0.017
PCB10 0.013 0.014 0.011 0 U 0 U 0.011 0 U 0 U 0.004 0 U
PCB1 0.008 0 U 0 U 0 U 0 U 0.008 0 U 0 U 0.006 0.008
PCB169 0.025 0.012 0.051 0 U 0 U 0.044 0.016 0.019 0.026 0 U
PCB126 0.013 0.013 0.011 0 U 0 U 0.009 0.003 0.003 0.009 0.008
PCB77 0.13 0.14 0.11 0.072 0.082 0.097 0.05 0.035 0.084 0.044
PCB127 0 U 0.013 0.007 0 U 0 U 0 U 0 U 0 U 0 U 0 U
PCB79 0.016 0.033 0.021 0 U 0 U 0.022 0.009 0.004 0.016 0.017
PCB78 0 U 0 U 0 U 0 U 0 U 0 U 0 U 0 U 0 U 0 U
PCB35 0.015 0.022 0.012 0 U 0 U 0.005 0.01 0.004 0.013 0.009
PCB80 0 U 0 U 0 U 0 U 0 U 0 U 0 U 0 U 0 U 0 U
PCB36 0 U 0.008 0 U 0 U 0 U 0 U 0 U 0 U 0 U 0.012
PCB11 0.056 0.068 0.08 0.21 0.19 0.062 0.054 0.069 0.059 0.081
PCB81 0.009 0.013 0.007 0 U 0 U 0.007 0.002 0 U 0.004 0 U
PCB37 0.28 0.29 0.21 0.18 0.26 0.2 0.067 0.047 0.13 0.076
PCB39 0.008 0.02 0.015 0 U 0 U 0.01 0 U 0.002 0.009 0 U
PCB38 0 U 0.01 0 U 0 U 0 U 0 U 0 U 0 U 0.003 0 U
PCB13 0.022 0.031 0.024 0 U 0.063 0.024 0.009 0 U 0.018 0.014
PCB12 0.022 0.031 0.024 0 U 0.063 0.024 0.009 0 U 0.018 0.014
PCB14 0 U 0.008 0 U 0 U 0 U 0 U 0.003 0 U 0 U 0.007
PCB2 0 U 0 U 0 U 0 U 0 U 0 U 0 U 0.004 0.008 0 U
PCB15 0.12 0.11 0.088 0.057 0.17 0.082 0.037 0.027 0.055 0.03
PCB3 0.005 0.008 0 U 0 U 0 U 0 U 0 U 0.002 0.009 0 U
TOTAL PCBs 311 362 329 263 225 289 56.6 34.9 108 86.2
LIPID (%) 1 0.88 1 1.5 0.77 0.89 0.9 0.64 0.6 0.8
LIPID-NORMALIZED PCBs (µg/kg-lipid) 31052 41093 32934 17534 29196 32469 6285 5457 18043 10780
TABLE B97: L. variegatus tissue PCB data generated from 28-day bioaccumulation testing on Cleveland Harbor Upper Cuyahoga River and Lake sediments (OEPA 2015f)
1 Not detected at the specified detection limit
PCB CONGENER (µg/kg)
LAKE ERIE (SURFACE GRAB AND CORE SAMPLES, MAY AND JUNE)
SURFACE GRAB COMPOSITE SAMPLES CLA-1 AND ADJACENT CORE COMPOSITE SAMPLES
UPPER RIVER (SURFACE GRAB AND CORE COMPOSITE SAMPLES, APRIL)
DMMU-1 DMMU-2a DMMU-2b