Federal Technical Vocational Education and Training (FTVET ...

1 | P a g e
Department of Technical Education & Training
Research report
FOR
Impact of the Trainer Training Program on Teaching
and Learning process in Technical Colleges and
Vocational Training Centers in Sri Lanka
Neville Edirisinghe
H.K.N. Thusharika
P.G.R. Damayanthi

2 | P a g e
Abstract
Technical and vocational education in Sri Lanka has become a crucial sector and
Technical teacher training is the most important area. The University of Vocational
Technology has planned to conduct technical training programs for teachers to develop
skills and competencies of teachers in technical training and education. The research
objective is to identify the effect of Quality of teachers’ Training Programs on Teaching
and Learning Process outcomes in Technical Colleges and Vocational Training Centers
in Sri Lanka. The research problem of the study is “How Quality of teachers’ Training
Programs effect on teaching and learning process outcomes in Technical Colleges and
Vocational Training Centers in Sri Lanka?”. Under research methodology, Formal
survey and In-depth interview were conducted to collect data. The sample size for the
survey was selected from 2014 and 2015 batch. The total teachers participated to the
program is 200 teachers and 35 teachers were selected for the survey. For in-depth
interview, 2 course coordinators were selected. The summary of sampling process is
shown below. The study found that there is a strong impact of Quality of Training
Programs on Teaching and Learning Process outcomes,
Secondly, it highlighted that leaning materials during the training period effects on total
learning outcomes. Thirdly, it found that quality of teaching curriculum for trainees’
effects on total learning outcomes. It is found that there is a high relationship between
Quality of resource persons and their presence and Total Learning outcomes. Then,
capacity of resource persons directly an effect on total learning outcomes. It is found
that there is a high relationship between Quality of assessment methods and materials
and total Learning outcomes. Then, quality of assessment method can effect on total
learning outcomes. In addition to above, it is found that there is a high relationship
between Quality of physical facilities and arrangement and Total Learning outcomes.
Finally, it is found that there is a high relationship between Mode of delivery of teacher
training programs and Total Learning outcomes. It is finally recommended that the
management have to consider these findings to improve quality of teachers training
program.
Key words: Technical and vocational education, Teachers’ training, Outcomes of
teachers

3 | P a g e
Table of Contents Abstract ...................................................................................................................... 2
List of Tables ............................................................................................................. 5
List of Figures ............................................................................................................ 6
CHAPTER 01 ................................................................................................................ 7
INTRODUCTION ......................................................................................................... 7
1.1 Background of the study ................................................................................. 7
1.1.1 Sri Lankan National Education System ....................................................... 7
1.1.2 Technical education in Sri Lanka ................................................................ 9
1.1.3 Profile of National Institute of Technical Education of Sri Lanka (NITESL) and
Teachers’ Training ................................................................................................... 10
1.2 Research Problem ......................................................................................... 11
1.2.1 The problem of the research study ............................................................ 11
1.2.2 Teachers’ Training Program ...................................................................... 12
1.2.3 Research Problem of the study and Research Gap Justification ..................... 13
1.3 Research Objectives of the study .................................................................. 15
1.4 Research Question of the study ..................................................................... 15
1.5 Significance of the Research ......................................................................... 15
1.6 Scope of Study .............................................................................................. 16
CHAPTER 02 .............................................................................................................. 17
LITERATURE REVIEW ............................................................................................ 17
2.1 Introduction to Literature Review ................................................................. 17
2.2 Education system in Sri Lanka ...................................................................... 17
2.2.1 Number of Schools, Teachers, Pupils & Pupil Teacher Ratio by Type of
Schools 19
2.2.2 Performance of Candidates - G.C.E. (O/L) and G.C.E. (A/L) ............... 20
2.2.3 Number Literate and Literacy Rates by Census years & Sex ................ 21

4 | P a g e
2.3 Technical Education and Vocational Training System in Sri Lanka ............ 21
2.4 Importance of Technical Education and Vocational education for Sri Lanka
25
2.5 Students by Institute of Vocational & Technical Training Sector ................ 29
2.6 Income and Expenditure of Vocational & Technical Training Sector .......... 29
2.7 Institutional Development of Vocational and Technical Training Sector ..... 30
2.8 Challenges in Sri Lanka’s TVET System in Sri Lanka ................................. 31
2.9 Overcoming Challenges in the TVET System in Sri Lanka ......................... 32
2.10 National Vocational Qualification System (NVQ) .................................... 33
2.11 Past studies related to Factors affecting the impact of teacher training
programs .................................................................................................................. 34
CHAPTER 03............................................................................................................ 39
METHODOLOGY & DESIGN ................................................................................... 39
3.1 Conceptual model of the study ...................................................................... 39
3.2 Hypotheses of the study ................................................................................ 39
3.3 Research design of the study ......................................................................... 39
3.3.1 Research Approach of the study ................................................................ 39
3.3.2 Time horizon of the study .......................................................................... 40
3.3.3 Research Strategy of the study .................................................................. 40
3.3.4 Unit of analysis .......................................................................................... 41
3.3.5 Sampling process ....................................................................................... 41
3.3.6 Data Analysis and Presentation of the study ............................................. 42
CHAPTER 4 ................................................................................................................ 43
DATA ANALYSIS AND PRESENTATION ............................................................. 43
4.1 Sample profile analysis ...................................................................................... 43
4.1.1 Gender of respondents ............................................................................... 43
4.1.2 Age of respondents .................................................................................... 43

5 | P a g e
4.1.3 Education level of respondents .................................................................. 44
4.1.5 Years of experience of respondents ........................................................... 45
4.2 Correlation Analysis ...................................................................................... 46
4.3 Regression Analysis ...................................................................................... 50
CHAPTER 05 .............................................................................................................. 53
CONCLUSIONS AND RECOMMENDATION ........................................................ 53
5.2 Conclusion of the study ................................................................................. 53
5.3 Recommendation of the study ....................... Error! Bookmark not defined.
5.4 Limitations of the study................................................................................. 53
5.5 Suggestions for future studies ....................................................................... 54
References ................................................................................................................ 55
List of Tables
Table 1. 1 Performance of Candidates - G.C.E. (O/L) and G.C.E. (A/L), 2011-
2015(Number, %) .......................................................................................................... 8
Table 1. 2 Students by Institute of Vocational &Technical Training Sector, 2014 -
2015 9
Table 1. 3 Unemployment rates: 2006 – 2014 ........................................................ 11
Table 1. 4 Composition of Vocational Training and Employment 2002 – 2013 .... 12
Table 1. 5 Students by Institute of Vocational &Technical Training Sector, 2014 -
2015 29
Table 2. 1 Number of Schools, Teachers, Pupils & Pupil Teacher Ratio by Type of
Schools 19
Table 2. 2 Performance of Candidates - G.C.E. (O/L) and G.C.E. (A/L) ............... 20
Table 2. 3 Number Literate and Literacy Rates by Census years & Sex ................ 21
Table 2. 4Table Unemployed number and unemployment rate by gender and sector –
2014.............................................................................................................................. 26
Table 2. 5 Unemployment rate by district - 2014 ................................................... 27
Table 2. 6 Unemployment rate by age group and gender - 2014 ............................ 27

6 | P a g e
Table 2. 7 Unemployment rate by level of education – 2014 ................................. 28
Table 2. 8Unemployment rate and percentage distribution of employment status for
each province – 2014 ................................................................................................... 28
Table 2. 9 Income and Expenditure of Vocational & Technical Training Sector .. 30
Table 2. 10 Institutional Development of Vocational and Technical Training Sector
31
Table 3. 2 Unit of analysis of the study .................................................................. 41
Table 3. 1 Sampling plan of the study .................................................................... 41
Table 4. 1 Correlation Analysis: Correlation matrix............................................... 46
Table 4. 2 Model Summary .................................................................................. 50
Table 4. 3 Anova table ............................................................................................ 51
Table 4. 4 Coefficients of correlation analysis ................................................... 51
List of Figures
Figure 1. 1 General organization on structure of the education system in Sri Lanka 7
Figure 2. 1 General organization structure of the education system in Sri Lanka ... 18
Figure 2. 2National Vocational Qualification (NVQ) System in Sri Lanka ................ 34
Figure 3. 1 Conceptual model of the study .............................................................. 39
Figure 4. 1 Gender of respondents ........................................................................... 43
Figure 4. 2 Age of respondents ................................................................................ 44
Figure 4. 3 Education level of respondents .............................................................. 44
Figure 4. 4 Years of experience of respondents ....................................................... 45
7 | P a g e
CHAPTER 01
INTRODUCTION
1.1 Background of the study
1.1.1 Sri Lankan National Education System
Sri Lanka is a developing country in which the education sector has been identified and
considered as strategic sector for achieving the macro and micro economic goals and
objectives. “Education is considered as a human right in the society and every
person/child has been promoted and opened to access to education” (MOE, 2012).
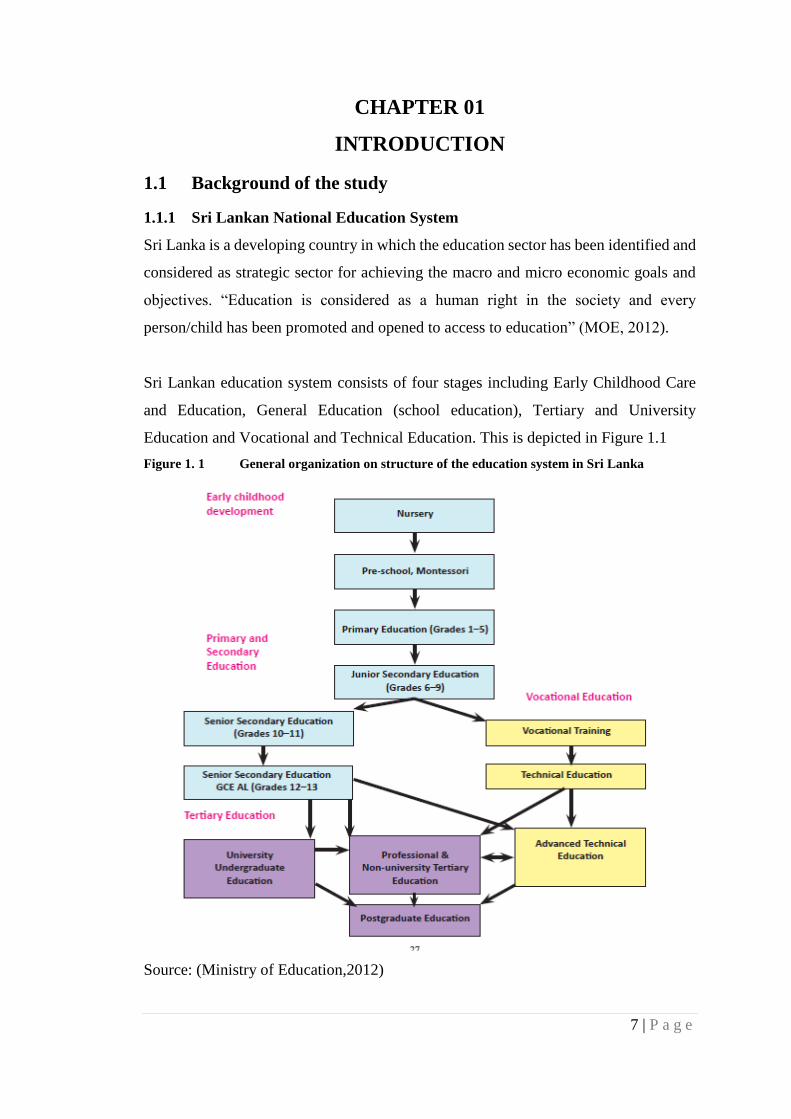
Sri Lankan education system consists of four stages including Early Childhood Care
and Education, General Education (school education), Tertiary and University
Education and Vocational and Technical Education. This is depicted in Figure 1.1
Figure 1. 1 General organization on structure of the education system in Sri Lanka
Source: (Ministry of Education,2012)

8 | P a g e
With the analysis of Sri Lankan education sector, the students can follow the education
through education ladder of G.C.E. (O/L), G.C.E. (A/L) and university educations. It is
shown that 58.68 % of student population are eligible for G.C.E.(A/L) and above 41%
of students do not qualify for G.C.E.(A/L) in 2015.In addition to above, that 62.35 %
of student population are eligible for university education and above 38 % of students
do not qualify for university entrants. In this sense, 4% of student population (Small
percentage) enters to the university (See table 1.1). It is shown that majority of
population left the school education after G.C.E. (O/L) and G.C.E. (A/L) and they face
a problem of continuing higher education or obtaining a job in the job market due to
unfitness to job market requirements
Table 1. 1 Performance of Candidates - G.C.E. (O/L) and G.C.E. (A/L), 2011-2015(Number,
%)
2011 2012 2013 2014 2015
School Candidates sat for the GCE(O/L) 348,143 352,475 287,040 277,414 290,929
Percentage Qualifying for GCE(A/L) 58.09* 62.39* 64.21* 66.55* 78.79*
All Candidates Sat for the GCE(O/L) 443,298 451,039 308,054 298,549 314,635
Percentage Qualifying for GCE(A/L) 56.54* 60.87* 62.42* 64.51* 58.68*
School Candidates sat for the GCE(A/L) 203,928 196,954 209,906 207,304 210,340
School Candidates Qualifying to Enter
University
120,846 124,377 122,913 126,971 131,137
Percentage Qualifying to Enter University 59.26 63.15 58.56 61.25 62.35
Source: (Department of Examinations, 2016)
With the analysis of graduates’ employability, University graduates also do not have an
expected job opportunity due the skills and competencies shortage. Then,
Unemployment rate is about 5% in 2015 and youth unemployment increases gradually.
In addition, above, graduate, under employment has been increased in Sri Lanka. These
situations have become national level issues and it has become the strategic barrier in
economic development, Sri Lanka.
In this sense, Technical and vocational education sector has become so popular in
addressing this issue.

9 | P a g e
1.1.2 Technical education in Sri Lanka
According to reports and statistics of Department of Examination, there is an
institutional system which aims to cater technical education by targeting above
mentioned target audience. This institutional system consists of Department of
Technical Education & Training (DTET), Vocational Training Authority (VTA),
National Apprentice & Industrial Training Authority (NAITA), National Institute of
Business Management (NIBM), University of Vocational technology (UNIVOTEC),
Ceylon German Technical Training Institute (CGTTI) and National Institute of
Fisheries and Nautical Engineering (NIFNE), Sri Lanka Institute of Printing, National
Youth Corps, National Youth Service Council. Table 1.2 shows number of students
who has registered, completed and dropped.
Table 1. 2 Students by Institute of Vocational &Technical Training Sector, 2014 - 2015
Source: (Ministry of Youth Affairs & Skills Development, 2016)
Institute
Year
Establish
shed
Total no. of Students
Intake Completed Dropped
2014 2015 2014 2015 2014 2015
1
1. Dept. Of Technical
Education
& Training (DTET)
1893 22,863 19,864 18,882 15,834 3,981 4,348
2 Vocational Training
Authority(VTA) 1995 28,784 28,745 22,133 24,724 2,157 1,841
3
National Apprentice &
Industrial Training Authority
(NAITA
1990 31464 22878 24250 14203 4026 5455
4
National Institute of
Business Management
(NIBM)
1,968 9,775 9,572 6,370 8,045 425 235
5 University of Vocational
Technology (UNIVOTEC)a 1,999 740 1,870 140 1,448 126 31
6 Ceylon German Technical
Training Institute(CGTTI) 1,959
Full time courses 510 499 318 826 12 20
Part time courses 3,645 3,676 3,161 1,890 484 215
7
National Institute of
Fisheries and
Nautical Engineering
(NIFNE)
1999 1,309 518 991 168 71 56
8 Sri Lanka Institute of
Printing (SLIOP) 1984 942 928 601 346 148 130
9 National Youth Corps 2002 10,311 7,697 8,283 5,226 2,028 2,471
10 National Youth Service
Council 1968 19,575 19,735 14,681 15,177 4,894 4,519

10 | P a g e
1.1.3 Profile of National Institute of Technical Education of Sri Lanka (NITESL)
and Teachers’ Training
Technical education and training sector has become prominent sector in Sri Lankan
education sector. Sri Lankan government has established several organizations for
developing Technical education and training sector including Department of Technical
Education & Training (DTET),Vocational Training Authority(VTA),National
Apprentice & Industrial Training Authority (NAITA) ,National Institute of Business
Management (NIBM), University of Vocational technology (UNIVOTEC), Ceylon
German Technical Training Institute(CGTTI) and National Institute of Fisheries and
Nautical Engineering (NIFNE), Sri Lanka Institute of Printing, National Youth Corps,
National Youth Service Council.
The National Institute of Technical Education of Sri Lanka (NITESL) is an organization
which aims to develop Technical education and training sector by formation of
strategies and initiatives. The National Institute of Technical Education of Sri Lanka
(NITESL) was established on January 8, 1999, under the Parliament Act No.59 of 1998.
NITESL’s vision is “to facilitate the development of demand driven technically skilled
training staff in the technical and vocational education and training sector in Sri Lanka”
and its mission is “to provide services of human resource development, curriculum
development and instructional resource material development, for the technical and
vocational education and training sector in Sri Lanka” (Annual Report of NITESL,
2009).
Technical teacher training is main sector in Technical education and training sector.
Specially, Technical teacher training programs have received much broader attention
as of recently in Sri Lanka. Because, Technical teacher training effects on quality of
outcomes of technical programs and quality of students. With the analysis of success
and failure of training programs, the subject of training with a little or no broader
analysis of the underlying causes for success or failure of such programs. Technical and
vocational education in Sri Lanka has been relatively new and its evolution through the
years has been subject to many constraints and difficulties. These constraints and
difficulties are manly lack of planning, lack of resources, and lack of Training and
development opportunities for teachers.

11 | P a g e
With the analysis of technical teacher training programs, NITESL conducts technical
teacher training programs for trainers who are engaged in teaching at technical
education and vocational training institutions. Initially, The National Institute of
Technical Education of Sri Lanka introduced certificate and diploma level programs
and degree programs were introduced after 2008 with the establishment of the
University of Vocational Technology. Thus this study aims to investigate the impact of
technical trainer training programs conducted by the University of Vocational
Technology (UNIVOTEC) on the teaching and learning process.
1.2 Research Problem
1.2.1 The problem of the research study
Technical and vocational education in Sri Lanka has received greater attention due to
many reasons. Specially, unemployment rate has become the issue and graduate
unemployment, female unemployment, skills gap to meet industry skills and
competency requirements have become strategic concern in the industry. Table 1.3
shows unemployment rate in Sri Lanka in past few years. It is evident that female
unemployment rate is high.
Table 1. 3 Unemployment rates: 2006 – 2014
Year Total
Male Female
2006 6.5 4.7 9.7
2007 6.0 4.3 9.0
2008 5.2 3.6 8.0
2009 5.7 4.3 8.2
2010 4.9 3.5 7.5
2011 4.0 2.7 6.3
2012 3.9 2.8 5.8
2013 4.3 3.2 6.2
2014 4.2 3.2 6.2
(Excluding Northern & Eastern provinces (for the purpose of comparison)

12 | P a g e
Source: Labor Market Information Bulletin, (2002 – 2013)
According to table 1.4, it shows the Composition of Vocational Training and
Employment 2002 – 2013.It indicates that unemployed with Vocational Training are
around 25% and Unemployed without Vocational Training are 70% averagely. It
indicates that technical and vocational education has become the strategic factor and
solution to reduce unemployment rate in the country.
Table 1. 4 Composition of Vocational Training and Employment 2002 – 2013
Unemployed
Persons
2002
(%)
2003
(%)
2004
(%)
2006
(%)
2007
(%)
2008
(%)
2009
(%)
2010
(%)
2011
(%)
2012
(%)
2013
(%)
Unemployed
with
Vocational
Training
28.4 24.8 30.0 25.6 27.8 28.2 29.6 34.1 28.1 26.5 33.5
Unemployed
without
Vocational
Training
71.6 75.2 70.0 74.4 72.2 71.8 70.4 65.9 71.9 73.5 66.5
Total
Unemployed
Persons
100.0 100.0 100.0 100.0 100.0 100.0 100.0 100.0 100.0 100.0 100.0
Source: Labor Market Information Bulletin, (2002 – 2013)
1.2.2 Teachers’ Training Program
Stakeholders in technical and vocation education effects on outcomes of the final
product.
Teacher has become a key stakeholder of knowledge sharing process in technical and
vocational education process. Teacher training has become the key requirement for
improving the performance in the industry and teachers. The University of Vocational
Technology (UNIVOTEC) started teacher training program for trainers (lecturers and
Instructors) to develop skills and competencies of trainers.

13 | P a g e
“The University of Vocational Technology (UNIVOTEC) is established by the
parliamentary Act No. 31 of 2008, and functions under the purview of the Ministry of
Youth Affairs and Skills Development” (UNIVOTEC,2016). “The University of
Vocational Technology facilitates to skilled technicians to maintain the daily
technological functions of the industrial world ensuring the technology runs accurately
and efficiently.
“The University of Vocational Technology has planned to conduct technical training
programs for teachers to develop skills and competencies of technical training and
education. Primary task is to teach technical and vocational skills to their subjects at
various Technical and Vocational Training Colleges in the country. The first batch of
trainees successfully completed their training in 2015. There three objectives of this
teacher training program.
1) To develop professional career of trainers to enhance the professional skills and
competencies.
2) To development teaching methodology and skills to cater knowledge and know
how effectively and efficiently.
3) To provide a path to the higher education and development for trainers
1.2.3 Research Problem of the study and Research Gap Justification
The success of trainer training programs depends on successful planning and
continuous resource provision. In addition, feedback from trainees and future
prospects determine the extent and nature of success. An impact assessment
effort of trainer training programs on teaching and learning process needs to be
based on these aspects. The problem of impact assessment is essentially
associated with the level of orientation that future trainers (current trainees)
manage to achieve against the backdrop of constraints. Thus, there is an

14 | P a g e
identifying constraint is a very important part of the process of impact
assessment. It must also be noted that impact is not always positive. It can be
negative as well.
The successful management of teacher training programs would determine the
extent of impact of the respective programs. Currently there is an apparent lack
of an objective driven approach to manage and access the impact of these
programs on the teaching and learning process. The first batch of trainees
successfully completed their training in 2015.UNIVOTEC’s current efforts are
highly oriented towards achieving positive outcomes.
Thus, there is a need of conducting a comprehensive study for examining the
impact of teacher Training Programs on Teaching and Learning Process in
Technical Colleges and Vocational Training Centers in Sri Lanka. The findings
of the study can be used to formulate strategic initiatives for developing the
Technical and vocational education.
The teachers perceive the training programs in different level and ways and it
decides teachers’ effectiveness and performance at the career. Thus, there
should be a system to measure the teacher program quality and outcomes under
accepted criteria.
There is no formal system to measure the teacher program quality and outcomes
by UNIVOTEC.
The poor teaching performance effects on quality of students and their behavior.
It may lead to low job orientation.

15 | P a g e
Thus, Research problem of the study is “How Quality of teachers’ Training
Programs effect on teaching and learning process outcomes in Technical Colleges
and Vocational Training Centers in Sri Lanka?”
1.3 Research Objectives of the study
To identify the effect of Quality of teachers’ Training Programs on Teaching and
Learning Process outcomes in Technical Colleges and Vocational Training Centers in
Sri Lanka.
1.4 Research Question of the study
What is the effect of Quality of teachers’ Training Programs on Teaching and Learning
Process outcomes in Technical Colleges and Vocational Training Centers in Sri Lanka?
1.5 Significance of the Research
1 This study provides the practical and academic significance to industry
stakeholders. Specially, findings of this study can be used for decision making
process for officers and decision makers in Technical and vocational education in
Sri Lanka.
2 The findings, conclusion and recommendations of this study can be used for
Department of Technical Education & Training (DTET),Vocational Training
Authority(VTA),National Apprentice & Industrial Training Authority (NAITA)
,National Institute of Business Management (NIBM), University of Vocational
technology (UNIVOTEC), Ceylon German Technical Training Institute(CGTTI)
and National Institute of Fisheries and Nautical Engineering (NIFNE), Sri Lanka
Institute of Printing, National Youth Corps and National Youth Service Council.
3 There is a lack of research studies for academic scholars. Then, this study provides
a valid contribution for filling academic gap through the study.

16 | P a g e
1.6 Scope of Study
This study aims to examine the effect of Quality of teachers’ Training Programs on
Teaching and Learning Process outcomes in Technical Colleges and Vocational
Training Centers in Sri Lanka (Special emphasis to DTET).
The data will be collected from three samples including data from 40
instructors/lecturers in DTET. This study has ignored samples of instructors/lecturers
in NITA, NISC, VTA and CGTTI
Survey and in-depth interview were conducted by following deductive research
approach the time horizon of the study is one time and short time period. This study
takes cross sectional approach for data collection.

17 | P a g e
CHAPTER 02
LITERATURE REVIEW
2.1 Introduction to Literature Review
Literature review is the examination and analysis of secondary evidences which are
related to the study that the researcher concern. According to (Saunders, 2009),
“Literature review is critical examination of existing body of knowledge in relation to
the current study that the researcher concerns”. The perseverance of this literature
review is “to regulate the extent to which the topic under study is covered in the existing
body of knowledge” (Babbie, E. & Mouton, J, 2001). This study aims to study articles,
books, journals, newspapers, magazines, conference proceedings, doctoral
dissertations, master ‘s theses, government publications, and financial, marketing, and
other reports from different internal and external sources.
2.2 Education system in Sri Lanka
Education system of a country is very important topic and it has become the backbone
of socio and economic development. (Corperate website of Minsitry of
Education,2016) mentioed that Sri Lanka provides free-education from primary stage
to first university education. The national education policy is formulated on the
recommendations of the National Education Commission (NEC) established under an
Act of Parliament. National Education Commission functions under Presidential
Secretariat to provide necessary recommendations to the president and authorities. Sri
Lanka has identified education and basic need of human being and it is considered as
the basic human right of the people. Sri Lankan government has declared as education
is compulsory requirement for 5 to 14 years and it expects to increase the upper age
limit to 16 years as policy decision. NIE stated that different stages of education can be
categorized Early Childhood Care and Education, General Education (school
education), Tertiary and University Education and • Vocational and Technical
Education.

18 | P a g e
Figure 2. 1 General organization structure of the education system in Sri Lanka
Source: (NEC, 2016)
“Early Childhood Care and Education has been identified as critical sector and it
provides an importance of the early years in the physical, mental, social and emotional
development of a child” (NEC, 2016). Sri Lankan government has formulated a
National Policy on Early Childhood Care and Development. According to this policy,
the central governments will lay down national policy guidelines including the
standards to be maintained by pre-school institutions. The provincial councils will be
responsible for regulating the pre-school institutions functioning in their province
(NEC, 2016).

19 | P a g e
The first five years of schooling at the primary stage of education is crucial to lay a firm
Foundation for the subsequent learning of the child. The integrated primary curriculum
is based on four main subject areas of Language (mother tongue), Mathematics,
Environment related activities and Religion (NEC, 2016).
The secondary stage of eight years is further sub-divided into three levels including
junior secondary level from grade six to grade nine, senior secondary level leading to
GCE OL; and senior secondary level leading to GCE AL. Junior secondary level
includes grade 1 to 9 levels and at present education is compulsory from grade one to
nine. Around 93 per cent of students attending school complete grade nine. After
completing the four-year junior secondary level at grade nine, students proceed to GCE
OL class at grade ten. This course is of two years’ duration and at the end the students
sit a public examination, the GCE OL. The curriculum consists of six core subjects and
three or four optional subjects selected from several groups of subjects. Students who
pass in six subjects with first language, mathematics and three subjects at credit or
higher level qualify to follow the GCE AL course. Approximately 60 per cent of
students qualify to proceed to GCE AL grade. The GCE AL course is of two years’
duration and constitutes the final stage of secondary Education. It is an attainment
examination as well as a selection examination for university admission (NEC, 2016).
2.2.1 Number of Schools, Teachers, Pupils & Pupil Teacher Ratio by Type of Schools
Total number of schools has been increased gradually and total number of teachers in
Government Schools, Private Schools and Pirivenas and Total Number of Pupils have
been increased year by year. With the analysis of Number of Schools, Teachers, Pupils
& Pupil Teacher Ratio by Type of Schools, it can be seen a positive progress of all
indicators.
Table 2. 1 Number of Schools, Teachers, Pupils & Pupil Teacher Ratio by Type of Schools
2012 2013 2014 2015*
Total Number of Schools 10,737 10,849 10,971 11,010
Government Schools(a) 9,905 10,012 10,121 10,157
Private Schools 98 103 103 104
Pirivenas 734 734 747 749
Total Number of Teachers 235,924 239,848 242,596 245,654
Government Schools(b) (c) 223,724 227,469 229,664 231,803

20 | P a g e
Private Schools 6,114 6,317 6,471 7,075
Pirivenas 6,086 6,062 6,461 6,776
Total Number of Pupils 4,194,336 4,233,555 4,272,695 4,301,331
Government Schools(a) 4,004,059 4,037,095 4,078,401 4,100,497
Private Schools 125,669 130,344 131,397 136,228
Pirivenas 64,608 66,116 62,897 64,606
Pupil Teacher Ratio 18 18 18 18
Government Schools(a)
Private Schools 21 21 20 19
Pirivenas 11 11 10 10
New Admission to Government
Schools 339,143 342,451 339,569 ..
Source: (Ministry of Education, 2016)
2.2.2 Performance of Candidates - G.C.E. (O/L) and G.C.E. (A/L)
With the analysis of student performance of G.C.E. (O/L) and G.C.E. (A/L), It is shown
that 58.68 % of student population are eligible for G.C.E. (A/L) and above 41% of
students do not qualify for G.C.E. (A/L) in 2015 and 62.35 % of student population are
eligible for university education and above 38 % of students do not qualify for
university entrants. Out of all students, little percentage is eligible for university
entrants. It is shown that performance of candidates for G.C.E. (O/L) and G.C.E. (A/L)
is satisfactory and it is increasing year by year.
Table 2. 2 Performance of Candidates - G.C.E. (O/L) and G.C.E. (A/L)
(Number,
%)
2011 2012 2013 2014 2015
School Candidates sat for the GCE(O/L) 348,143 352,475 287,040 277,414 290,929
Percentage Qualifying for GCE(A/L) 58.09* 62.39* 64.21* 66.55* 78.79*
All Candidates Sat for the GCE(O/L) 443,298 451,039 308,054 298,549 314,635
Percentage Qualifying for GCE(A/L) 56.54* 60.87* 62.42* 64.51* 58.68*
School Candidates sat for the GCE(A/L) 203,928 196,954 209,906 207,304 210,340
School Candidates Qualifying to Enter
University 120,846 124,377 122,913 126,971 131,137
Percentage Qualifying to Enter University 59.26 63.15 58.56 61.25 62.35

21 | P a g e
All Candidates Applied for the GCE(A/L) 287,915 271,948 277,395 290,517 302,501
All Candidates Sat for the GCE(A/L) 239,775 233,634 241,629 247,376 255,191
All Candidates Qualifying to Enter University 141,411 144,745 140,993 149,489 155,447
Percentage Qualifying to Enter University 58.99 61.95 58.35 60.43 60.91
Source: (Ministry of Education, 2016)
2.2.3 Number Literate and Literacy Rates by Census years & Sex
With the analysis of Literacy rate, it shows a progress year by year and Sri Lankan
government has given more attention year by year for improving Literacy rate and
education sector as a strategic sector in the country.
Table 2. 3 Number Literate and Literacy Rates by Census years & Sex
Censu
s
year
Population (’000) No. Literate(’000) Percentage Literate
Male Female Total Male Female Total Male Female To
tal
1953 3,110 2,693 5,803 2,510 1,496 4,006 80.7 55.6 69.0
1963 3,952 3,571 7,523 3,385 2,404 5,789 85.6 67.3 77.0
1971 4,839 4,515 9,354 4,143 3,201 7,344 85.6 70.9 78.5
1981 5,768 5,541 11,309 5,257 4,608 9,866 91.1 83.2 87.2
2001(a) 6,937 7,069 14,006 6,423 6,340 12,763 92.6 89.7 91.1
2012 8,046 8,736 16,782 7,807 8,304 16,111 96.8 94.6 95.6
Source: (Ministry of Education, 2016)
2.3 Technical Education and Vocational Training System in Sri
Lanka
“Technical Education and Vocational Training System is identified as the one of main
sector in national education sector” (NEC, 2016). Technical Education and Vocational
Training System consists of agencies, Institutions, public and private sectors, standards
and curriculum development agencies and regulatory bodies under Ministry of Youth
Affairs and Skills Development. These are Department of Technical Education &
Training (DTET), Vocational Training Authority (VTA), National Apprentice &
Industrial Training Authority (NAITA), National Institute of Business Management

22 | P a g e
(NIBM), University of Vocational technology (UNIVOTEC), Ceylon German
Technical Training Institute (CGTTI) and National Institute of Fisheries and Nautical
Engineering (NIFNE), Sri Lanka Institute of Printing, National Youth Corps, National
Youth Service Council etc.
“Department of Technical Education &Training (DTET) manages Technical Colleges
which are outside the SLIATE. There are approximately 17,000 trainees enrolled in the
colleges run by this department” (Ministry of Education, 2016). Department of Technical
Education and Training (DTET) operates 38 Technical Colleges throughout the country as
at end: of 2009, of which nine (09) Colleges have been upgraded as Colleges of Technology
(CoTs) to offer diploma level courses leading to National Vocational Qualifications”. The
Technical Education Development Project (TEDP) funded by the Asian Development Bank
provides funding for this initiative. The Korean International Cooperation Agency
(KOICA) also provides funds in this program.
“The Tertiary and Vocational Education Commission (TVEC) was established under
the Provisions of the Tertiary and Vocational Education Act No. 20 of 1990 and it
engage in policy development, planning, co-ordination and the development of tertiary
and vocational education at all levels” (UNESCO, 2015). It is committed to developing
a nationally recognized system for granting of tertiary and vocational education awards;
and maintaining academic and training standards in institutes, agencies and all other
establishments providing tertiary education and vocational education.
“The University of Vocational Technology (UNIVOTEC) is first vocational education
university in Sri Lanka which was established for the TVET sector by repealing act of
National Institute of Technical Education of Sri Lanka (NITESL)” (UNESCO, 2015).
The main objective of UNIVOTEC to provide progressive upward movement to the
students in the technical education and vocational training system, based on their
aptitudes and abilities, to acquire university education. According to (UNESCO, 2015)
Secondary objectives of UNIVOTEC are: (1) to provide pedagogical training up to
degree level for trainers serving in the technical and vocational education sector and
industry; (2) to provide courses of study for middle level technical personnel, with
qualifications acceptable for admission to UNIVOTEC, up to degree level; (3) to
provide courses of study for those with National Vocational Qualifications to upgrade

23 | P a g e
their competencies and acquire a degree level qualifications; and (4) to provide
extension courses on continuous professional development.
“The Vocational Training Authority (VTA) which was established under Vocational
Training Authority of Sri Lanka Act. No. 12 of 1995 provides skills training to rural
Youth through a network of 6 National Vocational Training Institutes, 22 District
Vocational Training Centers and 218 Rural Vocational Training Centers” (UNESCO,
2015).
“The National Apprenticeship and Industrial Training Authority (NAITA) is also a
body in vocational education which was established as the National Apprenticeship
Board under the National Apprenticeship Act. No. 49 of 1971 and was renamed under
the Tertiary and Vocational Education Act No. 20 of 1990 as the National
Apprenticeship and Industrial Training Authority” (UNESCO, 2015). NAITA conducts
island-wide training programs aimed at small, medium and large scale enterprises.
“The National Institute of Business Management (NIBM) was established in 1968 and
Later incorporated into the Act of Parliament No.23 of 1976 and It expanded the
capacity by establishing NSBM as the first Green university in Sri Lanka” (UNESCO,
2015). The Institute provides training courses for public and private institutions on
computer usage, consultancy services and productivity improvement.
“The Skills Development Fund Ltd. (SDFL) is a collective enterprise of the government
and the private sector” (UNESCO, 2015). The Fund was established in 1999 to fulfill
the human resource Development needs of employers. This fund aims to develop of
skills of employees. It is a self-funded organization governed by a Board of Directors.
“Ceylon German Technical Training Institute (CGTTI) is a pioneer vocational and
technical education body in Sri Lanka and it caters a most reputed vocation and
technical education courses to meet industry demand” (UNESCO, 2015). The main
objective of the Ceylon German Technical Training Institute is to develop automobile
technology and other technical trades. The Institute provides automobile training and
aims to be considered a center of excellence for training in the automotive sector.
24 | P a g e
“The National Youth Services Council (NYSC) is a body in vocational and technical
education which was established by Parliamentary Act No.69 of 1979 and The Council
implements annual youth programs and projects related to developing creativity,
artistic, technical and leadership skills; and works to encourage participation in
volunteer programs” (UNESCO, 2015).
“The National Human Resources Development Council (NHRDC) is in charge of
preparing human resource development policies, implementing the human resource
development plan, conducting studies, research and surveys and running seminars and
workshops related to human resource development” (UNESCO, 2015).
“The National Youth Award Authority (NYAA) is a body in vocational and technical
education and it works to improve attitudes among young people” (UNESCO, 2015).
It awards internationally recognized certificates and medals to youth and creates
opportunities to improve their international experience. The Authority runs training
programs in schools.
The National Youth Corps was initiated in 2003 by Parliamentary Act No. 21 of 2002.
“The National Youth Corps encompasses 43 regional training centers that offer courses
on personal development, career guidance, national heritage, beauty skills and job-
oriented vocational skills of youth population” (UNESCO, 2015).
“Youth Services Ltd. was established under the guidance and financial aid of the
National Youth Services Council in order to raise funds to implement youth projects
and to design training programs to enhance youth employability” (UNESCO, 2015).
“The International Centre for Training of Rural Leaders (ICTRL) assists in making
training services, offered by governmental and nongovernmental organizations,
efficient and effective” (UNESCO, 2015).
“The Sri Lanka Institute of Printers (SLIOP) was established with the objective of
improving quality of the printing industry” (UNESCO, 2015). It offers training on

25 | P a g e
printing technologies and management; and fosters knowledge on new technologies
through international cooperation.
“The National Institute of Fisheries and Nautical Engineering (NIFNE), established in
1999 by Parliamentary Act. No.36 is an educational and training institute in fisheries
and related areas and The Institute presently offers a number of distance, certificate and
diploma courses; and three degree programs” (UNESCO, 2015)
“The National Youth Services Cooperative Ltd. (NYSCO) encourages youth
entrepreneurs by providing entrepreneurship training, loan schemes and career
guidance for self-employment; and advice on obtaining credit from conventional
banks” (UNESCO, 2015).
2.4 Importance of Technical Education and Vocational education
for Sri Lanka
“The unemployment rate in Sri Lanka fell to 4.1% in the fourth quarter of 2013,
according to the latest data released by the Department of Census & Statistics and the
overall unemployment rate reported for females was 6.4% and it was 2.8% for males”
(CBSL, 2015). The highest unemployment rate was reported from the G.C.E (A/L) and
above group, which was about 8.1%. The survey results also revealed that
unemployment among females is higher than that among males in all age groups. The
estimated economically active population was about 8.7 million in the fourth quarter of
2013, of which 64.6% were males and 35.4% were females. Out of the economically
inactive population, 25.1% were males and 74.9% were females. The total number of
employed persons in Sri Lanka was estimated at about 8.3 million in the fourth quarter
of 2013, of which about 44.2% are engaged in the Service sector, 25.2% in the
Industries sector and 30.6% in the Agriculture sector (CBSL, 2015).
Sri Lanka’s unemployment rate in the third quarter of 2015 (3Q15) rose to 5 percent
from 4.2 percent in December 2014 and 4.5 percent in the second quarter of 2015.
Persons available and/or looking for work, and who did not work and taken steps to
find a job during last four weeks and ready to accept a job given a work opportunity
within next two weeks are said to be unemployed. Overall unemployment rate reported
26 | P a g e
for females was 7.8 percent and it was 3.5 percent for male. Youth unemployment rate
15 – 24 years reported for the third quarter 2015 was 22.9 percent and that reports the
highest unemployment rate among all age groups. Further rates for both males and
females were 20.3 and 26.8 percent respectively, for age group 15-20.
The survey results further revealed that the unemployment among females was higher
than that of males, in all age groups. Youth and female unemployment contribute more
to the overall unemployment of the country. The highest unemployment rate was
reported from the G.C.E (A/L) and above group which was about 10.1 percent.
Corresponding percentages were 6 percent and 14.1 percent for males and females,
respectively. Female unemployment rates were higher than those of males in all levels
of education. This further shows that the problem of unemployment is more acute in
the case of educated females than educated males, which was observed consistently
over the results of previous survey rounds as well. Out of the 5.5 million employed
population, the survey estimates showed that over 45 percent of the labor force were in
the services sector while 27.4 percent and 27.2 percent were in the agriculture and
industries sectors, respectively. According to statistics of Census and Statistics, Sri
Lanka has faced a problem of unemployment among different age categories. In
addition to this, under employment has become the issue in Sri Lanka. On other hand,
Unemployment and under employment among graduates also increased gradually.
Thus, the demand for technical and Vocational education in Sri Lanka has been
increased dramatically
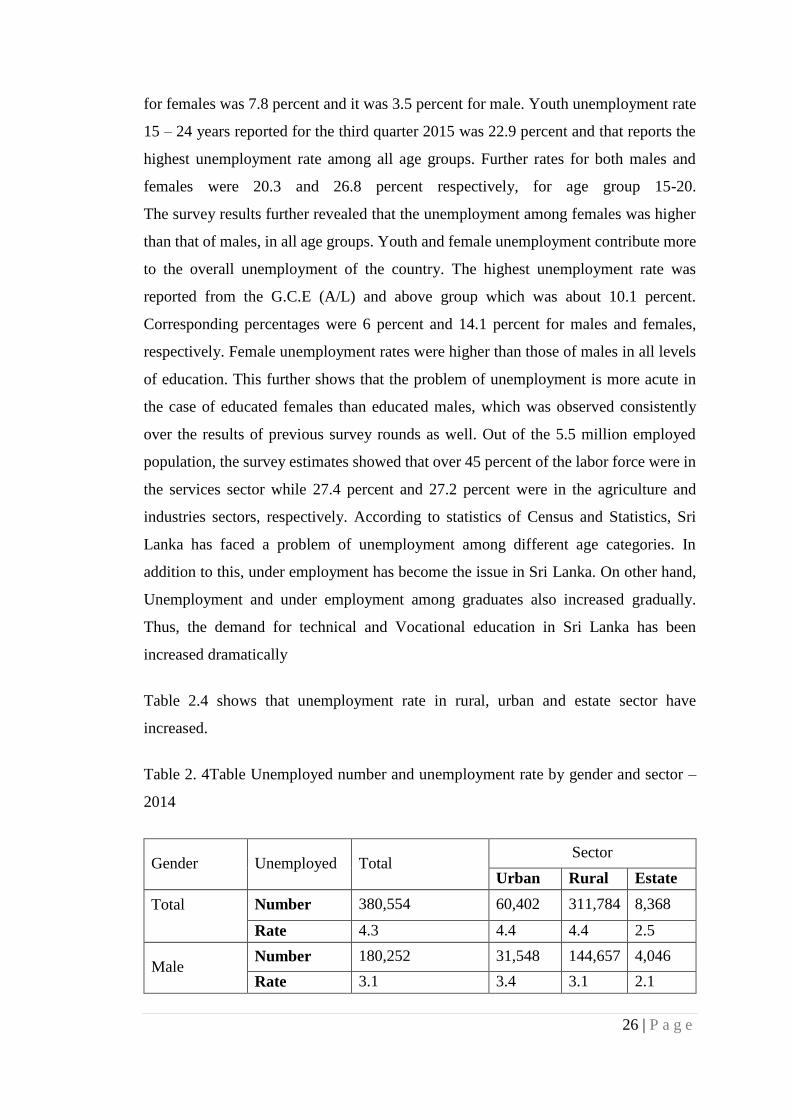
Table 2.4 shows that unemployment rate in rural, urban and estate sector have
increased.
Table 2. 4Table Unemployed number and unemployment rate by gender and sector –
2014
Gender Unemployed Total Sector
Urban Rural Estate
Total
Number 380,554 60,402 311,784 8,368
Rate 4.3 4.4 4.4 2.5
Male Number 180,252 31,548 144,657 4,046
Rate 3.1 3.4 3.1 2.1

27 | P a g e
Female Number 200,303 28,854 167,127 4,322
Rate 6.5 6.6 6.7 2.9
Source: Labor Market Information Bulletin, (2002 – 2013)
According to table 2.5, it shows, there is high unemployment rate at the district level.
Table 2. 5 Unemployment rate by district - 2014
District Un-emp rate
(%) District
Un-emp rate
(%)
Colombo 3.7 Kilinochchi 7.6
Gampaha 3.7 Batticaloa 3.9
Kalutara 3.9 Ampara 6.0
Kandy 5.0 Trincomalee 4.3
Matale 5.2 Kurunegala 3.5
Nuwara Eliya 2.9 Puttalam 5.3
Galle 4.6 Anuradhapura 3.1
Matara 6.9 Polonnaruwa 3.7
Hambantota 6.7 Badulla 3.0
Jaffna 5.6 Monaragala 2.7
Mannar 2.9 Rathnapura 3.7
Vavunia 3.9 Kegalle 7.8
Mullativu 5.6
Source: Labor Market Information Bulletin, (2002 – 2013)
According to table 2.6, It shows youth unemployment remains at a high rate.
Table 2. 6 Unemployment rate by age group and gender - 2014
Age group (Years) Total Gender
Male Female
Total 4.3 3.1 6.5
15 - 24 20.3 16.2 27.5
25 - 29 8.3 5.8 12.5
30 - 39 2.7 1.5 4.9
Over 40 0.9 0.7 1.3
Source: Labor Market Information Bulletin, (2002 – 2013)

28 | P a g e
Table 2.7 shows that unemployment level in.G.C.E. (A/L) & above is higher than other
age categories.
Table 2. 7 Unemployment rate by level of education – 2014
Level of Education Total Gender
Male Female
Total 4.3 3.1 6.5
Grade 5 & Below 0.9 0.6 1.3
Grade 6-10 3.4 2.9 4.5
G.C.E. (O/L) 5.9 4.4 8.9
G.C.E. (A/L) & above 8.1 5.3 11.0
Source: Labor Market Information Bulletin, (2002 – 2013)
Table 2.8 shows that Unemployment rate and percentage distribution of employment
status for each province
Table 2. 8Unemployment rate and percentage distribution of employment status for each province –
2014
Province Unemployment
rate
Employment status
Total Paid
employee Employer
Own
Account
Worker
Contributing
Family Worker
Total 4.3 100.0 56.4 2.8 31.9 8.9
Western 3.7 100.0 68.3 4.0 23.5 4.2
Central 4.3 100.0 57.9 2.2 30.1 9.7
Southern 5.9 100.0 55.2 3.2 33.1 8.5
Northern 5.3 100.0 60.8 2.7 33.6 2.9
Eastern 4.9 100.0 57.8 1.7 37.5 3.0
North Western 4.0 100.0 50.3 3.1 35.8 10.7
North Central 3.3 100.0 34.9 0.5 43.6 20.9
Uva 2.9 100.0 36.8 0.7 40.5 21.9
Sabaragamuwa 5.5 100.0 55.8 2.5 33.7 8.1
Source: Labor Market Information Bulletin, (2002 – 2013)

29 | P a g e
2.5 Students by Institute of Vocational & Technical Training Sector
With the analysis of above, it shows 12,992 are registered in 2014 and 11,598 in 2015
avaragely.9981 of students in 2014 and 8,789 of students in 2015 completed the
relevant courses. Averagely, it takes 76% of average completion rate. Averagely, 1,835
of students in 2014 and 1,932 of students in 2015 are dropped the course due to many
reasons. It takes averagely 20% annually.
Table 1. 5 Students by Institute of Vocational &Technical Training Sector, 2014 - 2015
Source: (Ministry of Youth Affairs & Skills Development, 2016)
2.6 Income and Expenditure of Vocational & Technical Training
Sector
Table 2.4 shows that income and expenditure of all institutes including Department of
Technical Education & Training (DTET),Vocational Training Authority(VTA),
National Apprentice & Industrial Training Authority (NAITA) ,National Institute of
Business Management (NIBM), University of Vocational technology (UNIVOTEC),
Institute
Year
Establish
shed
Total no. of Students
Intake Completed Dropped
2014 2015 2014 2015 2014 2015
1 1. Dept. Of Technical Education
& Training (DTET) 1893 22,863 19,864 18,882 15,834 3,981 4,348
2 Vocational Training
Authority(VTA) 1995 28,784 28,745 22,133 24,724 2,157 1,841
3
National Apprentice &
Industrial Training Authority
(NAITA
1990 31464 22878 24250 14203 4026 5455
4 National Institute of
Business Management (NIBM) 1,968 9,775 9,572 6,370 8,045 425 235
5 University of Vocational
Technology (UNIVOTEC)a 1,999 740 1,870 140 1,448 126 31
6 Ceylon German Technical
Training Institute(CGTTI) 1,959
Full time courses 510 499 318 826 12 20
Part time courses 3,645 3,676 3,161 1,890 484 215
7 National Institute of Fisheries and
Nautical Engineering (NIFNE) 1999 1,309 518 991 168 71 56
8 Sri Lanka Institute of Printing
(SLIOP) 1984 942 928 601 346 148 130
9 National Youth Corps 2002 10,311 7,697 8,283 5,226 2,028 2,471
10 National Youth Service Council 1968 19,575 19,735 14,681 15,177 4,894 4,519

30 | P a g e
Ceylon German Technical Training Institute(CGTTI) and National Institute of
Fisheries and Nautical Engineering (NIFNE), Sri Lanka Institute of Printing, National
Youth Corps, National Youth Service Council. According to this table. There is an
increasing trend of income and expenditure.
Table 2. 9 Income and Expenditure of Vocational & Technical Training Sector
Year
Total Income (Rs.Mn) Total Expenditure(Rs.Mn)
Institute
Govt. Grant Fees & Other
Capital
Recurrent
Establish-
2014 2015
2014 2015 2014 2015 2014 2015
shed
1. Dept.of Technical Education
}
& Training (DTET) 1893 1,225 1,919.20 28 9.21 187 321.34 1,313 1,597.77
2. Vocational Training Authority(VTA) 1995 1,129 1,307 150 140 204 121.5 1,075 1,162
3. National Apprentice &
Industrial Training Authority (NAITA)}1990 845.50 801.76 64.27 51.2 147.98 59.35 708.28 685
4. National Institute of
}
Business Management (NIBM) 1968 - - 705.87 601 67.05 65.92 434.99 554.6
5. University of Vocational
Technology (UNIVOTEC)a} 1999 222.10 229.99 27.90 29.61 102.41 77.61 143.73 254.57
6. Ceylon German Technical
}
Training Institute(CGTTI) 1959 211.18 252.7 - 21 71.31 56 168.66 170
7. National Institute of Fisheries and
} 1999
Nautical Engineering (NIFNE) 198 306.88 41.1 37.07 98 92.96 189 139
8. Sri Lanka Institute of Printing (SLIOP) 1984 - - 16.34 16.67 1.52 1.16 14.28 11.65
9. National Youth Corps 2002 646.55 556.39 .. .. 98.64 52.50 554.46 508.18
10.National Youth Service Council 1968 1,246.53 1,247.00 .. .. 181.00 157.00 1,132 1,248
Source : Ministry of Youth Affairs & Skills Development 83
Source: (Ministry of Youth Affairs & Skills Development,2016)
2.7 Institutional Development of Vocational and Technical Training
Sector
Table 2.5 shows that Institutional Development of Vocational and Technical Training
Sector, Sri Lanka .it shows number of centers and number of courses (fulltime and part
time), strengths of employees (Academic and nonacademic) in year 2014 and
2015.According to this, there is an increasing trend of centers, courses and employee’s
year by year.

31 | P a g e
Table 2. 10 Institutional Development of Vocational and Technical Training Sector
No. of No. of Courses Strength of Employees
Institute Centers Part time Full time Academic Non Academic
2014 2015 2014 2015 2014 2015 2014 2015 2014 2015
1.
Dept.of Technical
Education
}
39 39 18 19 62 64 494 490 1,805 2,174
& Training (DTET)
2. Vocational Training Authority(VTA) 248 247 32 32 81 83 1,344 1308 561 586
3. National Apprentice &
Industrial Training Authority
(NAITA)} 77 77 21 13 219 121 114 446 773 434
4. National Institute of
Business Management (NIBM)
} 05 05 25 39 35 21 48 56 115 132
5 University of Vocational
Technology (UNIVOTEC)a} 01 01 16 15 04 06 39 43 112 111
6. Ceylon German Technical
Training Institute(CGTTI) }
}
02 02 35 37 10 10 146 150 74 87
7.
National Institute of Fisheries
and
Nautical Engineering (NIFNE) 08 08 06 02 35 16 20 40 175 167
8. Sri Lanka Institute of Printing 02 02 17 17 01 01 06 03 05 05
9. National Youth Corps 37 37 - - 2 2 414 378 177 174
10. National Youth Service Council 46 47 85 83 42 46 - - - -
Source: (Ministry of Youth Affairs & Skills Development,2016)
2.8 Challenges in Sri Lanka’s TVET System in Sri Lanka
Sri Lanka education system has faced many chalenges today and these chalenges limit
the sustanability of the industry.According to study was conducted by (Koralage, 2012)
found that Sri Lankan technical and vocational training sector has faced many
challenges. Currently Sri Lanka’s vocational training option faced poor recognition and
awareness amongst the broader public in terms of the qualifications required for such
professions as well as the work performed in them. People have negative awareness and
perceptions on the sector. Parents have not positive attitudes on vocational training and
they like to pursue children education at universities or other education sector.
Consequently, many of the available training places at the TVET institutes go unfilled
and report relatively high dropout rates in comparison to universities and other
specialized training institutes. In addition to above, the lack of financial resources
available to invest in TVET programs and the limited availability of competent trainers
to facilitate students’ education negatively impact the quality of education provided.
The curriculum packages are inadequate for preparing the students for the work
environment and the school managers lack the skills necessary to properly support
32 | P a g e
TVET programs. In addition to above, there was no formal plan for development of Sri
Lanka’s TVET System and it has become the key barrier for sector development.
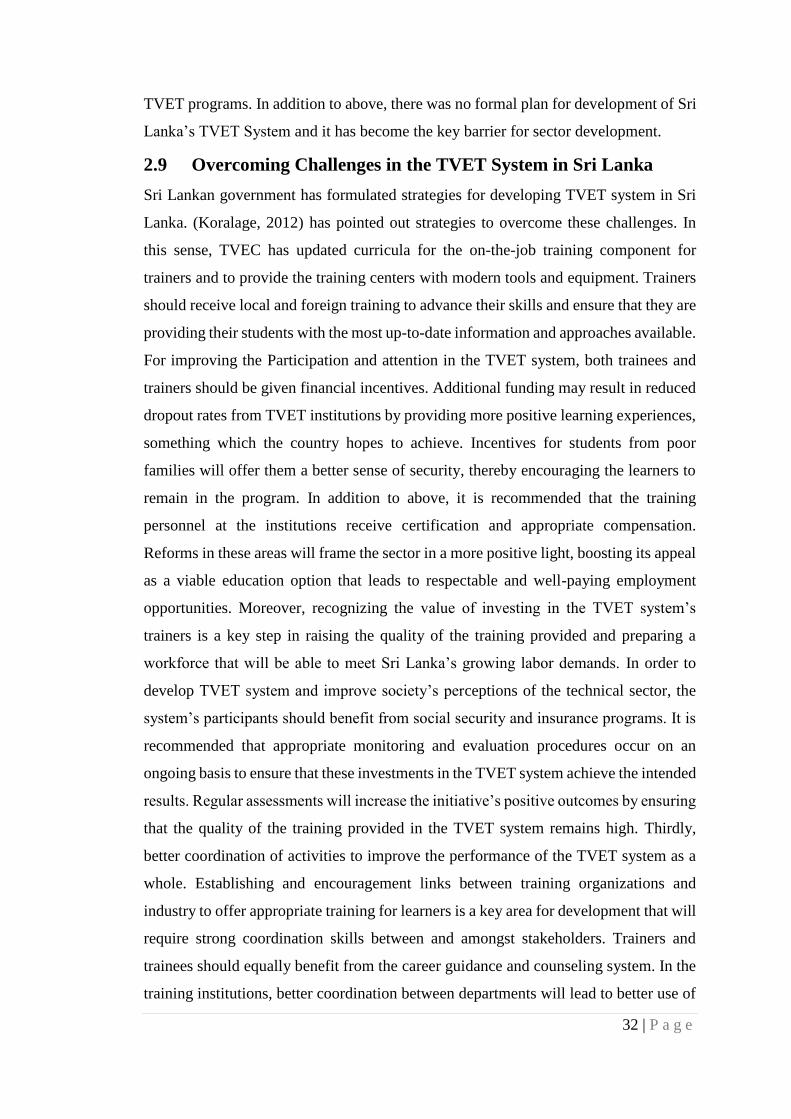
2.9 Overcoming Challenges in the TVET System in Sri Lanka
Sri Lankan government has formulated strategies for developing TVET system in Sri
Lanka. (Koralage, 2012) has pointed out strategies to overcome these challenges. In
this sense, TVEC has updated curricula for the on-the-job training component for
trainers and to provide the training centers with modern tools and equipment. Trainers
should receive local and foreign training to advance their skills and ensure that they are
providing their students with the most up-to-date information and approaches available.
For improving the Participation and attention in the TVET system, both trainees and
trainers should be given financial incentives. Additional funding may result in reduced
dropout rates from TVET institutions by providing more positive learning experiences,
something which the country hopes to achieve. Incentives for students from poor
families will offer them a better sense of security, thereby encouraging the learners to
remain in the program. In addition to above, it is recommended that the training
personnel at the institutions receive certification and appropriate compensation.
Reforms in these areas will frame the sector in a more positive light, boosting its appeal
as a viable education option that leads to respectable and well-paying employment
opportunities. Moreover, recognizing the value of investing in the TVET system’s
trainers is a key step in raising the quality of the training provided and preparing a
workforce that will be able to meet Sri Lanka’s growing labor demands. In order to
develop TVET system and improve society’s perceptions of the technical sector, the
system’s participants should benefit from social security and insurance programs. It is
recommended that appropriate monitoring and evaluation procedures occur on an
ongoing basis to ensure that these investments in the TVET system achieve the intended
results. Regular assessments will increase the initiative’s positive outcomes by ensuring
that the quality of the training provided in the TVET system remains high. Thirdly,
better coordination of activities to improve the performance of the TVET system as a
whole. Establishing and encouragement links between training organizations and
industry to offer appropriate training for learners is a key area for development that will
require strong coordination skills between and amongst stakeholders. Trainers and
trainees should equally benefit from the career guidance and counseling system. In the
training institutions, better coordination between departments will lead to better use of

33 | P a g e
the resources available. It is proposed that the government raise funds to support skills
development, which will require coordinated efforts between the various levels and
departments involved in managing the country’s resources, both human and financial.
Finally, a more coordinated system with effective communication links would result in
minimizing salary and wage differences between individuals within the same
profession, signifying efforts to create more equality and better standards in the sector
(Koralage, 2012).
2.10 National Vocational Qualification System (NVQ)
There was a need of having Vocational Qualification framework at the national level.
Traditionally, the primary and secondary schools are teaching according to nationally
recognized curricula and conduct exams and award G.C.E. (O/L) and G.C.E. (A/L)
certificates. Universities offer a wide range of bachelor degrees in Arts and Science,
those awarded under the preview of UGC (University Grant Commission) that have
equality and recognition; irrespective of universities. Further, nevertheless certificates
and Diplomas are offered by the Public and Private vocational training institutes and
there is debate and doubt on which certificate to accept and meet Industry requirements.
Tertiary and Vocational Education Commission introduced a National Vocational
Qualification System (NVQ) which consists of 7 Levels in collaboration with all
Government Technical Education and Vocational Training Institutes and Skills
Development Project presently as TEDP under the guidance of Ministry of Vocational
and Technical Training. NVQ System is implemented under a direct monitoring of
Tertiary and Vocational Education Commission (TVEC). According to TVEC, it has
advantages both students and employers. First advantage is NVQ Certificate is not a
training certificate and it nationally recognized certificate by possessing skills up to the
respective NVQ level in that occupation. Secondly, NVQ provides Career path to obtain
qualifications in higher levels of this framework and gaining relevant skills on the basis
of experience and competencies. Thirdly, NVQ System is a skill evaluation system &
has a high tendency for a foreign employment. NVQ certificate provides recipients to
be enthusiastic to gain higher qualifications; the system encourages upgrading their
career development. With the analysis of advantages to employers, NVQ system is the
best fit to employ NVQ holders in their institutions and NVQ Qualification could be
used for the recruitment of technical hands for institutions, and also eligible for
34 | P a g e
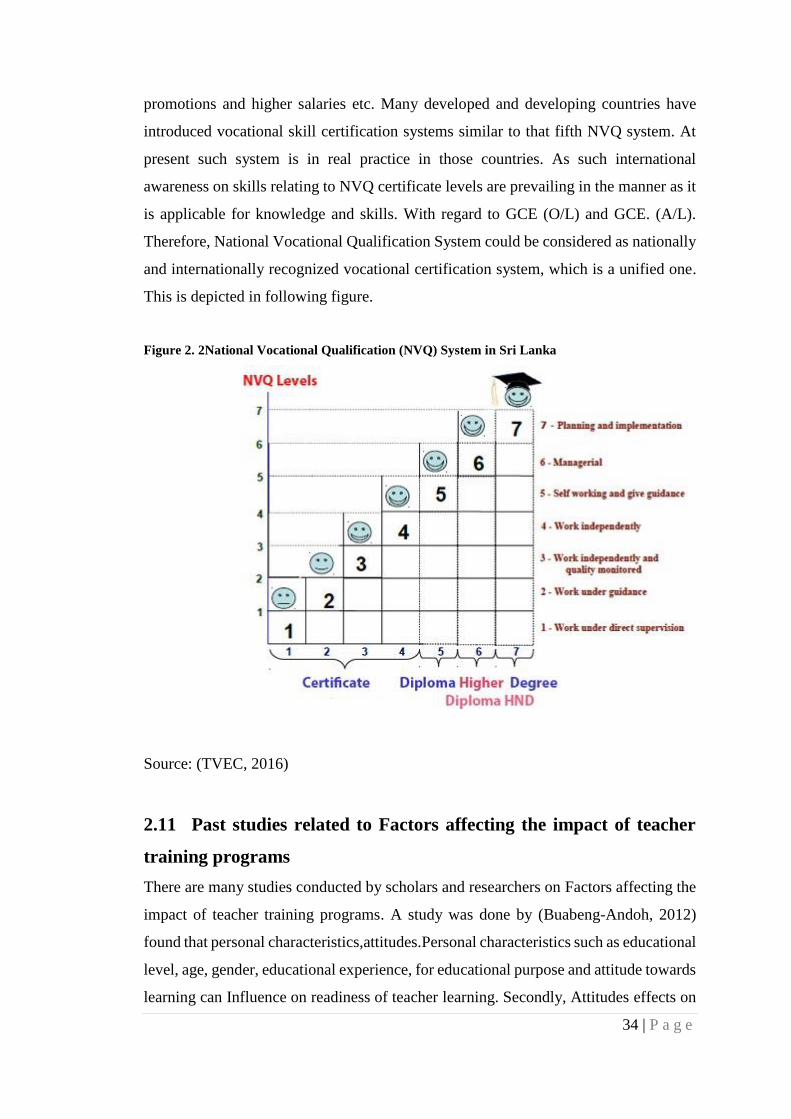
promotions and higher salaries etc. Many developed and developing countries have
introduced vocational skill certification systems similar to that fifth NVQ system. At
present such system is in real practice in those countries. As such international
awareness on skills relating to NVQ certificate levels are prevailing in the manner as it
is applicable for knowledge and skills. With regard to GCE (O/L) and GCE. (A/L).
Therefore, National Vocational Qualification System could be considered as nationally
and internationally recognized vocational certification system, which is a unified one.
This is depicted in following figure.
Figure 2. 2National Vocational Qualification (NVQ) System in Sri Lanka
Source: (TVEC, 2016)
2.11 Past studies related to Factors affecting the impact of teacher
training programs
There are many studies conducted by scholars and researchers on Factors affecting the
impact of teacher training programs. A study was done by (Buabeng-Andoh, 2012)
found that personal characteristics,attitudes.Personal characteristics such as educational
level, age, gender, educational experience, for educational purpose and attitude towards
learning can Influence on readiness of teacher learning. Secondly, Attitudes effects on

35 | P a g e
readiness of teacher learning. To successfully initiate and implement educational
technology in school’s program the teachers’ learning and attitudes should be positive.
(Zhang, Lai, Pang, Yi, & Rozelle, 2013) have done a study to examine the impact of a
short-term, intensive teacher training program on teacher and student performance for
an underserved population in China. They have used the performance of English
teachers to carry out the research. According to the research findings short term training
programs are ineffective in improving teacher and student performance.
Several studies have shown that traditional approaches (courses and workshops) are
failing to meet the professional needs of teachers. (Ostermeier, Prenzel, & Duit, 2010).
However, there is not necessarily a conflict between teachers’ learning in practice and
participation in traditional Teacher Professional Development (TPD) programs, but
programs that teachers attend should be linked to developmental processes that they
already participate in at their schools. (Temperley, Wilson, Barrar, & Fung, 2008).
(Svendsen, 2016) has carried out a research to find out how science teachers, who have
participated in a one-year school-based collaborative teacher professional development
program, perceive the program’s impact on their professional development. Constant
comparative analysis was used on data from three schools to generate the findings in
the study. The results indicate that participating teachers perceived a clear effect on
their teaching practice and ways of thinking about teaching science. In addition, the
findings identify a positive effect on the teachers’ attitudes towards collaboration.
Do teachers’ competencies and knowledge increase because they participate in
professional development course? This research question was addressed in a very
descriptive manner in the research (Zehetmeier, Andreitz, Erlacher, & Rauch, 2013).
What are the conditions that determine whether they increase (or not)? To answer this
question, a study has been monitoring a teacher training program since 2006. The
researchers have designed their study based on participant’s self-assessments. Teachers
assessed their state of knowledge regarding four aspects of the teaching methods before
and at the end of the course.
36 | P a g e
The researchers in the above study were able to build up a model that is based on the
association between teachers’ individual input conditions (e.g. their work-related
interests and knowledge), the opportunities to learn in the course (e.g. the information
on different topics, the people they work with, etc.) and the usage of those learning
opportunities, depending on the input conditions as well as on the quality of the learning
environment (e.g. by applying specific learning strategies). The competencies
developed in the course should affect their professional actions (e.g. their teaching
practice) and ultimately contribute to an improvement in their students’ learning.
“The training skills of the trainers’ are-spread with a large number of them with only
moderate skills in training. The success of a training programme is much dependent on
the level of motivation of the trainers, which in turn has a decisive impact on trainability
of the trainees. Mental attitude towards transferring knowledge and skills from the
trainer to the trainee needs to be improved”
(Fonseka, 1998) conducted a study on this subject area and found that Teachers and
Instructors neither are nor well prepared for delivery of training. According to the
examination pass ratio and student pass ratio more than 50% from the enrolment have
not passed the final examination. Therefore, training methodology, training equipment,
training materials, curriculum, and classroom and workshop environment should be
upgraded. Training delivery system and instructor training should be continuously
evaluated and upgraded. There should be an evaluation system for training instructors
and training programmes.
A study was conducted by (Mayadunne M., 2003) found that existing literature it is
evident that there is a research gap in analyzing the effectiveness of teacher
development programmes.
A study was done by (Bengand Eze, 2010) found that Quality of Training Programs,
Resource Constraints or Limitations, Perceived Future Prospects, Feedback from
Trainees and Program Planning & Execution Efficiency are factors which influences
on Teaching and Learning Process and outcome.
37 | P a g e
A study was done by Chandrani, (2007) on “effect of Training Methodology
Programmes (TMP) on the quality of the training process” found following findings on
the study area.
All the Passed out Trainees who were employed stated that quality of the
teaching aids are good or excellent. Majority of Trainers are using handouts,
flip charts, Wall charts and transparencies for their teaching and learning
process.
All the Trainers who followed the TMP were stated that relevancy of the content
taught in the TMP are highly relevant or relevant to their job.
Instructional planning, methods, media, evaluation and professional
development were the contents taught in TMP.
TMP changes Trainers main activities such as planning, using teaching
methods, preparing teaching aids and conducting continuous assessment.
TMP changed some important activities of Trainees such as increasing
performance of the trainees, saving note writing time of the trainees, Trainees
remembered content taught by Trainers etc.
TMP is highly necessary to Trainers to improve their instructional skills and
The Trainers were followed the TMP is to improve knowledge and presentation
skills. Majority HODD (80%) has responded that nominate Trainers for TMP
to increase quality of training delivery skills.
The percentage of 92 HODD has checked the improvement of the Trainers after
following TMP and many Trainers applied the content taught in TMP for their
working situation.
Many facilities such as Multimedia projector, Overhead projector Real Objects,
Models were requested by Trainers after following TMP and Many materials
such as Multimedia Transparency handouts, Flip charts, slides and check list
were requested by Trainers after following TMP.
Trained staff was used variety of methods, used different visuals and Provide
developmental feedback than the non-trained staff.According to above analysis
Trainees who not followed the CBT course is spent less duration to get a job
than trainees who followed the CBT courses.

38 | P a g e
According to the data collected passed out Trainees who not followed the CBT
courses have a job related to the course followed than the passed out Trainees
who followed the CBT courses
Finally, this study concluded that Training Methodology Programmes are not directly
affected to the quality of the training process. But TMP enhance the performance of the
trainers.TMP changed some important activities of Trainees such as increasing
performance of the trainees, saving note writing time of the trainees, Trainees
remembered content taught by Trainers etc. In addition to above, TMP is highly
necessary to Trainers to improve their instructional skills and the Trainers were
followed the TMP is to improve knowledge and presentation skills. Many facilities such
as Multimedia projector, Overhead projector Real Objects, Models were requested by
Trainers after following TMP and Many materials such as Multimedia Transparency
handouts, Flip charts, slides and check list were requested by Trainers after following
TMP. Trained staff were used variety of methods, used different visuals and Provide
developmental feedback than the non-trained staff. According to the study, Training
Methodology Programmers are not directly effect to the quality of the training process.
These programmes enhance the performance of the trainers. These programmes direct
Trainers for good planning and organization. Trainers who followed TMP courses are
conducting classes better than who have not followed TMP. All the Trainers who were
followed the TMP courses or not followed used variety of media and methods for
training. Trainees who were taught by Trained Trainers are competent than trainees
who were taught by untrained trainers. Employers wish to assigned trainers graduated
from CBT courses (NVQ certification)

39 | P a g e
CHAPTER 03
METHODOLOGY & DESIGN
3.1 Conceptual model of the study
Figure 3. 1 Conceptual model of the study
3.2 Hypotheses of the study
The proposed Hypothesis is shown below
H01= There is no effect of Quality of teachers’ Training Programs on Teaching and
Learning Process outcomes in Technical Colleges and Vocational Training Centers in
Sri Lanka.
Ha1= There is an effect of Quality of teachers’ Training Programs on Teaching and
Learning Process outcomes in Technical Colleges and Vocational Training Centers in
Sri Lanka.
3.3 Research design of the study
3.3.1 Research Approach of the study
“The researcher needs to select the appropriate research approach for design and
conducting the study” (Uma Sekaran, 2010). The researcher can select two research
approaches namely deductive and inductive research approach. “Deductive approach is
formal, structured, quantitative approach which tests the prior formulated hypotheses
Quality of Training Programs
o Quality of learning materials
o Quality of curriculum and its
development
o Quality of resource persons and their
presence
o Quality of assessment methods and
materials
o Quality of physical facilities and
arrangement
Teaching and Learning Process outcomes
o Teaching and Learning Process outcomes
o Change attitudes towards collaboration and
academic teaching.
o Development of Professional life.
o Development of teaching methods
o Development of other soft skills and
competencies
40 | P a g e
and the findings of deductive research approach can be used as the final decision
making” (Saunders, 2009). “In deductive approach is informal, unstructured,
qualitative approach and the findings of deductive research approach cannot be used as
the final decision making and it should be supported with further studies” (Saunders,
2009).
The researcher aims to conduct a survey and in-depth interview for measuring Quality
of Training Programs, Resource Constraints or Limitations, Perceived Future
Prospects, Feedback from Trainees and Teaching and Learning Process outcomes.
Survey takes the structured and formal method to collect data. In-depth interview takes
unstructured and informal approach to collect data. This study takes mix approach of
both deductive and inductive research approach in which the researcher measures and
collects data.
3.3.2 Time horizon of the study
“The Researcher needs to decide the time horizon of the study and there are two types
of time horizons such as cross sectional and longitudinal studies” (Saunders, 2009) This
study takes cross sectional study. because, the researcher of the study aims to conduct
and collect data at once rather than more times.
3.3.3 Research Strategy of the study
“The application of effective and efficient research strategies is key requirement for
achievement of research goals and objectives” (Uma Sekaran, 2010). According to
(Saunders, 2009), “No research strategy is inherently superior or inferior to any other”.
The researcher aims to use two research strategies. Formal survey (Quantitative) and
in-depth interviews are used.
“In-depth interviewing is a qualitative research technique that involves conducting
intensive individual interviews with a small number of respondents to explore their
perspectives on a particular idea, program, or situation”. Under this, the researcher aims
to collect informal and unstructured data from respondents (Couse coordinators)
Survey is used to collect a wide range of data in quantitative manner. In-depth interview
is used to get the insight on the problem. The survey strategy is usually associated with
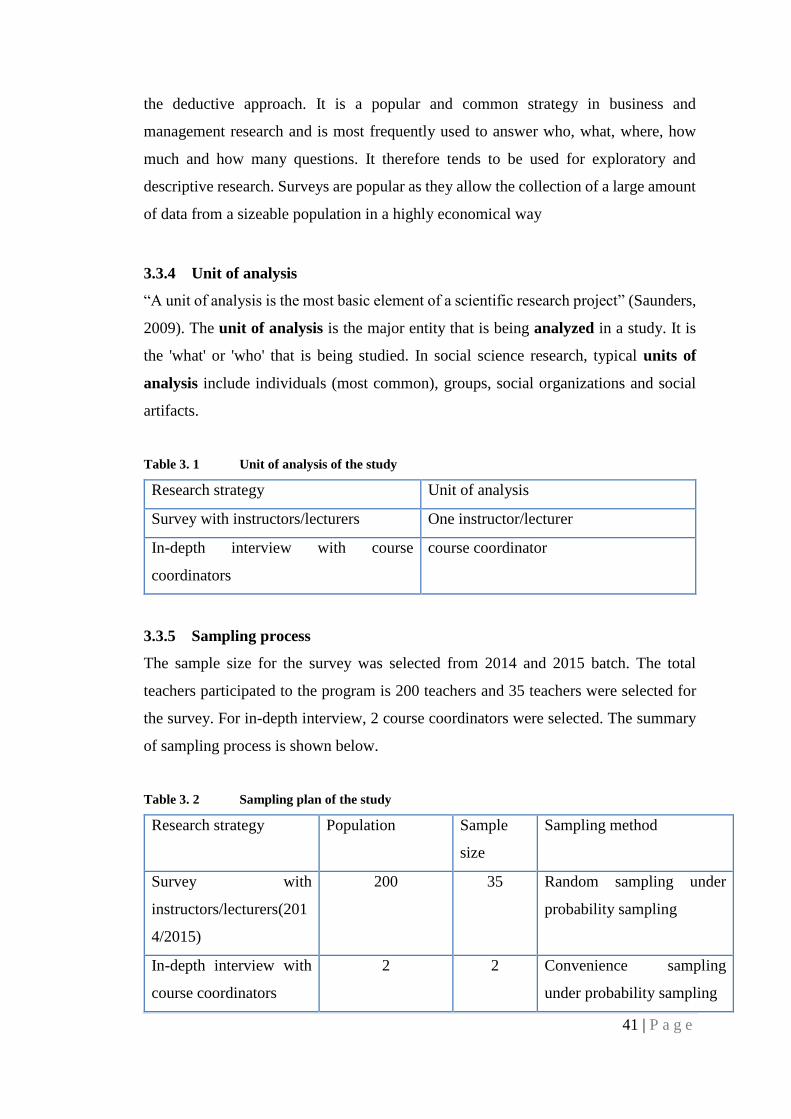
41 | P a g e
the deductive approach. It is a popular and common strategy in business and
management research and is most frequently used to answer who, what, where, how
much and how many questions. It therefore tends to be used for exploratory and
descriptive research. Surveys are popular as they allow the collection of a large amount
of data from a sizeable population in a highly economical way
3.3.4 Unit of analysis
“A unit of analysis is the most basic element of a scientific research project” (Saunders,
2009). The unit of analysis is the major entity that is being analyzed in a study. It is
the 'what' or 'who' that is being studied. In social science research, typical units of
analysis include individuals (most common), groups, social organizations and social
artifacts.
Table 3. 1 Unit of analysis of the study
Research strategy Unit of analysis
Survey with instructors/lecturers One instructor/lecturer
In-depth interview with course
coordinators
course coordinator
3.3.5 Sampling process
The sample size for the survey was selected from 2014 and 2015 batch. The total
teachers participated to the program is 200 teachers and 35 teachers were selected for
the survey. For in-depth interview, 2 course coordinators were selected. The summary
of sampling process is shown below.
Table 3. 2 Sampling plan of the study
Research strategy Population Sample
size
Sampling method
Survey with
instructors/lecturers(201
4/2015)
200 35 Random sampling under
probability sampling
In-depth interview with
course coordinators
2 2 Convenience sampling
under probability sampling

42 | P a g e
3.3.6 Data Analysis and Presentation of the study
Data analysis process will be done by ‘Statistical Package for Social Sciences’ (SPSS)
and Micro Soft Excel.
Correlation analysis was performed to measure the relationships among the variables.
A correlation is a single number that describes the degree of relationship between two
variables.
Multiple Regression analysis was used to perform to measure the effect of independent
variables to dependent variable

43 | P a g e
CHAPTER 4
DATA ANALYSIS AND PRESENTATION
4.1 Sample profile analysis
4.1.1 Gender of respondents
Sample consist of 77% of male respondents and 23 % of male respondents. Majority of
respondents are males.
Figure 4. 1 Gender of respondents
Source :( Survey data, 2016)
4.1.2 Age of respondents
23% of sample respondents is in year’s category 31-35, 26 % of sample respondents is
in year’s category 41-45, 14% of sample respondents is in year’s category 35-40 and
37% of sample respondents is in years above 50. majority of sample respondents are
above 50 years.
77%
23%
Gender of the respondents
Male
Female

44 | P a g e
Figure 4. 2 Age of respondents
Source :( Survey data, 2016)
4.1.3 Education level of respondents
34% of respondents are NCT qualification holders, 20% of respondents are post
graduate holders, 17 % of respondents are HNDE holders, 11% of respondents are
master qualification holders, and 6% of respondents are other and NDT holders.
Majority of respondents are NCT qualification holders.
Figure 4. 3 Education level of respondents
Source :( Survey data, 2016)
23%
37%
26%
14%
Age of the respondents
31-35
35-40
41-45
<50
6%
34%
17%6%
20%
11%6%
Education of respondents
G.C.E(A/L)
NCT
HNDE
NDT
Post Graduate/ Dip
HD / Masters
Other

45 | P a g e
4.1.5 Years of experience of respondents
Majority of respondents has 0-5 academic experience and years 5-10 of industry
experience.
Figure 4. 4 Years of experience of respondents
Source :( Survey data, 2016)
0-5 5-10 10-15 15-20 Over 20
16
8 8
21
9
17
3
6.0
YEARS OF EXPERINCE
Years of experiense (Acadamic) Years of experiense (Industry)
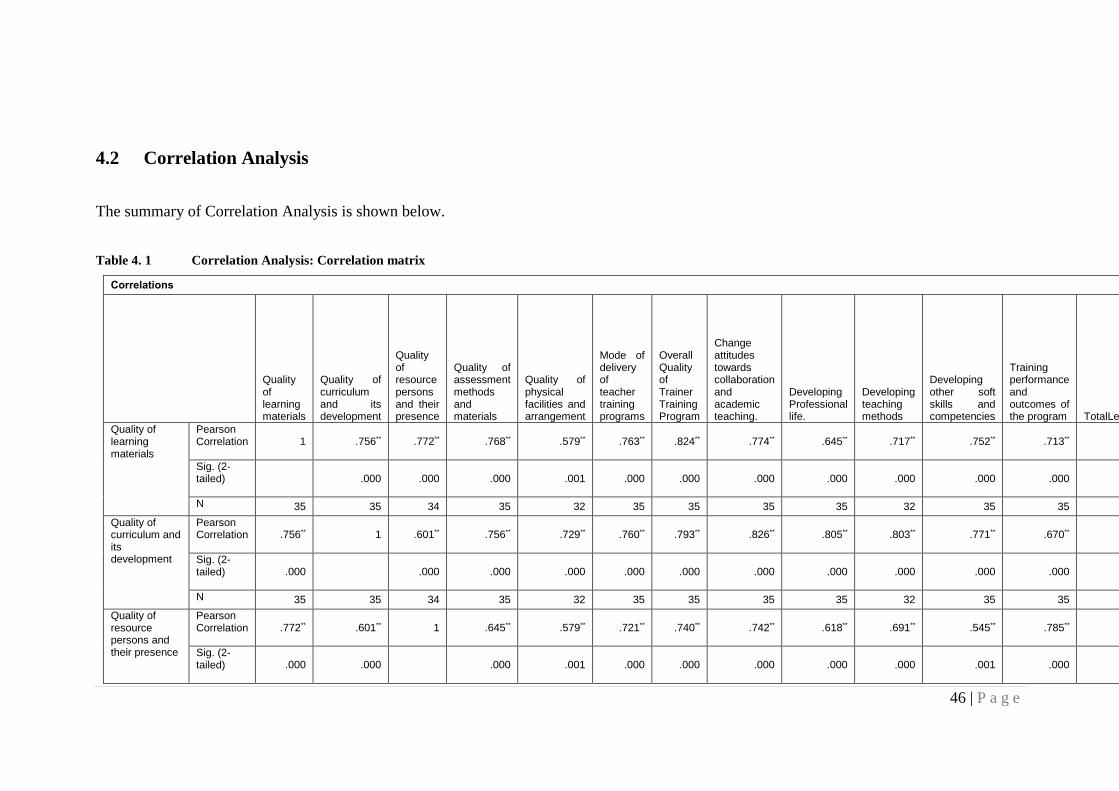
46 | P a g e
4.2 Correlation Analysis
The summary of Correlation Analysis is shown below.
Table 4. 1 Correlation Analysis: Correlation matrix
Correlations
Quality of learning materials
Quality of curriculum and its development
Quality of resource persons and their presence
Quality of assessment methods and materials
Quality of physical facilities and arrangement
Mode of delivery of teacher training programs
Overall Quality of Trainer Training Program
Change attitudes towards collaboration and academic teaching.
Developing Professional life.
Developing teaching methods
Developing other soft skills and competencies
Training performance and outcomes of the program TotalLearningoutcomes
Quality of learning materials
Pearson Correlation 1 .756** .772** .768** .579** .763** .824** .774** .645** .717** .752** .713** .769**
Sig. (2-tailed) .000 .000 .000 .001 .000 .000 .000 .000 .000 .000 .000 .000
N 35 35 34 35 32 35 35 35 35 32 35 35 35
Quality of curriculum and its development
Pearson Correlation .756** 1 .601** .756** .729** .760** .793** .826** .805** .803** .771** .670** .798**
Sig. (2-tailed) .000 .000 .000 .000 .000 .000 .000 .000 .000 .000 .000 .000
N 35 35 34 35 32 35 35 35 35 32 35 35 35
Quality of resource persons and their presence
Pearson Correlation .772** .601** 1 .645** .579** .721** .740** .742** .618** .691** .545** .785** .771**
Sig. (2-tailed) .000 .000 .000 .001 .000 .000 .000 .000 .000 .001 .000 .000

47 | P a g e
N 34 34 34 34 31 34 34 34 34 31 34 34 34
Quality of assessment methods and materials
Pearson Correlation .768** .756** .645** 1 .644** .675** .805** .663** .689** .619** .682** .596** .686**
Sig. (2-tailed) .000 .000 .000 .000 .000 .000 .000 .000 .000 .000 .000 .000
N 35 35 34 35 32 35 35 35 35 32 35 35 35
Quality of physical facilities and arrangement
Pearson Correlation .579** .729** .579** .644** 1 .661** .739** .651** .663** .561** .516** .655** .669**
Sig. (2-tailed) .001 .000 .001 .000 .000 .000 .000 .000 .001 .002 .000 .000
N 32 32 31 32 32 32 32 32 32 32 32 32 32
Mode of delivery of teacher training programs
Pearson Correlation .763** .760** .721** .675** .661** 1 .873** .772** .606** .714** .679** .793** .759**
Sig. (2-tailed) .000 .000 .000 .000 .000 .000 .000 .000 .000 .000 .000 .000
N 35 35 34 35 32 35 35 35 35 32 35 35 35
Overall Quality of Trainer Training Program
Pearson Correlation .824** .793** .740** .805** .739** .873** 1 .733** .611** .688** .687** .784** .748**
Sig. (2-tailed) .000 .000 .000 .000 .000 .000 .000 .000 .000 .000 .000 .000
N 35 35 34 35 32 35 35 35 35 32 35 35 35
Change attitudes towards collaboration and academic teaching.
Pearson Correlation .774** .826** .742** .663** .651** .772** .733** 1 .906** .888** .769** .834** .965**
Sig. (2-tailed) .000 .000 .000 .000 .000 .000 .000 .000 .000 .000 .000 .000
N 35 35 34 35 32 35 35 35 35 32 35 35 35
Pearson Correlation .645** .805** .618** .689** .663** .606** .611** .906** 1 .830** .795** .690** .922**

48 | P a g e
Developing Professional life.
Sig. (2-tailed) .000 .000 .000 .000 .000 .000 .000 .000 .000 .000 .000 .000
N 35 35 34 35 32 35 35 35 35 32 35 35 35
Developing teaching methods
Pearson Correlation .717** .803** .691** .619** .561** .714** .688** .888** .830** 1 .774** .765** .922**
Sig. (2-tailed) .000 .000 .000 .000 .001 .000 .000 .000 .000 .000 .000 .000
N 32 32 31 32 32 32 32 32 32 32 32 32 32
Developing other soft skills and competencies
Pearson Correlation .752** .771** .545** .682** .516** .679** .687** .769** .795** .774** 1 .638** .819**
Sig. (2-tailed) .000 .000 .001 .000 .002 .000 .000 .000 .000 .000 .000 .000
N 35 35 34 35 32 35 35 35 35 32 35 35 35
Training performance and outcomes of the program
Pearson Correlation .713** .670** .785** .596** .655** .793** .784** .834** .690** .765** .638** 1 .877**
Sig. (2-tailed) .000 .000 .000 .000 .000 .000 .000 .000 .000 .000 .000 .000
N 35 35 34 35 32 35 35 35 35 32 35 35 35
TotalLearnning outcoms
Pearson Correlation .769** .798** .771** .686** .669** .759** .748** .965** .922** .922** .819** .877** 1
Sig. (2-tailed) .000 .000 .000 .000 .000 .000 .000 .000 .000 .000 .000 .000
N 35 35 34 35 32 35 35 35 35 32 35 35 35
**. Correlation is significant at the 0.01 level (2-tailed).
Source :( Survey data, 2016)
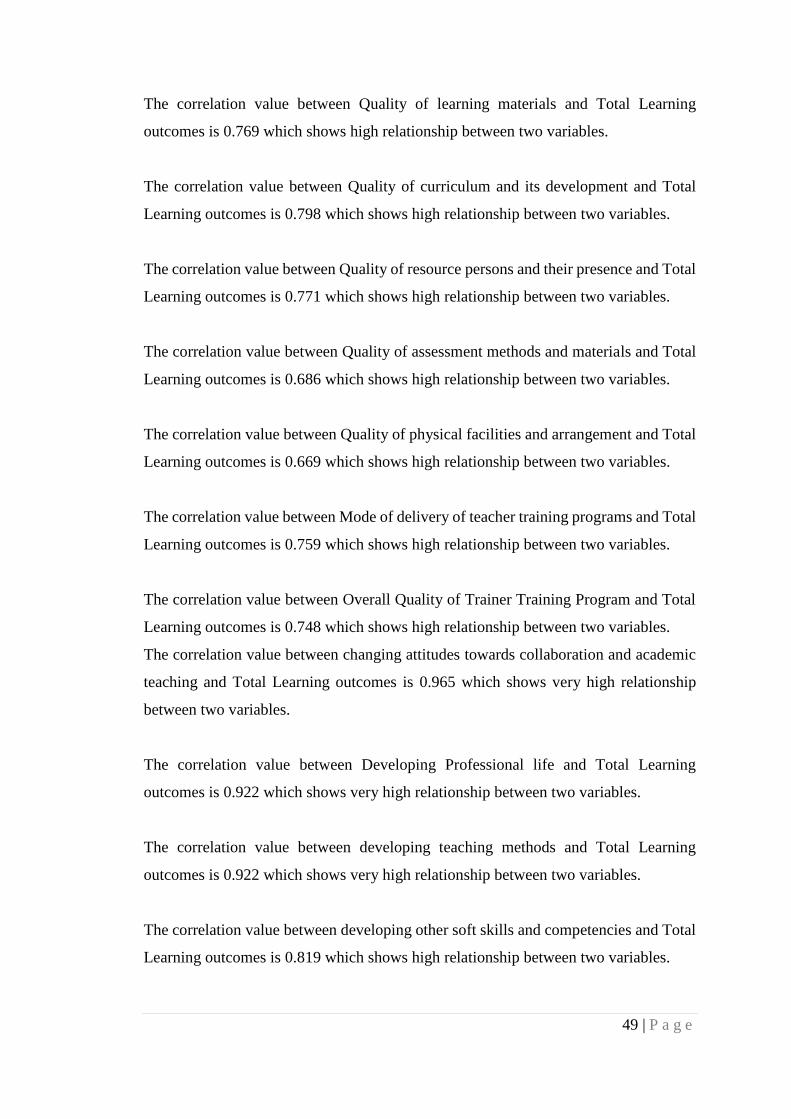
49 | P a g e
The correlation value between Quality of learning materials and Total Learning
outcomes is 0.769 which shows high relationship between two variables.
The correlation value between Quality of curriculum and its development and Total
Learning outcomes is 0.798 which shows high relationship between two variables.
The correlation value between Quality of resource persons and their presence and Total
Learning outcomes is 0.771 which shows high relationship between two variables.
The correlation value between Quality of assessment methods and materials and Total
Learning outcomes is 0.686 which shows high relationship between two variables.
The correlation value between Quality of physical facilities and arrangement and Total
Learning outcomes is 0.669 which shows high relationship between two variables.
The correlation value between Mode of delivery of teacher training programs and Total
Learning outcomes is 0.759 which shows high relationship between two variables.
The correlation value between Overall Quality of Trainer Training Program and Total
Learning outcomes is 0.748 which shows high relationship between two variables.
The correlation value between changing attitudes towards collaboration and academic
teaching and Total Learning outcomes is 0.965 which shows very high relationship
between two variables.
The correlation value between Developing Professional life and Total Learning
outcomes is 0.922 which shows very high relationship between two variables.
The correlation value between developing teaching methods and Total Learning
outcomes is 0.922 which shows very high relationship between two variables.
The correlation value between developing other soft skills and competencies and Total
Learning outcomes is 0.819 which shows high relationship between two variables.

50 | P a g e
The correlation value between Training performance and outcomes of the program and
Total Learning outcomes is 0.877 which shows high relationship between two
variables.
4.3 Regression Analysis
Table 4.2 shows the model summary of regression analysis. According to model
summary, simple correlation value is 0.908 which shows a strong (Positive) relationship
between the independent variable of Quality of Training Programs and dependent
variable of Teaching and Learning Process outcomes. R Square value (Model
Summary) of the table in which it shows “how much of the total variation of
independent variable on dependent variable”. Dependent variable of Teaching and
Learning Process outcomes is explained by independent variable of Quality of Training
Programs. This is 82.5% which at the very high level.
Table 4. 2 Model Summary
Model Summary
Mod
el
R R
Square
Adjusted R
Square
Std. Error of
the Estimate
1 .908a .825 .771 .39666
a. Predictors: (Constant), I am really satisfied with overall Quality of
Trainer Training Program, I am really satisfied with Quality of
physical facilities and arrangement, I am really satisfied with Quality
of resource persons and their presence, I am really satisfied with
Quality of assessment methods and materials, I am really happy
with Quality of curriculum and its development, I am really happy
with quality of learning materials, I am really satisfied with mode of
delivery of teacher training programs
Source :( Survey data, 2016)
According to ANOVA Table performance as shown in Table 4.7, the significant value
of the table is 0.000, According to Decision criteria, this value is less than 0.05(0.000
<0.05), and it shows that Null hypotheses is rejected and Alternative hypotheses is
accepted. This shows that there is an impact of Quality of Training Programs on
Teaching and Learning Process outcomes.

51 | P a g e
Table 4. 3 Anova table
ANOVAa
Model Sum of
Squares
df Mean
Square
F Sig.
1 Regression 17.037 7 2.434 15.469 .000b
Residual 3.619 23 .157
Total 20.655 30
a. Dependent Variable: Total Learning outcomes
b. Predictors: (Constant), I am really satisfied with overall Quality of Trainer Training Program,
I am really satisfied with Quality of physical facilities and arrangement, I am really satisfied with
Quality of resource persons and their presence, I am really satisfied with Quality of
assessment methods and materials, I am really happy with Quality of curriculum and its
development, I am really happy with quality of learning materials, I am really satisfied with
mode of delivery of teacher training programs
Source :( Survey data, 2016)
According to table 4.4 which shows The Coefficients of Regression Analysis, It
indicates the estimated regression coefficients values for independent variables as in
the proposed regression model
Y = ƒ (βX1j+βX2j+βX3j+βX4j+βX5j + βX6j)
Teaching and Learning Process outcomes = ƒ (β*0.131+β *0.519+β*172+β*0.32+β
0.55)
Table 4. 4 Coefficients of correlation analysis
Coefficients
Model Unstandardized Coefficients
Standardized Coefficients
t Sig.
B Std. Error Beta
1 (Constant) .136 .258 -.529 .602
I am really happy with quality of learning materials
.131 .186 .144 .702 .040
I am really happy with Quality of curriculum and its development
.519 .166 .545 3.131 .005
I am really satisfied with Quality of resource persons and their presence
.172 .156 .189 1.105 .021
I am really satisfied with Quality of assessment methods and materials
.032 .141 .037 .228 .041
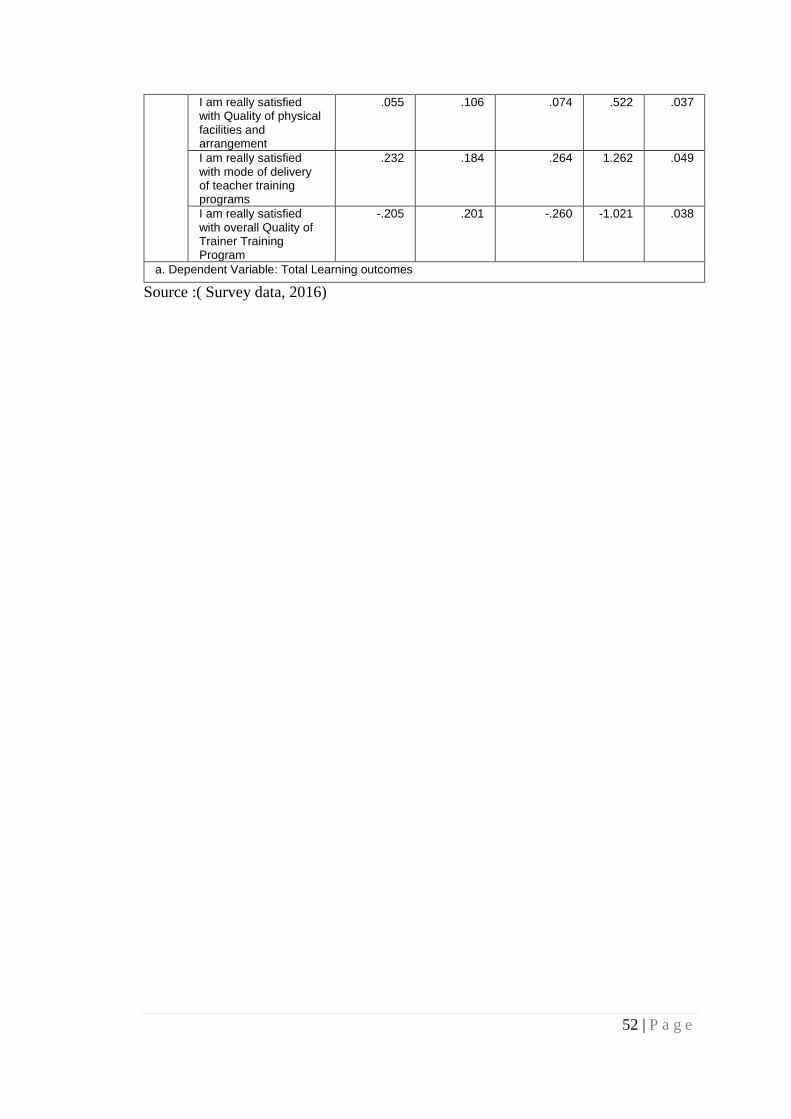
52 | P a g e
I am really satisfied with Quality of physical facilities and arrangement
.055 .106 .074 .522 .037
I am really satisfied with mode of delivery of teacher training programs
.232 .184 .264 1.262 .049
I am really satisfied with overall Quality of Trainer Training Program
-.205 .201 -.260 -1.021 .038
a. Dependent Variable: Total Learning outcomes
Source :( Survey data, 2016)

53 | P a g e
CHAPTER 05
CONCLUSIONS AND RECOMMENDATION
5.1 Conclusion of the study
In the training program the quality of learning material needs to be assessed to
enhance effectiveness of training input.
The curriculum compatibility and credibility of the TVET trainee need to be
assessed for relevance and credibility.
The qualifications and the experienced based credibility of the resource and
training person is significant in enhanced effectiveness' of training.
The methods used to assess and revise the performances levels of the trainees
need to be compatible to international standards.
A quality appraisal needs to be attached to the quality assortment of the overall
training program at beginning, middle and termination
The physical facilities and related amenities need to be fine-tuned to match with
the expected training program results with preserved and enhanced quality
5.2 Limitations of the study
This study has few limitations.
Data collection will be done form two sources such as data from 35 instructors, and
data from 2 industry specialists (Course coordinator and Lecturer). There is a limitation
of data collection and it causes to not representation of sample through the sampling
process.

54 | P a g e
The data will be collected from three samples including data from 40
instructors/lecturers in DTET. This study has ignored samples of instructors/lecturers
in NITA, NISC, VTA and CGTTI
The study model considers on few variables including Quality of learning materials,
Quality of curriculum and its development, Quality of resource persons and their
presence, Quality of assessment methods and materials and Quality of physical
facilities and arrangement etc.
5.3 Suggestions for future studies
It is suggested to consider trainees, instructors/lecturers in NITA, NISC, VTA and
CGTTI to make a wider range of findings.
It is suggested to increase the sample size and improve the current conceptual model by
looking at many aspects.
5.4 Recommendation
For course coordinators and designers
o To discuss with trainees to get their views and ideas on training
requirements and understanding their knowledge and skills gaps.
o To consider quality of learning materials when designing leaning
materials.
o To consider quality of curriculum and its development which meet the
changing vocational and technical movements.
o To employ quality of resource persons and capacities to implement the
successful teachers’ training program.
o To employ quality of resource persons and capacities to implement the
successful teachers’ training program.
o To plan physical facilities and arrangement to manage the quality of
training outcomes
For policy and decision makers
o To consider the industries as well as skill sector councils’ skill person
requirements behavior before planning teachers’ training programs.

55 | P a g e
References
Babbie, E. & Mouton, J. (2001). The Practice of Social Research. Cape Town: Oxfors
University Press.
Buabeng-Andoh. (2012). factor affecting teachers learning process. International
Journal of Education and Development using Information and Communication .
CBSL. (2015). Home page of Corporate Website of Central Bank of Sri Lanka.
Retrieved May 2015, from Corporate Website of Central Bank of Sri Lanka:
www.cbsl.lk
Department of Examinations. (2016, Octomber 28). Statistics. Retrieved from
www.statistics.gov.lk: http://www.statistics.gov.lk/pocket%20book/chap13.pdf
DTET. (2016, Octomber). Retrieved from Corperate website of DEPARTMENT OF
TECHNICAL EDUCATION AND TRAINING(DTET): http://www.dtet.gov.lk/
Education, M. o. (2016, Octomber). Retrieved 2016, from Corperate website of
Ministry of Education:
http://www.moe.gov.lk/sinhala/images/publications/Education_First_SL/Education_F
irst_SL.pdf
Koralage. (2012). Overcoming Barriers to Apprenticeship Training in Sri Lanka. he
Canadian Apprenticeship Journal , 1-6.
Ostermeier, C., Prenzel, M., & Duit, R. (2010). Improving Science and Mathematics
Instruction : The SINUS project as an example for reform as teacher Professional
Development. International Journal of Science Education, 32 (3), 303-327.
Saunders, M. e. (2009). Resaerch Methods for Business Students. South Asia: Dorling
Kindersley (India) Pvt LTD.
Svendsen, B. (2016). Teacher's Experience from a School based Collaborative Teacher
Professional DEvelopment Programme : Reported Impact on Professional
Development. Teacher Development, 20 (3), 313-328.

56 | P a g e
Temperley, H., Wilson, A., Barrar, H., & Fung, I. (2008). Teacher Professional
Learning and Development.
TVEC. (2016). Retrieved 2016, from Corperate website of TVEC:
http://www.tvec.gov.lk/nvq/description_of_nvq.htm
Uma Sekaran. (2010). RESEARCH METHODS FOR BUSINESS. New York: John
Wiley & Sons, Inc.
UmaSekeran. (2010). RESEARCH METHODS FOR BUSINESS. New York: John
Wiley & Sons, Inc.
UNESCO. (2015). Retrieved Octomber 2016, from UNESCO:
http://www.unevoc.unesco.org/wtdb/worldtvetdatabase_lka_en.pdf
Warnapala. (2007). TVET Policy famwork. Minister of Higher Education at the
National Conference, (p. 05). Colombo.
Wilson, A. (2006). Marketing resaerch an integerated Aprach.
WorldEconomicForm. (2015). New Vision for Education Unlocking the Potential of
Technology :Prepared in collaboration with The Boston Consulting Group.
Cologny/Geneva: World Economic Form.
Zehetmeier, S., Andreitz, I., Erlacher, W., & Rauch, F. (2013). Researching the Impact
of Teacher Professional Development Programmes Based on Action
Research,Constructivism and Systems Theory. Journal of Development Effectiveness,
5 (3), 339-358.
Zhang, L., Lai, F., Pang, A., Yi, H., & Rozelle, S. (2013). The Impact of Teacher
Training on Teacher and Student outcomes: Evidence from a Randomised experiment
in Beijing Migrant Schools. Journal of Development Effectiveness, 5 (3), 339-358.