DEPARTMENT OF PLANNING, INDUSTRY & ENVIRONMENT NSW …
36
DEPARTMENT OF PLANNING, INDUSTRY & ENVIRONMENT NSW Estuary Health Risk Dataset A first-pass risk assessment to help with the prioritisation of catchment management actions environment.nsw.gov.au
Transcript of DEPARTMENT OF PLANNING, INDUSTRY & ENVIRONMENT NSW …
DEPARTMENT OF PLANNING, INDUSTRY & ENVIRONMENT
NSW Estuary Health Risk Dataset A first-pass risk assessment to help with the prioritisation of catchment management actions
environment.nsw.gov.au

© 2019 State of NSW and Department of Planning, Industry and Environment With the exception of photographs, the State of New South Wales and Department of Planning, Industry and Environment are pleased to allow this material to be reproduced in whole or in part for educational and non-commercial use, provided the meaning is unchanged and its source, publisher and authorship are acknowledged. Specific permission is required for the reproduction of photographs. The Department of Planning, Industry and Environment (DPIE) – Environment, Energy and Science has compiled this report in good faith, exercising all due care and attention. No representation is made about the accuracy, completeness or suitability of the information in this publication for any particular purpose. DPIE shall not be liable for any damage which may occur to any person or organisation taking action or not on the basis of this publication. Readers should seek appropriate advice when applying the information to their specific needs. All content in this publication is owned by DPIE and is protected by Crown Copyright, unless credited otherwise. It is licensed under the Creative Commons Attribution 4.0 International (CC BY 4.0), subject to the exemptions contained in the licence. The legal code for the licence is available at Creative Commons. DPIE asserts the right to be attributed as author of the original material in the following manner: © State of New South Wales and Department of Planning, Industry and Environment 2019. Cover photo: Entrance of Lake Illawarra, south coast of New South Wales/DPIE. This publication may be cited as: Dela-Cruz J, Kuo W, Floyd J, Littleboy M, Young J, Swanson R, Cowood A, Dawson G (2019). NSW Estuary Health Risk Dataset – A first pass risk assessment to assist with the prioritisation of catchment management actions. Department of Planning, Industry and Environment, Sydney. Published by: Environment, Energy and Science Department of Planning, Industry and Environment 59 Goulburn Street, Sydney NSW 2000 PO Box A290, Sydney South NSW 1232 Phone: +61 2 9995 5000 (switchboard) Phone: 1300 361 967 (Environment, Energy and Science enquiries) TTY users: phone 133 677, then ask for 1300 361 967 Speak and listen users: phone 1300 555 727, then ask for 1300 361 967 Email: [email protected] Website: www.environment.nsw.gov.au Report pollution and environmental incidents Environment Line: 131 555 (NSW only) or [email protected] See also www.environment.nsw.gov.au ISBN 978 1 922317 26 1 EES 2019/0521 September 2019
Find out more about your environment at:
www.environment.nsw.gov.au

iii
Contents
1. Summary 1
2. Background 2
3. What is the NSW Estuary Health Risk dataset? 3
4. Recommended use of the dataset 7
5. Is the dataset suitable for your use? 8
6. How the dataset was created 10
6.1 Catchment runoff models 10 6.2 Estuary models (hydraulic, hydrodynamic or ecological response) 11 6.3 Risk analysis 14
7. Limitations and scientific rigour 16
8. Access to the dataset 17
9. References 18
10. Appendix A 19
11. Appendix B 21
12. Appendix C 26
12.1 Shapefile of risk scores 26 12.2 Shapefile of subcatchment loads and flows 27 12.3 Raster file of loads and flows per hectare 28
13. Appendix D 29
13.2 Viewing the shapefiles 29 13.3 Viewing the raster file 29

iv
List of tables
Table 1a Likelihood scores define the chance that runoff from a subcatchment will have an impact on the ecological health of an estuary 15
Table 1b Consequence scores define the magnitude of impact on the ecological health of an estuary 15
Table 1c Risk matrix to prioritise or rank subcatchments according to their risk of impacts on the ecological health of an estuary 16
Table B.1 List of 184 estuaries in New South Wales, labelled north to south, showing corresponding data files available for download in the Sharing and Enabling Environmental Data data portal 21
Table C.1 Description of attributes of shapefile containing risk scores 26 Table C.2 Description of attributes of shapefile containing subcatchment
nutrient and sediment loads and surface flows 27
Table C.2 Description of attributes of shapefile containing subcatchment nutrient and sediment loads and surface flows 28

v
List of figures
Figure 1 Map showing a ranking of subcatchments based on their relative risk of impact on the ecological health of the Manning River. 4
Figure 2 Maps showing total nitrogen loads exported from subcatchments draining into the Manning River. Exports are presented as annual total load from each subcatchment and average export of total nitrogen from 1 hectare of each subcatchment. 5
Figure 3 Maps showing the spatial variability in land use, soil types based on great soil group classification, total suspended solid exports (kilogram/hectare/year) and climate zones of the Manning River catchment. 6
Figure 4 Flow chart to help decide whether the NSW Estuary Health Risk Dataset is suitable to use for assessing the health of an estuary. 9
Figure 5 Plots showing the base exceedance and extent of potential impact of total nitrogen loads in the Manning River. 13
Figure A1 Plots comparing the modelled annual average total nitrogen, total phosphorus, total suspended solids loads and surface flows exported from the Narrabeen Lagoon catchment (northern beaches, Sydney). 19
Figure A2 Plots comparing modelled and observed/field measurements of chlorophyll a concentrations (measure of micro-algae) for estuaries classified as lakes, lagoons and creeks. 20
Figure D1 Steps to follow to view shapefiles in ArcMap 10.4. 30
Figure D2 Steps to follow to view the raster file in ArcMap 10.4 31

NSW Estuary Health Risk Dataset
1
1. Summary
This report describes the creation and use of the NSW Estuary Health Risk Dataset. It is designed to support councils in Stage 1 of preparing coastal management programs (CMPs) under the NSW Coastal Management Manual (2018). The dataset identifies land-use pressures and consequent risks of impacts on the ecological health of estuaries. Risks associated with other pressures, such as acid sulfate soils, erosion and contaminants, are not captured. The dataset can be used to help map where further studies and/or management actions in a catchment would contribute to achieving some of the management objectives for coastal environment areas and coastal wetlands and littoral rainforests areas, specified in the Coastal Management Act 2016. The dataset includes two shapefiles and one raster file for each estuary and its associated catchment in New South Wales (NSW). It is recommended that all files be reviewed to help set the context for the estuary health risk. The shapefiles provide data on risks and land-use pressures at the subcatchment scale. The raster file provides finer resolution data (1 hectare) on land-use pressures. The naming convention of the shapefiles is based on: i) the estuary/catchment name (e.g. MANNING_RIVER) ii) a north-south number (e.g. _047), indicative of the location of the estuary and catchment along the NSW coast, and iii) an identifier which describes the data being displayed (i.e. _HR, _NL, _NLF). A shapefile with an identifier of ‘HR’ (e.g. MANNING_RIVER_047_HR.shp) denotes that the shapefile contains the risk data. The shapefile defines the catchment of an estuary divided into smaller drainage areas or subcatchments. Each subcatchment has three main data attributes: likelihood scores, consequence scores and risk scores. Likelihood scores represent the extent and intensity of land-use pressure from each subcatchment, and consequence scores represent the extent of impact on estuary health. The overall risk score is a product of the likelihood and consequence scores, and serves to rank each subcatchment on a relative scale. A shapefile with an identifier of ‘NL’ (e.g. MANNING_RIVER_047_NL.shp) provides context for the likelihood scores. There are eight main data attributes, based on exports of surface flows, total nitrogen loads, total phosphorus loads and total suspended sediment loads. The exports are presented as the total export from the subcatchment or the average export from one hectare in the subcatchment. A raster file identified as ‘NLF’ (e.g. MANNING_RIVER_047_NLF.tif) has a grid size of one hectare with seven main data attributes that provide further context for the likelihood scores. Attributes such as climate zone, soil type and land use were used in the catchment runoff modelling to produce estimates of surface flows and nutrient and total suspended solid loads. The NSW Estuary Health Risk Dataset is available for many of the 184 main estuaries and catchments in coastal NSW. This data report provides a listing of which files are available for each estuary and catchment.

NSW Estuary Health Risk Dataset
2
2. Background
The NSW Government is leading a water quality initiative to improve the management and co-ordination of urban and rural diffuse source water pollution in New South Wales (NSW) as part of their requirements to implement the Marine Estate Management Strategy 2018–2028 (MEM Strategy). A key approach to delivering this initiative is to adopt the Risk-based framework for considering waterway health outcomes in strategic land use planning decisions (Risk-based Framework). The Risk-based Framework is a protocol that decision makers, such as councils, planners and environmental regulators, can use to help manage the impact of land-use activities on the health of waterways in NSW. The Risk-based Framework brings together the principles and guidelines recommended in the National Water Quality Management Strategy (NWQMS), which the NSW Government adopted in 1992. The overarching principle of the NWQMS is that healthy waterways support the community’s environmental values and uses – these are what the community believes is important for a healthy ecosystem, for public benefit, welfare, safety and/or health. In May 2017, the former Office of Environment and Heritage (OEH) and the NSW Environment Protection Authority released an introductory resource on the Risk-based Framework in response to 3 years of consultation on urban planning and wider catchment management. It consists of five main steps, which provide a clear line of sight between management targets, environmental values and uses the community want addressed, and the management or mitigation options needed to achieve these goals. Since the release of the introductory resource, the Risk-based Framework has been identified as a key action or guideline for achieving healthy waterways in a range of strategic plans, including the NSW Coastal Management Manual (to meet objects of the Coastal Management Act 2016). This report describes how the former OEH applied the first two steps of the Risk-based Framework and produced the NSW Estuary Health Risk Dataset to help inform Stage 1 scoping studies during the preparation of coastal management programs under the NSW Coastal Management Manual (2018). The dataset can be used to map (spatially prioritise) where further studies and/or management actions in a catchment would help achieve outcomes for coastal environment areas and coastal wetlands and littoral rainforests areas specified in the Coastal Management Act 2016. Specifically to:
• protect and enhance the coastal environmental values and natural processes of coastal waters, estuaries, coastal lakes and coastal lagoons
• enhance natural character, scenic value, biodiversity and ecosystem integrity of coastal environments
• reduce threats to and improve the resilience of coastal waters, estuaries, coastal lakes and coastal lagoons, including in response to climate change
• maintain and improve water quality and estuary health • support social and cultural values of coastal waters, estuaries, coastal lakes and
lagoons • protect coastal wetlands and littoral rainforests in their natural state, including their
biodiversity and ecosystem integrity • promote the rehabilitation and restoration of degraded coastal wetlands and littoral
rainforests • improve the resilience of coastal wetlands and littoral rainforests to the impacts of
climate change, including opportunities for migration • support the social and cultural values of coastal wetlands and littoral rainforests

NSW Estuary Health Risk Dataset
3
• promote the objectives of NSW Government policies and programs for wetlands or littoral rainforest management.
3. What is the NSW Estuary Health Risk
dataset?
The NSW Estuary Health Risk dataset includes two shapefiles and one raster file for each catchment in New South Wales (NSW). The shapefiles contain data on risks and land-use pressures at a subcatchment scale. The raster file contains finer resolution data (1 hectare) on land-use pressures. The naming convention of the shapefiles is based on: i) the estuary and catchment name (e.g. MANNING_RIVER) ii) a north-south number (e.g. _047), indicative of the location of the estuary and catchment along the NSW coast, and iii) an identifier which describes the data contained in the file (i.e. _HR, _NL, _NLF). A shapefile with an identifier of ‘HR’ (e.g. MANNING_RIVER_047_HR.shp) denotes that the shapefile contains data on risks (health risks). The shapefile defines the catchment of an estuary divided into smaller drainage areas/subcatchments based on waterways larger or equal in size to third-order streams. Each subcatchment has three main data attributes: likelihood scores, consequence scores and risk scores. Likelihood scores represent the extent and intensity of land-use pressure from each subcatchment, with a score of 1 indicating the lowest likelihood of impact and a score of 4 the highest likelihood of impact on estuary health. Consequence scores represent the extent of impact on estuary health, with a score of 1 indicating the lowest chance of impact and a score of 4 indicating the highest chance of impact. Risk is a product of the likelihood and consequence scores (i.e. likelihood x consequence = risk), with a maximum score of 16 indicating the greatest risk and a score of 1 indicating the lowest risk. The method for calculating risk scores follows the procedure outlined in the NSW Treasury’s Risk Management Toolkit. The intent of the dataset is to help identify strategic priorities for managing nutrient and sediment runoff throughout a catchment so that estuary health is protected, maintained and/or improved. Risks from other pressures such as acid sulfate soils, erosion and contaminants are not considered. The overall risk score for each subcatchment provides a relative rank for use in prioritisations. The example for the Manning River in Figure 1 shows that subcatchments in the north east and south west areas have risk scores of 12. This indicates that runoff from these subcatchments poses the greatest risk to the ecological health of the Manning River. More detailed investigations on the causes of these risks (i.e. as part of Stage 2 of developing a coastal management program), would ideally be undertaken in these relatively high-risk subcatchments (see Section 4). A shapefile with an identifier of ‘NL’ (nutrient load), provides context for the likelihood scores. There are eight main data attributes based on exports of surface flows (SF) and total nitrogen (TN), total phosphorus (TP) and total suspended sediment (TSS) loads. The exports are presented as the total export from the subcatchment (kilograms/year) or the average export from one hectare in a subcatchment (kilogram/hectare/year; otherwise known as export rate or generation rate). Figure 2 provides an example of exports of TN from each subcatchment draining to the Manning River. Note the difference in spatial trends between Figures 2a and 2b. The smaller subcatchments around the lower Manning River

NSW Estuary Health Risk Dataset
4
are identified as high risk in Figure 2b where TN loads are expressed as kilogram/hectare/year, but not in Figure 2a where TN loads are expressed as total loads exported from the subcatchment (in kilograms/year). Risk scores in the NSW Estuary Health Risk Dataset are based on a default option of likelihood scores that incorporate both types of export data. The likelihood scores can, however, be recalculated using a subset as has been done for the Manning River. In this case, likelihood scores reflect the average exports of SF, TN, TP and TSS loads from one hectare of the subcatchment. Using only the average export rate (kilogram/hectare/year) places greater emphasis on the intensity of land uses within a subcatchment. It is worth noting that the likelihood of impact of the total loads from a subcatchment are inherently captured in the consequence scores (see Section 6). The raster file that is included in the NSW Estuary Health Risk Dataset has an identifier of ‘NLF’ (nutrient load flow). It has a grid size of one hectare (100 x 100 metres) with seven main data attributes that provide further context for likelihood scores. Attributes such as the climate zone, soil type and land use were used in catchment runoff modelling to produce modelled estimates of SF, and TN, TP and TSS loads. An example of the types of maps that can be produced from the raster file is shown in Figure 3. The maps are important because they provide context and/or can be used to inform more site-specific determinations of management actions within the prioritised subcatchment (see Section 4).
Figure 1 Map showing a ranking of subcatchments based on their relative risk of impact
(risk score 1–16) on the ecological health of the Manning River. A higher score indicates a greater risk of impact.

NSW Estuary Health Risk Dataset
5
Figure 2 Maps showing total nitrogen loads exported from subcatchments draining into
the Manning River. Exports are presented as (a) annual total load from each subcatchment (kilogram/year (kg/y)), and (b) average export of TN from 1 hectare (ha) of each subcatchment (kilogram/hectare/year).

NSW Estuary Health Risk Dataset
6
Figure 3 Maps showing the spatial variability in (a) land use, (b) soil types based on great soil group classification, (c) total suspended solid
exports (kilogram/hectare/year) and (d) climate zones of the Manning River catchment.

NSW Estuary Health Risk Dataset
7
4. Recommended use of the dataset
The incentive for the NSW Estuary Risk Health Dataset was based on over 4 years of consultation and collaboration between the former Office of Environment and Heritage (OEH) and local councils across New South Wales. This work found there was a fundamental need for maps that:
• identify areas in a catchment that pose relatively higher risks to the health of estuaries and, as a consequence, areas where land-use intensification is best avoided and/or where more stringent management controls are needed
• identify areas in a catchment where investments/resources for on-ground actions would achieve the best benefits for managing estuary health
• could be used for multi-objective spatial planning. In using the dataset, it is important to note that the shapefiles containing the risk scores are best used in combination with other datasets to strategically prioritise the location of management actions throughout a catchment. An example of how the maps have been used to develop appropriate actions for estuary-focussed management plans is described in the Tuross Water Quality Improvement Plan. Here, the risk scores were used to determine where catchment management efforts should be focussed to help improve water quality in the estuary. Pressures included sediment issues arising from forestry in the upper parts of the Tuross catchment, as well as nutrient and sediment issues from intense agricultural practices in the lower part of the catchment. The risk scores indicated that almost all subcatchments around the periphery of the Tuross River posed a relatively high risk, due to greater average exports of TN, TP and TSS per hectare and connectivity to the river. The Eurobodalla Shire Council subsequently focussed their field assessments on the periphery subcatchments, with a view to better characterise land-use pressures and identify site-specific management actions. Field assessments included measures of bank erosion severity, riparian vegetation condition, riparian buffer width and agricultural management practices such as stock access to the river and intensity of cropping practices. The last assessment on agricultural management practices was also used to ground truth the raster file (‘_NLF) included with the NSW Estuary Health Dataset for that area. The council then developed a heuristic site score that combined the field assessments and datasets. The heuristic site score was used to prioritise site-specific management actions. Note that the field assessments and heuristic scoring undertaken by the council is an example of a strategic impact assessment, which forms Step 4 of the Risk-based Framework. A similar approach has been used by other councils and local land services to identify management actions and knowledge gaps for coastal planning or prioritise locations for riparian revegetation and stream bank erosion works, as part of the Marine Estate Management Strategy. For example, the MidCoast Council are using risk scores as one consideration in their prioritisation of management actions to inform the development of their coastal management program for the Manning River. Other considerations include the risks of agricultural practices and septics on primary contact recreation and drinking water supply, hillslope and bank erosion, and acid sulfate soils. The North Coast Local Land Services are using risk scores to focus erosion control works in priority subcatchments. They undertook a strategic impact assessment (Step 4 of the Risk-based Framework) and presented outcomes at a stakeholder workshop for review. They are now undertaking more specific assessments within a prioritised subcatchment to site their erosion control works. These specific assessments include further refinement of their strategic impact assessments based on feasibility and site constraints. For example:

NSW Estuary Health Risk Dataset
8
• sites in close proximity that require bed and/or bank erosion control works that will address the effects of turbidity (including sedimentation) and where possible simultaneously address nutrient loads on downstream aquatic habitats
• sites that can be accessed by heavy machinery from the shore with minimal deleterious effects
• sites suitable for the placement of large woody debris to compliment erosion control works by providing additional aquatic habitat enhancement, enhancing instream denitrification processes and/or protection of high-value conservation vegetation.
5. Is the dataset suitable for your use?
Before using the NSW Estuary Health Risk Dataset, it is important to understand its limitations (see Section 7) and assess whether the dataset is suitable for your use. You may find that the priorities provided by the risk scores may not align with your local field measures or other existing prioritisations and/or estuary health assessments completed for your estuary and catchment. The flow chart in Figure 4 provides an example of some decisions that need to be made before using the dataset. The first step of the flow chart specifies a need to compare the mapped shapefile of risk scores with any local assessment, because the dataset is based on a state-wide assessment. If there are discrepancies, the recommendation is to review support files showing the subcatchment nutrient loads or the nutrient loads and flows per hectare, and/or move to Step 2 of the flow chart which highlights the limitation that the dataset was created using the 2007 land-use map. At this step, it is recommended that the 2007 land-use file (see raster file) is compared with more recent land-use data available for the catchment. Step 3 provides some direction on whether you will need to update the risk scores in Stage 2 of your preparation of coastal management programs, or undertake a further assessment on the suitability of the dataset before making a decision whether to use it.

NSW Estuary Health Risk Dataset
9
Figure 4 Flow chart to help decide whether the NSW Estuary Health Risk Dataset is suitable to use for assessing the health of an estuary.

NSW Estuary Health Risk Dataset
10
6. How the dataset was created
The NSW Estuary Health Risk Dataset is underpinned by an effects-based assessment (EBA), which makes up Step 2 of the Risk-based Framework. A typical EBA for estuaries in New South Wales (NSW) has been well-established by the Estuaries and Catchment Team of the Department of Planning, Industry and Environment. The EBA consists of a coupled series of catchment, hydraulic or hydrodynamic and ecological response models. The intent of the models is to predict: i) the quantity and quality of runoff from a catchment ii) transport of runoff and pollutants in an estuary, and iii) ecological responses to changes in algal biomass, water clarity and seagrass cover in an estuary. The coupled series of models was designed to operate at the catchment scale and serve as a ‘first pass’ assessment. This means that the modelled outputs provide a good representation of spatial trends to identify relative priorities, but do not provide absolute values to allow decisions on the amount of nutrients or sediments that need to be mitigated, or provide predictions on the absolute amount of algal biomass within an estuary.
6.1 Catchment runoff models
Catchment runoff models are available for all 184 coastal catchments in NSW. The models are based on a nutrient and sediment export coefficient modelling approach, where the catchment is divided into different land-use types, and the area of each land-use type is multiplied by an export coefficient (Roper et al. 2011). The export coefficient is defined as the rate at which total nitrogen (TN), total phosphorous (TP) or total suspended solid (TSS) loads from each land-use type is exported to the estuary. The total export or load of TN, TP or TSS from a subcatchment is the sum of the export for each land-use type in the subcatchment. Specific local export coefficients were generated, to capture the spatial variability in the climate zones, soil types (great soil group) and land uses in NSW (Roper et al. 2011). The export coefficients were expressed as kilograms per hectare of the catchment per year, and derived by multiplying modelled surface flows (Littleboy et al. 2009) with measured TN, TP or TSS export concentration data (per land use) from the published literature and state government monitoring projects (Roper et al. 2011). Surface flows were modelled using 2CSalt (Littleboy et al. 2009), which is part of a suite of Australian catchment modelling tools available in the eWater Toolkit. The models were originally developed to predict water and salt inputs to inland rivers, but were found to be directly applicable to coastal catchments in the state (Littleboy et al. 2009). The models were calibrated for the period between 1975 and 2008 to provide average long-term ‘steady state’ surface flows for each hectare in a catchment. This period was chosen because it captured dry, wet and average rainfall years in the state. Model predictions were tested against measured flow data available for NSW (r2 = 0.98; Littleboy et al. 2009; see also Appendix A).

NSW Estuary Health Risk Dataset
11
6.2 Estuary models (hydraulic, hydrodynamic or
ecological response)
Estuary models are available in this package for most estuaries in NSW. Estuary models are not provided for estuaries where more detailed modelling exists such as the Hunter River, Lake Macquarie, Tuggerah Lakes, or where data were limited such as Karuah River, Sydney Harbour and estuaries classified as bays. The complexity of the estuary model reflects the estuary type. For example, simple 1-dimensional (1D) box models were developed for lake-, lagoon- and creek-type estuaries (see Roper et al. 2011), also referred to as intermittently closed and open lakes and lagoons (ICOLLS). More complex 1D branched models were developed for estuaries classified as barrier rivers and drowned river valleys. The 1D box models are based on scaling and empirical relationships developed using the methods of Sanderson and Coade (2010). These models only consider TN exports from a catchment because nitrogen is considered to be the main determinant of primary production in tidal estuaries (Harris 2001). They consist of a hydrology component and an ecological response (or estuary condition) component. The hydrology component predicts the fate of the TN exports within an estuary (i.e. how much is retained and how much is lost to the coastal ocean), the sensitivity of the estuary to TN exports, and the potential risk of the estuary to eutrophication. Eutrophication is essentially the steady-state concentration of TN in the water column and reflects the sum of catchment-derived TN retained within an estuary, TN load from rainfall and TN load from the coastal ocean. The ecological response component predicts how the primary producers and water clarity in an estuary respond to the retained TN exports. Primary producers are represented by estimates of chlorophyll a (Chl a) and percentage seagrass cover, and water clarity is represented by Secchi depth. These model outputs correspond with the estuary condition indicators used in the NSW estuary health monitoring program (Hallett et al. 2016a, 2016b and 2016c). The 1D branched models are more complex than the 1D box models. They treat the main estuary branch as a linear representation of the estuary, but also include multiple tributaries joining the main branch to create a simple and accurate representation of more complex systems. However, the 1D branched models were only developed for estuaries classified as barrier rivers (Roper et al. 2011) and lose accuracy in systems where the estuary becomes wide. The 1D branched models consider how nutrient and sediment inputs from the heads of the main branch and tributaries are transported due to the advection of catchment runoff (moving downstream) and the propagation of the tides (moving upstream/downstream). The models also account for friction along the estuary floor (bottom friction), which allows for accurate dissipation of tidal energy and vertical mixing in the water column. This interaction of catchment runoff, tides and bottom friction provides a reliable estimate of the upstream transport of brackish water and downstream transport of freshwater. This results in metrics for estimating residence times, or flushing times, as a function of distance along the estuary, which is a driver of primary production in estuary systems. To create the dataset, 1D branched models were configured to produce two metrics: base exceedance and extent of potential impact (Figure 5). TN loads arising from small rainfall events (i.e. 1-year annual exceedance probability) were used as inputs to the 1D branched model on the assumption that the catchment runoff from these small, but frequent events will be retained within an estuary and hence pose the greatest risk of impacts on estuary health. Base exceedance was determined for each subcatchment by increasing the total TN loads for one subcatchment by 20% and re-running the model. An increase in TN concentrations within the estuary relative to base or ambient TN concentrations (i.e. base exceedance) provide a relative measure of the magnitude of impact of that one subcatchment. Figure 5a shows that subcatchment 88 has the greatest base exceedance and would pose the greatest risk of

NSW Estuary Health Risk Dataset
12
impact (i.e. a 20% increase in TN loads results in 100% increase in base or ambient TN concentrations), if this metric was considered alone. Figure 5b shows that the extent of potential impact (i.e. transport of runoff in the estuary) posed by subcatchment 88 is localised, affecting only 20% of the surface area of the estuary. By comparison, subcatchment 86 has relatively high base exceedance and has a more systemic impact because the runoff is transported to a larger area of the estuary. Note that base exceedance and extent of potential impact are both expressed as percentages, ranging from 0 to 100. A base exceedance of 100% indicates a doubling of the base or ambient TN concentrations in an estuary. Similarly, if the extent of potential impact is 100%, then TN loads from the subcatchment are transported to all areas of an estuary.

NSW Estuary Health Risk Dataset
13
Figure 5 Plots showing the (a) base exceedance and (b) extent of potential impact of total nitrogen loads in the Manning River.
Subcatchments (SCs) are listed on the x-axis.

NSW Estuary Health Risk Dataset
14
6.3 Risk analysis
The outcomes of the catchment and estuary models were classified into likelihood or consequence criteria (Tables 1a and b) and integrated via a risk matrix (Table 1c). Each square in the risk matrix represents a unique pairing of the consequence and likelihood risk criteria and, therefore, a risk level. As indicated in Section 3, likelihood criteria included SF, TN, TP and TSS loads from the subcatchment or loads per hectare. Consequence criteria included Secchi depth (water clarity), Chl a, TN concentrations (for 1D box models), or base exceedance and/or extent of potential impact (for 1D branched models). For example, a 1D branched model developed for the Manning River estuary only included the base exceedance and extent of potential impact as consequence criteria in the risk analysis. Risk scores for likelihood or consequence criteria were based on quantiles. Specifically, the modelled data were categorised into quantiles and attributed with a score of 1 if they were ≤25th percentile, a score of 2 if they were >25th and ≤50th percentile, a score of 3 if they were >50th and ≤75th percentile, or a score of 4 if they were >75th percentile. In addition to catchment runoff, the proximity of a subcatchment to an estuary was also considered to pose a likelihood of risk of impact on estuary health. Consequently, subcatchments that drain directly to an estuary were also attributed with a likelihood score of 4 to denote a high likelihood of risk of impacts on the ecosystem health of the estuary due to proximity. All other subcatchments were attributed with a very low likelihood score of 1. The risk matrix resulted in 16 discrete risk levels, which can be used to identify the current risks of impacts of catchment runoff from individual subcatchments to the ecosystem health of an estuary and the priority with which each of the risks need to be addressed (Table 1c). The score for each risk level in the matrix was determined by simply multiplying the likelihood and consequence scores. According to the international standard for risk management, multiple risk levels can be grouped into broader groups, and used as escalation or decision points for mitigating the risks. There are no defined rules for the number of groupings as long as there are clear reasons for them, ideally supported by quantitative information. The risk scores in the shapefile reflect the original risk score from the risk matrix, to provide flexibility for users to define their own groupings on multiple risk levels or in combination with risk assessments for other stressors (e.g. pH).

NSW Estuary Health Risk Dataset
15
Table 1a Likelihood scores define the chance that runoff from a subcatchment will have an impact on the ecological health of an estuary
Likelihood Score Description
High 4 Ecological health of estuaries has a high chance of impact from the subcatchment because total and/or per hectare surface flows, and TN, TP and TSS loads from a subcatchment are large. Large inputs are those in the >75th percentile.
Moderate 3 Ecological health of estuaries has a moderate chance of impact from the subcatchment because total and/or per hectare surface flows, and TN, TP and TSS loads from a subcatchment are moderate. Moderate inputs are those in the >50th and ≤75th percentile.
Low 2 Ecological health of estuaries has a low chance of impact from the subcatchment because inputs of total and/or per hectare surface flows, and TN, TP and TSS loads from a subcatchment are relatively low. Low inputs are those in the ≥25th and <50th percentile.
Very low 1 Ecological health of estuaries has a very low chance of impact from the subcatchment because total and/or per hectare surface flows, and TN, TP and TSS loads from a subcatchment are very low. Very low inputs are those in the <25th percentile.
Notes: TN = total nitrogen; TP = total phosphorus; TSS = total suspended solids.
Table 1b Consequence scores define the magnitude of impact on the ecological health of an estuary
Consequence Score Description
High 4 Impacts on the ecological health of an estuary are high because TN and Chl a concentrations, water clarity, base exceedance and/or extent of potential impact metrics are in the >75th percentile of the datasets.
Moderate 3 Impacts on the ecological health of an estuary are moderate because TN and Chl a concentrations, water clarity, base exceedance and/or extent of potential impact metrics are in the >50th and ≤75th percentile of the datasets.
Low 2 Impacts on the ecological health of an estuary are low because TN and Chl a concentrations, water clarity, base exceedance and/or extent of potential impact metrics are in the >25th and ≤50th percentile of the datasets.
Notes: TN = total nitrogen; Chl a = chlorophyll a.

NSW Estuary Health Risk Dataset
16
Table 1c Risk matrix to prioritise or rank subcatchments according to their risk of impacts on the ecological health of an estuary
Consequence
(Estuary health) 4 3 2 1
Likelihood
(catchment runoff – subcatchment totals and/or per hectare)
4 16 12 8 4
3 12 9 6 3
2 8 6 4 2
1 4 3 2 1
7. Limitations and scientific rigour
Where possible, model outcomes have been tested with independent data. Figures A1 and A2 in Appendix A provide examples of this independent data testing. The independent data were sourced from more recent monitoring of estuaries in New South Wales (NSW), undertaken by the Estuaries and Catchments Team of the Department of Planning, Industry and Environment (DPIE), and/or modelled data from independent modelling supplied by some local councils (and their contractors). It is important to note that only relative spatial trends should be inferred from the dataset given that the models underpinning the dataset were intentionally developed as a first-pass assessment only. It is also important to consider that the land-use map used in the catchment modelling was based on the NSW Land Use 2007, which was the best available state-wide dataset at the time of the study. No other land-use mapping was available until recently (NSW Land Use 2017). This 10-year gap introduces obvious uncertainty in the use of the Estuary Health Risk Dataset in areas where land use in a catchment has changed significantly. Users are therefore encouraged to determine whether the Estuary Health Risk Dataset needs to be updated using more recent land-use maps and supporting water quality and/or ecological health data collected for an estuary. These types of datasets can be obtained through the DPIE Sharing and Enabling Environmental Data (SEED) data portal (search term ‘estuaries’), or from regional monitoring efforts such as the Ecohealth Monitoring Program for the north coast of NSW. DPIE has a scientific rigour policy, which requires that all published works are reviewed by independent subject matter experts. To meet these requirements:
• The method for developing and using 1D box models has been published (and hence reviewed) in an international journal (Sanderson and Coade 2010).
• The method for developing and using 1D branched models was independently reviewed by the DPIE Estuaries and Catchment Team. The models have since been used by the team in other projects that have been reviewed by the Commonwealth Scientific Industrial Research Organisation.
• The method for developing and using catchment export coefficient models has been published (and hence reviewed) in a conference paper (Littleboy et al. 2009) and an OEH report (Roper et al. 2011).

NSW Estuary Health Risk Dataset
17
• Approaches for NSW estuary health monitoring, including indicators for estuary health, has been reviewed in an international journal (Hallett et al. 2016a, 2016b and 2016c)
• The method for the risk analysis is consistent with other risk analyses undertaken for the State’s waterways (Healey et al. 2012), and independently reviewed by subject matter experts in the NSW Department of Primary Industries – Water (now NSW Department of Industry – Crown Lands and Water) and the Victorian Environment Protection Authority.
This report was independently reviewed by coast and estuary officers at DPIE and the DPIE Estuaries and Catchments Team. A number of end-users within local government also kindly reviewed this document.
8. Access to the dataset
The NSW Estuary Health Risk Dataset and associated metadata are available from the Sharing and Enabling Environmental Data (SEED) portal (search term ‘estuaries’): https://www.seed.nsw.gov.au/ A list of data available for each estuary is provided in Appendix B, and a data dictionary is provided in Appendix C. Instructions on viewing the dataset are provided in Appendix D.
NSW Estuary Health Risk Dataset
18
9. References
Hallett C, Valesini F and Elliot M 2016a, A review of Australian approaches for monitoring, assessing and reporting estuarine condition: I. International context and evaluation criteria. Environmental Science and Policy, 66: 260–269. Hallett C, Valesini F, Scanes P, Crawford C., Gillanders B, Pope A, Udy J, Fortune J, Townsend S, Barton J, Ye Qifeng, Ross DJ, Martini K, Glasby T and Maxwell P 2016b, A review of Australian approaches for monitoring, assessing and reporting estuarine condition: II. State and Territory Programs. Environmental Science and Policy, 66: 270–281. Hallett C, Valesini F and Elliot M 2016c A review of Australian approaches for monitoring, assessing and reporting estuarine condition: II. Evaluation against international best practice and recommendations for the future. Environmental Science and Policy, 66: 282–291. Harris GP 2001, Biogeochemistry of nitrogen and phosphorus in Australian catchments, rivers and estuaries: effects of land use and flow regulation and comparisons with global patterns. Marine and Freshwater Research, 52(1): 139–149. Healey M, Raine A, Parsons L and Cook N 2012 River Condition Index in New South Wales: Method development and application. NSW Office of Water, Sydney.
Littleboy M, Sayers J and Dela-Cruz J 2009 Hydrological modelling of coastal catchments in New South Wales. 18th World IMACS/MODSIM Congress, Cairns, Australia 13–17 July 2009. Roper T, Creese B, Scanes P, Stephens K, Williams R, Dela-Cruz J, Coade G, Coates B and Fraser M 2011, Assessing the condition of estuaries and coastal lake ecosystems in NSW, Monitoring, evaluation and reporting program, Technical report series. Office of Environment and Heritage, Sydney. Sanderson B and Coade G 2010 Scaling the potential for eutrophication and ecosystem state in lagoons. Environmental Modelling and Software 25(6): 724–736.

NSW Estuary Health Risk Dataset
19
10. Appendix A
This appendix shows a comparison of the outputs of models used to create the NSW Estuary Health Risk Dataset with independent assessments.
Figure A1 Plots comparing the modelled annual average total nitrogen (TN), total phosphorus (TP), total suspended solids (TSS) loads and
surface flows exported from the Narrabeen Lagoon catchment (northern beaches, Sydney). The black circles in each plot represent one subcatchment. The x-axis denotes the loads or flows generated from catchment models used to create the NSW Estuary Health Risk Dataset, and the y-axis denotes the loads or flows generated from an independent catchment model (MUSIC) developed by the Northern Beaches Council.

NSW Estuary Health Risk Dataset
20
Figure A2 Plots comparing modelled and observed/field measurements of chlorophyll a
concentrations (measure of micro-algae) for estuaries classified as lakes, lagoons and creeks. Each circle in the plots represents an estuary. A linear trend was used to assess the relationship between the modelled and observed data, and an r2 statistic was used to assess the goodness of fit. Changes to the goodness-of-fit were evaluated sequentially (a–f) by comparing the percentages difference in observed and modelled outcomes, starting at predictions within 10% of observed values (a) and stopping at predictions within 60% of observed values (f).

NSW Estuary Health Risk Dataset
21
11. Appendix B
This appendix provides a list of data available for the 184 main estuaries and catchments in New South Wales.
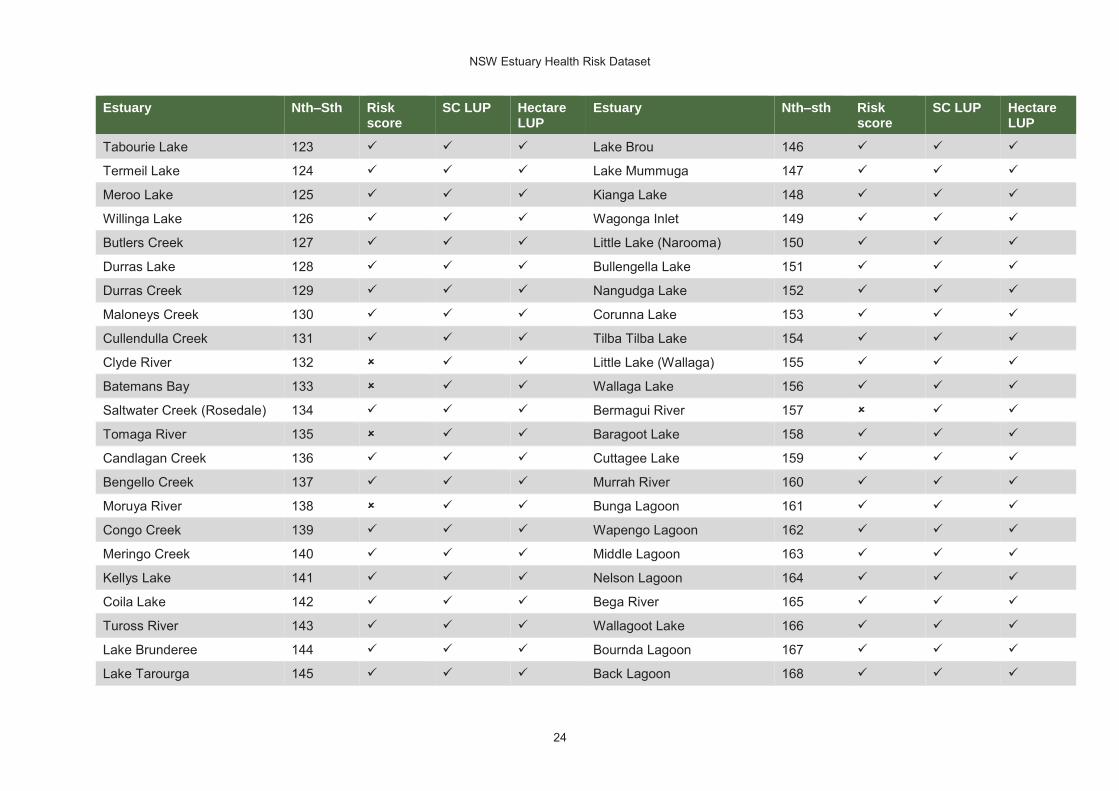
Table B.1 List of 184 estuaries in New South Wales, labelled north to south (Nth–Sth), showing corresponding data files available for download in the Sharing and Enabling Environmental Data (SEED) data portal. Three data files make up the NSW Estuary Health Risk Dataset: two shapefiles provide the data on risks (risk score) and land-use pressures (LUP) at the subcatchment (SC) scale, and one raster file provides finer resolution data (1 hectare) on land-use pressures (Hectare LUP). The three data files are available for most estuaries.
Estuary Nth–Sth Risk score
SC LUP Hectare LUP
Estuary Nth–sth Risk score
SC LUP Hectare LUP
Tweed River 001 ✓ ✓ ✓ Wooli Wooli River 017 ✓ ✓ ✓
Cudgen Creek 002 ✓ ✓ ✓ Station Creek 018 ✓ ✓ ✓
Cudgera Creek 003 ✓ ✓ ✓ Corindi River 019 ✓ ✓
Mooball Creek 004 ✓ ✓ ✓ Pipe Clay Creek 020 ✓ ✓ ✓
Brunswick River 005 ✓ ✓ Arrawarra Creek 021 ✓ ✓ ✓
Belongil Creek 006 ✓ ✓ ✓ Darkum Creek 022 ✓ ✓ ✓
Tallow Creek 007 ✓ ✓ ✓ Woolgoolga Lake 023 ✓ ✓ ✓
Broken Head Creek 008 ✓ ✓ ✓ Flat Top Point Creek 024 ✓ ✓ ✓
Richmond River 009 ✓ ✓ ✓ Hearns Lake 025 ✓ ✓ ✓
Salty Lagoon 010 ✓ ✓ ✓ Moonee Creek 026 ✓ ✓ ✓
Evans River 011 ✓ ✓ ✓ Pine Brush Creek 027 ✓ ✓ ✓
Jerusalem Creek 012 ✓ ✓ ✓ Coffs Creek 028 ✓ ✓ ✓
Clarence River 013 ✓ ✓ ✓ Boambee Creek 029 ✓ ✓ ✓
Lake Arragan 014 ✓ ✓ ✓ Bonville Creek 030 ✓ ✓ ✓
Cakora Lagoon 015 ✓ ✓ ✓ Bundageree Creek 031 ✓ ✓ ✓
Sandon River 016 ✓ ✓ ✓ Bellinger River 032 ✓ ✓ ✓

NSW Estuary Health Risk Dataset
22
Estuary Nth–Sth Risk score
SC LUP Hectare LUP
Estuary Nth–sth Risk score
SC LUP Hectare LUP
Dalhousie Creek 033 ✓ ✓ ✓ Port Stephens 055 ✓ ✓
Oyster Creek 034 ✓ ✓ ✓ Hunter River 056 ✓ ✓
Deep Creek 035 ✓ ✓ ✓ Glenrock Lagoon 057 ✓ ✓ ✓
Nambucca River 036 ✓ ✓ ✓ Lake Macquarie 058 ✓ ✓ ✓
Macleay River 037 ✓ ✓ ✓ Middle Camp Creek 059 ✓ ✓ ✓
South West Rocks Creek 038 ✓ ✓ ✓ Moonee Beach Creek 060 ✓ ✓ ✓
Saltwater Creek (Frederickton)
039 ✓ ✓ ✓ Tuggerah Lake 061 ✓ ✓ ✓
Korogoro Creek 040 ✓ ✓ ✓ Wamberal Lagoon 062 ✓ ✓ ✓
Killick Creek 041 ✓ ✓ ✓ Terrigal Lagoon 063 ✓ ✓ ✓
Goolawah Lagoon 042 ✓ ✓ ✓ Avoca Lake 064 ✓ ✓ ✓
Hastings River 043 ✓ ✓ ✓ Cockrone Lake 065 ✓ ✓ ✓
Cathie Creek 044 ✓ ✓ ✓ Brisbane Water 066 ✓ ✓ ✓
Duchess Gully 045 ✓ ✓ ✓ Hawkesbury River 067 ✓ ✓
Camden Haven River 046 ✓ ✓ ✓ Pittwater 068 ✓ ✓ ✓
Manning River 047 ✓ ✓ ✓ Broken Bay 069 ✓ ✓
Khappinghat Creek 048 ✓ ✓ ✓ Narrabeen Lagoon 070 ✓ ✓ ✓
Black Head Lagoon 049 ✓ ✓ ✓ Dee Why Lagoon 071 ✓ ✓ ✓
Wallis Lake 050 ✓ ✓ ✓ Curl Curl Lagoon 072 ✓ ✓ ✓
Smiths Lake 051 ✓ ✓ ✓ Manly Lagoon 073 ✓ ✓ ✓
Myall River 052 ✓ ✓ ✓ Middle Harbour Creek 074 ✓ ✓
Karuah River 053 ✓ ✓ Lane Cove River 075 ✓ ✓
Tilligerry Creek 054 ✓ ✓ ✓ Parramatta River 076 ✓ ✓

NSW Estuary Health Risk Dataset
23
Estuary Nth–Sth Risk score
SC LUP Hectare LUP
Estuary Nth–sth Risk score
SC LUP Hectare LUP
Port Jackson 077 ✓ ✓ Crooked River 100 ✓ ✓
Cooks River 078 ✓ ✓ Shoalhaven River 101 ✓ ✓ ✓
Georges River 079 ✓ ✓ Wollumboola Lake 102 ✓ ✓ ✓
Botany Bay 080 ✓ ✓ Currarong Creek 103 ✓ ✓ ✓
Port Hacking 081 ✓ ✓ Cararma Creek 104 ✓ ✓ ✓
Wattamolla Creek 082 ✓ ✓ ✓ Wowly Gully 105 ✓ ✓ ✓
Hargraves Creek 083 ✓ ✓ ✓ Callala Creek 106 ✓ ✓ ✓
Stanwell Creek 084 ✓ ✓ ✓ Currambene Creek 107 ✓ ✓ ✓
Flanagans Creek 085 ✓ ✓ ✓ Moona Moona Creek 108 ✓ ✓ ✓
Woodlands Creek 086 ✓ ✓ ✓ Flat Rock Creek 109 ✓ ✓ ✓
Slacky Creek 087 ✓ ✓ ✓ Captains Beach Lagoon 110 ✓ ✓ ✓
Bellambi Gully 088 ✓ ✓ ✓ Telegraph Creek 111 ✓ ✓ ✓
Bellambi Lake 089 ✓ ✓ ✓ Jervis Bay 112 ✓ ✓
Towradgi Creek 090 ✓ ✓ ✓ St Georges Basin 113 ✓ ✓ ✓
Fairy Creek 091 ✓ ✓ ✓ Swan Lake 114 ✓ ✓ ✓
Allans Creek 092 ✓ ✓ ✓ Berrara Creek 115 ✓ ✓ ✓
Port Kembla 093 ✓ ✓ Nerrindillah Creek 116 ✓ ✓ ✓
Lake Illawarra 094 ✓ ✓ ✓ Conjola Lake 117 ✓ ✓ ✓
Elliott Lake 095 ✓ ✓ ✓ Narrawallee Inlet 118 ✓ ✓ ✓
Minnamurra River 096 ✓ ✓ ✓ Mollymook Creek 119 ✓ ✓ ✓
Spring Creek 097 ✓ ✓ ✓ Millards Creek 120 ✓ ✓ ✓
Munna Munnora Creek 098 ✓ ✓ ✓ Ulladulla 121 ✓ ✓
Werri Lagoon 099 ✓ ✓ ✓ Burrill Lake 122 ✓ ✓ ✓
NSW Estuary Health Risk Dataset
24
Estuary Nth–Sth Risk score
SC LUP Hectare LUP
Estuary Nth–sth Risk score
SC LUP Hectare LUP
Tabourie Lake 123 ✓ ✓ ✓ Lake Brou 146 ✓ ✓ ✓
Termeil Lake 124 ✓ ✓ ✓ Lake Mummuga 147 ✓ ✓ ✓
Meroo Lake 125 ✓ ✓ ✓ Kianga Lake 148 ✓ ✓ ✓
Willinga Lake 126 ✓ ✓ ✓ Wagonga Inlet 149 ✓ ✓ ✓
Butlers Creek 127 ✓ ✓ ✓ Little Lake (Narooma) 150 ✓ ✓ ✓
Durras Lake 128 ✓ ✓ ✓ Bullengella Lake 151 ✓ ✓ ✓
Durras Creek 129 ✓ ✓ ✓ Nangudga Lake 152 ✓ ✓ ✓
Maloneys Creek 130 ✓ ✓ ✓ Corunna Lake 153 ✓ ✓ ✓
Cullendulla Creek 131 ✓ ✓ ✓ Tilba Tilba Lake 154 ✓ ✓ ✓
Clyde River 132 ✓ ✓ Little Lake (Wallaga) 155 ✓ ✓ ✓
Batemans Bay 133 ✓ ✓ Wallaga Lake 156 ✓ ✓ ✓
Saltwater Creek (Rosedale) 134 ✓ ✓ ✓ Bermagui River 157 ✓ ✓
Tomaga River 135 ✓ ✓ Baragoot Lake 158 ✓ ✓ ✓
Candlagan Creek 136 ✓ ✓ ✓ Cuttagee Lake 159 ✓ ✓ ✓
Bengello Creek 137 ✓ ✓ ✓ Murrah River 160 ✓ ✓ ✓
Moruya River 138 ✓ ✓ Bunga Lagoon 161 ✓ ✓ ✓
Congo Creek 139 ✓ ✓ ✓ Wapengo Lagoon 162 ✓ ✓ ✓
Meringo Creek 140 ✓ ✓ ✓ Middle Lagoon 163 ✓ ✓ ✓
Kellys Lake 141 ✓ ✓ ✓ Nelson Lagoon 164 ✓ ✓ ✓
Coila Lake 142 ✓ ✓ ✓ Bega River 165 ✓ ✓ ✓
Tuross River 143 ✓ ✓ ✓ Wallagoot Lake 166 ✓ ✓ ✓
Lake Brunderee 144 ✓ ✓ ✓ Bournda Lagoon 167 ✓ ✓ ✓
Lake Tarourga 145 ✓ ✓ ✓ Back Lagoon 168 ✓ ✓ ✓

NSW Estuary Health Risk Dataset
25
Estuary Nth–Sth Risk score
SC LUP Hectare LUP
Estuary Nth–sth Risk score
SC LUP Hectare LUP
Merimbula Lake 169 ✓ ✓ ✓
Pambula River 170 ✓ ✓ ✓
Curalo Lagoon 171 ✓ ✓ ✓
Shadrachs Creek 172 ✓ ✓ ✓
Nullica River 173 ✓ ✓ ✓
Boydtown Creek 174 ✓ ✓ ✓
Towamba River 175 ✓ ✓ ✓
Fisheries Creek 176 ✓ ✓ ✓
Twofold Bay 177 ✓ ✓
Saltwater Creek (Eden) 178 ✓ ✓ ✓
Woodburn Creek 179 ✓ ✓ ✓
Wonboyn River 180 ✓ ✓ ✓
Merrica River 181 ✓ ✓ ✓
Table Creek 182 ✓ ✓ ✓
Nadgee River 183 ✓ ✓ ✓
Nadgee Lake 184 ✓ ✓ ✓

NSW Estuary Health Risk Dataset
26
12. Appendix C
This appendix provides information about the attributes of the three data files that make up the NSW Estuary Health Risk Dataset.
12.1 Shapefile of risk scores
The risk scores shapefile was created in ArcMap 10.4. All files have a geographic coordinate system: GDA 1994. The subcatchment boundaries were created with ArcHydro tools using a 25-metre digital elevation model. Flow directions were constrained by known hydrolines (stream network) and the upper tidal limit boundaries, which were created as part of the NSW Monitoring, Evaluation and Reporting Strategy 2010–2015.
Table C.1 Description of attributes of shapefile containing risk scores
Attribute Description Source
ZoneID Unique identifier for subcatchment Automatically generated through subcatchment delineation using ArcHydro tools
Catchment Identifies which catchment each subcatchment is a part of
Automatically generated through catchment delineation using ArcHydro tools
Nth–Sth Numeric identifier of catchment relationship to estuary order, from north to south along the NSW coast
Assigned after catchment and subcatchment delineation using ArcHydro tools
Likelihood Likelihood score Likelihood data represent the land-use pressures arising from the each subcatchment (TN, TP, TSS loads). Likelihood is ranked from 1 (lowest) to 4 (highest).
Consequence Consequence score Consequence data represent either the ecological response (chlorophyll a, turbidity) or sensitivity (based on hydrodynamics) of the estuary to TN loads from each subcatchment, and proximity to environmental assets. Consequence is ranked from 1 (lowest) to 4 (highest).
Risk Risk score Ranking based on a risk analysis (likelihood x consequence), as per NSW Treasury Guidelines. Risk is ranked from 1 (lowest) to 16 (highest).
Notes: TN = total nitrogen; TP = total phosphorus; TSS = total suspended solids.

NSW Estuary Health Risk Dataset
27
12.2 Shapefile of subcatchment loads and flows
The subcatchment loads and flows shapefiles has a geographic coordinate system: GDA 1994. The subcatchment boundaries were created with ArcHydro tools using a 25-metre digital elevation model. Flow directions were constrained by known hydrolines (stream network) and upper tidal limit boundaries, which were created as part of the NSW Monitoring, Evaluation and Reporting Strategy 2010–2015.
Table C.2 Description of attributes of shapefile containing subcatchment nutrient and sediment loads and surface flows
Attribute Description Source
ZoneID Unique identifier for subcatchment Automatically generated through subcatchment delineation using ArcHydro tools.
Catchment Identifies which catchment each subcatchment is a part of
Automatically generated through catchment delineation using ArcHydro tools.
Nth–Sth Numeric identifier of catchment relationship to estuary order, from north to south along the NSW coast
Assigned after catchment and subcatchment delineation using ArcHydro tools.
SF_Lha Annual average surface flow (L/ha) exported from each hectare
Modelled flow outputs from unsaturated zone models PERFECT and HYDRUS2D, using specified land-use categories.
SF_L Annual total surface flows (L/y) exported from each subcatchment
Modelled flow outputs from unsaturated zone models PERFECT and HYDRUS2D, using specified land-use categories.
TN_kgha Annual average nitrogen load (kg/ha) exported from each hectare
Modelled flow outputs from unsaturated zone models PERFECT and HYDRUS2D. The flows were multiplied by an event mean concentration for various land-use classes to derive the loads.
TN_kg Annual total nitrogen load (kg/y) exported from each subcatchment
Modelled flow outputs from unsaturated zone models PERFECT and HYDRUS2D. The flows were multiplied by an event mean concentration for various land-use classes to derive the loads.
TP_kgha Annual average total phosphorus load (kg/ha) from each hectare
Modelled flow outputs from unsaturated zone models PERFECT and HYDRUS2D. The flows were multiplied by an event mean concentration for various land-use classes to derive the loads.
TP_kg Annual total phosphorus load (kg/y) exported from each subcatchment
Modelled flow outputs from unsaturated zone models PERFECT and HYDRUS2D. The flows were multiplied by an event mean concentration for various land-use classes to derive the loads.
TSS_kgha Annual average suspended solids load (kg/ha) from each hectare
Modelled flow outputs from unsaturated zone models PERFECT and HYDRUS2D. The flows were multiplied by an event mean concentration for various land-use classes to derive the loads.

NSW Estuary Health Risk Dataset
28
TSS_kg Annual total suspended solids load (kg/y) exported from each subcatchment
Modelled flow outputs from unsaturated zone models PERFECT and HYDRUS2D. The flows were multiplied by an event mean concentration for various land use classes to derive the loads.
Notes: ha = hectare; kg = kilogram; L = litre; TN = total nitrogen; TP = total phosphorus; TSS = total suspended solids; y = year.
12.3 Raster file of loads and flows per hectare
The file for loads and flows per hectare is a grid/raster file with a cell size of 100 x 100 metres (1 hectare) and geographic coordinate system of GDA 1994. Table C.2 Description of attributes of shapefile containing subcatchment nutrient and sediment
loads and surface flows
Attribute Full name Description Source
Climate Climate zone Values correspond to climate zones for New South Wales, reflecting the total rainfall and rainfall seasonality
Modelled flow inputs from unsaturated zone models PERFECT and HYDRUS2D.
Soil Great soil group Text corresponds to great soil group classification
The Australian Soil Classification
Land use Land use Text corresponds to the second level of the Australian Land Use and Management Classification Version 7
The Australian Land Use and Management Classification Version 7
SF_LHA Annual average surface flows (L) exported from each grid (hectare)
Values (correspond to modelled surface flows, expressed as L/ha/y)
Modelled flow outputs from unsaturated zone models PERFECT and HYDRUS2D. The flows were multiplied by an event mean concentration for various land-use classes to derive the loads.
TN_KGHA Annual average total nitrogen (TN) load (kg) exported from each grid (hectare)
Values (correspond to modelled TN, expressed as kg/ha/y)
Modelled flow outputs from unsaturated zone models PERFECT and HYDRUS2D. The flows were multiplied by an event mean concentration for various land-use classes to derive the loads.
TP_KGHA Annual average total phosphorus (TP) load (kg) exported from each grid (hectare)
Values (correspond to modelled TP, expressed as kg/ha/y)
Modelled flow outputs from unsaturated zone models PERFECT and HYDRUS2D. The flows were multiplied by an event mean concentration for various land-use classes to derive the loads.
TSS_KGHA Annual average total suspended solids (TSS) load (kg) exported from each grid (hectare)
Values (correspond to modelled TSS, expressed as kg/ha/y)
Modelled flow outputs from unsaturated zone models PERFECT and HYDRUS2D. The flows were multiplied by an event mean concentration for various land-use classes to derive the loads.
Notes: ha = hectare; kg = kilogram; L = litre; TN = total nitrogen; TP = total phosphorus; TSS = total suspended solids; y = year.

NSW Estuary Health Risk Dataset
29
13. Appendix D
This appendix provides a guide on viewing the NSW Estuary Health Risk Dataset, using ArcMap 10.4. The principles are applicable to other geographic information systems (GIS).
13.2 Viewing the shapefiles
Refer to Figure D1 Once you have loaded the shapefile into ArcMap, change the display to reflect the desired attribute by right clicking on the layer in the Table of Contents and select ‘properties’. This opens the ‘Layer Properties’ dialog box. Navigate to the ‘Symbology’ tab and select ‘Categories’ on the left-hand side of the dialog box. Use the drop-down menu underneath ‘Value Field’ to display the desired attribute, i.e. ‘Risk’. Once selected, click ‘Add All Values’ and if preferred, change the display colour by selecting a ‘Colour Ramp’ from the dropdown menu on the right-hand side or double click the ‘Value’ to select a new colour individually. Once complete click ‘OK’ to apply and view changes.
13.3 Viewing the raster file
Refer to Figure D2 Once you have loaded the raster file into ArcMap, change the display to reflect the desired attribute by right clicking on the layer in the Table of Contents and select ‘properties’. This opens the ‘Layer Properties’ dialog box. Navigate to the ‘Symbology’ tab and select ‘Unique Values’ underneath the ‘Show:’ field on the left-hand side. Use the drop-down menu underneath ‘Value Field’ to select the desired attribute to display, e.g. Climate, and if preferred, change the colour of the colour scheme by using the drop-down menu or individual colours by double clicking on values. Once complete click ‘OK’ to apply and view changes.

NSW Estuary Health Risk Dataset
30
Figure D1 Steps to follow to view shapefiles in ArcMap 10.4.

NSW Estuary Health Risk Dataset
31
Figure D2 Steps to follow to view the raster file in ArcMap 10.4