Department of Justice Oil Pipeline Deregul · Department of Justice Oil Pipeline Deregulation ......
185
Department of Justice Oil Pipeline Deregulation (1986) This report by the United States Department of Justice is a useful reference in reviewing market-based rate applications of oil pipelines. It is frequently cited in these cases before the Commission. The Department of Justice found that oil pipelines face significant competition in most markets. The report concluded that most crude oil and refined petroleum products pipelines could be safely deregulated. Additionally, the report recommended that all new crude oil pipelines could be deregulated.
Transcript of Department of Justice Oil Pipeline Deregul · Department of Justice Oil Pipeline Deregulation ......

Department of Justice
Oil Pipeline Deregulation
(1986)
This report by the United States Department of Justice is a useful reference in
reviewing market-based rate applications of oil pipelines. It is frequently cited in these
cases before the Commission. The Department of Justice found that oil pipelines face
significant competition in most markets. The report concluded that most crude oil and
refined petroleum products pipelines could be safely deregulated. Additionally, the
report recommended that all new crude oil pipelines could be deregulated.

Unofficial FERC-Generated PDF of 20050808-0259 Issued by FERC OSEC 08/08/2005 in Docket#: -
OH PjpeUne Deregulation Report of the U.S. Deoartment of bletlce.
May 1986
The United States Department of Justice issued its Report on OD Pipeline DereauJatlon (Report) In May, 1986. This Report resulted from an extensive study of lntenlate oil pipelines and a desire to lessen regulatory control over those common carrien.
The Report concluded that the majority of the crude oil and oil products pipelines could be safely deregulated (Report at vii), and that all new pipelines allould be releaaed from federal regulation (Report at xiv). The Report also found that despite their natural monopoly c:baracterlstic, oil pipelines face significant competition In moat markeiB (Report It lx). The Report recommended continued regulation only for those pipelines compet1na In hlJbly concentrated market& (Report at xi.).
The Report recommended the continued regulation of five pmduc!a pipelines and deregulation of all crude oH pipelines In the lower forty-eight states (Report at 61-78). It also found that the operation of six other products pipelines render a judgement call impoulble at this time (Report at 78-92).

Unofficial FERC-Generated PDF of 20050808-0259 Issued by FERC OSEC 08/08/2005 in Docket#: -
Oil Pipeline Dere&Jllation Report of the U.S. Department of Justice,
May 1986

Unofficial FERC-Generated PDF of 20050808-0259 Issued by FERC OSEC 08/08/2005 in Docket#: -
•. S. Dep3rtment of Justice Antllrust D1viswn
·Oil Pipeline Deregulation Report of the U.S. Department of Justice
·May 1986

Unofficial FERC-Generated PDF of 20050808-0259 Issued by FERC OSEC 08/08/2005 in Docket#: -
OIL PIPELINE DEREGULATION
Report of the u.s. Department of Justice
May 1986

Unofficial FERC-Generated PDF of 20050808-0259 Issued by FERC OSEC 08/08/2005 in Docket#: -
REPORT STAFF
This Report was prepared by the Antitrust Division of the
Department of Justice, Douglas H. Ginsburg, Assistant Attorney
General. The Report was written by Charles J. Untiet, Economist,
Economic Regulatory Section, and Frederick R. Warren-Boulton.
Deputy Assistant Attorney General, with the assistance of
economists and attorneys in the Antitrust Division, notably
Jon M. Joyce, Chief, Economic Litigation section, and under the
general supervision of Frederick R. Warren-Boulton, Deputy
Assistant Attorney General and Charles F. Rule, Deputy Assistant
Attorney General.
iii

Unofficial FERC-Generated PDF of 20050808-0259 Issued by FERC OSEC 08/08/2005 in Docket#: -
TABLE OF CONTENTS
EXECUTIVE SUMMARY .
I. INTRODUCTION ....
II. ECONOMIC PRINCIPLES UNDERLYING THE STUDY
A. Important Characteristics of Oil Pipelines
B. Pipeline Market Power
C. The Economic Welfare Criterion
III. ASSESSING THE DEGREE OF PIPELINE MARKET POWER AND THE RATIONALE FOR PIPELINE REGULATION
A. Competitors. in the Relevant Markets
B. Geographic Scope of Markets
C. The Herfindahl-Hirschman Index: The Initial Criterion of Market Power
1.
2.
Assigning Market Shares and Calculating the HHI . . . .
The HHI Threshold for the Initial Designation of Pipeline Market Power
D. Other Criteria for Assessing the Justification
vii
1
5
5
9
ll
15
16
20
23
24
29
for Pipeline Regulation . . . . . . . . . . . 33
1. Factors that Indicate Insufficient Market Power . . . . . . . . . .
2. Factors that Indicate Regulation May Be Ineffective . . . . . .
IV. CHOOSING THE PROPER UNIT OF REGULATION
A. Pipelines,.Not Markets. Should Be Deregulatea . . . . . . . . .
B. Defining Pipelines for Deregulation
1. Theoretical Principles .....
v
34
36
43
43
44
46

Unofficial FERC-Generated PDF of 20050808-0259 Issued by FERC OSEC 08/08/2005 in Docket#: -
2.
3.
Data Considerations
Definition of ''Pipeline'' for Deregulation Purposes
. . . . . . . . .
. . . . . . . . .
V. THE DATA USED IN THE REPORT
VI. RECOMMENDATIONS FOR INDIVIDUAL OIL PIPELINES
A. Introduction . .
B. Pipelines Recommended For Continued Regulation . . .
c. Pipelines For Which a Recommendation to Deregulate Is too Close to Call at This Time
D. Selected Pipelines Recommended for Deregulation . .
VII. DEREGULATION OF NEW OIL PIPELINES
APPENDIX--MAPS OF CRUDE AND PRODUCT PIPELINES IN THE LOWER-48 UNITED STATES . . . . . . . . .
vi
49
52
55
61
61
65
78
92
143
157

Unofficial FERC-Generated PDF of 20050808-0259 Issued by FERC OSEC 08/08/2005 in Docket#: -
EXECUTIVE SUMMARY
I. INTRODUCTION
This Report by the Antitrust Division of the Department of
Justice analyzes the need for continued federal regulation of
crude oil and refined petroleum product pipelines. While the
Department believes that most oil pipelines can be safely
deregulated, it believes that there are at least five, and
perhaps as many as eleven, pipelines with significant market
power that should remain regulated.
In May 1984, the Department released a Preliminary Report
on competition in the oil •pipeline industry. 1/ On July 16,
1984, the Department placed a notice in the Federal Register
soliciting comments on its Preliminary Report. This Report
reflects the Department's consideration of comments from
industry representatives and other interested parties.
This Executive Summary discusses the factors that the
Department t.akes into account in assessing the need for
continued federal regulation of oil pipelines. It closes by
listing those oil pipelines that the Department believes should
continue to be regulated, and those pipelines that are "too
close to call" at tq·iS time. The Department supports the
l/ u.s. Department of Justice, Competition in the Oil Pipeline Industry: A Preliminary Report (May 1984).
vii

Unofficial FERC-Generated PDF of 20050808-0259 Issued by FERC OSEC 08/08/2005 in Docket#: -
elimination of federal regulation of oil pipelines not fallinq
within these two categories. The Report does not discuss the
Trans Alaska Pipeline System (TAPS) which the Department
maintains should remain federally requlated. Furthermore. the
Report does not address the questions of whether existing state
requlation of oil pipelines should be modified or eliminated;
II. DISCUSSION
A. Economic Characteristics of Oil Pipelines
While many oil pipelines face competition, pipelines
nevertheless exhibit three economic characteristics that can
result in market power. A deregulation recommendation for any
pipeline requires & careful study of how these characteristics
affect competition in markets the pipeline. serves. First, oil
pipelines are a highly efficient mode for long distance
transportation of petroleum. Only water transportation,
particularly ocean-goinq tankers. can rival the efficiency of
oil pipelines, and water transportation is not available in
many locations. Second, oil pipelines feature economies of
scale over a larqe range of throughput volume. Some costs,
such as those for right-of-way and communications equipment.
are invariant to pipeline throuqhput. Steel pipe costs and
power costs also exhibit economies of scale. The friction
within a pipeline and the cost of pipe are roughly proportional
to the diameter of the pipeline. while its throughput volume is
viii

Unofficial FERC-Generated PDF of 20050808-0259 Issued by FERC OSEC 08/08/2005 in Docket#: -
roughly proportional to the ~re of its diameter. Thus, the
per barrel cost of pipeline transportation tends to fall with
increased output. giving oil pipelines the economic charac
teristic of a natural monopoly. Third, unlike other modes of
transportation. oil pipelines are not mobile. Thus. oil
pipelines are not an example of an industry that, due to "hit
and run entry," can perform competitively even in highly
concentrated markets.
B. Oil Pipeline Markets
This Report considers four types of oil pipeline markets.
An individual oil pipeline segment almost always specializes in
either crude oil or refined petroleum products, and switching
from one to the other is very costly. Thus. there are two types
of pipelines--crude pipelines and products pipelines--and each
operates in two types of markets--origin markets, upstream, and
destination markets, downstream. In origin markets, the poten
tial competitive concern is the exercise of monopsony power.
In destination markets. the potential competitive concern is the
exercise of monopoly power downstream. The study thus focuses
on four types of markets: crude origin, crude destination,
product origin, and product destination.
C. Competition Faced by Oil Pipelines
Despite their natural monopoly characteristic~. oil pipe
lines face significant competition in most markets. New oil
ix

Unofficial FERC-Generated PDF of 20050808-0259 Issued by FERC OSEC 08/08/2005 in Docket#: -
pipelines are sometimes constructed to compete with existing
pipelines in response to changes in regional patterns of supply
and demand. Oil pipelines face competition in port areas from
river barges and ocean-going tankers. In crude origin markets,
crude pipeli~es may also compete with local refineries. In
crude destination markets, crude pipelines may compete with
local crude producers. Likewise, in product origin markets,
product pipelines may compete with local marketers of petroleum
products, while, in product destination markets. product
pipelines may compete with local refineries.
D. The Measurement of Pipeline Market Power
The Department views a pipeline's potential for the
exercise of market power to be indicated by the number and size
distribution of firma in markets in which the pipeline
operates. In each market, this is measured by the
Herfindahl-Hirachman Index ("HHI") of market concentration,
which is calculated by summing the squares of the market shares
of all firms in the market. The social coats of regulation
must be balanced in each market against the potential social
losses from the exercise of market power. Since the direct
costs of regulation as well as the indirect costs in the form
of resource allocation distortions are likely to be invariant
to the degree of market concentration. while the potential
losses from the exercise of market power increase with the
degree of concentration, the Department recommends that only
X

Unofficial FERC-Generated PDF of 20050808-0259 Issued by FERC OSEC 08/08/2005 in Docket#: -
those pipelines competing in highly concentrated markets
warrant continued regulation. The potential social losses from
exploitation of market power in less concentrated markets are
too small to justify continued regulatory costs.
For the purpose of pipeline deregulation. the Department
has chosen a minimum HHI threshold of 2500 as a test of whether
an unregulated market could cause market power problems. An
HHI pf 2500 would be found, for example, in a market composed
of 4 equally sized firms. For purposes of the Report. if the
HHI is less than or equal to 2500, the market is considered
sufficiently competitive for deregulation. For example, if a
product destination market consists of 5, equally sized.
independent pipelines, it$ HHI is 2000. Assuming that none of
these pipelines poses problems in other destination or origin
markets. the Department would recommend deregulation of all 5
pipelines. on the other hand. if the HHI in a market exceeds
2500, it is tentatively designated a "high-risk" market.
suggesting a strong likelihood of noncompetitive behavior in
that market in the event of deregulation of all the pipelines
serving it. This tentative designation may be changed if other
offsetting considerations so indicate.
E. Geographic Scope of Markets :
The methodology used by the Department to define markets is
found in the Department of Justice's Merger Guidelines. For
the purposes of organizing capacity data, however. the Report
xi
Unofficial FERC-Generated PDF of 20050808-0259 Issued by FERC OSEC 08/08/2005 in Docket#: -
uses 181 Economic Areas or "BEAs" defined by the Bureau of
Economic Analysis of the u.s. Department of Commerce. While
SEAs may be only rough approximations of true geographic market
boundaries. the BEA concentration figures nonetheless serve as
useful indicators of market concentration. In cases where BEAs
are unsuitable for use as geographic markets, the Department
has reconsidered the scope of the relevant markets in order to
analyze properly the competitive situation in such markets.
F. Factors That Indicate Insufficient Market Power
Market concentration is not the sole indicator of market
power. Even if a market is highly concentrated, as indicated
by a HHI in excess of 2500, other factors may eliminate
concerns from deregulation of that pipeline. One such factor
is the presence of a pipeline in a concentrated market
coincidently with a rival, regulated pipeline having excess
capacity. In such a circumstance. an effective price ceiling
will be sustained at the allowed tariff of the regulated
pipeline an~ regulating small rivals pipelines in the same
market is unnecessary.
The presence of port facilities in the market may also
indicate a more competitive market than the HHI alone would
suggest. The key qUestion is whether the concentrated market
is served by a port that can easily expand its petroleum
traffic. If so, the threat of expansion of water transport
could be expected to check any increase in pipeline tariffs
after deregulation.
xii

Unofficial FERC-Generated PDF of 20050808-0259 Issued by FERC OSEC 08/08/2005 in Docket#: -
G. Pipelines, Not Markets, Should be Deregulated
The factors outlined above determine whether or not a
market is "high-risk." However, pipelines, and not markets,
are the appropriate entities for regulation or deregulation.
Market-by-market deregulation does not appear to be a practical
or cost effective policy due to the necessity and difficulty of
all~cating a pipeline's costs over its several markets. Thus,
the Department's recommendations are on a pipeline-by-pipeline
basis, rather than on a market-by-market basis.
A pipeline company may own several unconnected systems in
various sections of the country. currently, the Federal Energy
Regulatory Commission ("FERC") regulates oil pipelines on a
pipeline company basis, not on a pipeline basis. Thus, the
FERC currently allows a pipeline company to combine all of its
systems in ascertaining whether its overall rate of return is
reasonable. ~/ The Report contains a new definition of
"pipeline" for deregulation purposes. The definition separates
all crude pipelines from refined product pipelines. It also
separates a pipeline company into a number of individual com
ponent pipelines, subject to the provision that no component
pipeline supplies, or is supplied by, another component
~I In Opinion No. 154, FERC held that it would regulate on the basis of pipeline systems not companies; if a company owned a pipeline in the midwest and another in California, the two systems would be separately regulated. Williams Pipe Line Company, 21 FERC (CCH) f 61,260 (1982).
xiii

Unofficial FERC-Generated PDF of 20050808-0259 Issued by FERC OSEC 08/08/2005 in Docket#: -
pipeline. This provision, like the decision not to deregulate
on a market-by-market basis, is designed to eliminate the need
to perform the all but impossible cost-allocations that would
be required to effect company-by-company deregulation.
H. Deregulation of New Oil Pipelines
The Report recommends that newly built crude oil pipelines
not be federally regulated. As explained in greater detail in
the Report. regulation is not needed to prevent economically
inefficient behavior by new crude pipelines. In addition,
there exist strong positive justifications for deregulating new
product pipelines as well.
At the time that construction of a new pipeline first
becomes economically feasible, it is reasonable to assume that
there will be a large number of firms capable of building the
pipeline. thus ensuring competitive conditions at this time.
If contracts or joint venture agreements can freely be entered
into between these competitive potential builders and their
potential customers before the pipeline is built, then the
existence of numerous potential pipeline builders will be
sufficient to yield competitive, socially optimal results after
the pipeline is built. In contrast, the anticipation of
regulation of new oll pipelines could distort this private
contracting process and thereby produce inefficient. socially
undesirable investment and pricing decisions. Since the
potential ·for efficient private contracting appears to be high
xiv

Unofficial FERC-Generated PDF of 20050808-0259 Issued by FERC OSEC 08/08/2005 in Docket#: -
for new crude pipelines, and since the regulation of new crude
pipelines in particular can impose significant and costly
resource allocation distortions, the Department has concluded
that new crude oil pipeline should not be federally regulated.
In addition, while the case for deregulating all new product
pipeline is not as strong as for new crude pipelines, the
Department believes that, on balance, deregulation of new
product pipelines would also be advisable.
J. Individual Pipeline Analyses and Recommendations
A major portion of this Report is devoted to .the competitive
ana'Iysis of individual crude and product oil pipelines in the
contiguous United States.
The Department has not identified any crude pipeline that
presents a clear case for continued federal regulation. In most
instances. ·the structures of the markets in which the individual
crude pipelines operate do not appear to raise serious concerns.
In addition, there are theoretical considerations that tend to
lessen the need for continued federal regulation for crude
pipelines. Accordingly, the Department recommends that all
existing crude oil pipelines in the contiguous United States be
deregulated.
The Department recommends continued regulation for five
product lines: Colonial, Williams, Chevron (Salt Lake
Spokane), Southern Pacific, and Calnev. The discussion also
addresses six other prOduct lines for which the Department
XV

Unofficial FERC-Generated PDF of 20050808-0259 Issued by FERC OSEC 08/08/2005 in Docket#: -
currently lacks a fully adequate basis on which to predicate
any recommendation: Wyco, Badger, Yellowstone, West Shore,
Kaneb, and Texas Eastern. Furthermore, at this time the
Department does not make any recommendations with respect to
any liquefied petroleum gas (LPG), natural gas liquids (NGL),
and anhydrous ammonia pipelines. These pipelines are not
analyzed in this Report. The Department supports the prompt
de~equlation of all other oil pipelines currently subject to
federal regulation.
unofficial FERC-Generated PDF of 20050808-0259 Issued by FERC OSEC 08/08/2005 in Docket#: -
I. INTRODUCTION
This Report examines the state of competition in the
federally regulated oil pipeline industry in the contiguous
United States. !/ For many years, the Department of Justice
has believed that regulation is necessary for some, but not
all, interstate oil pipelines. In commenting on recent
proposals to deregulate the industry. the Department has stated
that only those pipelines the regulation of which can increase
economic efficiency should continue to be regulated.
Regulation should be retained only where its benefits outweigh
its costs. ~/ The continued regulation of any pipeline is
warranted only if it possesses significant market power and, if
deregulated, is likely to impose social costs in excess of
regulatory costs, since only then can regulation confer any
benefit. This Report outlines both a methodology for assessing
the need for continued federal regulation of oil pipelines and
the results·obtained from applying that methodology to oil
pipeline market data. It concludes by recommending the
elimination of federal regulation of all existing crude oil
1/ These oil pipelines are currently regulated with respect both to rates and to access obligations by the Federal Energy Regulatory Commission (FERC).
~/ Statement of William F. Baxter, Assistant Attorney General, Antitrust Division, U.S. Department of Justice, Concerning s. 1626, Department of Energy Organization Act Amendments of 1981, Before the Subcomm. on Energy Regulation of the Senate Comm. on Energy Regulation and Natural Resources, 97th Cong., 2d Sess. 1-2 (May 21, 1982).

Unofficial FERC-Generated PDF of 20050808-0259 Issued by FERC OSEC 08/08/2005 in Docket#: -
pipelines and a substantial number of oil product pipelines.
The Report concludes that five product pipelines should remain
subject to federal regulation, while six other product
pipelines remain "too close to call ·• at this time. Nothing in
this Report anticipates the elimination of tariff regulation
currently exercised by individual states.
This Report was undertaken due to a commitment to Congress
by .~he Department to conduct a study to identify those inter
state oil pipelines that should remain federally regulated. ~/
In May 1984, the Department released a Preliminary Report on
competition in the oil pipeline industry. !/ The Preliminary
Report outlined the methodology by which the Department proposed
to identify candidate pipelines for continued regulation. The
Preliminary Report also presented the data the Department pro
posed to use in its analysis. on July 16, 1984, the Department
placed a notice in the Federal Register soliciting comments on
its methodology and its data base.
In mid-october 1984, the Department received public comment
on the Preliminary Report from.interested parties, predominantly
from the oil pipeline industry. The most frequent industry
comments on methodology regarded the validity of BEA Economic
Areas as preliminary geographic markets: the use of throughput
,'
~/ Baxter, Supra note 2.
4/ u.s. Department of Justice, Competition in the Oil Pipeline Industry: A Preliminary Report (May 1984), "Preliminary Report."
-2-

Unofficial FERC-Generated PDF of 20050808-0259 Issued by FERC OSEC 08/08/2005 in Docket#: -
capacity, rather than on-take and off-take capacity; and the
HHI threshold value of 2500. While in some cases the industry's
comments on methodology were valid, they did not provide any
arguments that the Department had not already anticipated in
the Preliminary Report. In addition, with a few notable
exceptions, such as submissions by Sun and Buckeye. 21 the
industry did not provide helpful comments regarding the
Department's data base.
Chapter II discusses the economic principles underlying
the Department's study. It describes the economic welfare
criterion used by the Department to evaluate pipeline deregu
lation and explains why pipeline regulation can sometimes
enhance economic welfare.
Chapter III of the Report describes the methodology the
Department has used to analyze competition in pipeline markets
and to examine the need for continued regulation of individual
pipelines. It discusses the primary criterion used initially
to indicate market power--market concentration. It then
discusses various factors'that may indicate the absence of
significant market power, despite a high degree of market
concentration. Finally, Chapter III explains why regulation
may not always be able effectively to restrain the exercise of
such market power as a pipeline does have. Deregulation is
~/ Sun Pipe Line Company Comments, cover letter by John A. Ladner. Chief Counsel, October 11, 198~; Buckeye Pipeline Company comments, cover letter by Donald R. Merriman, President, OCtober 11, 198~.
-3-

Unofficial FERC-Generated PDF of 20050808-0259 Issued by FERC OSEC 08/08/2005 in Docket#: -
justified when effective regulation i's impossible.
Chapter IV discusses the issue of the proper unit for
regulation. The Department maintains that the appropriate unit
is a fully interconnected pipeline system owned by the same
person, not a pipeline company nor an individual pipeline
market. Chapter V discusses the data that the Department has
used to analyze the need for regulation of individual pipelines.
Chapter VI contains deregulation analyses for existing
individual pipelines and presents the Department's
recommendations. First, it discusses five product pipelines
recommended for continued federal regulation. Second, it
discusses six product pipelines for which no recl:ll1'111endation is
being made at this time. Finally, it discusses some pipelines
that are rec0l1'111ended for deregulation. The lines in all three
of these categortes were selected for discussion because a
preliminary structural screen indicated that a more detailed
investigation was warranted. At this time, the Department does
not make any recommendations with respect to any liquefied
petroleum gas (LPG), natural gas liquids (NGL), and anhydrous
ammonia pipelines. These pipelines are not analyzed in this
Report.
Chapter VII recol1'1!1ends that newly built crude oil pipelines
not be subject to f~eral regulation and explains why regula
tion is not needed to prevent economically inefficient behavior
by new crude oil pipelines. Chapter VII also explains that
there are strong justifications for not regulating new products
pipelines as well.

Unofficial FERC-Generated PDF of 20050808-0259 Issued by FERC OSEC 08/08/2005 in Docket#: -
. II. ECONOMIC PRINCIPLES UNDERLYING THE REPORT
A. Important Characteristics of Oil Pipelines
There are two types of oil pipelines--crude oil pipelines
and petroleum product pipelines. ~/ Crude oil pipelines
transport crude oil from producing fields or port terminals to
oil refineries. Petroleum product pipelines transport certain
petroleum products (motor gasoline, jet fuel. kerosene, diesel
fue}, and distillate heating oil) from oil refineries or port
terminals to product terminals located throughout the country.
several characteristics of oil pipelines must be taken into
account when considering deregulation. First, p~pelines are a
highly efficient means of transportation. For the movement of •
large volumes of either crude oil or petroleum products over
long distances, the per-unit cost of transportation by pipe
lines. is much lower than by truck or rail. 11 Only water
transportation can compete with pipelines over long distances,
~I For a detailed description of the oil pipeline industry. see G. Wolbert, u.s. Oil' Pipe Lines 1-158 (1979). For a concise discussion of the economic characteristics of oil pipelines, see J. Hansen, Competitive Aspects of the United States Petroleum Pipeline Industry (1980) (unpublished Ph.D. dissertation, Yale University), reprinted in Oil Pipeline Deregulation: Hearings on H.R. 4488 and H.R. 6815 Before the Subcomm. on Fossil and Synthetic Fuels of the House Comm. on Energy and Commerce, 97th Cong., 2d sess. 229 (1983) (here1nafter cited as 1982 House Hearings). The Hansen study has been revise4 and published as U.S. Oil Pipeline Markets (1983).
11 See, ~· Wolbert. supra note 6. at 132-135, 481; Hansen in 1982 House Hearings. supra note 6, at 266-69.
-5-

Unofficial FERC-Generated PDF of 20050808-0259 Issued by FERC OSEC 08/08/2005 in Docket#: -
and water transportation is unavailaole in many locations. !/
Hence, competition from other transportation modes will not
necessarily produce competitive results in petroleum markets.
Actual or potential intermodal competition must therefore be
examined on a market-by-market basis.
Second, oil pipelines exhibit significant economies of
scale; that is, the average cost per-barrel of throughput of
constructing and operating a pipeline declines significantly as
the pipeline's throughput is increased. ~/ The per-mile cost
of constructing a pipeline varies roughly with its circum
ference, equal to 3.1416 times twice the radius, while the
capacity of a pipeline varies roughly with the area of its
cross-section. equal to ~.1416 times the square of the radius.
Th4s, as a pipeline's radius is increased, its construction
costs rise roughly in the same proportion, while its capacity
rises roughly in proportion to the square of the radius.' In
addition, the average, per-barrel operating costs of a pipeline
with any given diameter fall with increased throughput over a
significant range. The declin~ of petroleum consumption since
1978 suggests that existing pipelines typically may be
!/ One commentator has argued that water transportation is often less efficien~ than pipeline transportation and in many cases competes with·pipelines only because pipeline rate regulation has been lax. See National Economic Research Associates, Inc., CompetitiOn in Oil Pitfiline Markets: A Structural Analysis 65-76 (April 1983) :fiereinafter cited as NERA Study) .
9/ Wolbert, supra note 6, at 98-100. -.
-6-

Unofficial FERC-Generated PDF of 20050808-0259 Issued by FERC OSEC 08/08/2005 in Docket#: -
operating at throughput levels within this range and therefore
may exhibit economies of scale at current throughput levels.
These economies of scale imply that one pipeline usually can
transport any given volume between any two points at a
significantly lower cost than can two smaller ones. !Q/
Economies of scale generally make it very difficult for a
new pipeline to enter into competition with an existing pipe
line in any origin or destination market. If the new pipeline
were designed to transport a substantially smaller volume than
the existing pipeline. it would suffer a substantial cost
disadvantage per unit transported. The larger scale entry
necessary to eliminate this cost disadvantage would not, in
most cases, be appealing to potential entrants. Absent
substantial growth in demand, large-scale entry in the presence
of economies of scale would create substantial excess capacity,
thus raising average costs, or would depress the market price,
or do both, making entry unprofitable. Entry into a market
occupied by a single pipeline is feasible only if growth in
demand provides room for a second efficient-sized pipeline. In
the past, growth in demand has bee~ responsible for multiple
pipelines serving some markets, but it is unlikely to be an
important force in the future. Thus, scale economies alone
suggest that the entry of new pipelines cannot be relied upon
10/ There are, of course, limits to these economies of scale; various factors militate against the manufacture and use of pipe more than four or five feet in diameter.
-7-

Unofficial FERC-Generated PDF of 20050808-0259 Issued by FERC OSEC 08/08/2005 in Docket#: -
to deconcentrate particular markets and check the exercise of
market power.
Third, oil pipelines are immobile. Once in place, a
pipeline cannot be adjusted readily to shifting sources of
supply or to changing markets. !!/ Thus. the sort of
hit-and-run entry of rival suppliers that may be possible in
some industries is not possible in the pipeline industry.
Where hit-and-run entry is possible, the mere threat of rival
entry may lead a market to perform competitively even if there
are very few actual sellers in the market at any one time. 12/
Because hit-and-run entry by a pipeline is unrealistic. com
petitive performance in a concentrated petroleum transportation
market served only by pipelines is unlikely. In these markets,
deregulation would likely have adverse effects on competitive
performance. on the other hand, deregulation of pipelines in
concentrated petroleum markets may be justified if competing
water transportation can be expanded at constant unit costs.
If that is the case. any effort to elevate the price of
transportation will be checked by the ability of shippers to
switch to water transportation.
!!/ Wolbert, supra note 6, at 93-94.
12/ w. Baumol, J, Panzar & R. Willig, Contestable Markets and the Theory of Industry Structure (1982).
-8-

Unofficial FERC-Generated PDF of 20050808-0259 Issued by FERC OSEC 08/08/2005 in Docket#: -
B. Pipeline Market Power
In oil pipelines, as in other industries, market power
arises from an ability to control supply or demand in a
relevant market. 13/ A pipeline may have monopsony market
power in an upstream market from which it originates shipments
("origin markets"), monopoly market power in a downstream
market to which it delivers ("destination markets"), or both.
For a deregulated pipeline with monopoly market power
downstream, an increase in its transportation charge would
.restrict the supply of products or crude oil downstream and
drive up prices in the relevant downstream market. Similarly,
a deregulated pipeline with monopsony market power upstream
would be in a position profitably to restrict the access of
shippers of products or crude oil upstream. Some supplier(&)
generally would be willing to supply this lesser quantity of
products or crude oil demanded at a lower price. Agafn, the
pipeline would increase the transportation charge, in this
case, to capture upstream profits from crude oil producers or
refiners.
13/ The Department has previously stated the conditions under which a pipeline would have market power. See Testimony of John H. Shenefield, Assistant Attorney General, Antitrust Division, u.s. Department of Justice, Before the Subcornm. on Antitrust and Monopoly of the Senate Comm. on the Judiciary. 95th Cong., 2d Sess. (June 28, 1978), reprinted in E. Mitchell, ed., Oil Pipelines and Public Policy: Analysis Of Proposals for Industry Reform and Reorganizat1on 191 (1979); Donald L. Flexner, Deputy Assistant Attorney General, Antitrust Division, u.s. Department of Justice, "Oil Pipelines: The Case for Divestiture," in Mitchell, supra, at 3.
-9-

Unofficial FERC-Generated PDF of 20050808-0259 Issued by FERC OSEC 08/08/2005 in Docket#: -
A deregulated pipeline may exercise market power in markets
with any of three types of structure. First, if the pipeline
is the only supplier of petroleum to a particular destination
market and if, as it is generally held, there are no good
substitutes for petroleum, then the pipeline would be a
monopolist. As a monopolist, the pipeline would be free to
restrict output and increase its prices to maximize its
profits, and the resulting petroleum price could significantly .·
exceed the current level. Second, if the pipeline were not a
monopolist, but nevertheless the dominant supplier of petroleum
to the market, the result could be similar, though less
severe. If pipelines at the fringe of the market or other
transportation suppliers, were unable to expand throughput or
capacity at the current market price, then the deregulated
dominant pipeline would act as a monopolist with respect to the
portion of the market that the fri~ge or other firms could not
economically supply. Third, if there were only a few large
suppliers to a particular destination market, it is likely that
the deregulated pipeline(&) would charge higher prices and
transport smaller quantities than at present, either because
the few suppliers would collude to raise prices or because each
recognizes that it may unilaterally raise prices. !!I
14/ Although the foregoing paragraph is expressed only in terms of destination markets, market power also can be exercised in origin markets with the same types of structure.
FOOTNOTE CONTINUED
-10-

Unofficial FERC-Generated PDF of 20050808-0259 Issued by FERC OSEC 08/08/2005 in Docket#: -
c. The Economic Welfare Criterion
The exercise of pipeline market power and, alternatively,
its regulation have both efficiency effects and distributive
effects. The sole criterion by which the Department evaluates
oil pipeline deregulation in this Report is its efficiency
effects. Excessive pipeline tariffs cause a misallocation of
resources through inefficient reductions in petroleum product
consumption, crude oil production. and refinery utilization.
These inefficiencies represent a loss of economic welfare to
society.
Excessive pipeline tariffs also have distributive effects,
however, in that they generate a transfer of income from oil
producers, refiners, and/or consumers to the stockholders of
pipeline companies. For example, suppose City A is supplied
with refined petroleum product from refineries in City B, arid
that there are two means of transportation currently being used
to transport that. product from B to A--a product pipeline with
fixed capacity and a water route accommodating competitive
water transportation. If the water transportation can easily
expand at constant unit cost and the regulated pipeline tariff
l!/ FOOTNOTE CONTINUED
For example, a pipeline that is the only source of transportation (or consumption) in an origin market could restrict the demand upstream and thereby depress the purchase price of petroleum in the origin market; it could then raise its own tariff to capture the margin created between upstream and downstream petroleum prices.
-11-

Unofficial FERC-Generated PDF of 20050808-0259 Issued by FERC OSEC 08/08/2005 in Docket#: -
is below the competitive water tarifr, deregulation of the
pipeline will allow it to raise its tariff to--but no higher
than--the price of water transport. This tariff increase will
not alter the amount of product being transported by the
pipeline, the amount transported by water, or the final price
of product in City A. While deregulation does not in this
instance increase the economic welfare of society, it could
cause a redistribution of income from the individuals or firms
with rights to ship on the pipeline at the regulated rates to
the stockholders of the pipeline. 15/ The Department"&
analysis of pipeline deregulation does not consider such purely
distributive effects.
This Report evaluate~ the welfare effects of pipeline
deregulation with reference to a competitive threshold below
which the free market is presumed to set tariffs more
efficiently than does regulation. When market concentration as
measured by the Herfindahl-Hirschman Index ("HH1") is above
this threshold, the Department believes unregulated market
forces cannot be relied upon to produce competitive results.
The cu~rent regulatory ~lternative to unregulated market
determination of prices is quite fluid, with progress
continuing toward more efficient cost-of-service regulatory
:
111 This assumes the rents flowing to the preferred-access shippers are not dissipated by competition among them for pipeline access. If this assumption did not hold, then deregulation in this example clearly would increase welfare.
-12-

Unofficial FERC-Generated PDF of 20050808-0259 Issued by FERC OSEC 08/08/2005 in Docket#: -
methodology. ~/ Therefore. the Department's recommendations
for pipeline deregulation have been developed on the assumption
that the regulatory alternative will become more efficient than
it has been in the past. 17/
~/ The Department has accordingly been involved for several years in a program of pipeline rate reform advocacy at the Federal Energy Regulatory Commission ("FERC") and in the courts. :
17/ Recent actions by the courts and the FERC substantially increase the likelihood that a cost-based method of regulation will be imposed upon the entire interstate petroleum pipeline industry in the future. See Willi~s Pipe Line Company, Opinion No. 154-B, 31 FERC (CCH) 11 61,377 (1985).
-13-

Unofficial FERC-Generated PDF of 20050808-0259 Issued by FERC OSEC 08/08/2005 in Docket#: -
III. ASSESSING THE DEGREE OF PIPELINE MARKET POWER AND THE RATIONALE FOR PIPELINE REGULATION
In order to assess the degree to which a particular
pipeline possesses market power, it is necessary first to
define its relevant origin and destination markets and to
examine the structure of competition in them. The basic
principles that the Department uses to delineate market
boundaries (both product and geographic) are set forth in
deta~l in its Merger Guidelines. 18/ Applying these principles
to oil pipelines, the relevant markets can be delineated by
considering, with respect to each in a series of groups of
products and geographic areas of increasing size, whether a
significant price increase would be profitable for a
hypothetical monopolist of•those products in that area. 19/
The smallest group of products and geographic area in which a
significant price increase would be profitable is the relevant
market. 20/
18/ 2 Trade Reg. Rep. (CCH) ~f 4490-95.
19/ For origin markets. the relevant test is whether a Significant price dec.rease is profitable for a hypothetical monopsonist in the area.
20/ Merger Guidelines f 4492; ~ Werden, "Market Delineation and the Justice Department's Merger Guidelines," 1983 Duke Law Journal 514, 531-34.
-15-
Unofficial FERC-Generated PDF of 20050808-0259 Issued by FERC OSEC 08/08/2005 in Docket#: -
A. Competitors in the Relevant Markets
There are four types of relevant markets: crude
destination markets, crude origin markets, product destination
markets, and product origin markets. 21/ Crude oil delivered
by pipeline competes with all other crude oil at its
destination 22/ regardless of whether it was imported into the
area or produced locally. The competitors in crude destination
markets therefore include both the pipelines and water
transportation facilities that import crude. as well as any
local crude production facilities. 23/ The crude oil in an
area may either be ~xported out of the area or consumed. i.e ..
refined, in the area. A pipeline transporting crude oil out of
an area therefore competes with local crude refineries 24/ as
well as with other crude transportation facilities, w~ether
pipelines or water facilities.
21/ This four-market approach is similar to that taken in previous studies of oil pipeline competition. See Hansen, supra note 6; NERA Study, supra note 8; and E. Mitchell, "A Study of Oil Pipeline Competition" (April 1982), reprinted in 1982 House Hearings, supra note 6, 138.
22/ For the purpose of this Report, all crude oil is assumed to be chemically identical.
23/ Product pipelines and product water facilities may in some cases also compete in crude destination markets. See infra text accompanying note 30.
24/ The input capacity of the refineries may be limited by the throughput capacities of outbound product pipelines.
-16-
Unofficial FERC-Generated PDF of 20050808-0259 Issued by FERC OSEC 08/08/2005 in Docket#: -
Just as local crude production is a source of competition
in crude destination markets, local product production, i.e.,
refining, is a source of competition in product destination
markets. Thus, the competitors in product destination markets
include pipelines and water transPortation facilities that
import petroleum products plus local refineries that produce
petroleum products. 25/ Local consumption is an alternative to
outbound transportation in product origin, as in crude origin,
markets. In product origin markets, the relevant consumers are
marketers or end users. Thus. the comoetitors in product
oriqin markets include Pioelines and water ~ranspertation
facilities that export petroleum products, plus local
distributors of petroleum products. 26/
The only transportation mode that can compete with
pipelines for long-distance shipments is water transportation.
Rail and truck transportation are significantly less efficient
than pipelines, barges, and tankers in the transportation of
petroleum over long distances. 27/ The markets analyzed in
this Report are sufficiently large and the distance therefore
required for inter-market shipments sufficiently long that
railroads and trucks will not handle a significant proportion
25/ The output cap~~ity of the refineries may be limited by the throughput capacities of inbound crude pipelines.
26/ Crude pipelines and crude water facilities may also compete in some product origin markets. See infra text accompanying note 30.
27/ Wolbert. supra note 6, at 132-135, 481.
-17-

Unofficial FERC-Generated PDF of 20050808-0259 Issued by FERC OSEC 08/08/2005 in Docket#: -
of market volume. 28/ Stated differently, most shipments via
railroad and trucks are intra-market shipments, which have
already b4en transported inter-market by pipeline or water
transportation or which are locally produced or consumed.
Thus, rail and truck facilities are excluded from the analysis
of relevant competitors. 29/
Crude pipelines participate in crude origin and destination
markets, and product pipelines participate in product origin
and destination markets. The exercise of pipeline market power
can result in (1) the reduction of crude production in crude
origin markets, (2) the reduction of refinery utilization in
crude destination and product origin markets, and (3) the
reduction of petroleum consumption in product destination
markets.
A crude pipeline's market power· in crude destination markets
may also be felt in product markets. Suppose a monopoly crude
pipeline supplies a refinery sector that competes in its local
market with nUmerous'product pipelines. If the crude pipeline
is deregulated, it may be able to force a socially inefficient
reduction of refinery ou~put in that local market. 30/
28/ !!! infra text accompanying notes 32-34.
29/ Hansen also extludes railroads and trucks. §!! Hansen in 1982 House Hearings, supra note 6, at 264-66.
30/ The crude pipeline may be able to raise short-run tariffs to refiners facing competition from product pipelines without forcing refinery shutdowns if the market price of products exceeds the refiners' minimum average variable coat.
-18-

unofficial FERC-Generated PDF of 20050808-0259 Issued by FERC OSEC 08/08/2005 in Docket#: -
In markets where there are numerous competing product
pipelines, however, this reduction of refinery output may not
raise product prices. Here, the deregulated crude pipeline
will have exercised market power in the crude destination
market, but will not affect prices in local product destination
markets. If, however, there were no pipelines or water
facilities competing in the importation of product, then the
crude pipeline's market power would extend to the product '
destination market, resulting in higher market prices for
petroleum products. In a similar fashion, a product pipeline's
market power in product origin markets may or may not extend to
crude origin markets.
Because this Report addresses the competition faced by oil
pipelines, rather than competition in the transportation of
petroleum generally, it considers only those petroleum-based
commodities that can be transported via petroleum pipelines.
In addition to crude oil, these consist of gasoline, jet fuel,
kerosene, diesel fuel, and distillate heating oil. Residual
fuel, coke, and asphalt are not pipelineable products. 31/
Similarly, this Report does not attempt to account for any
competitive limitations on oil pipeline market power due to
: 31/ Other studies have seriously overestimated the Significance of intermodal competition by failing to exclude such products. For example, Mitchell cites AOPL statistics which include these heavy refined products in their transportation figures. See Mitchell, supra note 21, at 21, reprinted in 1982 House Hearings, supra note 6, at 158.
-19-

Unofficial FERC-Generated PDF of 20050808-0259 Issued by FERC OSEC 08/08/2005 in Docket#: -
competition in the short-run from alternative fuels such as
natural qas and LPG, or from pipelines transportinq commodities
such as natural qas, LPG, and ammonia. Nor does the Report
attempt to account for the potential competition, if any, from
the possible entry of new pipelines or refineries. In these
respects, the Report may therefore tend to underestimate the
competitiveness of the transportation markets in which
pipelines compete.
B. Geographic Scope of Markets
The startinq points for relevant market analysis in this
Report are the 1&1 Economic Areas ("BEAs") into which the
Bureau of Economic Analysis of the u.s. Department of Commerce
has divided the contiquous United States. ~/ BEAs are
intended by the Department of Commerce to represent actual
areas of economic activity .. Each BEA has, at its center, a
major city which is the traditional hub of economic activity
for the entire BEA. For the purposes of this study, a BEA
serves as a basis for orqanizinq the data on pipelines and
other competinq facilities ~ computinq concentration indices.
To the extent that BEAs are rouqh approximations of markets,
u.s. Departmen~ of Commerce, Bureau of Economic Analysis, Vol. 2, Economic Areas 189
. partition qeoqraphic areas previous studies of petroleum transportation. See NERA
Study, suprf note a. at 120; Secretary of Transportation and Secretary o Enerqy, National Energy Transportati~n Study, A Preliminary Report to the President (July 1980). .
-20-
Unofficial FERC-Generated PDF of 20050808-0259 Issued by FERC OSEC 08/08/2005 in Docket#: -
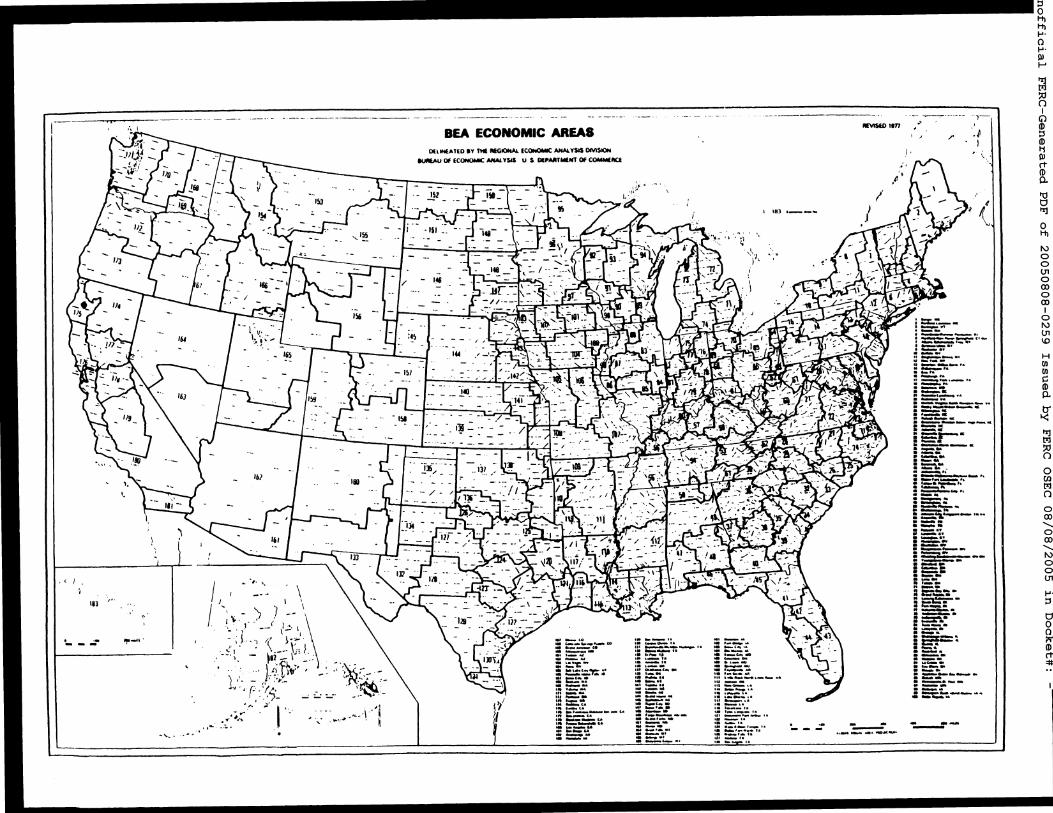
the resulting concentration indices arw rough indicators of
market concentration, one of several criteria used to evaluate
the need for continued regulation. A map showing the current
delineation of BEAs is set out on the adjacent page.
BEAs reasonably approximate the geographic scope of
pipeline markets because they are approximately the maximum
areas that can be viably served by the highly competitive
trucking sector. The area of the average SEA in the contiguous
states is 16,376 square miles, equivalent to that of a circle
with a radius of 72 miles or a square with side-length equal to
128 miles. Most trips by petroleum tank trucks are within a
50-mile radius of their origin. 33/ In addition to being of a
suitable size, SEAs are centered around major cities. and both
consumption of oil products and refining capacity are
concentrated in metropolitan areas. Indeed, almost all of the
refining centers identified in one oil pipeline study are
located either in or very near the central city of a SEA. 34/
Thus, SEAs appear to be reasonable approximations for crude
destination, product origin, and product destination markets.
33/ Congressional Research Service, National Energy Transportation 249 (May 1977) (prepared for the senate Comm. on Energy and Natural Resources and the Senate Comm. on Commerce, Science. and Transportation). The cost of transporting a gallon of gasoline 100 miles by truck ranges from 2 to 3 cents per gallon. Id. at 214 (figures adjusted for inflation). Some of this cost reflects loading and unloading costs. As a rule of thumb, the marginal cost of transporting product 50 miles is approximately one cent per gallon.
34/ Mitchell, supra note 21, at 80, reprinted in 1982 House Hearings, supra note 6, at 217.
-21-
. 'I .
lil .1"
~·.
.. ~
BEA ECONOMIC AREAS DlLINEA llD av 1l1l MGIOHAL. lCOHOMIC ANALYSIS OMStON
IIUNAU Of ICONOOIIC ......._ YSIS U. S. IIE'AIITMlNT Of COMMEIICI
') . ~
... _ .. .. ,_..,... .. = ::""..!.:.':. = ==-'"'"-· .. ··-~ ----:: :=::
I llll•---..
:~ :.:::-:·-- .. :: =.--:-.·· ... ·---·· ::s-:: .• ·-·--·· :: =-~·.--·· :: :::~~Fi.'" :: ::.-- ....
/
---8 ' ' /'
_, .. ._,L :=:..~ .. =-::--c..•· -~ -~ :--"';:-·
-~ I
, (
=..·· .......... - ..... --=·! -·· ---------............. == -=--.. -:::: =:-.::.-:-=---r:--..: =:::-:. 5= ~-:
§ =-.:-... ----·--·-·-· ·------- .... ................
H) H) ..... () ..... I» I-'
;) :;o 0 I
(jl (I) ;:I (I) 11 I» rt (I) 0.
'0 tl "'l
0 H)
1\)
0 0 lJl 0 0)
0 0)
I 0 1\)
lJl \C)
H Ill Ill c (I) 0.
~ ;) :;o 0
0 til t'l 0
0 0)
' 0 0)
' I\) 0 0 lJl
..... ;:I
tl 0 () ~ (I) rt '#

Unofficial FERC-Generated PDF of 20050808-0259 Issued by FERC OSEC 08/08/2005 in Docket#: -
To the extent that crude oil production is not concentrated in
metropolitan areas, however, BEAs are less useful as
approximations of crude origin markets. In conducting its
pipeline-by-pipeline analysis, where BEAs proved not to be
suitable markets. whether for crude origin or the other three
types of markets, the Department has redefined the markets to
accord better with economic reality.
c. The Herfindahl-Hirschman Index: The Initial Criterion of Market Power
After the competitors in each of the relevant markets have
been identified, the Department begins its quantitative
analysis of market power by examining the number and relative
size of those competitors.' assigning each a market share and
constructing an index of market concentration. The index of
market concentration used in the Report is the Herfindahl
Hirschman Index ("HHI"). The HHI is the same measure the
Department uses in its Merger Guidelines in order to determine
whether to challenge a merger under section 7 of the Clayton
Act. The HHI is calculated by summing the squares of the
individual market shares of all th~ firms included in the
market. 35/ Unlike a simple four-firm concentration ratio, the
..
35/ For example, a market consisting of four firms with market shares of 30 percent, 30 percent, 20 percent and 20 percent has an HHI of 2600 (900 + 900 + 400 + 400 • 2600). The HHI ranges from zero (in the case of an atomistic market) to 10,000 (in the case of a pure monopoly).
-23-

Unofficial FERC-Generated PDF of 20050808-0259 Issued by FERC OSEC 08/08/2005 in Docket#: -
HHI reflects both the distribution of' the market shares of the
top four firms and the composition of the market outside the
top four firms.
1. Assigning Market Shares and Calculating the HHI
Two factors complicate the assignment of pipeline market
shares. First, joint ventures are very common in the oil
pipeline industry. While each owner in a joint venture could
be assigned a market share based on that owner's share of the
joint venture, that would not generally be appropriate and
would be particulJrly inapt in the case of stock company joint
ventures in which the pipeline acts as a single entity under
the joint direction of ies owners.
Undivided joint interest pipelines differ from stock
company joint ventures in that the former do not have a
separate corporate identity; instead, each owner sets its own
tariff. Undivided joint interest pipelines have been likened
to a bundle of straws, with each owner treating its own share
as a separa~e pipeline. An undivided joint interest pipeline
has a potential for greater competition than a stock company
joint venture. However, for a number of reasons, this
potential may be limited. Capacity decisions for undivided 0
joint interest pipeiines are usually made jointly, and the
operating rules of an undivided joint interest pipeline may
-24-

unofficial t d PDF of 20050808-0259 Issue
FERC-Genera e 05 in Docket#: -d by FERC OSEC 08/08/20
explicitly restrict competition amonq its owners. 36/ Most importantly. undivided joint interest pipelines have certain unavoidable characteristics, such as a common operating company and information exchanges, that tend to restrict competition among the joint venturers. Thus, it is generally inappropriate to assiqn each owner of a joint venture pipeline a market share based on its ownership or throughput share of the pipeline. The second complicating factor is that the owners of particular pipelines may own other. competing facilities operating in the same markets. These competing facilities may be other pipelines, refineries, or crude production. For example, two nominally separate companies. the X Pipeline Company and the X Refining Company, may be in the same market. But if, both are wholly owned by the X Oil Corporation, their common ownership makes competition between them very unlikely. 37/
In the face of such complex overlaps and affiliations. devising a reasonable measure of market concentration is not an easy task. At one extreme, the Department could have disaggregated everything--that is, all joint ventures and even
36/ For example, the joint venture rules may grant each owner a fixed percentage of total throughput instead of a fixed percentage of total'capacity, seriously restricting tariff competition among the owners. ~I The problem of pipeline companies owning competing facilities is not common. One example is the Sun Pipeline products pipeline to Philadelphia which competes with Sun's refinery in Philadelphia.
-25-

Unofficial FERC-Generated PDF of 20050808-0259 Issued by FERC OSEC 08/08/2005 in Docket#: -
the X Pipeline Company and the X Refining Company could be
treated as independent entities. Such treatment would
seriously underestimate the actual effects of ownership
overlaps on competition, however. At the other extreme, the
Department could have aggregated at every turn by summing
market shares, even of independent companies, in all markets,
if they have any joint ownership interest in any market. This
approach would err in the opposite direction, seriously over
estimating the anticompetitive effects of such overlaps. 38/
In analyzing actual markets, the Department has dealt with
these problems by assiqninq market shares according to the
following rules. 39/
38/ The NERA Studf discusses these and other options, ultimately conclu~nq that (1) undivided interest and joint stock company pipelines should be treated in the same way and (2) pipelines in the same market should be combined if they have any owners in ~ommon. HERA Study, supra note 8, at 78-82. .
39/ These rules were adoited initially in the Preliminary Report and have been reta ned here. As is apparent in the Department's discussion below of individual pipelines, however, any reasonable alternative approach would have yielded the same recol!ltlendations. ·
-26-

Unofficial FERC-Generated PDF of 20050808-0259 Issued by FERC OSEC 08/08/2005 in Docket#: -
Rule 1: Parents, wholly owned 'subsidiaries. and corporations under common control are treated as one company.
Rule 2: If a pipeline is wholly-owned by a single company, the market share of the pipeline is attributed to that company.
Rule 3: If more than fifty percent of a joint venture pipeline. however organized, is owned by a single joint venturer, the pipeline is attributed to that joint venturer.
Rule 4: If no joint venturer owns more than fifty percent of a pipeline. however it is organized, the pipeline is treated as a single independent competitor, regardless of whether its owners also own competing facilities in the market.
Thus, if the X Oil cor'poration or its wholly owned
subsidiary owns (~) more than 50 percent of inbound product
pipeline A that, in turn, has 10 percent of the market, and
( 2) a ref in·ery with 15 percent of the market. X' s market share
is considered to be 25 per.cent. On the other hand, if neither
X nor any other company directly or indirectly owns 1110re than
so percent of the pipeline. then X's share will be 15 percent
and A's 10 percent. The HHI is then calculated in the usual
way--squaring and then summing the market shares of individual
firms. Thus, Rule 3 implicitly assumes that a majority
interest in a pipeline confers on its owner control over all of
the pipeline's capacity, which tends to overstate the level of
concentration in the market. On the other hand. Rule 4
implicitly assumes that a joint venture pipeline that is not
-27-

Unofficial FERC-Generated PDF of 20050808-0259 Issued by FERC OSEC 08/08/2005 in Docket#: -
controlled by a single owner behaves'like a totally independent
entity. Since this approach implicitly aasumes that the joint
venture and its parents make throughput decisions as if they
had no other interests in the market, it understates true
concentration. 40/
With three general exceptions, in doing its market
analyses. the Department assigned all facilities in a market to
individual firms. !!/ The three exceptions are local crude
production, local product consumption, and water transportation.
Firm-specific data for local crude production, local product
consumption (or marketing), and water transportation are not
publicly available. Furthermore. local crude production,
product marketing, and water transportation are competiti.ve
activitiea. In calculating market shares. these three types of
facilities are included in the denominator. but their own
market shares--squared or otherwise--are not added to the HHI.
To illustrate, assume that a crude destination market
consists of local crude production of 100 thousand barrels per
day ("MBD"), a pipeline of firm A that brings in 300 MBD, a
pipeline of firm B that brings in 400 MBO, and waterborne
40/ There has been some recent research on how competitive overlaps involving _joint ventures may be reflected in the measurement of concentration. R. Reynolds r. B. Snapp. "The Economic Effects of Partial Equity Interests and Joint Ventures," u.s. Department of Justice, Antitrust Division, EPO Discussion Paper 82-3 (August 3. 1982).
41/ As explained above. the universe of individual firms Includes any joint venture not controlled by a single owner.
-28-

Unofficial FERC-Generated PDF of 20050808-0259 Issued by FERC OSEC 08/08/2005 in Docket#: -
facilities that collectively bring in '200 MBD. The total
market universe is, thus, 1000 MBD. Firm A's share is 30
percent, and firm B's is 40 percent. The collective share of
local crude production is 10 percent, and the collective share
of water transportation is 20 percent. The HHI calculation
employed in this Report includes only the squared market shares .. of A and B with the resulting HHI of 2500. This method may
bias the HHI downward, but the bias is likely to be quite small
because local crude production, waterborne transportation, and
product marketing are competitive activities.
2. The HHI Threshold for the Initial Designation of Pipeline Market Power
' When mergers take place between competing firms, reaso'nable
antitrust policy requires weighing the increased likelihood of
anticompetitive behavior against efficiencies presumed to
accompany the merger. The Department's Merger Guidelines
establish two HHI thresholds relating to this balancing. If
the post-merger HHI is below 1000, competitive concerns are
presume~ to be sufficiently slight that they are outweighed by ·
efficiencies. If the post-merger HHI exceeds 1800, competitive
concerns are presumed to be substantial although still may be
outweighed by efficiencies. 42/ When the continued regulation
of an industry rathtr than a merger is the issue. however, the
42/ See Merger Guidelines S 3.11.
-29-

Unofficial FERC-Generated PDF of 20050808-0259 Issued by FERC OSEC 08/08/2005 in Docket#: -
benefits of preventing anticompetitive behavior. which
regulation presumably confers. must be weighed against the
direct and indirect costs of regulation. !1/ As a matter of
practical implementation, though, even the direct costs of
regulation are difficult to measure. They include resources,
both public and private, committed to the determination,
implementation, and maintenance of tariffs. Indirect costs in
the form of resource misallocation are much more difficult to
appraise. In the face of the impossibility of actually
measuring the costs of regulation, the Department believes that
an HHI of 2500 is a reasonable threshold above which pipelines
should be presumed to require continued regulation. 44/
Applying this principfe to the underlying data, if the HHI
in a BEA is less than or equal to 2500, the competitive
concerns in that SEA are presumed to be small relative to the
costs of pipeline regulation. Thus, if 4 equal-sized pipelines
served the same markets, such that each SEA had an HHI of 2500,
they would be deregulated based on the HHI threshold
criterion. If the HHI value in a particular BEA is greater
43/ The social benefits of traditional pipeline regulation fall far short of those that ideal regulation could produce. Tariffs permitted by traditional pipeline regulation have significantly exceeded average cost levels. See T. Spavins, "The Regulation of Oil Pipelines" in Mitcb.ell. supra note 13, at 77. See also notes 16-17, supra.
44/ The NERA Study also argues that a threshold of 2500 is appropriate. NERA Study, supra note 8, at 94-95.
-30-
Unofficial FERC-Generated PDF of 20050808-0259 Issued by FERC OSEC 08/08/2005 in Docket#: -
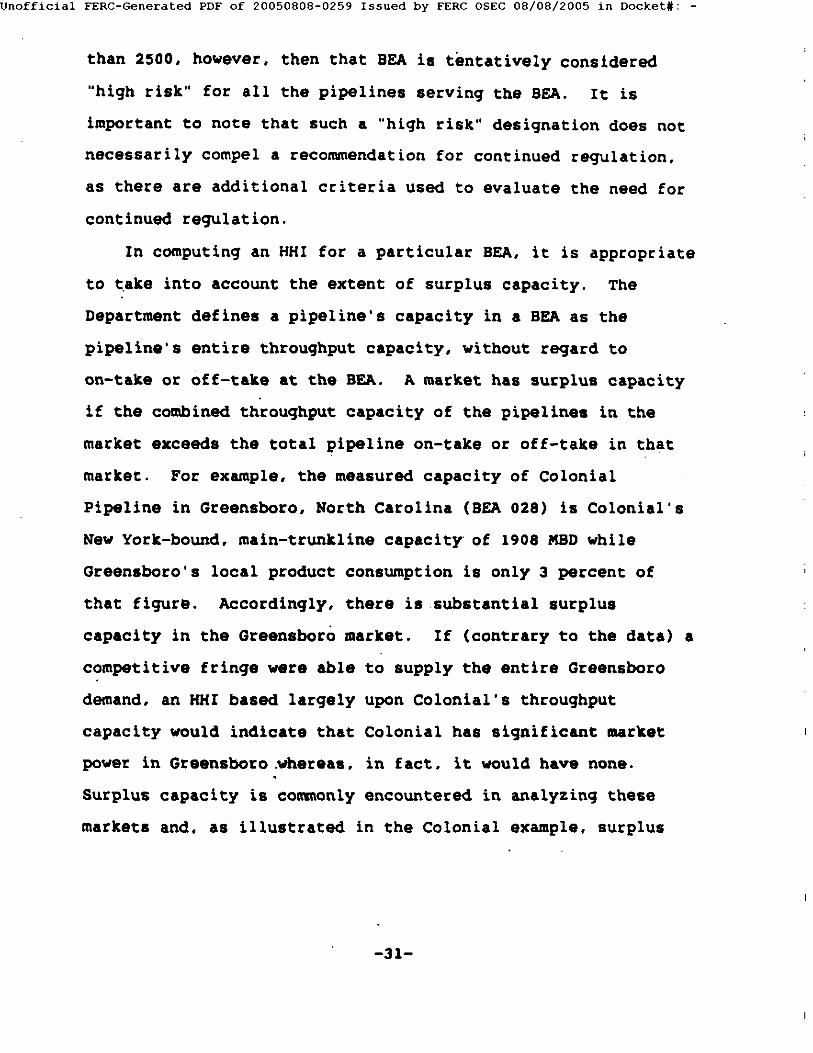
than 2500, however. then that BEA is tentatively considered
"high risk" for all the pipelines serving the SEA. It is
important to note that such a "high risk" designation does not
necessarily compel a recommendation for continued regulation.
as there are additional criteria used to evaluate the need for
continued regulation.
In computing an HHI for a particular SEA, it is appropriate
to t.ake into account the extent of surplus capacity. The
Department defines a pipeline's capacity in a SEA as the
pipeline's entire throughput capacity, without regard to
on-take or off-take at the BEA. A market has surplus capacity
if the combined throughput capacity of the pipelines in the
market exceeds the total pipeline on-take or off-take in that
market. For example, the measured capacity of Colonial
Pipeline in Greensboro, North Carolina {SEA 028) is Colonial's
New York-bound. main-trunkline capacity of 1908 MBD while
Greensboro's local product consumption is only 3 percent of
that figure. Accordingly, there is substantial surplus
capacity in the Greensboro market. If {contrary to the data) a
competitive fringe were able to supply the entire Greensboro
demand. an HHI based largely upon Colonial's throughput
capacity would indicate that Colonial has significant market
power in Greensboro.whereas, in fact. it would have none.
Surplus capacity is commonly encountered in analyzing these
markets and, as illustrated in the Colonial example, surplus
-31-
Unofficial FERC-Generated PDF of 20050808-0259 Issued by FERC OSEC 08/08/2005 in Docket#: -
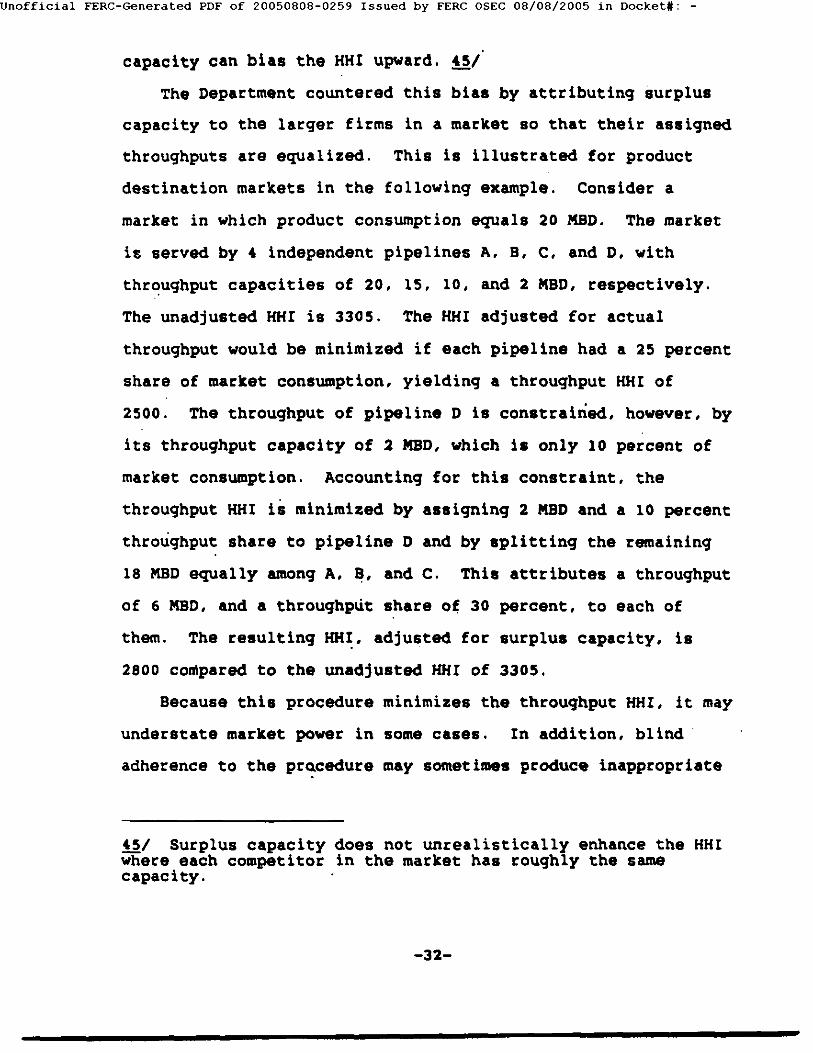
capacity can bias the HHI upward. ~/
The Department countered this bias by attributing surplus
capacity to the larger firms in a market so that their assiqned
throughputs are equalized. This is illustrated for product
destination markets in the following example. Consider a
market in which product consumption equals 20 MBD. The market
is served by 4 independent pipelines A, B, c. and D. with
throughput capacities of 20, 15, 10, and 2 MBD, respectively.
The unadjusted HHI is 3305. The HHI adjusted for actual
throughput would be minimized if each pipeline had a 25 percent
share of market consumption, yielding a throughput HHI of
2500. The throughput of pipeline o is constrained, however, by
its throughput capacity of 2 MBD, which is only 10 percent of
market consumption. Accounting for this constraint, the
throughput HHI is minimized by assiqning 2 MBD and a 10 percent
throughput share to pipeline D and by splitting the remaining
18 MBD equally among A, 8, and c. This attributes a throughput
of 6 MBD, and a throughput share Of 30 percent, to each of
them. The resulting HH~. adjusted for surplus capacity, is
2800 compared to the unadjusted HHI of 3305.
Because this procedure minimizes the throughput HHI, it may
understate market power in some cases. In addition, blind
adherence to the pr~cedure may sometimes produce inappropriate
45/ Surplus capacity does not unrealistically enhance the HHI where each competitor in the market has roughly the same capacity.
-32-

Unofficial FERC-Generated PDF of 20050808-0259 Issued by FERC OSEC 08/08/2005 in Docket#: -
results. !!/ In general, however, it is a reasonable procedure
to remove upward bias in the HHI for the purpose of estimating
pipeline market power in particular markets, given that the
total throughput capacity in a market often exceeds total
pipeline on-take or off-take in that market.
D. Other Criteria for Assessing the Justification for Pipeline Regulation
A high HHI value does not necessarily indicate market
power. nor does market power necessarily indicate the
desirability of regulation. There are a number of reasons why
a particular origin or destination BEA with an HHI above 2500
should not be considered high risk for some or all of the
pipelines serving that BEA. In some cases, one or more
pipelines in the ~EA may not have sufficient market power to
warrant regulation. In other cases, a pipeline may have
significant market power, but the current industry structure is
such that regulation may not be effective--that is, it will not
have any welfare-enhancing effect.
46/ For example, s~pose that pipeline X (150 MBD) and pipeline Y (50 MBD) ·are the sole sources of supply for BEAs A and B, and that the local consumption of A and B is 100 MBD each. The proper procedure here would be to combine A and B, in which case there is no surplus capacity. The adjusted HHI is the same as the unadjusted HHI of 6250. If one considers A and B separately, however. one obtains an adjusted HHI for each BEA equal to 5000.
-33-

Unofficial FERC-Generated PDF of 20050808-0259 Issued by FERC OSEC 08/08/2005 in Docket#: -
This section discusses the factors that would make it
inappropriate to designate a BEA with an KHI above 2500 a high
risk market. If one or more of these factors is present, the
Department considers a BEA as "non-high-risk" for at least some
of the pipelines serving the BEA. If a large proportion of
both the on-take and the off-take of a particular pipeline
occurs at origin and destination BEA& designated as
non-high-risk for the pipeline, either before or after these
factors have been considered, then the pipeline will be
considered a candidate for prompt deregulation.
1. Factors that Indicate Insufficient Market Power
The close proximity of a BEA to facilities in other BEAs
can sometimes indicate that a pipeline lacks market power in,
spite of a high HHI value. While the Department views BEAs as
reasonable initial approximations for markets, as explained
above, truc.k transportation between BEAs is economically
feasible in some cases. If the major cities of a concentrated
BEA are near facilities in another BEA, then it may be
appropriate to add these facilities to the market, which may
result in an adjusted HHI below the 2500 threshold.
A reasonable appraisal of the likelihood of anticompetitive
abuse by an unregulated pipeline in any market also should take
into consideration the presence of any regulated pipeline.
Even in a highly concentr.ated market, one regulated pipeline
with sufficient capacity to serve all or a significant portion
-34-
Unofficial FERC-Generated PDF of 20050808-0259 Issued by FERC OSEC 08/08/2005 in Docket#: -
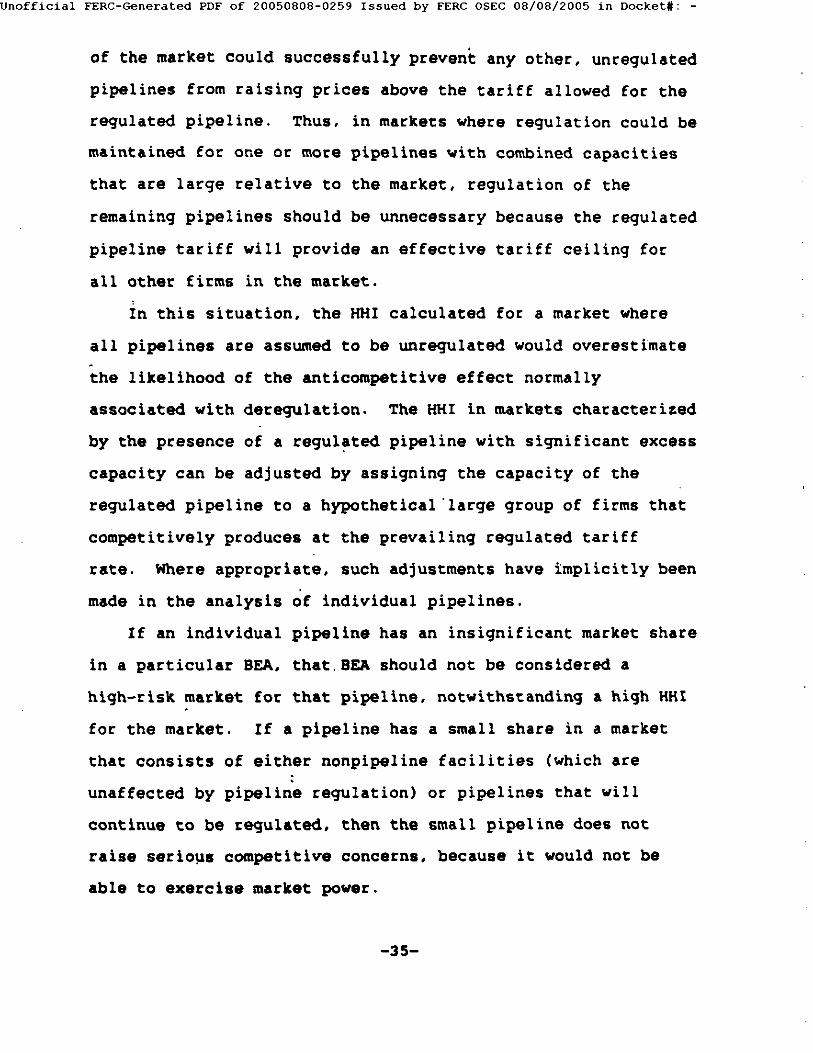
of the market could successfully prevent any other, unregulated
pipelines from raising prices above the tariff allowed for the
regulated pipeline. Thus, in markets where regulation could be
maintained for one or more pipelines with combined capacities
that are large relative to the market, regulation of the
remaining pipelines should be unnecessary because the regulated
pipeline tariff will provide an effective tariff ceiling for
all other firms in the market.
In this situation, the HHI calculated for a market where
all pipelines are assumed to be unregulated would overestimate
the likelihood of the anticompetitive effect normally
associated with deregulation. The HHI in markets characterized
by the presence of a regul~ted pipeline with significant excess
capacity can be adjusted by assigning the capacity of the
regulated pipeline to a hypothetical ·large group of firms that
competitively produces at the prevailing regulated tariff
rate. Where appropriate, such adjustments have implicitly been
made in the analysis of individual pipelines.
If an individual pipeline has an insignificant market share
in a particular BEA, that.BEA should not be considered a
high-risk market for that pipeline, notwithstanding a high KHI
for the market. If a pipeline has a small share in a market
that consists of either nonpipeline facilities (which are .
unaffected by pipeline regulation) or pipelines that will
continue to be regulated, then the small pipeline does not
raise serious competitive concerns, because it would not be
able to exercise market power.
-35-

Unofficial FERC-Generated PDF of 20050808-0259 Issued by FERC OSEC 08/08/2005 in Docket#: -
While data on the capacity of pipelines were available to
the Department in preparing this Report, comparable data on the
capacity of water traffic were not. There were, however, data
on actual water shipments between BEAs for 1980. It is likely
that water traffic can easily be expanded above 1980 throughput
levels in some markets. This expansion may be more likely in
the case of coastal ports, however, since the inland waterways
may be particularly subject to conditions of ice, flooding, low
water, and congestion. 47/ If water traffic appears to be a
currently viable source of competition and water traffic could
easily and efficiently expand from 1980 levels in response to
an attempted exercise of pipeline market power, the Department
adjusts the HHI downward;
2. Factors that Indicate Regulation May Be Ineffective
There are certain types of v.ertical arrangements that may
undercut the rationale for pipeline regulation. These
arrangements include ver~ical integration, market power at
other levels of the vertical supply chain, certain supply
contracts, and bilateral exchange. Each is discussed in
greater detail below. In some cases, these arrangements remove
the possibility that market power can be exercised. In other
47/ See. ~· the National Petroleum Council, Petroleum Storage and Transportation Capacities, Vol. ·v, Waterborne Transportation 17-20 (December 1979).
-36-

Unofficial FERC-Generated PDF of 20050808-0259 Issued by FERC OSEC 08/08/2005 in Docket#: -
cases, the vertical arrangements do not preclude the exercise of market power. but call into question whether pipeline regulation can effectively address the problem and thus have any welfare-enhancing effect. In general, these vertical arrangements are more common between crude oil pipelines and their shipppers, as opposed to the relationship between product pipelines and their shippers. Hence, crude oil pipelines as a class tend to pose less of a need for continued regulation than do product pipelines.
Vertical integration of a pipeline into adjacent stages substantially mitigates concern for the exploitation of market power. Consider, for example, a monopoly crude oil pipeline vertically integrated with a refinery. Higher tariffs on the pipeline are reflected as higher input prices to the refinery. When such a pipeline and refinery have a common owner, however, the cost to the combined facility is the actual cost·of transporting the crude on the pipeline and the nominal tariff is irrelevant. The same effects may be found when numerous refineries are integrated with joint venture pipelines. OWners face true marginal costs when their ownership share of the pipeline corresponds to their share of the pipeline throughput to their refinery. Importantly, refinery owners have a strong incentive to avoid facing a tariff level in excess of marginal transport cost. The widespread occurrence of vertically integrated pipelines strongly suggests that vertical integration is a more effective means of assuring marginal cost pricing
-37-

Unofficial FERC-Generated PDF of 20050808-0259 Issued by FERC OSEC 08/08/2005 in Docket#: -
than is reliance on regulation. 48/
While vertical integration between refinery owners ·and a
joint venture pipeline provides an effective means of
preventing opportunistic behavior by ineffectively regulated
pipelines possessing market power, such arrangements may also
permit evasion of effective regulation, under which pipeline
tariffs are set at competitive levels. By reducing pipeline
throughput, the prices of refined output can be increased to
monopoly levels. This result can be achieved by either a stock
company joint venture or an undivided interest joint venture
pipeline, although in the case of an undivided interest joint
venture a conspiracy would be required .in order to achieve the
monopoly output level. T~e joint venture pipeline tariff then
merely allocates monopoly profit between the pipeline stage and
the refinery staqe of the integrated operation. Thus,
regulation does not have any welfare-enhancing effect in the
ultimate (product destination) market. If the joint venture
pipeline also has market power in a crude origin market,
regulation will not have any welfare-enhancing effect there
either. The refiners at the downstream end of the pipeline can
also exercise monopsony power in the crude oil market by
48/ Product exchanges between oil companies, a common practice In the oil industry, are another method of assuring marginal cost pricing. For example, see Jon M. Joyce, "Why Do Firms Rely on Barter," u.s. Department of Justice, Antitrust Division, Economic Analysis Group Discussion Paper (formerly EPO), January 3, 1983 ..
-38-

unofficial FERC-Generated PDF of 20050808-0259 Issued by FERC OSEC 08/08/2005 in Docket#: -
restricting the throughput capacity of 'the pipeline. 49/ Once again, regulation simply transfers profits from the pipeline stage to the refinery stage.
Bottlenecks elsewhere in the vertical supply chain may also significantly weaken the effect of, and thus the case for, continued oil pipeline regulation. For example, suppose a product destination market X is served only by two equal-sized inbound product pipelines. Alpha and Beta. Further, suppose a competitive refinery market operates at Alpha's origin, A, while a monopoly refinery operates at Beta's origin, B, and that Alpha and Beta are the only pipelines out of A and B. respectively. A deregulated Alpha poses a strong risk of higher product prices at ~ since moving to the monopoly price would only require agreement between two parties: pipeline Alpha and either pipeline Beta or the refinery at B. It wo~ld not be necessary to obtain an agreement between the refinery at B and all the refineries at A. Thus, the product destination market X should be considered to be at high-risk from pipeline Alpha. There is less justification for the regulation of pipeline Beta. 50/ To the extent that the monopoly refinery at B can exercise market power, the regulation of Beta will have
49/ See Shenefield in Mitchell, supra note 13. 50/ A pipeline such as Beta can be considered a "plant facility," serving the refinery at B. For a discussion of such pipelines, see S. Livingston, "Oil Pipelines: Industry Structure," in Mitchell. supra note 13, at 317.
-39-
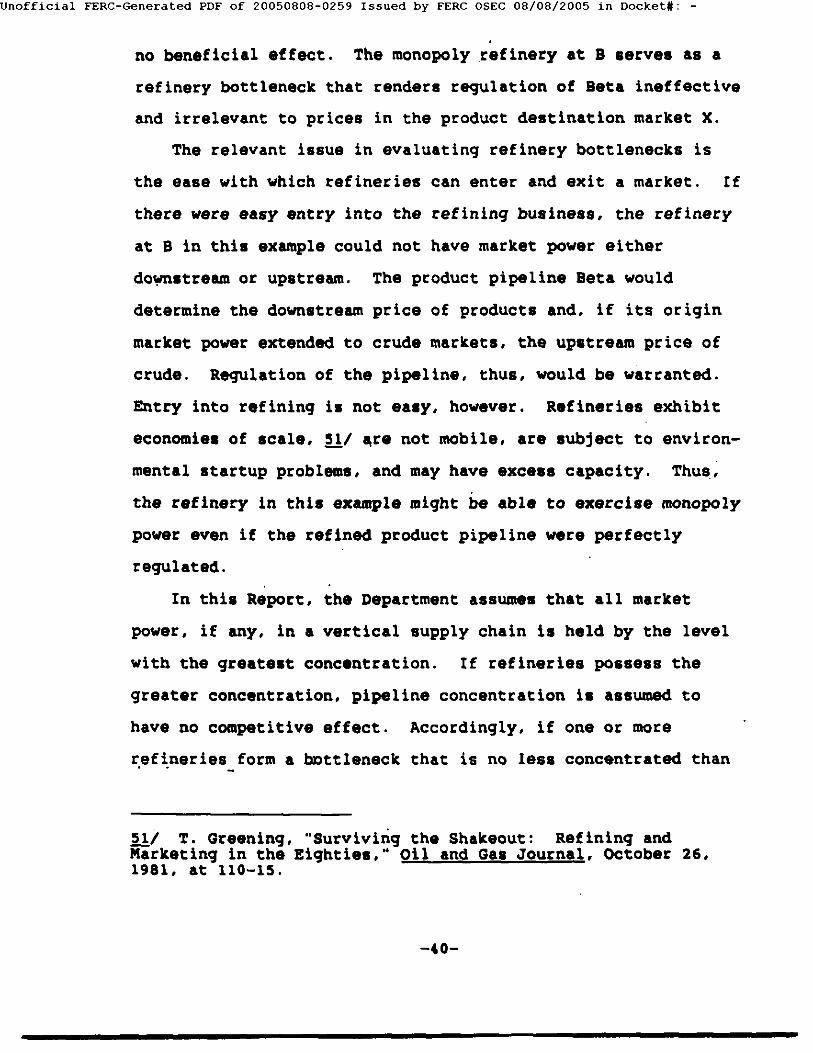
Unofficial FERC-Generated PDF of 20050808-0259 Issued by FERC OSEC 08/08/2005 in Docket#: -
. no beneficial effect .. The monopoly refinery at B aervea aa a
refinery bottleneck that renders regulation of Beta ineffective
and irrelevant to prices in the product destination market X.
The relevant issue in evaluating refinery bottlenecks is
the ease with which refineries can enter and exit a market. If
there were easy entry into the refining business, the refinery
at B in this example could not have market power either
do~stream or upstream. The product pipeline Beta would
determine the downstream price of product& and, if its origin
market power extended to crude markets, the upstream price of
crude. Regulation of the pipeline, thus, would be warranted.
Entry into refining is not easy, however. Refineries exhibit
economies of scale, 51/ ~re not mobile, are subject to environ
mental startup problems, and may have excess capacity. Thus .•
the refinery in this example might be able to exercise monopoly
power even if the refined product pipeline were perfectly
regulated.
In this Report, the Department assumes that all market
power, if any, in a vertical supply chain is held by the level
with the greatest concentration. If refineries posseaa the
greater concentration, pipeline concentration is assumed to
have no competitive effect. Accordingly, if one or more
~ef~neries form a bottleneck that is no less concentrated than
ll/ T. Greening, "Surviving the Shakeout: Refining and Marketing in the Eighties," Oil and Gas Journal, October 26, 1981, at 110-15.
-40-

Unofficial FERC-Generated PDF of 20050808-0259 Issued by FERC OSEC 08/08/2005 in Docket#: -
the associated product oriqin market, then the Department
designates the product origin market as non-high-risk for the
product pipelines in the market. Furthermore. if the refinery
bottleneck is no less concentrated than a product pipeline
corridor connecting the refineries to a separate product
destination market, then the Department designates the product
destination market as non-high-risk for the product pipelines
in the corridor. By the same token, the Department treats
refinery bottlenecks in 'a similar way for crude pipelines. 52/
Another arrangement that may obviate continued regulation,
particularly for crude pipelines, is bilateral exchange. 53/
An oil company that produces crude or runs refineries in an
area where a second firm controls a pipeline itself may control
a pipeline in another area where the second firm produces oil
or runs a refinery. Each firm, thus; possesses the means to
retaliate in response to an exercise of market power by the
other. and each company has the incentive to negotiate
efficient pipeline rat'es. or to swap .crude, or to execute the
business equivalent of hostage exchange in order to reach an
52/ This assumes that since any distortions from successive monopoly or successive oligopoly would reduce joint profits, such distortions are.avoided through negotiations. Successful negotiations are common in the oil industry whenever the number of bargainers is small. Gary D. Libecap and Steven N. Wiggins, "Contractual Responses to the Common Pool: Prorationing of Crude Oil Production" 84 American Economic Review 87 (1984).
53/ This strategy is discussed by o. Williamson. "Credible Conmitments: Using Hostages to Support Exchange," 83 American Economic Review 519 (1983).
-41-

Unofficial FERC-Generated PDF of 20050808-0259 Issued by FERC OSEC 08/08/2005 in Docket#: -
agreement that maintains pipeline rates at an efficient
level.
Crude production and crude refining are activities that
tend to have larger investments and fewer participants than
those in product marketing. Thus, it is more likely that
factors such as vertical integration, bilateral exchange, and
countervailing market power are present in crude origin and
crude destination markets. In general, these factors either
lessen the need for or render ineffective continued federal
regulation of existing crude pipelines. In some cases, such
factors eliminate welfare losses. For example, if a crude
pipeline competes in a competitive crude destination market,
but has potential market!power in crude origin, vertical
integration or price discrimination may prevent
welfare-reducing production losses in marginal fields. In
other cases, such as refining bottlenecks, market power may
still be present, bUt pipeline regulation can have no
beneficial effect.
-42-

Unofficial FERC-Generated PDF of 20050808-0259 Issued by FERC OSEC 08/08/2005 in Docket#: -
IV. CHOOSING THE PROPER UNIT OF REGULATION
A. Pipelines, Not Markets, Should Be Deregulated
On the basis of the principles outlined in Chapter III, the
Department has classified all pipeline markets according to the
risk that deregulation would impair their competitive
performance. Markets in which deregulation probably would be
harmful are designated "high-risk markets"; all others are
designated as "non-high-risk markets."
All pipelines operate in at least two markets--one origin
market and one destination market. In .addition, most operate
in multiple origin·or destination markets, or both. Therefore,
it is possible that there ~re a significant number of pipelines
that operate both i~ high-risk markets and in non-high-risk
markets. It may seem sensible at first blush to regulate all
high-risk markets and deregulate all non-high-risk markets;
however, that is probably not a practical policy. Most costs
of serving one market cannot easily be separated from those
of serving another; thus, partial deregulation would raise
difficult cost-allocation problems. Moreover, even partial
regulation of a pipeline is likely to impose substantial
administrative and allocative costs. As a practical matter,
therefore, it appear~ that a pipeline should be either
regulated or deregulated with respect to all of its markets.
In deciding whether a particular pipeline should be
regulated, it is therefore necessary to balance the high-risk
-43-

Unofficial FERC-Generated PDF of 20050808-0259 Issued by FERC OSEC 08/08/2005 in Docket#: -
against the non-high-risk markets, weighing the social benefits
from preventing an exercise of market power in the high-risk
markets against the regulatory costs that would be incurred by
the pipeline with respect to the non-high-risk markets. The
outcome of this balancing test should be related to the
proportion of the pipeline's throughput that trades in
high-risk markets. For example, if all or nearly all of both
the on-take and the off-take of a pipeline occur in
non-high-risk origin and destination markets. the pipeline
should certainly be deregulated. It is equally clear that a
pipeline operating primarily in markets that are high-risk for
that pipeline sh~uld continue to be regulated.
B. Defining Pipelines for Deregulation
Once it is determined that pipelines, not markets. are the
appropriate unit for regulation or deregulation, it becomes
necessary to define as precisely as possible the collection of
physical properties that will be considered a "pipeline."
Historically, the unit for regulation of the pipeline industry
has been the pipeline company, which may own several systems
transporting different commodities (i.e., crude oil and various
oil products). The regulator sets a rate of return for each
company as a whole_. Thus, for example, the Chevron product
pipeline from El Paso to Albuquerque has been combined, for
certain requlatory purposes, with the Chevron crude pipeline
from Rangely, Colorado to Salt Lake City.
-44-

Unofficial FERC-Generated PDF of 20050808-0259 Issued by FERC OSEe 08/08/2005 in Docket#: -
. In the Williams case, the Department took the position
before the Federal Energy Regulatory Commission ("FERC") that a
pipeline company is too broad an entity for effective
regulatory treatment. FERC agreed and said it would require
separate regulation of noncontiguous "pipeline systems," but it
did not attempt to define that term. 54/ To date there has
been no apparent change in FERC's accounting and reporting
requirements. Although it reversed almost every aspect of
FERC's Williams decision, the Court of Appeals neither
overturned this portion of the decision nor expressly required
that FERC regulate pipelines on a market-by-market basis.
While it noted that the ICC allocated operating costs on a
segment-by-segment (i.e., ~arket-by-market) basis, the court
itself provided no guidance regarding the allocation of capital
costs. 55/ Thus. the conclusion that a pipeline cannot be
regulated effectively on a market-by-market basis is not
inconsistent with the court of Appeals' decision. Accordingly,
in the discussion below, and in the Department's analysis of
particular markets, the term "pipeline" refers to a contiguous
54/ Williams Pipe Line Company, 21 FERC (CCH) , 61,260 at
61.650-51.
55/ Farmers Union central Exchange, Inc. v. FERC, 734 F.2d
1486, 1528-29 (D.C. Cir. 1984). The court held that FERC's
ruling on system-by-system regulation was premature since it
was not an issue in the regulatory proceeding. The court
observed, however, that prior ICC cases allocated pipeline
operatinq co.sts by a method that reflected throughput
barrel-miles.
-45-

Unofficial FERC-Generated PDF of 20050808-0259 Issued by FERC OSEC 08/08/2005 in Docket#: -
' set of physical properties that forms a proper unit for
regulation or deregulation.
1. Theoretical Principles
In defininq a pipeline, contiguity of facilities is a
necessary condition, since it is preferable to treat separately
two pipelines havinq one owner but no common facilities. If
one of the pipelines lacked siqnificant market power, it would
be inefficient to regulate it as part of a larqer whole.
Moreover, the qreater the number of individual pipelines that
can be defined within a company or a contiguous system, the
less likely it is that any one pipeline will operate in both
hiqh-risk and non-hiqh-~isk markets. On· the other hand, if two
segments of a pipeline system share common facilities, it may
not be wise to separate them for r'egulatory purposes, s inca
that will necessitate allocatinq the joint costs between them.
· If one seqment were regulated and the other deregulated, the
pipeline company would have an incentive to allocate the common
facilities to the rate base of the regulated component.
To illustrate these principles, consider the pipeline
seqments owned by a sinqle pipeline company as illustrated in
Figure 1. Crude oil flows from points A, 8, c, and D to the
:
-46-

Unofficial FERC-Generated PDF of 20050808-0259 Issued by FERC OSEC 08/08/2005 in Docket#: -
c .... ~& o:l
~" ..... .,
Fiqure 1
H
M ... w.
l
refinery at E; the pipeline segments from A and B converqe at
c. Product flows from the refinery at E to points F, .G. H, and
I; the pipeline segments toG and H diverqe at F. Requlatory
treatment of this network as a sinqle unit would not be
efficient. For examp~e. crude pipelines should be requlated
separately from product pipelines. Since crude and product
shipments are usually performed in different facilities. there
is no problem of allocatinq joint costs between them.
Likewise .• the joint cost criterion probably permits the product
-n-
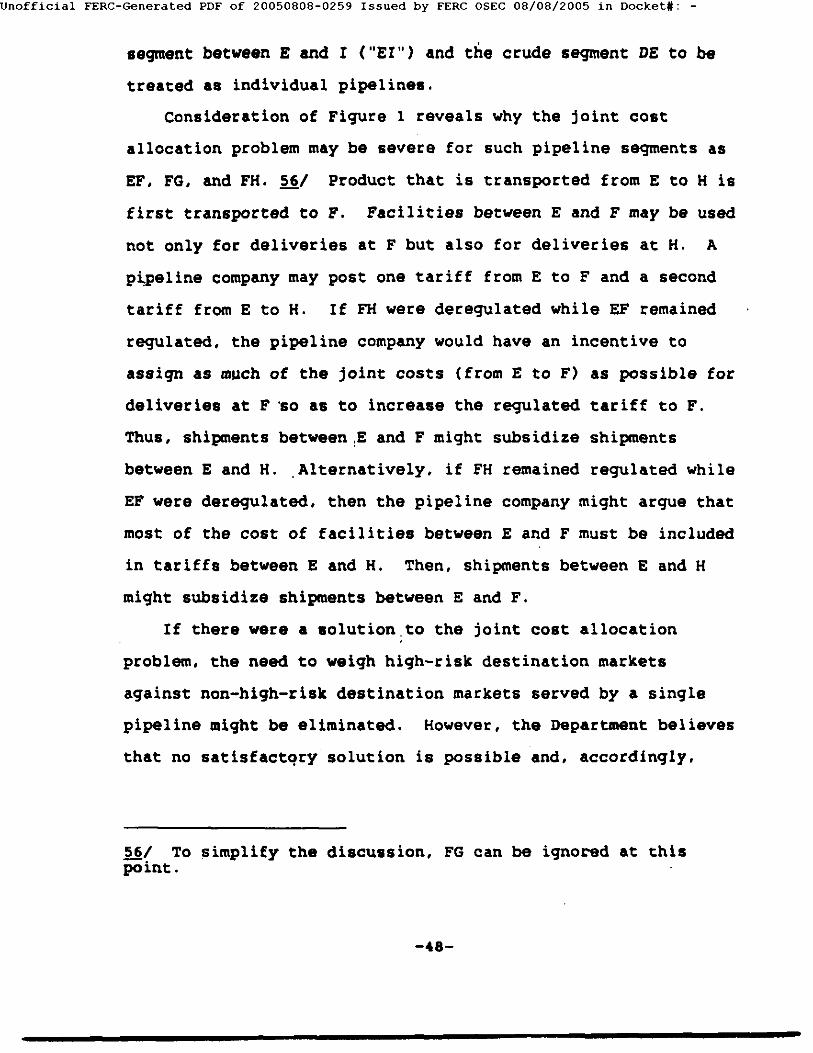
Unofficial FERC-Generated PDF of 20050808-0259 Issued by FERC OSEC 08/08/2005 in Docket#: -
segment between E and I ("EI") and the crude seqment DE to be
treated as individual pipelines.
Consideration of Figure 1 reveals why the joint cost
allocation problem may be severe for such pipeline segments as
EF, FG, and FH. 56/ Product that is transported from E to H is
first transported to F. Facilities between E and F may be used
not only for deliveries at F but also for deliveries at H. A
p~eline company may post one tariff from E to F and a second
tariff from E to H. If FH were deregulated while EF remained
regulated, the pipeline company would have an incentive to
assiqn as much of the joint costs (from E to F) as possible for
deliveries at F ·so as to increase the regulated tariff to F.
Thus, shipments between,E and F might subsidize shipments
between E and H .. Alternatively, if FH remained regulated while
EF were deregulated, then the pipeline company might argue that
most of the cost of facilities between E and F must be included
in tariffs between E and H. Then, shipments between E and H
might subsidize shipments between E and F.
If there were a solution.to the joint cost allocation
problem. the need to weigh high-risk destination markets
against non-hiqh-risk destination markets served by a single
pipeline might be eliminated. However, the Department believes
that no satisfactqry solution is possible and, accordingly,
56/ To simplify the discussion, FG can be ignored at this point.
-u-
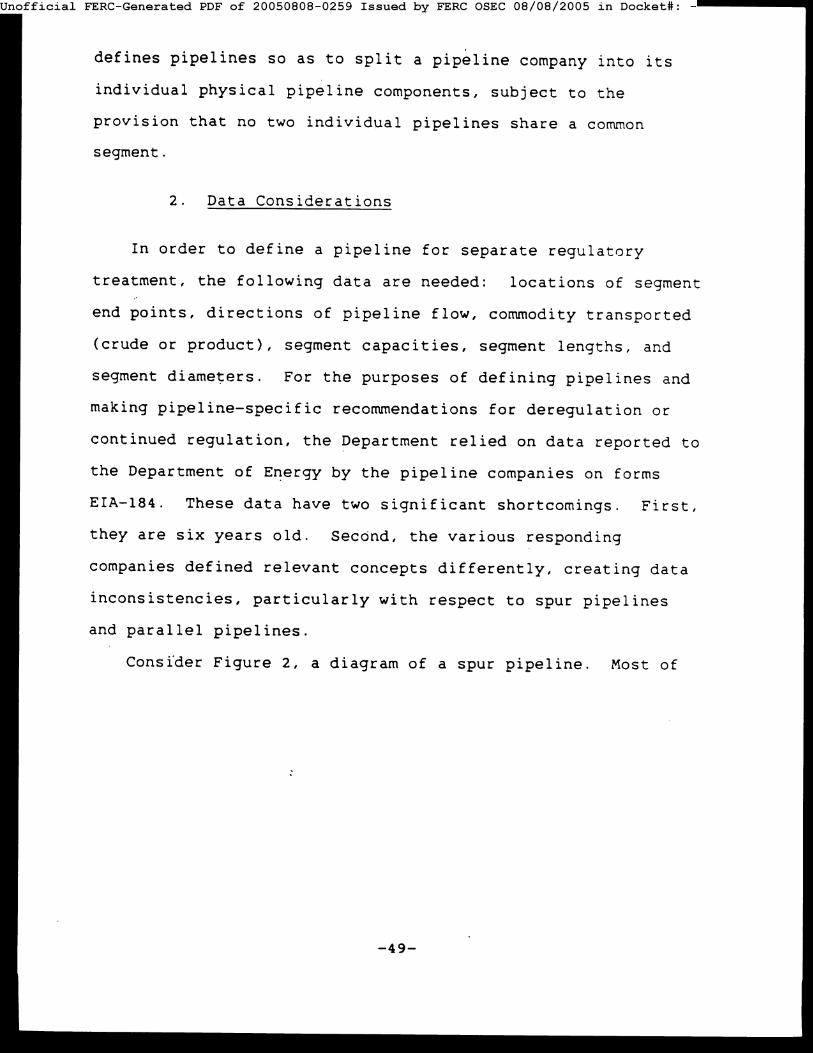
Unofficial FERC-Generated PDF of 20050808-0259 Issued by FERC OSEC 08/08/2005 in Docket#:
defines pipelines so as to split a pipeline company into its
individual physical pipeline components, subject to the
provision that no two individual pipelines share a common
segment.
2. Data Considerations
In order to define a pipeline for separate regulatory
treatment, the following data are needed: locations of segment
end points, directions of pipeline flow, commodity transported
(crude or product), segment capacities, segment lengths, and
segment diameters. For the purposes of defining pipelines and
making pipeline-specific recommendations for deregulation or
continued regulation, the Department relied on data reported to
the Department of Energy by the pipeline companies on forms
EIA-184. These data have two significant shortcomings. First,
they are six years old. Second, the various responding
companies defined relevant concepts differently, creating data
inconsistencies, particularly with respect to spur pipelines
and parallel pipelines.
Consfder Figure 2, a diagram of a spur pipeline. Most of
-49-

Unofficial FERC-Generated PDF of 20050808-0259 Issued by FERC OSEC 08/08/2005 in Docket#: -
Fiqure 2
the respondents (appropriately) reported three separate
segments for this diagram--AB. BC. and BD. Colonial. however.
reported only two-~C (Houston to Greensboro, North Carolina)
and BD (Atlanta to Macon. Georgia). In either case. since B
lies on AC, the entire ABCD network should be treated as a
single pipeline. due to the joint cost consideration.
-50-

Unofficial FERC-Generated PDF of 20050808-0259 Issued by FERC OSEC 08/08/2005 in Docket#: -
Figure 3 shows a single pipeline company with parallel
pipelines ABC and ABO. In their EIA-184 reports. most
A
Figure 3
companies (appropriately) described this situation as involving
three segments (AS, sc. and SD) and added the capacities of the
two AB lines to determine the capacity of AS. Wolverine. ho~
ever. reported three segments--AS (Hammond. Indiana to Niles.
-51-
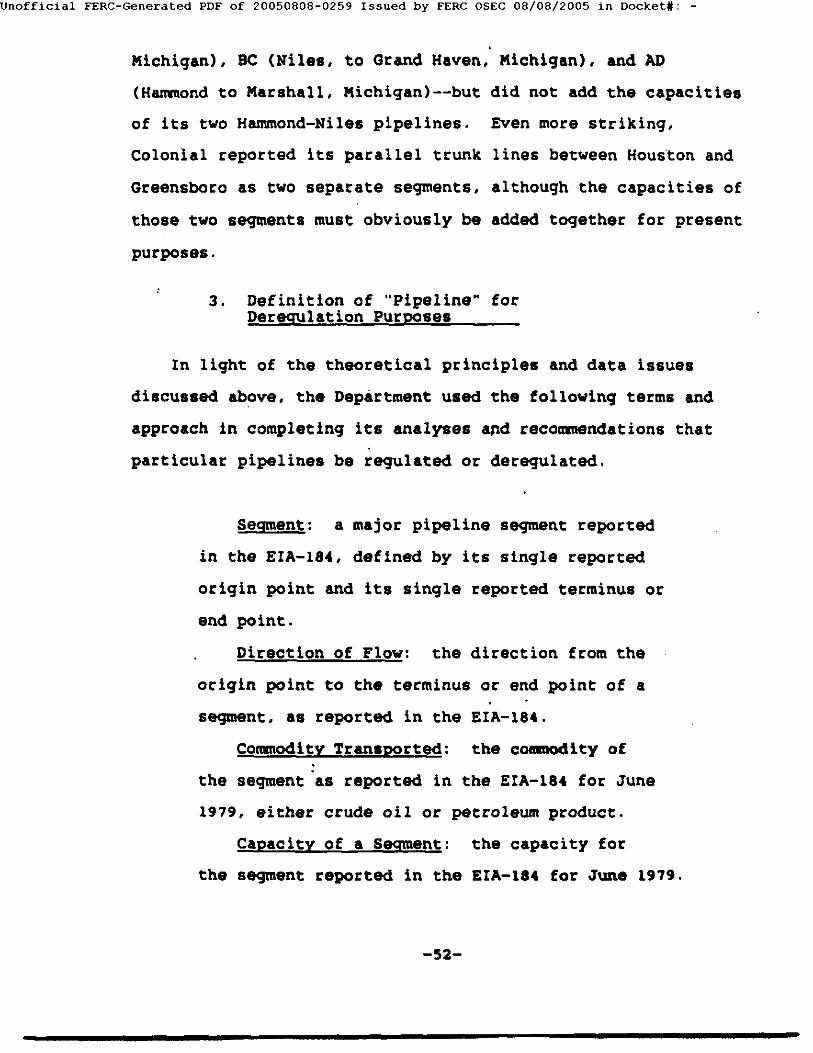
Unofficial FERC-Generated PDF of 20050808-0259 Issued by FERC OSEC 08/08/2005 in Docket#: -
Michigan), BC (Niles, to Grand Haven, Michigan), and AD
(H~ond to Marshall, Michigan)--but did not add the capacities
of its two Hammond-Niles pipelines. Even more striking,
Colonial reported its parallel trunk lines between Houston and
Greensboro as two separate segments, although the capacities of
those two segments must obviously be added together for present
purposes.
3. Definition of "'Pipeline" for Deregulation Purposes
In light of the theoretical principles and data issues
discussed above, the Department used the following terms and
approach in completing its analyses apd recommendations that
particular pipelines be regulated or deregulated.
Segment: a major pipeline segment reported
in the EIA-184, defined by its single reported
origin point and its single reported terminus or
end point.
Direction of Flow: the direction from the
origin point to the terminus or end point of a
segment, as reported in the EIA-184.
Co11111odity Transported: the cotllllodity of . the segment as reported in the EIA-184 for June
1979, either crude oil or petroleum product.
Capacity of a Segment: the capacity for
the segment reported in the EIA-184 for June 1979.
-52-

Unofficial FERC-Generated PDF of 20050808-0259 Issued by FERC OSEC 08/08/2005 in Docket#: -
Length of a segment: the distance in miles
between the origin point and the terminus or end
point of the segment reported in the EIA-184,
measured along the right of way of the segment. 57/
Segmenting Point: the origin point,
terminus, or end point of a segment, as reported
in the EIA-184.
Subsegments: portions of a segment delineated
by segmenting points of another segment owned by
the same pipeline company that lie on and wholly
within the segment. For example, in Figure 2, if
segment AC were reported as a single segment, it
was split into two ,subsegments. ·AS and BC, since
segmenting point B lies on Ac.
Parallel Segments: two segments owned by a
single pipeline company with the same segmenting
points, direction of flow, and commodity. Parallel
segments and their capacities are combined into a
single segment. ~/ For example, in Figure 3, if
57/ Segment length was reported in the EIA-184, but there was an inconsistency in cases of parallel pipelines. Some companies reported lengths as in the above definition, while others double-counted for t~o parallel pipes. These latter reports were reduced accordingly.
58/ There is one potential problem with this definition. Suppose a pipeline had reported two segments AC and AD as in Figure 2. Under the approach taken here. the capacities of the two pipelines between A and B would not be combined. The Department is aware of no actual instance in which this has occurred. however.
-53-
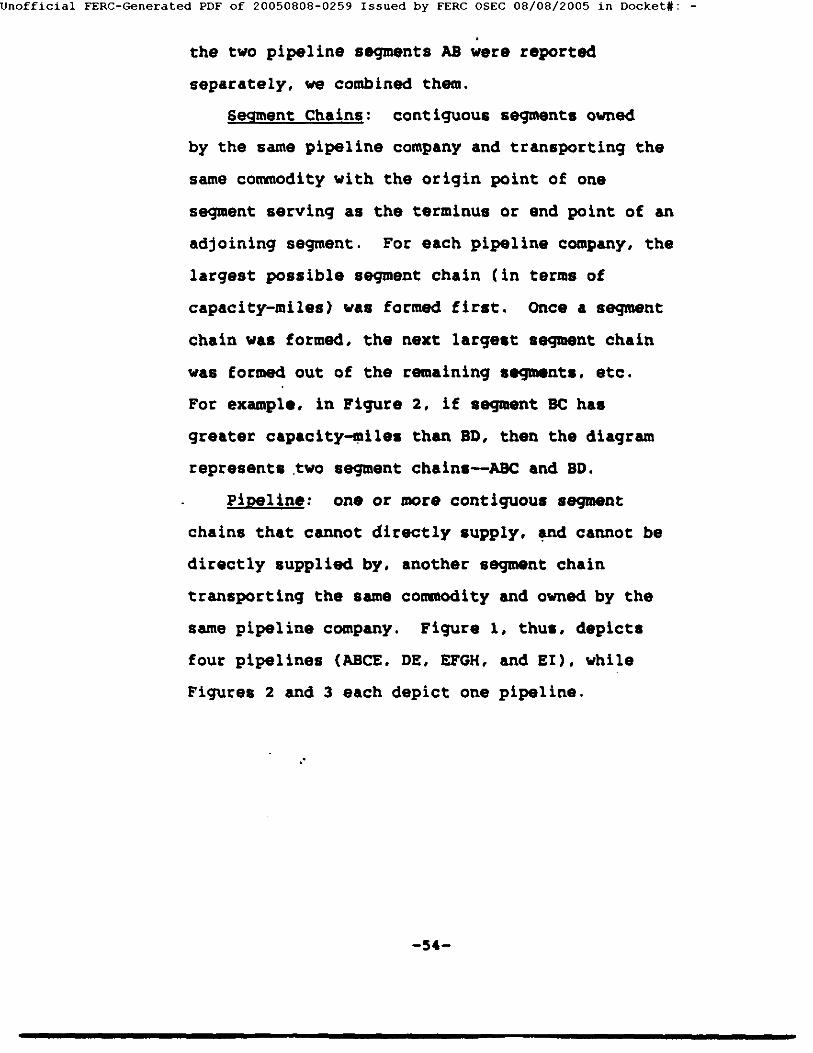
Unofficial FERC-Generated PDF of 20050808-0259 Issued by FERC OSEC 08/08/2005 in Docket#: -
. the two pipeline seqments AB were reported
separately, we combined them.
Segment Chains: contiguous segments owned
by the same pipeline company and transporting the
same commodity with the origin point of one
segment serving as the terminus or end point of an
adjoining segment. For each pipeline company, the
largest possible segment chain (in terms of
capacity-miles) was formed first. Once a segment
chain was formed, the next largest segment chain
was formed out of the remaining segments. etc.
For example, in Fiqure 2, if segment BC has
greater capacity~iles than BD, then the diagram
represents .two seqment chains--ABC and BD.
Pipeline: one or more contiguous segment
chains that cannot directly supply, and cannot be
directly supplied by, another segment chain
transporting the same commodity and owned by the
same pipeline company. Fiqure 1, thus, depicts
four pipelines (ABCE. DE, EFGH, and EI), while
Figures 2 and 3 each depict one pipeline.
-54-

Unofficial FERC-Generated PDF of 20050808-0259 Issued by FERC OSEC 08/08/2005 in Docket#: -
V. THE DATA USED IN THE REPORT
The Depa~tment's obse~vations of the o~igins and
destinations of oil pipelines we~e derived from pipeline
ta~iffs on file ~ith the FERC o~ state ~equlato~y agencies and
compiled and published by Marcova, Inc. 59/ Posted pipeline
tariffs indicate the location of currently ope~ating pipeline
te~minals.
Data for pipeline capacity we~e obtained from a numbe~ of
sources. The p~imary source is the most recent (June 1979)
pipeline throughput capacity reported on forms EIA-184. The
EIA-184 's were submitted to the Department of Ene.rgy by
pipeline companies and provided the basis for its 1980 pipeline
study. 60/ Each pipeline company supplied on its EIA-184 the
capacity of each significant segment of each of its pipelines.
The individual pipeline company was permitted to decide what it
considered a significant segment. A second source of pipeline
capacity data is a 1979 study by the National Petroleum Council
59/ Marcova, Inc., Interstate Pipeline Rates on Crude Petroleum Oil; Interstate Pipeline Rates on Gasoline and Petroleum Products; Intrastate Pipeline Rates on Crude Petroleum Oil; and Jntrastate Pipeline Rates on Gasoline and Petroleum Products:
§QI u.s. Department of Energy, United States Petroleum Pipelines, An Empirical Analy!iiS of Pipeline Siz·ing, Duft . Study (December 1980) (hereinafter referred to as DOE Pipeltne Study).
-55-
Unofficial FERC-Generated PDF of 20050808-0259 Issued by FERC OSEC 08/08/2005 in Docket#: -
("NPC"), .§.!/ In cases where the EIA-184 did not indicate a
pipeline's capacity, data from the NPC Study are used in this
Report. The EIA-184 and the NPC Study did not include
proprietary lines. For information on proprietary lines, the
Department relied upon pipeline maps prepared in 1975 by the
Office of Oil and Gas of the Federal Energy Administration, 62/
and various other public sources, including oil company annual
reports. All sources of pipeline data report throughput
capacities for the defined segment and not on-take or off-take
capacity at the individual pipeline's terminals. This Report
defines a pipeline's capacity in a BEA as its segment
throughput capacity as it enters (for destinations) or leaves
(for origins) the BEA.
The best source of public data for pipeline throughput for
FERC regulated pipelines is the annual FERC Form 6 reports
filed with FERC by the various pipeline companies. The
pipeline companies report (total company} annual receipts of
crude and refined product by state of origin. In many cases,
it is possible to impute throughput of individual segments from
the Form 6 data.
61/ National Petroleum Council, Petroleum Stora~e '· Transportation Capacities, Vol. III, Petroleum P1pel1ne (December 1979) (hereinafter referred to as NPC Study).
62/ The maps are contained in National Energy Transportation, supra note 33, at 203, 205.
-56-

Unofficial FERC-Generated PDF of 20050808-0259 Issued by FERC OSEC 08/08/2005 in Docket#: -
The ~aterborne transportation data used are 1980 actual
shipments between SEAs. These data ~ere obtained from the Army
C~rps of Engineers, which compiles shipment data, by product,
for all internal and coastal move~ents by water. 63/ Since the
focus of this study is pipeline market power. the Department
has included waterborne shipment data only for pipelineable
products--gasoline, jet fuel, kerosene. diesel fuel, and
distillate heating oil--and crude petroleum. As compiled by
the Corps of Engineers, the waterborne transportation data were
organized by port of origin and port of destination. These
data are assigned to the SEA in which the port is located.
As discussed above, refineries. crude pipelines, and
product pipelines compete against each other under certain.
circumstances. In order to compute market shares and HHis, it
is necessary that the capacity figures for these facilities be
made comparable. The usual measure of refinery capacity, and
the one used in this Report, is crude oil distillation
capacity. 64/ This capacity measure is in terms of crude oil
and thus is comparable to crude pipeline capacity. It is not
comparable to product pipeline capacity, for two reasons.
First, there are inputs to refineries other than crude oil,
63/ The Corps of ~nqineers did not provide shipment data broken down by ind~vidual shipper.
64/ The study's capacity data for refineries is the operating and idle calendar day crude capacity of refineries as of January 1, 1984. u.s. Department of Energy, Petroleum Supply Annual 1983, at 83-96 (June 1984).
-57-

Unofficial FERC-Generated PDF of 20050808-0259 Issued by FERC OSEC 08/08/2005 in Docket#: -
such as natural qas plant liquids. Second. of all refinery
products. only gasoline. jet fuel, kerosene, diesel fuel, and
distillate heating oil can be transported via petroleum product
pipelines. 65/ Residual fuel, petroleum coke, and asphalt are
not transported via pipeline. Liquid petroleum gas ("LPG") is
transported via LPG pipelines, which are not discussed in this
Report. In order to make the capacities of refineries and of
product pipelines comparable, the Department computed a ratio
of the production of pipelineable products to crude input at
refineries in 13 Bureau of Mines Refining Districts in
1982. 66/ The resulting ratios are used to adjust refinery
input capacities downward 67/ to make them comparable to
product pipeline capacities.
Product pipelines in product origin markets compete with
local consumption for petroleum products. Thus. local
consumption information must be included in the product origin
market in order to calculate shares accurately. Since
65/ See, ~· u.s. Department of Energy, Petroleum supply Annual 1983, at 52 (June 1984).
66/ The input and production data are found in U.S. Department of Energy, Petroleum Supply Annual 1982, at 40-41 (June 1983).
67/ The 13 Bureau of Mines Refining Districts and their computed ratios ar': East Coast •. 825; Appalachian ~1 •. 693; Appalachian ~2 •. 921; Indiana-Illinois-Kentucky, .913; Minnesota-Wisconsin-North and South Dakota, .876: OklahomaKansas-Missouri, .956; Texas Inland, .922; Texas Gulf Coast, .846; Louisiana Gulf Coast •. 871; North Louisiana-Arkansas, .692; New Mexico, .sal; Rocky Mountain, .886; and West Coast, .759.
-58-

Unofficial FERC-Generated PDF of 20050808-0259 Issued by FERC OSEC 08/08/2005 in Docket#: -
consumption figures by BEA are not readily available, they wece
derived from available data on consumption by state. The
available data were in the form of 1980 consumption, by state,
of motor gasoline, jet fuel, kerosene and distillate fuel. 68/
Using 1980 Census data, state consumption figures were conver~ed
into per capita consumption, which were then multiplied by the
BEA population to estimate BEA consumption. 69/ If a BEA
crossed state borders, a weighted per capita consumption
fi~ure. based on the percent of the BEA population in each
state. was used as the multiplier. 70/
Local crude production competes with pipelines and other
modes of transportation in crude destination markets, and thus
should be included in the market universe. For 18 major
producing states, the Department obtained county-by-county
information on 1981 crude production from state officials and
68/ State gasoline data for 1980 were obtained from u.s. Department of Transportation, Federal Highway Administration, Highway Statistics 1980, Table MF-21A, at 7. State data for 1980 kerosene and distillate fuel oil consumption were obtained from U.S. Department of Energy. Petroleum Supply Annual 1981, at 159, 164 (July 1982). The u.s. total of 1068 MBD of jet fuel supplied in 1980 was allocated among the SEAs in proportion to their relative population.
69/ Population by BEA is available in the 1980 census.
70/ For example, if 75 percent of the population of the BEA was in State X. which had a per capita petroleum products consumption figure of 2.4 gallons per day, and 25 percent of the population of the BEA was in State Y which had a per capita consumption figure of petroleum products of 2.0 gallons per day, the total consumption of the BEA would be derived by multiplying the population of the BEA by 2.3 gallons per day.
-59-

Unofficial FERC-Generated PDF of 20050808-0259 Issued by FERC OSEC 08/08/2005 in Docket#: -
thus was able to assign local production to the BEAs in these
states. Most of the remaining 30 states in the contiguous
United States are not significant crude oil producers. 71/
However, for BEAs in crude producing states for which the
Department currently does not have county production data,
notably Arkansas and Ohio, the Department estimated BEA
production based on total state production in 1982 and various
public sources of geographic information on crude production
activity within these states.
71/ Figures for 1982 crude oil production by state are presented in u.s. Department of Energy, Petroleum Supply Annual lill· at .37 (June 1983·).
-60-

Unofficial FERC-Generated PDF of 20050808-0259 Issued by FERC OSEC 08/08/2005 in Docket#: -
VI. RECOMMENDATIONS FOR INDIVIDUAL OIL PIPELINES
A. Introduction
This Chapter analyzes the need for continued federal regula
tion of individual oil pipelines and makes recommendations for
a number of oil pipelines. 72/ The analyses and recommendations
are based upon the methodology provided in Chapter III above
and upon information currently at the Department's disposal.
Should oil pipeline legislation be enacted, the Department anti
cipates making its final recommendation regarding the need for
continued FERC regulation of any individual pipeline as of such
time and in such form as is specified by the legi'slation.
Based upon its current information, the Department
recommends continued FERC regulation for the following product
pipelines: Colonial, Williams, Chevron (Salt Lake-Spokane
product system), Southern Pacific, and Calnev. 73/ In addi
tion, there are six product pipelines for which the relative
benefits and costs of continued FERC regulation are too close
to call at this time. These are Nyco, Badger. Yellowstone,
West Shore. Kanab, and Texas !astern. At this time, the
Department does not make any recommendation with respect to
any LPG, NGL, and anhydrous ammonia pipelines. The Department
72/ Maps of crude and product pipelines in the lower-48 United States are reprinted from the NPC Study in an appendix to this Report.
73/ This Report considers only pipelines. in the contiguous United States.
-61-,

Unofficial FERC-Generated PDF of 20050808-0259 Issued by FERC OSEC 08/08/2005 in Docket#: -
recommends federal deregulation of al'l other oil pipelines.
However, nothing in the discussion that follows anticipates the
elimination of tariff regulation currently exercised by
individual states.
For each of the two groups of product pipelines, those
recommended for continued FERC regulation, and those recommended
for future s~udy, there is a table on an adjacent page of this
Report indicating each pipeline's share of total 1983 barrel
~iles (excluding the Trans Alaska Pipeline System, TAPS). As
the tables indicates, pipelines that are recommended for
continued regulation accounted for 26.0% of 1983 barrel-miles,
while pipelines recommended .for immediate deregulation accounted
for 70.9% of 1983 barrel-miles. Pipelines that require f~ture
study account for 3.1% of 1983 barrel-miles.
The Department recommends that all existing crude oil
pipelines be deregulated. The Department has analyzed crude
oil pipeline markets in accordance with the methodology con
tained in Chapter III above. The Department has not identified
any crude pipeline that presents a clear case for continued
federal regulation. In addition, there are theoretical consi
derations that tend to lessen the· need for the continued federal
regulation of crude pipelines. Crude production and crude
refining are activities that feature fewer participants and
larger investment~ than those in product marketing. Thus,
crude origin and destination markets are more likely to exhibit
characteristics that either mitigate the exercise of market
power or undercut the effectiveness of regulation. These
-62-

Unofficial FERC-Generated PDF of 20050808-0259 Issued by FERC OSEC 08/08/2005 in Docket#: -
Pipelines Recommended for Continued Regulation
Pipeline
Colonial
Williams • Southern Pacific
Chevron (Product Only)
Calnev
Total
Source: FERC Form 6 reports.
Share of 1983 Bar~el-Miles (excluding TAPS)
(pe!:centage)
22.6
1.8
1.1
0.3
26.0
Pipelines Recommended for Future Study
Pipeline
Texas Eastern
Kaneb
West Shore
Yellowstone
Badger .·
Share of 1983 Barrel-Miles (excluding TAPS)
(percentage)
2.4
0.3
0.3
0.2
0.1
Wyco 0.1
Total 3.1
Source: FERC Form 6 reports.
-63-

Unofficial FERC-Generated PDF of 20050808-0259 Issued by FERC OSEC 08/08/2005 in Docket#: -
characteristics, which include vertic'al integration. bilateral
exchange, and bottlenecks elsewhere in the vertical supply
chain. weaken the justification for continued federal regu
lation of crude oil pipelines. 74/
The remainder of this chapter considers individual
pipelines. beginning with those recommended for continued regu
lation, then turning to those in the "gray" area. where market •
conditions place them close to the threshold of competitive
concern. Also discussed are some of the pipelines that are
clear candidates for deregulation. These lines were selected
for discussion because a preliminary, structural screen indi
cated that a more detailed investigation was warranted. Many
additional pipelines that can safely be deregulated are not
discussed. Some of the pipeline analyses that follow are
accompanied by a table that contains. for each BEA, a Herfindahl
measure and the pipeline's throughput capacity in the BEA. The
Herfindahl measure is adjusted for surplus capacity in
accordance with Chapter III. 75/
74/ These factors are discussed supra in text accompanying notes 48-53.
75/ One change used to compute adjusted HHis over those in the Preliminary Report (id.) is that the entire share of water transportation is treated-ai zero in the adjusted.HHI. Essentially. this assumes that water transportation is perfectly competitive, except that the amount of oil transported by water is fixed at 1980 levels.
-64-

Unofficial FERC-Generated PDF of 20050808-0259 Issued by FERC OSEC 08/08/2005 in Docket#: -
The tables should be viewed merely as a gross tool to
evaluate market concentration since BEAs are, in many cases,
only rough approximations of relevant markets. Where the BEAs
are not even reasonable approximations of relevant markets. no
table appears with the individual pipeline analysis.
B. Pipelines Recommended For Continued Regulation
1. Colonial Pipeline: Houston to New York {Product)
Destination BEAs Adjusted
HHI Capacity
012 New York, NY 937 960
018 Philadelphia, PA 674 960
019 Baltimore, MD 5564 960
020 Washington, DC 4621 960
021 Roanoke, VA 5000 36
022 Richmond, VA 4661 960
023 Norfolk, VA 2703 119
026 Fayetteville; NC 10000 41
02·7 Raleigh, NC 10000 146
028 Greensboro, NC 5000 1908
029 Charlotte, NC 5000 1908
031 Greenville, sc 5000 1908
035 Augusta •. GA 10000 29
036 Atlanta, GA 4860 1908
037 Columbus, GA 5000 33
038 Macon, GA 5000 56
-65-

Unofficial FERC-Generated PDF of 20050808-0259 Issued by FERC OSEC 08/08/2005 in Docket#: -
040 Albany, GA 9246 33
049 Birmingham, AL 4558 1908
051 Chattanooga, TN 5000 17l
053 Knoxville, TN 5000 108
054 Nashville, TN 8590 63
112 Jackson. MS 1008 1908
114 Baton Rouge. LA 171 1908
115 Lafa:~::ette, LA 1339 1908
Colonial, a joint venture of 10 oil companies. 1!/ is a
strong candidate for continued regulation. Historically, almost
40 percent of colonial shipments are made by non·owners, 77/
eliminating the vertical integration justification for
deregulation. The Colonial main trunkline should be considered
in two segments, as each confronts a different competitive
situation. In the first segment, Houston to Washington, D.c ..
Colonial runs parallel with the Plantation pipeline. In this
area, the main trunks of ·the two pipelines are separated from
Atlantic port competition by a distance of 150-250 miles. In
such ci·ties as Atlanta, Charlotte. and Greensboro, Colonial and
Plantation stand as a duopoly. There is virtually no competi
tion from refineries or water transportation. While the
76/ The owners and their percentage shares are: Gulf, 16.78; Amoco, 14.32; Texaco, 14.27; CITGO, 13.98; Mobil, 11.49; BP. 8.96; Conoco, 7.55; Phillips. 7.10; Union, 3.97; and Arco, 1.58. Gulf's share was recently acquired by Unocal (Union).
77/ Wolbert, supra note 6, at 408-9.
-66-
Unofficial FERC-Generated PDF of 20050808-0259 Issued by FERC OSEC 08/08/2005 in Docket#: -
trunkline capacities of Colonial and Plantation at these
southern cities easily exceed the local consumption require
ments, 78/ the HHI adjusted for surplus capacity is still 5000.
The combined product consumption in the SEAs between
Houston and Washington, o.c. is significant enough to justify
regulation of Colonial. In 11 southern SEAs where Colonial and
Plantation serve as a virtual duopoly 79/ and in the three
southern BEAs where Colonial is a monopolist, 80/ local product
consumption totals 870 MBD. This consumption comprises a signi
ficant 35 percent of the maximum combined trunkline capacity of
Colonial and Plantation of 2467 MBD.
In the second par·t of Colonial, north of Washington to New
York, Colonial no longer competes with Plantation. However, it
does compete with refineries and water transportation. In
Baltimore, with a local product consumption of 122 MBD. 81/
Colonial competes with 31 MBD in water shipments. 82/ While
78/ The local product consumption figures for the three cities are Atlanta--141 MBD, Charlotte--so MBD, and Greensboro--65 MBD. These quantities are small compared to the combined trunkline capacity of Colonial and Plantation of 2467 MBO.
79/ Washington, D.C., Roanoke, Richmond, Greensboro. Charlotte, Greenville, Atlanta, Columbus, Macon. Chattanooga. and Knoxville.
80/ Fayetteville, Raleigh, and Augusta.
81/ There are two Colonial stublines from the Colonial main trunkline in the w~stern part of the Baltimore BEA to the city of Baltimore itself. The combined capacity of the stublines is 156 MBD, with June 1979 throughput at 134 MBO.
82/ The Chevron 14 MBD refinery in Baltimore is inactive. Throughout this section. the refinery capacity measure refers
[Footnote Continued]
-67-
Unofficial FERC-Generated PDF of 20050808-0259 Issued by FERC OSEC 08/08/2005 in Docket#: -
the HH! adjusted for surplus capacity in Baltimore is 556•. a
Colonial price increase in Baltimore would probably be
u~profirable since water receipts, particularly receipts of
foreign product. could expand.
North of Baltimore. Colonial appears to face still greater
competition. In this region, Colonial faces competition from
foreign imports. which have been increasing in recent years.
In addition, the 960 MBD Colonial pipeline competes in
Philadelphia with the 174 MBD Chevron refinery. the 168 MBD BP
refinery, the 155 MBD Sun refinery. the 140 MBD Texaco
refinery. the 125 MBD Atlantic refinery. the 100 MBD Mobil
refinery, the 90 MBD Coastal refinery. and the 44 MBD seaview
refinery, and in New York with the 80 MBD Chevron refinery (now
idle) and the 100 MBD Exxon refinery. 83/ However. Colonial
appears to have market power in too many significant SEAs south
of Baltimore to justify deregulation.
82/ (Footnote Continued]
to crude input capacity. In computing market shares and HHis for product destination markets. the refinery capacity was multiplied by the ratio of pipelineable to total products. See note 67 supra.
83/ The Chevron and Exxon refineries have significant capacities for producing asphalt, and thus may not produce significant quantities of pipelineable product.
-68-

Unofficial FERC-Generated PDF of 20050808-0259 Issued by FERC OSEC 08/08/2005 in Docket#: -
2. Williams Pipeline: Entire Network Throughout the Midwest (Product)
Adjusted Destir:.a~ion BEAs HHI Caoacity
083 Ch~cago, IL 989 88
085 Springfield, IL 3333 68
086 Quincy. IL 1837 12
087 Peoria. IL 58 86
088 Rockford. IL 3333 88
092 Eau Claire, WI 10000 26
093 Wausau, WI 5000 26
095 Duluth, MN 3729 34
096 Minneapolis, MN 2438 119
097 Rochester. MN 5000 15
098 Dubuque, Ill. 4395 12
099 Davenport, Ill. 2813 88
100 Cedar Rapids, Ill. 5000 116
101 Waterloo, Ill. 10000 208
102 Fort Dodge, IA 5000 22
103 Sioux City, IA 3333 96
104 Des Moines, IA 5556 341
105 Kansas City. MO 2500 475
106 Columbia, MO 3037 36
107 St.Louis. MO 1092 36
108 Springfield, MO 3333 277
137 Oklahoma City. OK N.A. N.A.
-69-

Unofficial FERC-Generated PDF of 20050808-0259 Issued by FERC OSEC 08/08/2005 in Docket#: -
138 Tulsa, OK N.A. N.A.
139 Wichita. KS 1250 132
141 Topeka, KS 10000 206
142 Lincoln, NE 5000 106
HJ Omaha, NE 2500 96
144 Grand Island, NE 3333 31
147 Sioux Falls, SD 3333 96
148 Aberdeen, SD 5000 10
149 Fargo, ND 3333 32
150 Grand Forks, ND 10000 22
N.A.--not available
Williams is another candidate for continued regulation.
The independent Williams system is the fifth largest products
carrier in the United States. Williams transports product from
Oklahoma and Kansas northward via two trunk lines--an east line
and a west line. The east line runs from Kansas City via Des
Moines to Minneapolis; the west line from Kansas City via Omaha
to Sioux City, Iowa and Sioux Falls, South Dakota. The two
lines join in central Minnesota and go on to serve Fargo, North
Dakota and Grand Forks, North Dakota.
In some areas Williams faces significant competition.
Williams has no market power in the competitive Chicago and . St. Louis markets'. Water traffic on the Mississippi and
Illinois Rivers offers Williams competition at Quincy, Illinois
(BEA 86) and Peoria, Illinois (BEA 87). At the Mississippi
River port of Davenport, Iowa (SEA 99), water shipments
-70-
Unofficial FERC-Generated PDF of 20050808-0259 Issued by FERC OSEC 08/08/2005 in Docket#: -
comprise 25 percent of local consumption, with the rest
accounted for by an Arco pipeline (at Fort Madison) and
Williams. Increased water shipments to Davenport, plus
poten:ial comperi:ion from Amoco at Dubuque (73 miles north)
and Badger at Peru. Illinois {75 miles east) probably forestall
Williams market power in Davenport. In Rockford, Illinois (SEA
88) Williams, Amoco, and Badger form a triopoly; however, the
competitive Chicago market is only 86 miles away. In
Springfield-Decatur, Illinois {SEA 85) Williams. Phillips. and
the Shell proprietary line face competition from Marathon in
Champaign {47 miles east of Decatur), and the river port at
Peoria (73 miles north of Springfield), as well as potential
competition from the Explorer pipeline whose right-of-way
passes through the Springfield-Decatur SEA.
Williams probably also faces adequate competition in
Missouri. In Columbia, Missouri (BEA 106), Williams. Phillips,
and Arco form a triopoly, but the Continental terminal at
Belle. Missouri (SEA 107) is 75 miles away from Columbia. 84/
In Springfield, Missouri (BEA 108) Williams, Continental, and
eRA-Farmland face potential competition from Explorer and Amoco
pipelines which recently cancelled tariffs to destinations in
SEA 108. In Kansas City, there are 4 supplying pipelines-
Williams, Phillips, Amoco, and Arco. In Omaha, Nebraska (SEA
143) there are alsd 4 pipelines--Williams, the Amoco and NCRA
84/ Water traffic along the Missouri River is not significant (only 1 MBD to Columbia).
-71-
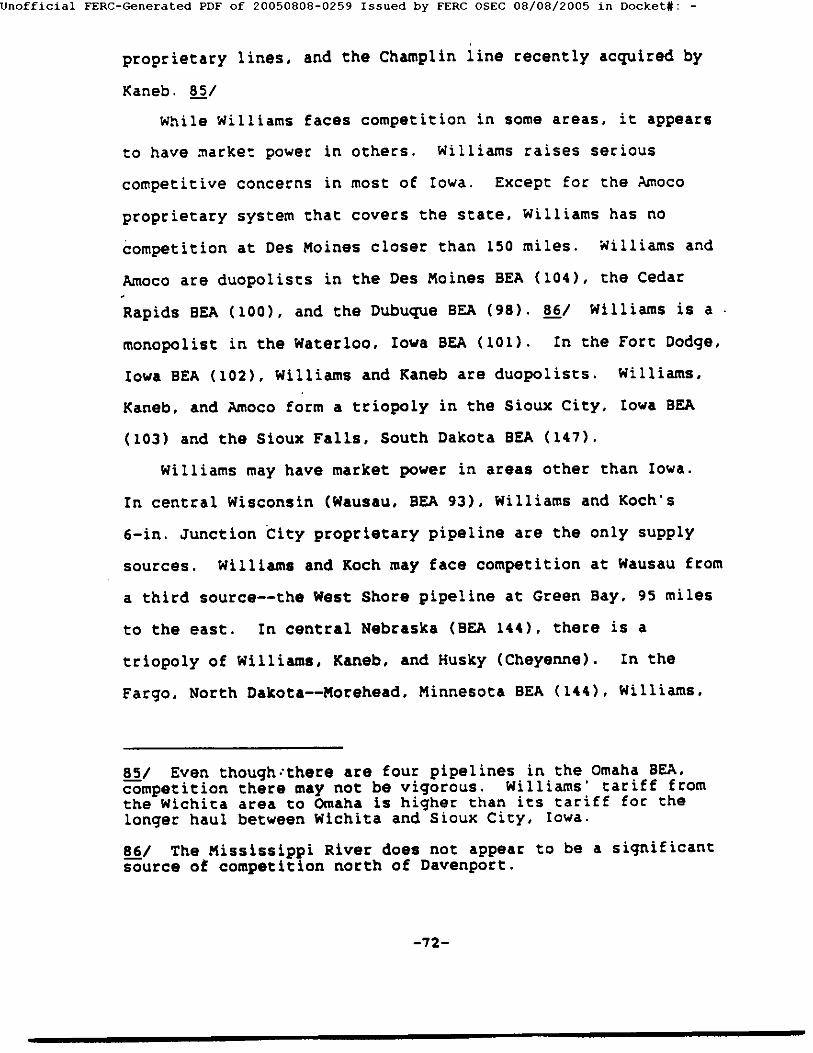
Unofficial FERC-Generated PDF of 20050808-0259 Issued by FERC OSEC 08/08/2005 in Docket#: -
proprietary lines, and the Champlin line recently acquired by
Kaneb. 85/
While Williams faces competition in some areas, it appears
to have ~arket power in others. Williams raises serious
competitive concerns in most of Iowa. Except for the Amoco
proprietary system that covers the state, Williams has no
competition at Des Moines closer than 150 miles. Williams and
Amoco are duopolists in the Des Moines BEA (104), the Cedar
Rapids BEA (100), and the Dubuque BEA (98). 86/ Williams is a.
monopolist in the Waterloo. Iowa BEA (101). In the Fort Dodge,
Iowa BEA (102), Williams and Kanab are duopolists. Williams,
Kaneb, and Amoco form a triopoly in the Sioux City. Iowa BEA
(103) and the Sioux Falls, South Dakota BEA (147).
Williams may have market power in areas other than Iowa.
In central Wisconsin (Wausau, BEA 93), Williams and Koch's
6-in. Junction City proprietary pipeline are the only supply
sources. Williams and Koch may face competition at Wausau from
a third source--the West Shore pipeline at Green Bay. 95 miles
to the east. In central Nebraska (BEA 144), there is a
triopoly of Williams, Kanab, and Husky (Cheyenne). In the
Fargo. North Dakota--Morehead. Minnesota BEA (144), Williams,
85/ Even though:there are four pipelines in the Omaha BEA. competition there may not be vigorous. Williams' tariff from the Wichita area to Omaha is higher than its tariff for the longer haul between Wichita and Sioux City, Iowa.
86/ The Mississippi River does not appear to be a significant source of competition north of Davenport.
-72-

Unofficial FERC-Generated PDF of 20050808-0259 Issued by FERC OSEC 08/08/2005 in Docket#: -
Kaneb, and Amoco form a triopoly. There is no other
competition for more than 200 miles. North of Fargo, Williams
is a monopolist in the Grand Forks BEA (150); south of Fargo,
Williams and Kaneb are duopolists in the Aberdeen, South Dakota
BEA (148).
In summary, Williams participates in concentrated product
destination markets over a wide area of Iowa, Nebraska. South
Dakota, North Dakota, and Wisconsin. Williams should not be
deregulated.
-73-

Unofficial FERC-Generated PDF of 20050808-0259 Issued by FERC OSEC 08/08/2005 in Docket#: -
3. Chevron (Salt Lake-Spokane System) (Product)
Adjusted Destination BEAs HHI Capacity
166 Pocatello, ID 10000 64
167 Boise, ID 10000 64
168 Spokane. WA 5005 16
169 Richland. WA 0 64
The Chevron line from Salt Lake to Spokane should not be
deregulated. It has a capacity of 64 MBD between Salt Lake and
Pasco, Washington and a capacity of 16 MBD between Pasco and
Spokane. It is a monopolist in Pocatello-Idaho Falls and in
Boise. The closest competition to Chevron in Boise is 280
miles away at Pasco, Washington. In the Richland, Washington
BEA (169), Chevron has no pipeline or refinery competition;
however. there is a water terminal at Pasco that substantially
·lessens Chevron's market power. In Spokane, Chevron has the
smaller share of a duopoly with Yellowstone. There is an
insiqnificant volume of water traffic along the Snake River.
prob&bly to the Lewiston, Idaho--Clarkston, Washington area.
However, these porta are 111 miles south of Spokane. This
distance, plus the shallowness of the Snake River, probably
renders water competition ineffective in Spokane.
Chevron is not the only potential shipper on its own line.
as there are five Salt Lake City refine~s including Chevron.
Thus, there is no "refinery bottleneck" nor vertical integra
tion justification for deregulating the Chevron line.

Unofficial FERC-Generated PDF of 20050808-0259 Issued by FERC OSEC 08/08/2005 in Docket#: -
4. Southern Pacific (Product)
Adjusted Destination BEAs HHI Capacity
161 Tucson. AZ 10000 70
162 Phoenix. AZ 10000 161
164 Reno. NV 10000 30
173 Eugene. OR 8521 40
177 Sacramento. CA 5000 167
178 Stockton. CA 4718 78
179 Fresno. CA 1111 25
181 San Diego, CA 4530 114
Southern Pacific Pipeline is wholly owned by the Southern
Pacific Company and is unaffiliated with a ·major oil company.
Southern Pacific has four pipeline routes for which it files
tariffs at FERC: El Paso-Tucson-Phoenix. Los Angeles-Phoenix.
San Francisco-Reno. and Portland-Eugene. Southern Pacific also
has intrastate movements to destinations such as Stockton,
Sacramento. Fresno. and Imperial. California. but these
movements are regulated by the Public Utilities Commission of
the State of California.
The El Paso-Tucson-Phoenix route has a throughput capacity
of 70 MBD to Tucson and 50 MBD to Phoenix. !r/ Southern
87/ This is the combined capacity of an 8 in .. 41 MBD segment reported in southern Pacific's EIA-184. and a 6 in .• 9 MBD segment reported in Southern Pacific's Form 6 and the NPC Study, supra note 61.
-75-

Unofficial FERC-Generated PDF of 20050808-0259 Issued by FERC OSEC 08/08/2005 in Docket#: -
Pacific's receipts on this route averaged 56 MBD in 1983. 88/
The Los Angeles-Phoenix route has a throughput capacity into
Phoenix of 111 MBD. Thus, total throughput capacity to Phoenix
from both east and west is 161 MBD. Southern Pacific has a
monopoly in Phoenix and Tucson. The nearest alternative supply
facilities for Phoenix are Los Angeles (389 miles), Las Vegas
(285 miles), El Paso (438 miles), Albuquerque (458 miles). and
the Giant refinery at Ciniza. New Mexico (340 miles). 89/
Phoenix is only 183 miles north of the Mexican border at
Nogales; however, in 1983 there were no imports of finished
motor gasoline from Mexico to PADD V, which includes the State
of Arizona. 90/ · Thus, the Southern Pacific lines to Phoenix
and Tucson should continue to be requlated.
The Southern Pacifi~ line from San Francisco to Reno should
also continue to be regulated. It has a throughput capacity of
30 MBD to Reno. Southern Pacific is the only supply facility
in the Reno BEA (164). The closest alternative supplies are
the Chevron proprietary pipeline to Sacramento (133 miles) and
the refineries and the ports in the San Francisco Bay area (200
miles).
88/ Southern Pacific Form 6.
89/ The 6 MBD refinery at Fredonia. Arizona (341 miles north of Phoenix) shut down in 1983, but recently reopened.
90/ u.s. Department of Energy, Petroleum Supply' Annual 1983, at 41 (June 1984).
-76-
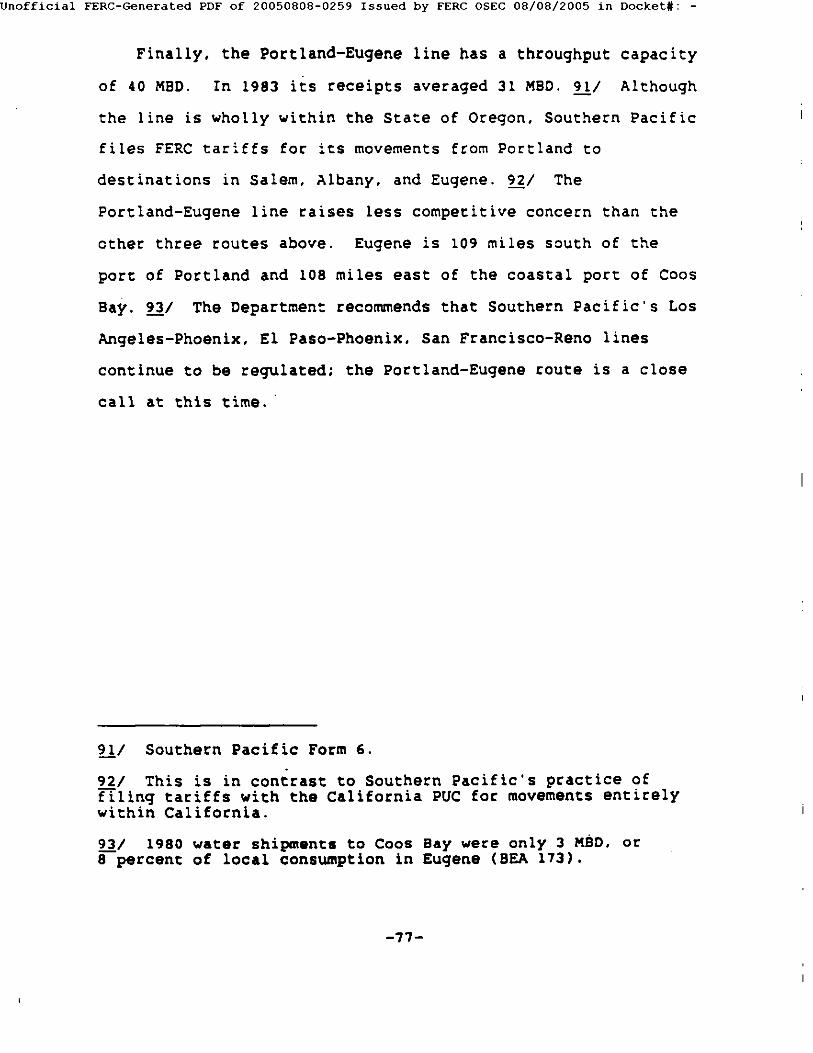
Unofficial FERC-Generated PDF of 20050808-0259 Issued by FERC OSEC 08/08/2005 in Docket#: -
Finally, the Portland-Eugene line has a throughput capacity
of 40 MBD. In 1983 its receipts averaged 31 MBO. !1/ Although
the line is wholly within the State of Oregon. Southern Pacific
files FERC tariffs for its movements from Portland to
destinations in Salem, Albany. and Eugene. 92/ The
Portland-Eugene line raises less competitive concern than the
ether three routes above. Eugene is 109 miles south of the
port of Portland and 108 miles east of the coastal port of Coos
Bay. 93/ The Department recommends that Southern Pacific's Los
Angeles-Phoenix. El Paso-Phoenix. San Francisco-Reno lines
continue to be regulated; the Portland-Eugene route is a close
call at this time.
!l/ Southern Pacific Form 6.
92/ This is in contrast to Southern Pacific's practice of filing tariffs with the California PUC for movements entirely within California.
93/ 1980 water shipments to Coos Bay were only 3 MBD. or 8 percent of local consumption in Eugene (BEA 173).
-77-
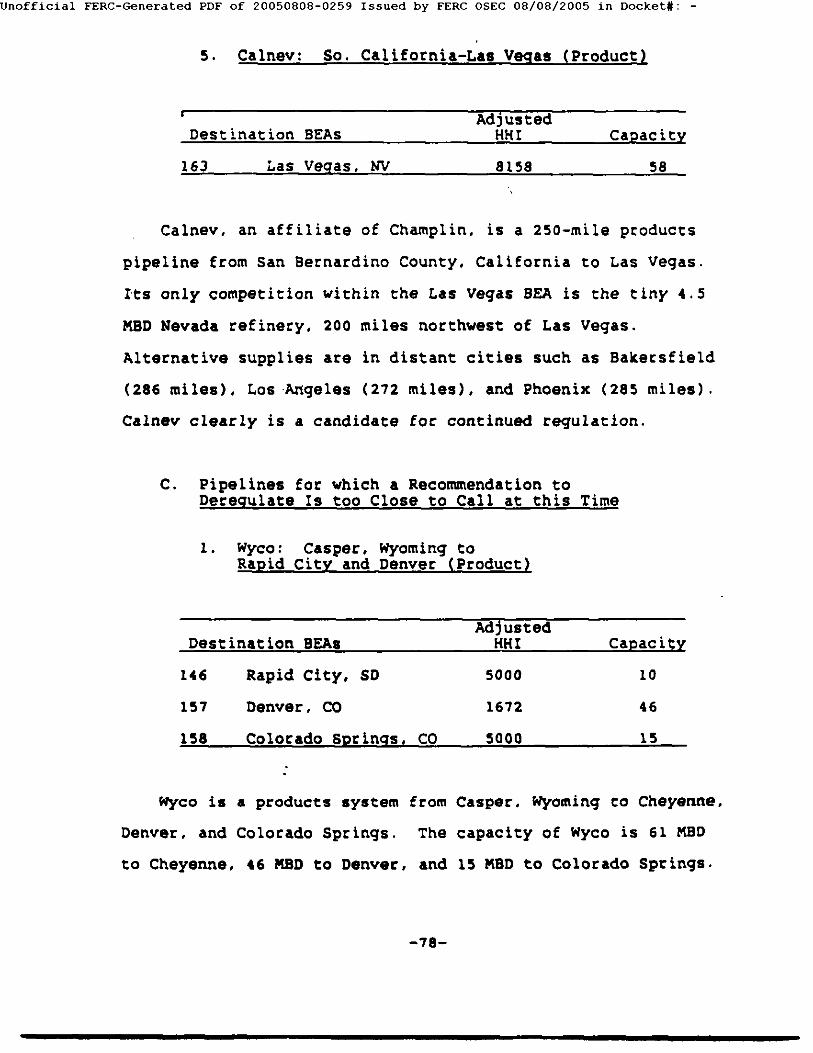
Unofficial FERC-Generated PDF of 20050808-0259 Issued by FERC OSEC 08/08/2005 in Docket#: -
5. Calnev: So. California-Las Vegas (Product)
Destination BEAs
163 Las Vegas. NV
AdJusted HHI
8158
Capacity
58
Calnev, an affiliate of Champlin, is a 250-mile products
pipeline from San Bernardino County, California to Las Vegas.
Its only competition within the Las Vegas BEA is the tiny 4.5
MBD Nevada refinery, 200 miles northwest of Las Vegas.
Alternative supplies are in distant cities such as Bakersfield
(286 miles), Los ·Angeles (272 miles), and Phoenix (285 miles).
Calnev clearly is a candidate for continued regulation.
C. Pipelines for which a Recommendation to Deregulate Is too Close to Call at this Time
1. Wyco: Casper, Wyoming to Rapid City and Denver (Product)
Adjusted Destination SEAs HHI Capacity
146 Rapid City, SD 5000 10
157 Denver, co 1672 46
158 Colorado SJi!rings, co 5000 15
Wyco is a products system from Casper. Wyoming to Cheyenne,
Denver, and Colorado Springs. The capacity of Wyco is 61 MBD
to Cheyenne, 46 MBD to Denver, and 15 MBD to Colorado Springs.
-78-

unofficial FERC-Generated PDF of 20050808-0259 Issued by FERC OSEC 08/08/2005 in Docket#: -
In addition, Wyco has a 6-in .• 10 MBD spurline from Casper to
Rapid City, South Dakota. Wyco is a joint venture of
subsidiaries of Amoco (40 percent), Texaco (40 percent), and
Mobil (20 percent). 94/ In 1983 Wyco's receipts in the State
of Wyoming were 45 MBD. 95/
Wyco does not appear to require federal regulation along
its mainline to Cheyenne, Denver, and Colorado Springs. Wyco's
movements from Casper to Cheyenne are intrastate, and Wyco does
not: file a tariff at FERC for these movements. In Denver. Wyco
competes with three pipelines (Borger-Denver. Chase. and
Medicine Bow) and two refineries (Conoco and Asamera). While
Wyco and Borger-Denver are the only supply facilities in the
Colorado Springs-Pueblo BEA (158), the competitive Denver
market is only 70 miles from Colorado Springs. and 112 miles
from Pueblo.
The Wyco spurline to Rapid City raises serious competitive
concerns, however. The Wyco terminal at Rapid City and the
Wyoming Refining Co. refinery at Newcastle, Wyoming (79 miles
west of Rapid City) form a duopoly in the Rapid City BEA
(146). The nearest alternatives (and distances to Rapid City)
are Kaneb at Mitchell, South Dakota (275 miles). Husky at
Sidney. Nebraska (256 miles), the Amoco and Little America
refineries at casper. Wyoming (261 miles). the Continental
94/ Texaco recently sold its 40\ share to Mobil.
95/ Wyco Form 6.
-79-

Unofficial FERC-Generated PDF of 20050808-0259 Issued by FERC OSEC 08/08/2005 in Docket#: -
pipeline terminal at Sheridan, Wyoming (240 miles), and the
Cenex terminal at Glendive, Montana (292 miles). These sources
may be all located too far from Rapid City to offer significant
competition t~ Wyco.
The Wyco spurline to Rapid City is a small pipeline. Its
diameter is only 6 in., and its throughput capacity is only 10
MSD. One might consider deregulating this spurline on de
~inimis grounds. The efficiency of a pipeline varies directly
with its diameter. The Wyco tariff from Casper to Rapid City
is 3.0 cents per gallon, while Wyco's tariff over a similar
distance from Casper to Denver is only 1.9 cents per gallon.
In comparison, the marginal cost of trucking from Casper to
Rapid City is around five cents per gallon. At this time the
Department considers Wyco a close call.
2. Texas Eastern: Houston to Cincinnati (Product)
AdJUSted Destination SEAs HHI capacity
055 Memphis, TN 859 57
067 Cincinnati. OH 1465 175
079 Indianapolis, IN 1429 300
080 Evansville, IN 1953 300
083 Chicago, IL 989 86 ,•
107 St. Louis, MO 1092 300
111 Little Roclt, II.B. 3089 325
117 Shreveport, LA 2533 325
-80-

Unofficial FERC-Generated PDF of 20050808-0259 Issued by FERC OSEC 08/08/2005 in Docket#: -
With the exception of Little Rock, Arkansas, the Texas
Eastern products system competes in competitive ~arkets. The
main 300 MBD Texas Eastern line runs from Houston to Little
Rock and then runs parallel to the Ohio River up to Seymour,
Indiana and then Cincinnati. From Seymour, a spur line runs
throuqh Indianapolis to Chicaqo. Total Texas !astern
deliveries of qasoline, kerosene, and distillate averaqed 206
MID in 1983. !!/
Texas !astern does not have destination market power in
Shreveport. Sprinkled throuqhout the area of northern
Louisiana and southern Arkansas are a number of small
refineries: Pennzoil (45 MBD). Calumet (3 MBD), Claiborne (7
MID), and two ~err-McGee refineries (18 MBD total) in northern
Louisiana; Cross (7 MID), Berry (3 MBD), MacMillan (5 MID), and
Lion (39 MID) in southern Arkansas. These refineries, all
within 80 miles of Texas !astern's terminal at Arcadia,
Louisiana (BEA 117), assure reasonable competition in
Shreveport.
In Evansville. Indiana, Texas !astern competes with the
21.2 MID Indiana ~arm Bureau refinery, and 15 MID of Ohio River
water traffic. In addition, the 195 MID Marathon refinery in
the Terre Haute B!A is only 75 •iles from Evansville. The
Combined local product consumption in Evansville and Terre
Haute is 50 MID. Tb~rty percent of this can be supplied via
!!/ Texas Eastern ~orm 1.
-81-

Unofficial FERC-Generated PDF of 20050808-0259 Issued by FERC OSEC 08/08/2005 in Docket#: -
water. The remaininq 35 MBD could be supplied in equal parts
by Texas Eastern, Marathon. and Indiana Farm Bureau, each with
a 24 percent share. The adjusted HHI is only 1728.
In Cincinnati, Texas Eastern competes with the 43.7 MBO
Chevron refinery, the 40 MID Miami Valley proprietary line of
Sohio, and with numerou• water terminals which supply 32 MID of
pipelineable product. The local product con1umption in
Cincinnati i1 95 MBD. One-third of thi1 local demand can be
as1umed to be 1upplied by water traffic. The remaininq
two-third• could be divided in equal parts by Chevron, Sohio,
and Texas Eastern. The resultinq HHI, adjusted for •urplus
capacity, i• 1455.
·Texas Eastern competes in Indianapolis with Marathon,
Buckeye, aock Island, Amoco, Shell, and Indiana Farm Bureau.
The local product consumption of Indianapolil is 12 MID. This
could be supplied in equal parts by the 7 firm•, yieldinq an
HHI adjusted for surplus capacity of 1429.
The only destination market of Texa• Eastern that raises
competitive concern• is Little aock, Arkansas. Texas Eastern
faces no competition at Little aock within 100 miles.
Formerly, lun pipeline delivered product into Little aock, but
sun has recently sold its Fort Smith-Little aock segment to a
firm that will convert the line to natural vas transport. In ' ~ittle aock, Texas Eastern's nearest competition consists of
Mis1issippi River ports and •outhern Arkansas refineries.
Based on interviews conducted by the Department. these source•
-12-

unofficial FERC-Generated PDF of 20050808-0259 Issued by FERC OSEC 08/08/2005 in Docket#: -
may be too far from Little Rock to provide viable competition.
There are four refineries in the southern part of the Little Rock SEA (111), but they are all quite far from metropolitan Little Rock. The largest of'the four, the 39 MBD Lion refinery at El Dorado, Arkansas, is 116 miles south of Little Rock. The other three refineries (Cross. Berry, and MacMillan) are also
located nearby in the El Dorado area. The river ports are at Memphis (137 miles), Helena, Arkansas (120 miles), Arkansas
City, Arkansas (110 miles), and Greenville, Mississippi (144
miles). 97/ Little Rock is located on the Arkansas River, but
petroleum traffic on the Arkansas River is insignificant. 98/
Due to competitive concerns in Little Rock. Texas Eastern
is a close call at this time.
97/ Memphis also has the 60 MBD Mapco refinery.
98/ Murphy owns a w•ter terminal on the Arkansas River at Little Rock, but it is closed. According to Murphy, pipeline tariffs would have to increase at least 3.St per gallon before water traffic on the Arkansas River became attractive.
-83-
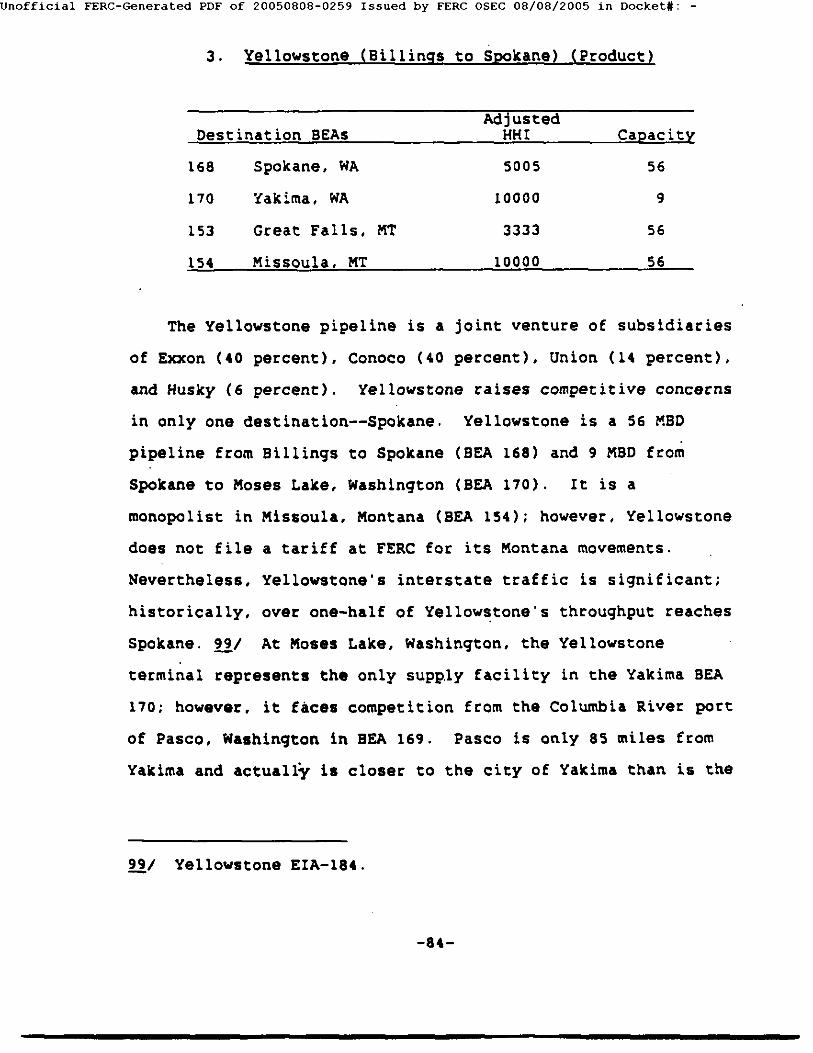
Unofficial FERC-Generated PDF of 20050808-0259 Issued by FERC OSEC 08/08/2005 in Docket#: -
3. Yellowstone (Billings to Spokane) (Product)
AdJUSted Destination SEAs HHI Capacity
168 Spokane, WA 5005 56
170 Yakima, WA 10000 9
153 Great Falls, MT 3333 56
154 Missoula. MT 10000 56
The Yellowstone pipeline is a joint venture of subsidiaries
of Exxon (40 percent), Conoco (40 percent), Union (14 percent),
and Husky (6 percent). Yellowstone raises competitive concerns
in only one destination--Spokane. Yellowstone is a 56 MBD
pipeline from Billings to Spokane (SEA 168) and 9 MSD from
Spokane to Moses Lake, Washington (BEA 170). It is a
monopolist in Missoula, Montana (BEA 154); however, Yellowstone
does not file a tariff at FERC for its Montana movements.
Nevertheless, Yellowstone's interstate traffic is significant;
historically, over one-half of Yellowstone's throughput reaches
Spokane. 99/ At Moses Lake, Washington, the Yellowstone
terminal represents the only supply facility in the Yakima BEA
170; however. it faces competition from the Columbia River port
of Pasco, Washington in BEA 169. Pasco is only 85 miles from
Yakima and actually is closer to the city of Yakima than is the
2!1 Yellowstone EIA-184.
-84-

Unofficial FERC-Generated PDF of 20050808-0259 Issued by FERC OSEC 08/08/2005 in Docket#: -
Yellowstone terminus at Moses Lake which is 101 miles away. In
addition, Pasco is also only 70 miles from Moses Lake. Thus,
water transportation through Pasco may compete in BEA 170.
In Spokane, Yellowstone is the larger facility of a
Yellowstone-Chevron duopoly. The river ports of Pasco (140
miles southwest of Spokane) and Lewiston-Clarkston (111 miles
south of Spokane) probably do not offer significant competition
in Spokane. The Department recommends continued regulation of
the Chevron line due to its clear monopoly in Boise, Idaho. If
Chevron remains regulated and if there is significant excess
capacity on Chevron to Spokane, then deregulation of
Yellowstone would not pose serious competitive problems in
Spokane. The capacity of ,chevron's Pasco-Spokane segment is 16
MBD. There is no public information on the current throughput
of this segment, 100/ although it did average 6 MBD during the
period 1968-1979. 101/ Therefore, it is probably safe to
assume that Chevron has 10 MBD excess capacity to Spokane. On
the other hand, Yellowstone's throughput out of Billings
averaged 48 MBD in 1983. 102/ The Department has not
determined how much of this throughput arrived at Spokane;
100/ According to Chevron's Form 6, Chevron received 10 MBD in refined product in tne State of Washington in 1983, presumably at Pasco. However, some of this product could have been shipped southbound to Adams, Oregon.
101/ Chevron EIA-184.
102/ Yellowstone Form 6.
-85-

Unofficial FERC-Generated PDF of 20050808-0259 Issued by FERC OSEC 08/08/2005 in Docket#: -
however, in June 1979, 52 percent of the total 57 MBD
Yellowstone throughput out of Billings arrived in
Spokane. 103/ If the same proportion held, Yellowstone
throughput to Spokane would have been 25 MBD in 1983. Only
40 percent of this throughput could be accommodated by the
estimated 10 MBD Chevron excess capacity to Spokane. Based on
this information, it is not clear that a deregulated
¥ellowstone will not exercise market power in 5pokane. The
Department, thus, considers Yellowstone a close call.
4. Badger: Chicago to Madison (Product)
Destination BEAs
088
090
Rockford, IL
Madison, WI
Adjusted HHI
3333
10000
Capacity
65
65
Badger is a joint venture of Area (34 percent), Cities
Service (32 percent), Union (12 percent), Marathon
(11 percent~. and Texaco (11 percent). Badger is a monopolist
in Madison and a triopolist (with Amoco and Williams) in
Rockford, Illinois. The competitive Chicago market is only 86
miles from Rockford, but 140 miles from Madison. Badger may
face competition in Madison from Williams and Amoco located
103/ Yellowstone EIA-184.
-86-

Unofficial FERC-Generated PDF of 20050808-0259 Issued by FERC OSEC 08/08/2005 in Docket#: -
both in Dubuque, Iowa (77 miles southwest), and in Rochelle,
Illinois (85 miles south). 104/ In addition, 77 miles east of
Madison is Milwaukee with its Lake Michigan water terminals and
West Shore pipeline. It is not clear how much competition there
is in Madison from these sources; thus, Badger is a close call.
5. West Shore: Chicago to Green Bay (Product)
Destination BEAs
089 Milwaukee. WI
094 Appelton-Green Bay
AdJUSted HHI
7921
6241
Capacity
192
66
The West Shore pipeline is a close call. West Shore runs
along Lake Michigan from Chicago through Milwaukee to Green Bay
and is the only products pipeline in the Milwaukee and Green
Bay BEAs. In 1983, deliveries out of West Shore averaged 173
MBD. 105/ West Shore may face competition in Milwaukee from
Badger in Madison (77 miles to the west) and from the
competitive Chicago market (87 miles to the south). West Shore
faces competition in the Appelton-Green Bay-oshkosh area from
Williams in Wausau and the private Koch line in Stevens Point,
104/ While Dubuque is located on the Mississippi it only receives 1 MBD in water shipments.
105/ West Shore Form 6.
-87-

Unofficial FERC-Generated PDF of 20050808-0259 Issued by FERC OSEC 08/08/2005 in Docket#: -
each 95 miles to the east. 106/ In a~dition, Milwaukee and
Green Bay are located on Lake Michigan. Water shipments to
Milwaukee are 10 MBD, or 11 percent of the 90 MBD local
consumption. Water shipments to the Appleton-Green Bay-oshkosh
BEA (94) are 11 MBD, or 21 percent of the 53 MBD local product
consumption. 107/ However. the Green Bay water data are
misleading, since most water shipments to the large SEA 94 are
to ports located on both coasts of the Upper Michigan
Peninsula, over 100 miles north of Green Bay. In 1979 the port
of Green Bay imported only 1 MBD of petroleum products. mostly
distillate. At the present time, a Green Bay marketer imports
into Green Bay 1 MaD of products (mostly distill.te) from
refineries at Sarnia, Ontario. According to this Green Bay
marketer contacted by the Department, the West Shore pipeline
would have to raise its tariff by 1.5¢ per gallon before
attracting significant competition from water transport at
Green Bay. Green Bay is closed to water traffic for 3-4 months
in the winter; however, the nearby ports of Manitowoc and Two
Rivers on Lake Michigan proper are apparently open year-round.
106/ According to a Green Bay jobber contacted by the Department, the Koch terminal at Junction City is sometimes the cheapest source of product. including transportation cost. in Green Bay.
107/ The EIA-184 indicates historic West Shore deliveries to Milwaukee and Green Bay of roughly 80 MBD and 40 MBD, respectively, which is consistent with the data used here.
-sa-

Unofficial FERC-Generated PDF of 20050808-0259 Issued by FERC OSEC 08/08/2005 in Docket#: -
6. Kaneb: Wichita to Jamestown, North Dakota (Product)
AdJUSted Destination BEAs HHI
102 Fort Dodge, lA 5000
103 Sioux City, lA 3333
140 Salina, KS 5000
142 Lincoln, NE 5000
144 Grand Island, NE 3333
147 Sioux Falls. so 3333
148 Aberdeen, SD 5000
149 Fargo, ND 3333
Capacity
17
51
72
72
25
16
16
Kaneb is an independent pipeline company. Its maintrunk
runs northward from the Wichita area to Jamestown. North
Dakota. It has three spurlines: to Phillipsburg, Kansas, to
North Platte, Nebraska, and to Milford, Iowa. In addition. it
has recently acquired the Champlin proprietary system. In
1983, Kaneb's receipts of gasoline and distillate in Kansas
averaged 90 MBD. 108/ The following table presents the
locations of Kaneb terminals plus the names and distances of
Kaneb's closest rivals.
108/ Kaneb Form 6. Note that this throughput exceeds the capacity indicated in Kaneb's EIA-184. Recent pipeltne maps indicate that Kaneb has added a 16-in. line alongside its maintrunk between Wichita and Geneva, Nebraska.
-89-
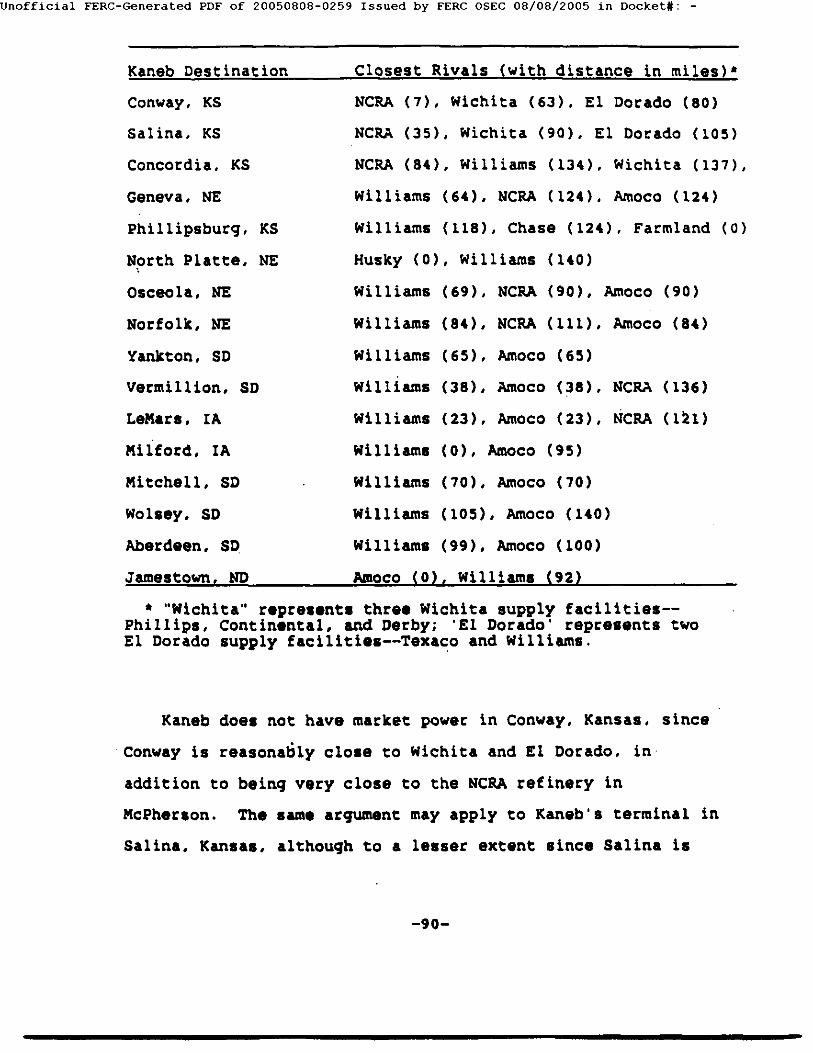
Unofficial FERC-Generated PDF of 20050808-0259 Issued by FERC OSEC 08/08/2005 in Docket#: -
Kaneb Destination
Conway, KS
Salina. KS
Concordia. KS
Geneva, NE
Phillipsburg, KS
N~rth Platte, NE
Osceola, NE
Norfolk, NE
Yankton, SD
Vermillion, SD
LeMars, IA
Milford, IA
Mitchell, SD
Wolsey, SD
Aberdeen, St)
Jamestown, ND
Closest Rivals (with distance in miles)•
NCRA (7), Wichita (63), ElDorado (80)
NCRA (35), Wichita (90), ElDorado (105)
NCRA (84), Williams (134), Wichita (137),
Williams (64), NCRA (124), Amoco (124)
Williams (118), Chase (124), Farmland (O)
Husky (0), Williams (140)
Williams (69), NCRA (90), Amoco (90)
Williams (84), NCRA (111), Amoco (84)
Williams (65), Amoco (65)
Williams (38), Amoco (38), NCRA (136)
Williams (23), Amoco (23), NCRA (121)
Williams (0), Amoco (95)
Williams (70), Amoco (70)
Williams (105), Amoco (140)
Williams (99), Amoco (100)
Amoco (0), Williams (92)
* "Wichita" represents three Wichita supply facilities-Phillips, Continental, and Derby; 'El Dorado' represents two El Dorado supply facilities--Texaco and Williams.
Kanab does not have market power in Conway, Kansas, since
Conway is reasonably close to Wichita and El Dorado, in
addition to being very close to the NCRA refinery in
McPherson. The same arqument may apply to Kanab's terminal in
Salina, Kansas, although to a lesser extent since Salina is
-90-

Unofficial FERC-Generated PDF of 20050808-0259 Issued by FERC OSEC 08/08/2005 in Docket#: -
_farther from alternative sources of product than is Conway.
However, north of Salina, Kaneb does not face a large number of
competitors. In its destinations in Iowa, South Dakota, and
North Dakota, Kaneb is at best a triopolist with the Amoco
proprietary system and Williams. In North Platte, Nebraska,
the Kaneb spurline has head-to-head competition from Husky's
Cheyenne line; the next closest rival is Williams, 140 miles to
the .. east. In Phillipsburg, Kansas, there is a Farmland
refinery that closed in 1982, but reopened in 1983. Other than
Farmland, Kaneb has no competition in Phillipsburg for over 100
miles.
The Department recommends that Williams remain regulated
due to its market power in Iowa and other places. If Williams
remains regulated, it may be safe to deregulate Kaneb. Whether
this is the case depends upon whether there is significant
excess capacity on Williams' west line. This excess capacity
cannot be computed from williams' Form 6 or any other public
information. In any event, even the existence of excess
capacity on Williams may not eliminate the need for regulation . .
of Kaneb, since most of Kaneb's destinations may not face
significant competition from Williams. Williams is located at
some distance from Kaneb maintrunk destinations north of
Salina, i.e., Conco;dia, Geneva, Osceola, Norfolk, Yankton,
Mitchell, Wolsey, Aberdeen, and Jamestown. By the same token,
Williams may not provide adequate competition to Kaneb spurline
-91-

Unofficial FERC-Generated PDF of 20050808-0259 Issued by FERC OSEC 08/08/2005 in Docket#: -
terminals at Phillipsburg and North Platte. 109/ In each of
the above eleven Kaneb destinations Williams' competition is at
best marginal due to its distance from Kaneb. At this time,
the Departmen: considers Kaneb a close call.
D. Selected Pipelines Recommended for Dere~ulation 110/
1. Capline: St. James, Louisiana to Patoka, Illinois (Crude)
Destination BEAs
107 St:. Louis, MO
AdJUSted HHI
4529
Capacity
1209
Capline can be deregulated without significant competitive
harm. Capline is a 660-mile crude pipeline between the
Louisiana Gulf Coast and Patoka, Illinois (in the St. Louis BEA
(107)). It has a throughput capacity of 1209 MBO, 111/ making
it the largest crude oil pipeline in the contiguous
r09/ In the Sioux Falls-Sioux City area. Williams clearly competes with Kaneb's spurline to Vermillion- LeMars-Milford.
110/ These lines were selected for discussion because a preliminary, structural screen indicated that a more detailed investigation was ~arranted.
111/ The capacity figure is based on EIA-184 submissions. Shell Pipeline. operator of Capline. states Capline's capacity to be 1260 MBD. See DOE Pipeline Study, supra note 60, text Tables XIII and xtv:
/
-92-
\
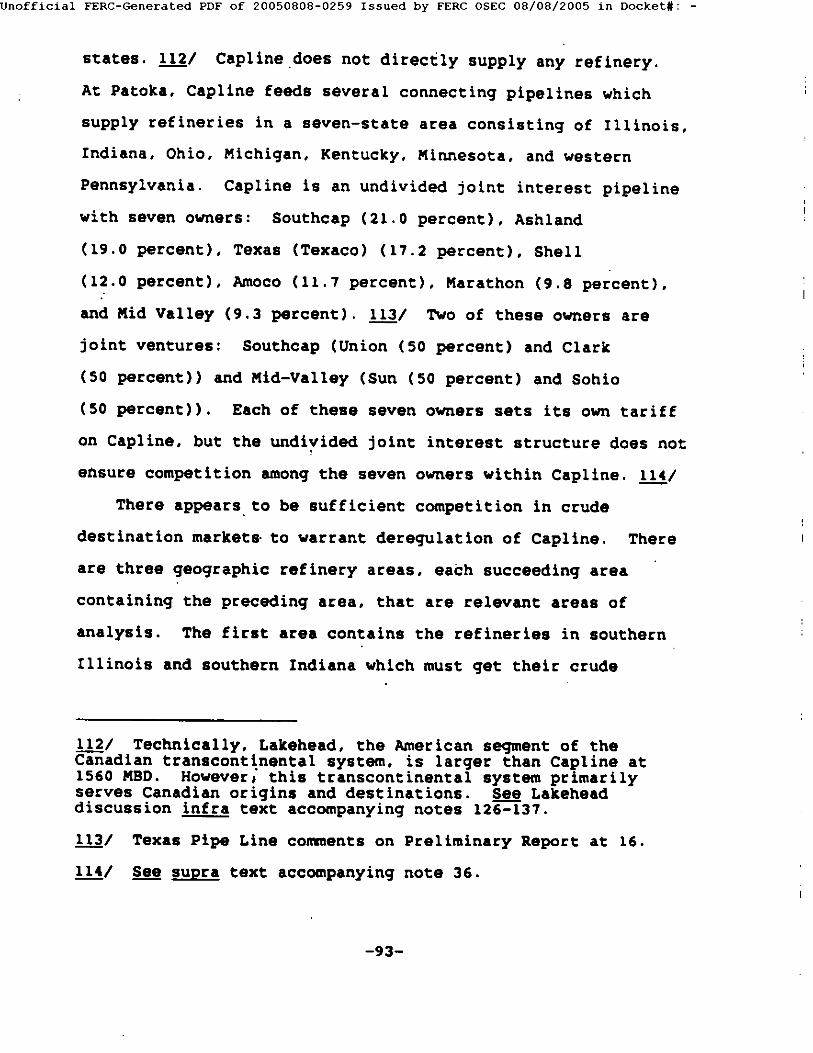
unofficial FERC-Generated PDF of 20050808-0259 Issued by FERC OSEC 08/08/2005 in Docket#: -
states. 112/ Capline_does not directly supply any refinery.
At Patoka, Capline feeds several connecting pipelines which
supply refineries in a seven-state area consisting of Illinois,
Indiana, Ohio, Michigan, Kentucky, Minnesota, and western
Pennsylvania. Capline is an undivided joint interest pipeline
with seven owners: Southcap (21.0 percent), Ashland
(19.0 percent), Texas (Texaco) (17.2 percent), Shell
(12.0 percent), Amoco (11.7 percent), Marathon (9.8 percent),
and Mid Valley (9.3 percent). 113/ Two of these owners are
joint ventures: Southcap (Union (SO percent) and Clark
(50 percent)) and Mid-Valley (Sun (50 percent) and Sohio
(50 percent)), Each of these seven owners sets its own tariff
on Capline, but the undivided joint interest structure does not
ensure competition among the seven owners within Capline. 114/
There appears. to be sufficient competition in crude
destination markets· to warrant deregulation of Capline. There
are three geographic refinery areas. each succeedinq area
containing the preceding area, that are relevant areas of
analysis. The first area contains the refineries in southern
Illinois and southern Indiana which must qet their crude
112/ Technically, Lakehead, the American segment of the Canadian transcontinental system, is larqer than Capline at 1560 MBD. Howeveri this transcontinental system primarily serves Canadian oriqins and destinations. See Lakehead discussion infra text accompanying notes 126-137.
113/ Texas Pipe Line comments on Preliminary Report at 16.
114/ See supra text accompanying note 36.
-93-
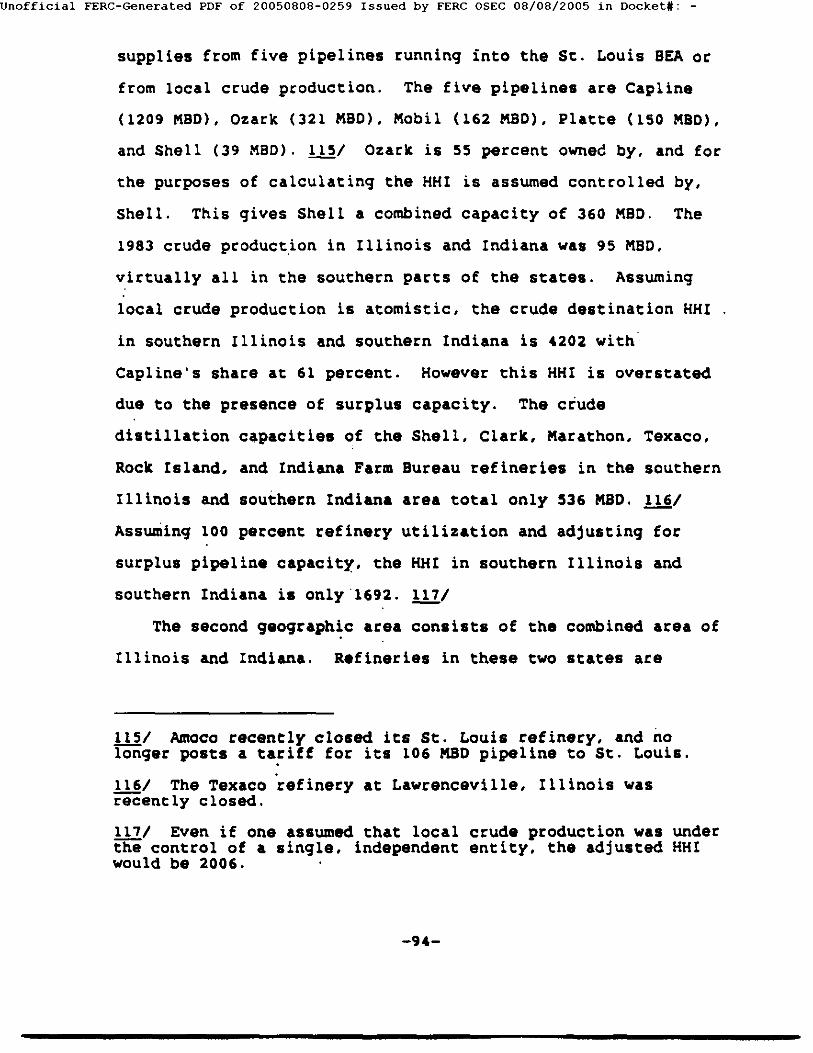
Unofficial FERC-Generated PDF of 20050808-0259 Issued by FERC OSEC 08/08/2005 in Docket#: -
supplies from five pipelines running into the St. Louis BEA or
from local crude production. The five pipelines are Capline
(1209 MBD), Ozark (321 MBD), Mobil (162 MBD), Platte (150 MBD),
and Shell (39 MBD). 115/ Ozark is 55 percent owned by, and for
the purposes of calculating the HHI is assumed controlled by,
Shell. This gives Shell a combined capacity of 360 MBD. The
1983 crude production in Illinois and Indiana was 95 MBD.
virtually all in the southern parts of the states. Assuming
local crude production is atomistic, the crude destination HHI
in southern Illinois and southern Indiana is 4202 with
Capline's share at 61 percent. However this HHI is overstated
due to the presence of surplus capacity. The crude
distillation capacities of the Shell, Clark, Marathon, Texaco,
Rock Island, and Indiana Farm Bureau refineries in the southern
Illinois and southern Indiana area total only 536 MBD. 116/
Assuming 100 percent refinery utilization and adjusting for
surplus pipeline capacity. the HHI in southern Illinois and
southern Indiana is only 1692. !!l/
The second geograph~c area consists of the combined area of
Illinois and Indiana. Refineries in these two states are
115/ Amoco recently closed its St. Louis refinery, and no longer posts a ta~iff for its 106 MBD pipeline to St. Louis.
116/ The Texaco refinery at Lawrenceville, Illinois was recently closed.
117/ Even if one assumed that local crude production was under the control of a single, independent entity, the adjusted HHI would be 2006.
-94-

Unofficial FERC-Generated PDF of 20050808-0259 Issued by FERC OSEC 08/08/2005 in Docket#: -
supplied either by lo~al crude production, by the five St.
Louis crude pipelines discussed above, or by three additional
pipelines into Chicago--the CUshing-Chicago System (296 MBD),
Amoco (260 MBD), and Lakehead (740 MBD). The unadjusted HHI
for the eight crude pipelines and the assumed atomistic 95 MBD
of local production is 2183, with Capline's share at
37 percent, but this figure is overstated due to surplus
capacity. The refineries in Illinois and Indiana include those
discussed above plus the Amoco, Mobil, Union. Clark, Gladieux,
and Laketon refineries in Chicago and northern Indiana. The
crude distillation capacities for all refineries in Illinois
and Indiana is 1327 MBD. The HHI adjusted for surplus
capacity, thus, is only 1238.
The final geographic region is the seven-state area of
Illinois, Indiana, Ohio, Michigan, Kentucky. Minnesota. and
western Pennsylvania. Refineries in the seven-state area are
supplied either by local crude production, the eight crude
pipelines previously discussed, or one additional crude
line--the 274 MBD Mid-Valley Line from Longview. Texas to Lima,
Ohio. Assuming the 259 MBD crude production in the eight-state
area is atomistic, the unadjusted crude destination HHI for the
area is 1756, with Capline's share at 39 percent. Total crude·
distillation capac~ty at refineries in the area is 2483 MBD;
adjusting for surplus capacity, the HHI is 1082.
In the markets for refined petroleum products, Capline and
the refineries it supplies also compete with product
-95-

Unofficial FERC-Generated PDF of 20050808-0259 Issued by FERC OSEC 08/08/2005 in Docket#: -
pipelines. 118/ There are five products pipelines running into
the St. Louis SEA--Explorer (290 MBD), Texas Eastern (300 MBD),
Phillips (105 MBD), Conoco (73 MBD), and Williams (36 MBD).
An important characteristic of Capline is the significant
vertical integration between owners of both Capline and
competing pipelines and refineries in the seven-state area.
Three-quarters of the 2500 MBD refinery capacity in the
e~ght-state area is owned by Capline parent companies. In
addition, Mobil, the largest refiner in the eight-state area
that is not an owner of Capline (180 MBD), has its own crude
pipeline to Chicago. Therefore. vertical integration between
crude pipelines and refineries in the Capline seven-state area
is significant, albeit not complete. This vertical integration
may provide a justification for the deregulation of Capline
even if it possessed market power. 11!/ If, for example,
Capline has market power in crude destination but not in
product destination markets due to competing products
pipelines, then vertical integration will reduce the likelihood
that a deregulated Capline will inefficiently decrease refinery
utilization. In conclusion. the Department believes that
Capline should be deregulated.
118/ But see supra note 30 and accompanying text.
119/ See discussion of vertically integrated joint venture pipelines supra text accompanying note 49.
-96-

Unofficial FERC-Generated PDF of 20050808-0259 Issued by FERC OSEC 08/08/2005 in Docket#: -
2. The Chevron and Amoco Crude Pipelines to Salt Lake City
Chevron has a 110 MBD crude pipeline from Rangely, Colorado
to Salt Lake City. Amoco has a 43 MBD crude pipeline from
Colorado and Wyoming into Salt Lake City. The Chevron and
Amoco pipelines appear to face adequate competition in crude
origin. The relevant crude origin market is a six-county area
in:Colorado, Utah, and Wyoming. This area produced 139 MBD in
1981. The individual county production figures are: Rio
Blanco, Colorado (44 MBD), Sweetwater, Wyoming (31 MBD), Uinta.
Wyoming (20 MBD), Duchesne, Utah (21 MBD), Uintah, Utah (12
MBD). and Summit, Utah (11 MBD.) 120/ In this six-county area
Chevron and Amoco face competition in crude origin from a third
crude pipeline, Frontier. and one refinery, seagull, in
Roosevelt, Utah. 121/ Furthermore, trucking to Salt Lake City
refineries appears to be feasible from Uinta. Duchesne, and
Summit counties.
The Chevron pipeline is.the largest participant in the
crude origin market and-can collect crude oil in Rio Blanco,
Uintah, and Duchesne Counties, including the Rangely, Red Wash,
120/ Crude production has increased in Summit County since 1981. In 1984, the East Anschutz Ranch field in Summit County by itself produced 29 MBD. Oil and Gas Journal. Jan. 28. 1985, at 116.
121/ A fourth crude pipeline out of the six-county area. the 12 MBD Wesco line out of Uintah County, appears to be idle currently. since the refinery it supplies. Gary Refining at Fruita, Colorado, is inactive.
-97-

Unofficial FERC-Generated PDF of 20050808-0259 Issued by FERC OSEC 08/08/2005 in Docket#: -
Altamont; and Bluebell fields. Chevron's 1983 receipts of
crude oil in Colorado and Utah averaged 75 MBD. 122/
Also collecting crude oil in the 6-county area is the Amoco
system. Amoco has a 17 MSD crude pipeline out of Rangely.
Colorado (Rio Blanco County) supplying its crude system in
Wyoming. This Wyoming system also features a 43 MBO Amoco
segment from Granger, Wyoming (Sweetwater County) to Salt ~ake
City. The Granger-Salt Lake City segment is also fed by a
6-in. Amoco segment from Pineview, Utah (Sillmlit County), and by
a 27 mile, 6-in. Phillips line from Bridger Lake, Utah (Sillmlit
County) to Amoco:• Bridger Station, Wyoming (Uinta County). In
sum. Amoco can collect crude in Rio Blanco. Sweetwater, Uinta,
and Slllmlit Counties.
A third crude pipeline out of this area is the new 16-in.
Frontier pipeline from Anschutz Station, Utah (Summit County)
to Casper, Wyoming. Frontier can collect crude in Summit and
Uinta Counties. including the recently discovered East Anschutz
Ranch and Painter Reservoir giant fields.
In addition to the three crude pipelines, there is one
refinery participating in the six-county crude origin market.
Seagull has a 7.5 MBO refinery in Roosevelt. Utah, on the
border of Duchesne and Uintah counties. Furthermore. on the
eastern edge of the six-county area is the 53 MBD Sinclair
refinery at Sinclair, Wyoming. Sinclair's refinery is fed by
122/ Chevron Form 6.
•
-98-

Unofficial FERC-Generated PDF of 20050808-0259 Issued by FERC OSEC 08/08/2005 in Docket#: -
its proprietary crude pipeline (formerly the Pasco pipeline)
that appears to be able to collect crude in Sweetwater County.
The crude destination market for the Chevron and Amoco
lines is Salt Lake City. In Salt Lake City there are five
refineries with total capacity of 148 MBD: Amoco (40 MBD),
Chevron (45 MBD), Crysen (13 MBD), Big West (25 MBD), and
Phillips (25 MBD). ~/ The Chevron and Amoco pipelines are
the only crude lines into Salt Lake City. For the purpose of '
including local crude production in the crude destination
market. the Salt Lake City BEA 165 is probably too large. It
does appear economically feasible. however. to truck crude oil
from producing fields in Uinta, Summit, and Duchesne counties
to Salt Lake. Crude pro~uction in these three counties
averaged 52 MBD in 1981. Furthermore, the Chevron and Amoco
pipeline-refineries face competition in product destination
from the 35 MBD Pioneer products pipeline from Sinclair.
Wyoming to Salt Lake City. In 1983, Pioneer receipts in the
Wyoming were 24 MBD. 124/
In summary, while it is a close call, it appears that
Chevron and Amoco face sufficient competition in~ude origin
and crude destination markets to warrant deregulation.
123/ Two additional Salt Lake City refineries are shut down--caribou-Four Corners and Morrison.
124/ Pioneer Form 6. Pioneer has one intermediate destination ~Rock Springs, Wyoming.
-99-

Unofficial FERC-Generated PDF of 20050808-0259 Issued by FERC OSEC 08/08/2005 in Docket#: -
3. Continental: Canadian Border to Billings, Montana (Crude)
Continental is a 106 MBD crude line running 577 miles
bet~een the Canadian border and Billings. Montana. According
to Continental's EIA-184, the historic throughput of the
Continental segment between the border and the Cut Bank,
Montana producing area has been 60-70 MBD. Most of this
throughput can be assumed to be Canadian crude delivered to
Continental via the Rangeland pipeline. In the Cut Bank
producing area (BEA 153) Continental historically increases its
throughput (to Billings) by 10 MBD. 125/
Continental participates in three markets: the Great Falls
crude origin market, the Great Falls crude destination market,
and the Billings crude destination market. In the five-county
producing area (Glacier, Toole, Pondera, Liberty, and Teton)
around Cut Bank (BEA 153), 1981 crude production was a modest
9.4 MSD. There Continental competes in crude origin with the
6.3 MaD Montana refinery in Great Falls and the 5.6 MBD Flying
J refinery in CUt Bank. While the HHI adjusted for surplus
capacity is 3333, the cost that could be imposed by the
exercise of market power over this modest local crude
production is almost certainly not of sufficient magnitude to
warrant the costs ~f regulation.
125/ Continental's EIA-184. The 1981 crude production for SEA ffi is 10 MaD.
-100-

Unofficial FERC-Generated PDF of 20050808-0259 Issued by FERC OSEC 08/08/2005 in Docket#: -
Continental does not have market power in crude destination
in the CUt Bank-Great Falls area. Assuming that the two local
refineries operate at full capacity (11.9 MBD), and assuming
competitive local production {9.4 MBD) in the five-county area,
the residual deliveries of Continental equal 2.5 MBD. yielding
an adjusted HHI of 441.
Continental {106 MBD) is the only pipeline into the
Billings crude destination market. Wesco and Belle Fourche
also transport crude into the vast Billings {SEA 155), but
these lines are 200 miles east of Billings. Exxon has a short
(69-mile) 58 MBD crude line to Billings that lies entirely
within the Billings crude destination market. The Billings
crude destination market has three refineries--Conoco (48.5
MBD), Exxon (42 MBD), and Cenex (33.7 MBD). Thus, the adjacent
refinery stage is somewhat concentrated. There is no other
source of refined product in Billings. In a nine-county area
within 100 miles of Billings (Big Horn, and Park in Wyoming and
Stillwater, Carbon, Musselshell, Yellowstone, Big Horn,
Rosebud, and Petroleum in Mon~ana) 1981 crude production was 93
MBD. Assuming that the three Billings refineries operated at
full capacity (124 MBD), and assuming competitive local crude
production, the residual deliveries of Continental equal 31
MBD, yielding an adjusted HHI of 625. Thus, Continental can be
deregulated.
-101-

Unofficial FERC-Generated PDF of 20050808-0259 Issued by FERC OSEC 08/08/2005 in Docket#: -
4. Lakehead: _Manitoba to Buffalo (Crude)
Lakehead is the American segment of a Canadian
transcontinental crude pipeline system running from Edmonton to
refineries in Montreal, Toronto and Sarnia, Ontario. The
system enters the United States at Pembina County, North Dakota
and runs to Superior, Wisconsin, with a capacity of 1560 MBD.
making it the largest crude pipeline in the contiguous states.
At superior, Lakehead splits into two routes--the south line
via Chicago (740 MBD) and the north line via the Michigan Upper
Peninsula (555 MBD). The two lines join as they re-enter
Canada at the Marysville, Michigan--Sarnia, Ontario border. At
Marysville, Lakehead can feed the Buckeye line to Toledo and
Detroit refineries. A spurline of the transcontinental system
re-enters the United States at Buffalo. The Lakehead (or u.s.)
portion of the spurline is 25 miles long and its capacity is
160 MBO. This spurline can feed the Kiantone pipeline to
United's refinery at. Warren. Pennsylvania.
Lakehead's off-take and on-take of crude oil in the United
States is modest relative t~ its large capacity. In 1983,
Lakehead's throughput entering the u.s. at Pembina. North
Dakota was 999 MBO. !1!/ Most of this throughput eventually
re-enters Canada. In 1983, Canadian exports to PADD II (the
~/ Lakehead Form 6.
-102-

Unofficial FERC-Generated PDF of 20050808-0259 Issued by FERC OSEC 08/08/2005 in Docket#: -
Midwest) were 207 MBD. 127/ Virtually all these exports can be
assumed to have been shipped via Lakehead. Furthermore, at
Clearbrook, Minnesota, Lakehead can accept Portal's deliveries
of North Dakota crude. These receipts averaged 35 MBD in
1983. At Chicago, Lakehead's south line can accept u.s. crude
and crude imported into the Gulf Coast; receipts were 16 MBD in
1983. Lakehead also can accept Michigan crude on either its
no~th or its south lines; receipts were 54 MBD in 1983. 128/
Lakehead is part of a transcontinental system that is primarily
Canadian; two-thirds of Lakehead's throughput originates in
western Canada and ~s delivered to refineries in eastern
Canada. 129/
Lakehead does not pose serious competitive problems in
crude destination markets. At Clearbrook, Minnesota, Lakehead
(together with Portal) feeds the Minnesota crude pipeline:
which in turn supplies the Minneapolis refining duopoly of Koch
and Ashland. 130/ Lakehead deliveries to the Minnesota
127/ u.s. Department of Energy, Petroleum Supply Annual 1983, at 39 (June 1984). Canada reduced its crude oil exports to the u.s. from 1109 MBD in 1973 to 274 MBD in 1983. Priority for Canadian crude went to u.s. refineries without alternative supplies. See DOE Pipeline Study. supra note 60, Appendix v.
128/ Lakehead Form 6.
~/ Lakehead comments on Prelimi~ary Report at 4.
130/ See also discussion of Minnesota pipelines infra text accompanying notes 138-142.
-103-

Unofficial FERC-Generated PDF of 20050808-0259 Issued by FERC OSEC 08/08/2005 in Docket#: -
pipeline averaged 121 MBD in 1983. 131/ The Minneapolis
refineries are also supplied from the south by the Wood River
line and by crude batching on the Williams product line. Thus.
with three pipe lines feeding two ;-efineries, the batt leneck
seems to lie in the refinery level.
After Clearbrook, Lakehead serves the 39 MBD Murphy
refinery located on Lake Superior at Superior, Wisconsin. 132/
Murphy is the only refinery in the Duluth BEA 95. Regulation of
such a bilateral situation is not necessary. In the absence of
regulation, bilateral negotiations between Lakehead and Murphy
should generate a tariff and throughput level that maximizes
their joint profit. The resulting throughput level would be
identical to the level that would obtain if Lakehead and Murphy
were vertically integrated. Regulation of Lakehead alone cannot
improve the competitive situation here, even if the Lakehead
Murphy joint entity possessed market power. · Lakehead's next
destination is the competitive Chicago market. The Lakehead
south line also delivers to Kalamazoo County (BEA 74). where
the small Lakeside (5.6 MBD) refinery operates. There is 10
MBD of local crude production in BEA H: the HHI adjusted for
surplus capacity is zero. In addition, Lakeside competes in
BEA 74 with the Wolverine, Amoco, and Total products lines.
131/ Minnesota Form 6.
132/ A 1979 Study by the National Petroleum Council indicates that Murphy has a crude oil water terminal at its· refinery. National Petroleum Council, Petroleum Storage and · Transportation Capacities. val. v. Water Transportation at C-14. Our water shipments data, however, does not indicate any crude oil shipmen•• into the Duluth-Superior· BEA 95.
·-104-

Unofficial FERC-Generated PDF of 20050808-0259 Issued by FERC OSEC 08/08/2005 in Docket#: -
Both the north and south lines of'Lakehead can supply two
central Michigan refineries (Total--40 MBD and Crystal--3 MBD)
via Total (Michigan-ohio) pipeline. Lakehead deliveries to
Total pipeline averaged only 12 MBD in 1983. 133/ In comparison,
there is 86 MBD of crude production in Michigan, most of it
within 100 miles of these central Michigan refineries. Due to
competition with local crude production, it is not likely that
Lakehead has market power at its central Michigan destinations.
At Marysville, in St. Clair County, Michigan (BEA 71) the
north and south lines combine and re-enter Canada. There ..
Lakehead supplies the 87 MBD Buckeye line to refineries in
Detroit and Toledo. Lakehead's deliveries to Buckeye were 55
MBD in 1983. 134/ The Lakehead-Buckeye route does not have
crude destination market power in Detroit since Marathon, the
sole Detroit refinery at 68.5 MBD, c·an be supplied by the 80
MBD Marathon pipeline. The Lima and Toledo BEAs probably
should be combined for crude destination. Lakehead-Buckeye
does not have crude destination market power in these BEAs
since it must compete with the Tecumseh (117 MBD), Marathon
(275 MBD-), Mid Valley (274 MBD), and Sohio (25 MBD) crude
lines, yielding an adjusted HHI of 2245.
Finally, Lakehead has a short. 25-mile segment in the
Buffalo area. This segment feeds the Kiantone crude line that
in turn supplies the refinery of Kiantone's parent,
133/ Total Form 6.
134/ Buckeye Form 6.
-105-

Unofficial FERC-Generated PDF of 20050808-0259 Issued by FERC OSEC 08/08/2005 in Docket#: -
United. !ll/ 1983 Lakehead deliveries to Kiantone were 31
MBD. 136/ Upon derequlation, bilateral negotiations between
Lakehead and United should generate a tariff that maximizes
joint profit. Deregulation would not have any effect other
than the redistribution of rent.
Lakehead participates in crude origin markets in Michigan;
Lakehead accepted 54 MBD of Michigan crude in 1983. There are
two distinct areas of crude origin in Michigan. The first is
south central Michigan, in particular, Hillsdale, Calhoun,
Ingham, and Eaton Counties in SEA 74. The entire crude
production of SEA 74 is only 10 MBD. Furthermore, including
Lakehead there' are' four competitors in BEA 74--the 6 MBD
Lakeside refinery in Kalamazoo, the 9 MBD Marathon·crude
pipeline from Hillsdale to Detroit. the 15 MSD Total
(Michigan-ohio) crude pipeline from Ingham to the Total and
Crystal refineries, and the 710 MBD Lakehead pipeline. The HHI
adjusted for surplus capacity for SEA 74 is 2500; thus, there
appears to be adequate competition in crude oil collection in
this area.
The more significant and potentially troublesome crude
origin market is north central Michigan, in particular Manistee
(19 MBD), Otseqo (18 MBD), Grand Traverse (11 MBD), Kalkaska (9
MBD), Crawford (4 MBD), and Missaukee (2.5 MBD) counties.
135/ See infra text accompanying note 145.
136/ Kiantone Form 6.
-106-

Unofficial FERC-Generated PDF of 20050808-0259 Issued by FERC OSEC 08/08/2005 in Docket#: -
These counties are on either side of the border of BEAs 72 and
73, which should be combined for this analysis. The combined
crude production for BEAs 72 and 73 is 76 MBD. There are three
competitors in the north-central-Michigan origin market.
First, Total has a 40 MBD refinery in Alma, Michigan. The
Total refinery is supplied by three of its own pipelines--a 1 19
MBD line running south from Missaukee county, a 25 MBD line
running west from the Lakehead terminal at Bay City, and a 15
MBD line running north from Ingham County in BEA 74.
The second competitor can be termed the Shell-Lakehead
lines. Shell has a pipeline running northeast through the most
productive counties (Manistee. Grand Traverse, Kalkaska.
Otsego) and then feeding Lakehead's north line at Lewiston
Station in Crawford County. Shell's throughput in 1983
averaged 51 MBD. 137/ The third competitor in the north
central Michigan crude origin market is the 4 MBD Crystal
refinery in Carson City. This refinery appears to be fed by
Total pipeline; however, truck shipments are a possible
alternative. The crude oil producing fields in northern
Michigan are located near the Lake Michigan ports of Manistee
and Traverse City, Michigan. However. crude oil is currently
not shipped out of these ports, and it is not clear to what
extent the ports are potential competitors in crude origin
markets.
137/ Shell Form 6.
-107-

Unofficial FERC-Generated PDF of 20050808-0259 Issued by FERC OSEC 08/08/2005 in Docket#: -
The adjusted HHI for this three-party crude origin market
is 4515; i.e. highly concentrated. Nonetheless. considerations
such as vertical integration, price discrimination, small
numbers bargaining, and bilateral exchange 138/ suggest that
:his concentration should not pose a problem. Thus. the
Department recommends the deregulation of Lakehead.
5. crude Pipelines to Minneapolis: Minnesota and Wood River
There are two refineries in Minneapolis--Ashland (67 MBD)
and Koch (137 MBD). These two refineries are supplied by two
crude pipelines~-the Minnesota pipeline (180 MBO) and the Wood
River pipeline (105 MBO). The Minnesota pipeline is a joint
venture of Koch and Ashiand and runs 256 miles from Clearbrook,
Minnesota to Minneapolis. It can be supplied at Clearbrook
either by Portal (from North Dakota) or Lakehead (from
Canada). In 1983, the Minnesota pipeline received 43 MBD from
Portal and 121 MBO from Lakehead for a total Minnesota
throughput of 164 MBO. 139/ The Wood River pipeline (105 MBO)
runs from the competitive St. Louis area to Minneapolis via
Bethany, Missouri. Wood River was originally a joint venture
of Koch and Williams, with Williams contributing its 18-in.,
106 MBO crude line from Mason City, Iowa to Minneapolis to the
138/ ~ supra text accompanying notes 48-53.
1111 Minnesota Form 6.
-108-

Unofficial FERC-Generated PDF of 20050808-0259 Issued by FERC OSEC 08/08/2005 in Docket#: -
joint venture. 140/ However, as of December 31, 1983, Koch
Industries assumed sole ownership of Wood River. Its 1983
throughput was only 11 MSD. 141/
In addition to Minnesota and Wood River, Williams also
posts a crude oil tariff to the Minneapolis area. Williams
crude shipments are apparently batched on Williams' product
system, since Williams does not report to FERC any crude lines
outside of Kansas. Any Williams crude shipments to Minneapolis
aremodest: total Williams crude shipments in 1983 averaged
only 12 MBD. 142/ While there are only 3 pipelines supplying
crude oil to Minneapolis, there are fewer refineries. The
bottleneck thus appears to be the refining level, and Minnesota
and Wood River should be peregulated.
6. North Dakota Crude Pipelines--Portal and Butte
Pipelines transporting crude oil out of the Williston Basin
in western North Dakota merit close examination. The crude
production region at issue is BEAs 151 and 152. The combined
crude production in these BEAs is 157 MBD. The major producing
counties are Billings (54 MBD), McKenzie (27 MBD), Williams (13
MBD), Bottineau (7 MBD), and Dunn (7 MBD) in North Dakota and
Richland (15 MBD), Sheridan (10 MBD), and Roosevelt (6 MBD) in
140/ Oil and Gas Journal, Sept. 1, 1980, at 44.
141/ Wood River Form 6 for year ending December 31, 1983.
142/ Williams Form 6.
-109-

Unofficial FERC-Generated PDF of 20050808-0259 Issued by FERC OSEC 08/08/2005 in Docket#: -
Montana. There are eight firms collecting crude in this area:
Portal, Amoco, Wesco. Belle Fourche. Continental, Northern
Rockies. Flying J, and Kenco. !!1/ However, Butte pipeline may
serve as a bottleneck for four of these pipelines.
Portal runs eastward from the Williston Basin to
Clearbrook, Minnesota and interconnects with the Lakehead and
Minnesota pipelines bound for Midwestern refineries. Portal is
qwned by Burlington Northern (50 percent) and Hunt Oil Company
(50 percent). In 1979, its main line capacity was 50 MBD, but
its average throughput in 1983 was 77 MBD, suggesting a recent
expansion. !!!/ Portal has origins in McKenzie, Williams.
Sheridan. Bottineau. and other counties. Portal appears to
have less competition in the eastern parts of the area such as
Bottineau County ..
Amoco has a 60 MBD pipeline system between Lignite, North
Dakota (Burke County) and Amoco's 56 MBD refinery at Mandan.
Amoco can collect crude in McKenzie, Williams, Dunn, and other
counties and deliver it either to Portal or to its Mandan
refinery. Amoco can also collect Billings County crude from
the short Okie (Koch) line.
Four other crude lines run from the Williston Basin to
Baker, Montana. At Baker these lines feed the Butte pipeline
to southeastern ~oming which in turn feeds the Platte and
!!11 The Kenco refinery is currently inactive ..
!!!/ Portal Form 6.
--110-

unofficial FERC-Generated PDF of 20050808-0259 Issued by FERC OSEC 08/08/2005 in Docket#: -
Amoco systems to St. Louis and Chicagd. Wesco, owned by Getty,
has a pipeline system to Baker with a mainline capacity of 34
MBO. Wesco can collect crude in Billings, McKenzie, Richland,
Roosevelt, and other counties. Belle Fourche, an independent
company, has a 19 MBD line from McKenzie County to Baker.
Belle Fourche has origins in Billings, McKenzie, and one other
county. Also, Continental and Northern Rockies post a tariff
from Billings County to Baker. In addition to these crude
pipelines, there are two other competitors in crude origin in
BEAs 151 and 152--the 5 MBD Flying J refinery in Williston,
North Dakota (Williams County), and the 5 MBD Kenco refinery in
Wolf Point, Montana (Roosevelt County).
At first glance, there appear to be sufficient
competitors--Portal, Amoco, Wesco, Belle Fourche, Continental,
Northern Rockies, Flying J, and Kenco--in the collection of
western North Dakota crude to prevent a competitive problem irt
crude origin markets. The Wesco, Belle Fourche, Continental,
and Northern Rockies pipelines, however, feed the Butte
pipeline system (51 percent owned by Shell) which runs .
southbound 300 miles from Baker, Montana to Fort
Laramie-Guernsey, Wyoming where it interconnects with the
Platte and Amoco lines to the Midwest. Thus, there are really
only five competitors for North Dakota crude--Portal, Amoco,
Butte, and the small Flying J and Kenco refineries. Wesco,
Continental, Northern Rockies. and the vertically-integrated
Amoco pipeline can be safely deregulated. The two remaining
-111-

Unofficial FERC-Generated PDF of 20050808-0259 Issued by FERC OSEC 08/08/2005 in Docket#: -
pipelines, Portal and Butte, are a closer call. Considerations
such as vertical integration. price discrimination, small
numbers bargaining, and bilateral exchange are probably
sufficient to warrant deregulation of both. !!}/
7. Kiantone: Buffalo to Warren, Pe~nsylvania (Crude)
Kiantone is a 48 MBD crude oil pipeline running from
.. Buffalo (BEA 10) to Warren. Pennsylvania (BEA 15). It is the
only crude pipeline out of SEA 10. Nevertheless. because crude
production in the entire State of New York is only 2 MBD,
Kiantone does not have the monopsony power in Buffalo required
to warrant its continued regulation. The throughput of
Kiantone is supplied via Lakehead.
In its destination Erie, Pennsylvania (BEA 15), Kiantone
supplies a 60 MBD refinery owned by its parent, United-Coral.
The only other refinery in the Erie BEA is the 15.7 MBD
Pennzoil refinery at Rouseville, 60 miles away from Kiantone · s
terminal at Warren. Pennzoil is supplied by its own crude
pipeline subsidiary in the area--the National Transit Company,
Due to Kiantone's vertical inte9ration, Kiantone can be safely
deregulated.
~I See supra text accompanying notes 48-53.
-112-

Unofficial FERC-Generated PDF of 20050808-0259 Issued by FERC OSEC 08/08/2005 in Docket#: -
8. Crude Pipelines into the LimaToledo-Detroit Area--Mid-Valley. Marathon, Tecumseh, Buckeye. Sohio
There are five crude pipelines running into the
Lima-Toledo-Detroit area. These are Mid-Valley, Marathon,
Tecumseh, Buckeye, and Sohio. Mid-Valley is a joint venture of
Sun (50 percent) and Sohio (50 percent). It owns a crude
pipeline running from Longview, Texas to Lima, Ohio, with a
throughput capacity into Lima of 274 MBD. This line also has
destinations in Cincinnati. Ohio and Lebanon Junction,
Kentucky. In 1983, the Mid-Valley route to Lima had receipts
in Texas, Louisiana, and Mississippi averaging 204 MBD. 146/
Marathon has a crude pipeline from the Capline terminus at '
Patoka, Illinois to Lima: 147/ This line has one intermediate
destination at Indianapolis. The capacity of this Marathon
line is 315 MBD to the Indianapolis area and 275 MBD to Lima.
Marathon also has pipeline interests between.Lima and Detroit.
Beginning at Lima and running northward through Toledo to
Samaria, Michigan is an undivided joint interest system called
the Maumee system. The Maumee system is operated by Mid-Valley
!!§/ Mid-Valley Form 6.
147/ Marathon owns an undivided interest in the Capline system.
-113-

Unofficial FERC-Generated PDF of 20050808-0259 Issued by FERC OSEC 08/08/2005 in Docket#: -
and owned by Mid-Valley and Marathon. !!!/ Its capacity to
Samaria is 278 MSD. From Samaria, Marathon has a 80 MBO crude
pipeline to its refinery in Detroit. 149/
The third crude pipeline into the Lima-Toledo-Detroit area
is the Tecumseh pipeline. Tecumseh is a 117 MBD pipeline from
the Chicago area to Cygnet, Ohio in the Toledo BEA. It is
owned by Arco (40 percent), Union (40 percent), and Ashland
(~0 percent). In 1983 Tecumseh receipts averaged 55 MBO. 150/
The fourth crude pipeline is Buckeye. Buckeye, a subsidiary of
the Pennsylvania Company, has an 87 MBD running southward from
the Lakehead terminal at Marysville, Michigan through Samaria,
Michigan to Toledo. In 1983 Buckeye's receipts on this line
averaged 55 MBD. 151/ Finally, the fifth crude line to the
Lima-Toledo-Detroit area is the 25 MBD Sohio line from Stoy in
southern Illinois to Lima.
Deregulation of these five crude pipelines does not raise
serious competitive concerns in crude destination in the
Lima-Toledo-Detroit area due to surplus capacity and the high
148/ According to an appendix in the DOE Pipeline Study, supra note 60, Maumee is owned 80 percent by Mid-Valley and 20 percent by Marathon. However, based on capacity shares reported in EIA-184, the breakdown is 74.1 percent Mid-Valley. 25.9 percent Marathon .
. 149/ This Samaria-Detroit line is also fed by a 9 MBD Intrastate Marathon line from the producing fields in southern Michigan.
150/ Tecumseh Form 6.
151/ Buckeye Form 6.
-114-

Unofficial FERC-Generated PDF of 20050808-0259 Issued by FERC OSEC 08/08/2005 in Docket#: -
degree of vertical integration. Refineries in the Lima
Toledo-Detroit area consist of Sohio at Lima (168 MBD), Sohio
at To:edo (120 MBD), Sun at Toledo (118 MBD), and Marathon at
Detroit (68.5 MBD). To this should be added the Ashland
re:inery at Canton (66 ~BD), which is supplied in part from an
Ashland pipeline from Lima. The combined refinery capacity of
these five refineries is 541 MBD. compared to the combined
throughput capacity of the pipeline of 778 MSD. The HHI
adjusted for surplus capacity is 2406. Furthermore, there is a
high degree of vertical integration between the pipelines and
the refineries. The Marathon, Sun, and Sohio refineries are
vertically integrated into crude pipelines. Ashland has
alternatives of Marathon, Mid-Valley, and Sohio in Lima. plus
25 MBD of local crude production in BEA 66.
Mid-Valley, Marathon, and Tecumseh have intermediate
destinations outside the Lima-Toledo-Detroit area which have
fewer pipeline alternatives. Mid-Valley supplies the 44 MBD
Chevron refinery at Cleves. Ohio near Cincinnati. Cincinnati
is on the Ohio River, but available data indicate only
negligible water shipments of crude to Cincinnati. A similar
situation pertains to Marathon and Tecumseh. Marathon is the
sole supplier to the 43 MBD Rock Island refinery in
Indianapolis. while Tecumseh is the sole supplier to two small
refiners in northecn Indiana--the 19 MSD Gladieux refinery in
Fort Wayne and the 8 MBD Laketon refinery in Laketon.
-115-

Unofficial FERC-Generated PDF of 20050808-0259 Issued by FERC OSEC 08/08/2005 in Docket#: -
Indiana. ill/ In each of these cases of a single ~ :line
supplying a single ·refinery, regulation is unnecessary. In the
absence of regulation. bilateral negotiations between the refine~y
and the pipeline should generate a tariff and throughput level
that maximizes joint profit. Regulation of the pipeline alone
cannot improve the competitive situation, even if the pipeline-
refinery combination possessed market power. Furthermore, in
each case it is unlikely that any crude destination market powe~
would extend to product destination since product destination
markets in Indiana and Ohio are reasonably competitive. In
conclusion, the five pipelines can be deregulated.
9. Plantation Pipeline: Baton Rouge to Washington (Product)
Adjusted Destination SEAs HHI
021)- Washington, DC 4621
021 Roanoke, VA 5000
022 Richmond, VA 4661
028 Greensboro·, NC 5000
029 Charlotte, NC 5000
031 Greenville-Spartanburg, sc 5000
036 Atlanta, GA 4860
037 Columbus, GA 5000
038 Macon, GA 5000
~I Gladieux recently shut down.
-116-
caeacity
115
35
115
559
559
559
559
28
26

Unofficial FERC-Generated PDF of 20050808-0259 Issued by FERC OSEC 08/08/2005 in Docket#: -
048 Montgomery. AL 10000 35
049 Birmingham. ~L 4558 559
051 Chattanooga, TN 5000 42
053 Knoxville. TN 5000 42
112 Jackson, MS 1008 559
Plantation is a joint venture of subsidiaries of Exxon
(48.8 percent). Chevron (27.1 percent), and Shell
(~4.0 percent). Plantation's trunkline runs closly parallel to
that of Colonial between Baton Rouge and Washington, D.C. In
1983, Plantation receipts in Louisiana and Mississippi averaged
431 MBD. 153/ This represents 77 percent of Plantation's
maintrunk capacity of 559 MBD. ~long most of its route,
Plantation serves as a virtual duopoly with Colonial. which the
Department recommends remain regulated.
Plantation can be safely deregulated given continued
regulation of Colonial and excess capacity on Colonial. In
1983, all of Plantation's maintrunk throughput could have been
accommodated on Colonial's maintrunk. Colonial's effective
mainline capacity as of December 31, 1983 was 2100 MBD, 154/
while its 1983 receipts in Texas, Louisiana, and Mississippi
we~e 1590 MBD. 155/ Assuming Colonial remains a regulated
153/ Plantation Form 6.
154/ Colonial Pipeline Co .• Colonial Pipeline Company Performance and Trends 1983, at 20.
155/ Colonial Form 6.
-117-
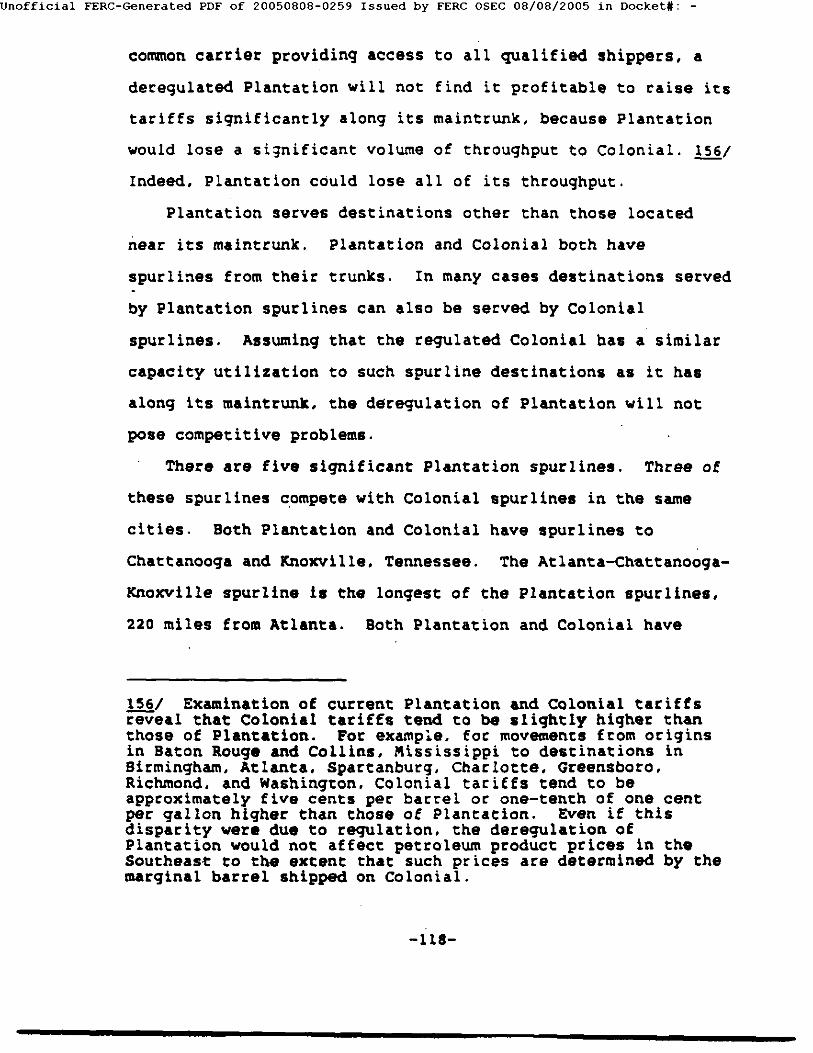
Unofficial FERC-Generated PDF of 20050808-0259 Issued by FERC OSEC 08/08/2005 in Docket#: -
common carrier providinq access to all qualified shippers, a
deregulated Plantation will not find it profitable to raise its
tariffs significantly along its maintrunk, because Plantation
would lose a si;nificant volume of throughput to Colonial. 156/
Indeed, Plantation could lose all of its throughput.
Plantation serves destinations other than those located
near its maintrunk. Plantation and Colonial both have
spurlines from their trunks. In many cases destinations served
by Plantation spurlines can also be served by Colonial
spurlines. Assuming that the requlated Colonial has a similar
capacity utilization to such spurline destinations as it has
along its maintrunk, the derequlation of Plantation will not
pose competitive problems.
There are five significant Plantation spurlines. Three of
these spurlines c.ompete with Colonial spurlines in the same
cities. Both Plantation and Colonial have spurlines to
Chattanooga and Knoxville, Tennessee. The Atlanta-ch~ttanooqa
Knoxville spurline is the longest of the Plantation spurlines,
220 miles from Atlanta. Both Plantation and Colonial have
156/ Examination of current Plantation and Colonial tariffs reveal that Colonial tariffs tend to be slightly higher than those of Plantation. For example. for movements from origins in Baton Rouge and Collins. Mississippi to destinations in Birmingham, Atlanta. Spartanburg, Charlotte, Greensboro. Richmond, and Washington. Colonial tariffs tend to be approximately five cents per barrel or one-tenth of one cent per gallon higher than those of Plantation. Even if this disparity were due to requlation. the deregulation of Plantation would not affect petroleum product prices in the Southeast to tbe extent that such prices are determined by the marginal barrel shipped on Colonial.
-118-

Unofficial FERC-Generated PDF of 20050808-0259 Issued by FERC OSEC 08/08/2005 in Docket#: -
spurlines to Macon, Georgia, 82 miles south of the trunklines
at Atlanta. Both Plantation and Colonial have spurlines to
Roanoke, Virginia, although via different routes. Roanoke is
around 100 ~iles north of the Colonial and Plantation
maintrunks at Greensboro. North Carolina.
The two remaining Plantation spurlines do not have
head-to-head competition with Colonial. The first such
Plantation spurline is to Montgomery, Alabama. Except for an
~nsignificant volume of water shipments, the 35 MBD Plantation
spurline is the only supply facility in the Montgomery SEA
(0,8). However. Montgomery is only 91 miles south of
Colonial's maintrunk at Birmingham.
The final Plantation spurline destination is Columbus.
Georgia, 108 miles south of Colonial's maintrunk at Atlanta.
At Columbus, Plantation faces competition from Colonial's
Atlanta-Macon-Americus spurline. Columbus is only 63 miles
northwest of Americus and 96 miles west of Macon. Assuming
that the regulated Colonial's Atlanta-Macon-Americus spurline
has a capacity utilizati~n rate similar to that of its main
trunk, a deregulated Plantation will not be able to profitably
raise market price at Columbus.
In conclusion, given continued regulation of Colonial.
the deregulation of Plantation will not allow it to exercise
market power in tr~kline cities such as Birmingham, Atlanta,
Spartanburg, Charlotte, Greensboro. Richmond, and Washington.
The reason for this is that the parallel Colonial system has
sufficient excess capacity to make any Plantation tariff
-119-
Unofficial FERC-Generated PDF of 20050808-0259 Issued by FERC OSEC 08/08/2005 in Docket#: -
increase unprofitable. Indeed Colonial's excess capacity could
accommodate the entire throughput of Plantation. The same is
probably true in Plantation spurline cities such as Chattanooga.
Knoxville. Macon, Roanoke, Montgomery, and Columbus, assuming
that Colonial's spurline utilization rates are similar to that
of its maintrunk. Thus the Department considers Plantation a
candidate for deregulation.
10. Ashland: Lima. Ohio to Canton, Ohio (Crude)
Ashland has a 70 MBD crude oil pipeline running from Lima,
Ohio (BEA 69) to Canton, Ohio (BEA 65). It is the only crude
pipeline into BEA 65. The Ashland pipeline supplies only one
refinery, however, its parent's refinery at Canton. Thus.
regulation is not necessary.
11. Ashland and Owensboro-Ashland: Patoka, Illinois. to Catlettsburg. Kentucky (Crude)
Ashland owns a 219 MBO pipeline from the Capline terminus
in Patoka, IL to Ashland's refinery in Catlettsburg, Kentucky
in the Huntington, West Virginia BEA (059). Within the State
of Kentucky, this line is owned by Owensboro-Ashland, a
subsidiary of Ashland Pipe Line. The Ashland and OWensboro
Ashland line has ? sources of throughput--connecting trunklines
at Patoka, including the Capline system, 157/ a connection with
!111 Ashland has an undivided joint interest in Capline.
-120-

Unofficial FERC-Generated PDF of 20050808-0259 Issued by FERC OSEC 08/08/2005 in Docket#: -
Mid-Valley pipeline at Lebanon Junction. Kentucky (Bullitt
county), and local crude production in southeastern Illinois,
southwestern Indiana, and northwestern Kentucky. In 1983, the
line had an average throughput of 155 MBD. ~58/
The Ash!and and Owensboro-Ashland line does not raise
serious competitive concerns in crude origin. Most of the
C~\lde product ion in the states of Illinois. Indiana, and
Kentucky is in a 100-mile square, 21-county area, 159/ which
contains the following giant fields: Clay City, Lawrence,
Louden. Main, New Harmony, and Salem. In 1981 the are~·s
production was 73 MBD. In this crude producing area. Ashland
competes with 7 entities: the 21 MBD Indiana Farm Bureau
refinery at Mt. Vernon. Indiana and supplying pipelines; the 2~
MBD Sohio crude pipeline to Lima, Ohio and gathering lines; the
120 MBD Marathon refinery at Robinson. Illinois and the 315 !o!BD
Marathon pipeline to Indianapolis and Lima. and gathering lines;
the 54 MBD Texaco refinery at Lawrenceville, Illinois and its
subsidiary's gathering lines; !§Q/ the 161 MBD Mobil (formerly
Texaco-Cities service) line from Patoka to Chicago; the 490 MBD
Chicap line from Patoka to Ch~cago; and the Capwood System crude
line feeding the St. Louis refineries of Shell and.Clark.
158/ Owensboro-Ashland Form 6.
153/ The counties .. are Fayette. Marion, Jefferson. Franklin, Effingham, Clay, Wayne, Hamilton. Jasper, Richland, Edwards, White, Gallatin, Crawford, Lawrence, and Wabash in Illinois; Gibson and Posey in Indiana; and Union and Henderson in Kentucky.
160/ The Texaco refinery at Lawrenceville has recently closed.
-121-

Unofficial FERC-Generated PDF of 20050808-0259 Issued by FERC OSEC 08/08/2005 in Docket#: -
Deregulation of the Ashland and OWensboro-Ashland line
would not reduce economic welfare at its destination markets as
well. The line's only destination is Ashland's refinery at
Catlettsbu=g. 161/ While the Ashland pipeline is the only
c=ude pipeline into the Huntington, West Virginia BEA (059),
the Ashland refinery is the only refinery in the SEA. Even if
Ashland possesses product destination market power in the
Huntington, West Virginia BEA 59, 162/ regulation of the
Ashland and OWensboro-Ashland crude pipeline would not
accomplish much, since the refinery could always extract any
monopoly profits. Thus, the Department recommends the
deregulation of owensboro-Ashland and the Ashland route between
?atoka and owensboro, Kentucky.
12. Exxon: Jay, Florida to Mobile, Alabama (Crude)
Exxon owns a 155 MBD crude pipeline from the Jay giant
field in Florida to Mobile, Alabama. Exxon's receipts in the
State of Florida in 1983 were 51 MBD. 163/ This Exxon pipeline
does not have market po~er at crude destination since Mobile is
a Gul~ Coast port that imports crude oil.
!!!/ Ashland's refinery at Louisville is now idle.
162/ Ashland faces some competition from Ohio River traffic.
163/ Exxon Form 6. This may be a lower bound estimate of this l1ne's throughput, since it may be able to collect crude in Alabama.
-122-

Unofficial FERC-Generated PDF of 20050808-0259 Issued by FERC OSEC 08/08/2005 in Docket#: -
A deregulated Exxon could also not raise serious
competitive concerns at crude origin. Exxon collects crude oi~
f~om two counties--Escambia. Alabama and Santa Rosa, Florida.
The crude production in these counties in 1981 was 16 MSO in
Escarr~ia and 85 ~30 in Santa Rosa. According to P=ofessor
Mitchell, there is some degree of vertical integration in the
crude origin market. The Jay field is unitized, with Exxcn
holding a 36 percent share of the field. 164/ However.
vertical integration is not complete, particularly when one
considers that there are other producing fields in Santa Rosa
County. For example. the Blackjack Creek Field produced 16 MBD
in 1981. 165/ Nevertheless, a deregulated Exxon will probably
not exercise monopsony power. Jay is only 47 miles north of
the port of Pensacola, which exports a small amount of crude.
Jay is also only 73 miles by truck to Mobile refineries (the
Exxon pipeline is 65 miles long). Competition from. trucks
appears likely. The Department, thus. recommends that this
Exxon line be deregulated.
164/ Mitchell, supra note 21, at 77.
165/ Data supplied by the Department of Natural Resources of the State of Florida.
-123-
Unofficial FERC-Generated PDF of 20050808-0259 Issued by FERC OSEC 08/08/2005 in Docket#: -
13. Crude Pipelines in the State of Kansas
This section discusses the following crude pipelines
operating in the State of Kansas: Osage, Jayhawk, Kaw, Amoco,
Wesco, and Ge:ty. !§!/
Osage is a joint venture of Getty (50 percent), NCRA
(20 percent), Mobil (15 percent), and Pester (15 percent).
Osage is a 280 MBD crude pipeline running 136 miles from
Cushing, Oklahoma to ElDorado, Kansas (near Wichita). In
1983, its throughput was 72 MBD. 1§1/
Jayhawk is a joint venture of Derby (50 percent) and NCRA
(50 percent). J.ayhawk has two main feeder segments. One
beqins with feeder lines in southwestern Kansas and the
Oklahoma Panhandle and then becomes a 165-mile, 42 MBD line
from Meade, Kansas to Chase, Kansas. The other is a 75-mile,
36 MBD line from Laton (Osborne County) in north central Kansas
to Chase. From Chase, where the two feeder segments merge. a
35-mile, 86 MBD maint.runk runs to McPherson, the location of
the NCRA refinery. Finally, a 43 MBD segment runs frgm
McPherson, to Valley Center (Wichita), the site of the Derby
refinery. In 1983, Jayhawk's receipts of crude oil averaged 88
MBD, 168/ slightly more than the reported 86 MBD capacity of
the main segment between Chase and McPherson.
166/ Getty was recently acquired by Texaco.
167/ Osage Form 6.
!§!/ Jayhawk Form 6.
-124-

Unofficial FERC-Generated PDF of 20050808-0259 Issued by FERC OSEC 08/08/2005 in Docket#: -
Xaw is a joint ventura of Texaco (33.3 percent), Cities
Service (33.3 percent), and Phillips (33.3 percent). Kaw runs
from Norton County in northwestern Kansas to Chase and Lyon
(Rice County) in central Kansas. Ka~ collects crude in Norton.
Phillips, Rooks, Treqo. Ellis. Russell. Ells~orth, Ness, Rush,
Barton, and Rice Counties in Kansas. Kaw does not file its
tariffs with FERC but does file with the State of Kansas.
~aw's throughput capacity eventually reaches 86 MBD at Chase.
In 1983 Kaw·s receipts of crude oil averaged 51 MBD. 169/ At
Chase, Kaw feeds either the 50 MBD Mobil crude line to
refineries in Wichita and El Dorado. or the 14 MBD Continental
crude line to Wichita and Ponca City. Oklahoma. ·
Amoco has a crude trunkline running west to east across
northern Kansas. part of a system that runs from Wyoming and
Colorado to Chicago. Amoco can collect crude in Rawlins.
Decatur, Osborne, Ottawa, and Wabaunsee Counties in Kansas
along this line. Amoco's capacity on its Laton,
Kansas--Freeman, Missouri segment is 142 MBD. In 1983, Amoco's
receipts of Kansas crude averaged 29 MBO 170/; but some of this
may have been production in southeastern Kansas transported on
a separate Amoco segment between Drumright, Oklahoma and
Freeman, Missouri.
:
169/ Kaw Form 6.
170/ Amoco Form 6.
-125-

Unofficial FERC-Generated PDF of 20050808-0259 Issued by FERC OSEC 08/08/2005 in Docket#: -
Wesco has a crud41 oil pipeline fr'om Cushing, Oklahoma to El
Dorado. Kansas. Wesco is a subsidiary of Getty, ~hich operates
a refinery in El Dorado. The capacity of the Wesco line is
25 1'!30.
Getty Pipeline appears to ha•te an extensive system to
collect crude oil in central Kansas. On its E!A-184 and its
Form 6, Getty merely reports a lO-in. line from Valley Center
(Wichita) to El Dorado, Kansas, the site of a Getty refinery.
According to its EIA-184, the capacity of this seqment is
20 KBD. However, pipeline mapa indicate an extensive Getty
feeder system that can collect crude in Ness, Hodqeman, Rush,
Pawnee. Edwards. Kiowa, Russell. Barton, Stafford, Pratt,
Barber, Ellsworth, Rice, .Reno, Kinqman, Harper, Harvey,
Sedgwick, Butler, cowley, and Greenwood Counties in central
Kansas. According to Getty's Form 6, Getty received 42 MBD of
Kansas crude oil, none from connecting carriers. Since crude
production in Sedgwick (Wichita) county (the origin of Getty's
reported ·10-in. line) is less than 2 MBD, Getty still operates
the extensive feeder system. In addition, it appears that
Getty has purchased an undivided interest in the former
Texaco-Cities Service 25 MBD segment from El Dorado, Kansas to
Sheldon, Missouri. Thus, Getty can now feed the Chicaqo-bound
Amoco and Cushin~Chicaqo systems at Humboldt, Kansas (Allen
County).
In the crude destination mar~et there are 4
competitors--osage (280 MBD). Getty-Wesco <•s MBDL Jayhavk (86
KBD) and Kav (86 MBD). These lines feed 4 Wichita-area
-126-

Unofficial FERC-Generated PDF of 20050808-0259 Issued by FERC OSEC 08/08/2005 in Docket#: -
refiners--Getty (81 MBD). NCRA (54 MBD), Pester (33 MBD), and
Derby (29 MBD). Assuming these refineries operate at full
capacity. the crude destination HHI adjusted for surplus
capacity is 2501. Any truck transportation of crude oil to
these refineries will drive the adjusted HHI below 2500.
Furthermore. there is a significant degree of vertical
integration between the crude pipelines and the refineries
which will lessen any market power exercised by the deregulated
crude pipelines at the expense of the refineries. Finally, any
crude destination market power by the crude pipelines will not
extend to product destination due to competition from product
pipelines serving Wichita such as Williams (132 MBD), Phillips
(140 MBD), and Continental (28 MBD). Williams has been
recommended for continued regulation, and its capacity to
Wichita is significantly greater than the estimated 49 MBD
product consumption in the Wichita BEA (139).
In the crude origin market in northern and central Kansas.
the major producing counties are Rice (5 MBD), Stafford
(6 MBD), Barton (11 MBD), Russell (12 MBD), Ellis (14 MBD),
Rooks (8 MBD), Phillips (3 MBD), Ness (6 MBO), Trego (4 MBO),
and Graham (6 MBD). In this area Kaw, Jayhawk, Getty. and
Amoco compete. These lines face either actual or potential
competition from the 26 MBD Farmland refinery and feeder lines .
at Phillipsburg, ~ansas (Phillips County). This refinery has
closed and re-opened in recent years. In crude origin activity
in southwest Kansas and the Oklahoma ~anhandle. Jayhawk faces
competition from Shamrock, Mobil-?hillips, and Wesco lines
-127-

Unofficial FERC-Generated PDF of 20050808-0259 Issued by FERC OSEC 08/08/2005 in Docket#: -
running southbound.
In conclusion. the Department recommends the deregulation
of Osage, Jayha~k. and the Wesco line from Cushing to Wichita.
~n addition .. ~ceo's crude pipeline in the State of Kansas does
not by itself warrant FERC regulation. The crude collection
activity by Kaw and Getty is intrastate.
14. Buckeye: Northeast and Midwest (Product)
Adjusted Destination SEAs HHI ca12acity
008 Syracuse-Utica, NY 2948 195
009 Rochester, NY 3333 58
Oll Binghamton-Elmira. NY 2500 195
013 Sc::anton-Wi lkes Barre, PA 2500 195
016 Pittsburgh, PA 961 101
017 Harrisburg-York-Lancaster. PA 2042 86
018 Philadelphia. PA 674 321
064 Youngstown-Warren, OH 1667 47
065 Cleveland, OH 1738 197
066 Columbus, OK 2355 40
069 Lima, OH 2000 108
070 Toledo, OH 1667 167
071 Detroit, MI 2000 121
-128-

Unofficial FERC-Generated PDF of 20050808-0259 Issued by FERC OSEC 08/08/2005 in Docket#: -
072 Sagin.;·•-Bay City, MI 3328 45
076 :ort Wa~l'ne. !N 5000 69
077 l<;,komo-Marion, Hl 3333 46
079 . ~ . .. . .::-..lanapo<lS. IN 1429 43
The Buckeye System, a subsidiary of the Pennsylvania
Company, is recommended for deregulation. Buckeye consists of
an extensive network of interconnected segments east of the
Mississippi River and north of the Ohio River. Four of these
segments serve destination BEAs where the adjusted HHI exceeds
2500. One such segment is the 195 MBD line from New York to
Wilkes-Barre. Binghamton. Syracuse. and Rochester. Upper New
York State is served by 4 pipelines out of the New York and
Philadelphia refinery areas--Buckeye (195 MBD), Atlantic (43
MBO). Mobil (28 MBD), and Sun (16 MBD). 171/ Th.ere·are also 2
small lube refineries in the Buffalo BEA--Witco and Quaker
State. There is only a little water traffic directly into the
Syracuse, Rochester. Binghamton. and Buffalo BEAs.
The adjusted HHis in BEAs in upper New York state are
somewhat high. Combining the Syracuse. Rochester. Binghamton,
and Buffalo BEAs into a single region, the HHI adjusted for
171/ The only BEAs that all four pipelines currently serve are Wilkes-Barre and Binghamton. Atlantic is not in Syracuse. but is 97 miles away at Rochester. Sun is not in Rochester. but is 97 miles away at Syracuse. Buckeye is not in Buffalo, but is 75 miles away at Rochester.
-129-

Unofficial FERC-Generated PDF of 20050808-0259 Issued by FERC OSEC 08/08/2005 in Docket#: -
surplus capacity is 2962. However, in the Buffalo-Rochester
area. Buckeye competes with sources of Canadian product such as
terminals on the Sun-Sarnia and Trans-Northern pipelines at
Hamilton, Ontario and Toronto-area refineries such as Gulf
Canada, Petro-Canada, and Texaco Canada. Buckeye indicated
that 7.3 MBD of Canadian product is imported into Buffalo and
Ro·chester, which would constitute 7. 2 percent of local
demand. 1111 A Buckeye shipper confirmed that truck shipments .
of Canadian product compete in Rochester. Furthermore, Buckeye
faces competition at Utica from 106 MBD in water shipments to
Albany (95 miles from Utica). 173/
In the SaginaW-Bay City BEA, 18 percent of local consumption
is supplied by water shipments that could expand if the local
duopoly of Buckeye and Total attempted to raise price. Buckeye
may face additional competition at·saginaw from Wolverine,
Amoco, Marathon, and Sun in Detroit (95 miles south) and
Imperial, Shell Canada, and Sun in Sarnia, Ontario (102 miles
east).
172/ Buckeye comments on Preliminary Report, Exhibit c. 173/ Water shipments into the Albany BEA are over two times BEA consumption, suggesting truck shipments from Albany to adjacent BEAs. ST Services owns terminals in both the Albany and Utica areas. According to ST Services, water shipments via Albany have been cheaper than iipeline shipments via Buckeye for the past three years in Ut ca. ST Services explained that for tankers originating at Caribbean refineries. the marginal cost of sailing up the Hudson to Albany is low.
-130-

Unofficial FERC-Generated PDF of 20050808-0259 Issued by FERC OSEC 08/08/2005 in Docket#: -
Buckeye supplies two SEAs in Indiana with hiqh adjusted
HHis. but it faces competition from nearby facilities in other
BEAs. In the Kokomo-Marion BEA, Buckeye forms a triopoly with
the Indiana Farm proprietary line and the Laketon asphalt
plant. But only 53 miles south of Kokomo is Indianapolis, wit~
additional competitors such as Texas Eastern, Marathon, Shell,
Amoco. and Rock Island.
In the Fort Wayne BEA, Buckeye forms a duopoly with Area;
~owever, 65 miles east of Fort Wayne is Sohio and Marathon at
Lima, Ohio. Furthermore, seventy-five miles north of Fort
Wayne are the Amoco and Wolverine terminals in southern
Michigan. In addition. the Indiana Farm proprietary pipeline
at Peru is 60 miles southeast of Fort Wayne.
-131-

Unofficial FERC-Generated PDF of 20050808-0259 Issued by FERC OSEC 08/08/2005 in Docket#: -
172
15. olympic: Northwest Washington to Portland (Product)
Destination BEAs
Portland, OR
Adjusted HHI
3712
Capacity
Olympic is a joint venture pipeline owned by Shell
(43.5 percent), Mobil (29.5 percent), and Texaco
(27.0 percent). Olympic runs along the Pacific Northwest Coast·
from the Anacortes-Ferndale refinery area (BEA 171) to Seattle
(still BEA 171) and Portland (BEA 172). The distance to seattle
is 150 miles and to Portland 300 miles. The throughput capacity
of Olympic is 220 MBD to, Seattle-Tacoma and 144 MBD to Portland.
In the Seattle-Tacoma area, Olympic competes with three small
refineries--chevron (5.5 MBD), Crysen (11.1 MBD), and US Oil
(21.4 MBD)--plus water shipments of 22 MBD. 174/ The HHI
adjusted for surplus capacity into the Seattle metropolitan
area (not shown in the table because the pipeline route is
wholly within BEA 171) is about 3900. If Olympic attempted to
raise price in Seattle, water shipments. particularly those of
foreign imports, could take away Olympic's market share. In
any event, Olympic does not file tariffs at FERC for Seattle
and other Washington destinations, but instead files them at •
the Washington Public Service Commission, which will continue
to regulate Olympic movements to Seattle.
174/ Chevron is an asphalt plant.
-132-

Unofficial FERC-Generated PDF of 20050808-0259 Issued by FERC OSEC 08/08/2005 in Docket#: -
The competitive situation for Ol~pic in Portland is
similar to that in seattle. Olympic competes in the Portland
BEA with the 15 MBD Chevron refinery 175/ and 35 MSD of water
shipments. The HHI adjusted for surplus capacity is 3712 to
Portland. However, if Olympic attempted to raise price in
Portland, increased water shipments, particularly from Canada,
China, and other foreign countries, could substantially reduce
Olympic's market share, making such a price increase unpro-
Htable for Olympic. Thus, Olympic should be deregulated.
16. Wolverine: Chicago to Detroit (Product)
Adjusted Destination BEAs HHI Capacity
070 Toledo, OH 1429 52
071 Detroit, MI 2000 172
073 Grand Rapids, MI 3530 25
074 Lansing, MI 2800 172
075 South Bend, IN 2500 252
Wolverine is a joint ven~ure of seven owners. 11!/ It runs
eastward out of Chicago toward Detroit. From the South Bend
175/ The Chevron refinery has a significant capacity for producing asphalt.-· and thus may not produce significant volumes of pipelineable product.
176/ Mobil (30 percent), Union (28 percent). Texaco (Ii percent), Clark (9.5 percent), Cities Service (9.5 percent), Marathon (5.0 percent), and Shell (~.o percent).
-133-

Unofficial FERC-Generated PDF of 20050808-0259 Issued by FERC OSEC 08/08/2005 in Docket#: -
SEA, a 25 MBO Wolverine spur line runs alonq the shore of Lake
Michigan to the Grand Rapids BEA. In the Detroit BEA, the 172
MBD main trunk splits into two lines--a 52 MBD spur line to
Toledo a~d a 120 MBD line to the Detroit metropolitan area.
In the Detroit and Toledo BEAs, Wolverine participates in
competitive product destination markets. In the Grand Rapids
BEA, Wolverine, Marathon, and Crystal supply sources.
Furthermore. 11 percent of Grand Rapids' consumption is
supplied by water, including some shipments to the Great Lakes
port of Muskegon, 39 miles from Grand Rapids. The Wolverine
terminal itself is 31 miles from the city of Grand Rapids;
thus, Wolverine does not have a large locational advantage in
Grand Rapids over Buckeye and Total, each 75 miles away in an
adjacent BEA.
In the Lansing-Kalamazoo BEA 74, Wolverine, the Amoco
proprietary line. the Total proprietary line, and the Lakeside
refinery are local suppliers. Wolverine also faces competition
in Lansinq from Buckeye at Owosso, located 29 miles northeast
of Lansing in the adjacent BEA 72. Wolverine may face
additional competition in Lansing from Marathon and Sun at
Detroit (84 miles east). In Kalamazoo, Wolverine also faces
competition from Marathon at Niles. located 57 miles southwest
of Kalamazoo in the adjacent SEA 75. Finally, in the South
Bend SEA. there are four supply sources--Wolverine. Marathon,
Amoco, and Arco. Furthermore. the competitive Chicago market
is only 80 miles to the west. The Department recommends that
Wolverine be deregulated.
-134-

Unofficial FERC-Generated PDF of 20050808-0259 Issued by FERC OSEC 08/08/2005 in Docket#: -
17. Phillips: Amarillo to Chicago (?roduct)
.;dj us ted Destination SEAs HHI Caoacity
083 Chicago. IL 989 47
085 Springfield, IL 3333 47
105 Kansas City, MO 2500 140
106 Columbia, MO 3037 105
107 St. Louis, MO 1092 105
137 Oklahoma City. OK 909 140
139 Wichita. KS 1250 140
Phillips, Williams, and Shell are suppliers to the
Springfield, Illinois BEA. Since the Phillips terminal is 40
miles east of Springfield at Forsyth, Phillips does not have a
large locational advantage in Springfield ave~ Marathon at
Champaign, 86 miles east of Springfield in the adjacent SEA
84. Furthermore, Explorer pipeline, with a station at Decatur
but no current tariff, is a potential competitor in
Spring~ield. Finally, the port of Peoria is 73 miles north of
Springfield.
In Kansas City. Phillips competes with Williams, Amoco, and
Arco. - . In the Columbia, Missouri SEA. Phillips, Area, and
Williams are suppliers. The Phillips terminal is 33 miles
south of Columbia at Jefferson City. Phillips faces
competition at Columbia and Jefferson City from Continental at
-13'5-

Unofficial FERC-Generated PDF of 20050808-0259 Issued by FERC OSEC 08/08/2005 in Docket#: -
Belle, 75 miles from Columbia (42 miles from Jefferson City) in
the adjacent BEA 107. In any event. the Department recommends
that Williams remain requlated.
A concentrated product origin market in which Phillips
participates is Amarillo. However, the potential monopsony
problem in Amarillo is alleviated by vertical integration.
There are two refiners in Amarillo--Phillips (9~ MBD), and
Diamond Shamrock (71.1 MBO). There are four pipelines out of
Amarillo--the 140 MBO Phillips line at issue, the 37 MBD
Borger-Denver line. an undivided joint interest line of
Phillips (81.1 percent) and Diamond Shamrock (18.9 percent), a
13 MBD Diamond Shamrock line. and the 14 MBD ATA system, an
undivided joint interest line of three equal owners (Phillips,
Diamond Shamrock, and Texaco). The remaining 13 percent of the
Amarillo origin market is local product consumption. The
Department. thus. recommends that Phillips be deregulated.
18. Explorer: Lake Charles, Louisiana-Houston to Chicago {Product)
Adjusted Destination BEAI ~I
083 Chicago, IL 989
107 St. Louis, MO 1092
122 Houston. TX 467
125 Dallas. TX 1000
138 Tulsa, OK 2500
-136-
Ca&acit~
290
290
380
380
380

Unofficial FERC-Generated PDF of 20050808-0259 Issued by FERC OSEC 08/08/2005 in Docket#: -
Explorer is a 1226-mile-lonq, joint venture, product
pipeline running from the Lake Charles, Louisiana refinery area
to Houston, Dallas, Tulsa. St. Louis, and Chicago. 1221 The
throughput capacity of Explorer between Houston and Tulsa is
380 MBD; nor~~ of Tulsa the capacity is 290 MBD. Explorer ca~
be deregulated without significant competitive harm.
The two major northern destination markets of Explorer,
Chicago and St. Louis are reasonably deconcentrated. For the
Tulsa product destination market, Explorer has at least three
rivals (Conoco, Sinclair, and Sun). The HHI adjusted for
surplus capacity in Tulsa is 2500. In addition, Tulsa is near
the competitive.Oklahoma City BEA (137). Finally, Explorer
supplies the Dallas product destination market. The NPC Study
indicates the following product pipelines serve Dallas:
American Petrofina (ll MBD), ~reo (44 MBO), Exxon (23 MBD),
Gulf (38 MBD), Shamrock (13 MBO), Texas (53 MBD), and Utilities
(10 MBD). 178/ Adding Explorer plus 2 local refineries--Amber
(20 MBD) and Liquid Energy (10 MBD)--yield a total of 10 firms,
which could satisfy the Dallas-Fort Worth demand in roughly
equal parts, yielding an adjusted HHI of 1000. Explorer also
does not have market power at its origins. Explorer's origin
177/ Explorer's eight owners are Shell (26.0 percent), Gulf (16.7 percent), Texaco (16.0 percent), Marathon (12.9 percent), Sun (9.4 percent), Conoco (7.7 percent), Cities Service (6.8 percent), and Phillips (4.5 percent).
178/ NPC Study, supra note 61, D-7, F-16.
-137-

Unofficial FERC-Generated PDF of 20050808-0259 Issued by FERC OSEC 08/08/2005 in Docket#: -
markets are concentrated due to the dominance of Colonial
pipeline, ~hich has shares of 92 percent in Lake Charles,
67 percent in Beaumont, and 62 percent in Houston. Thus,
Explorer can be deregulated.
19. Atlantic: Philadelphia to Buffalo (Product)
AdJUSted Destination SEAs HHI Capacity
009 Rochester. NY 3333 43
010 Buffalo, NY 4186 31
011 Binqhamton, NY 2500 43
013 Scranton-Wilkes Barre, PA 2500 15
014 Williams~rt 1 PA 10000 43
Atlantic, formerly ARCO; (43 MBD) is the second larqest of
four products pipelines runninq from the Ne~ York and
Philadelphia refineries to upper New York State. 179/ In the
Buffalo SEA, the suppliers are Atlantic, Mobil, and the small
lube refineries of Witco and Quaker State. Ho~ever, Atlantic
also faces competition in Buffalo from Buckeye at Rochester (75
miles east), United at Warren, PA (110 miles south), t~ Canadian
179/ see the discussion of Buckeye, supra text accompanying notes 171-173.
-138-

Unofficial FERC-Generated PDF of 20050808-0259 Issued by FERC OSEC 08/08/2005 in Docket#: -
product pipelines at Hamilton, Ontario (60 miles ~est), and
three Toronto-area refineries. Atlantic's service to
Williamsport is intrastate, and Atlantic does not file a tariff
at FERC for this service. The Department recommends
de~egulation of the Atlantic line.
20. The Chevron and ATA Products System to Albuquerque (Product)
Albuquerque, New Mexico is supplied by 2 products
pipelines, Chevron and ATA. Chevron is a 22 MBD pipeline from
El Paso, Texas to Albuquerque. Its 1983 throughput appears to
have been 21.5 MBD. 180/ Chevron has a 76 MBD refinery at i~s
pipeline's origin at El Paso. However .• the Chevron pipeline
cannot be considered a "plant facility" serving its El Paso
refinery, since there are other potential shippers on the
Chevron line. Texaco has a 17 MBD refinery at El Paso. 181/
Furthermore, Navajo, a southeastern New Mexico refiner, can
ship product to El Paso via the Navajo/Midland-Lea line, while
Shell can ship product to El Paso via its proprietary line from
its Odessa, .Texas refinery.
The ATA Product System runs from Amarillo. Texas, through
Tucumcari, New Mexico, to Albuquerque. The throughput capacity
of the ATA system is 18 MBD to Tucumcari and 13 MBD to
180/ Chevron Form 6.
181/ Texaco has recently announced the sale of this refinery to El Paso Refinery, Inc.
-139-

Unofficial FERC-Generated PDF of 20050808-0259 Issued by FERC OSEC 08/08/2005 in Docket#: -
Albuquerque. ATA is an undivided joint interest pipeline.
owned in 3 equal parts by subsidiaries of Diamond Shamrock,
Phillips. and Texaco. Its operator is West Emerald, a pipeline
subsidiary of Diamond Shamrock. Diamond Shamrock's interest in
ATA had 1983 deliveries of 5.4 MBD, 182/ while Texaco's
interest had deliveries of 3.3 MBD. 183/ Each owner of the
undivided joint interest ATA system sets its own tariff f~om
Amarillo to Albuquerque. 184/ The Department does not believe
that individual owners compete significantly within an
undivided joint interest pipeline. 185/ However. there is a
very high degree of vertical integration between the ATA system
and its upstream suppliers, .the Texas Panhandle refineries of
Phillips, Diamond Shamrock. and Texaco, which are the only
apparent potential sources of throughput for the ATA
system. 186/ Thus. the ATA system may be an example of a
vertically integrated joint venture in which regulation has
little effect. 187/
182/ West Emerald Form 6.
183/ Texas Form 6.
184/ For example. for movements between Amarillo and Albuquerque, West Emerald's FERC Tariff No. 9 is 60.5 cents per barrel, Texas' FERC Tariff No. 1748 is 64.0 cents per bar~el. while Phillips' F~RC Tariff No. 430 is 55.0 per barrel.
185/ See supra text accompanying note 36.
186/ The Texaco refinery recently shut down.
187/ ~supra text accompanying note 49.
-140-

Unofficial FERC-Generated PDF of 20050808-0259 Issued by FERC OSEC 08/08/2005 in Docket#: -
Chevron and ATA face competition in Albuquerque from two
refineries in northwest New Mexico. Giant has a refinery in
Ciniza. New Mexico, 120 miles west of Albuquerque. Bloomfield
operates a refinery in Bloomfield, New Mexico, 167 miles
~ort~west of Albuquerque. These two refineries are located in
sparsely populated areas, and truck some of their output to
A~buquerque, the nearest major city. Thus. the Chevron and ATA
:ines can be deregulated.
21. Texas-New Mexico (Crude)
The Texas-New Mexico pipeline originates in the Four
Corners area at Aneth. Utah and runs to West Texas and
Houston. It is a joint venture of Texaco (45 percent), ARCO
(35 percent), Cities Service (10 percent). and Getty
(10 percent). Its ·throughput capacity out of the Four Corners
area is 42 MBD. In 1983, the on-take of Texas-New Mexico in
the Four Corners area was at least 36 MBD; 16 MBD from the West
Coast via Four Corners pipeline and 20 MBD of Utah
production. 188/
The only possible competitive concern posed by the
~exas-New Mexico pipeline is in crude origin in the Four
corners area, where the 42 MBD Texas-New Mexico pipeline
competes with two northwest New Mexico refineries--the 18 MBD
Giant refinery, and the 14 MBD Bloomfield refinery. In 1981,
188/ Texas-New Mexico Form 6.
-141-

Unofficial FERC-Generated PDF of 20050808-0259 Issued by FERC OSEC 08/08/2005 in Docket#: -
the local etude production of the counties of San Juan, Utah;
San Juan. Rio Arriba, McKinley, and Sandoval, New Mexico; and
Montezuma, Colorado was •2 MBD. 189/ The HHI adjusted for
surplus capacity for the Four Corners crude origin market is
3333. There have been a number of refinery closings in recent
years in the Four Corners area; however, it is not clear to
what extent these closed refineries offer potential competition
in the crude origin market. Nevertheless. consideration of -such factors as vertical integration. price discrimination.
small-numbers bargaining, and bilateral exchange warrant
deregulation of Texas-New Mexico. 190/
'
189/ Texas-New Mexico has no origin market power over West Coast crudes.
190/ see supra text accompanying notes •a-53.
-1·2-

Unofficial FERC-Generated PDF of 20050808-0259 Issued by FERC OSEC 08/08/2005 in Docket#: -
VII. DEREGULATION OF NEW OIL PIPELINES
The Department recommends that no newly built oil pipeline
be federally regulated because regulation is not needed in
order to preven~ economically inefficient behavior by new oil
pipelines. Before a new crude or product pipeline is con
structed, there will be a large number of firms that could
build the pipeline, and they can be relied upon to behave
C?mpetitively. If appropriate contracts with the prospective
shippers and/or end users can be entered into before the
pipeline is built, then the existence of numerous potential
pipeline builders will be sufficient to yield competitive,
socially optimal results. Moreover, even if appropriate
contracts could not be entered into, there are separate and
distinct reasons why neither crude nor product pipelines are
likely to require regulation. On the contrary. the regulation
of new oil pipelines could produce inefficient. socially
undesirable investment and pricing decisions. For these
reasons. it is socially preferable not to regulate new oil
pipelines.
Prospective regulation of future new crude and product
pipelines raises a number of issues in addition to those
considered in changing the regulatory status of existing
pipelines. There are two apparently opposing economic concerns ~
that seem relevant. The first is that regulation could inhibit
investment in new crude and product pipelines. The second is
that regulation could be necessary in order to avoid monopoly
-143-

Unofficial FERC-Generated PDF of 20050808-0259 Issued by FERC OSEC 08/08/2005 in Docket#: -
and/or monopsony pricing by a new pipeline or, even worse, to
avoid monopoly and/or monopsony pricing combined with full
dissipation of all monopoly profits. These two apparently
opposing concerns can be largely reconciled, however, if a
clear distinction is maintained between competitive conditions
before and after a pipeline is built.
It appears reasonable to assume that before the pipeline is
built ("ex ante") there will be a large number of potential
builders of the pipeline, so that competitive behavior can be
expected. After the pipeline is built ("ex post"). however.
sellers at the origin and buyers at the destination would
confront a single pipeline owner. Nevertheless,· if contracts
can bridge the ex ante and ex post situations. then the
existence of a large number of potential pipeline builders
ex ante will be sufficient to produce procompetitive, socially
optimal ex post results. Thus. any regulatory intervention
that is expected to constrain ex post results may distort the
ex ante decisions away from the economically efficient
solution.
With this distinction in mind, consider the first
concern--that regulation could inhibit investment in new
pipelines. Suppose a firm is considering building a new
product pipeline. At the time the firm must commit itself to
such an investment. there may be substantial uncertainty as to
the amount of product that shippers will wish to ship·on the
line, the price that can be charged for transporting that
product, and perhaps the cost of building the pipeline. The
-144-
Unofficial FERC-Generated PDF of 20050808-0259 Issued by FERC OSEC 08/08/2005 in Docket#: -
firm will, thus. face a probability distribution of rates of
return on the investment. Suppose that the expected value for
the rate of return on the pipeline is the competitive rate of
return. say ten percent. It is estimated. however. that the~e
is a one chance in three of a zero percent rate of retarn. a
one chance in three of a ten percent rate of return. and a one
chance in three of a twenty perc~nt rate of return. In the
absence of regulation, a risk-neutral investor will proceed to
~uild the pipeline. Suppose, however, that the pipeline is
regulated to a maximum of a ten percent rate of return on the
grounds that this is the "competitive" rate of return. The
ex ante expected value for the rate of return is now only six
and two-thirds percent, i.e., a one-third probability of zero
percent and a two-thirds probability of a ten percent rate of
return. It will no longer be profitable for an independent
pipeline company to build the pipeline.
This analysis leads to the proposition that any regulation
should at least be limited to those cases where the ex ante
expected value for the rate of return. absent regulation. is
great~r than or equal to the··competitive rate of return
(adjusted for risk), and that. in such cases, the regulator
should seek to set an ex post maximum rate of return that
produces an ex ante competitive rate of return.
To illustrate; revise the previous example by assuming
instead that our investor estimates a twenty-five percent
probability of a zero percent rate of return, a twenty-five
percent probability of a ten percent rate of return. and a
-145-

Unofficial FERC-Generated PDF of 20050808-0259 Issued by FERC OSEC 08/08/2005 in Docket#: -
fifty percent proba~ility of a twenty percent rate of return.
The ex ante expected value of the rate of return is, therefore.
twelve and one-half percent. The ex ante expected value of the
rate of return could be reduced to ten percent if it were k~own
that, once built. the pipeline would be regulated to ear~ a
maximum of a fifteen percent rate of 'return. As a practi·cal
matter, however. determining ex ante this ex post maximum rate
of return would not be an easy task for regulators since a •
different maximum rate of return must be set for each pipeline
before the pipeline is built in order to obtain a competitive
ex ante return in each unique building situation. Moreover,
the entire probability distribution of possible rates of return
must be known. On the one hand, if the ex post regulatec rate
leads to an ex ante expected rate less than the competitive
rate, then pipelines that are socially desirable will not be
built. 191/ On the other hand, if the ex post regulated rate
is too high, the ex ante expected value of the rate of return
will be too high and there is likely to be resource-wasting
competition to obtain supracompetitive returns.
Now turn to the concern that regulation may be necessary in
order to prevent monopoly pricing by a new pipeline or, even
worse, monopoly pricing combined with wasteful dissipation of
the monopoly profi~s. Suppose that, once built, a pipeline
191/ To the extent that the regulated rate of return deviates rn-either direction from the optimal. an incentive is created for vertical integration because vertical integration' serves to circumvent suboptimal rates.
-146-

Unofficial FERC-Generated PDF of 20050808-0259 Issued by FERC OSEC 08/08/2005 in Docket#: -
would have monopsony power with respect to purchases of crude
or product and/or monopoly power in sales of crude to refiners
or product to consumers. Assume that this natural monopoly
monopsony would be sufficiently profitable. absent regulation,
to generate an ex ante expected value for the rate of return
considerably above the competitive level. Assume also that
there are a large number of potential builders of this pipeline
(i.e .. ex ante competitive conditions). Once construction of
the first pipeline is well under way, however, it will not be
profitable for any other investor to commence building a second
pipeline. Since any monopoly profits are captured by the first
mover. potential builders would compete to be the first mover.
and this competition may be highly wasteful. Since·the present
value of the monopoly-monopsony profits would be positive if
the pipeline were built at the cost-minimizing time, potential
investors likely would compete to be the first to commence
construction. Competition to become the first mover could lead
to the pipeline being built sufficiently (and wastefully) early
so that the ex ante e~ted value for the rate of return on the
investment would fall to the'·competitive rate of return. This
would result in the worst of all possible worlds--monopoly pric
ing combined with full dissipation of the monopoly profits. 192/
192/ This result surpasses the negative social welfare effects of the more orthodox monopoly-monopsony result by the extent of real resources used up in competing for the monopoly-monopsony profits. ·
-147-
Unofficial FERC-Generated PDF of 20050808-0259 Issued by FERC OSEC 08/08/2005 in Docket#: -
In principle, this problem can be solved by imposing a
regulatory constraint on the rate of return. Using the pre
vious example, as the regulator lowers the ex post maxi~um
allowed ra~e ~f return toward fifteen percent, ~he ex ante
expected value for the rate of return falls toward the ten
percent competitive level, and beginning construction time
will move forward toward the efficient construction time. A
~egulatory solution, however, is not necessary if transactions
costs are not sufficiently high to prevent a contractural
solution.
In the absence of high transaction costs, any investor may
be able to seize the first-mover advantage simply by entering
into long-term contracts.with potential users of the pipeline.
Alternatively, potential users may form a joint venture to
construct and operate the pipeline. Competition will, thus,
take the form of lower long-term contract prices (or lower
transfer prices in a joint venture) rather than wastefully
premature construction. Regulation will not be necessary,
since the availability of contracts or of vertical integration
allows the ex ante competitive conditions to produce an ex post
competitive result, even though natural monopoly conditions
appear to be present ex post.
The contractu4l or joint-venture solutions c~early work best
when the numbe: of potential users of the pipeline is small and
their identity is known ahead of time. Product pipelines.
however, may have a large number of shippers, and the identity
of some of the shippers on new crude pipelines may not be known
-148-

Unofficial FERC-Generated PDF of 20050808-0259 Issued by FERC OSEC 08/08/2005 in Docket#: -
by the time construction of the pipeline begins. For both new
crude and product pipelines, however. there are sound reasons
for concluding that regulation still is not necessary.
Conside~ first the case of new crude pipelines. and assume
a major crude discove~y by one or more oil companies that
together have leases on only part of the total area where
finding oil is now likely and that would be served by a new
pipeline. Through contracts with an independent pipeline cr by
setting up a joint-venture pipeline, these companies might be
able to monopsonize any new entrants that subsequently discover
and produce oil in the area. Knowinq that they would be sub
jected to monopsonistic pricinq for use of the pipeline. new
entrants would bid less for lease riqhts. The companies makinq
a major new discovery. thus, could extract monopsony profits in
any one of three ways: by neqotiatinq ex ante with an
independent pipeline operator for low contract rates that are
subsidized by the amount of monopsony profits that that
operator can expect to earn by imposinq hiqh tariff rates on
later-arrivinq producers: by constructinq a joint-venture
pipeline and then charqinq hiqh tariff rates for oil shipped by
later producers: or simply by lowerinq their bids on newly
leased areas.
Ignorinq ex ante behavior. there would appear to be ' insufficient incentive to explore and develop additional tracts
in the area. a reduction in output from such tracts, and a
wealth transfer from owners of other oil riqhts in the area to
the companies that first discovered oil in the area and now
-149-

Unofficial FERC-Generated PDF of 20050808-0259 Issued by FERC OSEC 08/08/2005 in Docket#: -
control the pipeline. This concern, however, is subject to the
same ex ante/ex post critique discussed above. Ex ante. the
first entrants into oil exploration in an area would know that,
in the absence of regulation, they could expect monopsony pro
fits from their control over the pipeline. In effect, they
would receive not only the value of any discoveries on tracts
they have already leased, but would also be able to appropriate
part of the value of discoveries on tracts that will be served
by the pipeline but that are not currently under lease to
them. If there is competition ex ante to discover new fields,
this competition will force the ex ante expected value for the
rate of return on exploration (including anticipated pipeline
monopsony profits) to the.sa first entrants down to competitive
levels.
The ex post natural monopsony characteristic of crude pipe
lines arguably could lead to excessive investment in the discovery
of riew fields and insuffipiant investment in their development.
The privata incentive to discover new major crude fields, how
ever, is less than would. be socially optimal because of an
informational externality endemic to oil exploration. 193/ The
193/ See Miller, "Some Implications of Land OWnership Patterns for Petroleum Policy," 49 Land Economics 414 (1973); Paterson. "Two Externalitie-. in Petroleum Exploration," in Studies in Ener~ Tax Policy 323 (G. Brannon ed. 1975) Stiglitz; "The Effi~ency of Market Prices in ~ong-Run Allocation in the Oil Industry," in Studies in Energy Tax Policy 55 (G. Brannon ed. 1975; and Alan Rockwood, "Information Externalities and the Structure of the u.s. Petroleum Industry" (Ph.D. Dissertation, Washinqton University,· 1980).
-150-

Unofficial FERC-Generated PDF of 20050808-0259 Issued by FERC OSEC 08/08/2005 in Docket#: -
success or failure of the first firm to explore in an area
provides other owners of oil rights in that area with infor
mation that can be of considerable value in estimating the
probability of their finding oil or in deciding where or at
what depth to drill. Each well drilled. except for the last,
generates externalities for the next well. Each well drilled,
except for the first. benefits from externalities generated
by previous wells. In addition. the unit cost of pipeline
t"ransportation, or even the existence of a pipeline. may depend
on the total amount of oil discovered in the area to be served
by a pipeline. Thus. informational externalities can be
generated by the first explorers even when completely inde
pendent geologies are involved. Under such conditions, each
owner prefers to wait until the other firms have explored their
tracts, and then free ride on these firms' investments. The
failure to compensate for such incentives will always result in
a delay past the optimal point to begin exploration, will
always slow the process of exploring the whole field, and may
even result in a field never being explored.
Not surprisingly. a number of institutional arrangements
have been used to internalize these externalities. First,
before beqinninq drilling on any one tract, the initial
explorer can try to acquire leases on as many tracts as
possible whose vaiues could be expected eo increase as a result
of drillinq on the first tract and all linked subsequent
tracts. Second, the first mover can drill, keep the result
secret, and then buy up leases on nearby tracts if oil is
-151-

Unofficial FERC-Generated PDF of 20050808-0259 Issued by FERC OSEC 08/08/2005 in Docket#: -
discovered. A third approach has been for adjacent lease
holders to enter into arrangements to compensate each other for
informational spillovers. Each of these solutions. however.
has its own severe limitations and problems.
Fortunately. however. it appears that if pipeline owners
are allowed to exert unregulated monopsony power. the effect
can be to offset these information externalities. OWners of
oil rights in an area can opt for one of twc roles. They can
participate in a joint venture drilling group that will carry
out the initial discovery process and that will finance and
build a joint venture pipeline if sufficient oil is discovered.
They. thus. foreqo free-rider gains but achieve access to pipe
line transportation at marginal cost if their efforts are
successful. Alternatively. they can refuse to par~icipate in
funding the early discovery process and wait until the results
of initial exploratory efforts are known. But if the initial
discovery process is a success, they will then face higher
transportation costa, since the pipeline owners can extract
from the later producers an amount up to the lesser of the
fixed· costs of a pipeline (i.e .• up to the cost to late-movers
of constructinq their own pipeline), the cost of alternative
transportation. or the value of their tracts. Thus, the same
fixed costs that make a pipeline into a natural monopsony. and
thus raise the potential for one kind of market failure, are
used to correct another market failure caused by informational
externalities.
-152-

Unofficial FERC-Generated PDF of 20050808-0259 Issued by FERC OSEC 08/08/2005 in Docket#: -
The critical observation here is that the number of
participants in the first-move~ group is endogenous. In the
absence of pipeline regulation. leaseholders are forced to
balance eK a~~e estimated infotmation externalities against the
ex a~te expected value o: the difference in trar.sportation
costs. Any initial first-mover group would not appear to have
an incentive to restrict their membership, since additional
members contribute to initial drilling costs but do not
increase the ex post transport costs of current members until
the late-mover group becomes too small to cover the fixed costs
of the pipeline. at which point the joint venture becomes a
coalition of the whole. 194/
Ex post. of course, these decisions by individual owners
of oil rights to join or not to join will prove to be right or
wrong, and thus these owners will almost invariably earn rates
of return.ex post which are greater than or less than the
competitive rate of return. Economic efficiency, however,
requires only that decision-makers face competitive rates of
return ex ante.
It is important to note that the analysis presented here
and its conclusions apply only to new crude pipelines. The
historic cost of pipeline regulation includes the value of oil
194/ In some cases, however, owners of oil rights may not be able to join the first mover group despite its profitability. Such cases would probably be restricted to government owned tracts, the leasing of which is delayed past the optimum point by governmental leasing policy. In that case, a change in governmental leasing policy should be considered.
-153-

Unofficial FERC-Generated PDF of 20050808-0259 Issued by FERC OSEC 08/08/2005 in Docket#: -
discoveries not made or delayed. For pipelines born into a
wcrld of regulation, these coses have already been incurred and
cannot be reversed by deregulation. But a credible policy of
not regulating any new pipelines can at lease make it possible
to avoid these costs in the fueure.
Turn now to new produce pipelines. Contracting costs a~e
likely to be quite high in the case of new product pipelines
because the number of shippers is likely to be great.
~evertheless, the Department believes that federal regulation
of new product pipelines is unwarranted, because the conditions
under which a new product pipeline would present a significant
market power problem are highly unlikely to exist.
All scenarios in which a new product pipeline would present
a market power problem share a common feature--a large increase
in product at a particular location that is most efficiently
satisfied through the construction of a new pipeling. If the
location already were served by several regulated pipelines. the
consumption increase necessary to lead to a competitive problem
would be eruly colossal--large enough to support a new pipeline
that would dominate the existing pipelines as a group. If the
location already were served by any regulated pipelines, the
necessary consumption increase still would be quite large or the
existence of the regulated pipeline would sufficiently check mar-
ket power exercise'd by the ne•.t pipeline. Finally. if the location
were not previously served by a pipeline. then the consumption
increase would have to be large enough to support a pipeline and
sufficiently unforseen to prevent efficient contracting.

Unofficial FERC-Generated PDF of 20050808-0259 Issued by FERC OSEC 08/08/2005 in Docket#: -
Undet cuttent matket conditions. such latge incteases in
ptoduc~ consumption.ate ex~remely unlikely ovet the neat
future. Oil consumption has not bee~ rising significantly ove~
::!le pas~ decade and stands r.ow well below the le•;-els of the
la::e 1970 · s. 135/ Product pipe:ines now !:ave excess capacity.
Thus, given the current modest rate of population growth,
drama~ic increases in petrole~~ cons~~ption seem a remote
possibility. Despite possible short-run increases in consump
tion due to falling oil prices, the fact that pettoleum is an
ex~austible resource should guarantee no dramatic incteases in
consumption. Prices must rise over the long term, and
eventually the oil will run out.
In summary, there are persuas i•;-e reasons fat recommending
that new crude pipelines not be subject to federal regulation.
To a somewhat lesser extent, the same conclusion holds fat new
product pipelines. Only in situations. if any, where ex ante
competition to build pipelines is lacking or when contracting
costs are very high would the prospect for inefficient outcomes
warrant concern. Of far greater concern, in the Department's
judgm~nt, is the prospect th~t the ex post regulatory constraint
will cause construction of socially desirable pipelines and the
discovery of new crude fields to be delayed or foregone.
195/ Energy Information Administration. Annual Energy Review 1984, at 89 (1985).
-155-

Unofficial FERC-Generated PDF of 20050808-0259 Issued by FERC OSEC 08/08/2005 in Docket#: -
-156-

Unofficial FERC-Generated PDF of 20050808-0259 Issued by FERC OSEC 08/08/2005 in Docket#: -
APPENDIX
~PS OF CR~DE AND PRODUCT PIPE~INES
IN THE LOWER-48 UN!TEO STATES
-157-

Unofficial FERC-Generated PDF of 20050808-0259 Issued by FERC OSEC 08/08/2005 in Docket#: -
I
I
----··-··-··-··-·· l\
-~ ..
I I j I ; I I •' i
l•f~~unll . ' • l:. ®IIGI:II I • 11 I ;· !"' • ~ ·I ~i I H
I ~til !j
I
i a I '• I ,, •
I .::.~. -I : rAJ!"'/ ' _,f
r .!..__._ .. _ - ~ lj /,' I .. _ ~ ··-.. ., :
t~-"'?"'.-~ ~·. / J / 'I ,f /- . . ··-i . [_
---·-., .. ---! .. ~ , ' J- ! I ; ...
\ )
~~ I r .. - .. _Jr . '
' {__-.--~
..
•
! .... / .~ / I
/
~i ~
" .... ~··!~': n::..o:o:'!'c ;:r?::!,:•·-:- .. -.-..~:: .·:-

Unofficial FERC-Generated PDF of 20050808-0259 Issued by FERC OSEC 08/08/2005 in Docket#: -
/
/
Ll
•
......... l
) --
I !hltl
il l ,, ,., !iii •

Unofficial FERC-Generated PDF of 20050808-0259 Issued by FERC OSEC 08/08/2005 in Docket#: -
I ' ·_y· -·-. '
' . : f l
•:I:!=!
"'----·=- .. *"'!!--··-7
L.._ : ,.., ..... ·-:::.::;;:;:>~~=--~~-·----~=.~~ ...
··---~-·· .. "!...~:-:.-··· .. ,. • ·-· ::::.:-·r.~~ ...
··-
,,,, 3;--. -·-·--~ ==--=-.. __ a--
I'I!Ha'AI. "COMMON CAaaR .__, NODUCTS I'IPillfiiS NIIM~fc. ......... ................ - _, .. - ·- -· ..... . .. ---· ..

Unofficial FERC-Generated PDF of 20050808-0259 Issued by FERC OSEC 08/08/2005 in Docket#:
,( ............... -.~l!:~--··--~-1- -!f n;r 21
··"'· ' • .
• •
!:-----·-·<!--·-~-~-~--
'RINCI'AL COMMON CAIIIII llfiNIO I'IIOOUCfS -~~
..... CAlla.! .. --· -Of --............ ,_ .. ·-·-··-, ... ._ .. .• -., ...
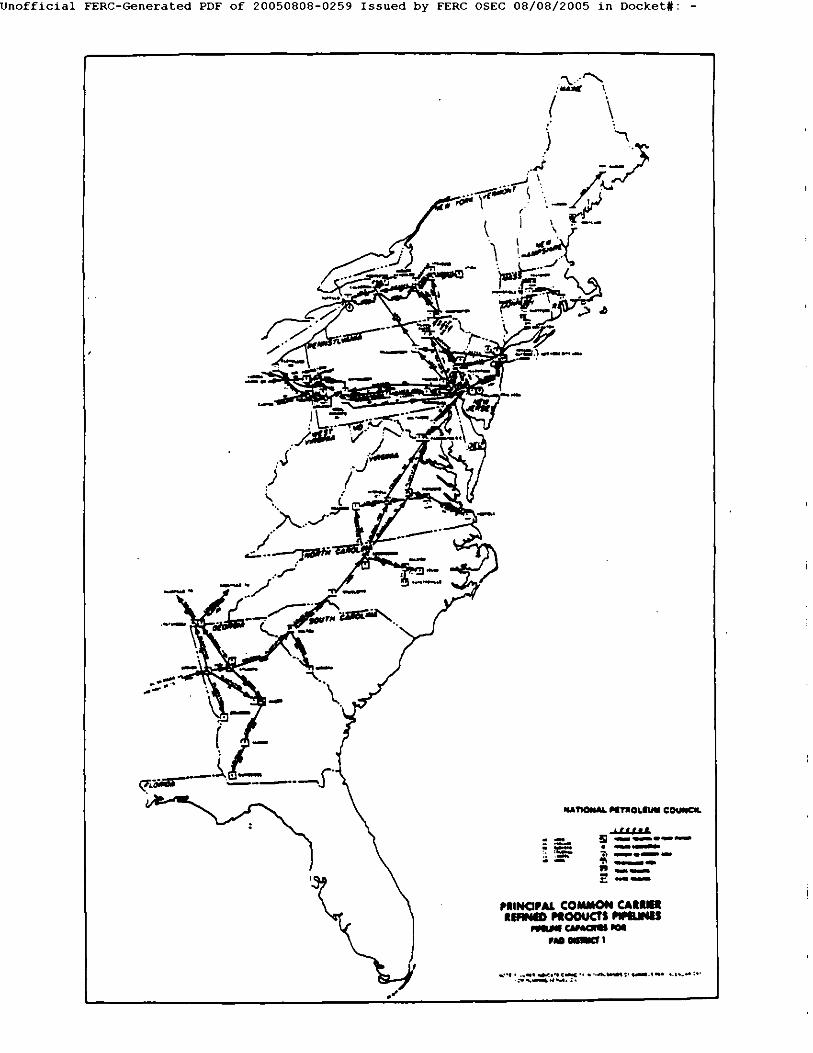
Unofficial FERC-Generated PDF of 20050808-0259 Issued by FERC OSEC 08/08/2005 in Docket#: -
."\.. ·'""--- I
/ \
,,,, 51----·--~ " ~ ----------
I'IINQPAI. COMMON CAIUI llfiNID PIOOUCTS PII'ILIHIS
- UMCIIIII-, .. __,,
...... ,, _ ... -. ... c-····--1·-·•- .. ,~ ... :~· ·:-- ... -ol-.l·

Unofficial FERC-Generated PDF of 20050808-0259 Issued by FERC OSEC 08/08/2005 in Docket#: -
' !
~~ I
1
i I
~~----··---··-~ i
..... - ~·
:
\ .I
I
I
I
I

Unofficial FERC-Generated PDF of 20050808-0259 Issued by FERC OSEC 08/08/2005 in Docket#: -
•I, ••
..--------__.., .. ,...,...._ .. ___ "'
l . ~
-~------.. .__··-.. --.)
~.
I I ; I• ~ •
I ji 'I 3 .. I : ,,,,,!! ~~~~~ : !lll!f!li! ~!
-:::o:el!l:r I ! •a: ~ 21 ~! s • :::11 § vo ~ ! 1 ..

Unofficial FERC-Generated PDF of 20050808-0259 Issued by FERC OSEC 08/08/2005 in Docket#: -
' i
I ! '
i
·---' SDfi'Ni;;:::··-- '· - ... r• •• .__ . --.__ ' I ---·-··! ,. ' ·.,
I
.. ~"' .. ) i
-· .---.... ... _ "·· .......
\...._
:'-··---:~~---·-··-··-j ~ .. ,~s:;:-.-------
1 ··--·-···---'
.
•
?
I
" /;
·<-,·-·
I CUll
.., --·-~ -------·-·----·-NAncNML "'TTIILLUM COUIIClC.
I'IINCI,AL COMMON CARRH QUDI OIL l'llt\INII _ ........... --· .... .-.. .. ... .... ·-·-· .. :-·· ...... _,. ·-··-····-1 ..
I '

Unofficial FERC-Generated PDF of 20050808-0259 Issued by FERC OSEC 08/08/2005 in Docket#:
)
. "' ··.
..
• • • •
\ I
~
G ·.yo---:~ ----------------
l'liNCII'MCOMMON CAll& CIUDI OIL ... LINIS ,....CII#nme~a~
-·· Mr-.cY I ,.,, o• -s•s...-. .. .,, •
.. -: .-. -·
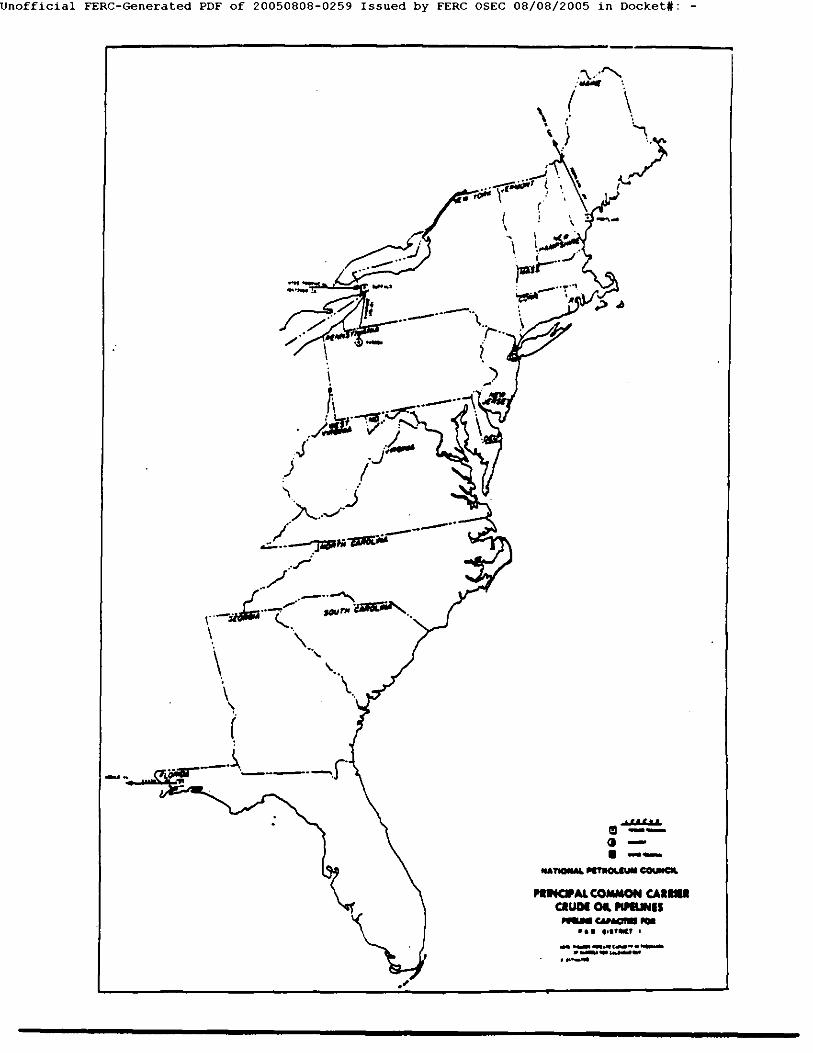
Unofficial FERC-Generated PDF of 20050808-0259 Issued by FERC OSEC 08/08/2005 in Docket#: -
\ \ (
--·i·-----.r· --. .....,~ ....
\ •
I ftC If
1!1-<t -.--
f!IIAT'IOML NTitOUUM CCM..wCa.
I'IINCIPAI. COMMON CAIIU CIUDI 01. I'II'IUNIS
. a. t•lf•Cf I ___ ... _... __ ._ ... __ ··-
Unofficial FERC-Generated PDF of 20050808-0259 Issued by FERC OSEC 08/08/2005 in Docket#: -