Department of Civil Engineering and Mechanics - Florida
124
Department of Civil Engineering and Mechanics The University of South Florida Durability of CFRP Pretensioned Piles in Marine Environment Volume II Rajan Sen, Satya Sukumar and Jose Rosas Department of Civil Engineering and Mechanics August 1995 A Report on a Research Project Sponsored by the Florida Department of Transportation in cooperation with the U.S. Department of Transportation Contract C-4478 Tampa, Florida
Transcript of Department of Civil Engineering and Mechanics - Florida
Department of Civil Engineering and Mechanics
The University of South Florida
Durability of CFRP Pretensioned Piles
in Marine Environment
Volume II
Rajan Sen, Satya Sukumar and Jose Rosas
Department of Civil Engineering and Mechanics
August 1995
A Report on a Research Project Sponsored by the
Florida Department of Transportation in cooperation with
the U.S. Department of Transportation
Contract C-4478
Tampa, Florida
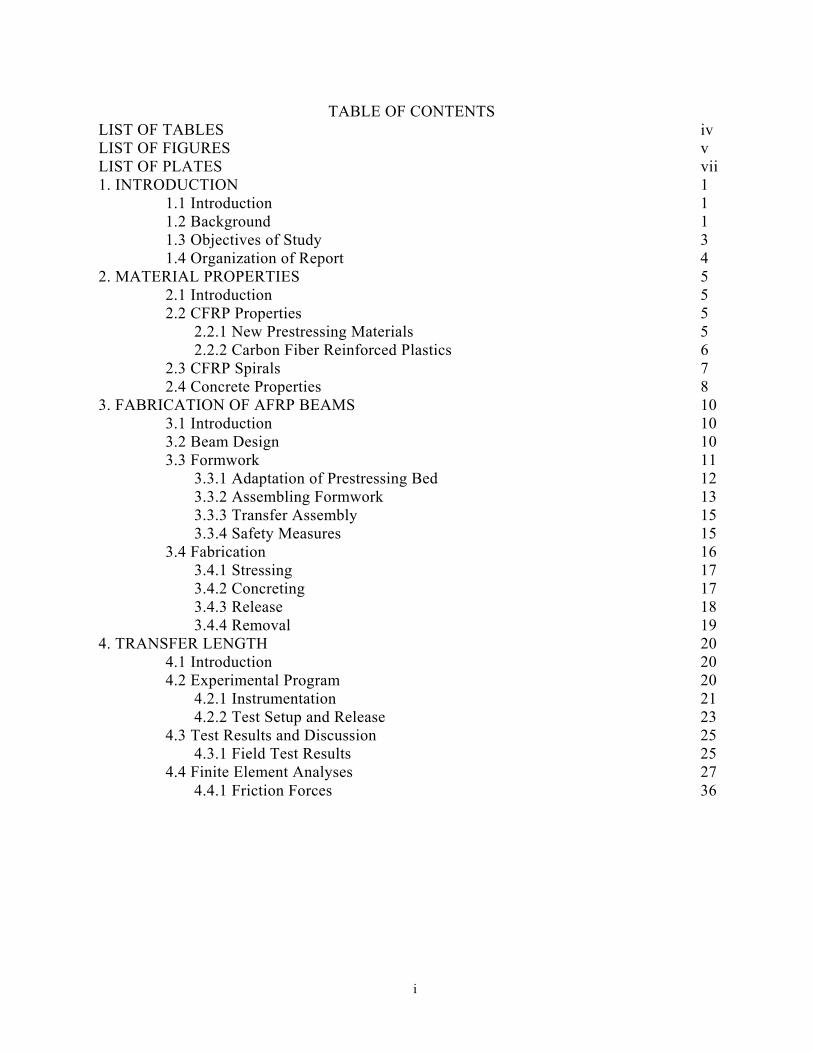
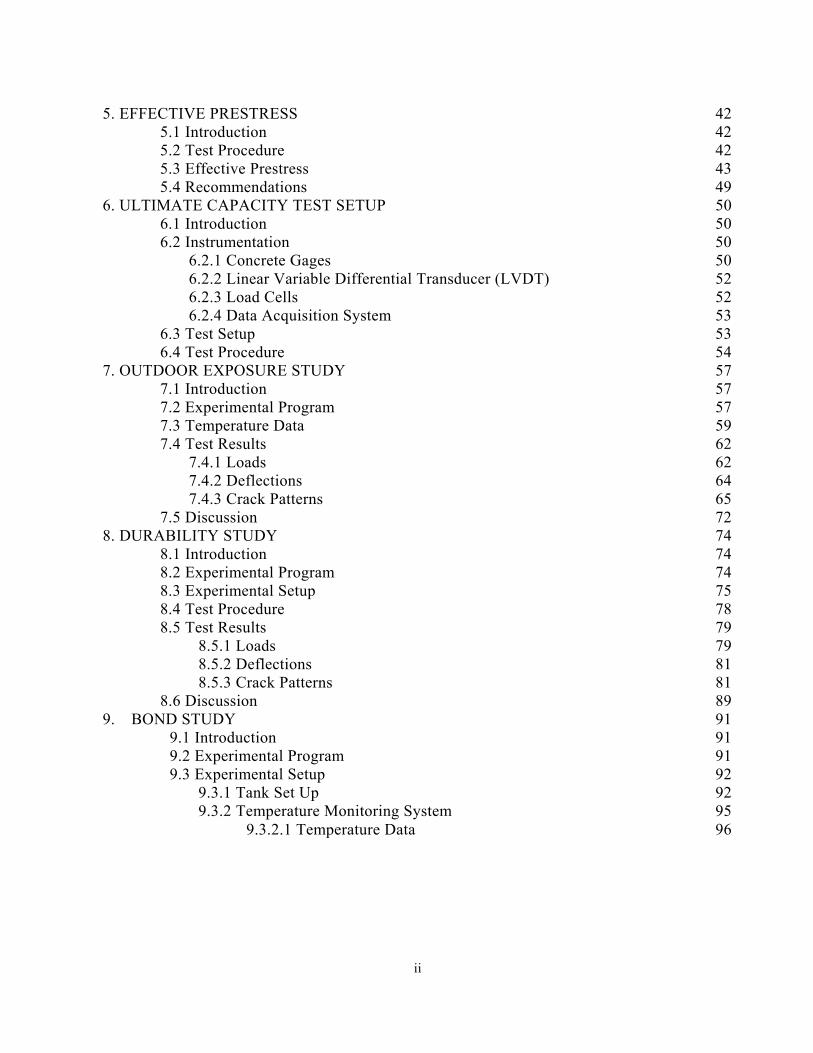
TABLE OF CONTENTS LIST OF TABLES iv LIST OF FIGURES v LIST OF PLATES vii 1. INTRODUCTION 1
1.1 Introduction 1 1.2 Background 1 1.3 Objectives of Study 3 1.4 Organization of Report 4
2. MATERIAL PROPERTIES 5 2.1 Introduction 5 2.2 CFRP Properties 5
2.2.1 New Prestressing Materials 5 2.2.2 Carbon Fiber Reinforced Plastics 6
2.3 CFRP Spirals 7 2.4 Concrete Properties 8
3. FABRICATION OF AFRP BEAMS 10 3.1 Introduction 10 3.2 Beam Design 10 3.3 Formwork 11
3.3.1 Adaptation of Prestressing Bed 12 3.3.2 Assembling Formwork 13 3.3.3 Transfer Assembly 15 3.3.4 Safety Measures 15
3.4 Fabrication 16 3.4.1 Stressing 17 3.4.2 Concreting 17 3.4.3 Release 18 3.4.4 Removal 19
4. TRANSFER LENGTH 20 4.1 Introduction 20 4.2 Experimental Program 20
4.2.1 Instrumentation 21 4.2.2 Test Setup and Release 23
4.3 Test Results and Discussion 25 4.3.1 Field Test Results 25
4.4 Finite Element Analyses 27 4.4.1 Friction Forces 36
i
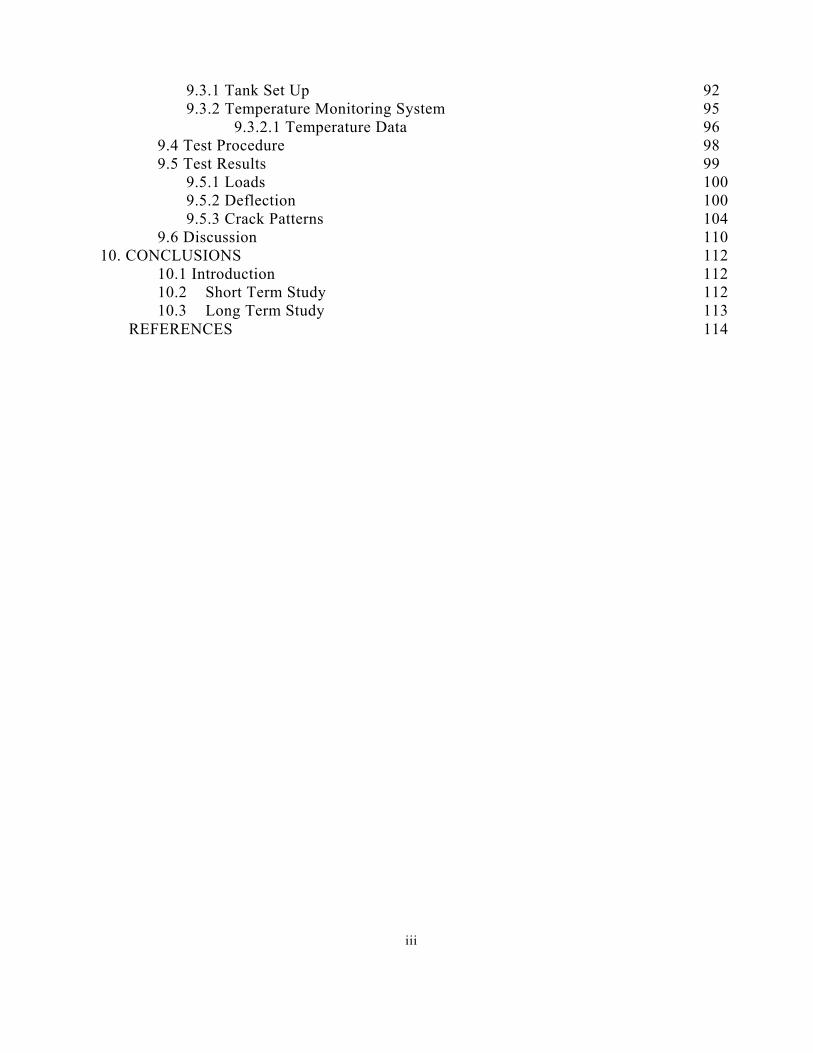
5. EFFECTIVE PRESTRESS 42 5.1 Introduction 42 5.2 Test Procedure 42 5.3 Effective Prestress 43 5.4 Recommendations 49
6. ULTIMATE CAPACITY TEST SETUP 50 6.1 Introduction 50 6.2 Instrumentation 50
6.2.1 Concrete Gages 50 6.2.2 Linear Variable Differential Transducer (LVDT) 52 6.2.3 Load Cells 52 6.2.4 Data Acquisition System 53
6.3 Test Setup 53 6.4 Test Procedure 54
7. OUTDOOR EXPOSURE STUDY 57 7.1 Introduction 57 7.2 Experimental Program 57 7.3 Temperature Data 59 7.4 Test Results 62
7.4.1 Loads 62 7.4.2 Deflections 64 7.4.3 Crack Patterns 65
7.5 Discussion 72 8. DURABILITY STUDY 74
8.1 Introduction 74 8.2 Experimental Program 74 8.3 Experimental Setup 75 8.4 Test Procedure 78 8.5 Test Results 79
8.5.1 Loads 79 8.5.2 Deflections 81 8.5.3 Crack Patterns 81
8.6 Discussion 89 9. BOND STUDY 91
9.1 Introduction 91 9.2 Experimental Program 91 9.3 Experimental Setup 92
9.3.1 Tank Set Up 92 9.3.2 Temperature Monitoring System 95
9.3.2.1 Temperature Data 96
ii
9.3.1 Tank Set Up 92 9.3.2 Temperature Monitoring System 95
9.3.2.1 Temperature Data 96 9.4 Test Procedure 98 9.5 Test Results 99
9.5.1 Loads 100 9.5.2 Deflection 100 9.5.3 Crack Patterns 104
9.6 Discussion 110 10. CONCLUSIONS 112
10.1 Introduction 112 10.2 Short Term Study 112 10.3 Long Term Study 113
REFERENCES 114
iii
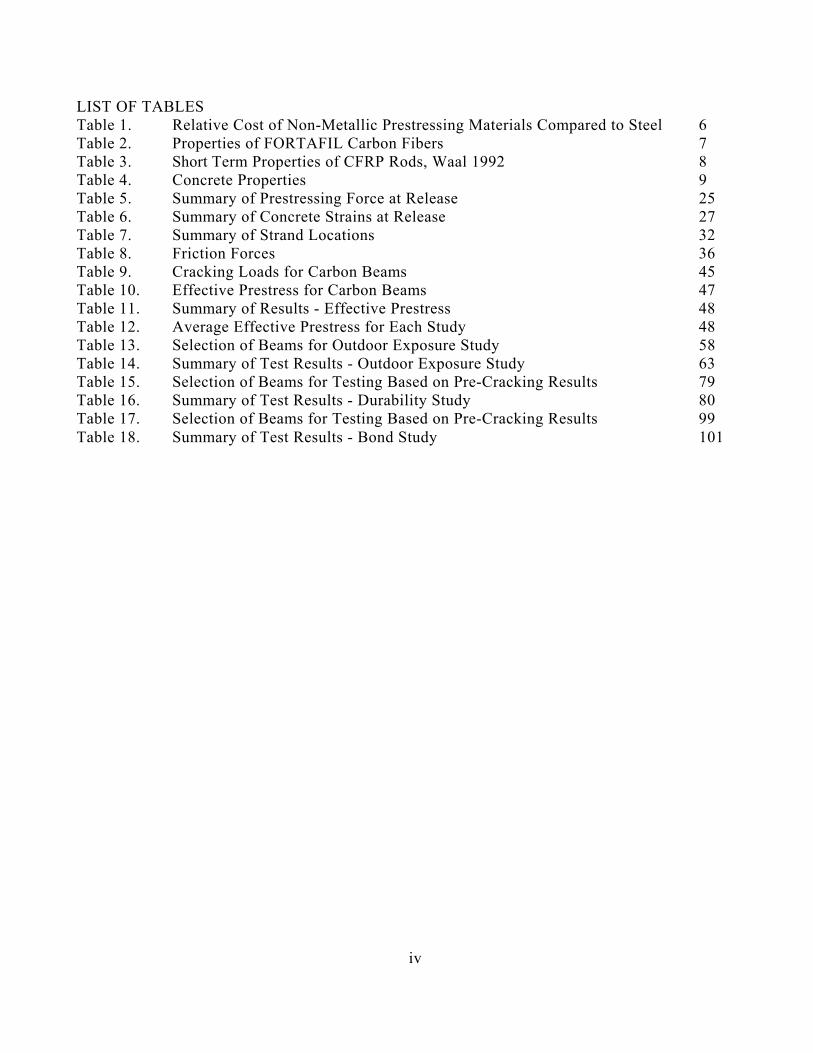
LIST OF TABLES Table 1. Relative Cost of Non-Metallic Prestressing Materials Compared to Steel 6 Table 2. Properties of FORTAFIL Carbon Fibers 7 Table 3. Short Term Properties of CFRP Rods, Waal 1992 8 Table 4. Concrete Properties 9 Table 5. Summary of Prestressing Force at Release 25 Table 6. Summary of Concrete Strains at Release 27 Table 7. Summary of Strand Locations 32 Table 8. Friction Forces 36 Table 9. Cracking Loads for Carbon Beams 45 Table 10. Effective Prestress for Carbon Beams 47 Table 11. Summary of Results - Effective Prestress 48 Table 12. Average Effective Prestress for Each Study 48 Table 13. Selection of Beams for Outdoor Exposure Study 58 Table 14. Summary of Test Results - Outdoor Exposure Study 63 Table 15. Selection of Beams for Testing Based on Pre-Cracking Results 79 Table 16. Summary of Test Results - Durability Study 80 Table 17. Selection of Beams for Testing Based on Pre-Cracking Results 99 Table 18. Summary of Test Results - Bond Study 101
iv
LIST OF FIGURES
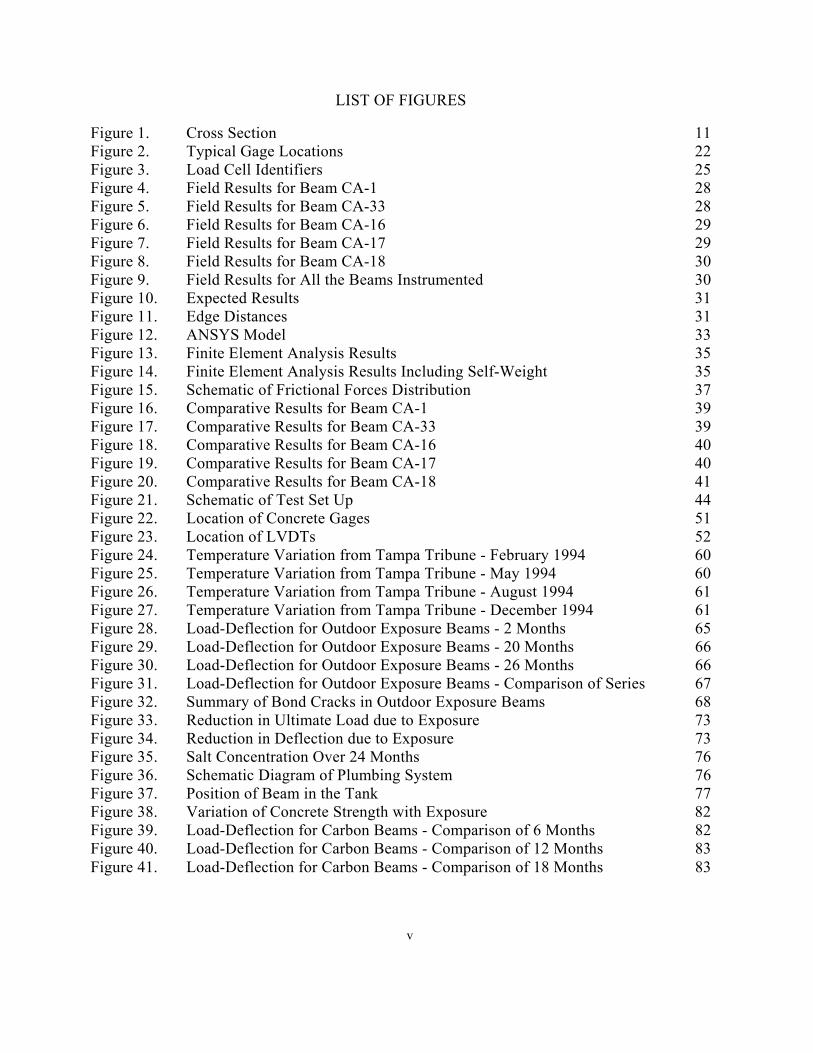
Figure 1. Cross Section 11 Figure 2. Typical Gage Locations 22 Figure 3. Load Cell Identifiers 25 Figure 4. Field Results for Beam CA-1 28 Figure 5. Field Results for Beam CA-33 28 Figure 6. Field Results for Beam CA-16 29 Figure 7. Field Results for Beam CA-17 29 Figure 8. Field Results for Beam CA-18 30 Figure 9. Field Results for All the Beams Instrumented 30 Figure 10. Expected Results 31 Figure 11. Edge Distances 31 Figure 12. ANSYS Model 33 Figure 13. Finite Element Analysis Results 35 Figure 14. Finite Element Analysis Results Including Self-Weight 35 Figure 15. Schematic of Frictional Forces Distribution 37 Figure 16. Comparative Results for Beam CA-1 39 Figure 17. Comparative Results for Beam CA-33 39 Figure 18. Comparative Results for Beam CA-16 40 Figure 19. Comparative Results for Beam CA-17 40 Figure 20. Comparative Results for Beam CA-18 41 Figure 21. Schematic of Test Set Up 44 Figure 22. Location of Concrete Gages 51 Figure 23. Location of LVDTs 52 Figure 24. Temperature Variation from Tampa Tribune - February 1994 60 Figure 25. Temperature Variation from Tampa Tribune - May 1994 60 Figure 26. Temperature Variation from Tampa Tribune - August 1994 61 Figure 27. Temperature Variation from Tampa Tribune - December 1994 61 Figure 28. Load-Deflection for Outdoor Exposure Beams - 2 Months 65 Figure 29. Load-Deflection for Outdoor Exposure Beams - 20 Months 66 Figure 30. Load-Deflection for Outdoor Exposure Beams - 26 Months 66 Figure 31. Load-Deflection for Outdoor Exposure Beams - Comparison of Series 67 Figure 32. Summary of Bond Cracks in Outdoor Exposure Beams 68 Figure 33. Reduction in Ultimate Load due to Exposure 73 Figure 34. Reduction in Deflection due to Exposure 73 Figure 35. Salt Concentration Over 24 Months 76 Figure 36. Schematic Diagram of Plumbing System 76 Figure 37. Position of Beam in the Tank 77 Figure 38. Variation of Concrete Strength with Exposure 82 Figure 39. Load-Deflection for Carbon Beams - Comparison of 6 Months 82 Figure 40. Load-Deflection for Carbon Beams - Comparison of 12 Months 83 Figure 41. Load-Deflection for Carbon Beams - Comparison of 18 Months 83
v
Figure 42. Load-Deflection for Carbon Beams - Comparison of 24 Months 84 Figure 43. Maximum Crack Length for the Durability Study Beams 84 Figure 44. Reduction in Ultimate Load due to Exposure 90 Figure 45. Reduction in Deflection Load due to Exposure 90 Figure 46. Salt Concentration in the Tank 94 Figure 47. Position of Beam in the Tank 94 Figure 48. Schematic Diagram of the Heating System 95 Figure 49. Temperature Cycle for February 1994 96 Figure 50. Temperature Cycle for June 1994 97 Figure 51. Temperature Cycle for May 1994 97 Figure 52. Temperature Cycle for September 1994 98 Figure 53 Variation of Concrete Strength with Time 102 Figure 54. Load-Deflection for Carbon Beams - Comparison of 1,000 Hour Test 102 Figure 55. Load-Deflection for Carbon Beams - Comparison of 6,500 Hour Test 103 Figure 56. Load-Deflection for Carbon Beams - Comparison of 10,000 Hour Test 103 Figure 57. Load-Deflection for Carbon Beams - Comparison of 15,500 Hour Test 104 Figure 58. Maximum Bond Crack - Bond Study 105 Figure 59. Reduction in Ultimate Load due to Exposure - Bond Study 111 Figure 60. Reduction in Deflection Load due to Exposure - Bond Study 111
vi
LIST OF PLATES Plate 1. Installation of Formwork 14 Plate 2. Prestressing Bed with All Thirty Three Forms 14 Plate 3. Chucks and Plastic inserts 16 Plate 4. Spirals Used Round the CFRP Rods 17 Plate 5. Curing of the CFRP Beams 18 Plate 6. Releasing the Prestressing Force in the CFRP Beam 19 Plate 7. Data Acquisition System Used at Prestressing Yard 23 Plate 8. Release of Prestressing Force 24 Plate 9. CFRP After Release 24 Plate 10. Precracking Test Set Up 44 Plate 11. System 4000 and Computer 55 Plate 12. Typical Set Up for CFRP Pretensioned Beams 55 Plate 13. Two Point Load Assembly 56 Plate 14. Flexure Failure of the Control Beam 64 Plate 15. Crack Pattern for CA 2 - 2 Months 69 Plate 16. Crack Pattern for CA 13 - 2 Months 69 Plate 17. Crack Pattern for CA 25 - 2 Months 70 Plate 18. Crack Pattern for CA 14 - 20 Months 70 Plate 19. Crack Pattern for CA 15 - 20 Months 71 Plate 20. Crack Pattern for CA 20 - 26 Months 71 Plate 21. Crack Pattern for CA 7 - Tested After 6 Months 85 Plate 22. Crack Pattern for CA 26 - Tested After 6 Months 85 Plate 23. Crack Pattern for CA 11 - Tested After 12 Months 86 Plate 24. Crack Pattern for CA 30 - Tested After 12 Months 86 Plate 25. Crack Pattern for CA 5 - Tested After 18 Months 87 Plate 26. Crack Pattern for CA 19 - Tested After 18 Months 87 Plate 27. Crack Pattern for CA 32 - Tested After 24 Months 88 Plate 28. Crack Pattern for CA 24 - Tested After 24 Months 88 Plate 29. Crack Pattern for CA 4 - Tested After 1000 Hours 105 Plate 30. Crack Pattern for CA 6 - Tested After 1000 Hours 106 Plate 31. Crack Pattern for CA 22 - Tested After 1000 Hours 106 Plate 32. Crack Pattern for CA 9 - Tested After 6500 Hours 107 Plate 33. Crack Pattern for CA 16 - Tested After 6500 Hours 107 Plate 34. Crack Pattern for CA 8 - Tested After 10000 Hours 108 Plate 35. Crack Pattern for CA 29 - Tested After 10000 Hours 108 Plate 36. Crack Pattern for CA 17 - Tested After 15500 Hours 109 Plate 37. Crack Pattern for CA 21 - Tested After 15500 Hours 109
vii
10
1. INTRODUCTION
1.1 Introduction
This is the second volume of an interim report presenting the preliminary
findings from an on-going investigation on the durability of carbon fiber reinforced
plastic (CFRP) pretensioned elements in a marine environment. The study, funded by
the Florida and US Department of Transportation since August 1992, is expected to be
completed in 1996.
1.2 Background
Florida's long coastline and sub-tropical climate have led to the rapid
deterioration of reinforced or prestressed concrete substructures exposed to a marine
environment. The resulting concrete spall is usually repaired by patching but this needs
to be repeated as often as every two years, e.g. for the Long Key Bridges, Monroe
County, Florida, Sagues, 1994. In rare instances, an impressed current cathodic
protection system is installed but its implementation for substructures in a marine
environment is far more complex than in bridge superstructures since fluctuations in
concrete resistivity (due to tide change) cause large variations in current distribution
that have to be controlled.
The high costs associated with the maintenance and repair of substructures in a
11
marine environment have prompted highway authorities to explore radical alternatives
such as the use of fiber reinforced plastics (FRPs) that offer the prospect of lower life
cycle costs. Although the potential of fiber reinforced plastics for prestressing
applications was recognized more than 40 years ago, Crepps 1951, it is only since the
1980's that there has been a worldwide resurgence of interest in their application, e.g.
Iyer & Sen 1991. FRPs have the desirable properties of high tensile strength, low
modulus and corrosion resistance that make it particularly attractive for prestressing
applications. They are, however, by no means inexpensive.
The price of FRPs ranges from 2.5-166 times that of steel (on a weight basis),
Nojiri 1992. The lower range corresponds to glass and the upper range to carbon.
However, since the quantity of steel used is relatively small, the incremental cost in
using the more expensive FRP material will not be as great. Moreover, in Florida
higher initial material costs will be partially offset by the lower cost of using smaller
sized piles and its associated lower transportation and driving costs (current Florida
Department of Transportation specifications require piles located in salt or brackish
water containing chlorides exceeding 0.2% to be at least 60 em x 60 cm irrespective of
load).
As relatively little was known regarding the suitability of FRP material for
pretensioning substructures, a comprehensive 26 month program of research was
initiated at the University of South Florida, Tampa in 1989, Sen et al 1992, Sen et al
1993a,b. Fiberglass was selected for the investigation because it was the least
expensive.
Following completion of this study in 1992, a new investigation was initiated to
12
plastics pretensioned beams that is the subject of this thesis.
1.3 Objectives of Study
The primary aim of the study was to establish whether carbon fiber reinforced
plastics could be used to replace steel in pretensioned piles driven in Florida's aggressive
environment. Since previous research had indicated adequate material resistance to
alkaline solutions, the focus of the research was on their durability as pretensioned piles
exposed to wet/dry cycles in salt water.
The aim of the investigation can be summarized as:
1. To assess the durability of CFRP pretensioned elements exposed to wet/dry cycles
in salt water.
2. To examine whether the long term bond between the CFRP element and concrete
was adversely affected by diurnal and seasonal temperature change.
3. To determine whether outdoor exposure had any detrimental effect on the service
and ultimate response of CFRP pretensioned elements.
To meet the objectives of the study, full sized CFRP pretensioned beams were
designed to fail by rupture of the CFRP prestressing rods. By comparing the failure of
exposed specimens with unexposed control specimens, the effect of exposure could be
understood in the context of changes in service and ultimate performance.
In addition to the larger specimens tested, other durability studies were also
initiated using smaller specimens. These include pullout and moisture absorption studies.
In these
13
tests, the smaller specimens were subjected to the same environment as the larger
specimens. The aim was to determine whether simpler tests could be devised to assess
durability. The results from these studies will be part of the final report to be submitted
next year.
1.4 Organization of Report
Information on materials used in these studies is summarized in Chapter 2. The
fabrication and preparation of specimens for testing is discussed in Chapter 3. The results
of field tests to determine transfer length and subsequent efforts to reconcile the test data
with predictions from finite element analyses are presented in Chapter 4. To accelerate
degradation, all specimens were pre-cracked. The analysis of the pre-cracking load to
determine the effective prestress is presented in Chapter 5.
A description of the test set-up and instrumentation used for all the ultimate
load tests is presented in Chapter 6. The three studies relating to outdoor exposure,
durability and bond are described in Chapters 7-9 respectively. The principal conclusions
are summarized in Chapter 10.
5
2. MATERIAL PROPERTIES
2.1 Introduction
This chapter provides essential data on carbon fiber reinforced plastic (CFRP)
rods used in the study. The properties of fibers and the rods are presented in Section 2.2.
Those of the CFRP spirals appear in Section 2.3. The mix design for the concrete is
summarized in Section 2.4.
2.2 CFRP Properties
2.2.1 New Prestressing Materials
Advances in composite materials over the past several decades have led to the
development of several high strength, light weight fiber reinforced plastics, FRP.
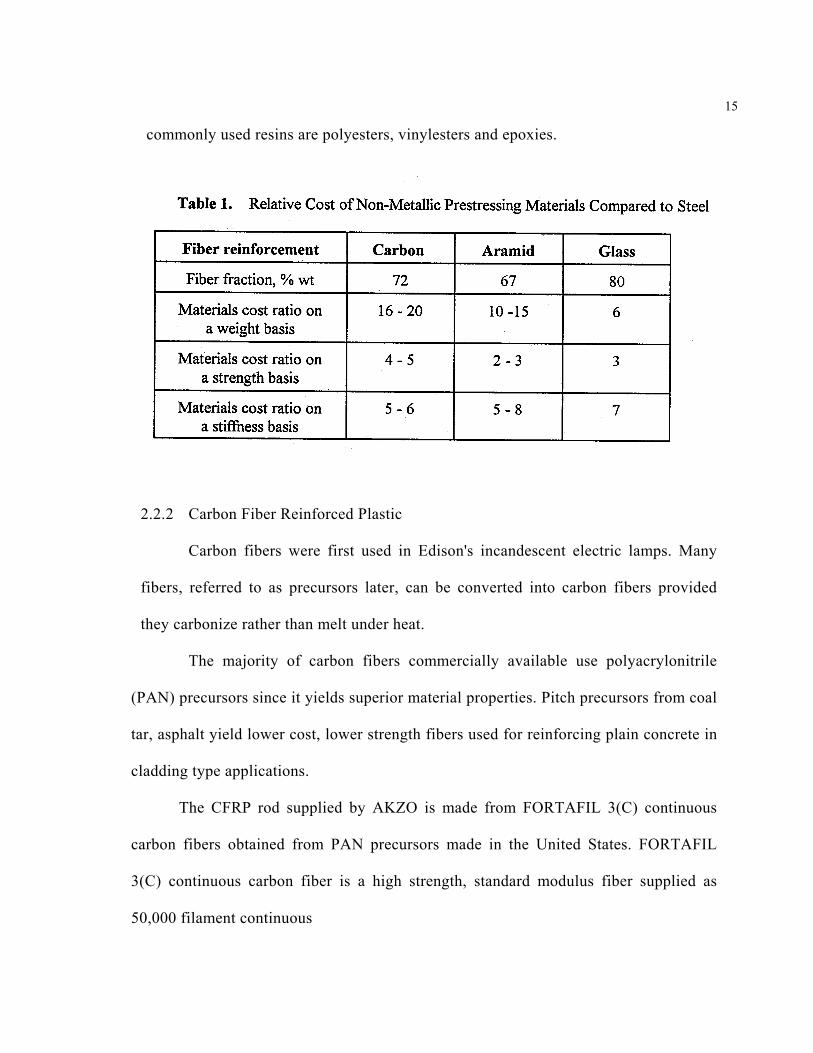
Although these composites are more expensive than prestressing steel (see Table 1), life
cycle costs may be significantly lower, Dolan 1990.
Of the commercially available fibers three, glass, carbon and aramid fibers, have
the necessary combination of strength and stiffness suitable for prestressing, Rostasy
1988. Resins or polymers form the continuous matrix to which these fibers are bonded.
The most
15
commonly used resins are polyesters, vinylesters and epoxies.
2.2.2 Carbon Fiber Reinforced Plastic
Carbon fibers were first used in Edison's incandescent electric lamps. Many
fibers, referred to as precursors later, can be converted into carbon fibers provided
they carbonize rather than melt under heat.
The majority of carbon fibers commercially available use polyacrylonitrile
(PAN) precursors since it yields superior material properties. Pitch precursors from coal
tar, asphalt yield lower cost, lower strength fibers used for reinforcing plain concrete in
cladding type applications.
The CFRP rod supplied by AKZO is made from FORTAFIL 3(C) continuous
carbon fibers obtained from PAN precursors made in the United States. FORTAFIL
3(C) continuous carbon fiber is a high strength, standard modulus fiber supplied as
50,000 filament continuous
16
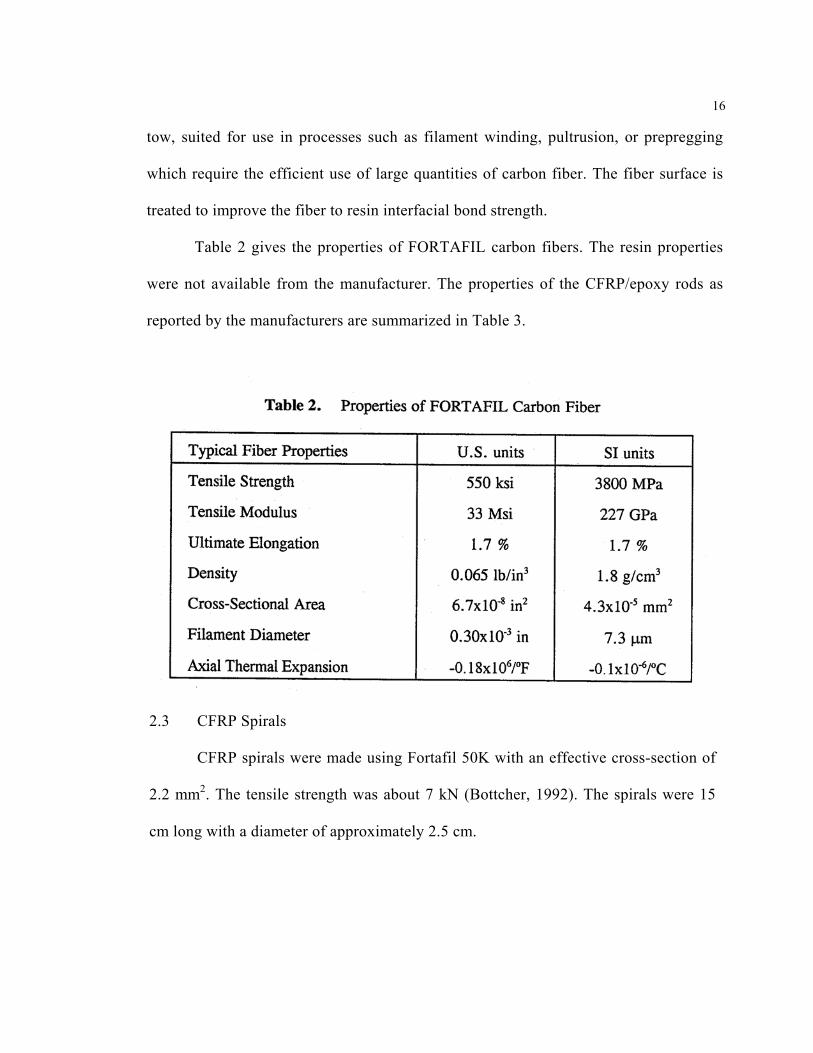
tow, suited for use in processes such as filament winding, pultrusion, or prepregging
which require the efficient use of large quantities of carbon fiber. The fiber surface is
treated to improve the fiber to resin interfacial bond strength.
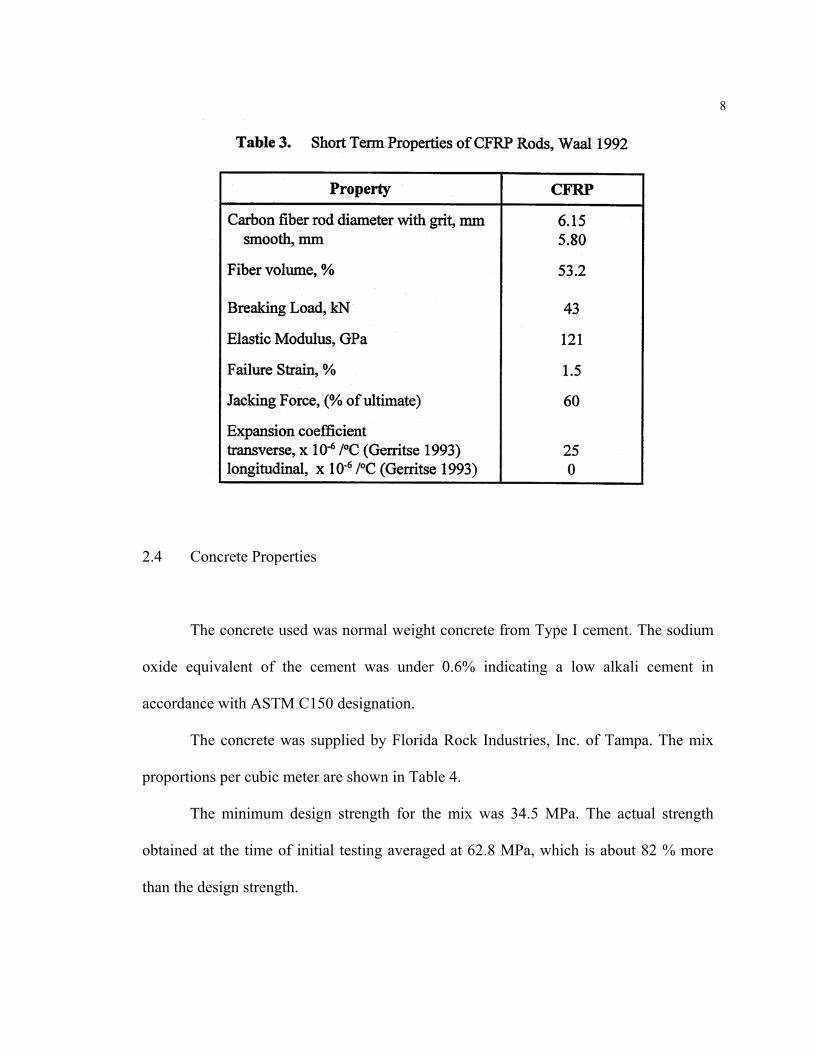
Table 2 gives the properties of FORTAFIL carbon fibers. The resin properties
were not available from the manufacturer. The properties of the CFRP/epoxy rods as
reported by the manufacturers are summarized in Table 3.
2.3 CFRP Spirals
CFRP spirals were made using Fortafil 50K with an effective cross-section of
2.2 mm2. The tensile strength was about 7 kN (Bottcher, 1992). The spirals were 15
cm long with a diameter of approximately 2.5 cm.
8
2.4 Concrete Properties
The concrete used was normal weight concrete from Type I cement. The sodium
oxide equivalent of the cement was under 0.6% indicating a low alkali cement in
accordance with ASTM C150 designation.
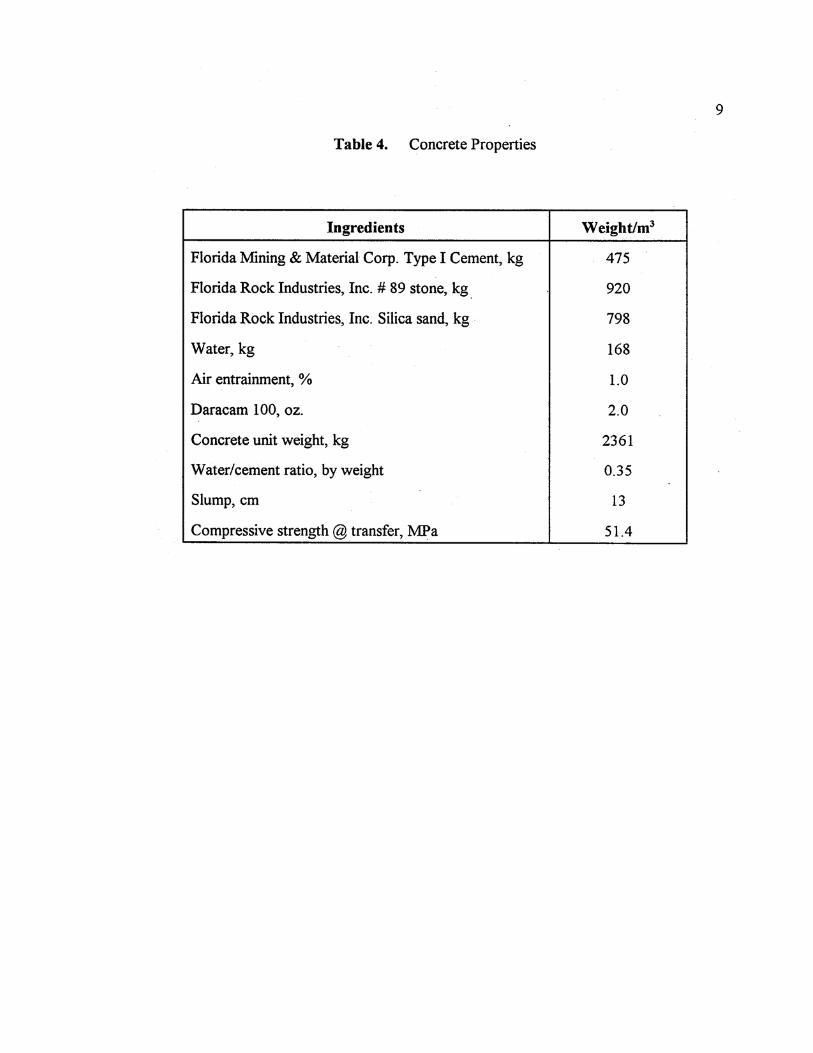
The concrete was supplied by Florida Rock Industries, Inc. of Tampa. The mix
proportions per cubic meter are shown in Table 4.
The minimum design strength for the mix was 34.5 MPa. The actual strength
obtained at the time of initial testing averaged at 62.8 MPa, which is about 82 % more
than the design strength.
10
3. FABRICATION OF CFRP BEAMS
3.1 Introduction.
This chapter describes the fabrication of the carbon fiber reinforced plastic
pretensioned beams used for investigating long term performance. Because all beams
were cast in a single pour, many technical problems had to be overcome. This is also
discussed in a recently published paper, Sen et al 1994.
Section 3.2 presents the design of the specimens. Section 3.3 describes the
construction of the forms and addresses some of the measures taken to iron out
difficulties faced during their mass production. Details of the actual fabrication and
concreting are included in Section 3.4.
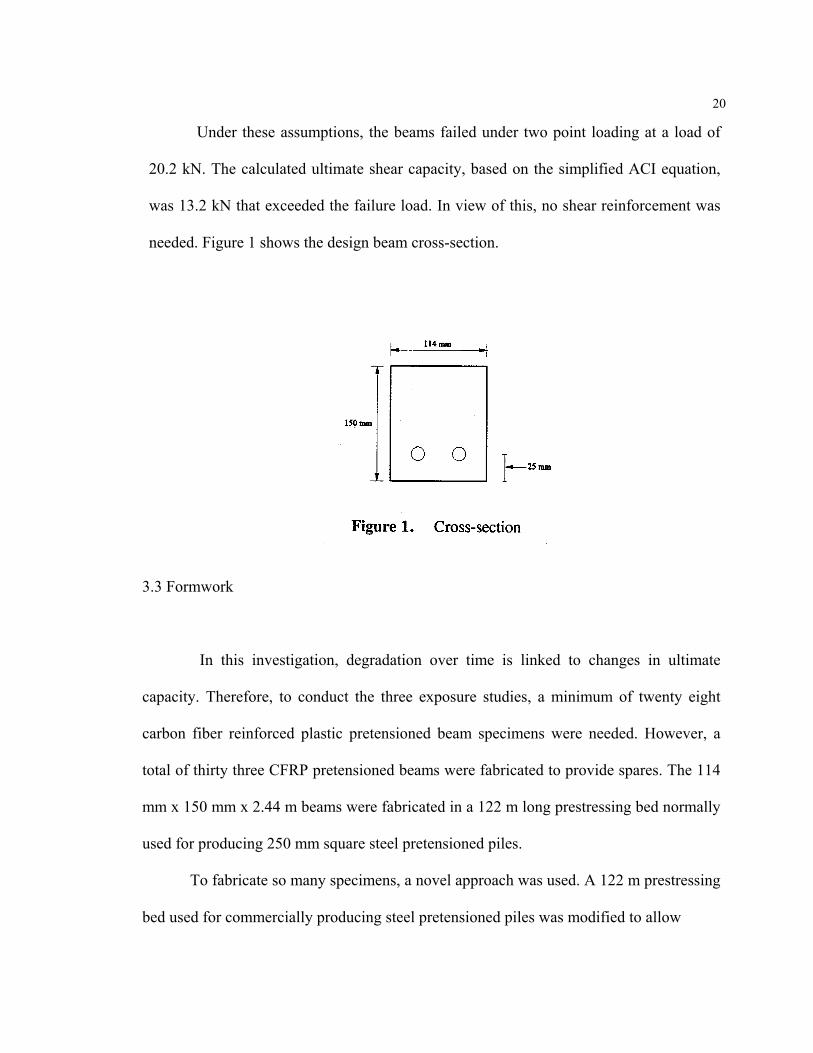
3.2 Beam Design
The beams used in this study were designed to fail by rupture of the CFRP
rods. The cross-section was 114 mm x 150 mm and the CFRP rods had an
eccentricity of 50 mm. The length was 2.44 m to match the size of available plywood
sheeting. The assumed concrete strength was 41.4 MPa and the CFRP properties are
those summarized in Table 3. The design calculations are included in Sukumar 1995.
.
20
Under these assumptions, the beams failed under two point loading at a load of
20.2 kN. The calculated ultimate shear capacity, based on the simplified ACI equation,
was 13.2 kN that exceeded the failure load. In view of this, no shear reinforcement was
needed. Figure 1 shows the design beam cross-section.
3.3 Formwork
In this investigation, degradation over time is linked to changes in ultimate
capacity. Therefore, to conduct the three exposure studies, a minimum of twenty eight
carbon fiber reinforced plastic pretensioned beam specimens were needed. However, a
total of thirty three CFRP pretensioned beams were fabricated to provide spares. The 114
mm x 150 mm x 2.44 m beams were fabricated in a 122 m long prestressing bed normally
used for producing 250 mm square steel pretensioned piles.
To fabricate so many specimens, a novel approach was used. A 122 m prestressing
bed used for commercially producing steel pretensioned piles was modified to allow

12
pretensioning of all the carbon fiber reinforced plastic specimens in a single pour. The
cross-sections of the CFRP specimens is shown in Figure 1.
3.3.1 Adaptation of Prestressing Bed
The beams were fabricated at Henderson's Prestress, Tarpon Springs, FL since
they had several 122 m prestressing beds that were suitable. More importantly, their
facility had been used earlier in the successful fabrication of the world's first fiberglass
pretensioned piles, Sen et al 1993c. The use of this facility additionally provided the
benefit of experienced personnel and equipment needed for the placement, curing and
removal of specimens. A 250 mm x 250 nun pile bed was used for the fabrication of
the CFRP specimens.
It was evident that drop-in forms would be needed to cast the much smaller
beam specimens. Other changes were also necessitated because of the design and
relative age of the prestressing beds. Frequent tensioning of steel strands had resulted
in burrs to the strand holes in the stressing headers at both the dead and live ends that
could potentially damage the highly anisotropic CFRP rods. Furthermore, the
prestressing jack used for stressing steel strands was unsuitable in view of the relatively
small jacking forces needed for the CFRP specimens (see Table 3). Finally, since the
entire 122 m bed was not used to make the thirty three carbon specimens (33 x 2.44 m
= 80.5 m plus spacers), measures had to be taken to eliminate danger to personnel or
specimens during release of the prestressing force. Some of these concerns are
addressed later.
22
3.3.2 Assembling Formwork
A prototype form was constructed to ensure that the openings for the CFRP rods
aligned with the openings in the stressing headers and to check that the concrete cover
was correct. This was carefully dismantled into its constituent parts a bottom board, two
side boards, two end pieces and appropriate spacers. These were then used as templates
for production of the remaining forms.
All component pieces for the thirty three beams cast were cut, labeled and
partially pre-assembled at USF. At the prestress yard, each form piece was unloaded,
assembled and positioned in the prestress bed. The final assembling procedure,
consisting of attaching two side boards to a bottom board, was performed with the use
of a pneumatic stapler and nail gun. These forms were then placed end to end at the
"dead end" in the prestress bed. This methodology permitted the complete assembly of
each form and minimized the damage potential of the formwork until the appropriate
time to properly secure them in their final positions.
Following placement of the forms, spacers and end pieces were fastened and the
forms moved to their final position. As a further strand alignment check a string was
threaded through the header plate and each form for the length of the pile bed. Minor
adjustments were made and the formwork was secured in place with wooden spacers
and braces. The form interiors were then sprayed with two applications of form oil to
facilitate stripping. The positioning of the forms allowed for a 24.4 m and 6.1 m space at
the live
14
24
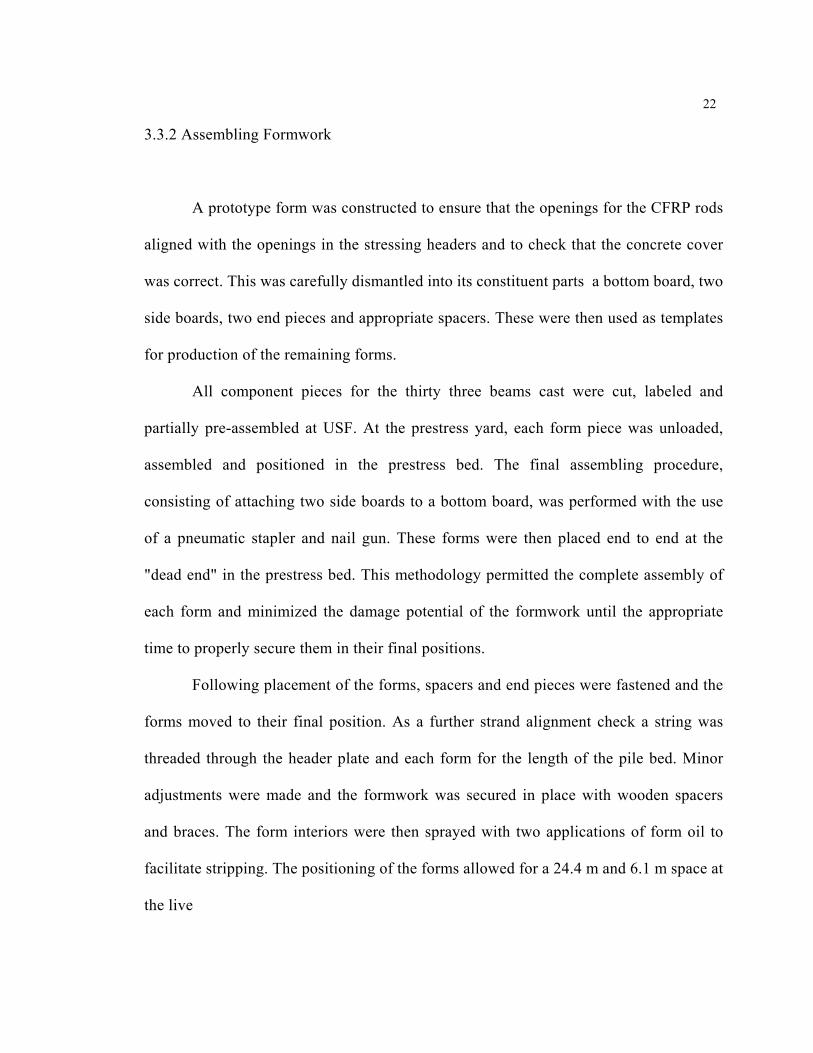
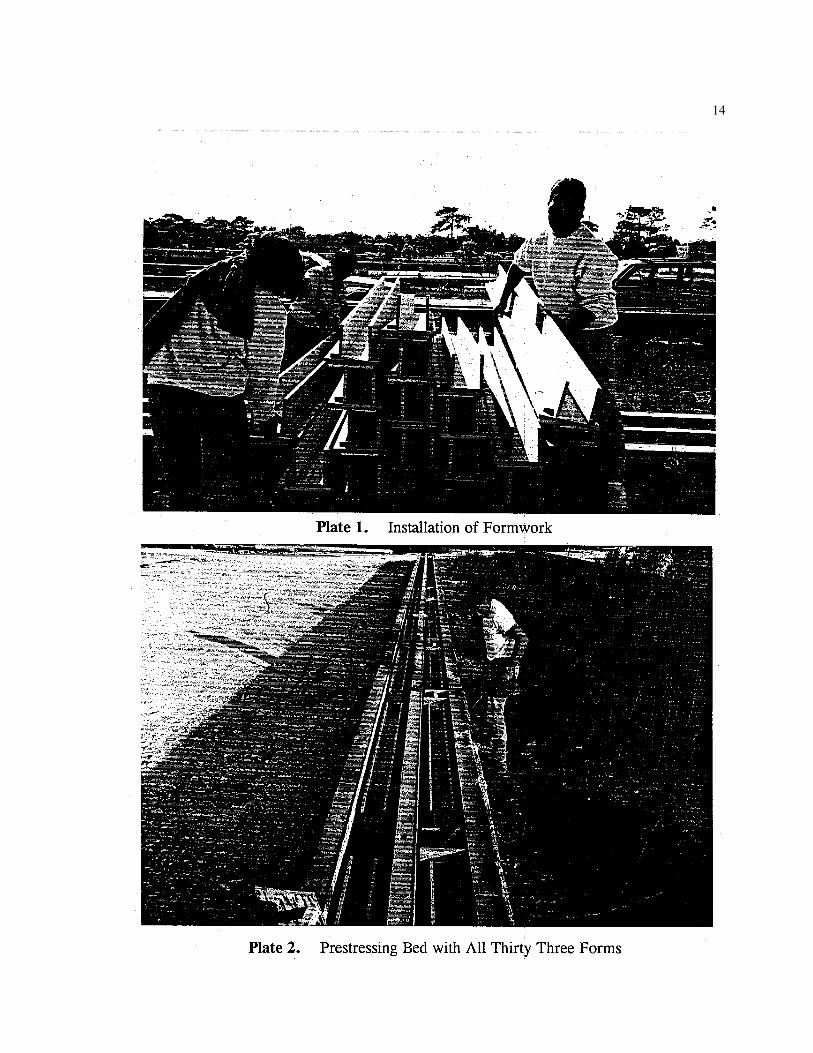
and dead ends of the prestressing bed, respectively. Plates 1 and 2 show the formwork
assembly and the thirty three assembled forms, respectively.
3.3.3 Transfer Assembly
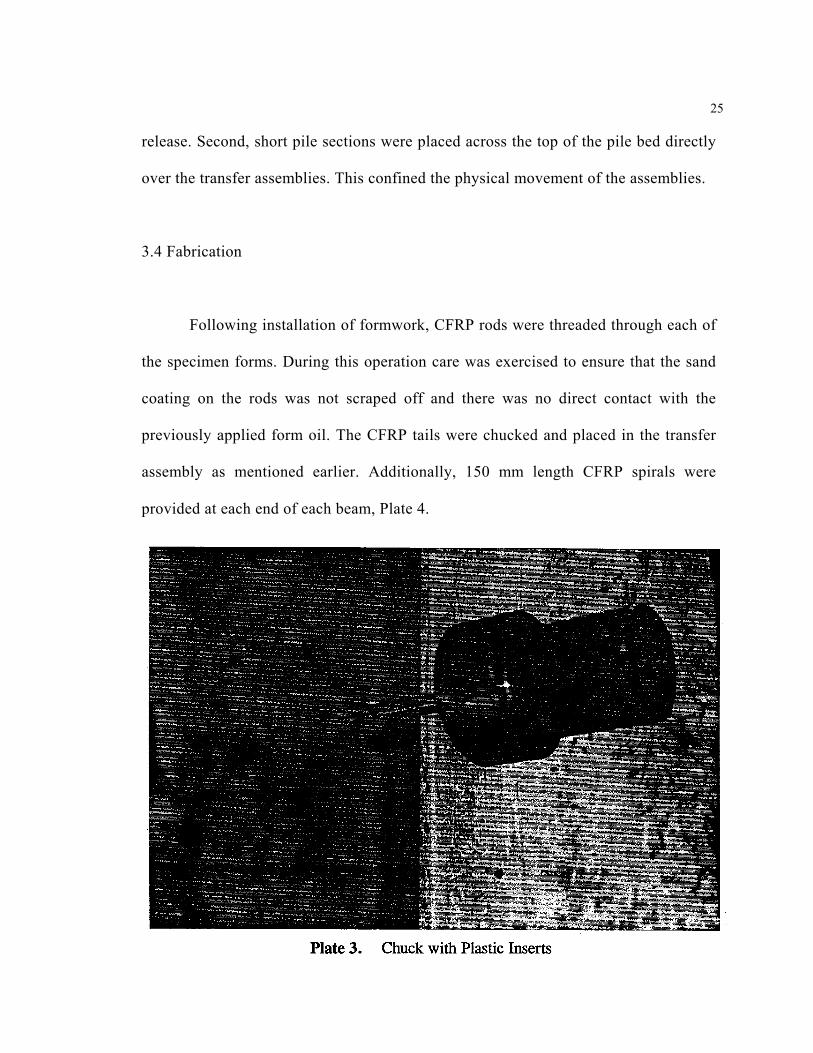
As noted earlier, burrs to the strand openings made it inadvisable to chuck the
CFRP rods directly to the stressing headers. Instead, transfer assemblies were used to
attach each CFRP rod to its steel counterpart. The CFRP rods were chucked at one end of
the transfer assembly using custom designed chucks with plastic inserts that were
provided by HBG shown in Plate 3. A 13 mm steel strand was chucked to the other end
of the transfer assembly. The free end of the steel strand was then continued and chucked
at the stressing headers. This arrangement was similar to that used earlier in the
fabrication of fiberglass piles excepting that the transfer assemblies were based on a
design provided by HBG that used a thick walled pipe.
3.3.4 Safety Measures
Two preventive measures were incorporated into the fabrication process to
countermand the effects of the stresses induced upon release of the prestressing force.
First, supplementary specimens were cast between each transfer assembly and the first
and last specimens at either end of the pile bed. These mock beams acted as buffers to
minimize and prevent the transfer assembly from hitting the actual test members upon
25
release. Second, short pile sections were placed across the top of the pile bed directly
over the transfer assemblies. This confined the physical movement of the assemblies.
3.4 Fabrication
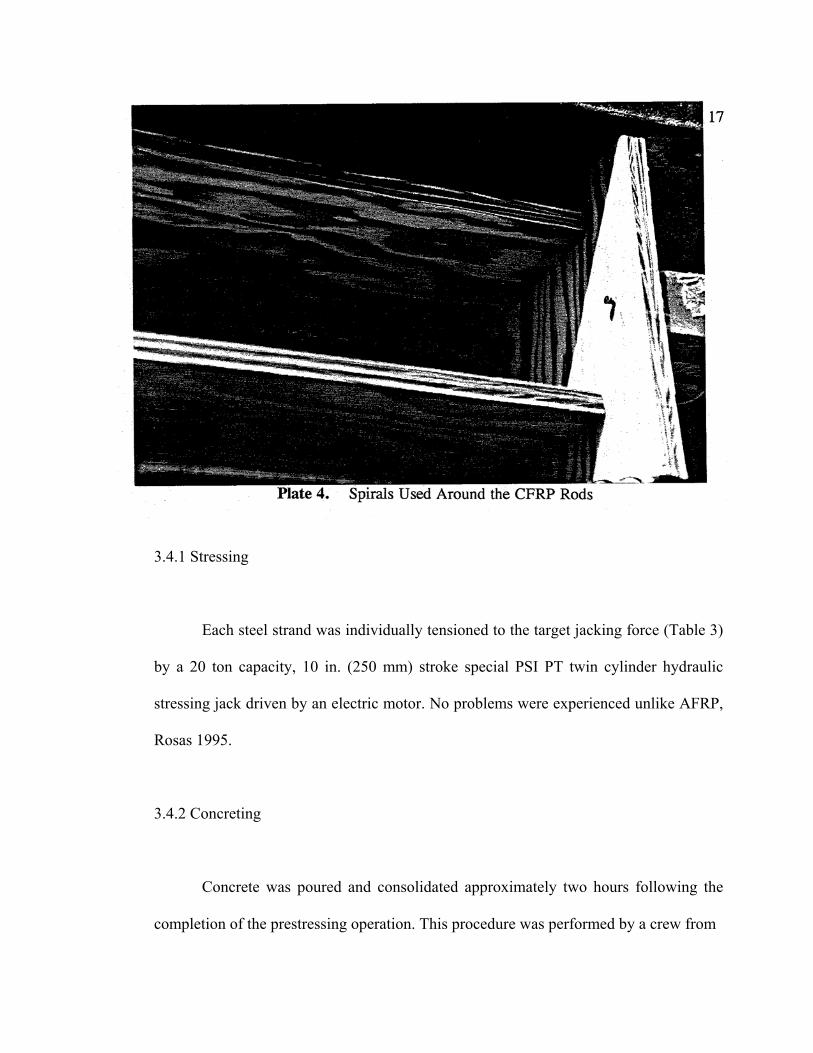
Following installation of formwork, CFRP rods were threaded through each of
the specimen forms. During this operation care was exercised to ensure that the sand
coating on the rods was not scraped off and there was no direct contact with the
previously applied form oil. The CFRP tails were chucked and placed in the transfer
assembly as mentioned earlier. Additionally, 150 mm length CFRP spirals were
provided at each end of each beam, Plate 4.
3.4.1 Stressing
Each steel strand was individually tensioned to the target jacking force (Table 3)
by a 20 ton capacity, 10 in. (250 mm) stroke special PSI PT twin cylinder hydraulic
stressing jack driven by an electric motor. No problems were experienced unlike AFRP,
Rosas 1995.
3.4.2 Concreting
Concrete was poured and consolidated approximately two hours following the
completion of the prestressing operation. This procedure was performed by a crew from
27
Henderson Prestress in a similar manner utilized in commercial production. One important
difference mandated was that the CFRP rods did not come into direct contact with the
head of the vibrator. The surface of the concrete was screeded, trowel finished and
covered with plastic sheeting to retain the moisture.
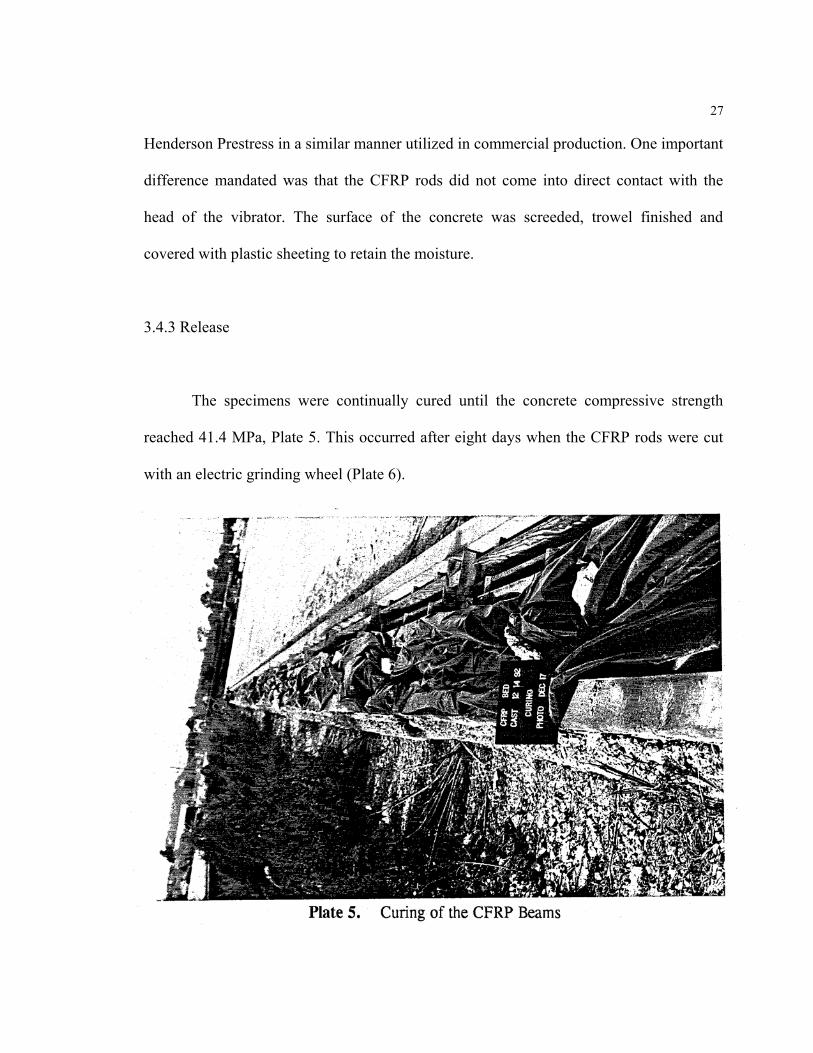
3.4.3 Release
The specimens were continually cured until the concrete compressive strength
reached 41.4 MPa, Plate 5. This occurred after eight days when the CFRP rods were cut
with an electric grinding wheel (Plate 6).
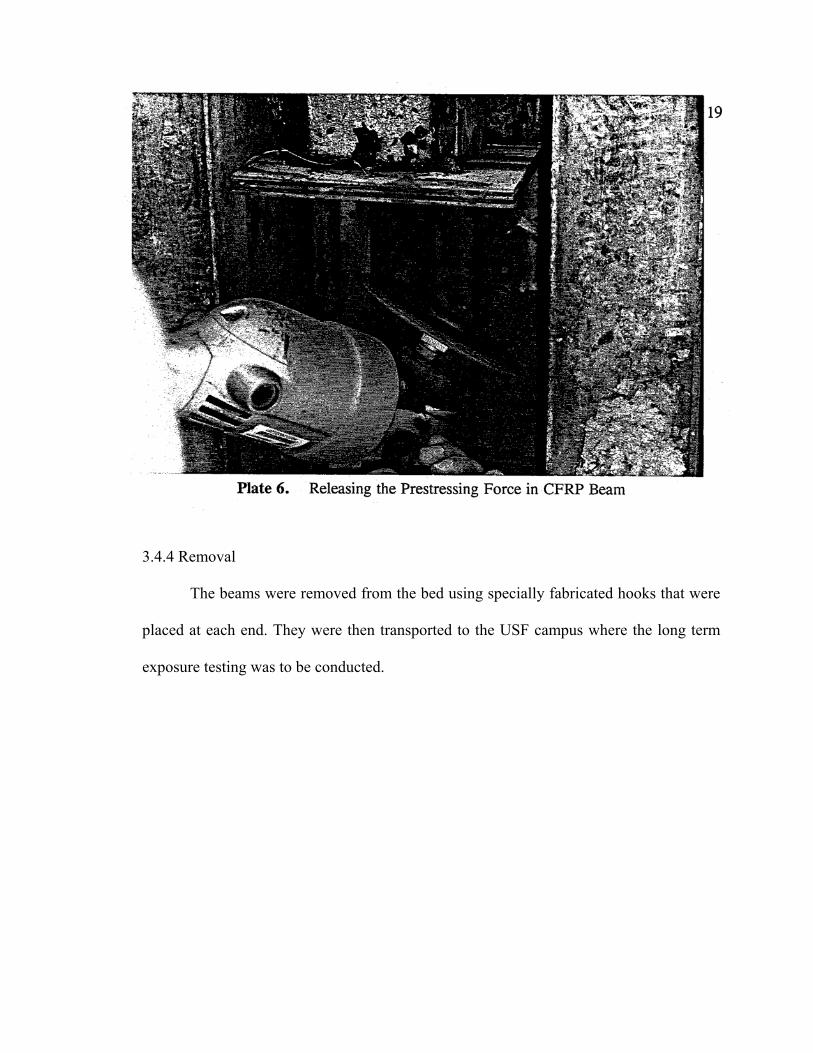
3.4.4 Removal
The beams were removed from the bed using specially fabricated hooks that were
placed at each end. They were then transported to the USF campus where the long term
exposure testing was to be conducted.
29
4. TRANSFER LENGTH
4.1 Introduction
In pretensioned beams, when the external jacking force is released the
prestressing tendons attempt to return to their normal unstressed position. This motion is
resisted by the bond developed between the concrete and the prestressing strand and it is
this bond that transfers the prestressing force to the concrete. This transfer occurs near
the end of the specimen over a distance referred to as the transfer length.
To determine the transfer length in CFRP prestressed concrete beams, five of the
thirty three specimens cast were instrumented while still in the prestressing bed. Load
cells were used to monitor the prestressing force at both live and dead ends and a
computerized data acquisition system recorded the strain variation at release.
The experimental program is briefly outlined in Section 4.2. The test results are
summarized in Section 4.3. The details of finite element analyses carried out to
determine transfer length and comparisons of predictions with test results are described
in Section 4.4.
4.2 Experimental Program
The logistics involved in outdoor experimentation limited the number of beams that
30
could be instrumented. The two most important constraints were the number of strain gage
channels available in the data acquisition system and the length of wiring needed. Based on
these considerations, only five of the thirty three specimens cast were instrumented.
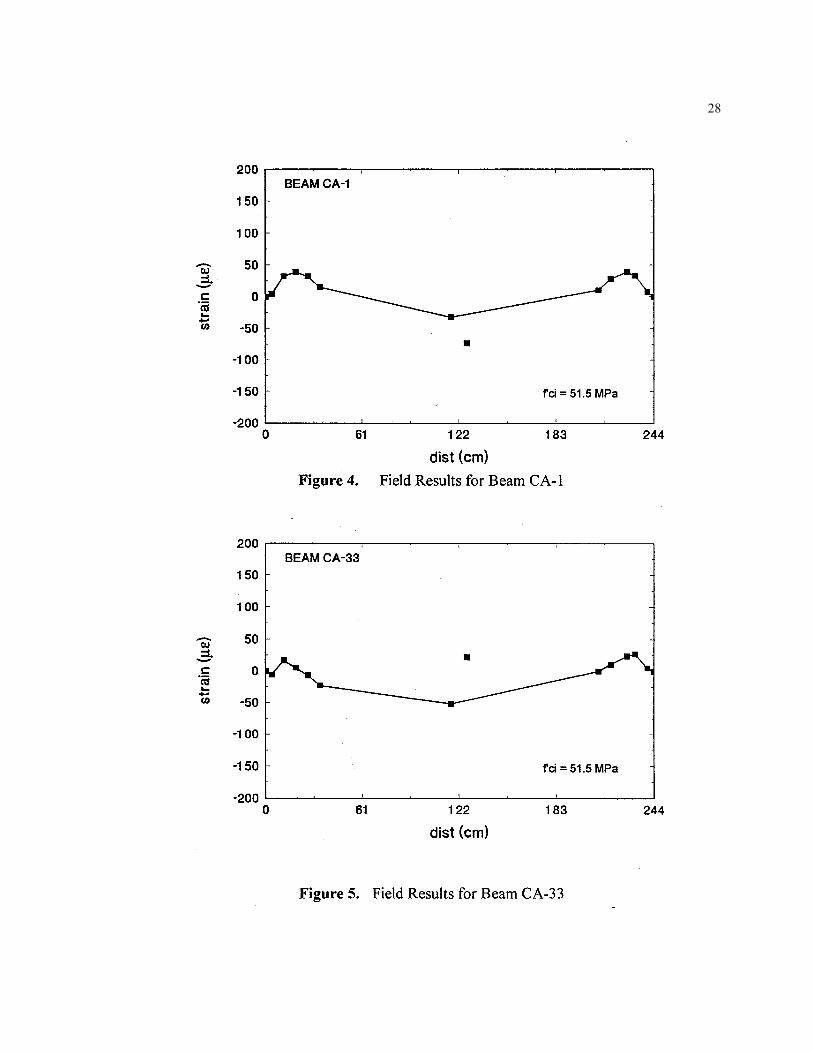
The basic strategy was to instrument two specimens, CA-1, CA-33, closest to the
live and dead ends respectively. Since load cells were mounted at both these ends, these
specimens enabled the accuracy of the measurements to be assessed and also provided an
index of the instantaneous elastic shortening losses.
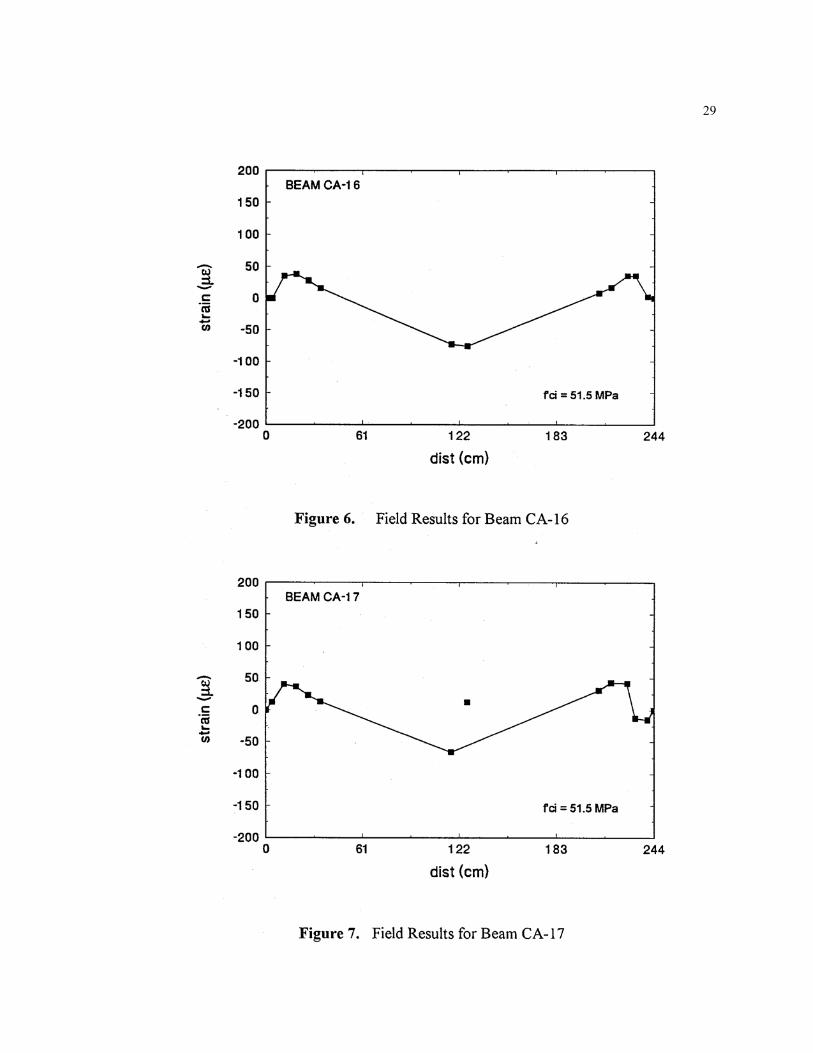
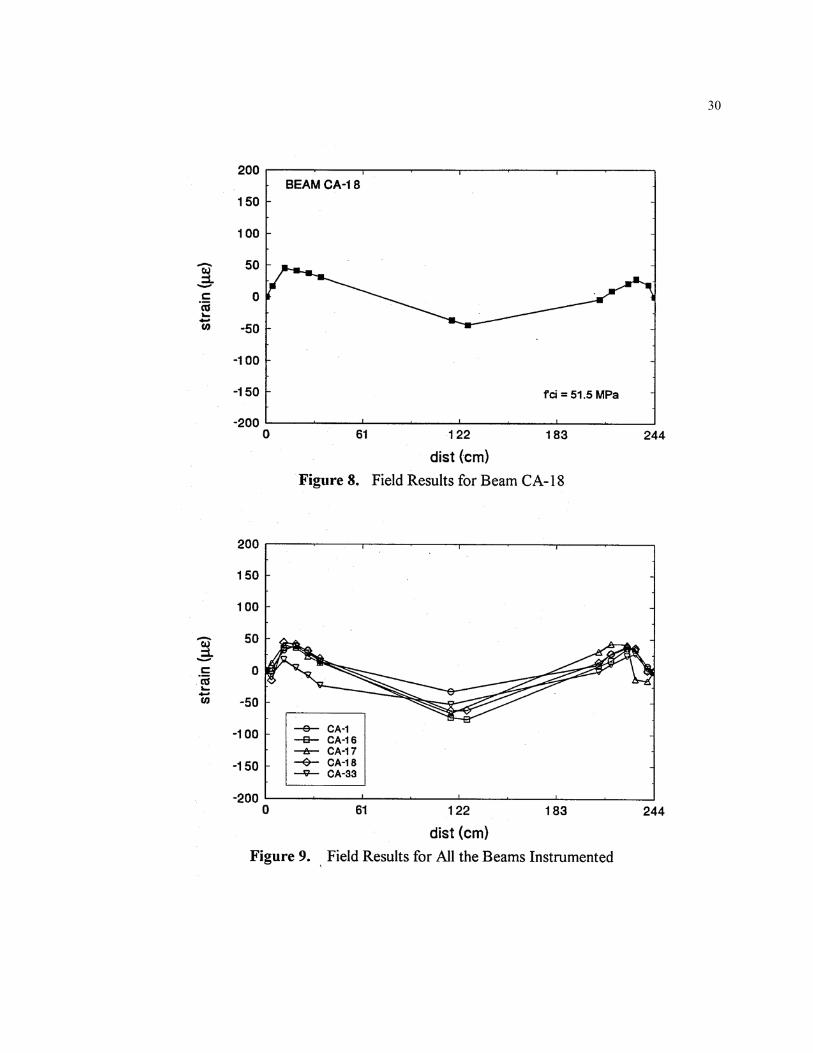
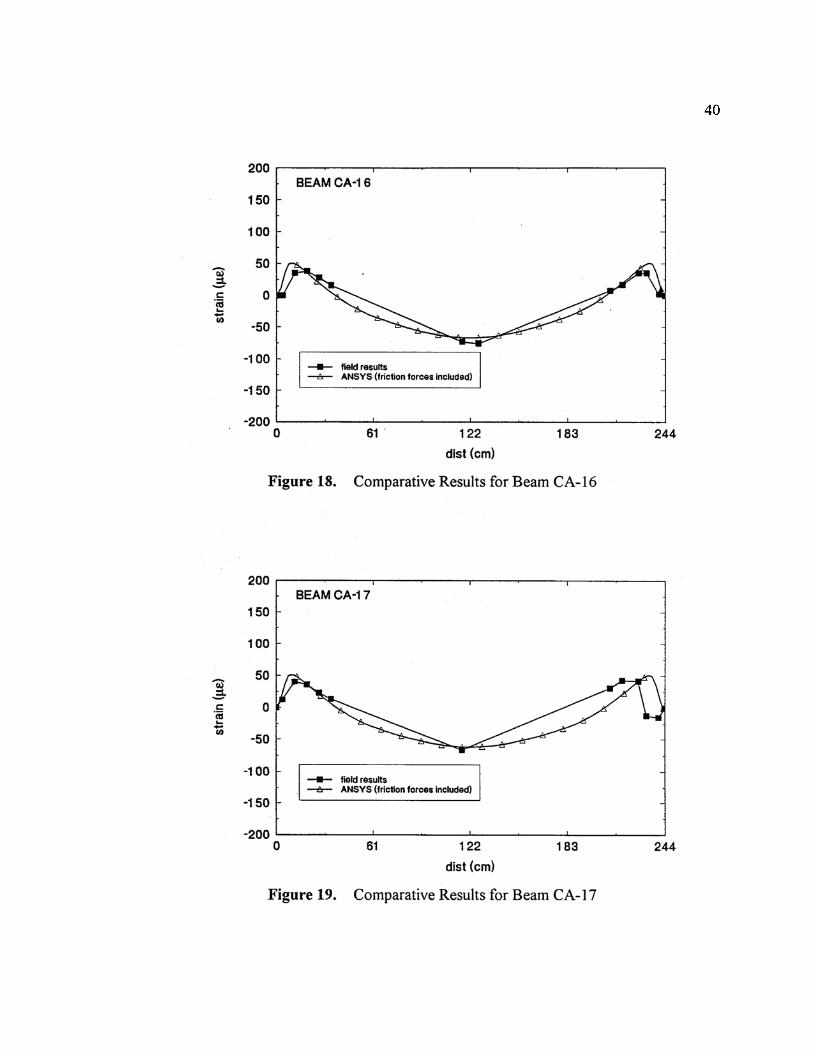
The three remaining specimens selected, CA-16, CA- 17and CA-18 were located
near the middle of the bed where more uniform conditions were expected. More
importantly, their proximity to the data acquisition system minimized the length of wiring
needed.
4.2.1 Instrumentation
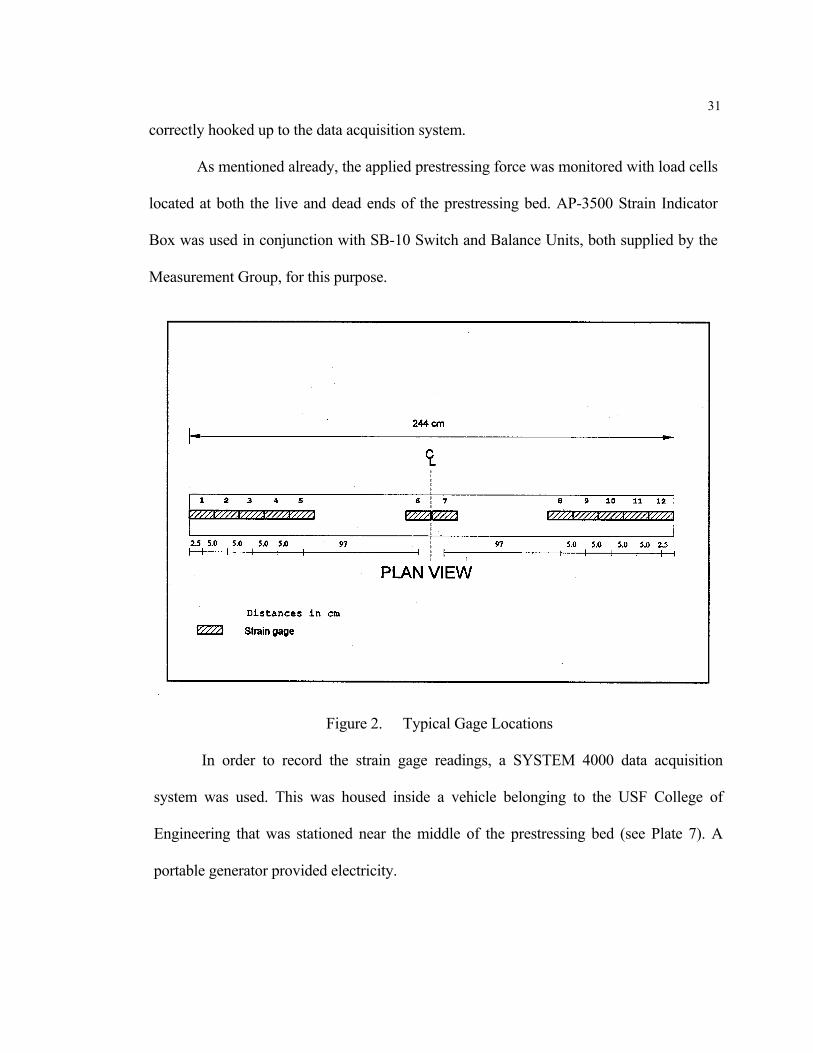
To capture the strain variation, five gages were affixed to the concrete at each end
spaced 5 cm. apart. This meant that strains were measured at 2.5 cm., 7.5 cm., 12.5 cm.,
17.5 cm. and 22.5 cm. In addition, two further gages were placed symmetrically 119.4 cm.
from each end. The arrangement of these gages is shown schematically in Figure 2.
The location of the gages on the top surface of the selected beams was carefully
marked and the surface ground to a smooth finish. The gages were positioned as carefully
as possible given that this operation was carried outdoors. A more complete description of
the installation procedure is given in Section 6.3. A total of sixty gages were attached. The
most difficult task was in tracking the individual wires from the strain gages so that they
31 correctly hooked up to the data acquisition system.
As mentioned already, the applied prestressing force was monitored with load cells
located at both the live and dead ends of the prestressing bed. AP-3500 Strain Indicator
Box was used in conjunction with SB-10 Switch and Balance Units, both supplied by the
Measurement Group, for this purpose.
Figure 2. Typical Gage Locations
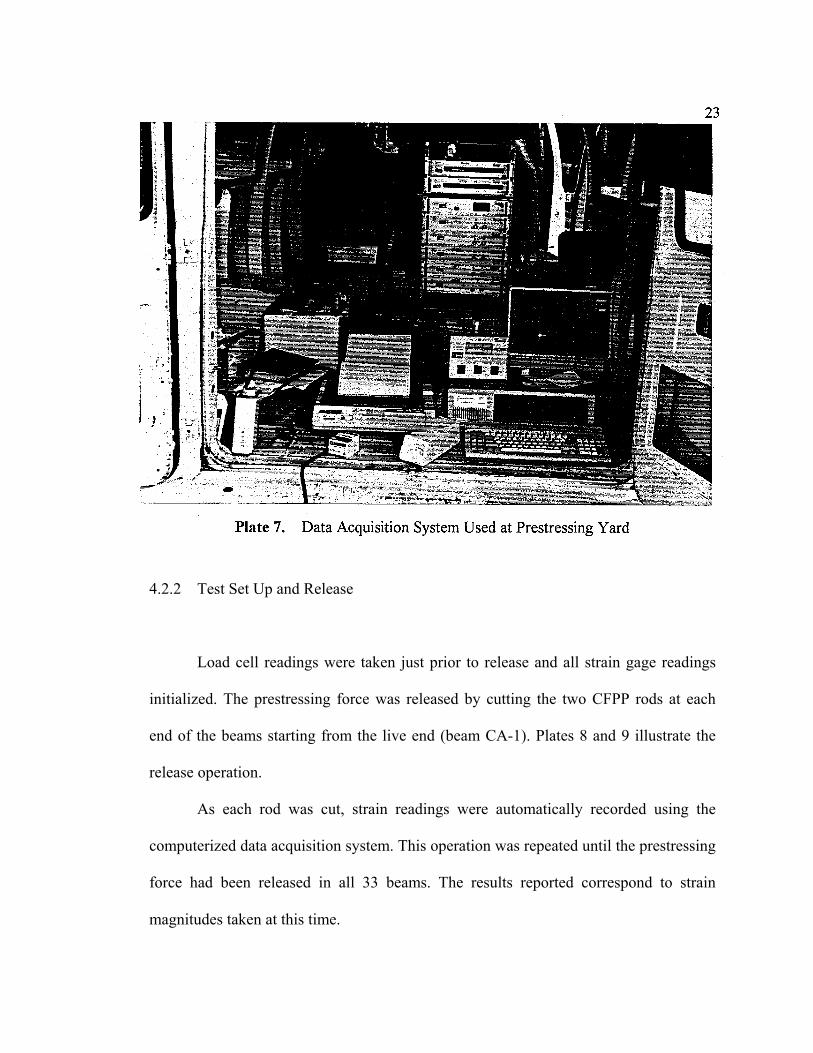
In order to record the strain gage readings, a SYSTEM 4000 data acquisition
system was used. This was housed inside a vehicle belonging to the USF College of
Engineering that was stationed near the middle of the prestressing bed (see Plate 7). A
portable generator provided electricity.
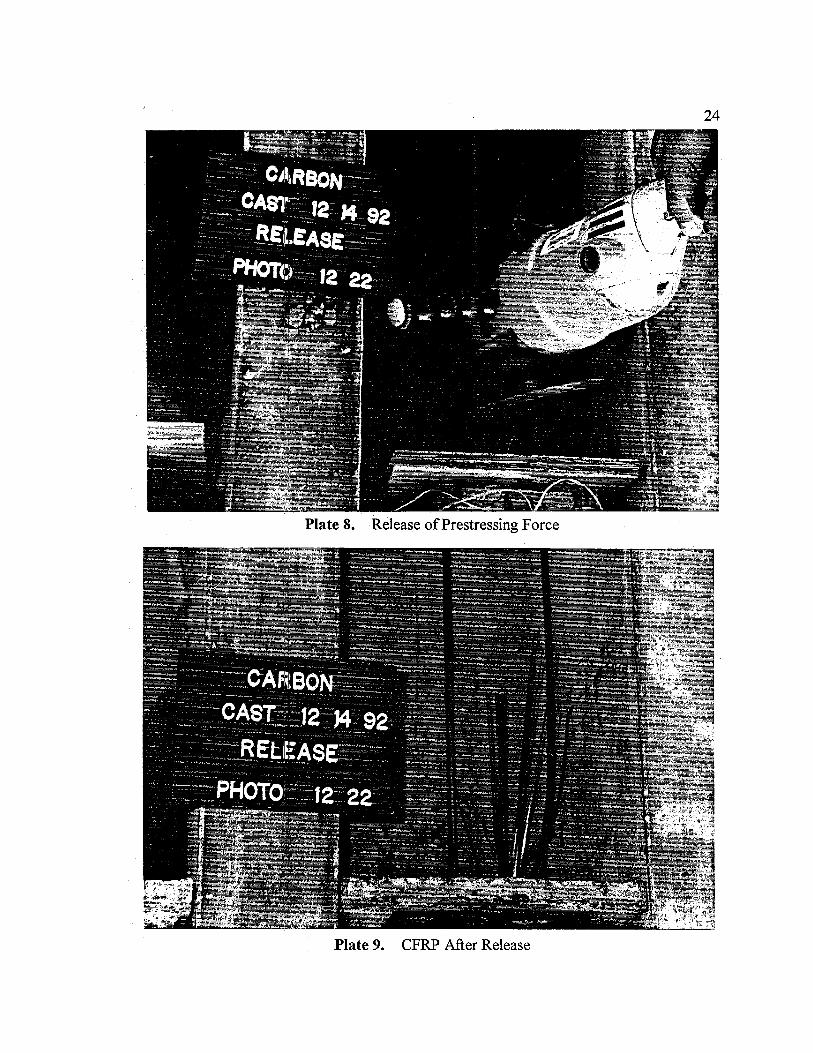
4.2.2 Test Set Up and Release
Load cell readings were taken just prior to release and all strain gage readings
initialized. The prestressing force was released by cutting the two CFPP rods at each
end of the beams starting from the live end (beam CA-1). Plates 8 and 9 illustrate the
release operation.
As each rod was cut, strain readings were automatically recorded using the
computerized data acquisition system. This operation was repeated until the prestressing
force had been released in all 33 beams. The results reported correspond to strain
magnitudes taken at this time.
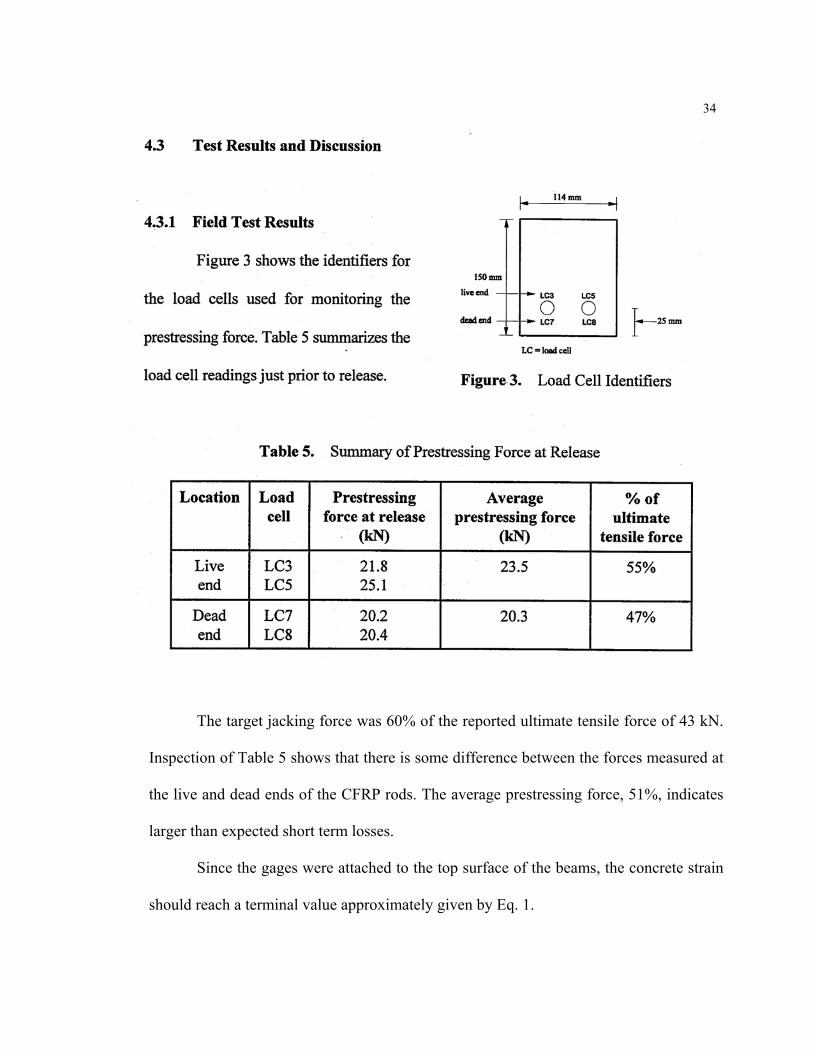
34
The target jacking force was 60% of the reported ultimate tensile force of 43 kN.
Inspection of Table 5 shows that there is some difference between the forces measured at
the live and dead ends of the CFRP rods. The average prestressing force, 51%, indicates
larger than expected short term losses.
Since the gages were attached to the top surface of the beams, the concrete strain
should reach a terminal value approximately given by Eq. 1.
35
SEM
SEPe
AEP +−
In Eq. 1, P is the prestressing force, M the bending moment due to self weight, A
the crosssectional area of the beam, S its section modulus and E the Young's Modulus for
concrete. Using P as 43.8 kN (Table 5), A as 174.2 cm2, S as 442.5 cm3 and E as 30.7 GPa
(the concrete strength was measured as 51.4 MPa ) based on Nilson's equation for high
strength concrete, the strain value comes out as 81 ge in tension near the ends where self
weight bending moments are minimal. At mid-span, the bending moment is at its highest
and induces a compressive strain of 22µε, making the total strain 59µε in tension.
The results summarizing recorded concrete strains are presented in Table 6
(tension positive). Plots of the strain variation along the length of the beam for each of the
five instrumented beams are shown in Figures 4-8. A comparative plot of all the results
appears in Figure 9.
Inspection of Figures 4-9 shows that although the strain variation is more or less
symmetrical, it does not agree with the expected distribution shown in Figure 10
determined from Eq. 1. Moreover, the recorded maximum strain of 44ge (see Table 6) is
lower than the theoretical value of 81 µε.
Because the strain variation was similar for all the five beams tested, and in five
other AFRP specimens tested on the same day, Rosas 1995, instrumentation error was
ruled out. Instead, it was hypothesized that when the prestressing force was released, the
upward movement of the beams was impeded by frictional type forces that developed
between the
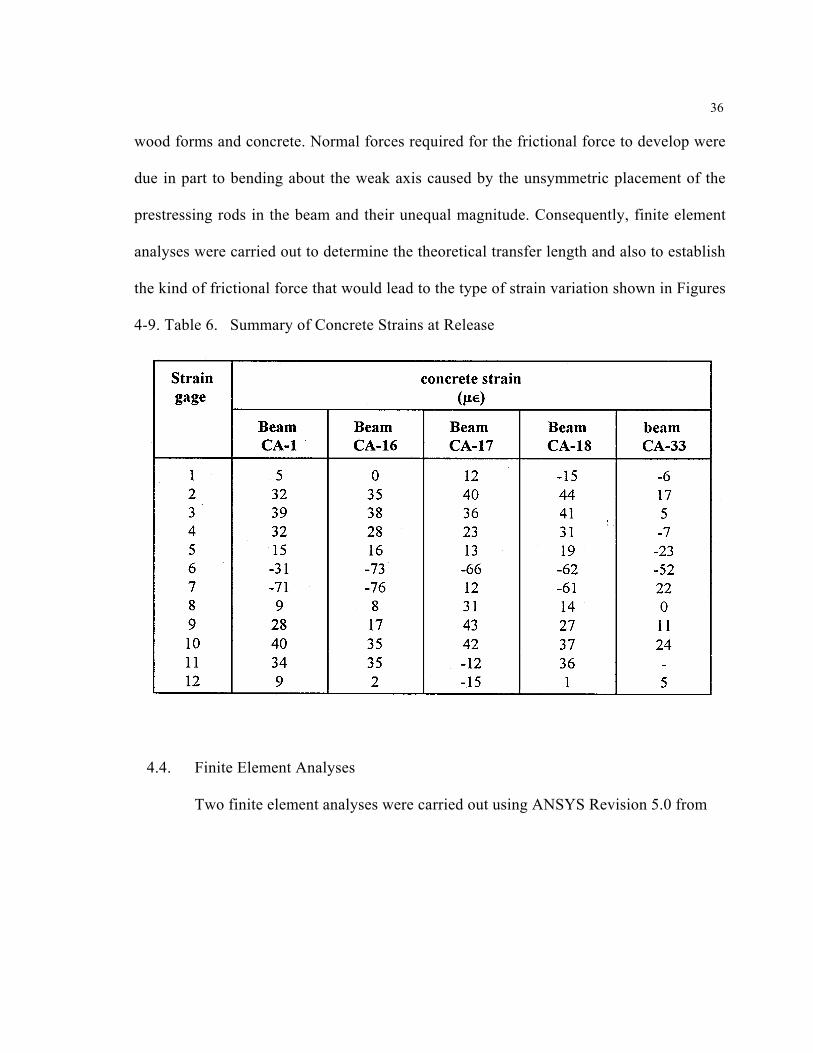
36
wood forms and concrete. Normal forces required for the frictional force to develop were
due in part to bending about the weak axis caused by the unsymmetric placement of the
prestressing rods in the beam and their unequal magnitude. Consequently, finite element
analyses were carried out to determine the theoretical transfer length and also to establish
the kind of frictional force that would lead to the type of strain variation shown in Figures
4-9. Table 6. Summary of Concrete Strains at Release
4.4. Finite Element Analyses
Two finite element analyses were carried out using ANSYS Revision 5.0 from
28
29
30
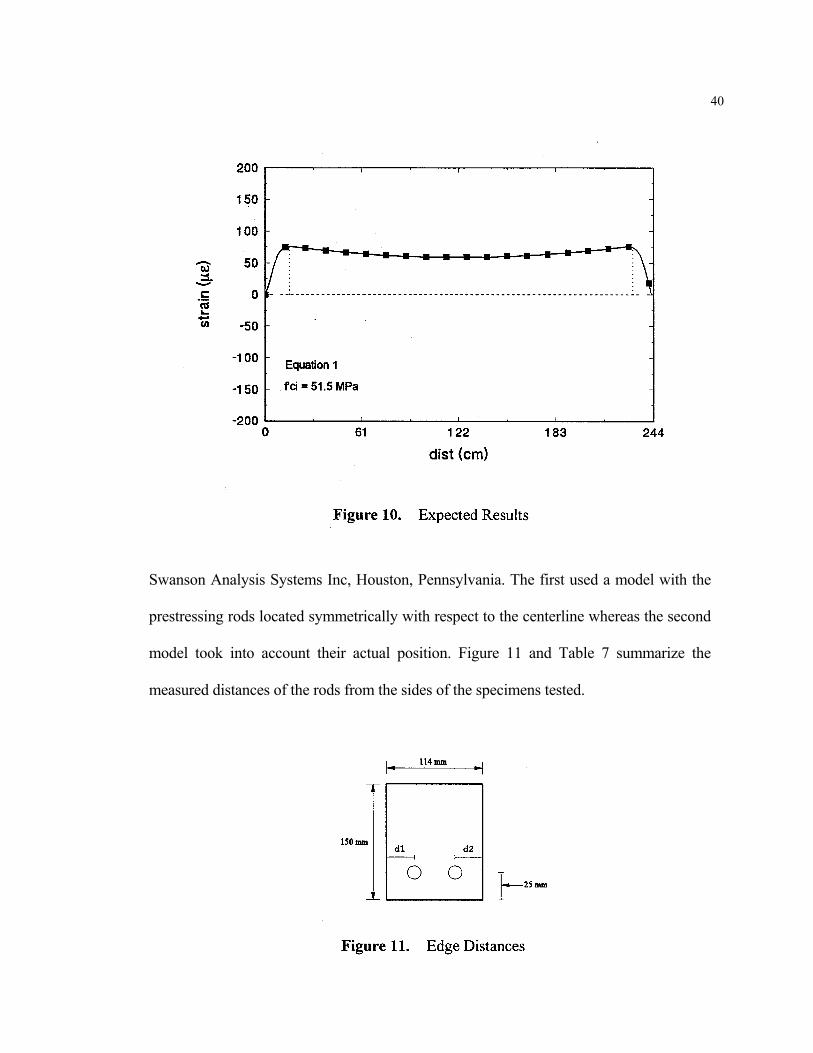
40
Swanson Analysis Systems Inc, Houston, Pennsylvania. The first used a model with the
prestressing rods located symmetrically with respect to the centerline whereas the second
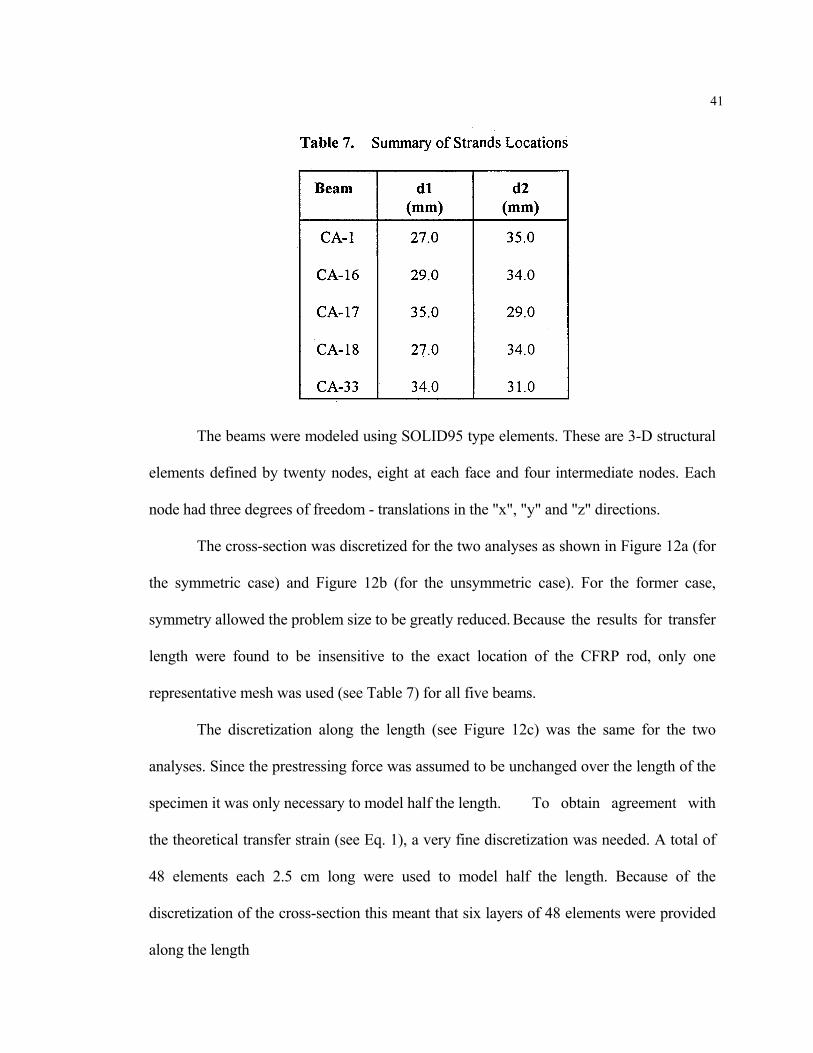
model took into account their actual position. Figure 11 and Table 7 summarize the
measured distances of the rods from the sides of the specimens tested.
41
The beams were modeled using SOLID95 type elements. These are 3-D structural
elements defined by twenty nodes, eight at each face and four intermediate nodes. Each
node had three degrees of freedom - translations in the "x", "y" and "z" directions.
The cross-section was discretized for the two analyses as shown in Figure 12a (for
the symmetric case) and Figure 12b (for the unsymmetric case). For the former case,
symmetry allowed the problem size to be greatly reduced. Because the results for transfer
length were found to be insensitive to the exact location of the CFRP rod, only one
representative mesh was used (see Table 7) for all five beams.
The discretization along the length (see Figure 12c) was the same for the two
analyses. Since the prestressing force was assumed to be unchanged over the length of the
specimen it was only necessary to model half the length. To obtain agreement with
the theoretical transfer strain (see Eq. 1), a very fine discretization was needed. A total of
48 elements each 2.5 cm long were used to model half the length. Because of the
discretization of the cross-section this meant that six layers of 48 elements were provided
along the length
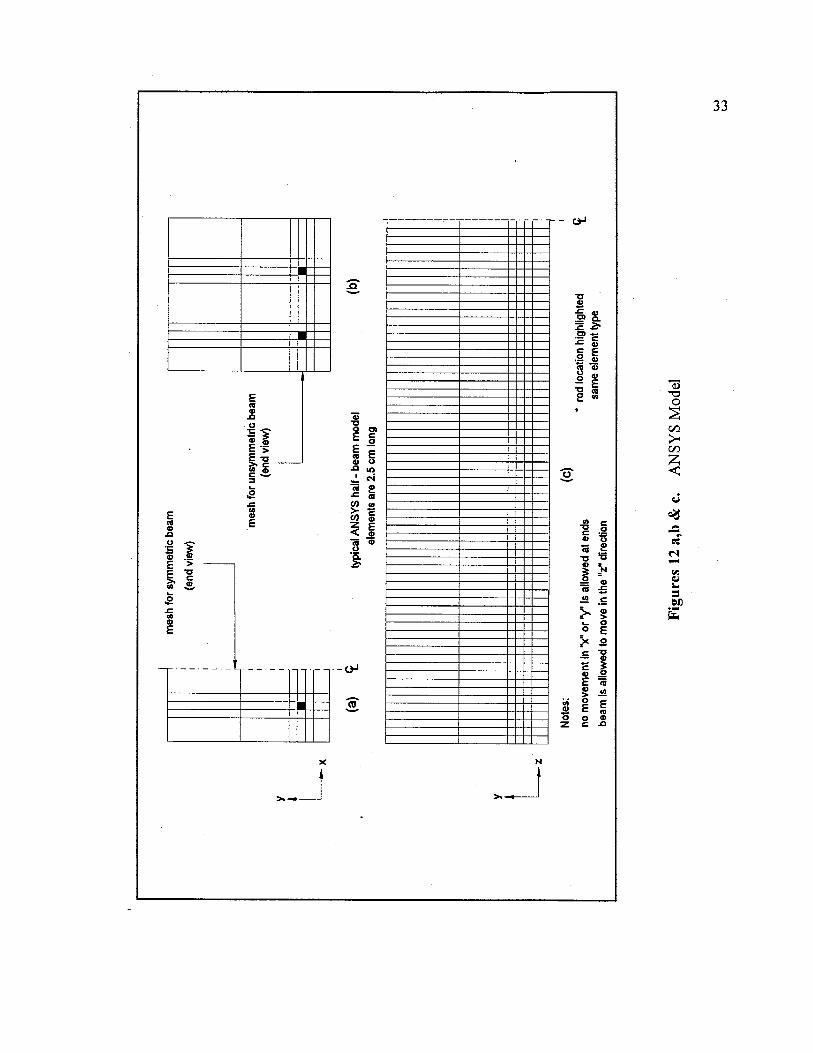
43
(see Figure 12c). Their height varied as shown in Figure 12a,b. A total of 2,592 elements
and 12,817 nodes were used in the discretization. In the cross-section, 193 nodes were
present.
Since prestress forces are transferred to the concrete by the Hoyer effect, the
Poisson's ratio of the two materials is an important variable. For concrete, a value of 0.2
given in the AASHTO specifications was used. For CFRP, the values were different in the
axial and radial directions. In the axial direction, the CFRP value of 0.28 was used. In the
radial directions, the resin value of 0.35 was used.
The elastic modulus of concrete was determined using Nilson's equations
corresponding to a concrete strength of 51.5 MPa. This gave a value of 30.7 GPa. For CFRP,
the calculated modulus of 109 GPa was used in the longitudinal direction. In the transverse
direction, the resin modulus of 4 GPa was assumed.
To determine the theoretical transfer length ideal conditions were assumed. Thus, the
beam was free to move longitudinally because of elastic shortening (z) and upward (y)
because of eccentricity of the prestressing force. However, the ends were assumed to be
simply supported and restrained to prevent out of plane movement (x direction).
The prestressing load was equally distributed among each of the corners of the
element(s) representing CFRP (see darkened element(s) in Figures 12a,b). Details of the loads,
material properties and boundary conditions as input may be found in Sukumar, 1995.
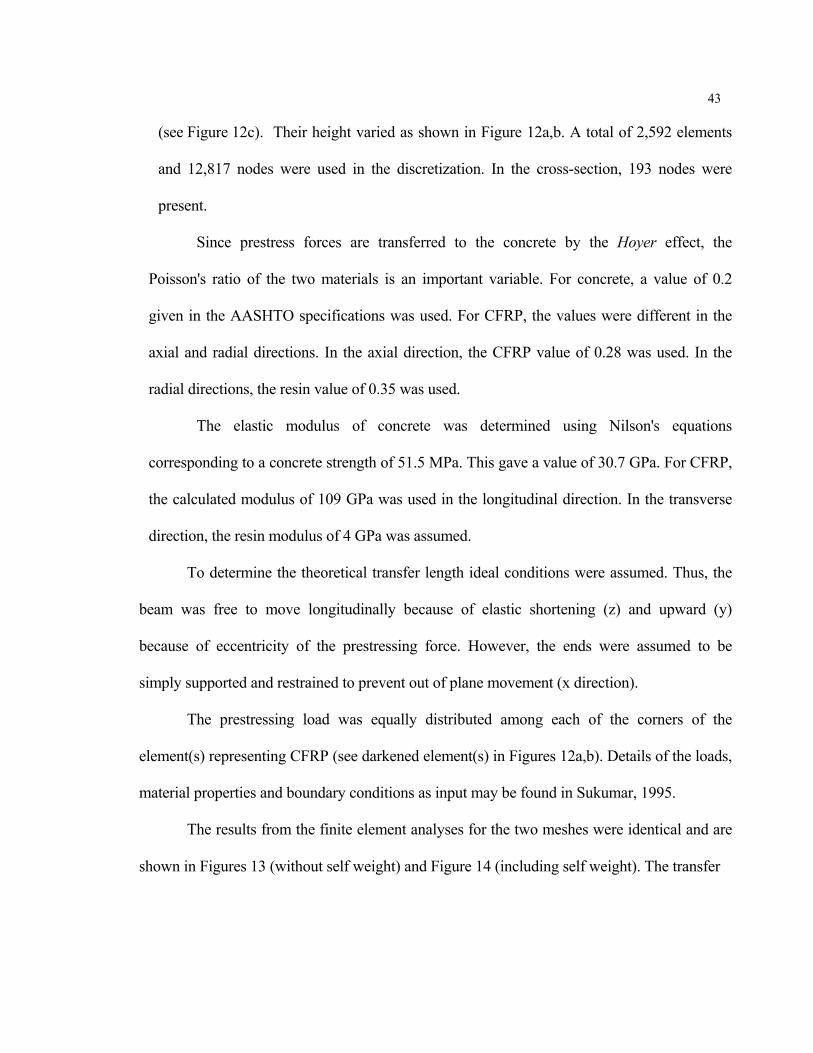
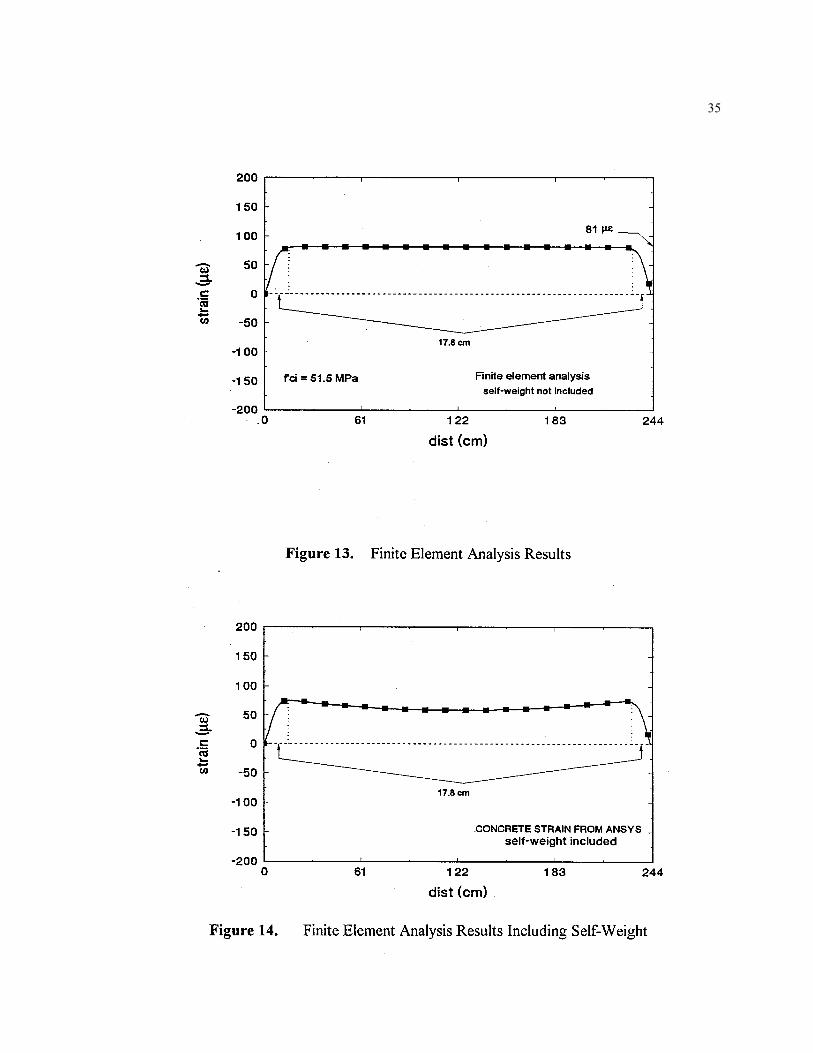
The results from the finite element analyses for the two meshes were identical and are
shown in Figures 13 (without self weight) and Figure 14 (including self weight). The transfer
35
45
length predicted is about 17.8 cm as indicated in these figures. The concrete strain
corresponding to transfer of 81µε is identical to that obtained from Eq. 1 neglecting self-
weight. This suggests that the finite element discretization was satisfactory.
4.4.1 Friction Forces
As noted earlier, the discrepancy between the field results (Figures 4-9) and expected
results (Figure 10) was attributed to possible friction forces that impeded the upward
movement of the beam at transfer. In view of this, finite element analyses were carried out.
Because the frictional forces were believed to be caused by bending about the weak
axis, only movement of the surface pressing against the wood, i.e. in tension, was
restricted, The face moving away from the formwork, i.e. the compression face, was
unaffected. Moreover, only apart of the tension face actually in contact with the form
would be subjected to frictional forces.
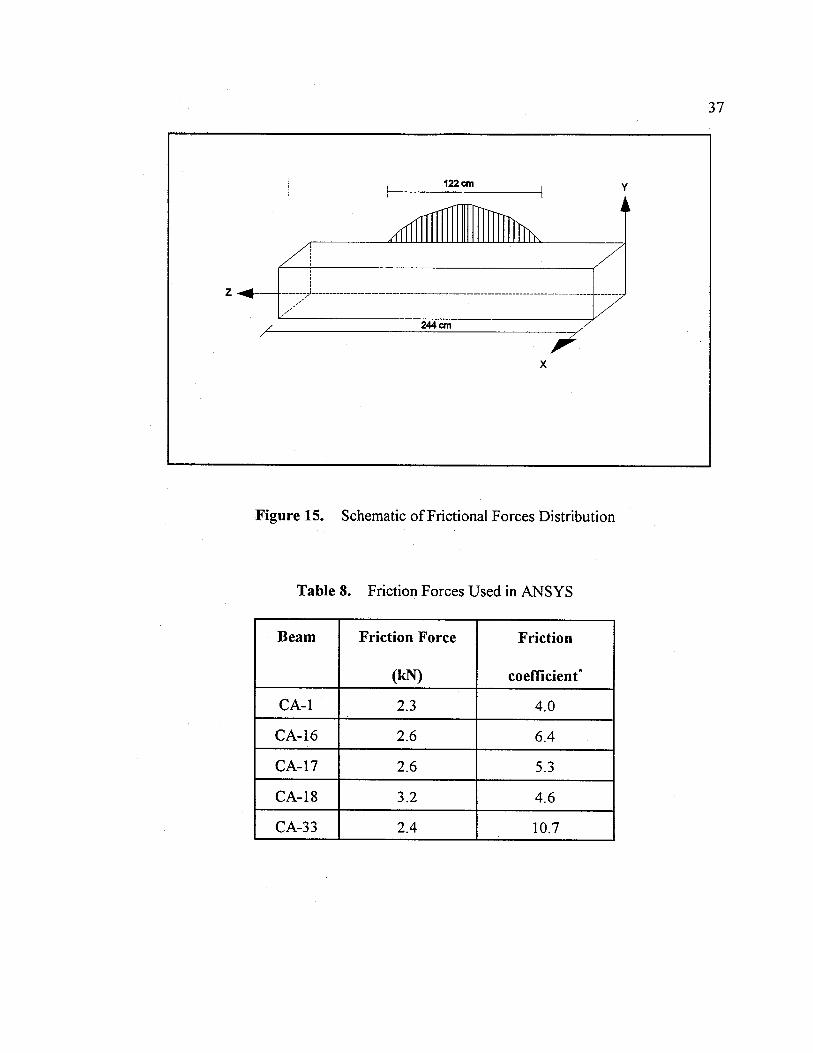
Based on the above considerations, the frictional force was assumed to have a
parabolic distribution that extended from quarter point to quarter point. This is consistent
with the upward movement which is greater in the middle and smaller near the ends. This
force was additionally assumed to act on only one face as shown in Figure 15.
Trial and error was used to obtain correlation between test results and predictions from
ANSYS. Since the frictional force was not identical in each beam, the magnitude of this
force varied from beam to beam. Table 8 summarizes the forces used in the analysis. These
47
range from 2.3 kN to 3.2 kN. Using a very simplified model, this suggests a large friction
coefficient, Sukumar 1995.
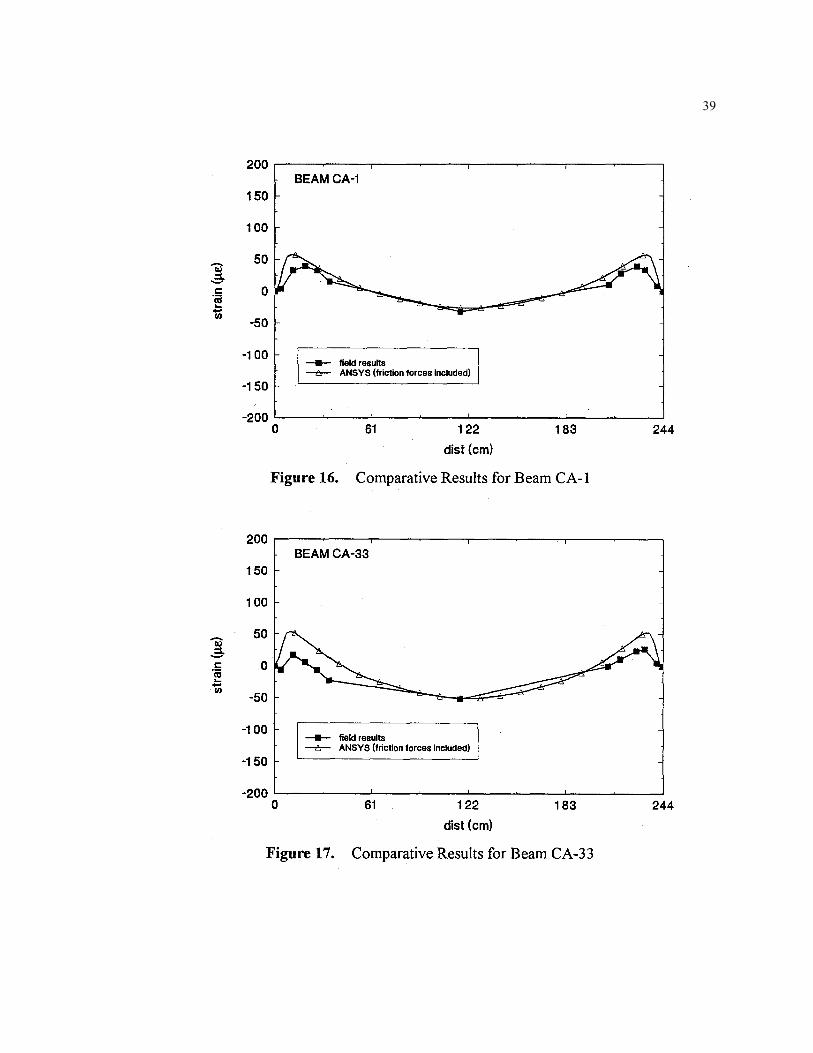
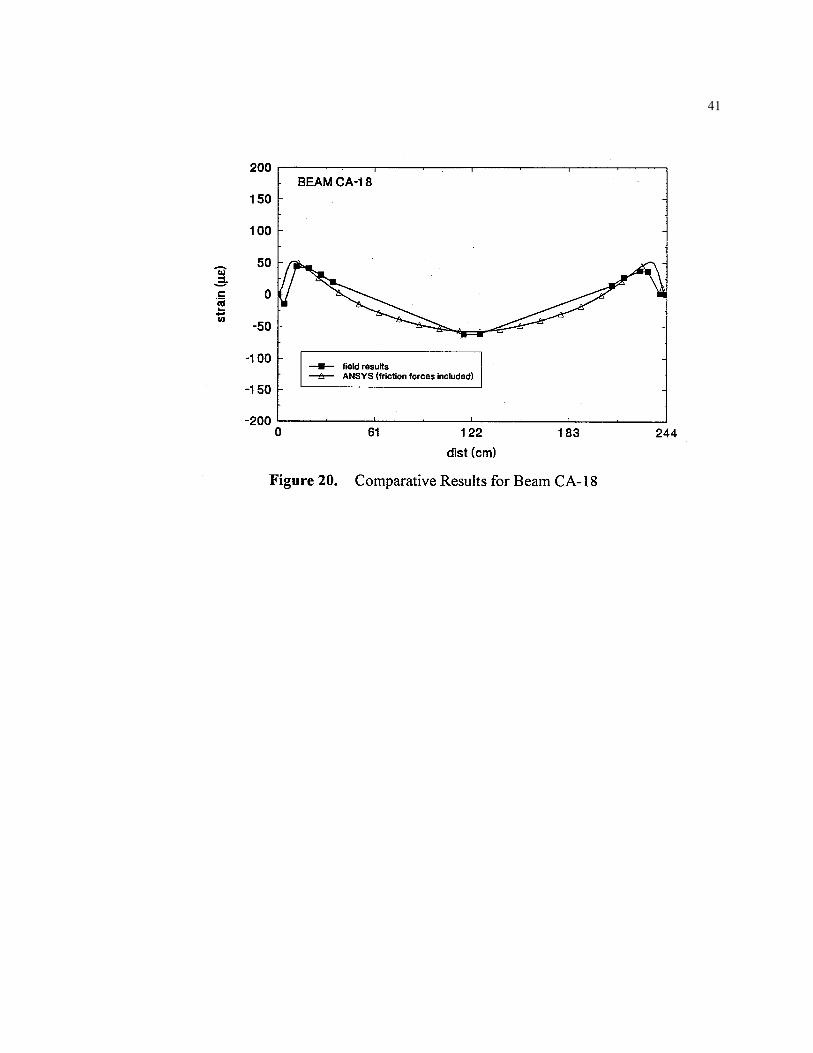
Figures 16-20 compare the predictions from finite element analysis incorporating
frictional forces and test results. The overall agreement is close and appears to confirm the
validity of the hypothesis.
39
41

51
5. EFFECTIVE PRESTRESS
5.1 Introduction
This chapter analyses pre-cracking load results to determine the effective prestress.
The beams cast on December 14, 1992 were pre-cracked three weeks later on January 6,
1993. Since three beams CA 1, CA 10 and CA 20 were damaged during removal from the
bed, only thirty beams were pre-cracked. Section 5.2 gives the setup for the precracking.
The calculation of-the effective prestress is summarized in Section 5.3.
5.2 Test Procedure
The beams were pre-cracked at the prestressing yard where the beams were poured.
Since no cylinders were tested during pre-cracking, the concrete strength was extrapolated
from the concrete strengths at transfer and the initial controls tests carried in February
1993, Mehta & Monteiro 1993. This indicated that the concrete strength would be
approximately 92% of the 28 day strength giving a strength of 58 MPa.
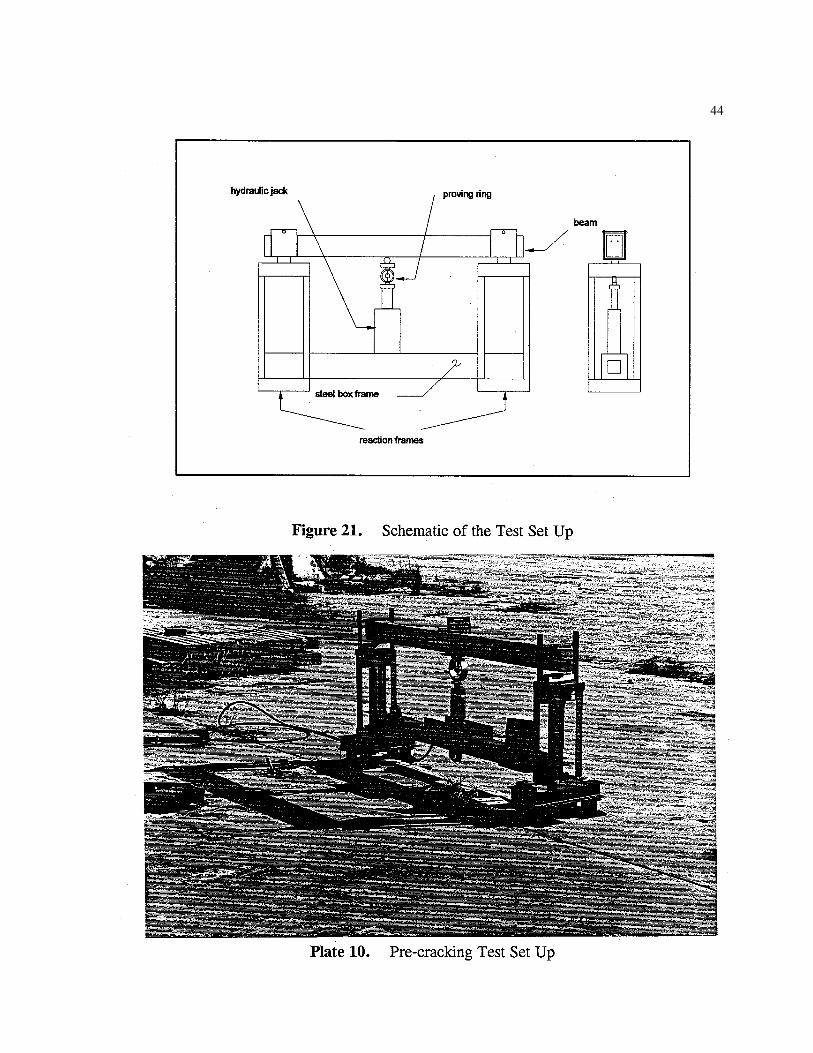
The outdoor test set-up used is shown in Figure 21. The beams were placed upside
down (span of 2.29 m) in a temporary metal frame so that the bottom surface, i.e. the pre-
compressed tension zone was exposed. This meant that any crack could be immediately
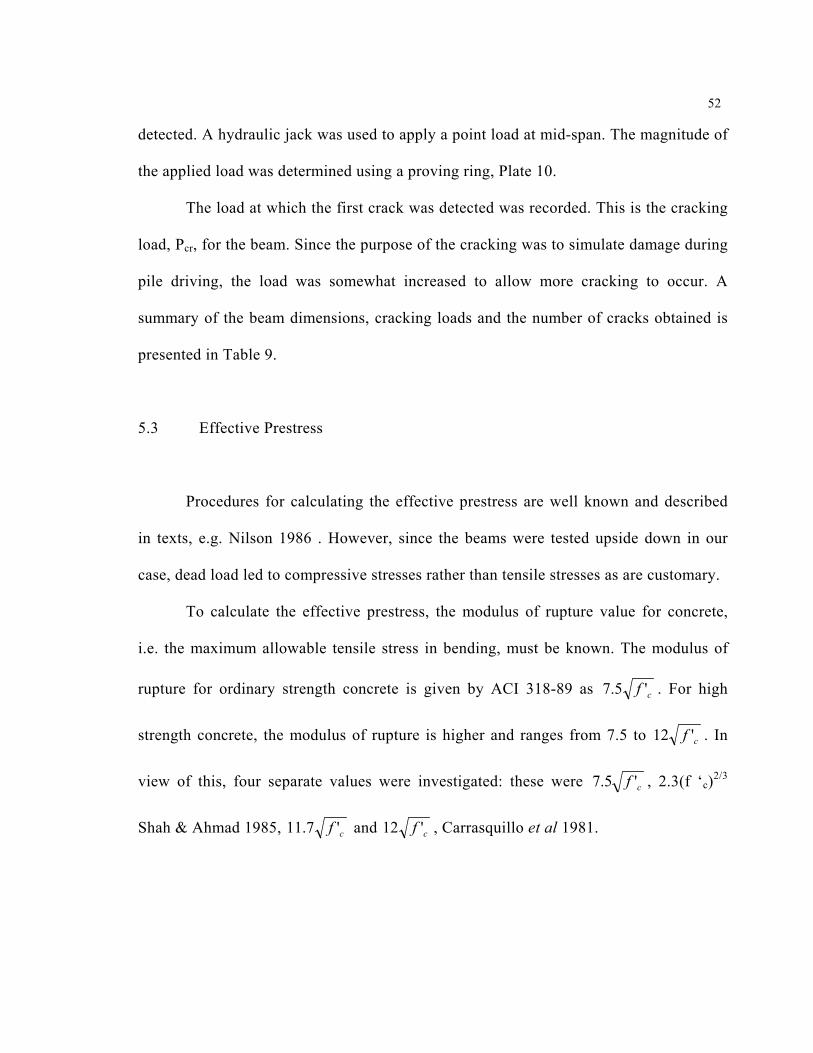
52
detected. A hydraulic jack was used to apply a point load at mid-span. The magnitude of
the applied load was determined using a proving ring, Plate 10.
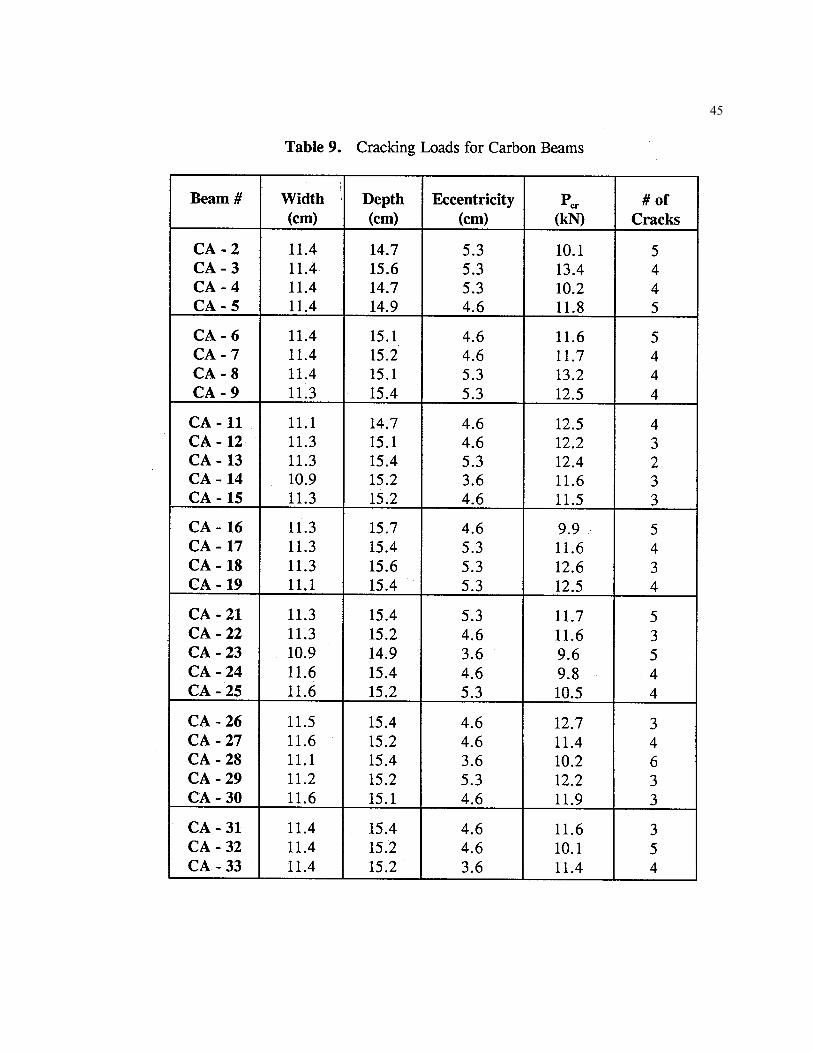
The load at which the first crack was detected was recorded. This is the cracking
load, Pcr, for the beam. Since the purpose of the cracking was to simulate damage during
pile driving, the load was somewhat increased to allow more cracking to occur. A
summary of the beam dimensions, cracking loads and the number of cracks obtained is
presented in Table 9.
5.3 Effective Prestress
Procedures for calculating the effective prestress are well known and described
in texts, e.g. Nilson 1986 . However, since the beams were tested upside down in our
case, dead load led to compressive stresses rather than tensile stresses as are customary.
To calculate the effective prestress, the modulus of rupture value for concrete,
i.e. the maximum allowable tensile stress in bending, must be known. The modulus of
rupture for ordinary strength concrete is given by ACI 318-89 as cf '5.7 . For high
strength concrete, the modulus of rupture is higher and ranges from 7.5 to cf '12 . In
view of this, four separate values were investigated: these were cf '5.7 , 2.3(f ‘c)2/3
Shah & Ahmad 1985, cf '7.11 and cf '21 , Carrasquillo et al 1981.
44
45
46
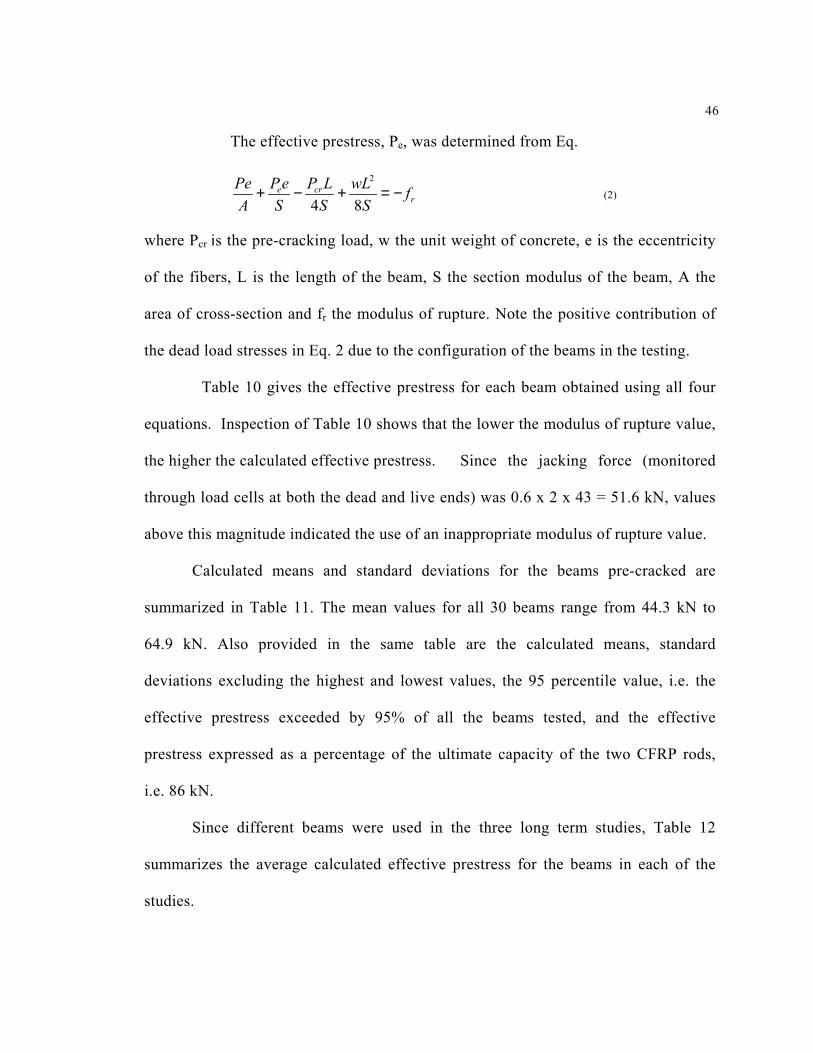
The effective prestress, Pe, was determined from Eq.
rcre f
SwL
SLP
SeP
APe −=+−+
84
2
(2)
where Pcr is the pre-cracking load, w the unit weight of concrete, e is the eccentricity
of the fibers, L is the length of the beam, S the section modulus of the beam, A the
area of cross-section and fr the modulus of rupture. Note the positive contribution of
the dead load stresses in Eq. 2 due to the configuration of the beams in the testing.
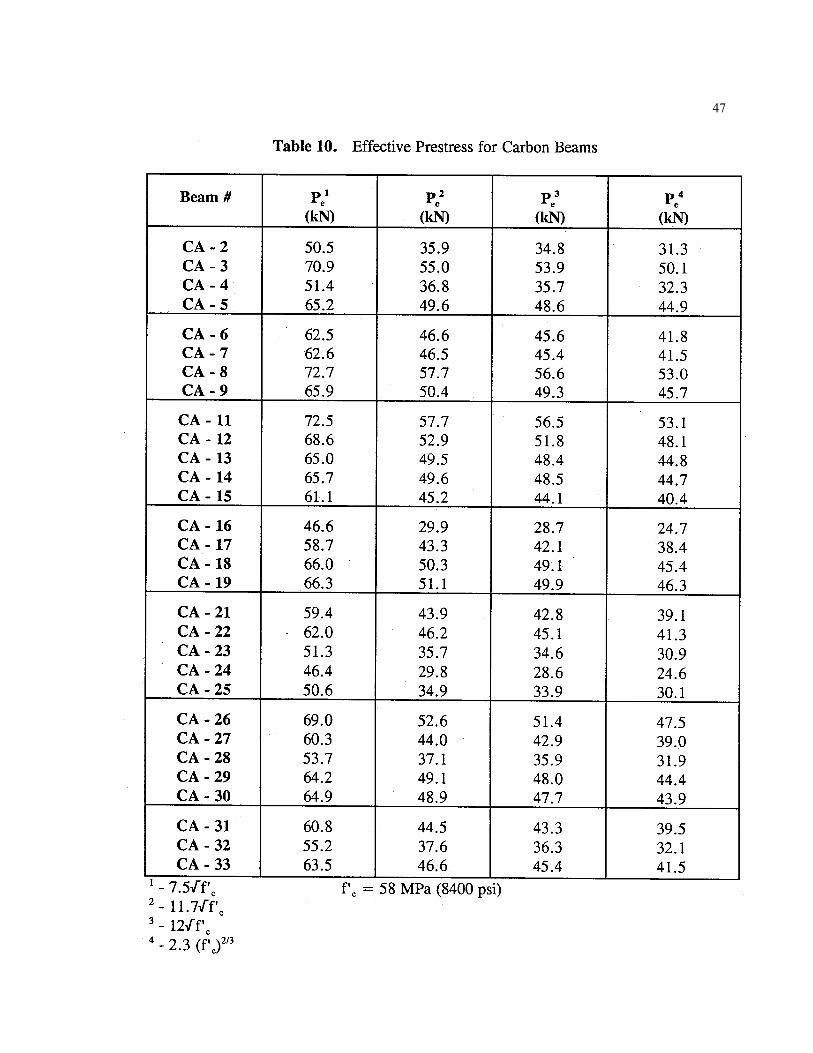
Table 10 gives the effective prestress for each beam obtained using all four
equations. Inspection of Table 10 shows that the lower the modulus of rupture value,
the higher the calculated effective prestress. Since the jacking force (monitored
through load cells at both the dead and live ends) was 0.6 x 2 x 43 = 51.6 kN, values
above this magnitude indicated the use of an inappropriate modulus of rupture value.
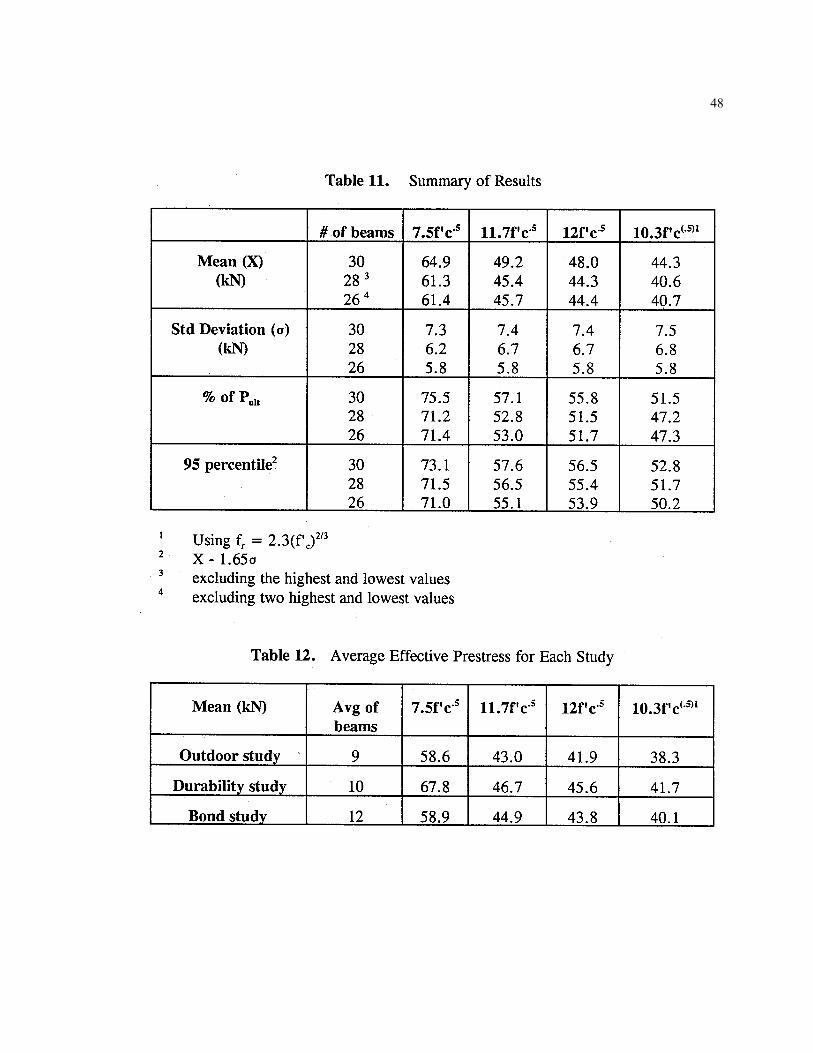
Calculated means and standard deviations for the beams pre-cracked are
summarized in Table 11. The mean values for all 30 beams range from 44.3 kN to
64.9 kN. Also provided in the same table are the calculated means, standard
deviations excluding the highest and lowest values, the 95 percentile value, i.e. the
effective prestress exceeded by 95% of all the beams tested, and the effective
prestress expressed as a percentage of the ultimate capacity of the two CFRP rods,
i.e. 86 kN.
Since different beams were used in the three long term studies, Table 12
summarizes the average calculated effective prestress for the beams in each of the
studies.
47
48

58
It may be seen that the effective prestress is lowest in the beams selected for the outdoor
study and highest for those selected for the durability study.
5.4 Recommendations
The initial prestress determined from the transfer length was estimated as 51% of
the ultimate force (Table 5). Since the beams were pre-cracked only two weeks later, the
effective prestress should also be around this value. Based on this, the modulus of rupture
of cf '3.10 gives the most sensible values. If the worst two results are omitted, then the
modulus of rupture value of cf '12 also gives acceptable results.
59
6. ULTIMATE CAPACITY TEST SETUP
6.1 Introduction
This chapter presents information on the setup for the ultimate bending capacity tests
that were part of the outdoor exposure, durability and bond studies. Instrumentation is
discussed in Section 6.2 and the test setup described in Section 6.3. The test procedure is
outlined in Section 6.4.
6.2 Instrumentation
6.2.1 Concrete Gages
To monitor the concrete strain, four electrical resistance gages model PL-60-1Lfrom
Texas Measurements were attached to the top surface of each one of the specimens. RP-2,
which is a two component (main agent and hardener) polyester adhesive manufactured by
Tokyo Kenkyujo Co. Ltd., Tokyo, Japan, was used to attach the gages to the concrete.
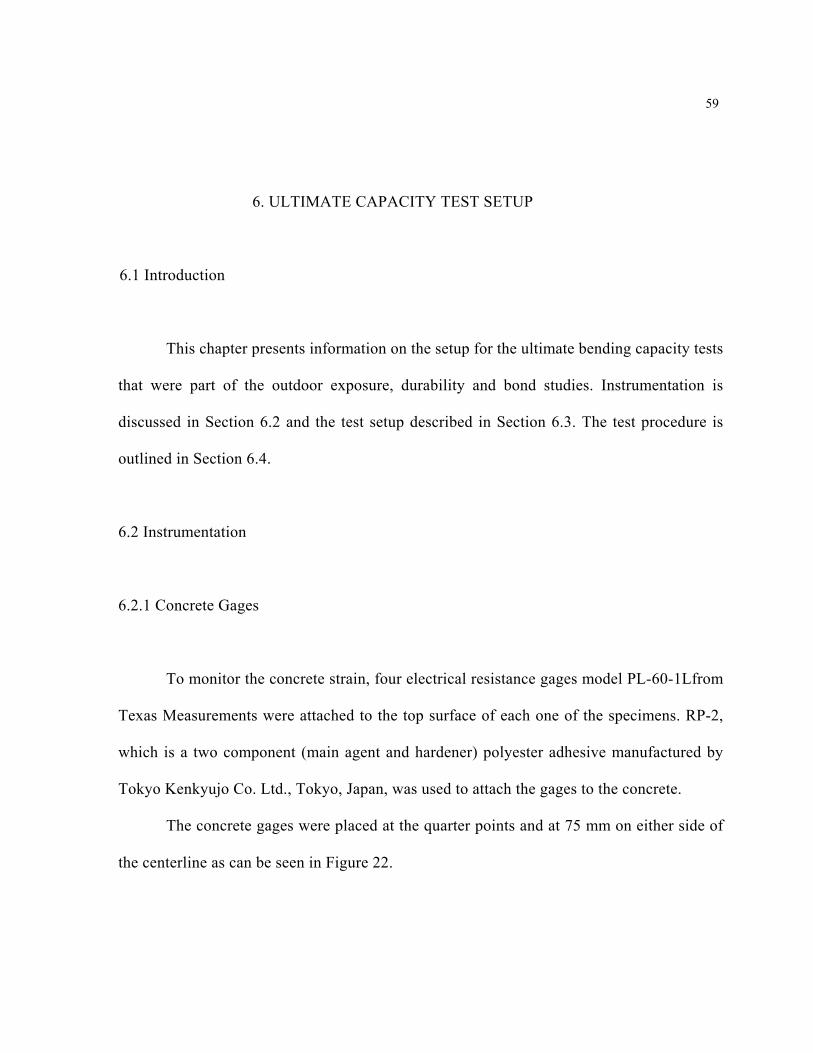
The concrete gages were placed at the quarter points and at 75 mm on either side of
the centerline as can be seen in Figure 22.
60
Prior to installation of these surface strain gages, their location was smoothened
and wiped using gauze moistened with acetone. The adhesive was then mixed in the
recommended proportion (98:2) and applied to the back of each gage and to the ground
surface. The gage was then carefully set in place and covered with a Teflon sheet
provided by the manufacturer to help remove any air bubbles. Duct tape was used to
cover and apply pressure to the gage. A voltmeter was then used to verify an expected
reading of 120 mΩ.
61
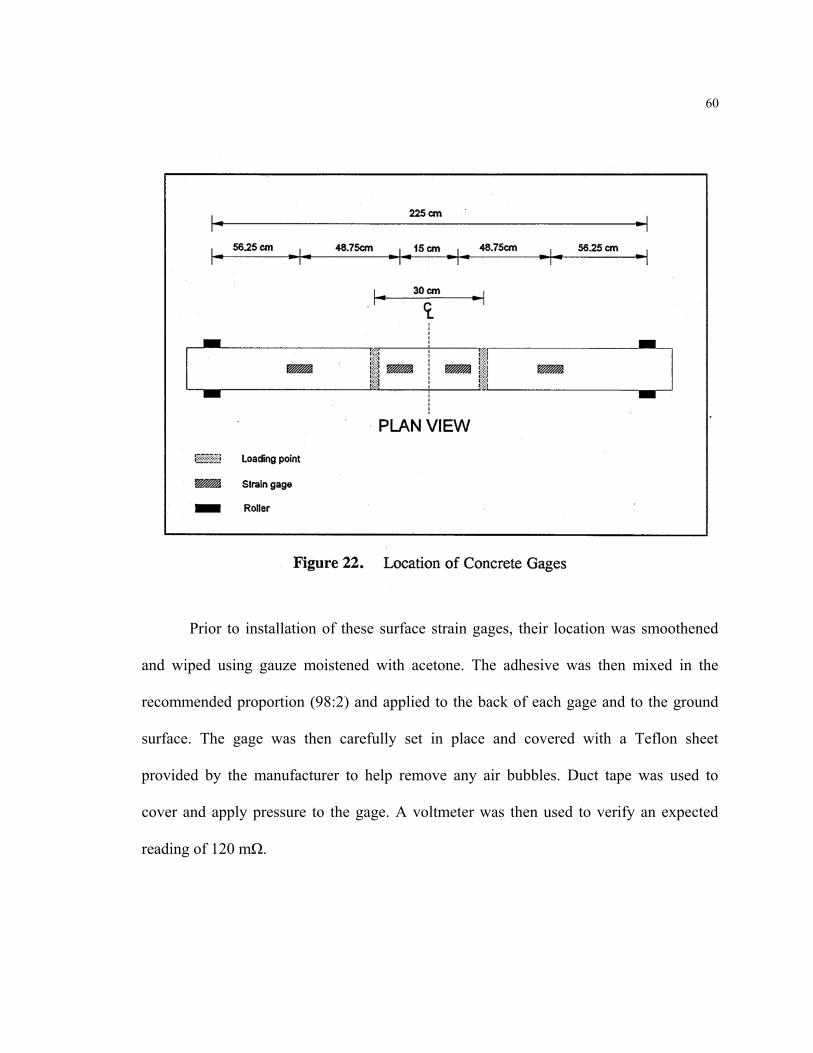
6.2.2 Linear Variable Differential Transducer (LVDT)
Three LVDTs, model CDP-50 from Texas Measurements with a maximum stroke
of 50 mm, were placed under the beams at the quarter points and midspan to measure the
vertical deflection due to the applied load. Figure 23 shows the location of the LVDTs.
6.2.3 Load Cells
The applied load and reactions were monitored by two different types of load
cells. The applied load was measured with a load cell rated at a capacity of 22.2 kN. The
62
reactions were measured with two load cells rated at a capacity of 222 kN each.
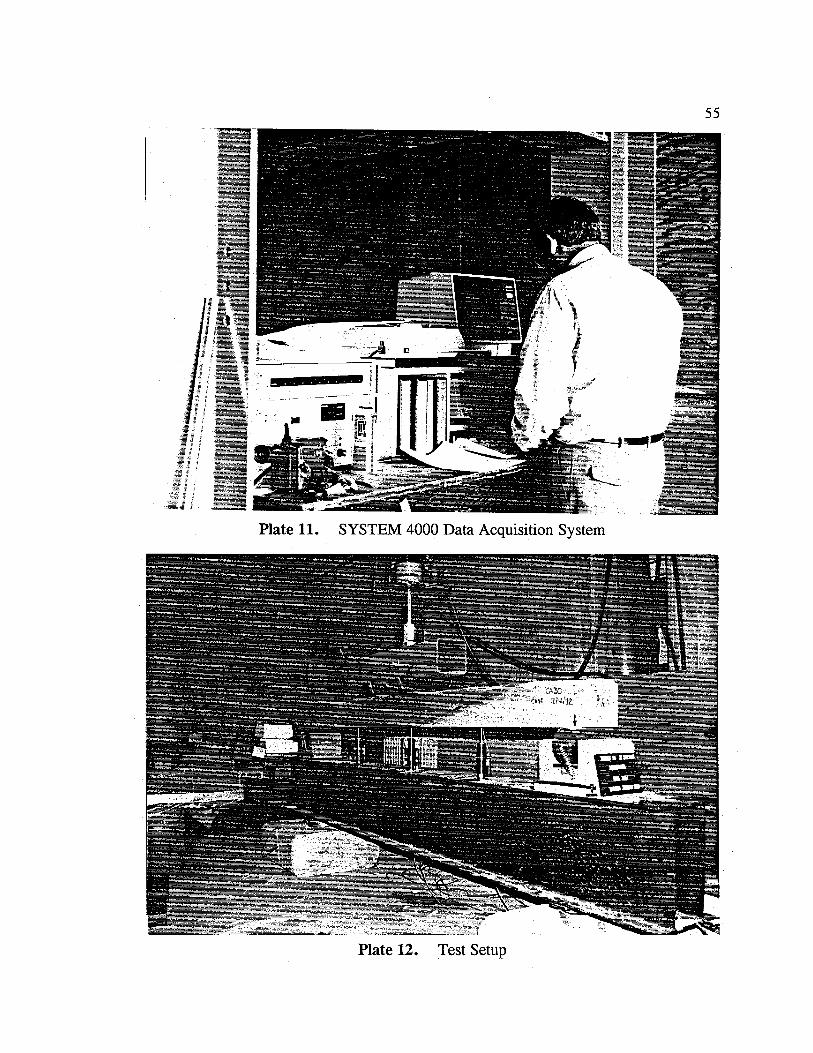
6.2.4 Data Acquisition System
Data recording from concrete strain gages, LVDTs and load cell was fully
automated using a SYSTEM 4000 data acquisition system. This system includes the
Data Acquisition Control Unit (DACU), an IBM personal computer and printer. The
DACU contained five strain gage scanners capable of scanning 100 strain gage based
transducers and two universal scanners capable of scanning twenty LVDT channels.
The software accompanying the system allowed the continuous monitoring of the
concrete strain, deflections, applied load and reactions by displaying the scanned
channels on the computer's monitor. This software also allowed the recording of the
data in a floppy disk and its printout. Platel l shows the SYSTEM 400 data acquisition
system.
6.3 Test Setup
The ultimate bending capacity tests were performed in the Structures
Laboratory at the University of South Florida, Tampa, Florida.
The specimens were simply supported on rollers that were anchored to a steel
box frame made of two I sections welded together. These rollers, fabricated by the USF
machine shop, allowed rotational movement at both ends but could restrain horizontal
translation at either end. The steel box frame was also simply supported on the two load
63
cells that were located directly under the rollers so as to transmit the vertical load
without deformation.
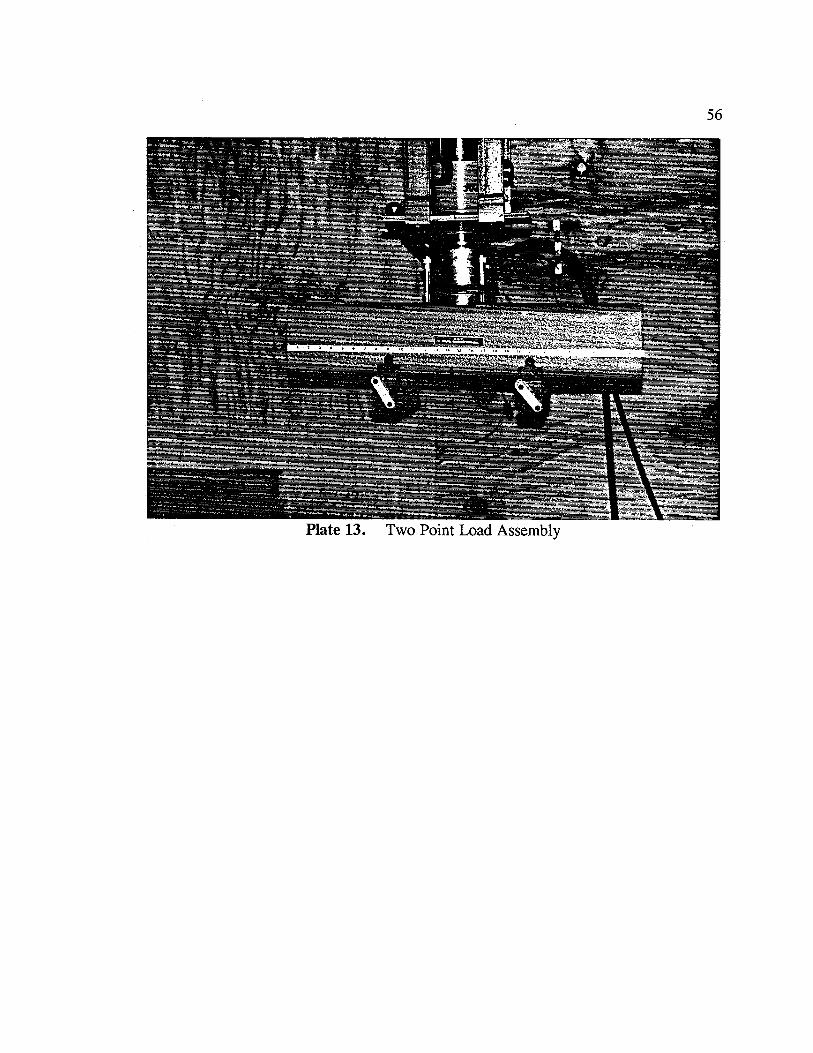
An Enerpac hydraulic jack was used to apply the load. This jack was loaded
against a reaction frame and the load was transmitted through a swivel head assembly to
which a 150 mm x 150 mm x 9.5 mm square steel hollow section was directly bolted.
Two special roller type attachments were screwed to the hollow section so as to
distribute the load from the hydraulic jack to two points on the specimen located 300
mm. apart from each other and centered with respect to the supports. This two point
load subjected the center portion of the specimen to pure bending. Plates 12 and 13
show the actual test setup and the two point load assembly.
6.4 Test Procedure
Prior to each series of tests, the load cells were calibrated using a digital load cell
so as to verify the validity of the readings in the SYSTEM 4000. After placing the beam
on the steel box frame, the LVDTs were calibrated against a cubic piece of aluminum of
known dimensions. After this calibration, the concrete strain, deflection and load
readings were zeroed.
The static load was applied in 900 N increments up to the cracking load. Above
this value, the increments were smaller and readings were recorded depending on the
individual response of the specimens. The beams were loaded to failure and information
about failure mode and crack pattern was recorded.
66
7. OUTDOOR EXPOSURE STUDY
7.1 Introduction
This chapter presents interim results from the outdoor exposure study. A total of
four series of tests were planned. Of these, three have been completed to date.
The test program is described in Section 7.2. Ambient temperature conditions for
these tests are addressed in Section 7.3. Section 7.4 summarizes the test results. A
discussion of the results is presented in Section 7.5.
7.2 Experimental Program
Of the thirty three beams cast, twenty two were set aside for the durability (Chapter
8) and bond (Chapter 9) studies. Nine others were set aside for the outdoor exposure where
they were exposed to the elements. Of these nine beams, one (CA 20) was damaged
during removal from the prestressing bed.
Details of the dimensions, number of pre-cracks and eccentricity of these beams are
summarized in Table 13.
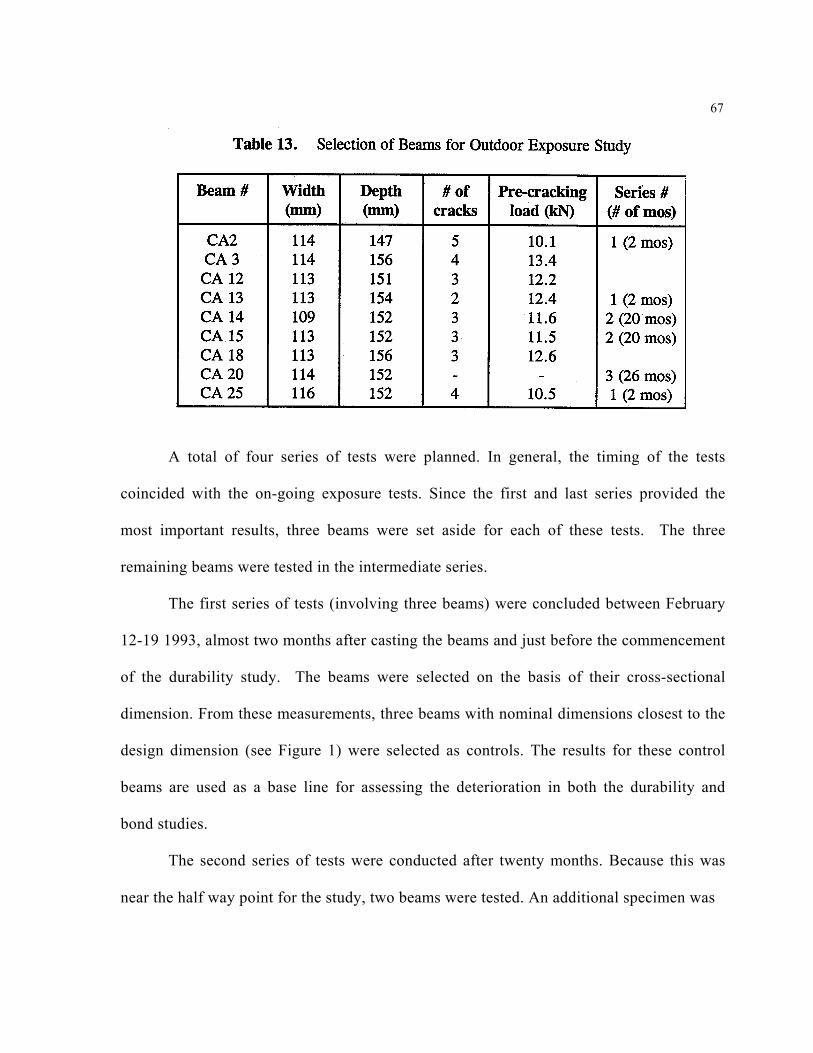
67
A total of four series of tests were planned. In general, the timing of the tests
coincided with the on-going exposure tests. Since the first and last series provided the
most important results, three beams were set aside for each of these tests. The three
remaining beams were tested in the intermediate series.
The first series of tests (involving three beams) were concluded between February
12-19 1993, almost two months after casting the beams and just before the commencement
of the durability study. The beams were selected on the basis of their cross-sectional
dimension. From these measurements, three beams with nominal dimensions closest to the
design dimension (see Figure 1) were selected as controls. The results for these control
beams are used as a base line for assessing the deterioration in both the durability and
bond studies.
The second series of tests were conducted after twenty months. Because this was
near the half way point for the study, two beams were tested. An additional specimen was
68
tested after twenty six months only to provide a measure of the deterioration in the bond
and durability specimens that were tested at the same time.
Ultimate capacity tests were conducted on all the beams using the setup
described in Chapter 6. In all the three series, the concrete strength was established by
testing standard cylinders.
7.3 Temperature Data
The beams tested were exposed to outdoor conditions for the whole duration of
twenty six months. To provide an index of exposure conditions, information on
Tampa's weather as reported in the Tampa Tribune was used.
Because temperature is a key variable, the daily maximum and minimum
temperature ranges were plotted for each monthly period since December 14 1992.
Since the other studies involved exposure to salt water, the water temperature of the
Gulf of Mexico was also included.
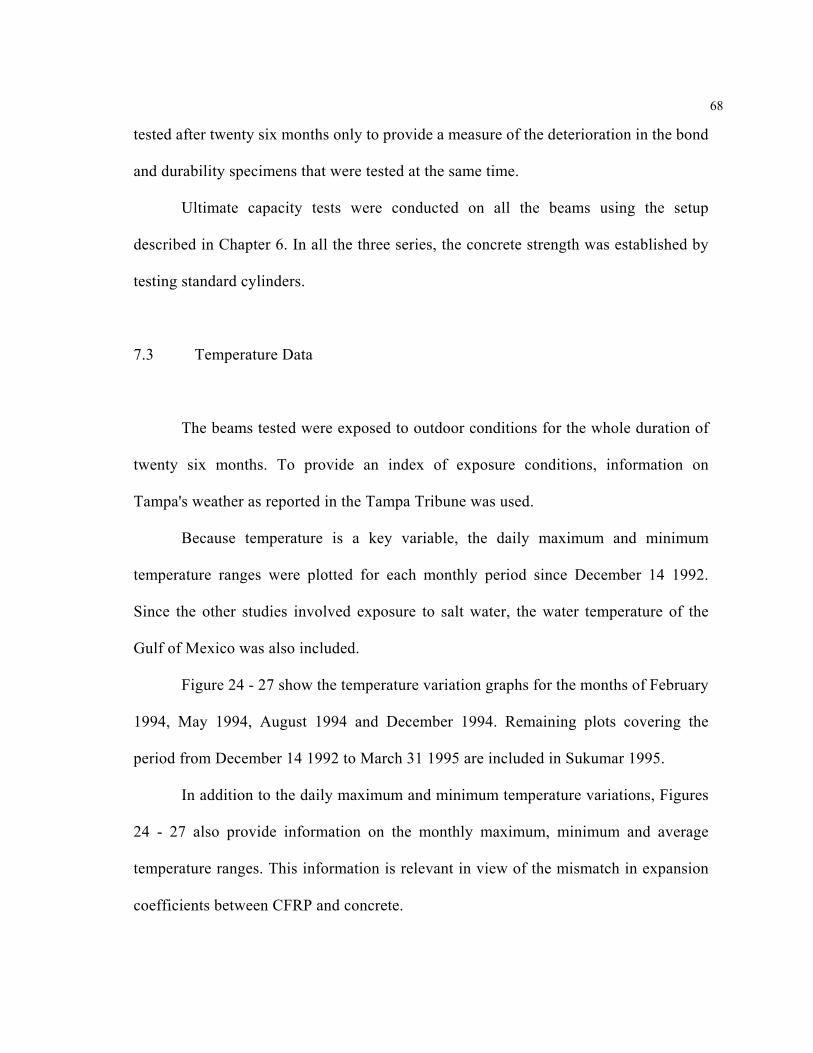
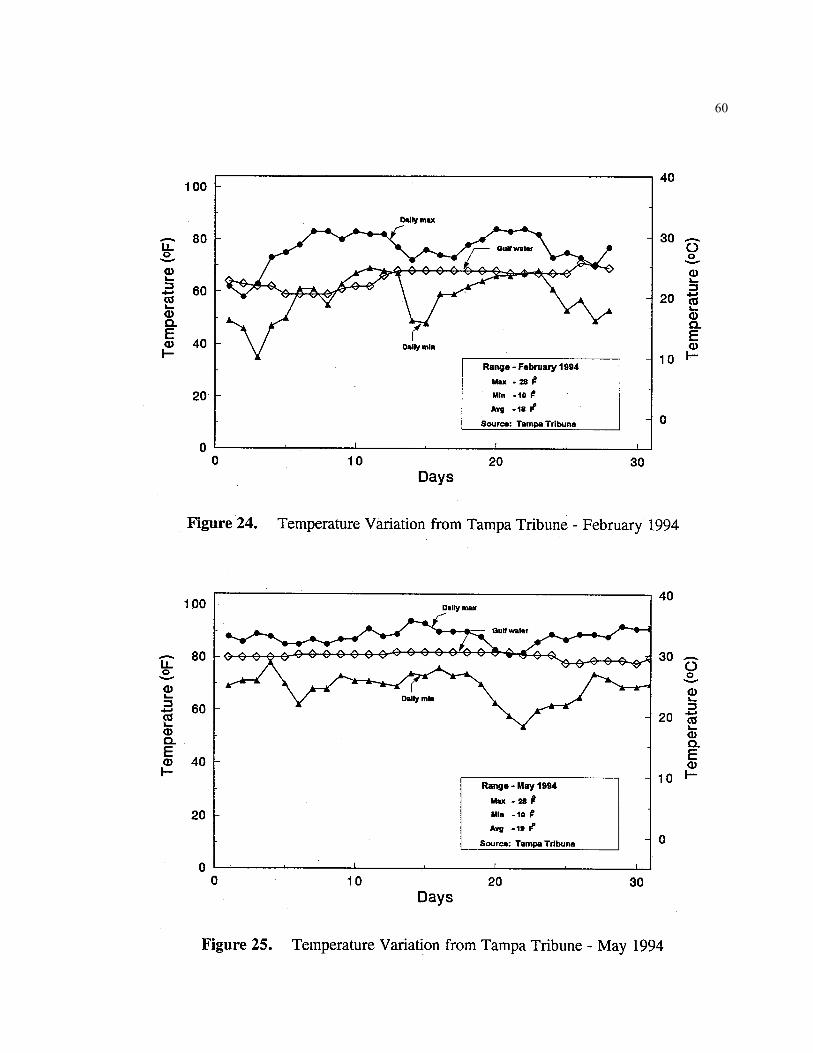
Figure 24 - 27 show the temperature variation graphs for the months of February
1994, May 1994, August 1994 and December 1994. Remaining plots covering the
period from December 14 1992 to March 31 1995 are included in Sukumar 1995.
In addition to the daily maximum and minimum temperature variations, Figures
24 - 27 also provide information on the monthly maximum, minimum and average
temperature ranges. This information is relevant in view of the mismatch in expansion
coefficients between CFRP and concrete.
60
61
62
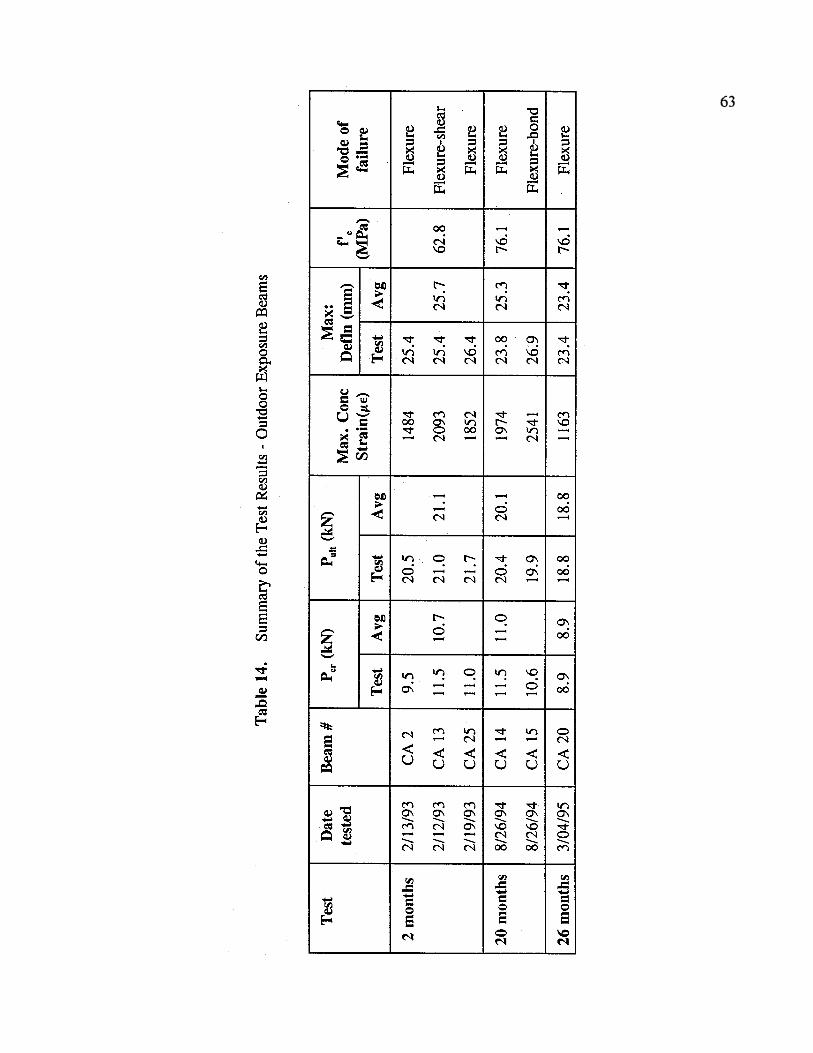
7.4 Test Results
A summary of the results for all the beams tested is provided in Table 14. This
contains information on the cracking loads, failure loads, maximum deflections, ' um
concrete strains and concrete strength.
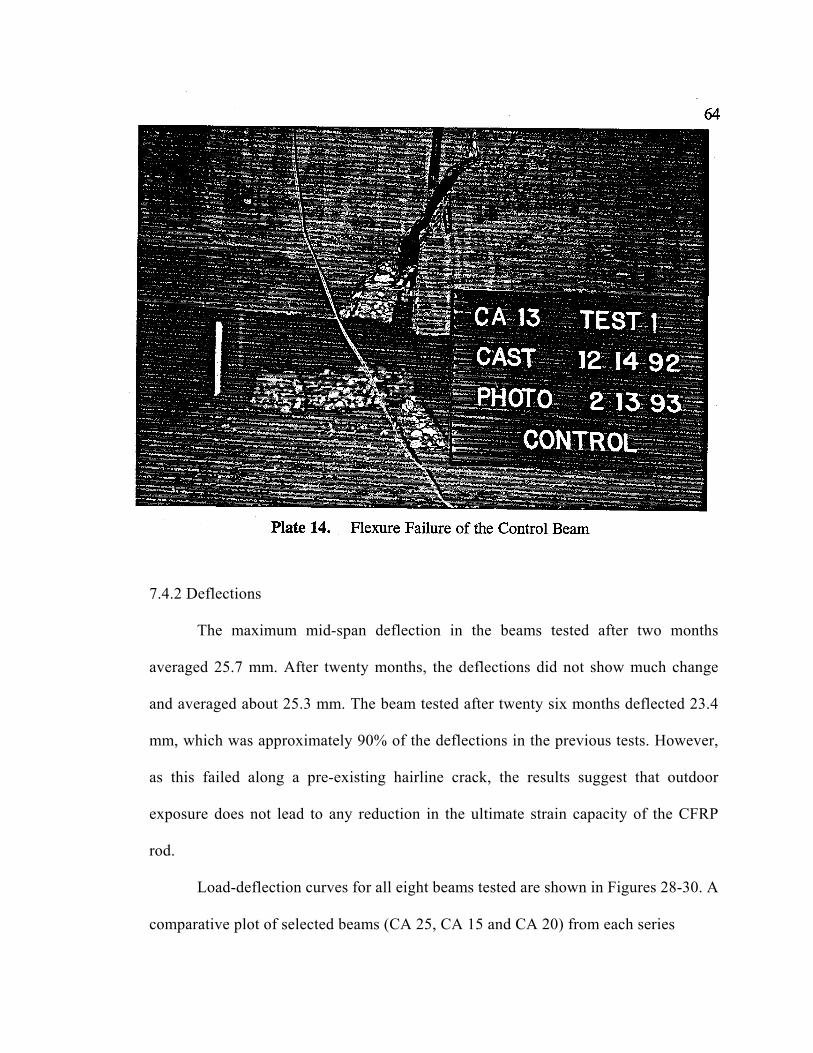
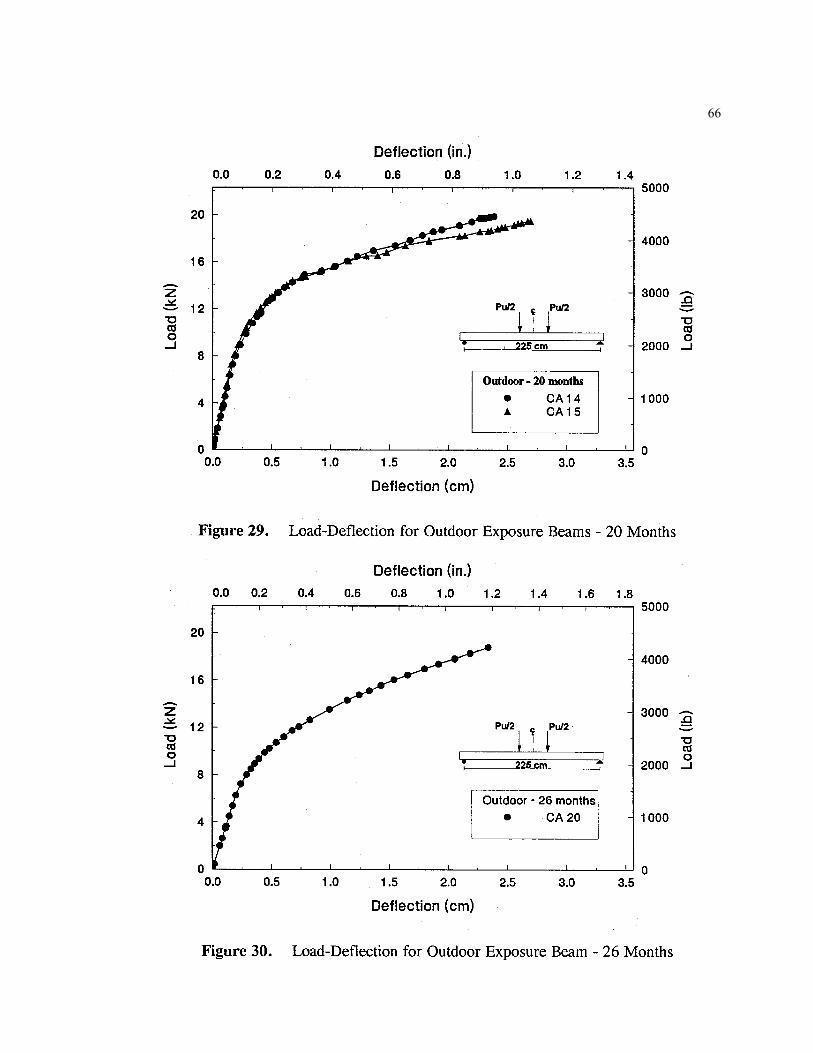
7.4.1 Loads
The outdoor exposure beams tested after two months had a failure load in the range
of 20-22 kN, with an average value of 21.1 kN (see Table 14). All three beams filed in
flexure in the constant moment region, i.e. between the load points. The failure ode was in
accordance with the design (see Section 3.2). Plate 14 shows the failure of control specimen
CA 13.
After twenty months the failure load for the outdoor exposure beams dropped by
5.2% relative to the two month value, but the failure mode was still flexure. The average
failure load was 20.1 kN.
The failure load dropped to 18.8 kN after twenty six months. This reduction in load
was probably due to a pre-existing hairline crack near the top of the beam tested along
which it failed.
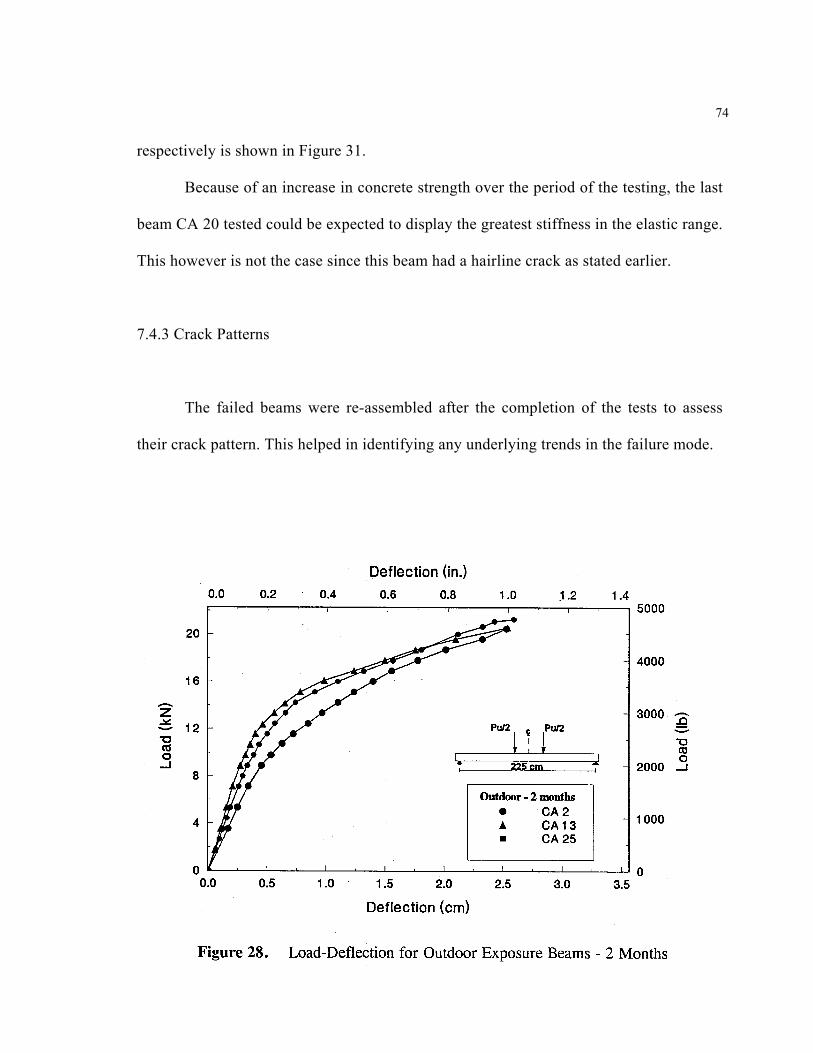
7.4.2 Deflections
The maximum mid-span deflection in the beams tested after two months
averaged 25.7 mm. After twenty months, the deflections did not show much change
and averaged about 25.3 mm. The beam tested after twenty six months deflected 23.4
mm, which was approximately 90% of the deflections in the previous tests. However,
as this failed along a pre-existing hairline crack, the results suggest that outdoor
exposure does not lead to any reduction in the ultimate strain capacity of the CFRP
rod.
Load-deflection curves for all eight beams tested are shown in Figures 28-30. A
comparative plot of selected beams (CA 25, CA 15 and CA 20) from each series
74
respectively is shown in Figure 31.
Because of an increase in concrete strength over the period of the testing, the last
beam CA 20 tested could be expected to display the greatest stiffness in the elastic range.
This however is not the case since this beam had a hairline crack as stated earlier.
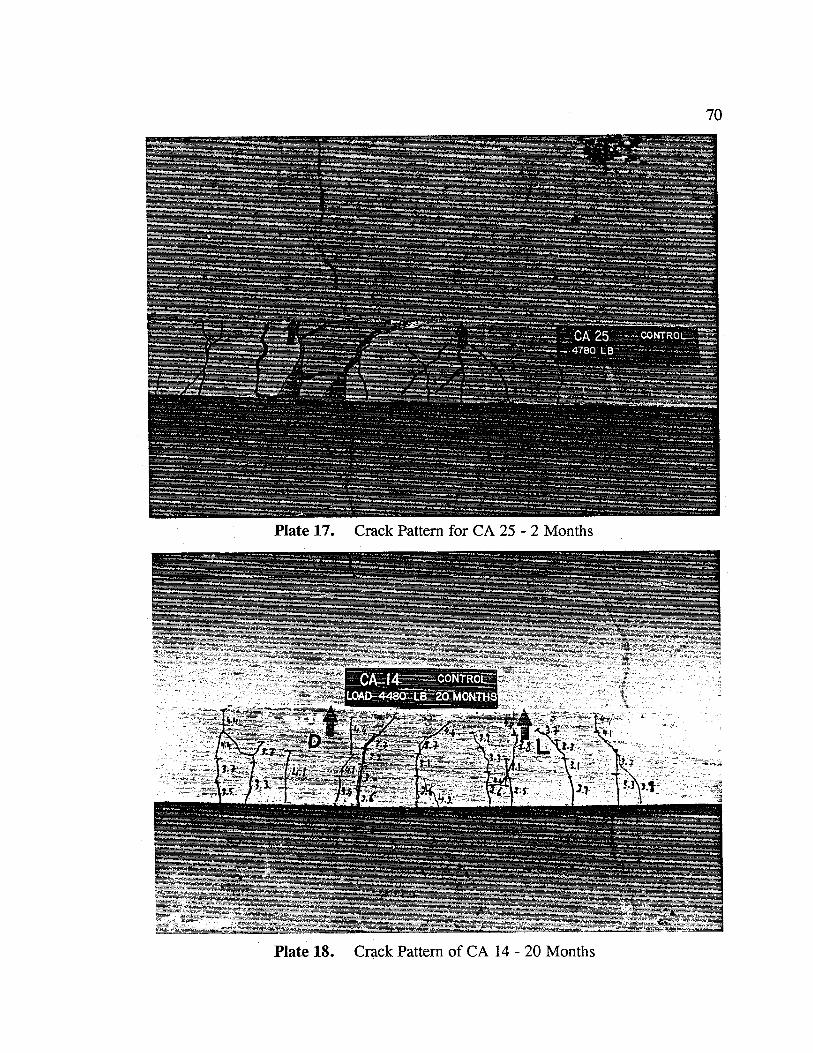
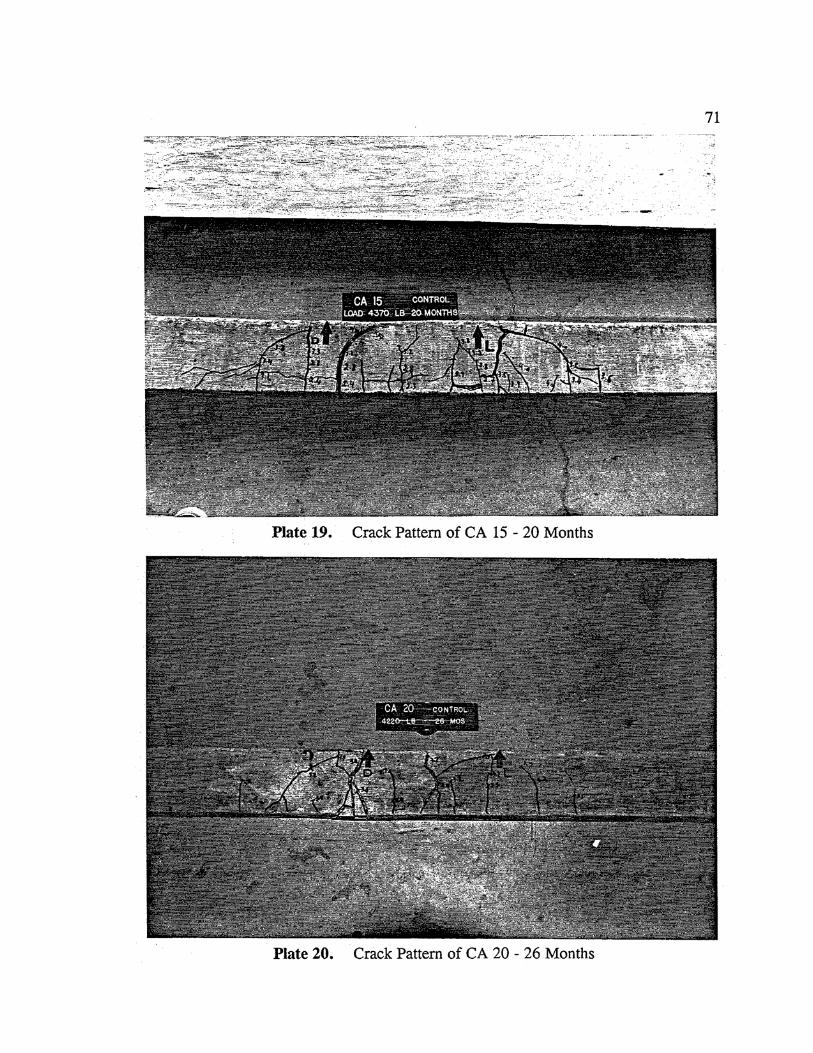
7.4.3 Crack Patterns
The failed beams were re-assembled after the completion of the tests to assess
their crack pattern. This helped in identifying any underlying trends in the failure mode.
66
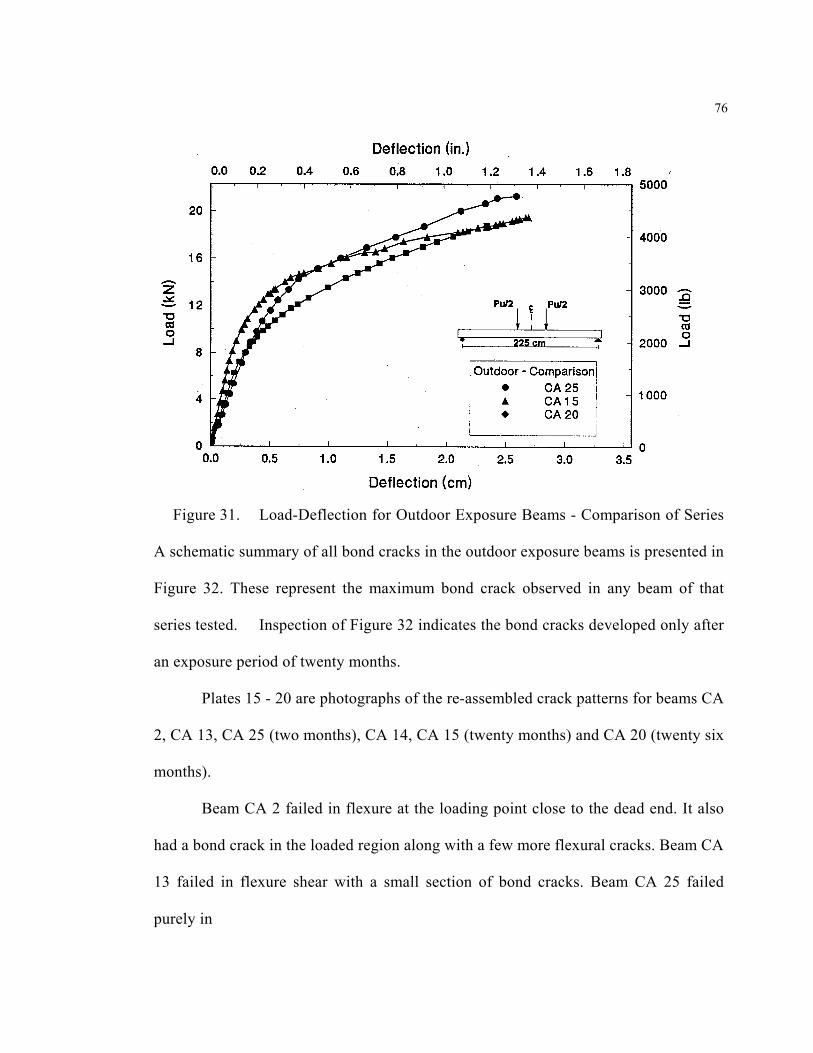
76
Figure 31. Load-Deflection for Outdoor Exposure Beams - Comparison of Series
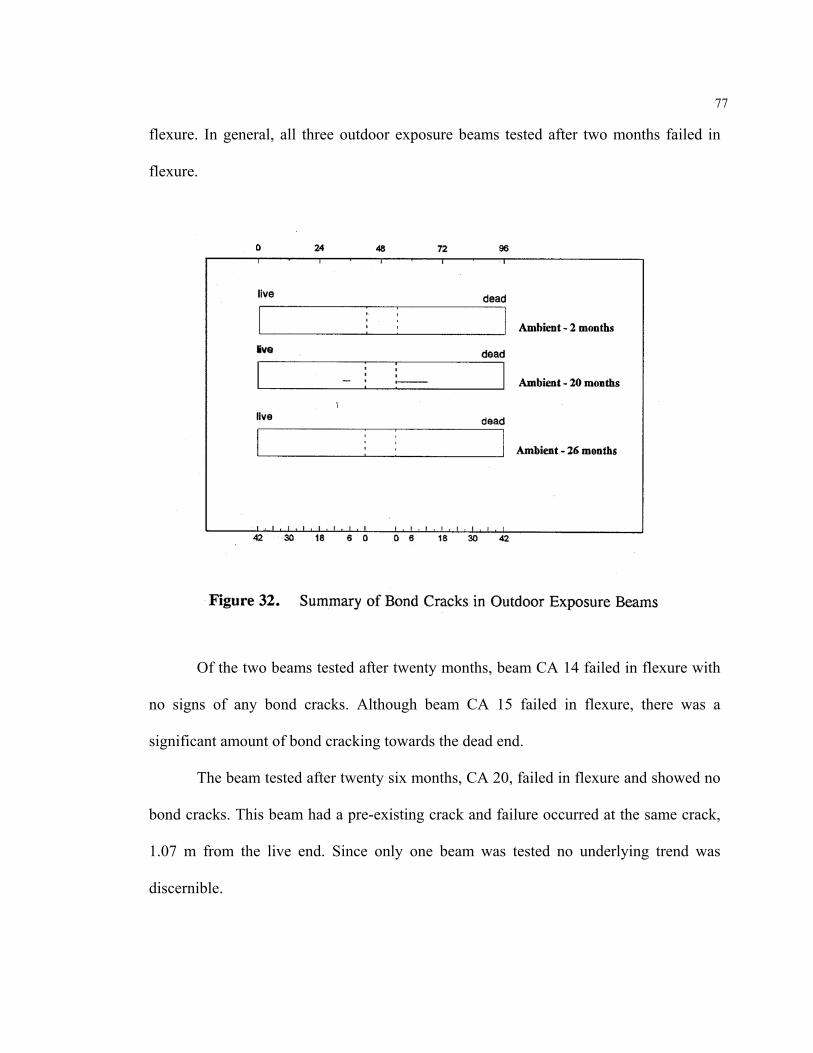
A schematic summary of all bond cracks in the outdoor exposure beams is presented in
Figure 32. These represent the maximum bond crack observed in any beam of that
series tested. Inspection of Figure 32 indicates the bond cracks developed only after
an exposure period of twenty months.
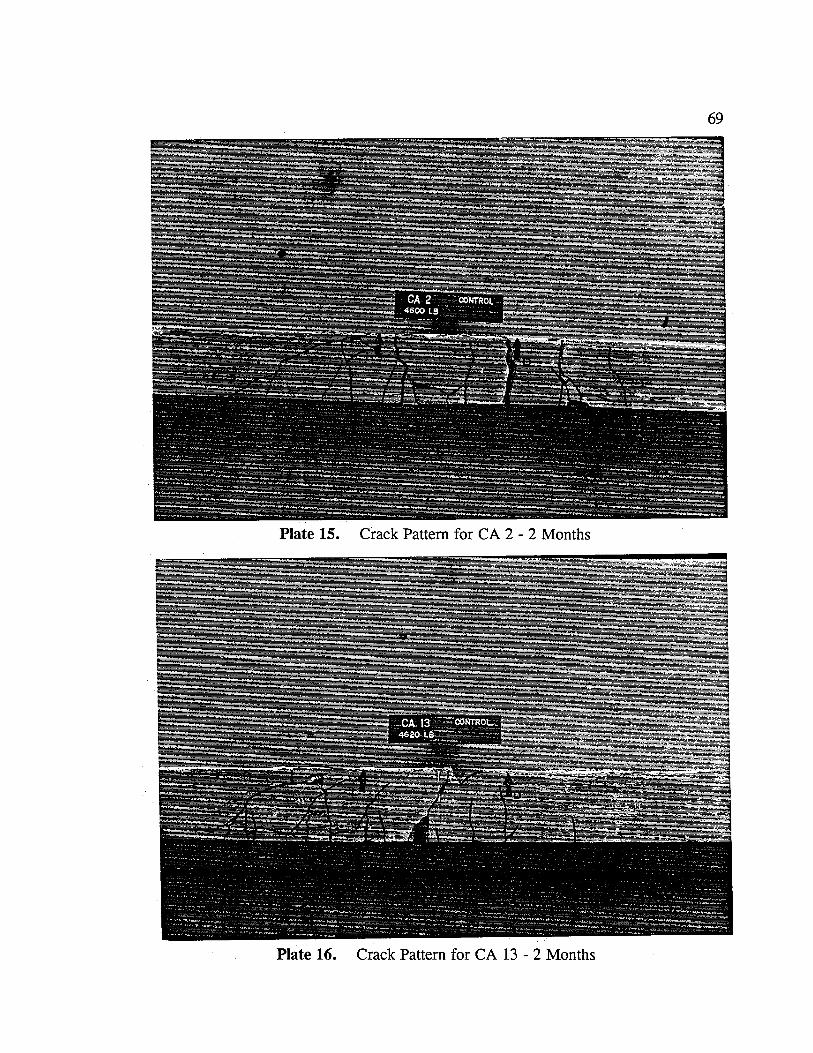
Plates 15 - 20 are photographs of the re-assembled crack patterns for beams CA
2, CA 13, CA 25 (two months), CA 14, CA 15 (twenty months) and CA 20 (twenty six
months).
Beam CA 2 failed in flexure at the loading point close to the dead end. It also
had a bond crack in the loaded region along with a few more flexural cracks. Beam CA
13 failed in flexure shear with a small section of bond cracks. Beam CA 25 failed
purely in
77
flexure. In general, all three outdoor exposure beams tested after two months failed in
flexure.
Of the two beams tested after twenty months, beam CA 14 failed in flexure with
no signs of any bond cracks. Although beam CA 15 failed in flexure, there was a
significant amount of bond cracking towards the dead end.
The beam tested after twenty six months, CA 20, failed in flexure and showed no
bond cracks. This beam had a pre-existing crack and failure occurred at the same crack,
1.07 m from the live end. Since only one beam was tested no underlying trend was
discernible.
72
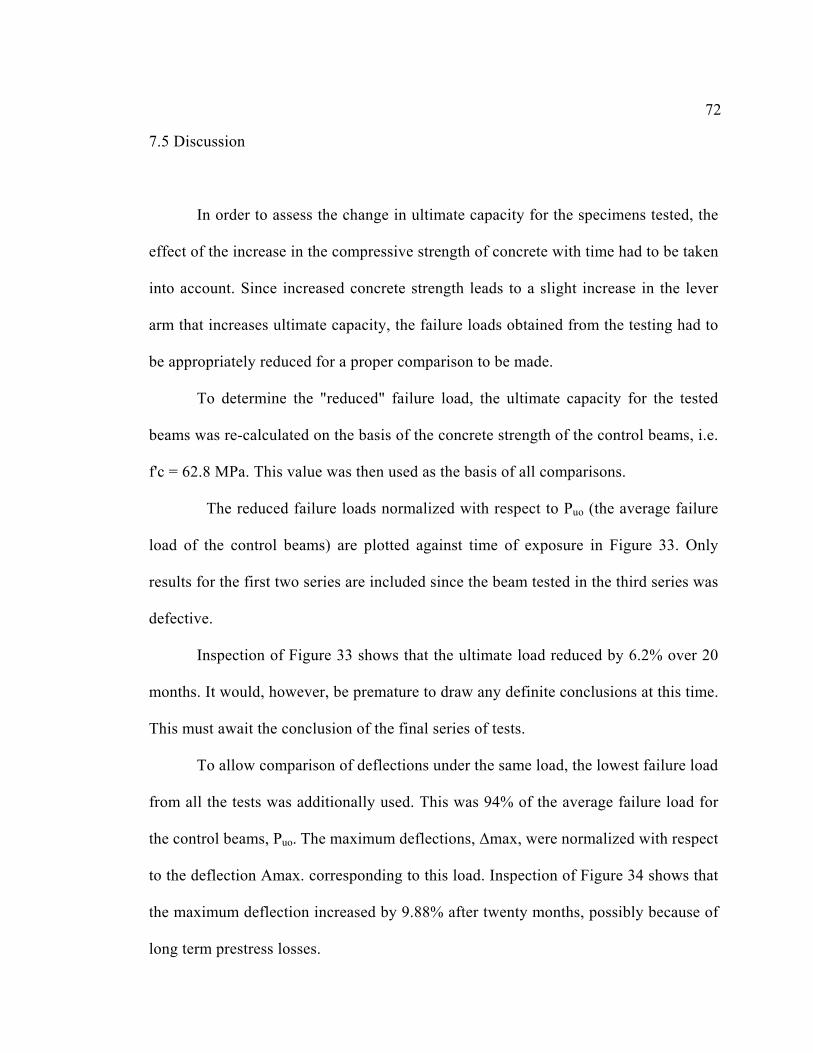
7.5 Discussion
In order to assess the change in ultimate capacity for the specimens tested, the
effect of the increase in the compressive strength of concrete with time had to be taken
into account. Since increased concrete strength leads to a slight increase in the lever
arm that increases ultimate capacity, the failure loads obtained from the testing had to
be appropriately reduced for a proper comparison to be made.
To determine the "reduced" failure load, the ultimate capacity for the tested
beams was re-calculated on the basis of the concrete strength of the control beams, i.e.
f'c = 62.8 MPa. This value was then used as the basis of all comparisons.
The reduced failure loads normalized with respect to Puo (the average failure
load of the control beams) are plotted against time of exposure in Figure 33. Only
results for the first two series are included since the beam tested in the third series was
defective.
Inspection of Figure 33 shows that the ultimate load reduced by 6.2% over 20
months. It would, however, be premature to draw any definite conclusions at this time.
This must await the conclusion of the final series of tests.
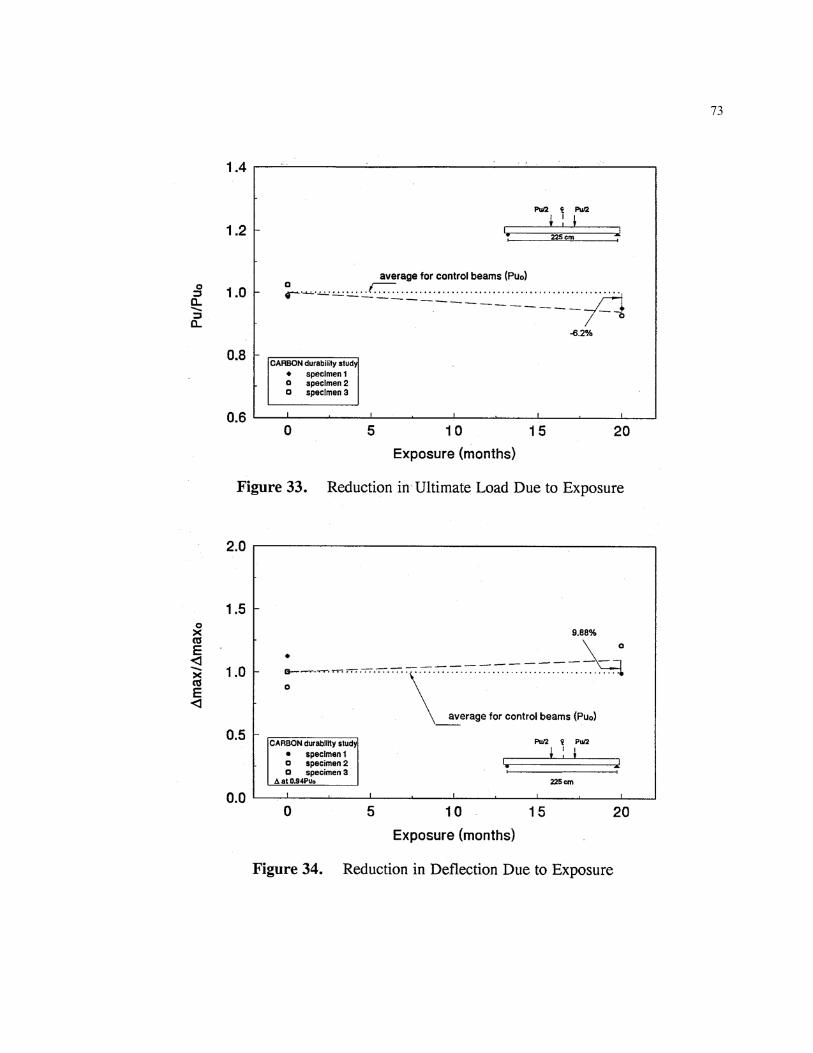
To allow comparison of deflections under the same load, the lowest failure load
from all the tests was additionally used. This was 94% of the average failure load for
the control beams, Puo. The maximum deflections, ∆max, were normalized with respect
to the deflection Amax. corresponding to this load. Inspection of Figure 34 shows that
the maximum deflection increased by 9.88% after twenty months, possibly because of
long term prestress losses.
73
74
8. DURABILITY STUDY
8.1 Introduction
This chapter presents interim results from the durability study that attempted to
assess the combined effect of salt water and tidal cycling on the long term performance
of CFRP pretensioned elements. The scope of the study is outlined together with a
summary and discussion of the results obtained to date.
Of the ten specimens selected for this study, eight have been tested over a period
of 24 months. The two remaining are scheduled for testing during 1995. The baseline for
comparison was set by the results of the three control beams (see Chapter 7).
The experimental program and the test set-up are described in Sections 8.2 and
8.3. The test procedure is presented in Section 8.4. The results of the ultimate load tests
and a discussion of the effect of exposure to a marine environment are summarized in
Sections 8.5-8.6.
8.2 Experimental Program
In order to assess durability of the CFRP pretensioned specimens, a set up was
designed to simulate marine environment conditions. The beams selected for this study
84
were subjected to wet and dry cycles (high and low tide periods) by periodically
changing the water level inside tanks in which they were placed. Details of water
level variation and beam position inside the tank are given in Section 8.3.
To date, four series of ultimate capacity tests have been conducted. Two
beams were tested in each series. The series were conducted after 6, 12, 18 and 24
months of exposure. Reduction in ultimate bending capacity was assessed by
comparing the test results between exposed and unexposed specimens.
8.3 Experimental Setup
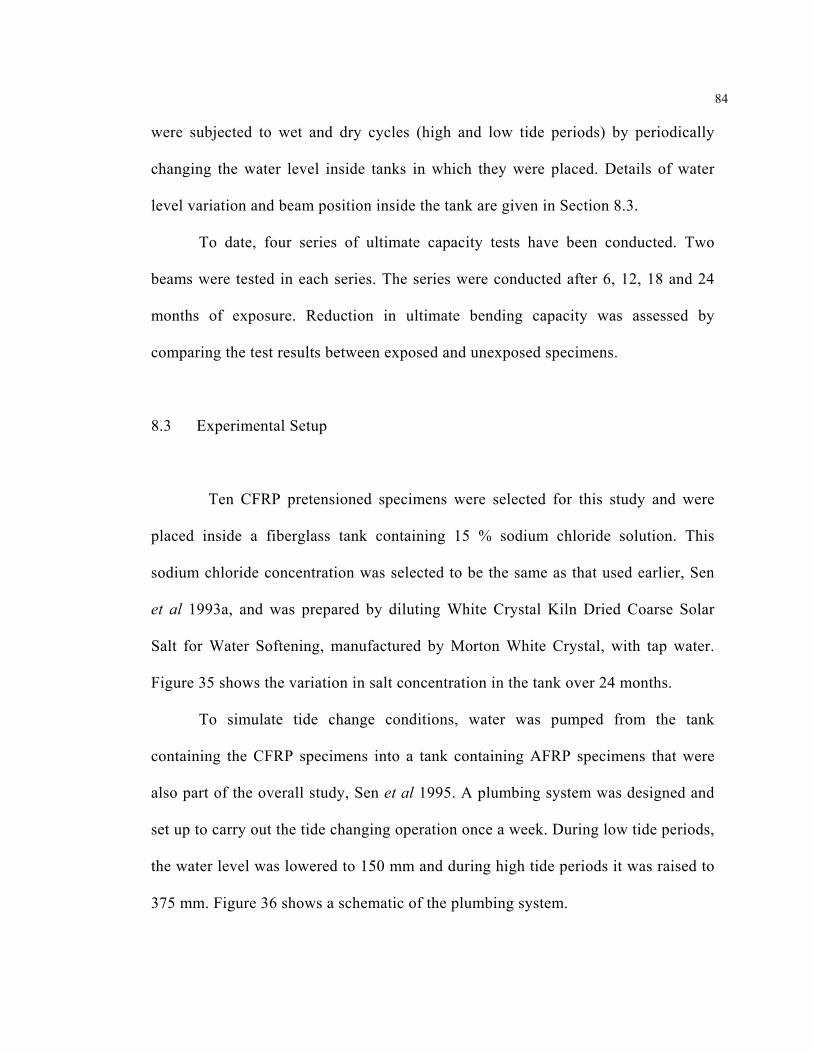
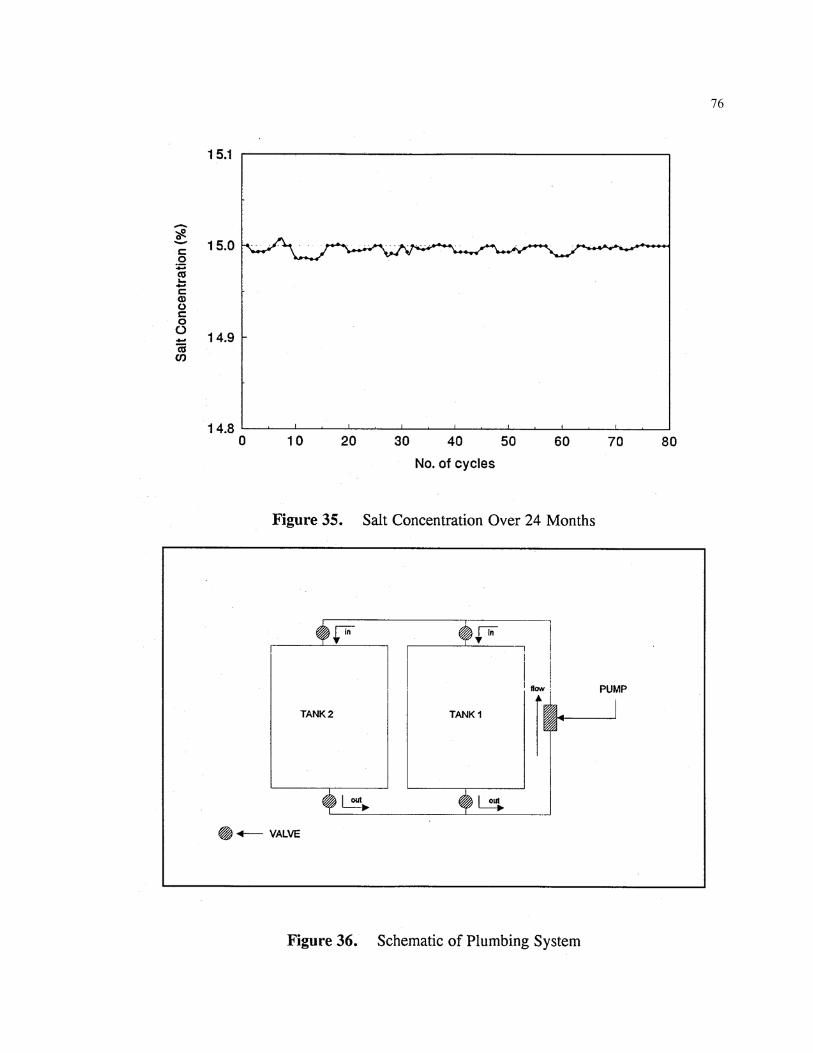
Ten CFRP pretensioned specimens were selected for this study and were
placed inside a fiberglass tank containing 15 % sodium chloride solution. This
sodium chloride concentration was selected to be the same as that used earlier, Sen
et al 1993a, and was prepared by diluting White Crystal Kiln Dried Coarse Solar
Salt for Water Softening, manufactured by Morton White Crystal, with tap water.
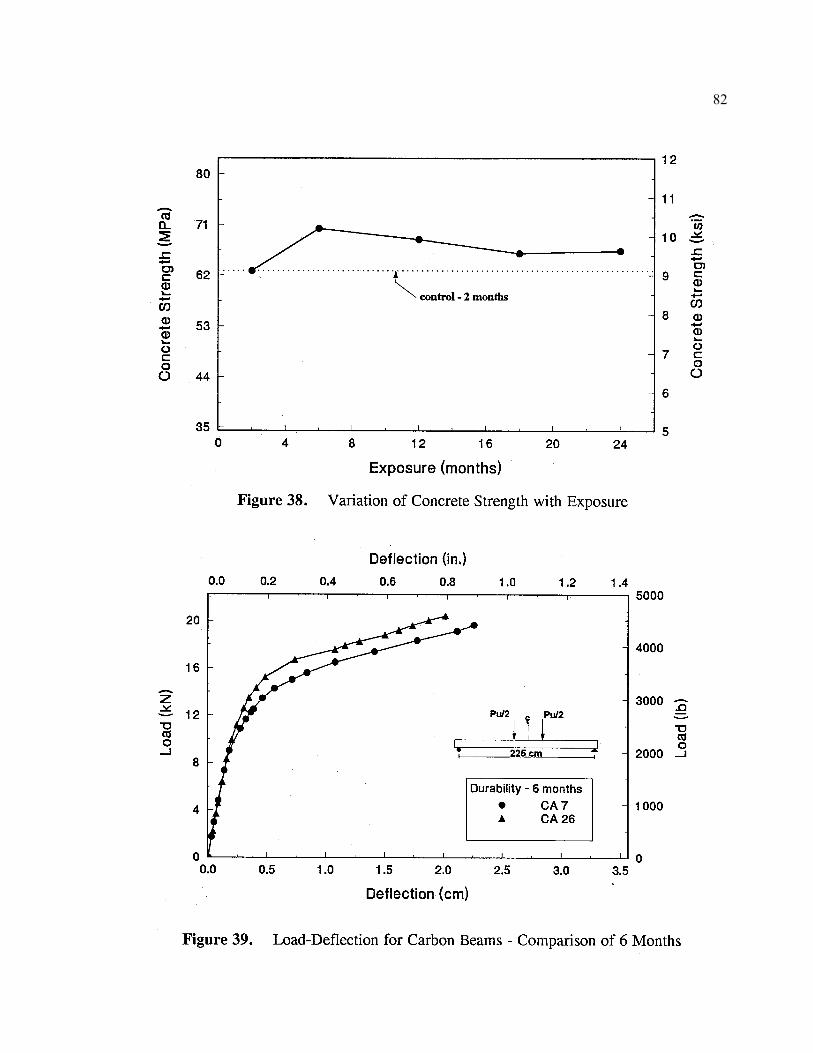
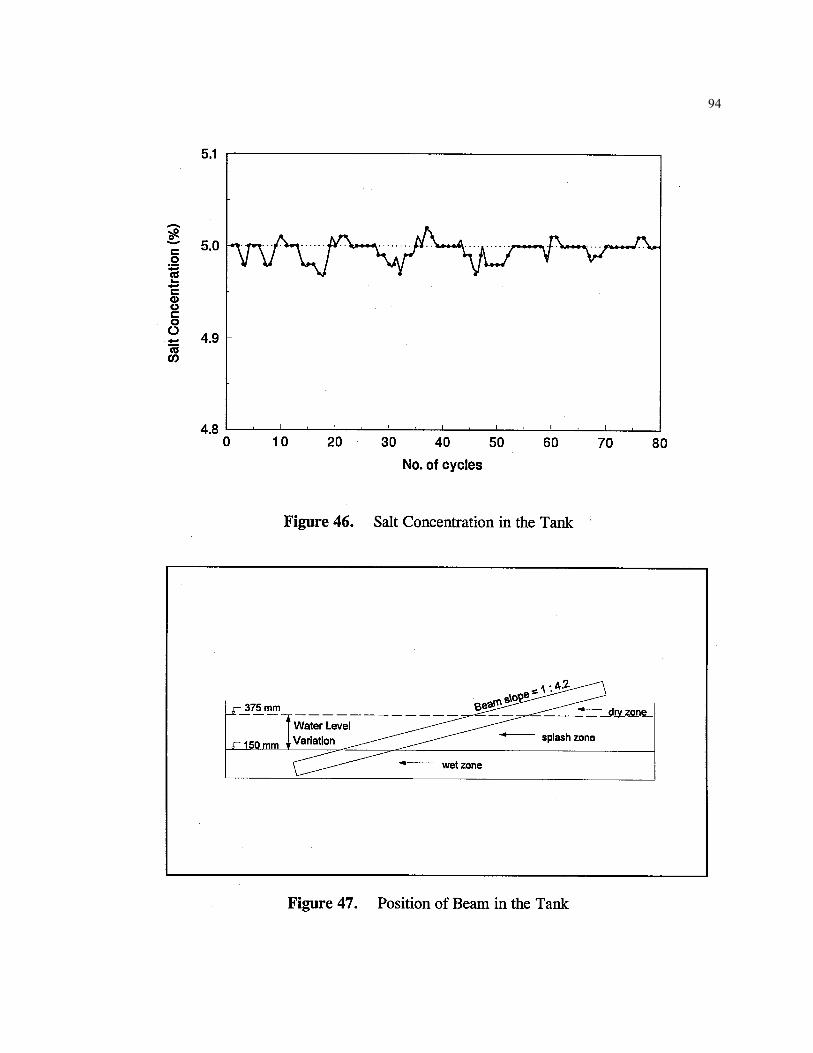
Figure 35 shows the variation in salt concentration in the tank over 24 months.
To simulate tide change conditions, water was pumped from the tank
containing the CFRP specimens into a tank containing AFRP specimens that were
also part of the overall study, Sen et al 1995. A plumbing system was designed and
set up to carry out the tide changing operation once a week. During low tide periods,
the water level was lowered to 150 mm and during high tide periods it was raised to
375 mm. Figure 36 shows a schematic of the plumbing system.
76
86
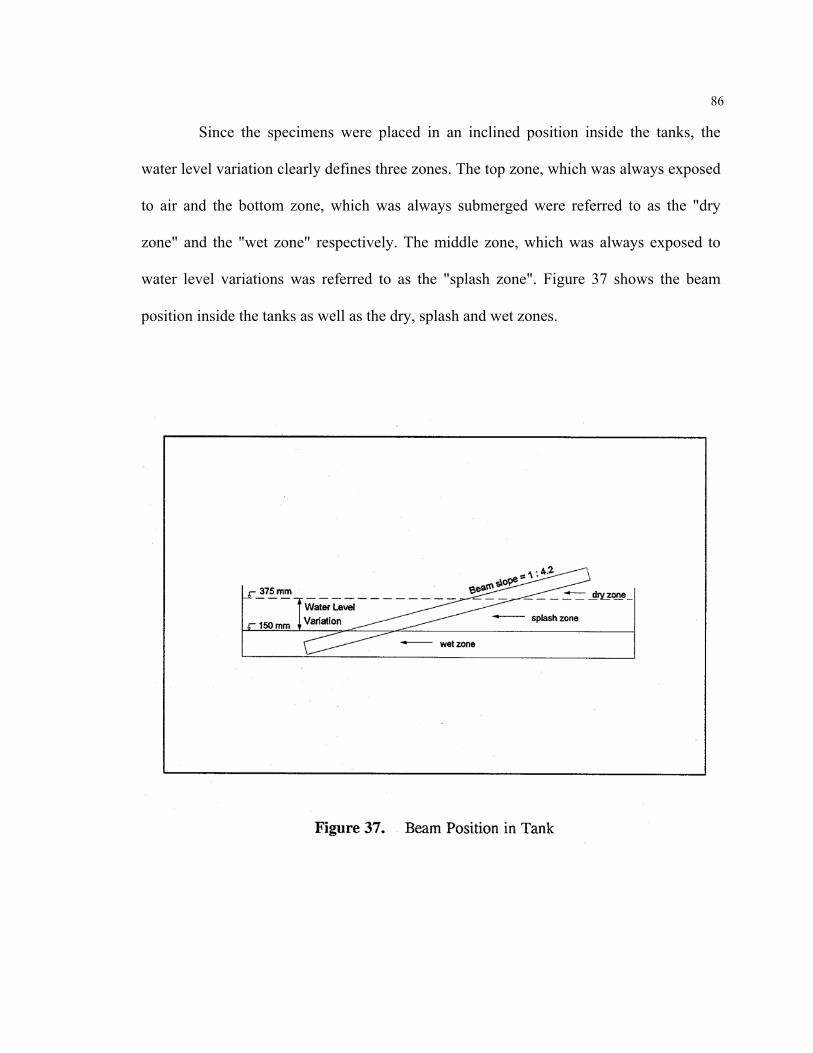
Since the specimens were placed in an inclined position inside the tanks, the
water level variation clearly defines three zones. The top zone, which was always exposed
to air and the bottom zone, which was always submerged were referred to as the "dry
zone" and the "wet zone" respectively. The middle zone, which was always exposed to
water level variations was referred to as the "splash zone". Figure 37 shows the beam
position inside the tanks as well as the dry, splash and wet zones.
78
In order to utilize the actual compressive strength of the concrete in the
interpretation of results, twelve standard cylinders that were poured at fabrication, were
subjected to the same conditions. Two cylinders were tested after each series of ultimate
bending capacity tests.
After placing the beams inside the tank, a crane system was designed to facilitate
the inspection and removal of the specimens prior to testing.
8.4 Test Procedure
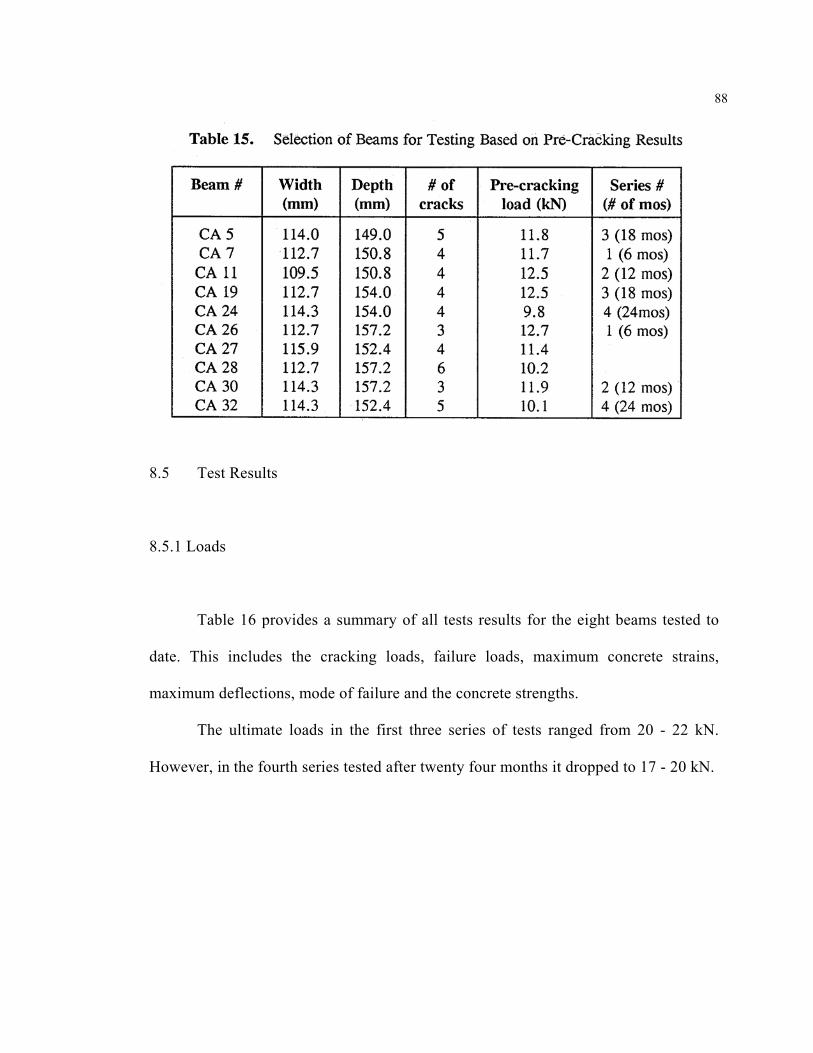
The specimens to be tested were selected largely on the basis of their pre-
cracking response. Table 15 gives the dimensions, pre-cracking load and the number of
cracks at pre-cracking for all the beams in the tank. Out of the ten beams in the tank, the
beam with the most cracks (6) and the one with the most representative number of cracks
(4) were left to be tested in the end.
The beams selected for each test were checked for cracks at the ends, sides, top
and bottom before they were removed from the tank. They were removed from the tank
and carefully transported back to the Structure Laboratory where all the testing was
carried out.
The beams were allowed to dry for at least twenty four hours. Strain gages were
then attached to the concrete surface and the beams prepared for testing. The setup for
the ultimate load test is described in Chapter 6.
88
8.5 Test Results
8.5.1 Loads
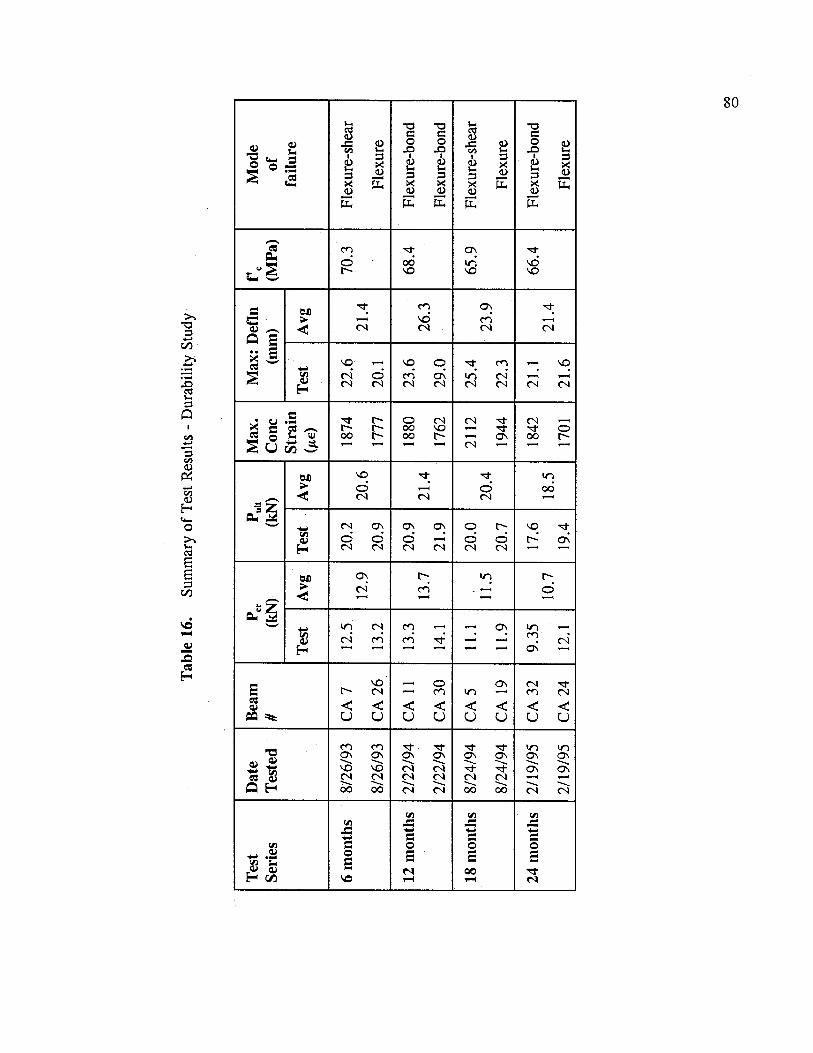
Table 16 provides a summary of all tests results for the eight beams tested to
date. This includes the cracking loads, failure loads, maximum concrete strains,
maximum deflections, mode of failure and the concrete strengths.
The ultimate loads in the first three series of tests ranged from 20 - 22 kN.
However, in the fourth series tested after twenty four months it dropped to 17 - 20 kN.
90
The average failure load was 20.6 kN for the six month test and increased to
21.4 kN in the twelve month test. After the twelve month test, the ultimate load dropped
initially to 20.4 kN (18 month) and then to 18.5 kN after 24 months. This is due in part to
changes in concrete strength over the twenty four month period as shown in Figure 38.
8.5.2 Deflections
The average deflections for the six months, twelve months, eighteen months and
twenty four months test were 21.4 mm, 26.3 mm, 23.9 mm and 21.4 mm, respectively.
Though the deflection increased for the twelve and eighteen month tests, it dropped
during the twenty four months test.
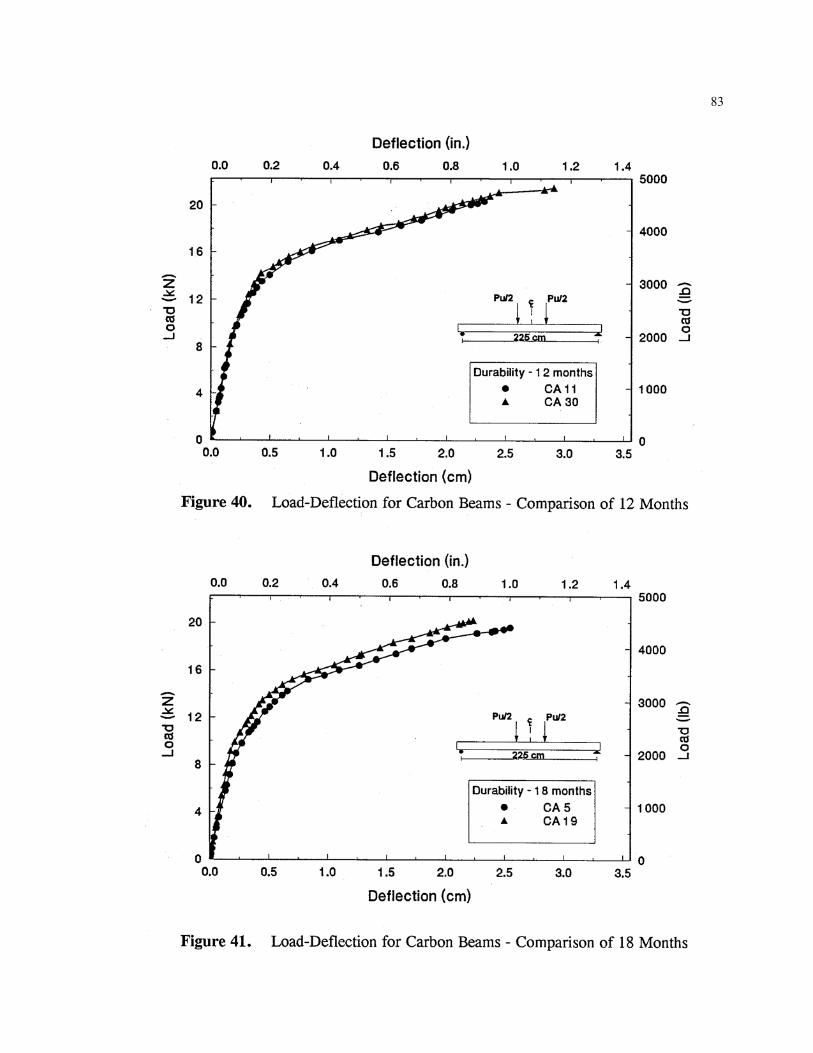
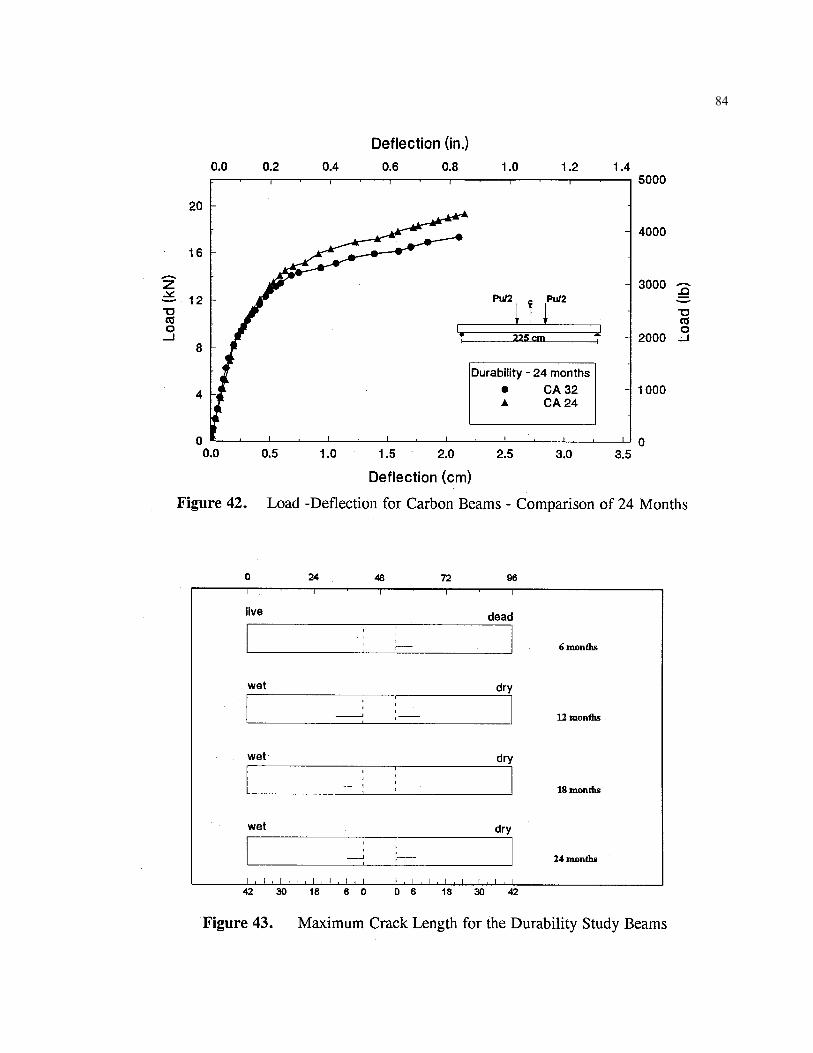
Figures 39 - 42 show the load vs. deflection curves for the four series of tests.
The similarities in the response of all the beams tested is evident from these graphs.
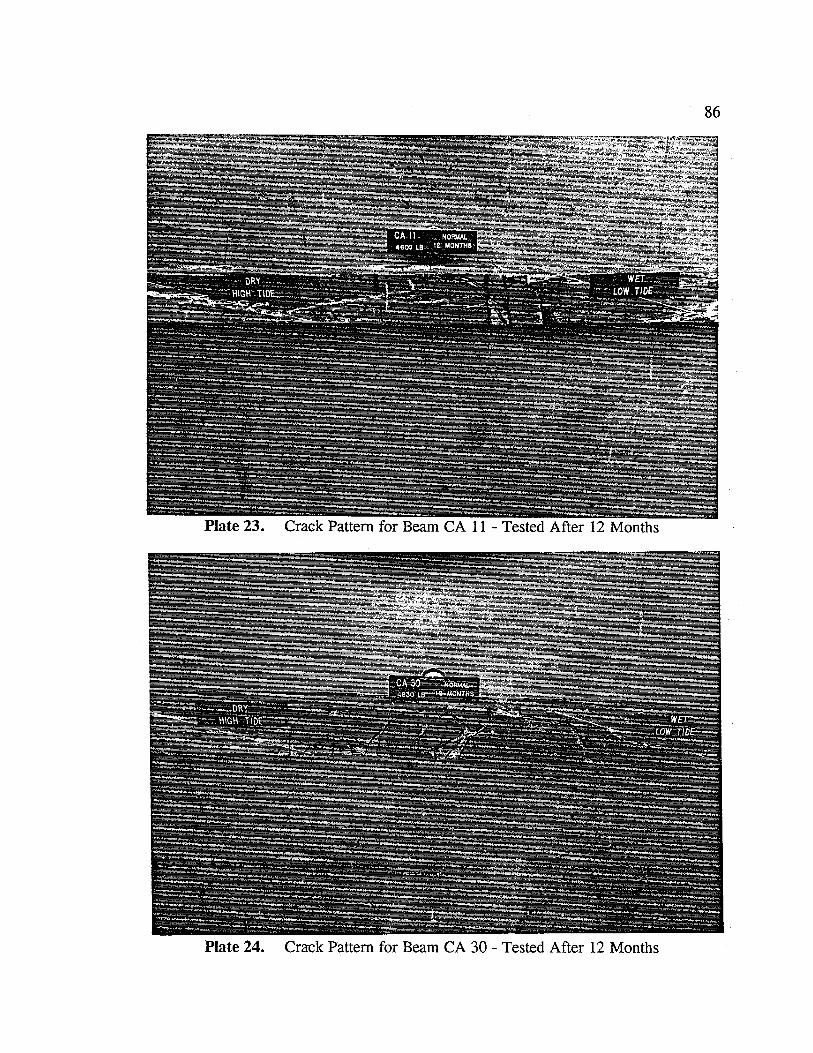
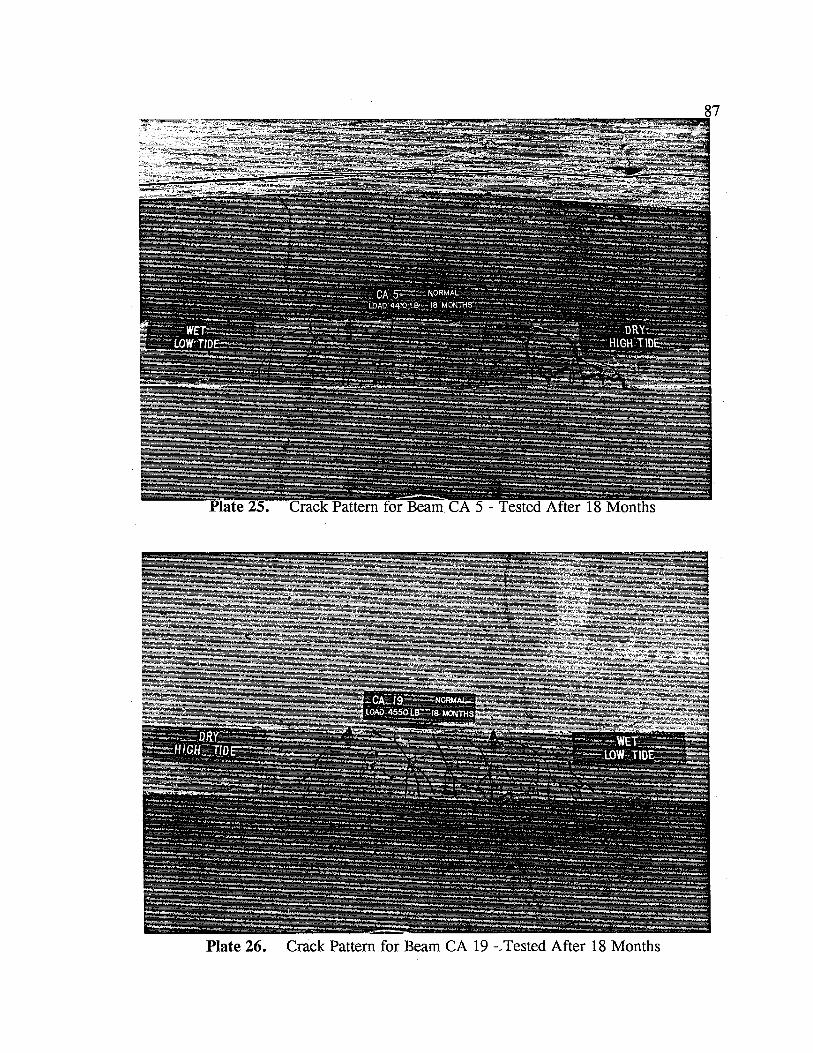
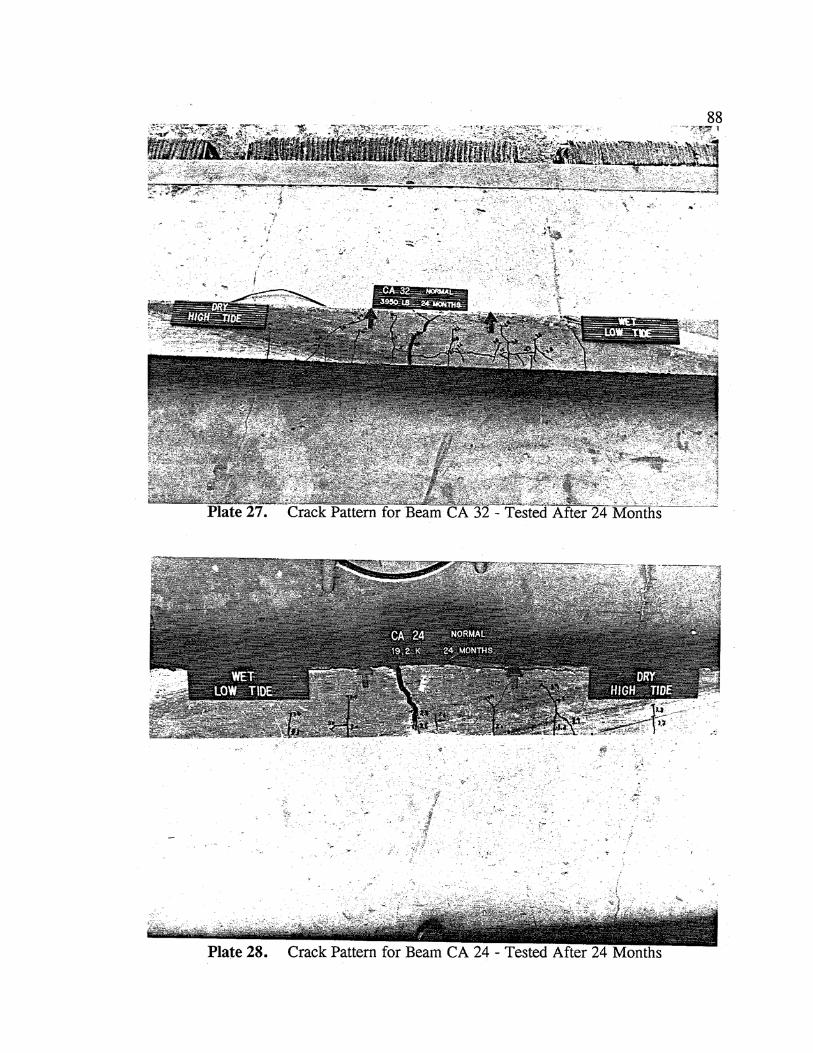
8.5.3 Crack Patterns
The beams were re-assembled after testing to verify and analyze the failure
mode. Though none of the beams failed in bond, some had visible bond cracks.
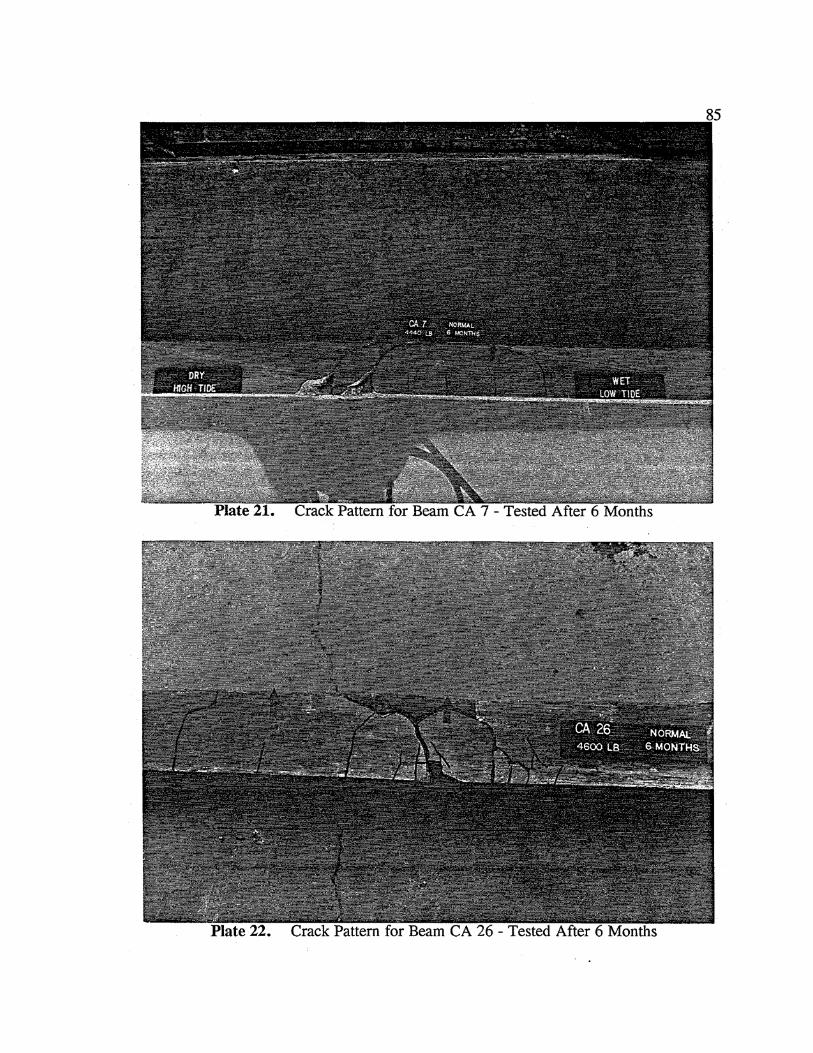
Figure 43 shows the maximum bond cracks, among all the beams, from the four
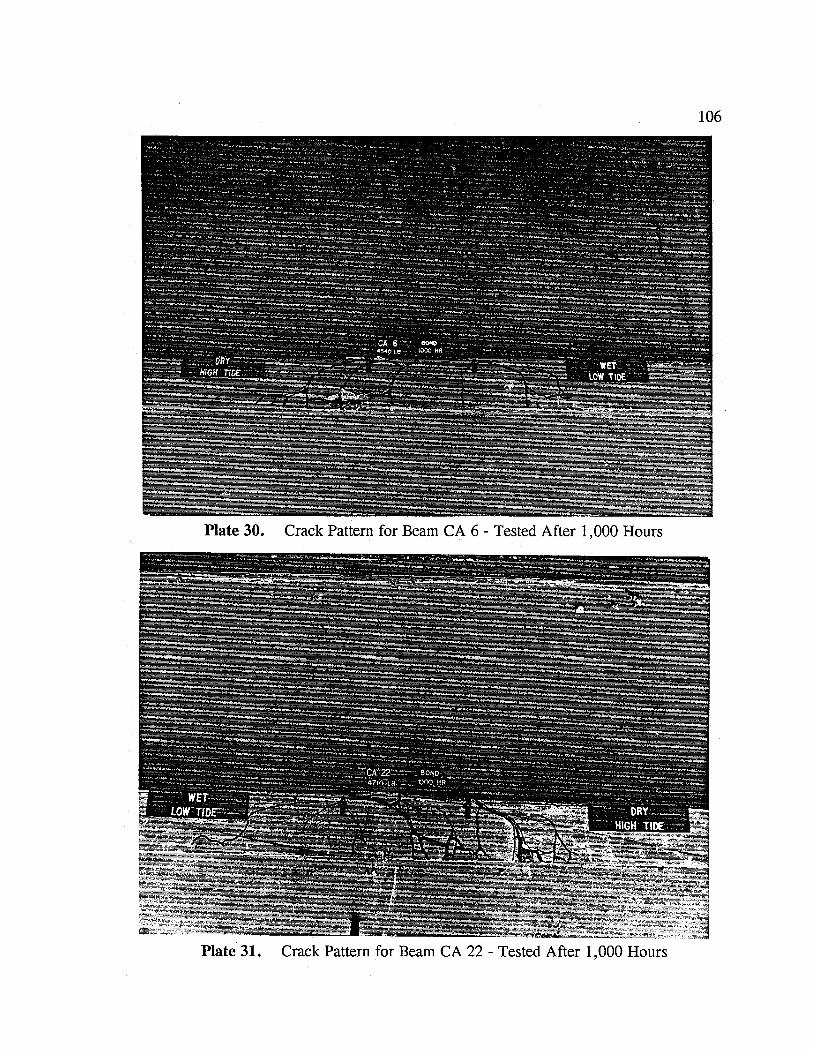
series of tests. Plates 21 - 28 show the crack patterns for all the beams tested so far.
82
83
84
89
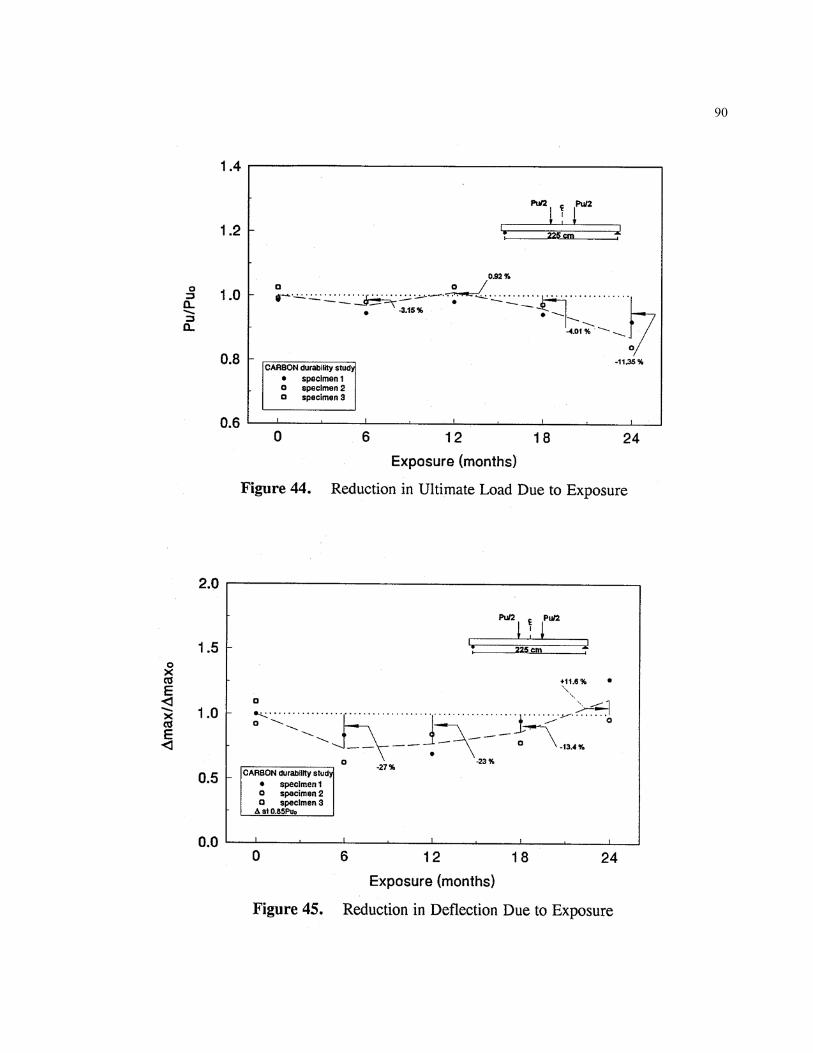
8.6 Discussion
In order to assess the loss of strength due to exposure, the effect of changes in
concrete strength had to be factored out as explained in Section 7.5.
Figure 44 plots the variation in ultimate strength normalized with respect to
that of the average ultimate load of the control beams tested after 2 months, Puo (see
Chapter 7) against exposure.
Inspection of Figure 44 shows minimal reductions in ultimate capacity over
the first 12 months of exposure. However, in subsequent tests, reductions of 4 % and
11.35 % were observed after exposure of 18 and 24 months respectively.
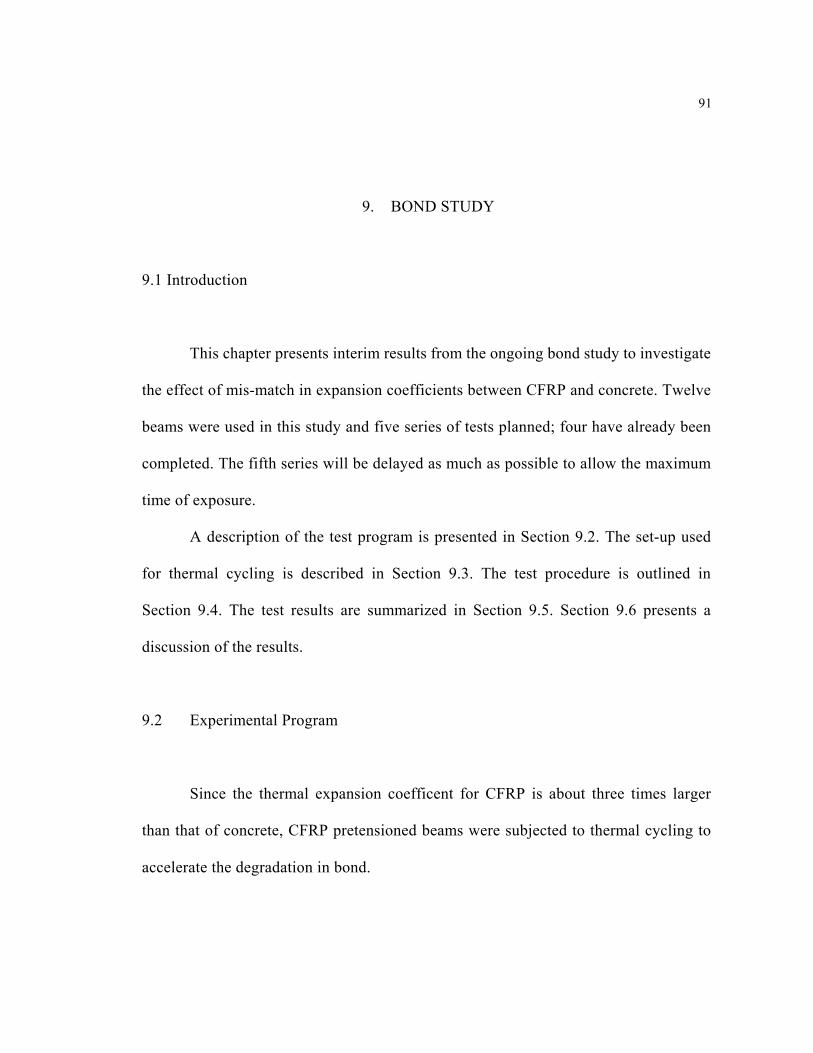
A similar analysis was conducted to determine the changes in ultimate
deflection. As before, the maximum deflection was normalized with respect to the
lowest load - 84 of the control beams so that the relative deflections under the same
load could be compared.
Figure 45 plots the variation of the normalized deflection with respect to
exposure. Inspection of this figure shows that proportionately smaller deflections
were observed during the first 18 months. In the last test, deflections were larger.
90
91
9. BOND STUDY
9.1 Introduction
This chapter presents interim results from the ongoing bond study to investigate
the effect of mis-match in expansion coefficients between CFRP and concrete. Twelve
beams were used in this study and five series of tests planned; four have already been
completed. The fifth series will be delayed as much as possible to allow the maximum
time of exposure.
A description of the test program is presented in Section 9.2. The set-up used
for thermal cycling is described in Section 9.3. The test procedure is outlined in
Section 9.4. The test results are summarized in Section 9.5. Section 9.6 presents a
discussion of the results.
9.2 Experimental Program
Since the thermal expansion coefficent for CFRP is about three times larger
than that of concrete, CFRP pretensioned beams were subjected to thermal cycling to
accelerate the degradation in bond.
101
The CFRP pretensioned beams were exposed to wet/dry cycles and thermal
cycles twice a week. Since the beams were being put through hot/cold cycles along with
the wet/dry cycles, a heating system was designed to heat and maintain the salt water
temperature at 60°C. This heating system is described in Section 9.3.
Since the temperature range beams were subjected varied with the ambient
temperature, the interval between tests was not kept the same. The tests carried out in
summer were conducted after 1,000 hours and 10,000 hours exposure. In winter, tests
were conducted after 6,500 hours and 15,500 hours. In each case, this followed a spell
of severe cold weather by Florida standards so that the temperature range the CFRP
pretensioned beams were subjected was maximized.
A total of nine beams have been tested in four series to date. Three beams were
tested in the first series conducted after 1,000 hours of exposure. In the subsequent three
series, two beams were tested after 6500 hours, 10,000 hours and 15,500 hours. The
difference in capacity between the exposed and unexposed control beams (Chapter 7)
provided a measure of the deterioration in the strength of the beams.
9.3 Experimental Set Up
9.3.1 Tank Set Up
The test set-up was identical to that described in Section 8.3.1 excepting that the
salt concentration was 5 % and the beams were kept upright with the CFRP material
102
nearest to the water surface. The variation of salt concentration with time is shown in
Figure 46.
Tides were simulated by raising and lowering the water level inside the tanks. The
plumbing system was similar to the one used for the durability study, Figure 36. For each
tide change water was pumped from the tank at a higher tide to the tank at a lower tide.
Low tide was maintained by keeping 150 mm of water in the tank and high tide by
maintaining it at 375 mm. The tide change caused a "splash zone" in the beams. The
"splash zone" was in the mid region of the beam as seen in Figure 47. The tank at high
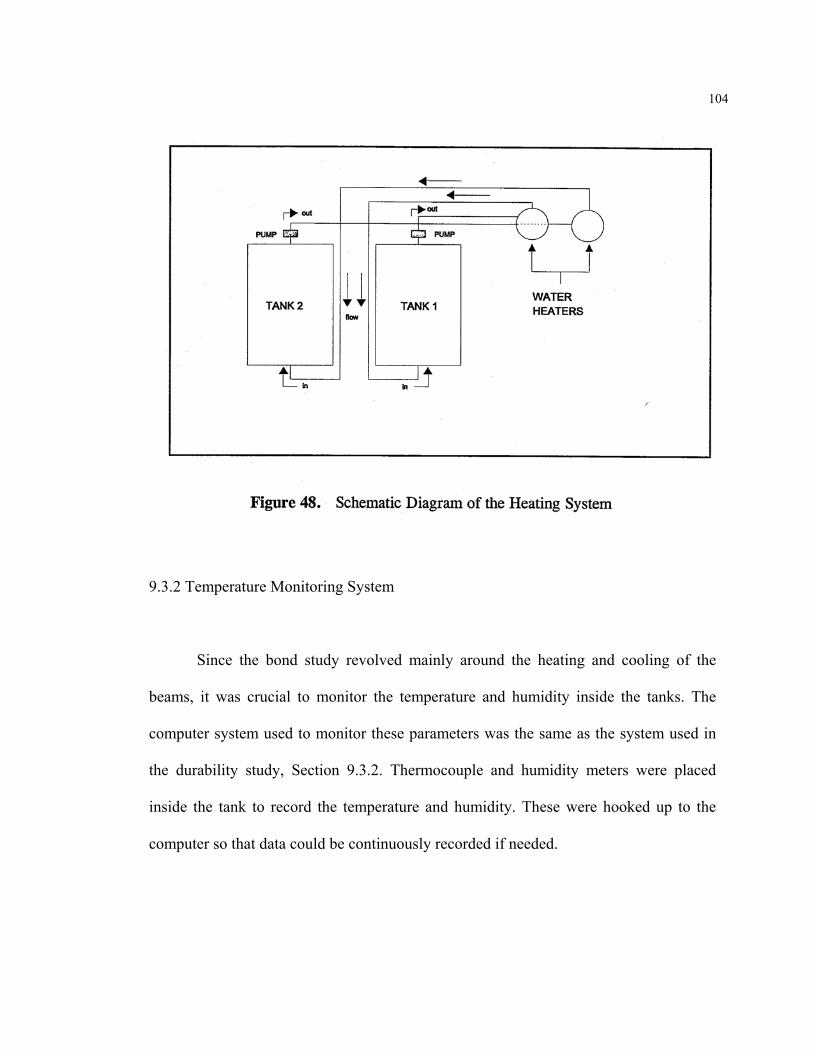
tide (tank-1) was then heated to 60°C and maintained at that temperature till the next tide
change, while the tank at low tide (tank-2) was allowed to cool. During tide change tank-1
was brought to low tide and allowed to cool while tank-2 was brought to high tide and
heated.
The salt water in the tanks was heated using commercial water heaters. Figure 48
shows a schematic diagram of the heating system. When the tank was being heated, it was
kept covered using styrofoam panels so that the temperature could be maintained at 60°C.
The tank was connected to a thermostat which helped maintain the temperature at 60°C.
Every time the temperature dropped 2°C below the required temperature, the heater
would start circulating hot water and vice versa when the temperature rose 2°C above.
Twelve cylinders, which were poured the same time as the beams, were also
placed in the tank to obtain the strength of concrete under the same conditions as the
beam. One cylinder was tested for every beam tested.
94
104
9.3.2 Temperature Monitoring System
Since the bond study revolved mainly around the heating and cooling of the
beams, it was crucial to monitor the temperature and humidity inside the tanks. The
computer system used to monitor these parameters was the same as the system used in
the durability study, Section 9.3.2. Thermocouple and humidity meters were placed
inside the tank to record the temperature and humidity. These were hooked up to the
computer so that data could be continuously recorded if needed.
105
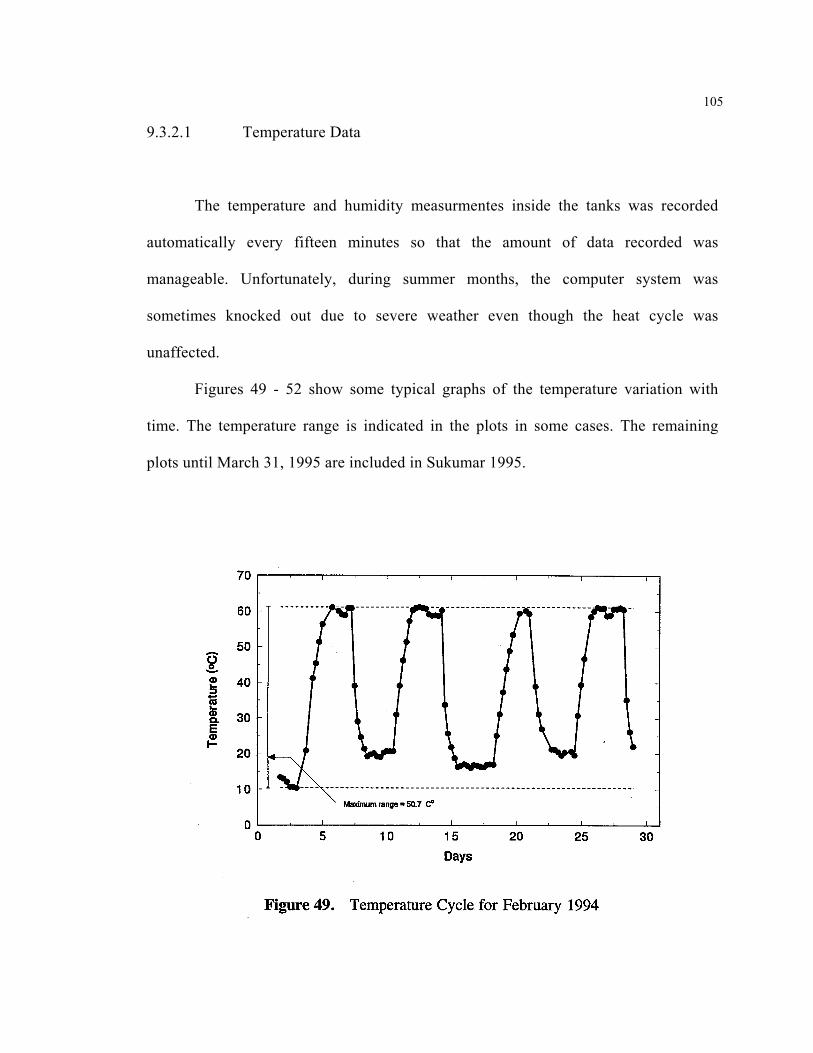
9.3.2.1 Temperature Data
The temperature and humidity measurmentes inside the tanks was recorded
automatically every fifteen minutes so that the amount of data recorded was
manageable. Unfortunately, during summer months, the computer system was
sometimes knocked out due to severe weather even though the heat cycle was
unaffected.
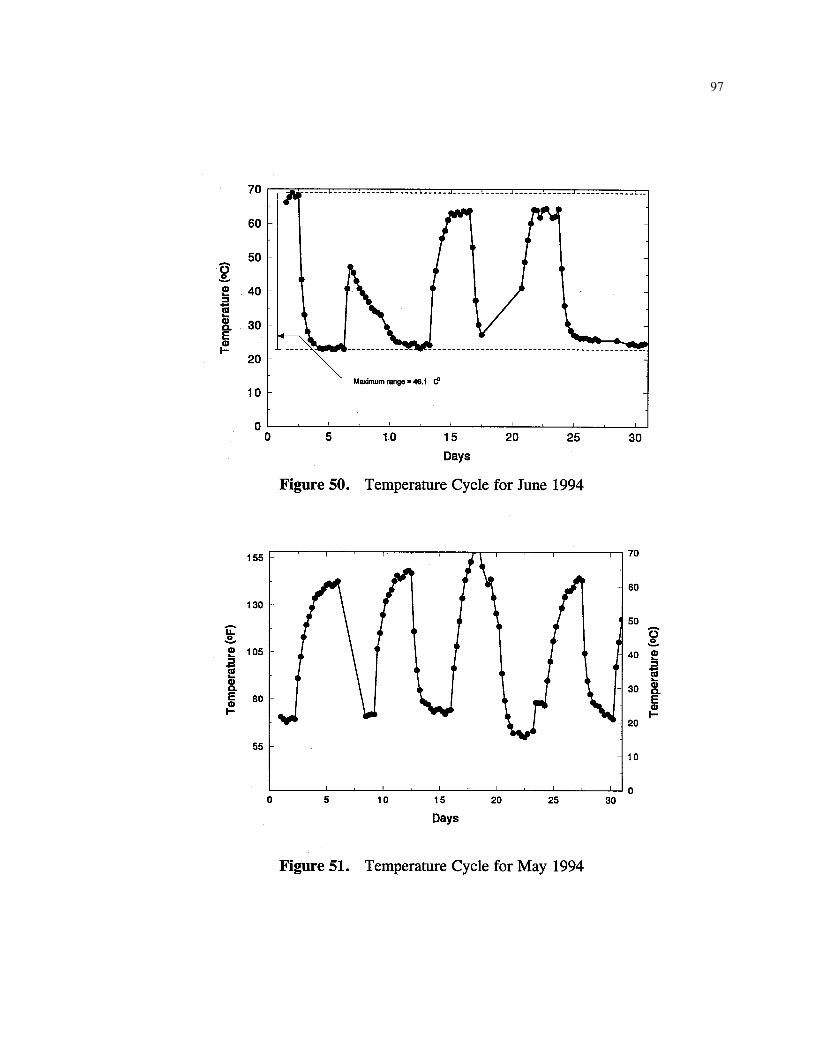
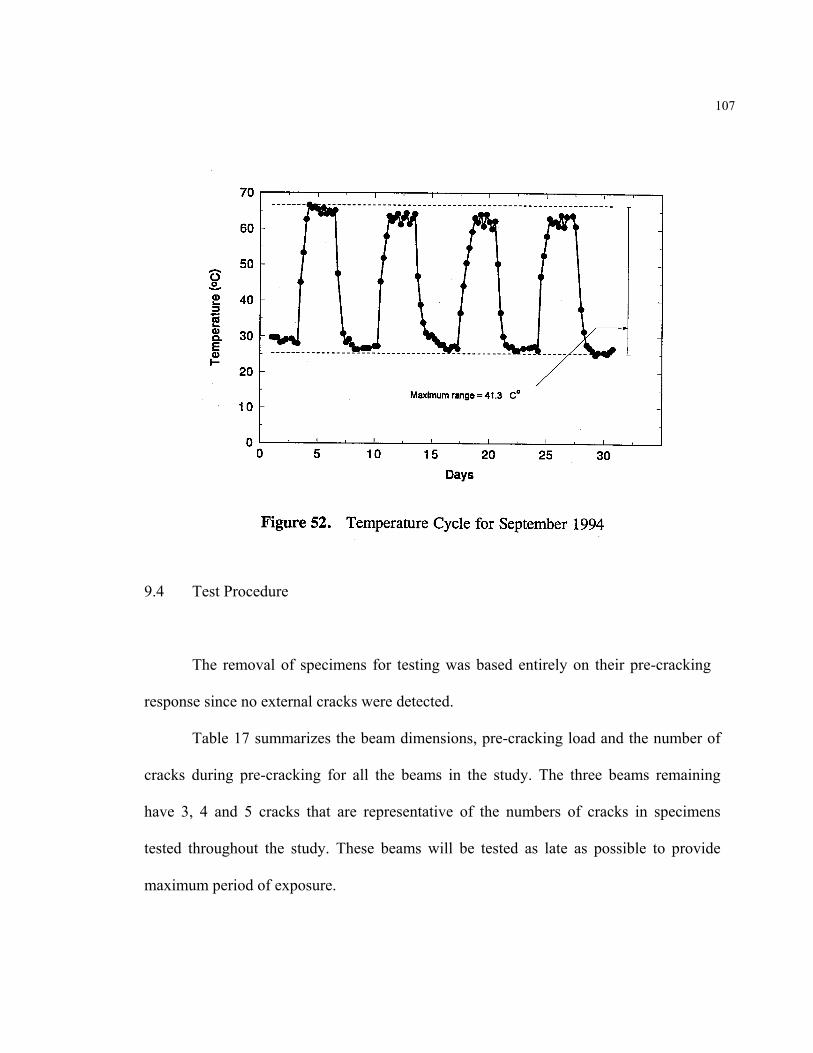
Figures 49 - 52 show some typical graphs of the temperature variation with
time. The temperature range is indicated in the plots in some cases. The remaining
plots until March 31, 1995 are included in Sukumar 1995.
97
107
9.4 Test Procedure
The removal of specimens for testing was based entirely on their pre-cracking
response since no external cracks were detected.
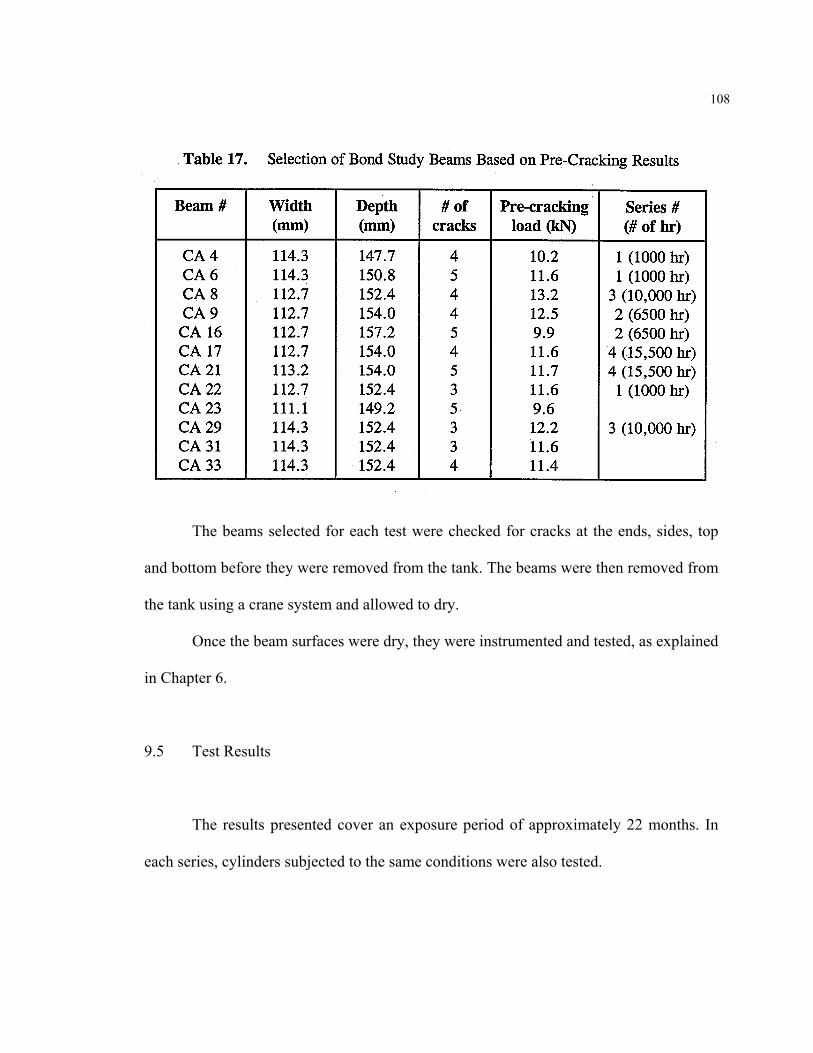
Table 17 summarizes the beam dimensions, pre-cracking load and the number of
cracks during pre-cracking for all the beams in the study. The three beams remaining
have 3, 4 and 5 cracks that are representative of the numbers of cracks in specimens
tested throughout the study. These beams will be tested as late as possible to provide
maximum period of exposure.
108
The beams selected for each test were checked for cracks at the ends, sides, top
and bottom before they were removed from the tank. The beams were then removed from
the tank using a crane system and allowed to dry.
Once the beam surfaces were dry, they were instrumented and tested, as explained
in Chapter 6.
9.5 Test Results
The results presented cover an exposure period of approximately 22 months. In
each series, cylinders subjected to the same conditions were also tested.
109
9.5.1 Loads
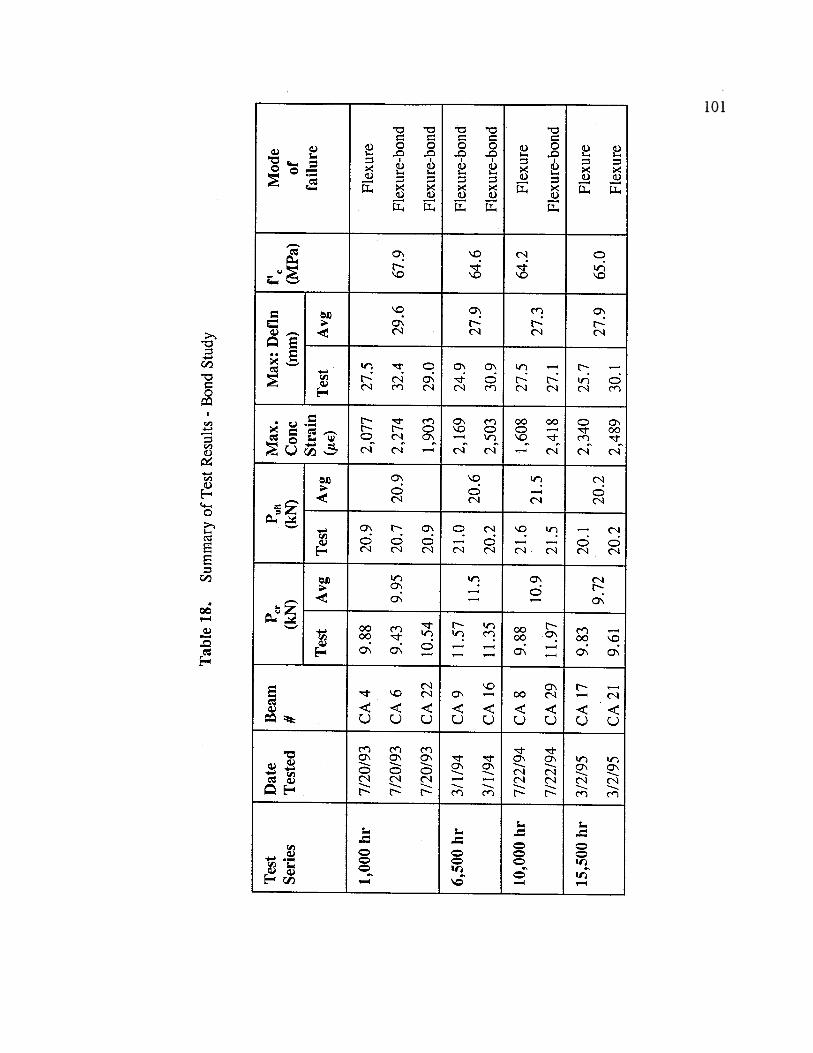
Table 18 gives the cracking loads, failure loads, maximum concrete strains,
maximum deflections, mode of failure and the concrete strengths of the nine beams
tested for the bond study.
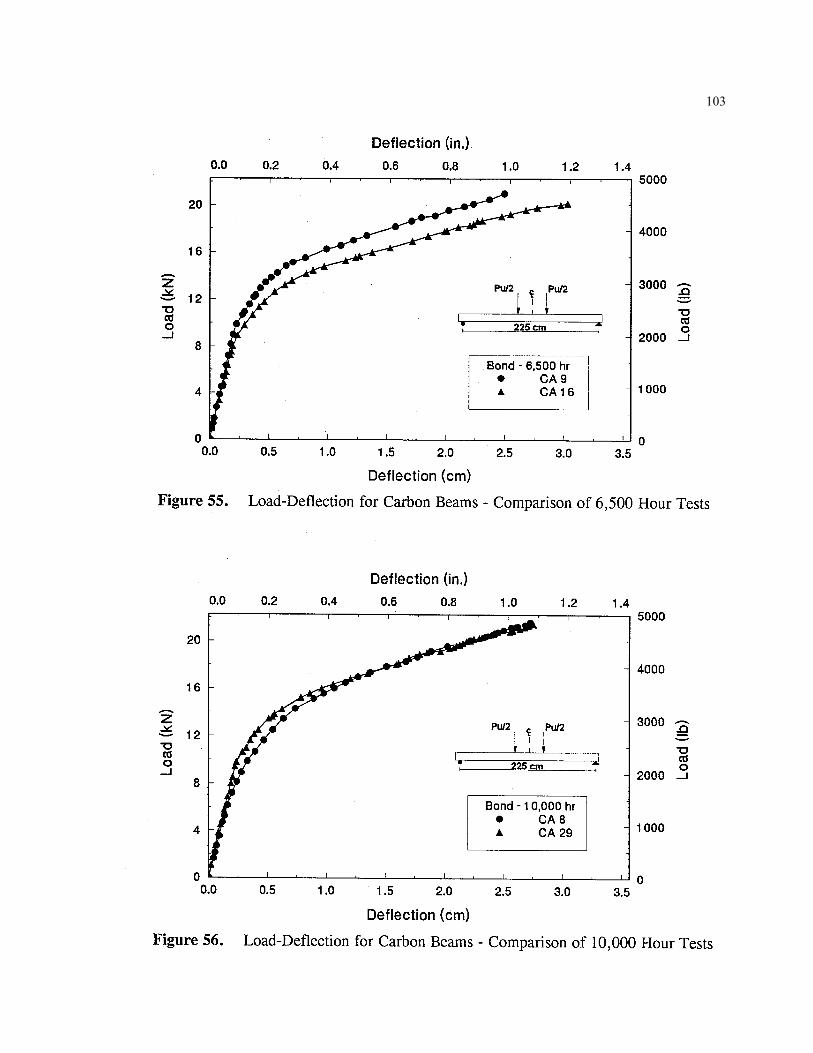
The ultimate loads in all the four series of tests ranged from 20 - 22 kN. The
average failure loads were 20.9 kN, 20.6 kN, 21.5 kN and 20.2 kN for the 1,000 hours,
6,500 hours, 10,000 hours and 15,500 hours, respectively. Thus, there was not much
variation in the failure load for all the four series
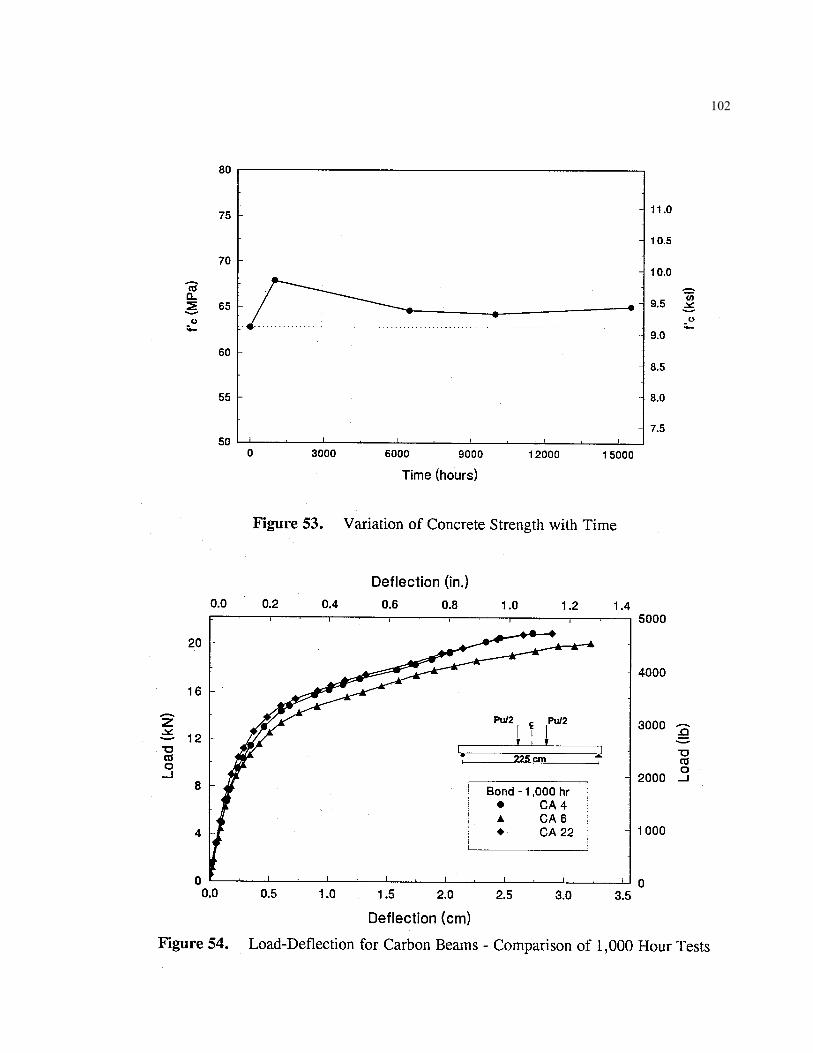
There was some reduction in concrete strength due to exposure in salt water,
similar to that encountered in the durability test (see Table 16). Figure 53 shows the
variation of concrete strength over the twenty two month period of testing.
The average cracking load fluctuated between 9.7 kN and 11.5 kN for the four
series of tests. This was lower than the original pre-cracking load presumably due to
long term prestress losses.
9.5.2 Deflections
The average deflections for the 1,000 hours, 6,500 hours, 10,000 hours and
15,500 hours were 29.6 mm, 27.9 mm, 27.3 mm and 27.9 mm, respectively. The
deflection reduced by 5.7% after the 1,000 hours test. Figures 54 - 57 show the load vs.
deflection curves for the four series of tests.
102
103
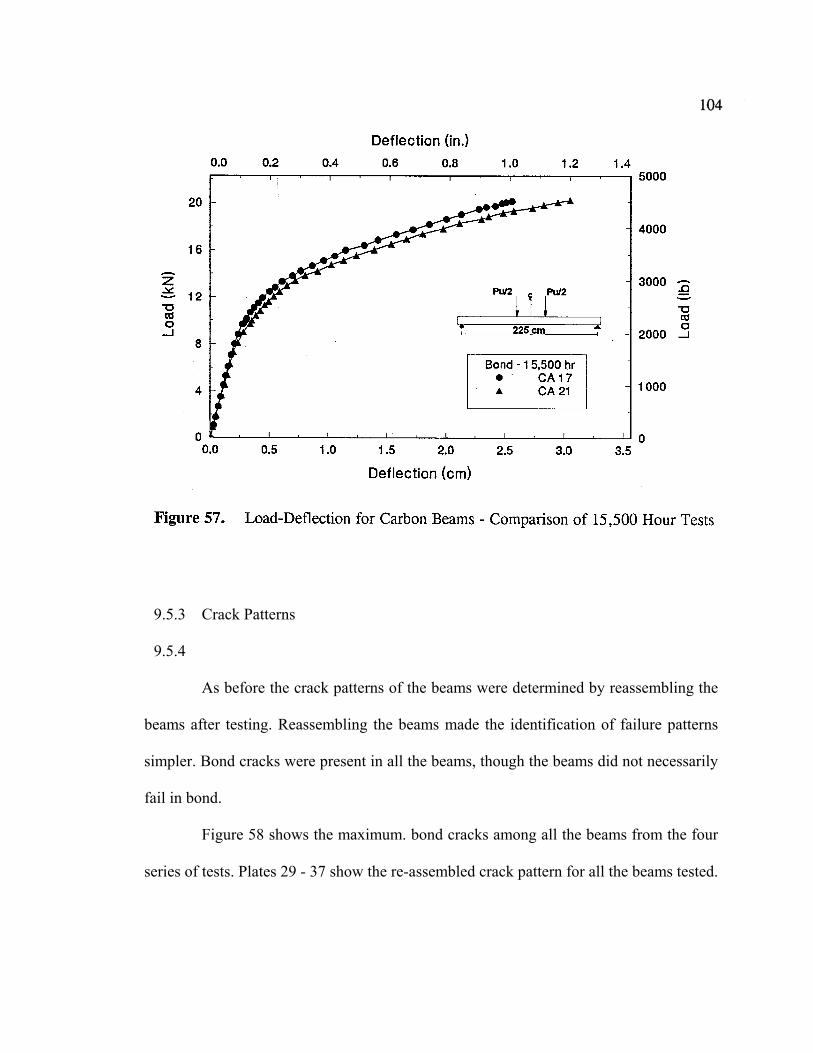
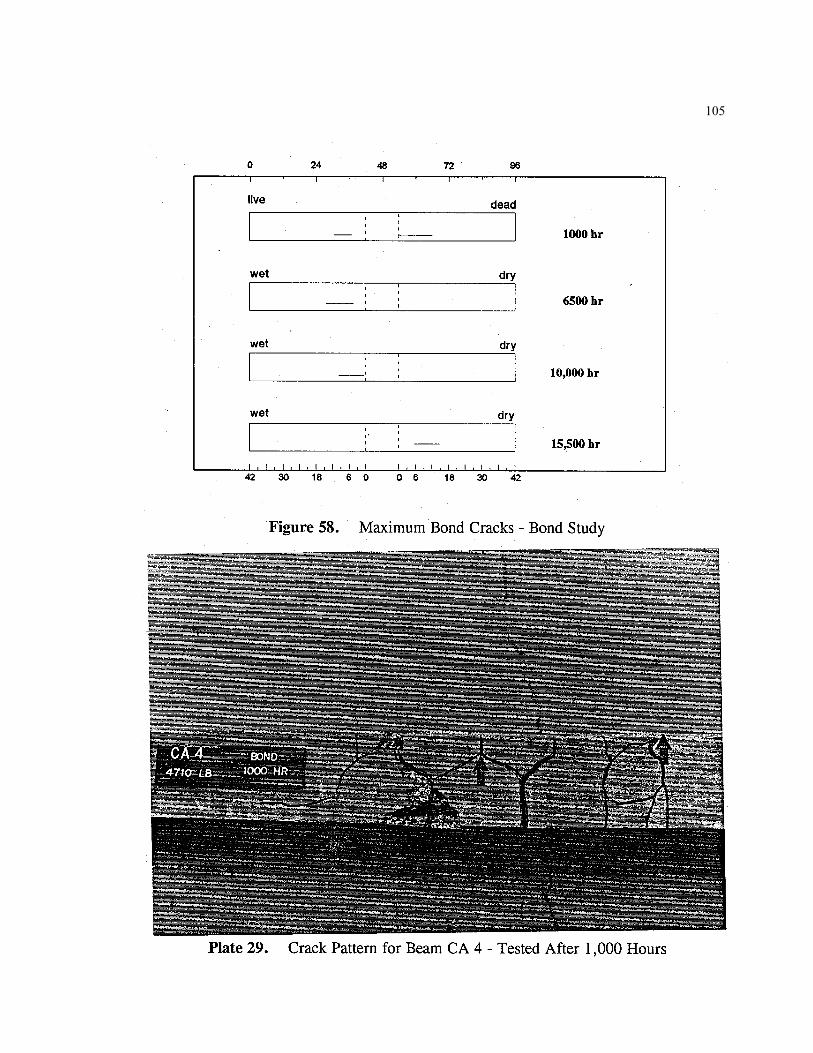
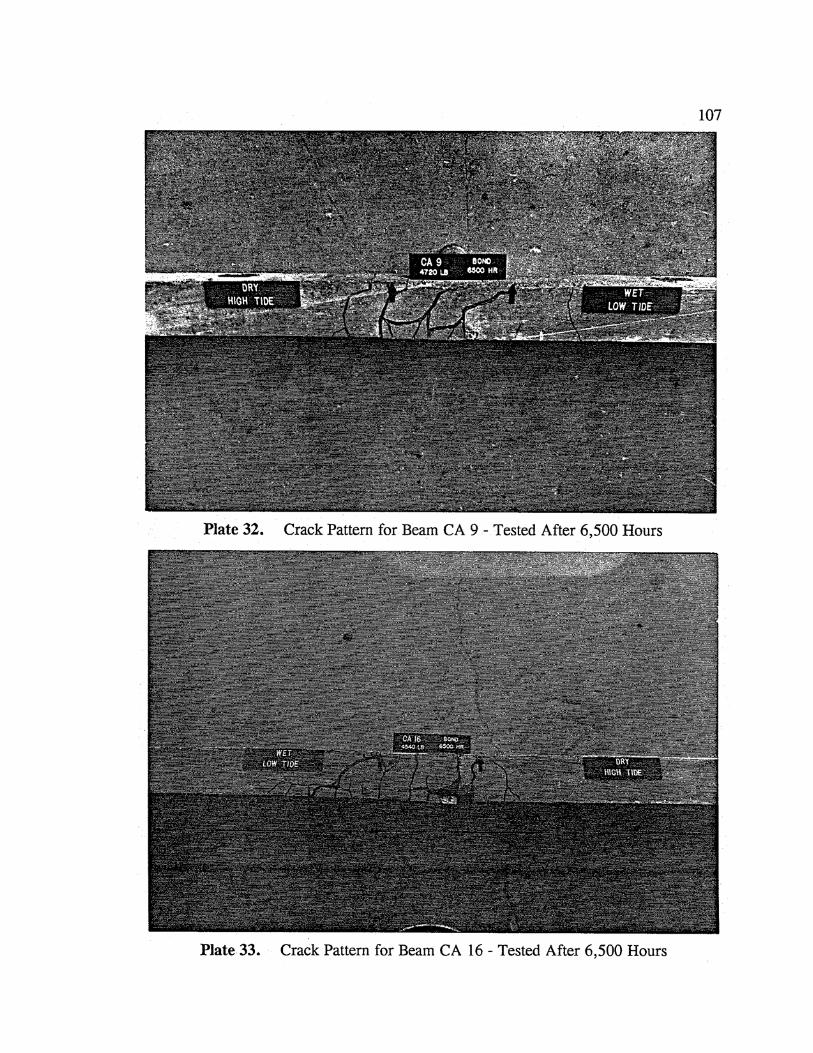
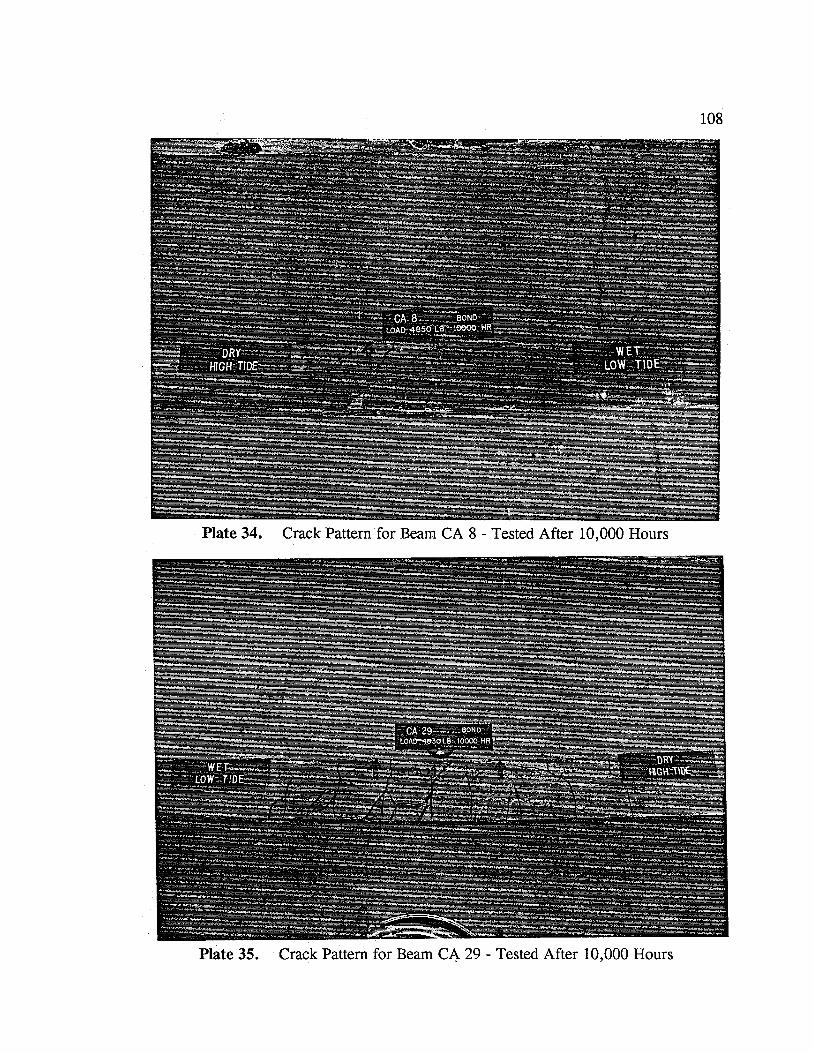
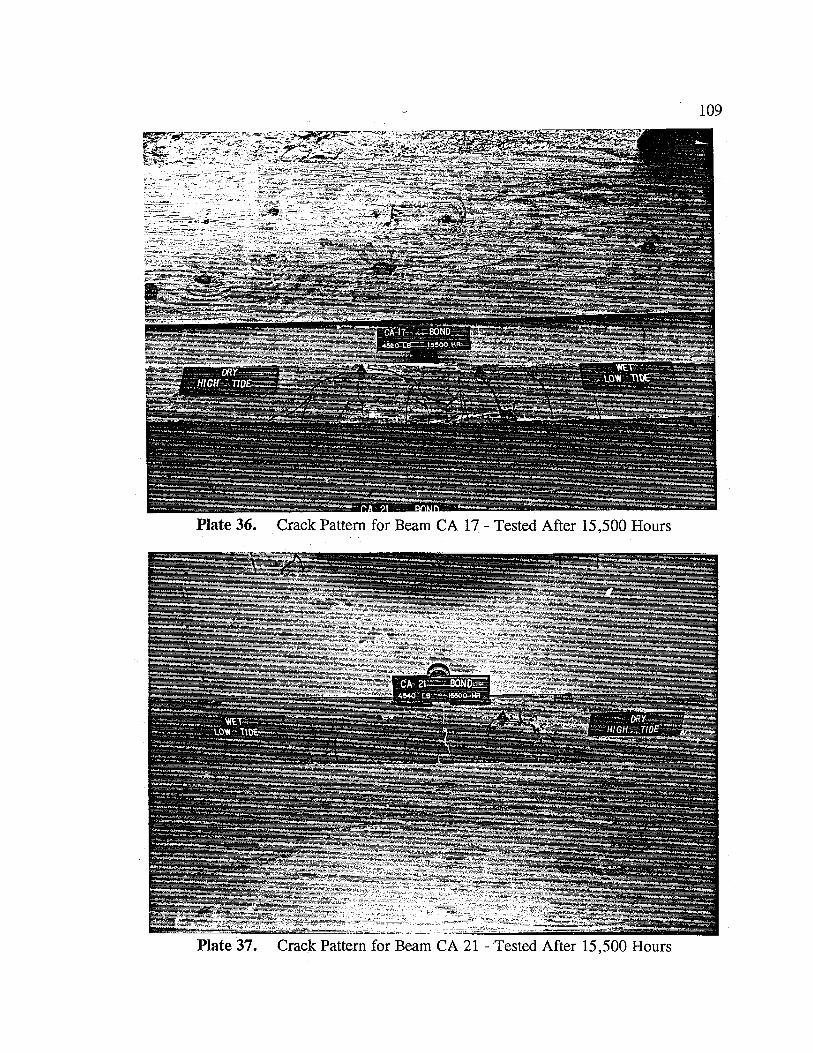
9.5.3 Crack Patterns
9.5.4
As before the crack patterns of the beams were determined by reassembling the
beams after testing. Reassembling the beams made the identification of failure patterns
simpler. Bond cracks were present in all the beams, though the beams did not necessarily
fail in bond.
Figure 58 shows the maximum. bond cracks among all the beams from the four
series of tests. Plates 29 - 37 show the re-assembled crack pattern for all the beams tested.
105

110
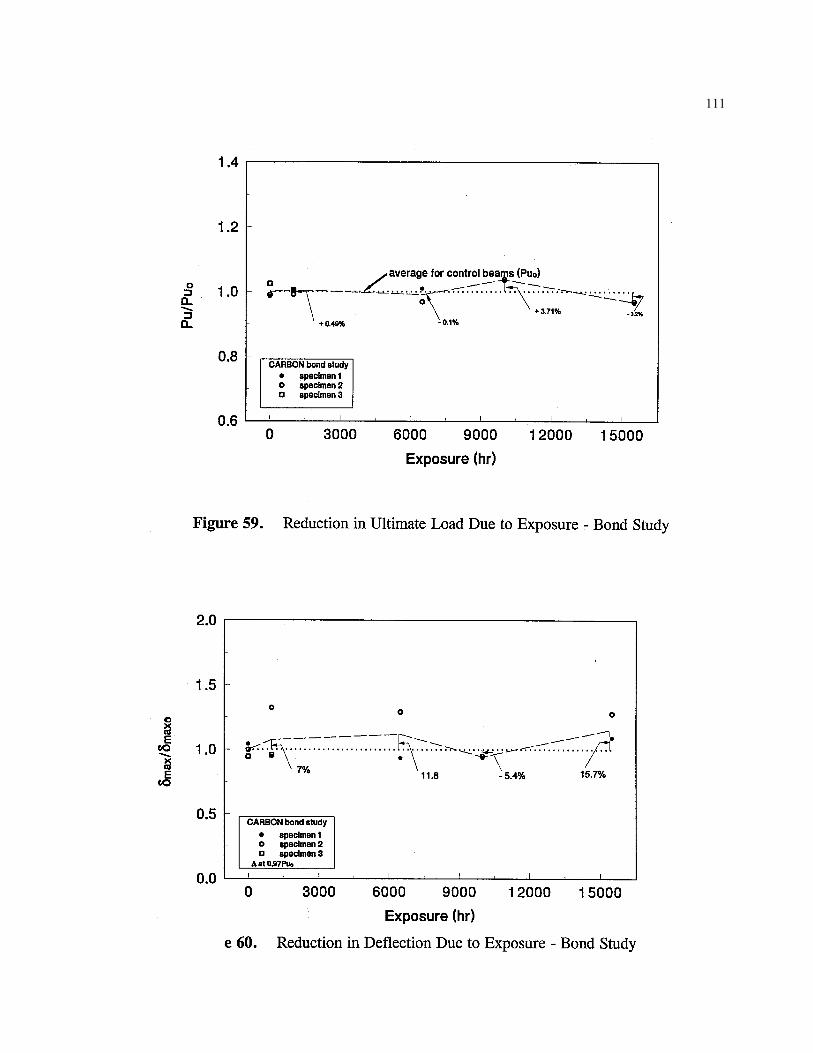
9.6 Discussion
To assess the loss of strength in the beams due to exposure, an analysis similar
to the one conducted in the durability study was performed. The reduction in the
ultimate load in the beams was calculated as a ratio of the average failure load of the
control beams, which were the two month outdoor exposure test results, Chapter 7. As
can be seen from Figure 59, the average failure load did not vary much for the 1,000
hours and 6,500 hours test. There was an increase in the ultimate load for the 10,000
hour test and a reduction of 3.2% for the 15,500 hours test. Thus, the ultimate load
did not show any trends for the whole period of exposure to thermal cycling.
A similar analysis was conducted to determine the loss in deflection of the
beams at failure, due to exposure. This analysis was also similar to that described in
Section 7.5. The lowest failure load from all the four series of tests, which was 97 %
of the failure load of the control beams, was selected for the comparison. The
deflections were then expressed as a ratio of the average deflection of the control
beams.
Figure 60, gives the plot of the ratio of deflection versus the exposure time.
There was no reduction in deflection for the 1,000 hours and 6,500 test. The reduction
was only 5.4 % for the 10,000 hours test and there was an increase in deflection by
15.7% for the 15,500 hours test. This shows that there no reduction in strain capacity
of the CFRP rods with exposure.
111
112
10. CONCLUSIONS
10.1 Introduction
The object of this study was to investigate the durability of CFRP pretensioned
piles in a marine environment. As such, three major investigations were initiated in
which durability was assessed for outdoor exposure, in concrete subjected to wet/dry
cycles and under a combination of tidal and thermal cycling. The only short term study
conducted was a field investigation of transfer length.
10.2 Short Term Study .
1. The theoretical transfer length of CFRP pretensioned beams was approximately
31 diameters or 18 cm. This is smaller than the 50 diameter used for steel.
2. Transfer length measurements in outdoor sites using drop-in forms may yield
different answers than anticipated form theoretical considerations. In this study,
the most probable cause of discrepancy was identified as frictional forces caused
by bending due to the eccentricity of the prestress force about the weak axis.
3. Existing facilities for prestressing steel can be readily adapted for CFRP.
122
10.3 Long Term Study
1. The outdoor study showed some reduction in ultimate strength with the duration
of exposure. There was a 6.2% reduction in strength between the beams tested at
two months and those tested at twenty months. The bond was unaffected nor was
there evidence of a reduction of strain capacity in the CFRP rod.
2. There was a 11.35% loss in strength after 24 months in the CFRP pretensioned
beams used in the durability study. However, there was no deterioration in bond
or evidence of increased brittleness.
3. There no was reduction in ultimate strength in the bond study specimens after
15,500 hours of exposure, although there was some evidence of bond cracking in
the failed beams. This suggests that the effect of mis-match in thermal expansion
coefficients between concrete and CFRP may be unimportant.
As the investigation is still on-going, the conclusions presented are necessarily
preliminary and are subject to change pending the outcome of the outstanding tests.
123
REFERENCES
American Association of State Highway and Transportation Officials (1994), Standard Specifications for Highway Bridges, 15th Edition, Washington, D.C. ACI 318-89 (1992), Building Code and Commentary, American Concrete Institute, Detroit, MI. Carrasquillo, R.L, Nilson, A.H. and Slate F. O. (1981), "Properties of High Strength Concrete Subject to Short-Term Loads," ACI Journal, May-June, pp 171178. Dolan, C.W. (1990), "Development in Non-Metallic Prestressing Tendons," PCI Journal, Vol. 35, No. 5, September-October, pp. 80-88. Gerritse, A. (1993), Private communication with R. S en dated May 30. Iyer, S.L. and Sen, R. (1991), Advanced Composite Materials in Civil Engineering Structures, ASCE, New York, NY. MacGregor, J.G. (1992), Reinforced Concrete: Mechanics & Design, Prentice-Hall, NJ, Second Edition. Mehta, P.K. and Monteiro, P. (1993), Concrete: Structure, Properties and Materials, Prentice-Hall, NJ, Second Edition. Nilson, A.H. (1987), Design of Prestressed Concrete, John Wiley & Sons, Second Edition. Rosas, J. (1995), "Studies in Durability of AFRP Pretensioned Piles." Master's Thesis submitted to Department of Civil Engineering & Mechanics, University of South Florida, Tampa, FL, May. Rostasy, F. S. (1989), "New Prestressing Materials," Congress Report, FIP'88-IXth Congress, Jerusalem, Israel, September, pp. 148-159.
115
Sen, R., Issa, M. and Mariscal, D.(1992), "Feasibility of Fiberglass Pretensioned Piles in a Marine Environment," August, Report CEM/ST/92/1, Florida Department of Transportation. Sen, R., Mariscal, D. and Shahawy, M. (1993a), "Durability of Fiberglass Pretensioned Beams," ACI Structural Journal, Vol 90, No. 5, September-October, pp. 525-533. Sen, R., Mariscal, D. and Shahawy, M. (1993b), "Investigation of S-2 Glass/Epoxy Strands in Concrete." ACI Special Publication 138, International Symposium on FRP Reinforcement for Concrete Structures (Ed. A. Nanni & C. Dolan), pp. 15-34. Sen, R., Issa, M., Wadsack, P. and Shahawy, M. (1993c), "Driving Stresses in Fiberglass Pretensioned Piles," ACI Structural Journal, Vol 90, No 6, NovemberDecember, pp. 666-674. Sen, R., Spillett, K. and Shahawy, M. (1994), "Fabrication of aramid and carbon fiber pretensioned beams," Concrete International, Vol 16, No 6, pp. 45-47. Sen, R. and Shahawy, M. (1994), "Accelerated Durability Testing of FRPs used in Highway Construction." Nenv Experimental Techniques for Evaluating Concrete Material and Structural Pel formance, ACI SP-143 (Ed. D. Stevens & M. Issa), pp. 297-314. Sen, R., Rosas, J. and Sukumar, S. (1995), "Durability of AFRP Pretensioned Piles in a Marine Environment. " Interim Filial Report Vol 1 submitted to Florida and US Department of Transportation, August. Shah, S.P and Ahmad, S.H (1985), "Structural Properties of High Strength Concrete and its Implications for Precast Prestressed Concrete," PCI Journal, Nov-Dec, pp 92-118. Sukumar, S. (1995), "Studies in Durability of CFRP Pretensioned Piles,". MSCE Thesis submitted to Department of Civil Engineering & Mechanics, University of South Florida, Tampa, FL, May.