
Departamentode Universidade de Aveiro 2018
79
Universidade de Aveiro Departamento de Electrónica, Telecomunicações e Informática, 2018 Leonardo Gabriel Sousa Coelho Plataforma web para gestão de processos ETL em ambientes multi-instituição. Web platform for ETL process management in multi-institution environments.
Transcript of Departamentode Universidade de Aveiro 2018

Universidade de AveiroDepartamento deElectrónica, Telecomunicações e Informática,
2018
Leonardo GabrielSousa Coelho
Plataforma web para gestão de processos ETLem ambientes multi-instituição.
Web platform for ETL process management inmulti-institution environments.


Universidade de AveiroDepartamento deElectrónica, Telecomunicações e Informática,
2018
Leonardo GabrielSousa Coelho
Plataforma web para gestão de processos ETLem ambientes multi-instituição.
Web platform for ETL process management inmulti-institution environments.
Dissertação apresentada à Universidade de Aveiro para cumprimento dos req-uisitos necessários à obtenção do grau de Mestre em Engenharia de Com-putadores e Telemática, realizada sob a orientação científica do ProfessorAssociado com Agregação José Luís Oliveira, Professor do DepartamentoEletrónica e Telecomunicações e Informática da Universidade de Aveiro.


o júri / the jury
presidente / president Prof. Dr. Augusto Marques Ferreira da SilvaProfessor Auxiliar do Departamento de Electrónica, Telecomunicações e Infor-mática da Universidade de Aveiro)
vogais / examiners committee Prof. Dr. José Luís OliveiraProfessor Associado com Agregação do Departamento de Electrónica, Telecomu-nicações e Informática da Universidade de Aveiro
Prof. Dr. Rui Pedro Sanches de Castro LopesProfessor Coordenador do Departamento de Informática e Comunicações do Insti-tuto Politécnico de Bragança


agradecimentos /acknowledgements
Inicialmente, quero agradecer ao meu orientador (Professor José LuísOliveira) pelo apoio, interesse e simpatia demonstrados ao longo de todoo trabalho. O seu sentido crítico foi muito importante para a qualidade dotrabalho desenvolvido e para o meu crescimento pessoal.
Em segundo lugar, quero agradecer ao meu co-orientador (Renato Pinho)e aos restantes colaboradores da BMD Software (Luís Bastião e ErikssonMonteiro). A vossa disponibilidade e colaboração foram inigualáveis. Sintoque este foi o ano que mais evoluí técnicamente, sobretudo graças a vocês.
Agradeço ainda a oportunidade proporcionada de fazer parte integrante dogrupo de bioinformática do IEETA da Universidade de Aveiro e do espirítode entre-ajuda que os membros do grupo sempre manisfestaram.
Por fim, queria fazer o agradecimento mais importante. Agradeço à minhafamília por todo o apoio que me ofereceram ao longo de todo este percurso.Permitindo a estabilidade emocional que necessitava para ter sucesso naquiloque mais gosto.


Resumo A evolução tecnológica e a digitização sucessiva de processos e serviços têmcriado novas oportunidades no domínio da integração de dados. A promessade tomada de decisões baseada em estatísticas tem sido amplamente re-conhecida. Nesse sentido, Data Warehouses são estruturas que procuramarmazenar todas as informações relevantes de um negócio em particular,possibilitando a análise eficiente de grandes volumes de dados, oferecendosuporte à tomada de decisões e à previsão de eventos futuros. Uma DataWarehouse pode integrar dados de múltiplas fontes. Sendo assim, os dadospresentes nas diversas fontes de dados heterogéneas devem ser devidamentecapturados, tratados e uniformizados. Os processos ETL respondem a essanecessidade, permitindo a definição de um fluxo de trabalho programado quecombina funções de extração, transformação e carregamento de dados.
O entusiasmo por ferramentas que permitem o desenvolvimento de processosETL de uma forma visual tem vindo a aumentar, pois tornam o processomais simples e intuitivo. Contudo, atualmente não existem ferramentasweb robustas e completas para o desenvolvimento de processos ETL. Umasolução web permite a instalação centralizada da aplicação, libertando odesenvolvedor dos processos ETL da necessidade de gerir a instalação daaplicação, assim como as suas dependências e conectores de bases de dados.
Esta dissertação teve como principal objetivo o desenvolvimento de umasolução web completa e robusta que permitisse o desenvolvimento e gestãode processos ETL num contexto multi-instituição. Sabendo que os dadosusados são tipicamente sensíveis, era necessário garantir a privacidade e pro-teção dos mesmos. Além disso, os processos ETL são executados periodica-mente para atualizar a Data Warehouse ou para a produção de relatóriosestatísticos, sendo necessária a capacidade de execução escalonada e per-iódica dos processos.


Abstract The technological evolution and the successive digitization of processes andservices created new opportunities for data collection in a wide range ofapplication areas. The promise of statistics-driven decision-making is nowbeing widely recognized. Data Warehouses seek to store all relevant in-formation for a particular business, allowing the efficient analysis of largevolumes of data, supporting decision-making and future events prediction.A Data Warehouse may integrate data from multiple data sources. Hence,the data present in the various heterogeneous data sources must be properlycaptured, parsed and standardized. ETL processes adress this need, allowingthe definition of a programming workflow which combines data extraction,transformation and loading functions.
The enthusiasm for tools that allow the development of ETL processes in avisual way has been increasing, because they make the process simpler andmore intuitive. However, there are currently no robust and comprehensiveweb tools for developing ETL processes. A web solution enables centralizedapplication installation, freeing the ETL process developer from the need tomanage the application installation, as well as its dependencies and databaseconnectors.The main goal of this dissertation was to develop a robust and comprehensiveweb solution for the development and management of ETL processes ina multi-institution environment. Knowing that the used data is typicallysensitive, it was necessary to ensure data privacy and protection. In addition,ETL processes are periodically executed to update the Data Warehouse orto produce statistical reports, requiring the ability to define scheduled andperiodic execution of ETL processes.


Contents
Contents i
List of Figures iii
List of Tables v
Acronyms 1
1 Introduction 31.1 Motivation and Goals . . . . . . . . . . . . . . . . . . . . . . . . . . . . . . . . 31.2 Thesis outline . . . . . . . . . . . . . . . . . . . . . . . . . . . . . . . . . . . . . 5
2 Background & State of the Art 72.1 Big Data . . . . . . . . . . . . . . . . . . . . . . . . . . . . . . . . . . . . . . . . 7
2.1.1 High-level pipeline . . . . . . . . . . . . . . . . . . . . . . . . . . . . . . 72.2 Business Intelligence . . . . . . . . . . . . . . . . . . . . . . . . . . . . . . . . . 92.3 ETL tools . . . . . . . . . . . . . . . . . . . . . . . . . . . . . . . . . . . . . . . 11
2.3.1 Open-Source Tools . . . . . . . . . . . . . . . . . . . . . . . . . . . . . . 122.3.2 Open-Source tools vs Commercial tools . . . . . . . . . . . . . . . . . . 15
2.4 Business Analytics Tools . . . . . . . . . . . . . . . . . . . . . . . . . . . . . . . 152.4.1 Power BI . . . . . . . . . . . . . . . . . . . . . . . . . . . . . . . . . . . 162.4.2 Metabase . . . . . . . . . . . . . . . . . . . . . . . . . . . . . . . . . . . 162.4.3 Saiku . . . . . . . . . . . . . . . . . . . . . . . . . . . . . . . . . . . . . 18
2.5 Business Intelligence Suites . . . . . . . . . . . . . . . . . . . . . . . . . . . . . 182.5.1 Pentaho . . . . . . . . . . . . . . . . . . . . . . . . . . . . . . . . . . . . 192.5.2 SpagoBI . . . . . . . . . . . . . . . . . . . . . . . . . . . . . . . . . . . . 202.5.3 Jaspersoft . . . . . . . . . . . . . . . . . . . . . . . . . . . . . . . . . . . 212.5.4 BI Suites comparison . . . . . . . . . . . . . . . . . . . . . . . . . . . . . 22
2.6 Summary . . . . . . . . . . . . . . . . . . . . . . . . . . . . . . . . . . . . . . . 23
3 Proposal Definition 253.1 Functional Requirements . . . . . . . . . . . . . . . . . . . . . . . . . . . . . . . 253.2 Non Functional Requirements . . . . . . . . . . . . . . . . . . . . . . . . . . . . 273.3 System Modeling . . . . . . . . . . . . . . . . . . . . . . . . . . . . . . . . . . . 27
3.3.1 Functional Model . . . . . . . . . . . . . . . . . . . . . . . . . . . . . . . 273.3.2 Data Model . . . . . . . . . . . . . . . . . . . . . . . . . . . . . . . . . . 283.3.3 Overall Architecture . . . . . . . . . . . . . . . . . . . . . . . . . . . . . 32
i

3.4 Summary . . . . . . . . . . . . . . . . . . . . . . . . . . . . . . . . . . . . . . . 35
4 System Implementation 374.1 The pipeline editor . . . . . . . . . . . . . . . . . . . . . . . . . . . . . . . . . . 374.2 ETL SDK . . . . . . . . . . . . . . . . . . . . . . . . . . . . . . . . . . . . . . . 37
4.2.1 Pentaho Data Integration . . . . . . . . . . . . . . . . . . . . . . . . . . 374.2.2 DI SDK . . . . . . . . . . . . . . . . . . . . . . . . . . . . . . . . . . . . 394.2.3 Rendering algorithm . . . . . . . . . . . . . . . . . . . . . . . . . . . . . 424.2.4 Extensibility . . . . . . . . . . . . . . . . . . . . . . . . . . . . . . . . . 44
4.3 Execution servers . . . . . . . . . . . . . . . . . . . . . . . . . . . . . . . . . . . 444.4 Task scheduler . . . . . . . . . . . . . . . . . . . . . . . . . . . . . . . . . . . . 464.5 Summary . . . . . . . . . . . . . . . . . . . . . . . . . . . . . . . . . . . . . . . 47
5 BICenter: Results and Use cases 495.1 BIcenter User Interface . . . . . . . . . . . . . . . . . . . . . . . . . . . . . . . . 495.2 A use case on biomarkers analysis . . . . . . . . . . . . . . . . . . . . . . . . . . 55
6 Conclusion 576.1 Future Work . . . . . . . . . . . . . . . . . . . . . . . . . . . . . . . . . . . . . 57
Bibliography 59
ii

List of Figures
1.1 PDI components by category. . . . . . . . . . . . . . . . . . . . . . . . . . . . . 5
2.1 The Big Data Analysis Pipeline (adapted from [1]). . . . . . . . . . . . . . . . . 82.2 Business Intelligence Architecture. . . . . . . . . . . . . . . . . . . . . . . . . . 102.3 Business Intelligence Pipeline. . . . . . . . . . . . . . . . . . . . . . . . . . . . . 102.4 A Dimensional Model of a Data Warehouse. . . . . . . . . . . . . . . . . . . . . 112.5 Overview of Kettle programs. Source by [2] . . . . . . . . . . . . . . . . . . . . 132.6 Power BI ecosystem. . . . . . . . . . . . . . . . . . . . . . . . . . . . . . . . . . 172.7 Metabase dashboard. . . . . . . . . . . . . . . . . . . . . . . . . . . . . . . . . . 172.8 Saiku dashboard. . . . . . . . . . . . . . . . . . . . . . . . . . . . . . . . . . . . 182.9 Pentaho Business Intelligence Suite. . . . . . . . . . . . . . . . . . . . . . . . . 192.10 Pentaho Architecture. . . . . . . . . . . . . . . . . . . . . . . . . . . . . . . . . 202.11 SpagoBI Architecture. . . . . . . . . . . . . . . . . . . . . . . . . . . . . . . . . 212.12 Jaspersoft Architecture. . . . . . . . . . . . . . . . . . . . . . . . . . . . . . . . 22
3.1 System use cases. . . . . . . . . . . . . . . . . . . . . . . . . . . . . . . . . . . . 263.2 System workfow to build, manage and execute ETL tasks. . . . . . . . . . . . . 283.3 Example of an ETL process. . . . . . . . . . . . . . . . . . . . . . . . . . . . . . 293.4 ETL process ER model. . . . . . . . . . . . . . . . . . . . . . . . . . . . . . . . 293.5 Institution ER model. . . . . . . . . . . . . . . . . . . . . . . . . . . . . . . . . 303.6 Execution ER model. . . . . . . . . . . . . . . . . . . . . . . . . . . . . . . . . . 313.7 RBAC ER model. . . . . . . . . . . . . . . . . . . . . . . . . . . . . . . . . . . . 323.8 Components diagram. . . . . . . . . . . . . . . . . . . . . . . . . . . . . . . . . 333.9 Deployment diagram. . . . . . . . . . . . . . . . . . . . . . . . . . . . . . . . . . 343.10 MVC architecture. . . . . . . . . . . . . . . . . . . . . . . . . . . . . . . . . . . 34
4.1 MxGraph architecture. . . . . . . . . . . . . . . . . . . . . . . . . . . . . . . . . 384.2 ETL task execution flowchart. . . . . . . . . . . . . . . . . . . . . . . . . . . . . 394.3 ETL task construction flowchart. . . . . . . . . . . . . . . . . . . . . . . . . . . 394.4 Trans builder class diagram. . . . . . . . . . . . . . . . . . . . . . . . . . . . . . 414.5 TransExecutor class. . . . . . . . . . . . . . . . . . . . . . . . . . . . . . . . . . 414.6 Boolean condition . . . . . . . . . . . . . . . . . . . . . . . . . . . . . . . . . . . 434.7 SortRows component specification. . . . . . . . . . . . . . . . . . . . . . . . . . 444.8 Slave server configuration. . . . . . . . . . . . . . . . . . . . . . . . . . . . . . . 454.9 Dynamic Carte cluster configuration . . . . . . . . . . . . . . . . . . . . . . . . 46
5.1 Login page. . . . . . . . . . . . . . . . . . . . . . . . . . . . . . . . . . . . . . . 49
iii

5.2 Main page. . . . . . . . . . . . . . . . . . . . . . . . . . . . . . . . . . . . . . . 505.3 Editor toolbar. . . . . . . . . . . . . . . . . . . . . . . . . . . . . . . . . . . . . 505.4 Institution page. . . . . . . . . . . . . . . . . . . . . . . . . . . . . . . . . . . . 505.5 Count rainy days by month. . . . . . . . . . . . . . . . . . . . . . . . . . . . . . 515.6 Resource settings . . . . . . . . . . . . . . . . . . . . . . . . . . . . . . . . . . . 515.7 Filter rows settings page. . . . . . . . . . . . . . . . . . . . . . . . . . . . . . . . 525.8 Filter rows input fields. . . . . . . . . . . . . . . . . . . . . . . . . . . . . . . . . 525.9 Scheduling a ETL task on a remote execution server. . . . . . . . . . . . . . . . 535.10 Execution scheduling table. . . . . . . . . . . . . . . . . . . . . . . . . . . . . . 535.11 Execution history. . . . . . . . . . . . . . . . . . . . . . . . . . . . . . . . . . . 545.12 Execution logs. . . . . . . . . . . . . . . . . . . . . . . . . . . . . . . . . . . . . 545.13 Execution step measures. . . . . . . . . . . . . . . . . . . . . . . . . . . . . . . 545.14 Preview execution output. . . . . . . . . . . . . . . . . . . . . . . . . . . . . . . 555.15 ETL task to calculate biomarkers averages. . . . . . . . . . . . . . . . . . . . . 555.16 Biomarkers averages. . . . . . . . . . . . . . . . . . . . . . . . . . . . . . . . . . 56
iv

List of Tables
2.1 Criteria fulfillment by the candidates . . . . . . . . . . . . . . . . . . . . . . . . 14
3.1 List of user stories . . . . . . . . . . . . . . . . . . . . . . . . . . . . . . . . . . 263.2 List of supported ETL components . . . . . . . . . . . . . . . . . . . . . . . . . 273.3 Data source fields . . . . . . . . . . . . . . . . . . . . . . . . . . . . . . . . . . . 303.4 Execution server fields . . . . . . . . . . . . . . . . . . . . . . . . . . . . . . . . 303.5 Step Metrics fields . . . . . . . . . . . . . . . . . . . . . . . . . . . . . . . . . . 31
4.1 Cron expression fields. . . . . . . . . . . . . . . . . . . . . . . . . . . . . . . . . 46
v

vi

Acronyms
• AD: Active Directory
• API: Application Programing Interface
• BA: Business Analytics
• BI: Business Intelligence
• DI: Data Integration
• ETL: Extract, Transform and Load
• ER: Entity-Relationship
• GWT: Google Web Toolkit
• IPC: Informatica Power Center
• LDAP: Lightweight Directory Access Protocol
• MVC: Model-View-Controller
• OLAP: Online Analytical Processing
• PDI: Pentaho Data Integration
• RBAC: Role Based Access Control
• SDK: Software Development Kit
• TOS: Talend Open Studio
1

2
Chapter 1
Introduction
1.1 Motivation and Goals
The technological evolution and the successive digitization of processes and services creatednew opportunities for data collection in a wide range of application areas. The promise ofstatistics-driven decision-making is now being widely recognized, mainly due to a developingenthusiasm around the Big Data concept. However, currently there is a discrepancy betweenthe potential of Big Data and its realization. Heterogeneity, scale, timeliness, complexity andprivacy problems, limit the progress at all phases of the pipeline that can create value fromthe data [3, 4, 5, 6].
Business Intelligence (BI) allows the implementation of processes to analyze and presentBig Data in a useful way for a particular business. BI includes a wide range of tools, ap-plications and methodologies which empowers organizations with internal and external datacollection capabilities, which allows data preparation for analysis, and enables to develop andexecute queries against the data, to provide visually appealing analytical results for decisionmakers, namely reports, dashboards and data visualizations [7, 8]. BI software can be repre-sented by three broad application categories: data management, data discovery, and reportingtools. Data management tools typically belong to the bottom tier, where data needs to becollected, transformed and loaded to the target system, usually a data warehouse. Data dis-covery applications, related to the middle tier, provides the ability to sift through data andbuild business value conclusions. Reporting tools, in front tier, are keen on the translation ofbusiness value conclusions into more user-friendly information, such as graphs or customizedreports.
Data Warehousing simplify the capture and analysis of data from multiple sources. How-ever, the process of data integration and transformation into a data warehouse typically con-sumes up to 80 percent of development resources [9]. In order to store data in an efficient way,the collected raw data must be properly parsed and handled. Extract, Transform and Load(ETL) is a programming workflow that addresses this need, through the combination of threedistinct functions: 1) The Extract function reads and collects a useful subset, from distinctand heterogeneous data sources; 2) The Transform function manipulates the data to convertit to the desired format and state; 3) The Load function stores the resulting dataset into thetarget database. ETL tools are the key components in the construction of data warehouses,by managing all the input processes [10].
A typical ETL process consist in a pipeline that encompasses a finite number of transfor-
3

mation steps applied over a data stream. Considering a real-life complex scenario, the numberof transformation steps will grow exponentially. Due to the pipeline complexity growth, thepipeline management will become unbearable and highly susceptible to errors. Thus, it iscrucial to build tools that facilitates the management of ETL processes.
Various GUI-based tools have been built aiming to simplify the construction of ETL pro-cesses. To help understanding and identifying the most relevant and complete graphical ETLtools available on the market, several surveys have been presented [11, 12]. Briefly, both Tal-end Open Studio (TOS) and Pentaho Data Integration (PDI or Kettle) are recognized as themost powerful open-source tools currently available, despite the increasing relevance of newtools such as CloverETL. In these tools the user is able to define a ETL process by building avisual pipeline formed by ETL components. The pipeline is built using drag-and-drop actionsand ETL components configuration.
One of the main focus of these GUI-based tools is to support a higher level of engagementof users without a deep technical expertise. Nonetheless, current ETL tools, namely PDI,TOS and CloverETL, are all desktop-based, a characteristic that implies some technical skills,namely the ability to install the solution, the platform dependencies and the database con-nectors. Since ETL GUI-based tools seek to approach non-IT people, this problem appearsas a contradiction to the tools’ original purpose.
The aforementioned problems have been already identified by other authors, who alsoargued that a web-based solution would have a positive impact on the creation of a moretransparent environment for data integration, facilitating the creation of ETL pipelines tonon-IT people. In a web solution, the installation would be centralized, and the systemmanager would be in charge of all underlying details.
Krishna et al. [13] firstly proposed a web-based framework for representing data extractionfrom one or more data sources, transformation business logics and the load of data within adata warehouse. Later [14], they provide the capability to pre-configure multi-source con-nections that can be used in future transformations. The application also offers a viewabletransformation report with execution metrics, in order to measure data quality and accuracy.In a distinct work, Novak et al. [15] proposed a prototype of a web ETL tool. The authorsemphasize that as far as they knew there was no such thing as a complete and fully web-basedopen-source ETL tool. They also stated that with a web-based solution users could savetime and space required for installation purposes, the application would be easily accessibleanywhere via web browser and multiple users could work simultaneously.
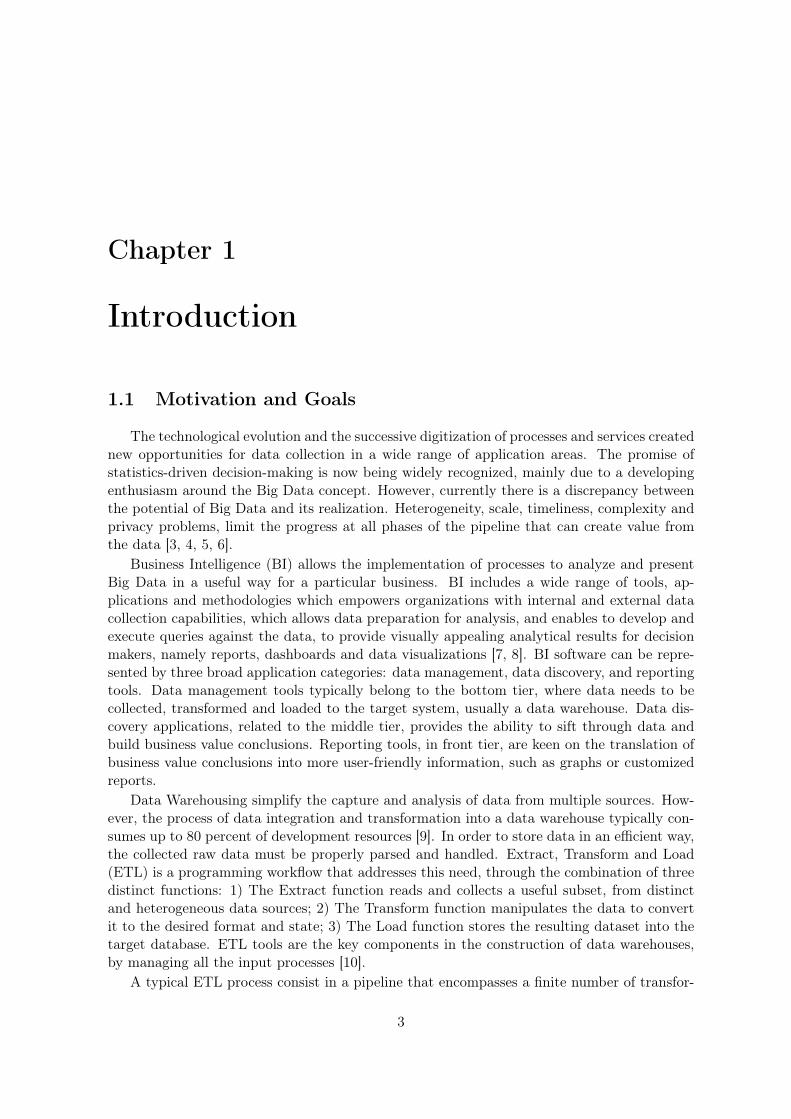
However, existing web ETL solutions are quite limited, since they only encompass a veryrestricted set of ETL components. On the other hand, the existent desktop-based ETL tools(such as PDI or TOS) offers an endless number of components. For instance, Pentaho Data In-tegration latest version (v8.0) provides 237 ETL components, divided by 23 different categories(Figure 1.1). Considering the data heterogeneity of Big Data environments, it is interestingto know that PDI supports an enormous amount of different types of data sources, namelyvarious types of structured, unstructured and distributed databases, OLAPs, text files, mails 1.
Typically, desktop-based ETL tools use an application programing interface (API) as theback-engine to empower the tool. Open-source ETL projects, such as Pentaho, Talend andCloverETL, make their ETL APIs public available. Hence, there is the possibility to use analready existent ETL API embedded in a web solution. This idea was already explored in
1https://wiki.pentaho.com
4
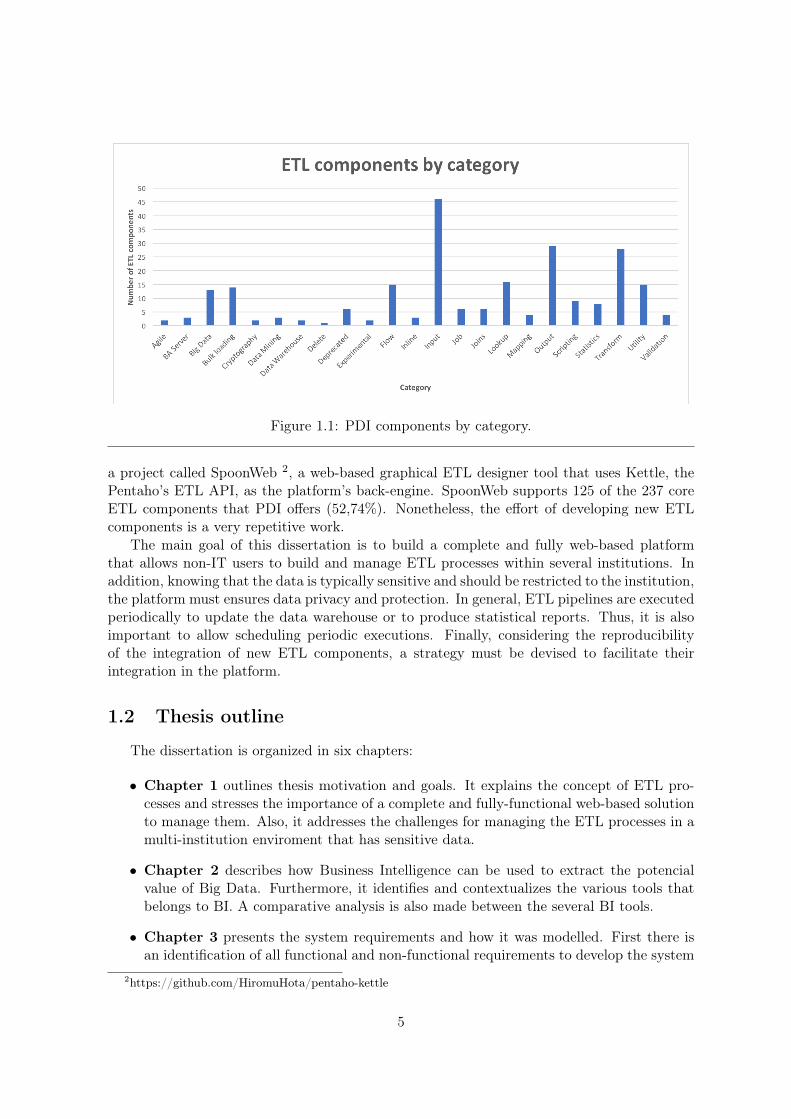
Figure 1.1: PDI components by category.
a project called SpoonWeb 2, a web-based graphical ETL designer tool that uses Kettle, thePentaho’s ETL API, as the platform’s back-engine. SpoonWeb supports 125 of the 237 coreETL components that PDI offers (52,74%). Nonetheless, the effort of developing new ETLcomponents is a very repetitive work.
The main goal of this dissertation is to build a complete and fully web-based platformthat allows non-IT users to build and manage ETL processes within several institutions. Inaddition, knowing that the data is typically sensitive and should be restricted to the institution,the platform must ensures data privacy and protection. In general, ETL pipelines are executedperiodically to update the data warehouse or to produce statistical reports. Thus, it is alsoimportant to allow scheduling periodic executions. Finally, considering the reproducibilityof the integration of new ETL components, a strategy must be devised to facilitate theirintegration in the platform.
1.2 Thesis outline
The dissertation is organized in six chapters:
• Chapter 1 outlines thesis motivation and goals. It explains the concept of ETL pro-cesses and stresses the importance of a complete and fully-functional web-based solutionto manage them. Also, it addresses the challenges for managing the ETL processes in amulti-institution enviroment that has sensitive data.
• Chapter 2 describes how Business Intelligence can be used to extract the potencialvalue of Big Data. Furthermore, it identifies and contextualizes the various tools thatbelongs to BI. A comparative analysis is also made between the several BI tools.
• Chapter 3 presents the system requirements and how it was modelled. First there isan identification of all functional and non-functional requirements to develop the system
2https://github.com/HiromuHota/pentaho-kettle
5

and, from those requirements, it was made the proposal for implementation. It describesthe proposed business process, the data model and the system overall architecture.Finally, it was explained the deployment strategy.
• Chapter 4 explains the implementation decisions. Summarily, it performs a detaileddescription of the relevant aspects of each system logical component described in theoverall architecture.
• Chapter 5 presents the thesis results, by showing the system main workflow. It alsopresents a use case in the mass spectrometry scenario.
• Chapter 6 presents the conclusion of this thesis and proposes future works.
6

Chapter 2
Background & State of the Art
2.1 Big Data
Big data is typically used to define large volumes of data, both structured or unstructured,that inundates a business on daily basis. Big Data environment are noisy and there willbe a significant amount of invalid or corrupted records. Those records must be discardedduring the acquisition phase. However, currently that decision is made in an ad hoc fashion.Furthermore, data are not natively in a structured format. Tweets and blogs are examplesof weakly structured pieces of text. Images and videos are structured just for storage anddisplay, but not for semantic content and search. Therefore, it is necessary to transformthe content into a suitable structured format for later analysis. Nevertheless, this can be ahuge challenge. Moreover, the value of data explodes when it is aggregated with other sources,however considering the data heterogeneity, data integration can be a major challenge. [16, 4, 5]Nevertheless, if these obstacles are overcome a huge improvement can be introduced to thebusiness. Decisions that previously were made based on guesswork, or on artificial models ofthe reality, can now be made automatically using the data itself. [6]
2.1.1 High-level pipeline
The analysis of Big Data involves multiple distinct phases and each phase must be carefullythought in order to build a powerful solution. As the Figure 2.1 suggests, the main steps are:
1) This first step consists in collecting the data from several sources. Since part of thedata is of no interest, this phase also considers the filtering and compression of the captureddata. So, the definition of how data will be discarded, will be a major issue;
2) Seldom the collected information will be ready for analysis. So, the captured datacannot be left untouched, if an efficiently data analysis is expected. Rather, it is necessary todevelop and apply information extraction processes to capture all relevant information from theunderlying sources and translate it into the appropriate format for analysis. Performing thistype of operations in a right and complete fashion represents a continuing technical challenge;
3) This phase considers the heterogeneity of the data flood, recognizing that it’s notenough to merely record and stores it in a repository. Considering a non-hierarchical group ofdatasets in a given repository, it is unlikely that these data will be useful someday. However,the adequate meta-data will ease the usefulness of the data, still there will exist challenges toovercome. Data analysis is considerably more demanding than simply locating, identifying,
7

Figure 2.1: The Big Data Analysis Pipeline (adapted from [1]).
understanding, and citing data. For effective large-scale analysis all of this has to happen ina completely automated manner;
4) This is possibly the most important step of the analysis pipeline, where the existingdata is actually processed and analyzed. Querying and mining methods for Big Data is sub-stantially different from traditional statistical analysis on small samples. These data are oftennoisy, dynamic, heterogeneous, inter-related and untrustworthy. Nevertheless, even noisy, BigData could be more valuable than tiny samples since general statistics obtained from frequentpatterns and correlation analysis usually overpower individual fluctuations and often disclosemore reliable hidden patterns and knowledge. Further, interconnected Big Data forms largeheterogeneous information networks, with which information redundancy can be explored tocompensate for missing data, to crosscheck conflicting cases, to validate trustworthy relation-ships, to disclose inherent clusters, and to uncover hidden relationships and models. Miningrequires integrated, cleaned, trustworthy, and efficiently accessible data, declarative query andmining interfaces, scalable mining algorithms, and big-data computing environments [17];
5) Data interpretation arises from the need to give valuable information to most people aspossible. The potential value of analyzing Big Data is only harnessed, if users understand theanalysis. Therefore, data interpretation consists in transforming the existent data to a formatthat will be understandable for the ordinary user. In a nutshell, most of the time, just providingthe results is not enough. Rather, supplementary information must be provided explaininghow results were derived upon precisely what inputs. Such supplementary information is calledthe provenance of the resulting data. Improving the capture, storage and query provenance, inconjunction with adequate meta-data capture techniques, an infrastructure can be built, andprovided to users, with the ability to interpret analytical results and to repeat the analysiswith different assumptions/parameters or datasets; [1]
Although the analysis phase is crucial, it is important not to underestimate all other phasesof the data analysis pipeline. For instance, Big Data needs to be managed in a context, whichmay be noisy, heterogeneous and not include an upfront model. Doing so raises the needto handle uncertainty and errors. Similarly, the questions to the data analysis pipeline willtypically not all be laid out in advance. We may need to figure out good questions based on thedata. Therefore, a good planning of the big picture, considering data acquisition, extraction,
8

integration, analysis and interpretation, must be done, in order to take most advantages ofthe provided data. [1]
Nowadays, there is a major bottleneck in the number of people capable to ask usefulquestions to the data and analyze it properly. It is possible to significantly increase thenumber of users capable to work with the data, by supporting many levels of engagementwith it, not all requiring deep technical expertise. Existing computational techniques can beapplied, at least in some aspects of the Big Data problem. For example, relational databasesrely on the notion of logical data independence, therefore, users can think about what theywant to compute, while the system determines the way it will be efficiently computed.
2.2 Business Intelligence
The ultimate benefit of Business Intelligence (BI) is to accelerate and improve decisionmaking, with the intent of increasing operational efficiency, and eventually gaining competitiveadvantages over business rivals. It also helps to identify market trends and spot businessproblems early. BI data can be either dynamic or statical, since data can include historicalinformation, as well as new data gathered from source systems as it is generated, enablingBI analysis to support both strategic and tactical decision-making processes. In the past,Business Intelligence tools were mostly used by data analysts and others IT professionals,but business executives are increasingly using BI software themselves, thanks to the recentdevelopment of user-friendly and ordinary user oriented BI platforms.
BI combines a broad set of data analysis applications, including ad hoc analysis andquerying, enterprise reporting and online analytical processing (OLAP). BI technology alsoincludes data visualization software for designing charts and other info-graphics, as well astools for building BI dashboards and performance scorecards that display viewable data onbusiness metrics and key performance indicators in an easy-to-grasp way. BI programs can alsoincorporate forms of advanced analytics, such as data mining, predictive analytics, text mining,statistical analysis and big data analytics. Figure 2.2 illustrates how the tools cooperate witheach other in order to extract the potential business value of Big data.
BI environments are related with the management and processing of huge volumes of data,which must be stored efficiently, in order to smooth later analysis. Therefore, as Figure 2.3suggests, data must be stored in specialized data structures, designed as data warehouses. [18]
A Data Warehouse usually encompasses a huge domain. However, that big domain istypically composed by smaller domains more or less independent between them. Each one ofthose small domains can be represented by a Data Mart. In other words, a Data Warehouse canbe seen as a central repository for all data. Data Marts seek to meet the particular demandsof a specific group of users. So, organization’s Data Marts are subsets of the organization’sData Warehouse. [19]
In Data Warehousing, the simplest dimensional model is called the start schema, in thisschema data are organized in facts and dimensions. A fact can be seen as an event, and adimension contains information about the fact. A star schema is designed by surroundingeach fact by the associated dimensions, the resulting schema resembles a star, as Figure 2.4suggests, hence the schema name. Star schemes are optimized for querying large data sets andare used by Data Warehouses and Data Marts. The star schema boosts aggregation operationsof the fact records, and those operations can be easily filtered or grouped by the surroundingdimensions. [20]
9

Figure 2.2: Business Intelligence Architecture.
Figure 2.3: Business Intelligence Pipeline.
10

Figure 2.4: A Dimensional Model of a Data Warehouse.
To store data in an efficiently fashion within the Data Warehouse, and underlying DataMarts, the collected heterogeneous raw data must be properly parsed and handled. In thissense, Extract, Transform and Load (ETL) is a programming tool that combines three distinctfunctions. The extract function reads and collects data from distinct and heterogeneous spec-ified data sources and extracts a subset composed by the useful data. The transform functionmanipulates the data to convert it to the desired form and state. And, the load function storesthe resulting data to the target database.
OLAP is a technique that enables a user to easily and selectively extract and view datafrom a different point of view. OLAP data are stored in a multidimensional database, smallerthan a data warehouse, since not all transactional data is needed for trend analysis. OLAPtools are designed to locate interceptions of the data dimensions and display them. [21]
In a business perspective, it enables analysts, managers and executives to gain insightinto data through fast, consistent, interactive access to a wide variety of possible views ofinformation that has been transformed from raw data to reflect the real dimensionality of theenterprise as understood by the user.
2.3 ETL tools
ETL tools are very useful for data integration and data warehousing. They act as basisfor construction of data warehouses, since the input is given to the data warehouse throughthe ETL. There are a large number of ETL tools available in the market, following differentdesigns and modeling techniques. Some are open source and others are proprietary tools.In this sense, is important to analyze and evaluate the most popular ETL tools available onthe market. N. Mali et al. [11] and P. Metkewar et al. [12] published papers on ETL toolssurveys, in order to understand and identify the most relevant ETL tools’ pros and cons, andin what context they should be used. Briefly, both Talend Open Studio (TOS) and PentahoData Integration (PDI or Kettle) are by far the most relevant and complete open-source toolscurrently available on the market. Furthermore, Informatica PowerCenter and IBM Infosphere
11

Data Stage are the most popular commercial ETL tools.Pentaho 1 is a commercial open-source Business Intelligence suite along with a data inte-
gration product named Pentaho Data Integration - PDI (Kettle). Kettle is the default ETLtool for the Pentaho ecosystem. It uses a meta-driven approach. Moreover, Pentaho providesa graphical editor, called Spoon, where users are able to build data integration procedures,also known as transformations. The transformations can be run by Kettle runtime in differentways: using the command line utility (Pan or Kitchen), a remote server (Carte) or directlyfrom the IDE (Spoon). Procedures can be saved in a database repository or a file system, inXML format, and interpreted by a Java library which is required to run the ETL tasks. Italso supports multi-format data and allows data movement between many different databasesand files. These interactions are pictorially represented in Figure 2.5. [2]
Talend Open Studio is another open-source ETL tool, developed by Talend 2, with supportof data integration. Rather than meta-data driven it uses a code-driven approach and hasa user friendly and comprehensive GUI for user interaction, similar to Spoon. The codegeneration property allows generating executable code of Java and Perl that can be run lateron a server.
Informatica Power Center 3 (IPC) is a commercial data integration suite, and share leaderin data integration tools. [22] The main focus of IPC is on data integration with numerouscapabilities, namely: enterprise size architecture, data cleansing, data profiling, web servicingand interoperability with current and legacy systems.
IS Datastage 4 is a IBM product. The capabilities of the tool include data consolidation,synchronization, and distribution across disparate databases, automatic data profiling andanalysis in terms of content and structure, data quality enhancement, transformation anddelivery to and from complex sources, i.e. capability to get data from any sources format anddeliver it to any targets, within or outside the enterprise, at the right time.
2.3.1 Open-Source Tools
Both Talend and Pentaho have the largest communities and strongest community support.In my own perspective, I felt that Pentaho’s community is more active and helpful than Tal-end’s community. Nevertheless, Talend and Pentaho represents the most deployed open-sourceETL tools. Talend is more focused on data integration, data quality and data managementsolutions, while Pentaho is focused on Business Intelligence. Pentaho and Talend solutions arevery reliable, mature and fast growing. Real world enterprise implementations are becomingcommon in both cases.
Talend’s components and features are numerous, mixing both general purpose tools andvery specific components. Talend provides vendor specific sets of RDBMS, NoSQL, Big Datacomponents among generic ones, this approach enables the support to both vendor specificfeatures and generic database features. Pentaho’s features and components are a little lesscomprehensive than Talend ones, however this doesn’t restrict the complexity of the ETL pro-cedures that can be implemented. In fact, the most complex and specific Talend’s componentscan be built by a set of less complex and more general Pentaho’s components.
1https://www.hitachivantara.com/go/pentaho.html?source=pentaho-redirect2https://www.talend.com/3www.informatica.com4https://www.ibm.com/us-en/marketplace/datastage
12

Figure 2.5: Overview of Kettle programs. Source by [2]
13

Talend is very easy to deploy as a standalone Java application, and is the default ETLtool for SpagoBI and JasperServer. Kettle is the default tool for Pentaho Business Intelligenceand requires the Kettle core libraries when deployed outside the Pentaho platform. However,Kettle makes it easy to deploy procedures in clustered environments and save them in adatabase table. In Talend these and further features are available in the subscription version.
Hermanny Filho [23] performed a comparative analysis between Pentaho Data Integrationand Talend Open Studio. Both tools were compared within three distinct categories: the waytransformations and jobs are developed, the available features by the tools and the trans-formations’ performance in both tools. The author concluded that Kettle presented betterresults on the flexibility to develop transformations or jobs and on the data migration speed.On the other side, Talend Open Studio made less memory and CPU usage on the data move-ment tasks. In more detail, in the best scenario, Kettle showed 60% quicker than TalendOpen Studio, on the data movement tasks. While, in the worst scenario, used 80% more CPUresources.
Majchrzak et al.[24] published a paper on ETL applications and in particular on opensource ETL tools. That paper analyzes open-source ETL tools especially with regard to theirperformance. Before the selected ETL tools’ performance evaluation, the authors evaluate thepotential tools, by a criterion. Since Pentaho Data Integration and Talend Open Studio werethe ones that fulfill the criterion, as Table 2.1 suggests, they were the chosen tools for theperformance analysis. A selection of common indicators was derived from the ISO 9126 norm,to evaluate the performance, namely: the execution time, measured in seconds, the CPU load,measured in percentage of utilization, the memory load, measured in percentage of utilizationand the number of SELECT SQL statements.
Table 2.1: Criteria fulfillment by the candidates
Integration Interfaces Graphical editor Functionality Support Documentation Up-to-datenessApatar OS Data Integration X X X X X XCloverETL Engine X X X X X XEnhydra Octopus X X XJitterbit Integration Environment X X X X X XKETL X X X X XPentaho Data Integration X X X X X X XScriptella X X X XTalend Open Studio X X X X X X X
After the performance evaluation, the authors found that Talend Open Studio(TOS) istwice as fast, regardless of the amount of data. And that the speed advantage of TOS variesaround a factor of six. There is also a slightly worse scaling behavior in the CPU usage ofPDI compared to TOS.
On the other side, the memory usage of PDI is advantageous. It is about 40-50% less thanthe average memory usage of TOS, regardless of the amount of data processed. Moreover,TOS does not support the parallel organization of the ETL process.
To sum up, the claim of completeness and consistency is fulfilled by TOS and PDI. Whilefor TOS low CPU utilization is given in most cases, PDI has consistent advantages in memoryusage. Even with varying memory size both tools show similar behavior.
Nonetheless is of major importance to realize that the transformation’s implementationplays a huge role on the execution performance of the actual transformation. Overall, it maybe said both tools are complementary. Each one with a focus, but allow the same tasks oftransformation and data integration.
14

2.3.2 Open-Source tools vs Commercial tools
Marc Russel made a comparative analysis between the major open-source and commercialETL tools (PDI vs TOS vs IPC vs DataStage). [25] The analysis focused on performance andusability. The author highlighted the difficulty of providing a reliable analysis. But the globalperformance of each ETL tool was scored, as a sum of twelve distinct performance tests. Thus,the following scores were obtained:
• First: Informatica Powercenter (353 points)
• Second: Talend Open Studio (333 points)
• Third: IBM Datastage (239 points)
• Fifth: Pentaho Data Integration (148 points)
Nevertheless, PDI is the easier tool to parallelize ETL workloads.R. Katragadda et al. performed an empirical study of Talend Open Studio versus Informat-
ica Power Center [26]. The authors found out that IPC has multiple capabilities, but limitedfunctionalities in integration with other environments. Whereas Talend has advanced inte-gration capabilities with other environments. Furthermore, Talend is quite suitable for smallimplementations, but for large implementation IPC is way ahead. Since Talend is free, itssupport, documentation and large-scale implementations make it less suitable for commercialapplication.
H. Rose et al. [27] made a comparative study between open-source and commercial ETLtools. The authors evaluated ETL tools in terms of architecture, functionality, usability,reusability, connectivity and interoperability. From all the analysis conducted it is still hardto generalize which tool is the best. However, commercial tools proved to be generally better.Infomatica proves to be slightly better in quite many features. Nevertheless, the authorsemphasized that open-source tools offer reduced costs, having the potential to give support tothe initiatives of small enterprises. Furthermore, the gap between open-source and commercialETL tools has been decreasing over the time.
2.4 Business Analytics Tools
Data visualization is the presentation of data in a pictorial or graphical format. It enablesdecision makers to see analytics presented visually, so they can grasp difficult concepts oridentify new patterns. With interactive visualization, you can take the concept a step furtherby using technology to drill down into charts and graphs for more detail, interactively changingwhat data you see and how it’s processed.
Charts and graphs represent in a more intuitive fashion large amounts of complex data,rather than spreadsheets or reports. With the aid of data visualization, decision-makers canidentify areas of attention or improvement in the business, clarify which factors influencecustomer behavior, analyze and predict the best place for a specific product and predict salesvolumes.
In this sense, is important to analyze and evaluate the most popular business analyticstools available on the market.
15

2.4.1 Power BI
Power BI 5 is a suite of business analytics tools to analyze data and share insights, pro-vided by Microsoft. It offers interactive visualizations with self-service business intelligencecapabilities, where end users can create reports and dashboards by themselves, without havingto depend on information technology staff or database administrators. Power BI ecosystemencompasses a set of key components:
• Power BI Desktop: a windows desktop application.
• Power BI (Service): a SaaS (Software as a service) online service.
• Power BI Mobile Apps: an application for Android and iOS devices, as well as forWindows phones and tablets.
• Power BI Gateways: gateways used to sync external data in and out of Power BI.
• Power BI Embedded: Power BI REST API, that can be used to build dashboards andreports into the custom applications that serves Power BI users, as well as non-PowerBI users.
• Power BI Report Server: provides a localized way for storing and managing PowerBI reports.
• Power BI Visuals Marketplace: a marketplace of custom visuals and R-poweredvisuals.
Figure 2.6 portrays how Power BI tools are orchestrated, to cooperate between them,in order to build and deliver business insights. Within the Power BI environment, there arehundreds of connections to popular business applications, for instance Excel, Google Analytics,Salesforce or MySQL, complete with prebuilt dashboards. Also, data and reports are accessibleanywhere with Power BI Mobile apps, that can synchronize automatically on data changes.Moreover, Power BI allow data analysts to build reports and analytics, over Power BI Desktop.It combines data from disparate databases, files, and web services with visual tools that helpsto understand and fix data quality and formatting issues automatically. Furthermore, reportscan be securely published and automatically refreshed, within the organization. Power BIcan unify all organization’s data, with Power BI gateways. Finally, Power BI reports anddashboards can be embedded in external reporting portals or applications, with Power BIEmbedded.
2.4.2 Metabase
Metabase 6 is a free, open source analytical tool that allows the user to ask questionsabout the provided data, without SQL knowledge, through a very simple web interface. Theasked question is converted to SQL code, through a powerful translator. Results are retrievedin table format, where users can re-filter the result or translate the table into several differentgraphs. Latter, dashboards can be built by dragging and resizing multiple resulting graphsinto a mesh (Figure 2.7).
5https://powerbi.microsoft.com/en-us/6https://www.metabase.com/
16

Figure 2.6: Power BI ecosystem.
Figure 2.7: Metabase dashboard.
17

Metabase offers advanced capabilities, such as sending result notifications via email orSlack, embedding the resulting dashboards on external web pages and geographic maps con-struction. Moreover, Metabase allows fully customizable roles management and has a modernfeed wall, where users can be informed of colleagues’ activities. Furthermore, it also providesa REST API, where developers can interact with the engine.
2.4.3 Saiku
Saiku 7, originally called the Pentaho Analysis Tool, started life as a basic Google WebToolkit(GWT) based wrapper around the OLAP4J library. Saiku offers a user friendly, web-based analytics solution that allows to easily analyze corporate data and share reports. Thesolution connects to a range of OLAP Servers including Mondrian, Microsoft Analysis Services,SAP BW, allowing to explore data in real time. By harnessing the power of OLAP, Saikuallows users to choose the measures and dimensions they need to analyze, split data and drillinto the detail to uncover relationships, opportunities and issues. Furthermore, allows non-destructive editing of query results, providing the ability to adjust the figures and perform“what-if” analysis over their data (Figure 2.8). The query results can be shared or exportedinto Excel or PDF.
Figure 2.8: Saiku dashboard.
Saiku can be embedded in external web applications. Because of its restful nature, theserver can be completely decoupled and used as a standalone service. Moreover, Saiku EmbedFramework is a framework that facilitates Saiku’s integration within external applications.
2.5 Business Intelligence Suites
Business Intelligence encompasses a wide variety of tools, applications and methodologiesthat enable organizations to collect data from internal systems and external sources, prepareit for analysis, develop and run queries against that data, and create reports, dashboards and
7https://meteorite.bi/products/saiku
18

data visualizations. The anlytical results are then available to corporate decision-makers, aswell as operational workers.
Since business intelligence requires a set of tools or technologies with different goals orpurposes, those tools are traditionally bundled. The BI bundle is called Business IntelligenceSuite. Thus, is important to analyze and evaluate the most relevant BI Suites available onthe market.
2.5.1 Pentaho
Pentaho is a complete business intelligence suite. Pentaho BI Project encompasses thefollowing major applications: Reporting, Analysis, Dashboards, Data Mining and BusinessIntelligence Platform. Pentaho BI Suite consists in Data Integration (DI) and Business Ana-lytics (BA) components. All core engines are open. As Figure 2.9 suggests, Pentaho’s stackincludes three layers:
• Presentation layer: responsible for news, analysis, dashboards and method manage-ment. The data can be viewed either from a browser, portal, office, and e-mail or webservices.
• Business Intelligence Platform: responsible for security, administration, businesslogic and repository management.
• Data & Application Integration: responsible for ETL and its integration.
Figure 2.9: Pentaho Business Intelligence Suite.
From a architectural point of view (Figure 2.10), Pentaho also contains three layers:
19

• Data Layer: allows the connection to any data source.
• Server Layer: encompasses BA Server, Pentaho User Console and Pentaho Data In-tegration Server. User console is for the user role mapping, security and for configuringwhich report should be shown to which user. Pentaho Data Integration server handlesjobs and transformations’ execution. Reports and dashboards can be deployed via BAserver, making them available to the end-users.
• Client Layer: offers a set of front-end tools for corporate data manipulation and anal-ysis, and for reports and dashboards construction.
Figure 2.10: Pentaho Architecture.
2.5.2 SpagoBI
SpagoBI 8 contains a variety of functionalities such as the creation and export of reports,creating charts, ETL, OLAP, data mining, KPIs, application server, login service, dashboard,task schedule and Web server. All modules are connected with the core, which ensures thebalance of the platform. Figure 2.11 illustrates SpagoBI Server architecture. SpagoBI can berepresented by five components:
• SpagoBI Server: the core of the suite including the analytical tools and features.
• SpagoBI Meta and Studio: the integrated development environments to organizeand create analysis.
8https://www.spagobi.org/
20
• SpagoBI SDK: the integration layer allowing to use SpagoBI with external tools.
• SpagoBI Applications: a collection of vertical analytical models that are developedusing SpagoBI.
Beyond the Business Intelligence server, SpagoBI offers a software development kit (SDK)used for the integration of the services provided by the Server. In particular, it is used bySpagoBI Studio in order to allow users to download or upload their analytical documents fromor onto the Server.
Figure 2.11: SpagoBI Architecture.
2.5.3 Jaspersoft
Jaspersoft 9 BI Suite consists of five different components (Figure 2.12):
• JasperReports Library: the reporting engine, is able to use different types of datasource to produce reports that can be viewed, printed or exported in several documentsformats, including HTML, PDF, Excel and Word.
• Jaspersoft Studio: is the editing software for JasperReports. It allows to design andrun report templates, build report queries and write complex expressions.
• JasperReports Server: the reports’ server, responsible for storage and report man-agement.
• Jaspersoft ETL: the ETL software with a GUI. It allows the data extraction from yourtransactional system to create a consolidated data warehouse or data mart for reportingand analysis.
• Jaspersoft OLAP: the relational OLAP server. It enables data analytics to model,manipulate and visualize any flavor of data using OLAP or in-memory analysis in orderto identify issues, spot trends and make better decisions quickly.
9https://www.jaspersoft.com/
21

Figure 2.12: Jaspersoft Architecture.
2.5.4 BI Suites comparison
J. Lapa et al. [28] performed a comparative analysis between several open-source businessintelligence platforms: Actuate, JasperSoft, OpenI, Palo, Pentaho, SpagoBI and Vanilla. Theauthors evaluated the BI platforms according to the criteria used in Gartner. These criteriaare grouped into three broad and fundamental categories: Integration, Information deliveryand Analysis. They didn’t evaluate the usability, nor the platforms’ performance. Instead theyfocused on revealing each platform’s capabilities. After the evaluation, they concluded thatPentaho, SpagoBI and Jaspersoft are the most complete open-source BI platforms currentlyavailable.
V. Parra et al. [29] realized a comparative study on the data processing performance ofPentaho and Jaspersoft, in Big Data scenarios. The experimental analysis has focused on theirETL and reporting processes, by measuring their performance. Six different Excel databases,with different sizes, have been used to perform the analysis. In the ETL phase, Jaspersoft BIrevealed an increment on the data processing CPU time over Pentaho BI, represented in anaverage of 42.28% over the six databases. Meanwhile, Pentaho BI exhibited an increment ondata processing CPU time over Jaspersoft evidenced by the reporting analysis outcomes, withan average 43.12% over the databases. In summary, Pentaho had a superior performance forthe ETL process, and Jaspersoft an improved performance for the reporting process.
A. Marinheiro et al. [30] elaborated a study that evaluated and compared the five mainopen-source Business Intelligence suites: JasperSoft, Palo, Pentaho, SpagoBI and Vanilla.The authors identified Pentaho and SpagoBI has the most powerful solutions. Nevertheless,Pentaho has a commercial version and doesn’t allow collaborative work. However, it is themost used open-source BI suite. The major disadvantages on Jaspersoft is that, in its open-source version, doesn’t support ad-hoc queries, data-mining and score-boarding. Nonetheless,those capabilities are fulfilled in the commercial version. Finally, they concluded that currentlyopen-source BI suites offer a high level of confidentiality, and should be considered as validalternatives to commercial BI suites.
22

2.6 Summary
In this chapter, it was highlighted the importance of supporting many levels of engagementwith the data, so that a higher number of users are able to take advantage from it. There aremultiple types of tools which help users to take full advantage of data. ETL tools simplify thedata integration process for the construction of a data warehouse. BA tools provide meansfor representing data intuitively. Tipically, these tools are bundled as a BI suite. Therefore,a comparative study was performed to identify the best current BI suite. Briefly, Pentahoproved to be the best open source BI suite.
23

24

Chapter 3
Proposal Definition
The main goal of this thesis was to build a web-based platform that allows the buildingand management of ETL pipelines, by non-IT users, in a multi-institution environment. Inthis section, it will be presented the requirements that were considered to implement a properand reliable solution.
3.1 Functional Requirements
Each institution manages and mantains ETL tasks and provides the resources for theexecution of the associated tasks. Thus, each institution owns its private data sources, serversfor ETL task execution and a task scheduler that allows periodic execution. In order to provideaccess and management control of ETL tasks and institutions, there are four distinct types ofusers (Figure 3.1):
• Administrator: Entity that moderates the platform. This actor has permissions tocreate and delete institutions.
• Resource Manager: Entity that manages private data sources and execution servers.This actor has permissions to create and delete private data sources and executionservers, within specific institutions.
• Task Manager: Entity that builds and executes ETL tasks. This actor can create andconfigure ETL tasks, within specific institutions.
• Data Analyst: This actor has permissions to inspect task execution history, namelythe resulting data, execution logs and performance metrics.
The main use cases are represented in Figure 3.1, where are represented the user interactionswith the web application and institutions. Table 3.1 identifies the main actor for each use caseand describes it as a user story.
To enable the development of ETL tasks, the platform must provides a set of ETL com-ponents. The platform should provides 12 different ETL components divided in 7 distinctcategories (Table 3.2).
Finally, users that belongs to the institution must have access to that institution in the sys-tem. Thus, upon authentication the system must be able to authenticate users via institutionLightweight Directory Access Protocol (LDAP) server or Active Directory (AD) server.
25

Figure 3.1: System use cases.
Table 3.1: List of user stories
Primary Actor Use Case User StoryAdministrator Create Institution As an administrator,
I want to create a institution,So that other users can build, execute and manage ETL tasks.
Resource Manager Create Server As a resource manager,I want to create a task server,So that task managers can execute ETL tasks.
Create Data Source As a resource manager,I want to create a data source,So that ETL tasks can access institution’s private data.
Task Manager Create Task As a task manager,I want to create a task,So that it can be correctly configured.
Run Task As a task manager,I want to run a task,So that the data is processed in some way.
Data Analyst Check History As a data analyst,I want to check a task’s history,So that I can chronologically verify executions’ output and performance metrics.
26

Table 3.2: List of supported ETL components
Category Component Description
Input Generate Rows Generate a number of empty or equal rows.Table Input Read information from a database table.
Ouput Table Output Write information to a database table.
Transform
Add a checksum Add a checksum column for each input row.Select values Select or remove fields in a row.
Optionally, set the field meta-data: type, length and precision.Add sequence Get the next value from an sequence.Sort Rows Sort rows based upon field values (ascending or descending).
Flow Filter Rows Filter rows using simple equations.Dummy (do nothing) This step represents a breakpoint in the pipeline.
It’s useful for testing purposes or to split streams.Join Merge Join Joins two streams on a given key and outputs a joined set.
The input streams must be sorted on the join key.Statistics Group By Builds aggregates in a group by fashion.Scripting Execute SQL script Execute an SQL script, optionally parameterized using input rows.
3.2 Non Functional Requirements
Information Security
Since ETL tasks parse and handle sensitive data that belongs to a particular institution,the system must be designed and implemented taking in account these security issues, namelyuser authentication, access control, data protection and isolation.
System Reliability
Considering the periodic execution of ETL tasks, it is important to ensure that eachexecution is correctly initialized, started, motorized and concluded. When some fatal erroroccurs during an ETL task execution, the system must be able to handle the error andsuccessfully conclude the execution.
Solution Scalability
Since a complete ETL tool typically encompasses a wide variety of components, it is crucialto build an agile approach to the development and integration of new ETL components.
3.3 System Modeling
In the following, the section system will be conceptualized according to the requirementsidentified in previous sections.
3.3.1 Functional Model
The functional model was derived from the identification of all key components from atop-down analysis of the system requirements. Figure 3.2 illustrates step by step all actionsand interactions between the main actors in order to build and execute ETL tasks and toanalyze the output results. Firstly, the administrator must create an institution. A resource
27

manager with access to the institution can create and configure all desired private data sourcesand task execution servers. Thereafter, a task manager can build and configure the ETL taskand then schedule it for periodic or non-periodic execution. At the configured times the taskwill be sent to the execution server and executed. At the end of the execution, a notificationwill be sent to the data analysts, so they can check the execution results.
Figure 3.2: System workfow to build, manage and execute ETL tasks.
3.3.2 Data Model
The system data model relies on a SQL-structured database. The following subsectionwill detail the data model. Due to its complexity, the entity-relationship (ER) model willbe explained in four steps. First, will be presented the ETL task structure. Second, will beintroduced the institution structure and the underlying resources. After, will be explainedhow the results and metrics are organized. Finally, will be presented the role-based accesscontrol (RBAC) structure.
ETL process
An ETL process is represented by a pipeline of steps, that execute a certain transformationover the data stream, and hops, that connects the steps between each others (Figure 3.3).
As Figure 3.4 suggests, an ETL process or task is formed by multiple Steps and Hops. EachHop starts from a source Step and ends in a target Step and their role is to guide the data overthe flow. Each Step defines a transformation action and that action can be configured throughthe web interface. On one hand, in order to visually represent each Step, they must hold aCell that is formed by a certain coordinate and dimension. On the other hand, a Step followsa given structure or schema that is defined by the Component. A Component is composedby a set of properties, called ComponentProperty. Each ComponentProperty has a label, atype, and a source, to dynamically build the step settings page and the Kettle’s method nameto invokeStepPorperty contains the actual value of the Step’s ComponentProperty. In fact,in order to materialize a given Step, a StepProperty must be defined by each Component-Property of the correspondent Step’s Component. Nevertheless, if the ComponentProperty
28

Figure 3.3: Example of an ETL process.
is a table, the property will be considered as a aggregate of sub-properties. In this case theComponentProperty will have a set of ComponentMetadatas. Each ComponentMetadata willrepresent a column of the table and the same attributes will apply to ComponentMetadata.
Figure 3.4: ETL process ER model.
Institution
An institution is characterized by a name, a group of ETL tasks, a group of private datasources, a group of execution servers and a group of users (Figure 3.5). A data source consistsin a relational database. Table 3.3 describes all data source attributes. Table 3.4 explains allatributtes of the remote execution server. To schedule task executions, Schedule entity relatesa task, with a given server and user that scheduled execution. It also has a start date and aperiod that defines the interval between executions (Daily, Weekly, Monthly, Yearly).
29

Figure 3.5: Institution ER model.
Table 3.3: Data source fields
Field Feature DescriptionconnectionName Connection Name Uniquely identifies a connection across transformations.databaseInterface Connection Type Database technology (for example, MySQL, Oracle, and so on).accessType Method of access Database access type (Native (JDBC), ODBC, or OCI).
Available access types depend on the database technology.hostName Server host name Defines the host name of the server on which the database resides.
The host can also be defined by IP-address.portNumber Port number Sets the TCP/IP port number.databaseName Database name Identifies the database name to be connected.
In case of ODBC, specify the DSN.username Username Specifies the user name to connect to the database.password Password Specifies the password to connect to the database.
Table 3.4: Execution server fields
Field Feature Descriptionname Server name The alias of the execution server.hostName Hostname or IP address The address of the machine where the server resides.portNumber Port number Defines the port to use for communicating with the remote server.username Username Username credential for accessing the remote server.passwrod Password Password credential for accessing the remote server.
30

Output and Performance
When execution time comes, the task will be sent to the remote execution server and willbe executed. Execution entity represents the task execution. An execution is formed by a setof step metrics and the output data, that holds the resulting data. Table 3.5 describes thestep metrics in detail. The output data consists in a set of data rows. Each data row has aset of key-value pairs (Figure 3.6).
Figure 3.6: Execution ER model.
Table 3.5: Step Metrics fields
Field Feature Descriptionread Read Number of lines read from input-streams.write Written Number of lines written to output-streams.input Input Number of lines read from file or database.output Output Number of lines written to file or database.update Updated Number of lines updated in the database.error Errors Number of errors that occurred.state Active The status of the step: running, finished or stopped.time Time The number of seconds that the step has been running.speed Speed The speed in rows per second at which the step processes rows.priInOut Input/Output Sleep time (get/put) is the time that a step had to go to sleep
(in nano seconds) because the input buffer was empty (get) orthe output buffer was full (put).
31

RBAC
Figure 3.7 describes the RBAC system structure. A user has several roles. Each rolemaintains a set of permissions. Each permission consists in an association of an operation anda resource. The Authentication entity is a facade to a given user group, that can be LDAP orActive Directory (AD). When a certain user logs in the platform the underlying user groupwill be determined, by trying authentication on each configured user group. If authenticationsucceeds, the user will be instantiated in the database. Depending on the group to which hebelongs, the user will acquire the correspondent roles and institution access.
Figure 3.7: RBAC ER model.
3.3.3 Overall Architecture
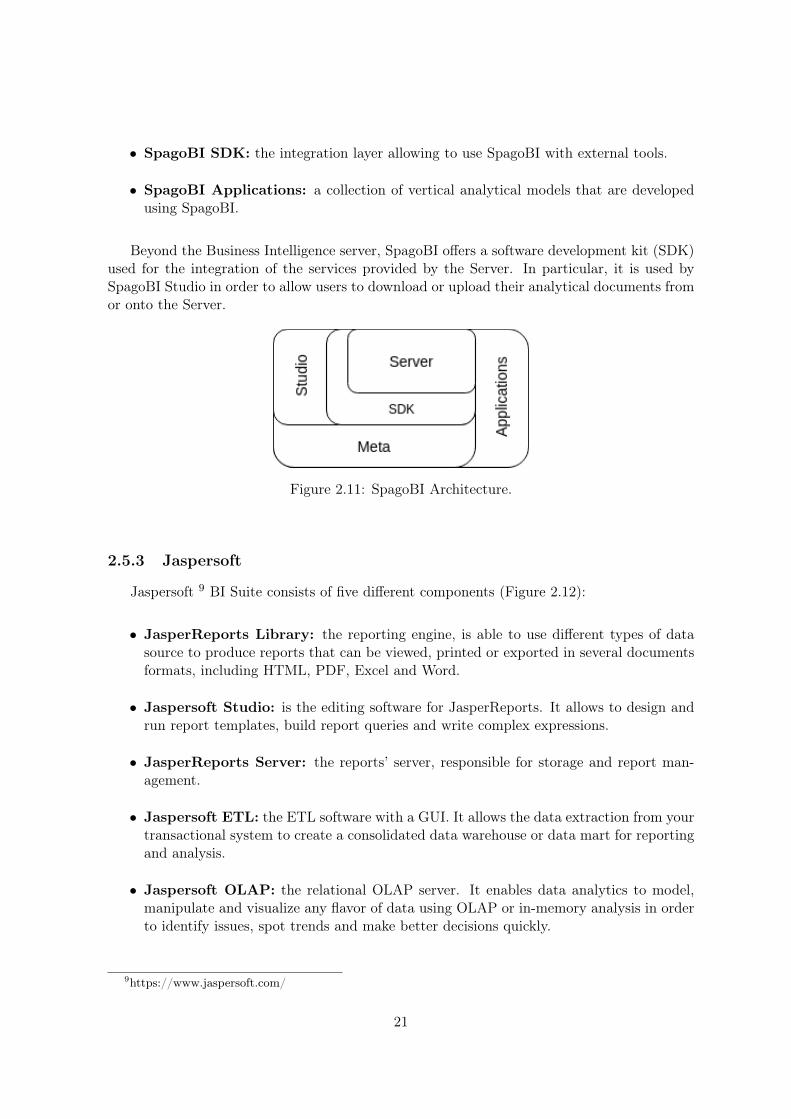
As result of the modeling stage, it was designed an architecture (Figure 3.8) to fit thesystem requirements. The architecture considers four different tiers: 1) Application tier con-trols all application functionalities and maintains the system business logic; 2) Data tier isresponsible for the maintenance of the private data sources; 3) Processing tier has the duty ofexecuting and monitoring ETL task executions; 4) Client tier is responsible for the solutionpresentation and page rendering;
The system logic is built upon five different controllers: 1) RBAC controller provides useridentity and evaluates access requests to resources; 2) Institution controller allows the creationand destruction of institutions, and resource allocation in institutions; 4) Task controller
32
enables the creation, configuration and destruction of ETL tasks; 5) Execution controller usesKettle and Carte servers, so it can build, remotely execute and monitor ETL tasks;
Data Integration (DI) Software Development Kit (SDK) seeks to bridge the gap betweenKettle and the stored information in BIcenter database (DB). It provides methods to buildPentaho’s ETL processes according to the stored information, and also to execute them.Nevertheless, task execution is a periodic process. Therefore, Execution Scheduler manages thetask execution scheduling. When the appropriated time arrives, a Execution Job is triggered.That job will communicate with DI SDK so that the given task is indeed executed. SVGcontroller maps between images and components, with the intent to build the visual pipeline.
Figure 3.8: Components diagram.
The deployment strategy, represented in Figure 3.9, shows the decoupling between thesystem and institutions (and their associated resources). Thus, in the system side will bethe application server and the system database. In the institution side will be the executionservers and the institution’s private data sources. This way, data protection and isolation isguaranteed.
The BIcenter Web client adopted Model-View-Controller (MVC) architectural pattern(Figure 3.10). This pattern divides the web application in three different components:
• Model: represents the knowledge and data in an application. It has the responsabilityto respond to information requests, proceed to information changes according to giveninstructions requests, and to notify observers in event-driven systems when informationchanges. Typically, the application data is stored in a database.
• View: it represents the user interface. The View updates the UI upon changes in theModel, by rendering the data into the suitable UI form.
• Controller: it handles events that occurs in the View, such as user interactions, andupdates the Model accordingly.
Moreover, mxGraph 1 is used to draw a visual representation of the ETL tasks stored in1https://jgraph.github.io/mxgraph/
33

Figure 3.9: Deployment diagram.
Figure 3.10: MVC architecture.
34
the system database. Apache Quartz 2 is used to specify scheduled executions of ETL tasks.JQuery UI 3 is used to allow drag and drop actions, so users can build ETL pipelines. Theremote execution servers consist of Carte servers. Carte 4 is a simple web server, developedby Pentaho, that allows the remote execution of ETL tasks.
3.4 Summary
In this chapter, it was designed a high level solution. The main actors and their storieswere identified. As well as the logical overall system architecture and the underlying datamodel. In the next chapter, it will be described all implementation decisions that materializedthe logical architecture.
2http://www.quartz-scheduler.org/3https://jqueryui.com/4https://wiki.pentaho.com/display/EAI/Carte+User+Documentation
35

36

Chapter 4
System Implementation
The choices made during the system implementation were very important to ensure a suc-cessful final solution. This chapter explores the basis of the underling system implementation,the problems found during the development phase and the engineered solutions that led to asuccessful system.
4.1 The pipeline editor
So that the user can build a visual representation of the desired ETL pipeline, there is theneed to build a proper editor. The editor must be able to process a similar structure to theone depicted in Figure 3.3 and generate the correspondent visual representation of the ETLtask. MxGraph 1 was used to build the ETL pipeline editor. MxGraph is a Java/JavaScriptdiagramming library that enables the building of interactive graphs. A graph consists in a setof cells. A cell can either be a vertex or an hop. So, a graph is formed by a group of verticesconnected by edges. The vertices correspond to the ETL steps and the edges correspond tothe ETL hops. Figure 4.1 illustrates the MxGraph architecture. Hence, in order to exhibit thedesired task within the mxEditor, it is necessary to translate the task to the correspondingmxGraph object. GraphDecoder is responsible for creating a mxGraph and defining theappropriated model, according to the given Task (Algorithm 1). To insert vertices and edgesin the graph model, a transaction must be created (beginUpdate and endUpdate). This isrequired for the model to remain in a consistent state. A default parent is automaticallycreated and represents the first child of the root cell in the model. Subsequent elements mustbe added to the default parent.
4.2 ETL SDK
4.2.1 Pentaho Data Integration
Taking into account the evaluations carried out in Section 2.6, it was decided to use PDISDK. Kettle contains a rich set of data integration functionality that is exposed in a set ofdata integration tools. However, we can also use Kettle as a library in our own softwareand solutions. Pentaho Data Integration can be used as a Java API composed by threemain components: Core, that contains the core classes for Kettle; Database, that contains
1https://jgraph.github.io/mxgraph/
37

Figure 4.1: MxGraph architecture.
Algorithm 1GraphDecoder algorithmData: TaskResult: mxGraphGraph.getModel().beginUpdate()Parent := Graph.getDefaultParent()for all Step in Task doId = Step.getId()X := Step.Cell.getX()Y := Step.Cell.getY()Width := Step.Cell.getWidth()Height := Step.Cell.getHeight()ComponentName := Step.Component.getName()StepImage := SvgImageUrl.getUrl(ComponentName, SvgImageUrl.SizeMiddle)Cell = Graph.insertVertex(Parent, X, Y, Width, Height, StepImage)Cells.put(Id, Cell)
end forfor all Hop in Task doSourceId := hop.getSource().getId()TargetId := hop.getTarget().getId()Graph.insertEdge(Parent,Cells.get(SourceId), Cells.get(TargetId));
end forGraph.getModel().endUpdate()
38

the database-related classes; Engine, that contains the Kettle’s runtime classes. Figure 4.2explains step by step how an ETL task is executed. The initialization of the Kettle environmentloads all available plugins, initializes the logging environment and set up and reads the systemvariables. After the environment initialization, the transformation metadata is loaded anda transformation engine object is instantiated. Then, the execution is prepared and thetransformation threads are started. Finally, because the whole transformation runs multi-threaded, it waits until all processing is completed. The instantiation and configuration of theETL task object requires an algorithm depicted in Figure 4.3. Nevertheless, each ETL stephas its own configuration process and properties.
Figure 4.2: ETL task execution flowchart.
Figure 4.3: ETL task construction flowchart.
4.2.2 DI SDK
The database model depicted in Figure 3.4 allows to efficiently store all relevant informationin order to build and execute a given ETL process. Thus, one could make use of the stored
39

data along with Kettle to successfully build and execute ETL tasks. Hence, a DI SDK wasdesigned and developed. In Kettle, an ETL process can be represented by six classes [31]:
• TransMeta: is the class that defines the information about the ETL process and offersmethods to save and load it from XML, as well as methods to alter an ETL process byadding/removing databases, steps, hops, etc.
• Trans: represents the information and operations associated with the concept of anETL process. It can loads, instantiates, initializes, runs, and monitors the execution ofthe ETL process.
• DatabaseMeta: defines the database specific parameters for a certain database type.
• StepMeta: is the class that defines the information about a ETL process’s Step.
• TransHopMeta: defines a link between two steps in an ETL process.
• BaseStep: represents the information and operations associated with the concept of anETL process Step. It offers initialization, row processing and step clean-up methods.
Thus, initially a TransMeta must be properly configured with all proper DatabaseMetas,StepMetas and TransHopMetas. TransDecoder is responsible to create a TransMeta and defineall underlying information, according to the given Task (Algorithm 2). GenericStep is a classthat has a generic algorithm to encode or decode a given Step to or from a Kettle’s StepMeta.In order to provide interface segregation, TransDecoder must use the StepDecoder interfacethat only provides the GenericStep decoding method (Figure 4.4).
Algorithm 2TransDecoder algorithmData: TaskResult: TransMetafor all DataSource in Task doTransMeta.addOrReplaceDatabase(DataSource);
end forfor all Step in Task doStepMeta := StepDecoder.decode(Step)TransMeta.addStep(StepMeta)
end forfor all Hop in Task doTransHopMeta.setFromStep(Hop.source)TransHopMeta.setToStep(Hop.target)TransMeta.addTransHop(TransHopMeta)
end for
After having a correctly configured TransMeta, it can be executed with the associatedTrans object. TransExecutor is a singleton responsible for the initialization, execution andmonitoring of the Trans object. Moreover, it writes and stores the execution logs, step mea-sures and status, and the resulting data in real-time. To accomplish this, listeners are coupledto the Trans and Steps objects in order to obtain the results and metrics throughout thetransformation’s execution (Figure 4.5).
40

Figure 4.4: Trans builder class diagram.
Figure 4.5: TransExecutor class.
41

4.2.3 Rendering algorithm
As stated previously, the effort of developing new components is a repetitive work. There-fore, GenericStep has a generic algorithm to dynamically encode/decode a Kettle Step. Asshown by Algorithm 3, it is used a reflective software approach to traverse over the StepProp-erties. For each StepProperty, the correspondent StepMetaInterface method will be invokedwith the stored value. Nonetheless, since StepProperty values has different types and formats,and considering that within the database the value is stored as a String, the invokeMethodfunction must dynamically cast the value to the desired type. Thus, invokeMethod uses reflec-tion to check the method parameter and dynamically cast the given value to the desired type.If a given StepProperty represents a json table, for each associated ComponentMetadata, thecorrespondent value will be extracted from the json, and the invokeMethod will be executedaccordingly.
Algorithm 3GenericStep decode algorithmData: StepResult: StepMetaStepMetaInterface = PluginRegistry.findPlugin(Step.name)for all StepProperty in Step doif StepProperty.ComponentProperty.type != table thenfor all Method in StepMetaInterface’s setMethods doif StepProperty.ComponentProperty.method == Method.name theninvokeMethod(StepMetaInterface, Method, StepProperty.value)
end ifend for
elsefor all ComponentMetadata in StepProperty.ComponentProperty dofor all Method in StepMetaInterface’s setMethods doif ComponentMetadata.method == Method.name theninvokeMethod(StepMetaInterface, Method, StepProperty.value.getComponentMetadataValue(ComponentMetadata.id))
end ifend for
end forend if
end for
Some input parameter are complex and require a casting algorithm. Several PDI com-ponents, for instance FilterRows (which role is to filter data rows based on a given booleancondition), need a Condition object. There are two types of conditions: atomic conditions andcomposite conditions. An atomic condition is defined by a field, a function and a value. Acomposite condition is composed by a set of atomic or composite conditions linked by logicaloperators (NOT Condition1 AND Condition2 OR Condition3 ). The boolean condition isdefined on the web interface (Figure 4.6a) and stored in the database as a Json String (Fig-ure 4.6b). Thus, Algorithm 4 is a recursive algorithm that traverses the tree structure andbuilds the Condition object accordingly.
42

(a) Web interface (b) Tree structure
Figure 4.6: Boolean condition
Algorithm 4ConditionBuilderData: Operator, JsonResult: Conditionif Json has no children thenCondition.setLeftValuename(Json.field)Condition.setFunction(Json.function)Condition.setRightExact(value)
elsefor all Child in Json doif Child is not last thenSubCondition := ConditionBuilder(Json.operator,Child);
elseSubCondition := ConditionBuilder("NONE",Child);
end ifend forCondition.addCondition(SubCondition);
end ifif Json.operator != "None" thenCondition.setOperator(Json.operator);
end if
43

4.2.4 Extensibility
The definition of the ETL components is maintained in a JSON file which is automaticallyprocessed during the application startup. In this phase, all Component objects are extractedand stored within the platform’s database. When the user wants to configure a step or wantsto run an ETL process, the application loads the needed Components, in order to build thesettings page or to create the StepMeta object. One can describe new ETL components in theconfiguration file. The Step will be immediately supported by the web platform because of thedynamic and reflection-based approach. For instance, SortRows can be specified as presentedin Figure 4.7.
Figure 4.7: SortRows component specification.
4.3 Execution servers
In the architecture design, it was defined the need of dedicated execution servers allocatedto institutions, so private data protection and isolation is guaranteed. Carte is a lightweightHTTP server that allows remote and parallel execution of ETL tasks. It runs in backgroundand listens for requests to execute specific transformations. While Carte is running, it waitsand listens for requests on a predefined network port (TCP/IP). Clients on a remote computer
44

can make requests to a machine running Carte, sending an ETL task definition as part of therequest message. When a running Carte instance receives a given request, it authenticates therequest and executes the transformation contained in it.
Clustering allows a single transformation to be divided and executed in parallel by multiplecomputers that are running the Carte server, thus distributing the workload. It acceptscommands from remote clients. These commands control the deployment, management, andmonitoring of transformations on the slave server.
A slave server is the smallest building block of a cluster. It can be started by specifyingthe hostname or IP address and the port the Web server should run on. Kettle relies on aXML format for the configuration of the slave server (Figure 4.8). The <slaveserver> XMLblock describes the hostname and port that the slave server should listen to, and it allowsthe configuration of various aspects of the slave server. In general, these options enable toperform a fine-tune of the memory usage for a long-running server process such as Carte:
• max_logs_lines: allows to configure the maximum number of log lines that the slaveserver logging system should keep in memory at most.
• max_logs_lines: describes the maximum time in minutes that a log line should bekept in memory. This is especially useful for long-lived transformations to prevent theslave server from running out of memory.
• object_timeout_minutes: By default, all transformations stay visible in the slaveserver status report indefinitely. This parameter allows to automatically clean out oldtransformations from the status list.
Figure 4.8: Slave server configuration.
A cluster schema consists of one master server that controls the cluster, and a numberof non-master slave servers. It contains metadata on how master and slaves must transmitdata. Data is passed between Carte servers over TCP/IP sockets. When a transformation isrunning, the different parts of it are distributed across Carte slave server nodes for processing,while the Carte master server node tracks the progress. To set up a dynamic cluster, initiallya single Carte server instance must be launched to work as the master node (Figure 4.9a).Since slaves need to be able to contact the master node, it usually has a fixed IP addressor hostname. This configuration can be supplemented with additional logging parameterslike Figure 4.8. Hereafter, Carte slaves can register to the previously launched Carte master
45

(Figure 4.9b). In the <masters> section of the slave server’s configuration file, one or moreCarte servers can be specified to which the slave needs to report.
(a) Carte master (b) Carte slave
Figure 4.9: Dynamic Carte cluster configuration
4.4 Task scheduler
Considering the importance of executing ETL tasks in a scheduled and periodic manner, itis important to build a component that manages and triggers executions. When one wants toschedule a task, a start date and a periodic interval must be defined. Therefore, a executionjob scheduler was developed using Apache Quartz 2. Quartz is a Java job scheduling librarythat allows the creation of simple or complex schedules for executing jobs. To schedule a jobexecution, Quartz allows the definition of a CronTrigger. The CronTrigger class is based onthe scheduling capabilities of cron. A cron expression is a string comprising five or six fieldsthat represents a schedule to execute some routine. Table 4.1 defines all cron expression fields.Thus, a cron expression string can be built based on the previously announced fields.
Field Name Mandatory Allowed Values Allowed Special CharactersSeconds Yes 0-59 ,-*/Minutes Yes 0-59 ,-*/Hours Yes 0-23 ,-*/Day of month Yes 1-31 ,-*?/LWMonth Yes 1-12 or JAN-DEC ,-*/Day of week Yes 1-7 or SUN-SAT ,-*?/L#Year No empty, 1970-2099 ,-*/
Table 4.1: Cron expression fields.
2http://www.quartz-scheduler.org/
46
4.5 Summary
In this chapter, it was explained the main development challenges and the subsequentengineered solutions. Firstly, it was described the translation process between the data modeland the visual representation of an ETL task. Also, it was described the translation processfrom the data model to the Pentaho’s transformation object, so one can execute the desiredtask. It was presented the algorithm that allows a dynamic integration of ETL componentswithin the platform. Furthermore, it was explained how an execution server can be deployedand executed. Finally, it was explained how one can periodically schedule ETL tasks. Inthe next chapter, the final platform will be explained step by step and a use case will bepresented.
47

48

Chapter 5
BICenter: Results and Use cases
The objectives defined on the system modeling phase were successfully fulfilled. As aresult, a system with a large potential to facilitate the management of ETL processes in amulti-institution environment was achieved.
5.1 BIcenter User Interface
In this section, BIcenter UI and all underlying interactions will be presented in detail.In the login page (Figure 5.1), users can be authenticated using an institution LDAP, whichprovides a central place to store usernames and passwords.
Figure 5.1: Login page.
After user authentication, he is redirected to the application’s main page (Figure 5.2). Themain page offers an ETL pipeline editor. Users can drag components located on the sidebarand drop them on the editor. Also, it provides a toolbar (Figure 5.3) that offers edition andselection functionalities over the ETL pipeline. Moreover, it allows to configure and inspectall pipeline steps and to execute the ETL task.
In the sidebar, one can list all accessible institutions. Each institution is composed by anexecution scheduler, a task folder, a server folder and a data source folder (Figure 5.4). After
49

Figure 5.2: Main page.
Figure 5.3: Editor toolbar.
opening the task folder, a new task can be created by specifying its name. Thereafter, theETL task can be built by dragging components and connecting them together.
Figure 5.4: Institution page.
50

In Figure 5.5 represents an example of an ETL task. This task is able to process therainfall dataset from a weather station, filtering all rainy days, and counting the number ofrainy days by month and year. After drawing the ETL task, all data sources, components andthe execution server must be properly configured.
Figure 5.5: Count rainy days by month.
To configure a data source, one can open the data source folder and, thus, a popup willarises (Figure 5.6a). That popup allows to describe the data source definition. Simlarly, toconfigure a remote execution server, one can open the server folder and describe all serverproperties within the corresponding popup (Figure 5.6b).
(a) Data source settings page. (b) Execution server settings page.
Figure 5.6: Resource settings
After configuring the data sources and the execution server, each ETL component mustbe configured through the web interface. For instance, Figure 5.7 shows the Filter Rowsconfiguration page. In order to configure the component, it must be specified a booleancondition that allows to filter the input rows. After applying the condition to a given row,it must be fowarded to a certain step. Thus, it should also be defined the ETL steps for thepositive and negative case.
51

Figure 5.7: Filter rows settings page.
Figure 5.8: Filter rows input fields.
52

When all steps are configured, the ETL task can be executed. As can be seen on Figure 5.3,the task may run locally or remotelly. Preferably, the task should run on the remote server,that belongs to the institution, to ensure data protection and isolation. When it is a remoteexecution, it can be scheduled. If the remote toolbar execution button is clicked, a popup willappear allowing the scheduling of the ETL task (Figure 5.9). Firstly, the remote executionserver must be chosen. Secondly, if the scheduling of the task is desired, a execution datemust be defined. Finally, to execute the task periodically, an interval must be specified.
Figure 5.9: Scheduling a ETL task on a remote execution server.
On the sidebar, when "Execution Scheduler" is clicked, it redirects to the executionscheduling table (Figure 5.10). Here one can check or delete previously defined schedules.
Figure 5.10: Execution scheduling table.
When some execution finishes, the user will be notified by the navbar’s bell (Figure 5.2).The execution history can be analyzed at any time (Figure 5.11). The history provides atimeline where one can see all executions’ start date and time, the used execution server, theduration time and the user who have defined the given schedule.
For each execution, users can verify the execution logs (Figure 5.12), steps’ performancemetrics (Figure 5.13) and preview output results (Figure 5.14) on real-time. The real-timeoutput data can be displayed for each step (Figure 5.14b).
53

Figure 5.11: Execution history.
Figure 5.12: Execution logs.
Figure 5.13: Execution step measures.
54

(a) Steps status (b) Preview step output
Figure 5.14: Preview execution output.
5.2 A use case on biomarkers analysis
Mass spectrometry is a physical analytical technique to detect and identify molecules ofinterest by measuring its mass and characterizing its chemical structure. In order to identifythe relevant molecules, a set of biomarkers are analyzed and evaluated. Therefore, a set oftest tubes are placed in a plate and are applied for screening. To fine tune the data machine,periodically, biomarkers mean values are calculated.
Figure 5.15 illustrates the ETL task that calculates the biomarkers averages’. Firstly,plates are filtered by date. Then, plates, screens and screening values are merged. Hence,the values of the various biomarkers are averaged. Finally, those averages are written to adatabase table (Figure 5.16). This pipeline was performed on a newborn dataset. Due to datasensitivity, only a general overview is presented.
Figure 5.15: ETL task to calculate biomarkers averages.
55

Figure 5.16: Biomarkers averages.
56

Chapter 6
Conclusion
The main objective of this thesis was the study, design and development of a solution thatcovers the limitations and problems found in the building and management of ETL tasks ina multi-institution environment. From the initial study, it was concluded that a web solutionwould translate into a significant positive impact for ETL task developers, since it wouldfacilitate the installation and maintenance process. Moreover, considering that ETL tasksare usually related with sensitive data, it was important to devise an architecture that wouldgarantees data protection and isolation. Since ETL tasks are tipically periodically executed,for example to feed a data warehouse or to produce statistical reports, it was also necessaryto allow execution’s scheduling. Finally, there was the need for user authentication and accesscontrol to institutions and resources. Thus, a RBAC system was developed, and it can connectsto institutions’ LDAP or AD. Thus, users that belongs to a certain institution don’t need toregister in the platform, since they already have access to that institution.
To implement the system that achieved these goals, an architecture that identified themain key logical components was designed and a study of the appropiate technologies for eachcomponent was carried out. Therefore, mxGraph was used to translate and display a visualrepresentation of the stored ETL tasks. Kettle was used to allow the dynamic definition oftransformations based on the stored ETL tasks. In addition, it allowed one to use all existingPentaho ETL components. Nonetheless, Kettle allows the implementation of new componentsas a custom plugin. Carte servers enabled to execute transformations remotely. Those serverswill reside in institutions, as well as the private data sources, thus ensuring data protection.Additionally, Carte servers can be defined as a cluster formed by a master and a group of slaves.This cluster configuration allows load balancing and failover operations. Apache Quartz wasused to allow the scheduling of ETL task executions through cron expressions.
All system requirements listed in chapter 3 were fulfilled. The final system allows users, ifthey have the right permissions, to instantly start developing and scheduling ETL tasks andto define execution servers and private data sources within a institution. Also, the integra-tion effort of new ETL components was mitigated by the dynamic approach to componentspecification.
6.1 Future Work
Despite the obtained results, several developments can be planned as future work. Con-sidering that one of the most important use cases for ETL tasks is to aggregate data in order
57

to produce statistical reports, a report management tool would be an important contribution.Anyway, one has to think and decide if the report management tool should be integrated inBIcenter or if it should be a standalone product, which would interact in a coordinated waywith BIcenter. Since currently the ETL step ouput is only represented in a tabular format,there is a limitation on the value that can be extracted from the data during the ETL taskexecution. Hence, it would be extremely important to provide ways to define enriched views ofthe output, namely pivot tables, bar charts, line charts, area charts, scatter charts, pie chartsand heat grids. There are several data visualization libraries that could be good options toempower enriched views over the ouput data, for example: Pentaho Visualization API, D3.jsand Chartist.js.
58

Bibliography
[1] T. M. C. et al, “Opportunities and challenges of big data in economics research andenterprises,” International Journal of Computer Science and Mobile Computing, vol. 3,no. 4, pp. 1155–1161, 2014.
[2] J. V. G. Matt Casters, Roland Bouman, Pentaho Kettle Solutions. Wiley Publishing,Inc., 2010.
[3] A. Labrinidis and H. V. Jagadish, “Challenges and opportunities with big data,” Proc.VLDB Endow., vol. 5, pp. 2032–2033, Aug. 2012.
[4] P. P. L. R. Ruchita H.Bajaj, “Big data – the new era of data,” International Journal ofComputer Science and Information Technologies, vol. 5, no. 2, pp. 1875–1885, 2014.
[5] W. K. Motashim Rasool, “Big data: Study in structured and unstructured data,” HCTLOpen International Journal of Technology Innovations and Research (IJTIR), vol. 14,pp. 1–6, 2015.
[6] P. B. Divyakant Agrawal, “Challenges and opportunities with big data,” Cyber CenterTechnical Reports, 2012.
[7] S. Negash, “Business intelligence,” Communications of the Association for InformationSystems (CAIS), vol. 13, no. 15, pp. 177–196, 2004.
[8] Margaret Rouse, “business intelligence (bi).” https://searchbusinessanalytics.techtarget.com/definition/business-intelligence-BI, 2016. [Online; accessed2018-May-21].
[9] H. W. Inmon, Building the Data Warehouse. New York: John Wiley & Sons Inc, 3 ed.,2002.
[10] E. Rahm and H. Hai Do, “Data cleaning: Problems and current approaches,” IEEEComputer Society, vol. 23, no. 4, pp. 3–13, 2000.
[11] N. Mali, “A Survey of ETL Tools,” International Journal of Computer Techniques -–,vol. 2, no. 5.
[12] P. S. Metkewar, “A Technical Comprehensive Survey of ETL Tools,” International Journalof Applied Engineering Research ISSN, vol. 11, no. 4, pp. 973–4562, 2016.
[13] R. Krishna and Sreekanth, “An object oriented modeling and implementation of web basedetl process,” IJCSNS International Journal of Computer Science and Network Security,vol. 10, no. 2, pp. 192–196, 2010.
59

[14] V. Radhakrishna, V. Sreekanth, and B. RangaSwamy, “Implementation ofweb-etl transfor-mation with pre-configured multi-source system connection and transformation mappingstatistics report,” International Conforence on Advanced Computer Theory and Engineer-ing(ICACTE), vol. 3, no. 2, pp. 317–322, 2010.
[15] M. Novak and K. Rabuzin, “Prototype of a web etl tool,” (IJACSA) International Journalof Advanced Computer Science and Applications, vol. 5, no. 6, pp. 97–103, 2014.
[16] S. N. et al, “An improved version of big data classification and clustering using graphsearch technique,” International Journal of Computer Science and Mobile Computing,2016.
[17] P. D. Juarez, P. Matthews-Juarez, D. B. Hood, W. Im, R. S. Levine, B. J. Kilbourne,M. A. Langston, M. Z. Al-Hamdan, W. L. Crosson, M. G. Estes, S. M. Estes, V. K.Agboto, P. Robinson, S. Wilson, and M. Y. Lichtveld, “The public health exposome: Apopulation-based, exposure science approach to health disparities research,” InternationalJournal of Environmental Research and Public Health, vol. 11, no. 12, pp. 12866–12895,2014.
[18] Wikipedia, “Data warehouse.” https://en.wikipedia.org/wiki/Data_warehouse,2017. [Online; accessed 2018-May-21].
[19] Margaret Rouse, “Data mart.” https://searchsqlserver.techtarget.com/definition/data-mart, 2014. [Online; accessed 2018-May-21].
[20] Margaret Rouse, “Star schema.” https://searchdatamanagement.techtarget.com/definition/star-schema, 20010. [Online; accessed 2018-May-28].
[21] Margaret Rouse, “Olap (online analytical processing).” https://searchdatamanagement.techtarget.com/definition/OLAP, 2007. [Online; accessed2018-May-28].
[22] M. A. Beyer, E. Thoo, E. Zaidi, and R. Greenwald, “Magic quadrant for data integrationtools,” tech. rep., CloverETL, Gartner, 08 2016.
[23] H. Filho, “Análise comparativa das ferramentas de ETL - Kettle e Talend,” Master’sthesis, UNIVERSIDADE FEDERAL DA PARAÍBA, RIO TINTO – PB, 2013.
[24] T. A. Majchrzak, T. Jansen, and H. Kuchen, “Efficiency evaluation of open source etltools,” in Proceedings of the 2011 ACM Symposium on Applied Computing, SAC ’11,(New York, NY, USA), pp. 287–294, ACM, 2011.
[25] M. Russel, “Etl benchmarks,” tech. rep., Manapps, [email protected], 10 2008.
[26] R. Katragadda, S. Sremath Tirumala, and D. Nandigam, “ETL tools for Data Warehous-ing: An empirical study of Open Source Talend Studio versus Microsoft SSIS,”
[27] H. S. Rose and P. Raibagkar, “A Comparative Study of ETL Tools,” IJSRD -InternationalJournal for Scientific Research & Development|, vol. 4, no. 05online, pp. 2321–613, 2016.
60

[28] J. Lapa, J. Bernardino, and A. Figueiredo, “A comparative analysis of open source busi-ness intelligence platforms,” in Proceedings of the International Conference on Informa-tion Systems and Design of Communication, ISDOC ’14, (New York, NY, USA), pp. 86–92, ACM, 2014.
[29] V. M. Parra, A. Syed, A. Mohammad, and M. N. Halgamuge, “Pentaho and Jaspersoft :A Comparative Study of Business Intelligence Open Source Tools Processing Big Data toEvaluate Performances,” IJACSA ) International Journal of Advanced Computer Scienceand Applications, vol. 7, no. 10, 2016.
[30] J. B. António Marinheiro, “Analysis of open source business intelligence suites,” in Pro-ceedings of the International Conference on Information Systems and Design of Commu-nication, (Lisboa, Portugal), IEEE, 2013.
[31] M. Casters, R. Bouman, and J. v. Dongen, Pentaho Kettle Solutions: Building OpenSource ETL Solutions with Pentaho Data Integration. Wiley Publishing, 2010.
61


