DENVER WATER MARSTON WATER TREATMENT PLANT ... - … · Denver Water saw the advantage of using a...
56
PAP -7 - 11 DENVER WATER MARSTON WATER TREATMENT PLANT BASIN 3 BAFFLE STUDY October, 1997 Prepared by: 1 0 Bates Engm-ft Incorporated 7333 W. Jefferson Avenue, Suite 155 Lakewood, Colorado 80235-2017 (303) 980-1212 Fax (303) 980-6300 WATER RESOURCES RESEARCH LABORATORY OFFICIAL FILE COPY
Transcript of DENVER WATER MARSTON WATER TREATMENT PLANT ... - … · Denver Water saw the advantage of using a...

PAP -7-11
DENVER WATER
MARSTON WATER TREATMENT PLANT
BASIN 3 BAFFLE STUDY
October, 1997
Prepared by:
1 0
Bates Engm-ft Incorporated
7333 W. Jefferson Avenue, Suite 155 Lakewood, Colorado 80235-2017
(303) 980-1212 Fax (303) 980-6300
WATER RESOURCES RESEARCH LABORATORY
OFFICIAL FILE COPY
ACKNOWLEDGMENTS
Lee Cesario, Denver Water project manager, conceived of the idea of testing Marston Basin 3 using a hydraulic model and provided guidance on model construction, flow conditions and goals for the project.
The hydraulic model was designed, installed and tested by Dave Woodward of Bates Engineering. The model was fabricated by AIA Plastics of Denver. Provision of equipment and assistance in setup were provided by Bureau of Reclamation Water Resources Research Laboratory and Laboratory Shops with the help of Jerry Fitzwater and Herb Hanley under the oversight of Phil Burgi and Don Clem. The de-ionized water was provided by Tom Bunnelle of the Water Treatment and Engineering and Research Group under the oversight of Stan Hightower.
This report was prepared by Dave Woodward and reviewed by Bob Bates and Lee Cesario.

TABLE OF CONTENTS
EXECUTIVE SUMMARY
I. PURPOSE Page 1
II. USE OF HYDRAULIC MODELS Page 3
III. MODEL DESCRIPTION Page 4
IV. MODEL SCALING FACTORS Page 7
V. DATA COLLECTION AND INTERPRETATION Page 8
VI. SUMMARY OF TESTS PERFORMED Page 10
VII. SUMMARY OF TEST RESULTS Page 13
VIII. BAFFLE CONFIGURATION SELECTION Page 25
IX. RECOMMENDATIONS Page 28
REFERENCES
APPENDIX A - HYDRAULIC MODEL SCALING FACTORS
APPENDIX B - CONDUCTIVITY DATA
APPENDIX C - TRACER BREAKTHROUGH CALCULATIONS
APPENDIX D - SELECTED PHOTOGRAPHS
Denver Water Marston Basin 3 Baffle Study - Table of Contents

EXECUTIVE SUMMARY
This report discusses the results of a hydraulic model study investigating mixing in Denver Water's Marston Water Treatment Plant Basins. The primary purpose of the study was to determine a baffle arrangement that would minimize "dead zones" in Basin 3 in light of changes made to the inlet and outlet locations. Secondary purposes were to evaluate the proposed weir box in Basin 2 and determine a satisfactory inlet pipe geometry for Basin 3.
The study was performed by Bates Engineering in cooperation with the U.S. Bureau of Reclamation using a 1:48 scale acrylic model. A total of 17 tests were performed in July and August 1997. The study recommends that the weir in Basin 2 be sharp-crested and that three 72-inch inlets be provided into Basin 3. A specific baffle configuration recommendation is made for Basin 3 which will improve mixing in potential "dead zones" by 32%.
Denver Water Marston Basin 3 Bale Study - Executive Summary

PURPOSE
The Denver Water Marston Water Treatment Plant provides "peaking" capacity water treatment during periods of high summertime demand to supplement water treated at the Foothills and Moffat Water Treatment Plants. The Plant treats approximately 10% of the water produced by Denver Water. At the end of the treatment process, the treated water passes through two contact basins (Basins 1 and 2) with storage volumes of 3.5 Million Gallons (MG) each. The water may then be routed into the distribution system or pass through a 10.4 MG clearwell (Basin 3) for temporary storage. These three basins were constructed in the 1950's of cast-in-place concrete. Their locations and orientations can be seen in Figure 1.
Plans are currently underway to modify these basins to maximize their effectiveness. This is to be achieved by increasing the chlorine contact time in the contact basins and eliminating "dead zones" in the clearwell. Contact time is defined as the length of time for a slug of water to move from the inlet to the outlet of the basin. Dead zones are defined as specific areas within the basins where turnover of water is relatively slow compared with the average turnover in the basin.
Modifications to the basins include adding labyrinth baffles in Basins 1 and 2 to achieve plug flow, constructing a weir at the west end of Basin 2 to provide uniform flow into Basin 3 and modifying the inlet and outlet piping in Basin 3. The proposed Basin 3 inlet pipes will consist of steel pipe and butterfly valves through the common wall with Basin 2. The outlet will be moved from the north wall to the southwest wall.
Three hydraulic questions have been raised by Denver Water in light of these proposed changes to the basins:
0 Will the weir at the west end of Basin 2 work effectively?
• What inlet configuration for Basin 3 will result in the most uniform mixing in the basin?
• What baffle configuration in Basin 3 will minimize dead zones in the basin?
The purpose of this study was to address these three issues.
Denver Water Marston Basin 3 Baffle Study - Page 1 of 28

K 0 m 0 D
M 0
-0c
o ~
C7 0
O n CD 0 to
Existing 54" 0 Out/et to be abandoned
. . . . . . . . . . . . . . . .
Proposed 96" Out/et . . . . . . . . . . . . . . II . 11
r Bos%n 3 11 . 1 4 II
Filter Bldgs. i i . . . . . . . . 1 Proposed 72" 0 Inlets
II
I I BOS%/! ~ BOSln L
I it l Jill . . . . . . . . . . . 1111 1111 . . . . . . . . . . . . Jill .
1111 . . . . . . . . . . . .
---- J X11 -----J
Proposed We%r Box

II. USE OF HYDRAULIC MODELS
Recently, researchers have turned to scale hydraulic models to investigate mixing issues in potable water storage reservoirs."' These studies have been spearheaded by the American Waterworks Association (AWWA) Research Foundation Project 260, "Water Quality Modeling of Distribution System Storage Facilities". This research has previously been summarized in a report to Denver Water.'
Bates Engineering, Inc. has performed three hydraulic model studies related to mixing in potable water storage reservoirs. Each of these studies were performed using scale hydraulic models constructed of acrylic at the U.S. Bureau of Reclamation Water Resources Research Laboratory in Lakewood, Colorado. The findings from these studies have been incorporated into the knowledge base of AWWA Research Foundation Project 260.
The first study performed by Bates Engineering examined the effects of inlet piping configuration on mixing in a 3 MG reservoir under design in 1996 for the City of Aurora, Colorado. The number, size and location of the inlets were varied as well as the inlet pipe configuration itself The results of this study were incorporated into the design of the reservoir now under construction.
A second study was performed for Denver Water to investigate general aspects of reservoir mixing that could be applied to the Hogback, Chatfield and Colorow reservoirs.' During six tests, the effect of four variables affecting mixing were evaluated: outlet configuration, water temperature, flow rates and the use of an air bubbler mixing system. The report concluded that the most important influences on reservoir mixing, and hence water quality, were: inlet/outlet geometry, flow rate and water temperature. An air bubbler mixing system effectively promoted mixing but required further evaluation.
A third study for the City of Fort Collins Water Utilities examined various baffle configurations to increase contact time at the twin 15 MG Reservoirs at their Water Treatment Facility. Baffle configurations were recommended for each reservoir that would increase the contact time by an average of 28%.5 These baffles are currently under construction.
Denver Water saw the advantage of using a hydraulic model to address the issues related to modifications to their contact basins at the Marston Water Treatment Plant described in Part 1. They contracted with Bates Engineering, Inc. in June 1997 to perform a hydraulic model study. This report describes the model, the testing and the conclusions reached.
` Grayman, Walter M., et. al., "Water quality and mixing models for tanks and reservoirs," Journal of the American Water Works Association, Vol. 88, No. 7 (July 1996), pp. 60-73. Z Telephone conversation with Lewis Rossman, U.S. Environmental Protection Agency, National Risk Management Research Laboratory, Cincinnati, October 22, 1996. ' Bates Engineering, Denver Water Treated Water Storage Reservoir Hydraulic Model Mixing Study, report prepared for Denver Water, November 1996. ' ibid. S Bates Engineering, Fort Collins Water Utilities 15 MG Reservoirs Baffle Study, report prepared for Fort Collins Water Utilities, September 1997.
Denver Water Marston Basin 3 Baffle Study - Page 3 of 28

III. MODEL DESCRIPTION
The hydraulic model includes the weir box in Basin 2 and all of Basin 3. In order to provide uniform flow into the weir box, a separate box was added adjacent to the weir box to introduce flows from the pump. The level floor and walls of Basin 3 were fabricated using 1/2-inch acrylic sheet. The sloping floor in the proposed Basin 2 weir box was replicated in the model.
In order to keep the model to a size which could be readily transported and to permit use of scaleable PVC pipe fittings, a model scale factor (LR) of 1:48 was selected. The resulting model dimensions were approximately 8 1/2 feet by 9 feet (see Figures 2 and 3). The 18-inch round prototype columns were modeled with 3/8-inch acrylic dowels. Baffles consisted of 1/8 acrylic sheets attached to columns with adhesive putty.
Five inlets were provided along the southwest wall: two 1 3/4-inch inlets (84-inch prototype) at the third points of the weir box and three 1 1/2 inch inlets (72-inch prototype) at the quarter points. A single 2-inch outlet (96-inch prototype) was provided along the southwest wall half way between the northern edge of the weir box and the west edge of the basin. All the inlets and the outlet were placed at a minimum of 1/4 inch (1 foot prototype) above the floor.
The model was placed on a wood frame at the U.S. Bureau of Reclamation Water Resources Research Laboratory in Lakewood, Colorado for testing (see Photo 1, Appendix D). Mylar sheets were placed under the model to diffuse the fluorescent lights mounted below used for overhead photography.
Water was provided to the inlet box using a 250-gallon plastic supply tank in conjunction with a small centrifugal pump and flexible plastic piping. The water was diffused in the inlet box using a tee fitting (see Photos 4 and 5, Appendix D). Water was drawn through the outlet by means of two Little Giant"' 1/25 HP magnetic drive centrifugal pumps in series and was discharged to a floor drain. Inflow and outflow rates were measured using valved, acrylic, panel-mount, 10 gallon per minute (gpm) King° rotameters.
Denver Water Marston Basin 3 Baffle Study - Page 4 of 28

T
i
Figure 2 Model Plan _ -
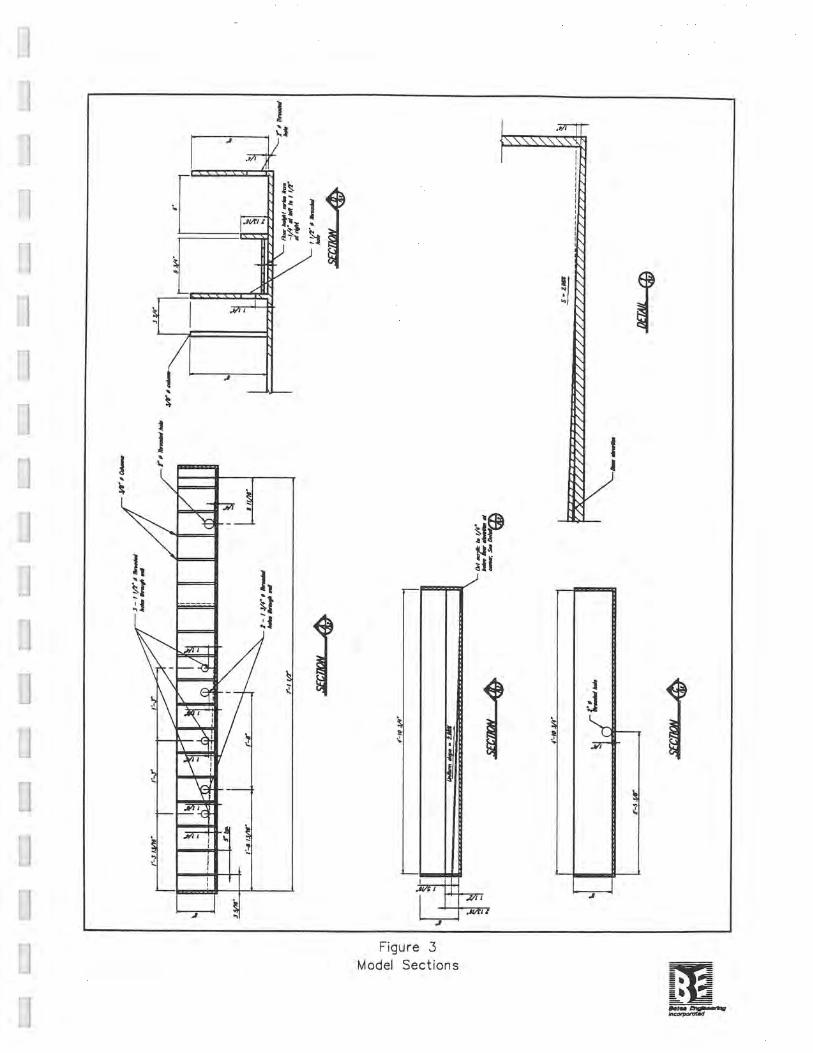
Figure 3 Model Sections
PT

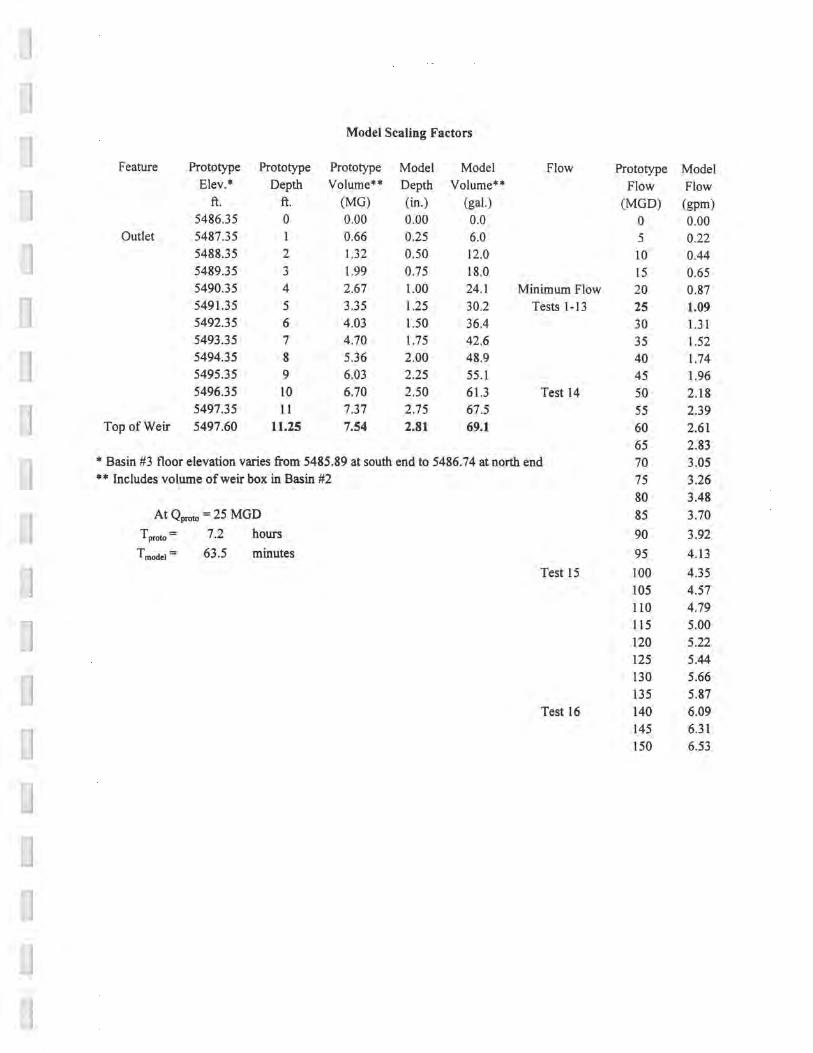
IV. MODEL SCALING FACTORS
In order to derive quantitative data from a hydraulic model, relationships between the prototype and model parameters such as length, flow and time must be established. These relationships are expressed in terms of similitude. For flowing water the choice of an appropriate similitude relationship is based on the forces which dominate the flow, whether inertia, friction, gravity, compressibility, surface tension or pressure.' For flow under atmospheric pressures characterized by turbulence, the Froude similitude relationship is the appropriate choice.
For Froude similitude, model lengths are scaled directly by the scale factor, so that, for example, at 48 scale, a 1 1/2-inch diameter model inlet pipe corresponds to 72-inch prototype pipe.
For Froude similitude, flow rates for the model were scaled by the five-halves power so that 25 MGD corresponds to a model flow rate of
QM = QP/LR'/2 = 25 x 106 /48 S2/(24*60) = 1.09 gpm.
This flow rate was selected as a control flow rate for the baffle selection tests to allow adequate time for taking conductivity data. The actual prototype flow rate for Basin 3 is expected to vary from 20 to 150 MGD. For Froude similitude, time is scaled by a factor of the one-half power. One minute in model time thus corresponds to
Tp = TM*LR1/2 = (1)(48)1/2 = 6.92 minutes
in prototype time. Two hours of testing time in the model thus corresponds to 13.8 hours in the prototype.
For further details on model scaling, see Appendix A.
6 Daugherty, Robert L. and Joseph B. Franzini. Fluid Mechanics with Engineering Applications, 7th ed., McGraw Hill, 1977, pp. 174-181.
Denver Water Marston Basin 3 Baffle Study - Page 7 of 28

V. DATA COLLECTION AND INTERPRETATION
Mixing in a hydraulic model can be visually observed by using a tracer dye. For this model, dye was introduced by adding yellow-green Norlab® liquid powder tracing dye to the water in the supply tank which was then pumped into the model. The initial mixing in the model could be observed and photographed with this method. However, after about 25 minutes, all the water in the model was sufficiently dyed to prohibit further observation of mixing patterns. Quantitative means were thus needed to verify mixing.
Conductivity can also be used to evaluate mixing. If tap water is introduced into a model full of de-ionized water, areas of low ion concentrations in the model indicate a lower turnover rate than areas of high concentrations. Dead zones could thus be located.
To utilize conductivity measurements, the model was filled with de-ionized (distilled) water and the supply tank was filled with tap water. De-ionized water has a theoretical conductivity of zero and the laboratory tap water had conductivity values in the range of 120 to 130 microSiemens per centimeter (µS/cm). An Orion Model 105 conductivity meter was used to record conductivity from fourteen 5-pin Orion 012010 conductivity probes mounted at fixed locations in the supply tank and model (see Appendix B for their locations). These 14 probes were bussed to a switching box with 14 channels so the probes could be read at a single location (see Photo 1, Appendix D). An additional 8-pin Orion"' 0 105 10 conductivity probe was used to independently verify conductivity measurements. This probe was also used to record temperatures in the model and the dye tank. In general, the dye tank and model temperatures were within I" C of each other during conductivity testing so that temperature stratification was not created in the model.
The primary means for evaluating the effectiveness of a given baffle configuration with conductivity is by measuring the conductivity at a particular probe at a specific time and comparing it with the conductivity measured during the unbaffled test. The conductivity measurements can then be converted to a percent tracer breakthrough as follows:
% Tracer Breakthrough (t) = Conductivity(t) - Conductivity (t=0) Conductivity(Supply) - Conductivity (t=0)
For each probe, time can be plotted on the x axis and percent tracer breakthrough can be plotted on the y axis. Time is expressed in percent of hydraulic detention time, T, which is defined as the time for one complete exchange of water in the basin. For example, for flow in the model of 1.09 gpm and a water level of 2 13/16 inches (corresponding to approximately 69.1 gallons of storage, see Appendix A for details), one complete exchange of water in the model requires:
T = 69.1 gallons/1.09 gpm = 63.5 minutes
The progress of mixing at a particular probe can then be evaluated from the graph by reading TX/T values. L is defined as the time at which x percent of the inflow tracer concentration (tracer breakthrough) reaches the particular probe. For example, if 10% of the inflow tracer concentration reached the probe at 19 minutes, the resulting T,o/T is:
T,o/T = 19 minutes/63.5 minutes = 0.30 or 30%
Denver Water Marston Basin 3 Bale Study - Page 8 of 28

Basins are routinely evaluated based on the T jdT value at the outlet. In the Guidance Manual for Compliance with the Filtration and Disinfection Requirements for Public Water Systems Using Surface Water Sources, the Environmental Protection Agency (EPA) has classified the degree of mixing in basins based on T,o/T time.' A modified version of their basin classification system is found below:
Basin Condition TLO/T
Perfect Short Circuiting 0.00 Unbaffled (Completely Turbulent) 0.10 Minimal Baffling 0.30 Average Baffling 0.50 Superior Baffling 0.70 Perfect Mixing (Plug Flow) 1.00
While these guidelines appear to be more applicable to small basins than to large ones like Basin 3, they do provide some guidance on evaluating baffling configurations.
' U.S. Environmental Protection Agency, Guidance Manual for Compliance with the Filtration and Disinfection Requirements for Public Water Systems Using Surface Water Sources, Washington D.C., March 1991, Table C-5.
Denver Water Marston Basin 3 Baffle Study - Page 9 of 28

VI. SUMMARY OF TESTS PERFORMED
A total of 17 tests were performed to answer the questions raised concerning modifications to Basins 2 and 3. The variables for each of the 17 tests performed are summarized on Table 1.
The first two tests were performed to select an inlet pipe configuration for Basin 3. The mixing patterns of dyed water in the unbaffled basin were visually evaluated.
Test 3 was a control conductivity test performed on the unbaffled basin
Tests 4 - 7, 9, 10 and 12 involved the visual qualitative evaluation of mixing in the basin using dye only. Eight different baffle arrangements were tested (See Figure 4). These tests were terminated when further evaluation was not feasible due to complete dye dispersion in the model. Overhead photographs were taken for each test at regular intervals. A separate notebook of photographs has been provided to Denver Water along with this report.
Tests 8, 11 and 13 involved the quantitative conductivity testing of the three most promising baffle configurations based on the visual evaluation of the dye tests. The tests were terminated when the outlet conductivity reached 90% of the inlet conductivity (approximately two hours).
Tests 14, 15 and 17 were performed to determine if the T,,/T values were constant for other flow rates. Baffle 8 was selected as a control for these tests. Flows of 50, 100 and 140 MGD were tested (140 MGD was the maximum outlet pump capacity). Photographs for the 100 MGD test were taken separately in Test 16.
Denver Water Marston Basin 3 Baffle Study - Page 10 of 28

Table 1. Summary Of Tests Performed
Baffle Prototype Test Overhead Conductivity Test # Date Baffle # Length Flow Duration Photos Data Comments
(feet) (MGD) (min.) 1 7/28/97 None 0 25 17 Yes No 2-84" Inlets 2 7/28/97 None 0 25 17 Yes No 3-72" Inlets 3 7/30/97 None 0 25 120 No Yes Unbaffled 4 7/30/97 1 190 25 25 Yes No Dye Test 5 7/30/97 2 246 25 25 Yes No Dye Test 6 7/30/97 3 248 25 25 Yes No Dye Test 7 7/30/97 4 253 25 25 Yes No Dye Test 8 8/4/97 4 253 25 120 No Yes Conductivity 9 8/4/97 5 321 25 25 Yes No Dye Test 10 8/4/97 6 438 25 25 Yes No Dye Test 11 8/11/97 6A 496 25 120 t>_ 10 min. Yes Conductivity 12 8/11/97 7 341 25 30 Yes No Dye Test 13 8/13/97 8 367 25 120 Yes Yes Conductivity/Dye Test 14 8/26/97 8 367 50 60 Yes Yes Conductivity 15 8/27/97 8 367 140 21:26 Yes Yes Conductivity 16 8/28/97 8 367 100 10 Yes No Dye Test 17 8/28/97 8 367 100 30 No Yes Conductivity

.......... ...
Figure 4 Baffle Configurations
OWE=
. ..........
............... " : : N
..........

VII. SUMMARY OF TEST RESULTS
A. Weir Box
During the initial model testing, an unexpected phenomenon occurred in the model weir box. When the water level in the inlet box (representative of Basin 2) was nearly level with the water level in the weir box and Basin 3, a turbulent rocking motion would occur in the weir box in the short dimension (see Photographs 4 and 5, Appendix D). This rocking motion eventually created relatively large surface waves in Basin 3. The phenomena became a concern because of the potential impact of these waves in the prototype.
After discussion with Bureau laboratory personnel, it was concluded that this phenomena was a result of the vacuum created along the downstream face of the weir as water flowed horizontally over the flat crest of the weir. This vacuum "sucked" the water in the weir box towards the weir wall. As the water level rose at the weir wall, the vacuum collapsed and the water sought to level itself by moving back away from the wall. The continuation of this process created the cyclic rocking motion. Laboratory personnel believed that this phenomenon might also be expected in the prototype.
Laboratory personnel recommended replacing the broad-crested weir (1/2-inch acrylic sheet) with a sharp crested weir. A 1/8-inch thick strip of sheet metal was used to simulate the sharp-crested weir. The rocking phenomenon was eliminated for all flow depths with this modification. A sharp-crested weir is thus recommended for construction.
Denver Water Marston Basin 3 Baffle Study - Page 13 of 28

B. Net Configuration
Tests 1 and 2 were performed to select an inlet pipe configuration for Basin 3. The mixing patterns of dyed water in the unbaffled basin were visually evaluated for two inlet configurations proposed by Denver Water. Overhead photographs of these two tests can be found in the separate photograph binder.
The first configuration involved two 1 3/4-inch inlets (84-inch prototype) at the third points of the weir box. The second involved three 1 1/2 inch inlets (72-inch prototype) at the quarter points of the weir box. Inlets not in use during the tests were sealed with 1/8-inch acrylic sheet and a submersible sealing lubricant.
During initial mixing, the spread of flow across the basin was wider with three inlets as would be expected. With three inlets the zone between the inlet and outlet (Probe 4) appeared to be less well mixed, while with two inlets the northwest wall (Probe 9) appeared to be less well mixed. Dye reached the farthest (northeast) corner (Probe 13) slightly faster with two inlets than with the three, probably due to the higher inlet velocities associated with the smaller overall inlet opening area.
Although there did not appear to be large differences in mixing between the three and two inlet configurations, a decision was made to use three inlets in order to better spread the initial flows and provide more flexibility in operation of the basin. The remaining tests were thus performed using the three inlets.
Denver Water Marston Basin 3 Baffle Study - Page 14 of 28

11
C. Unbaffled Conductivity Test
As a means for identifying dead zones in the basin and as a control for later baffled tests, an unbaffled conductivity test was next performed.
Prior to performing the test, it was assumed that the dead zones would be primarily located at the comers of the model away from the inlet and outlet (i.e. Probes 3, 12 and 13). In fact, conductivity readings at Probes 12 and 13 did indicate poor mixing. However, the area around Probe 3 appeared to be well mixed (see Photograph 7). Surprisingly, the "short-circuit" path between the inlet and outlet (Probe 4) also appeared to be poorly mixed. In general flows tended to fan out from the southwest wall perpendicularly and gradually arc to the north and bend back again south. This created a dead zone at probe 4. See Figure 5 below.
4 50
Decd Zone ° 59 .
'Jo = Conduc(iv#y Probe Locofion and Number
Decd Zone
Figure 5. Unbaffled Flow Lines
In general, the differences between the conductivities in the active and dead mixing zones in the basin were relatively higher than for other models tested by Bates Engineering, Inc. This is undoubtedly due both to the unusual geometry of the basin and the fact that the inlet and outlet are located on the same, rather than adjacent or opposite, walls.
12,
Denver Water Marston Basin 3 Baffle Study - Page 15 of 28

D. Baffle Dye Tests
Based on the observations of dead zones in the unbaffled basin, eight different baffle configurations were dye tested to narrow the selection of baffle configurations for the longer conductivity tests. These configurations were developed based on what appeared to be reasonable means of directing flows through dead zones without creating new dead zones. An attempt was made achieve this goal without extensive plug-flow type baffles which are not only expensive, but also become a maintenance liability. The guiding principle followed was to allow the basin to disperse flows where it was naturally able to and to train flows
a where it was not. The basic configuration involved creating a "wall" between the inlet area and the outlet area punctuated by short gaps which would prevent creating new dead zones behind the baffles.
Some general observations made in the course of these dye tests were:
1. The dead zone at Probe 4 could not be effectively eliminated by directing flows from the northernmost inlet through this area (Baffles 1, 2, 3 and 5).
2. Too many gaps in the baffle "wall" prevented the dead zone at Probes 12 and 13 from being eliminated (Baffles 1-5).
3. Baffle configurations which left a gap along the southwest wall (Baffles 1-5 and 7) allowed a basin-wide circular mixing pattern to develop. This proved counterproductive because some the water approaching the outlet was blended back in with the incoming flows. This water was thus forced to remain in the basin a minimum of twice as long as other water.
4. The area along the northwest wall does not tend to mix well unless flows are channeled along this wall (Baffle 8).
Q Overall, Baffle Configurations 6A and 8 appeared to provide the greatest improvement in overall mixing. The third best arrangement appeared to be Baffle Configuration 4.
Denver Water Marston Basin 3 Bale Study - Page 16 of 28

E. Baffle Conductivity Tests
Baffle Configurations 4, 6A and 8 were selected to undergo conductivity testing for two hours to determine quantitatively which configuration was most effective in minimizing dead zones in Basin 3. For these three tests and the unbaffled test tracer breakthroughs were calculated at the dead zones identified in the unbaffled test (Probes 4, 9, 12, 13) and at the outlet (Probe 14). The calculations can be found in Appendix C. Tracer breakthroughs at these probes are graphed on the following pages. The graphs allow ready comparison of the effectiveness of each baffle configuration.
A relatively rapid increase in conductivity at Probes 4, 9, 12 and 13 is an indication of favorable mixing, since these are the dead zones. Baffles 6A and 8 tended to promote faster mixing at Probe 4. None of the baffles improved the mixing at Probe 9, except that Baffle 8 tended to produce more rapid mixing later in the testing. All three baffle configurations improved mixing at Probe 12, with Baffles 4 and 8 being most significant. The improvement in mixing at Probe 13 was dramatic and similar for all three baffle configurations, except that Baffle 6A gave the best long-term mixing.
A relatively slow increase in conductivity at the outlet (Probe 14) is also an indication of favorable mixing, because it indicates that flows have been spread more uniformly in the basin before they are discharged. In general all the baffles were slightly better than the unbaffled case early in the tests, but were similar in the long term.
Denver Water Marston Basin 3 Baffle Study - Page 17 of 28

Denver Water Marston Basin #3 Baffle Study
Probe 4 Breakthrough 100%
90%
80%
70%
E" 40% 0
30%
20%
10%
/
Unba$led —Baffle #4 ~/~
wow.
0040•~
- - - Baffle #6A — - Baffle #8 0
oo 0
'0/ poll
WOO
f 000010
,
t
r r r
I /
r ~
r r r
rr ' / 0%
0% 20% 40% 60% 80% 100% 120% 140% 160% 180% 200%
% Hydraulic Detention Time

Denver Water Marston Basin #3 Baffle Study
Probe Breakthrough
100%
90%
80%
70%
60% L
50% L V
40% 0
30%
20%
10%
0%
0%
r• Unbattled — —Baffle #4 / ' 00
- - -Baffle #6A / ' .0000
`• ' — - Baffle #8
r r
0000
/ • 000
r ~0-*W
/ / r /
/
e I r
I
0.0
/ 1
/
/
J ,
1 i 1
•
•
20% 40% 60% 80% 100% 120% 140% 160% 180% 200%
% Hydraulic Detention Time

40% 0
100%
90%
80%
70%
30%
20%
10%
0%
0%
— Unbaffled
—Baffle #4 - - - Baffle #6A 0 / - - Baffle #8
00 /
001.0-
/ /
/
0 10
10
i s
/ •
/1
♦ 1
20% 40% 60% 80% 100% 120%
% Hydraulic Detention Time
140% 160% 180% 200%
Denver Water Marston Basin #3 Baffle Study
Probe 12 Breakthrough

140% 160% 180% 200% 20% 40% 60% 80% 100% 120% % Hydraulic Detention Time
Denver Water Marston Basin #3 Baffle Study
Probe 13 Breakthrough 100%
90%
80%
70%
60%
50%
E" 40% e
30%
20%
10%
- Unba$led - - — Baffle #4 - - / • - - - Baffle #6A ..•► — - Baffle #8
0-0 0000
' Op /
0 /
001-
'000f./
i
f /
Ir/
IF
r
IV f
r
0% 0%

160% 180% 200% 20% 40% 60% 80% 100% 120% 140%
% Hydraulic Detention Time
Denver Water Marston Basin #3 Baffle Study
Probe 14 (Outlet) Breakthrough 100%
90%
80%
70%
'man 60%
50%
v
E" 40% \o 0
30%
20%
10%
Unbaffled — Baffle #4 - - - Baffle #6A — - Baffle #8 •
/ /
/ / . ./
/
0000
0000 I I
/
/ /
/ /
/
/
/
0% 0%

F. Stability of T,o/T Times for Differing Flow Conditions
In order to ascertain the impact of the baffles over the flow range expected in the prototype, conductivity tests were run for Baffle 8 at 25, 50, 100 and 140 MGD. A comparison of tracer breakthrough for Tests 13, 14, 15 and 17 is shown graphically on the following sheet. The graphs are strikingly similar indicating that T,,/T is constant for the flow ranges expected in the prototype. Minor differences at the beginning of the tests are likely due to difficulty in making the rapid measurements required for the higher flows.
Denver Water Marston Basin 3 Baffle Study - Page 23 of 28

Denver Water Marston Basin #3 Baffle Study Baffle 8 - Outlet Breakthrough
100%
90%
80%
70%
60%
A
50%
F` 40%
30%
20%
10%
25 MGD 00pw 0 i
— — 50 MGD - - - 100 MGD ..~' — - 140 MGD • ✓
/ • •
•
10
J
♦ • ♦
♦ I ♦
0%
0% 20% 40% 60% 80% 100% 120% 140% 160% 180% 200%
% Hydraulic Detention Time

VIII. BAFFLE CONFIGURATION SELECTION
Since the goal of baffling Basin 3 was to eliminate dead zones, it was felt that the best means of evaluating the three baffle configurations was to quantify their performance at the probes identified in the unbaffled test as dead zones. These are Probes 4, 9, 12 and 13.
In order to weigh the impacts of the baffles over time for each test, the values of T,o/T, T50/T and T90/T for these four probes were determined from the graphs. The percent improvement of baffle "#" over the unbaffled case at a particular time was calculated as follows:
% Improvement (#) = T,_,/T(Unbaffled) - T,, 100 T,,/T(Unbaflled)
In order to compare the relative benefits of various baffle configurations, the increases in T,/T times were weighed against the length of baffle involved. Since the length of baffle will be approximately proportional to cost, this permits an economic evaluation of the benefits of the various baffle configurations. Consequently the percent improvement in tracer breakthrough was divided by the length of the particular baffle in hundreds of feet.
The length-relativized percent improvement for each baffle was then averaged for the three times, T,o/T, T50/T and T90/T. The results are shown on Table 2. Baffle 6A provides the best initial mixing (TIWD, but it surpassed by Baffle 8 later in the tests (T50/T and T90/T). Overall, Baffle 8 has the greatest average improvement over length, followed by baffles 6A and 4. Even without relativizing the baffle configurations by their respective lengths, Baffle 8 is still superior to Baffle 6A. For these reasons Baffle 8 is the recommended baffle configuration.
Denver Water Marston Basin 3 Baffle Study - Page 25 of 28

Table 2. Evaluation of Top Three Baffles
10% Tracer Breakthrough (t = T,o/T) Baffle Length
(feet)
% Impr./ Length
in 100's Baffle # T,o/T (%) at Probe Average
4, 9, 12, 13
%
Improvement 4 1 9 12 13 14*
None 44 28 35 37 32 36 0% 0 4 38 27 34 18 37 29 19% 253 7.4%
6A 11 42 29 17 36 25 31% 496 6.3% 8 20 38 1 27 1 23 1 42 27 25% 367 6.8%
* T,o/T at outlet
50% Tracer Breakthrough (t = TW T') Baffle Length
(feet)
% Impr./ Length in 100's
Baffle # T5o/T (%) at Probe Average 4, 9, 12, 13
% Improvement 4 1 9 12 13 14
None 72 53 93 115 62 83 0% 0 4 75 57 64 41 63 59 29% 253 1 11.4%
6A 22 77 70 46 76 1 54 1 35% 496 7.1%
1 8 34 67 1 50 1 45 1 66 1 49 1 41% 367 11.2%
90% Tracer Breakthrough (t = TqO/T) Baffle Length
(feet)
% Impr./ Length
in 100's Baffle # Tq/T (%) at Probe Average
4, 9, 12, 13 %
Improvement 4 1 9 12 13 14 None 210 188 253 260 189 228 0% 0
4 187 194 234 230 174 211 7% 253 1 2.9% 6A 103 205 196 155 170 1 165 1 28% 496
1
5.6% 8 129 172 1 144 1 186 1 165 1 158 1 31% 367 8.4%
Average % Impr./ Length
in 100's
Average %
Improvement Rating 0% 18% 7.2% 2 31% 6.3% 3 32% 8.8% 1

~€'• A
~. .
e
. . . . . . . . . . . . . . .
7
Figure 6
Recommended Baffle Configuration = _

IX. RECOMMENDATIONS
The following are recommended for the improvements to Denver Water's Marston Treatment Plant Basins 2 and 3:
A sharp-crested weir is recommended for the Basin 2 weir based on its improved hydraulic performance.
2. Three 72-inch inlets should be installed in the common wall between Basins 2 and 3 at the quarter points of the wall. This arrangement provides improved distribution of flow in the basin over a two-inlet scheme.
Baffle 8 is recommended for Basin 3. Of the baffle configurations tested, it had the best overall ability to eliminate identified dead zones over time. The effectiveness of this baffling will be constant over the anticipated flow range for the basin.
Denver Water Marston Basin 3 Baffle Study - Page 28 of 28

REFERENCES
Bates Engineering, Denver Water Treated Water Storage Reservoir Hydraulic Model Mixing Study, report prepared for Denver Water, November 1996.
Bates Engineering, Fort Collins Water Utilities 15 MG Reservoirs Baffle Study, report prepared for Fort Collins Water Utilities, September 1997.
Daugherty, Robert L. and Joseph B. Franzini. Fluid Mechanics with Engineering Applications, 7th ed., McGraw Hill, 1977.
Grayman, Walter M., Lecture Notes on "Modeling Tanks and Reservoirs", given at American Water Works Association Workshop on Distribution System Network Modeling, Denver, March 17, 1996.
Grayman, Walter M., et. al., "Water quality and mixing models for tanks and reservoirs," Journal of the American Water Works Association, Vol. 88, No. 7 (July 1996), pp. 60-73.
U.S. Bureau of Reclamation, Hydraulic Laboratory Techniques, Denver, 1980.
U.S. Environmental Protection Agency, Guidance Manual for Compliance with the Filtration and Disinfection Requirements for Public Water Systems Using Surface Water Sources, Washington D.C., March 1991.

APPENDIX A - HYDRAULIC MODEL SCALING FACTORS
0 0 0 0 0 0
Model Scaling Factors
Feature Prototype Prototype Prototype Model Model Flow Prototype Model Elev.* Depth Volume** Depth Volume** Flow Flow
ft. ft. (MG) (in.) (gal.) (MGD) (gpm) 5486.35 0 0.00 0.00 0.0 0 0.00
Outlet 5487.35 1 0.66 0.25 6.0 5 0.22 5488.35 2 1.32 0.50 12.0 10 0.44 5489.35 3 1.99 0.75 18.0 15 0.65 5490.35 4 2.67 1.00 24.1 Minimum Flow 20 0.87 5491.35 5 3.35 1.25 30.2 Tests 1-13 25 1.09 5492.35 6 4.03 1.50 36.4 30 1.31 5493.35 7 4.70 1.75 42.6 35 1.52 5494.35 8 5.36 2.00 48.9 40 1.74 5495.35 9 6.03 2.25 55.1 45 1.96 5496.35 10 6.70 2.50 61.3 Test 14 50 2.18 5497.35 11 7.37 2.75 67.5 55 2.39
Top of Weir 5497.60 11.25 7.54 2.81 69.1 60 2.61 65 2.83
* Basin #3 floor elevation varies from 5485.89 at south end to 5486.74 at north end 70 3.05 * * Includes volume of weir box in Basin #2 75 3.26
80 3.48 At QPro, = 25 MGD 85 3.70
Tproto = 7.2 hours 90 3.92
Tmode, = 63.5 minutes 95 4.13
Test 15 100 4.35 105 4.57 110 4.79 115 5.00 120 5.22 125 5.44 130 5.66 135 5.87
Test 16 140 6.09 145 6.31 150 6.53
I
__J
J

APPENDIX B - CONDUCTIVITY DATA

BATES ENGINEERING, INC. Test: 3 Inlet: 3-72" Flow: 25 MGD DENVER WATER MARSTON BASIN #3 Date: 7/10 Baffle: Unbaffled HYDRAULIC MODEL STUDY
Time Time
(t)
Photo
No(s)
Air
Temp.
(° C)
Supply
Temp.
(° C)
Model
Temp.
(° C)
Probe l
Conduct.
(NS)
Probe 2
Conduct.
(µ5)
Probe 3
Conduct.
(0)
Probe 4
Conduct.
(µ5)
Probe 5
Conduct.
(µS)
Probe 6
Conduct.
(0)
Probe 7
Conduct.
(µ5)
Probe 8
Conduct.
(µS)
Probe 9
Conduct.
(µ5)
Probe 10
Conduct.
(NS)
Probe I I
Conduct.
(µS)
Probe 12
Conduct.
(µS)
Probe 13
Conduct.
(µS)
Probe 14
Conduct.
(NS)
7:13 0 21.8 20.8 132.8 2.7 2.0 1.8 1.8 1.8 1.8 1.8 1.8 1.8 1.8 1.8 1.6 23
7:14 1 20.0 2.0 2.0 2.1
7:15 2 52.9 2.0 2.1
7:16 3 10.1 2.3 2.0
7:17 4 94.5 2.1 2.0 24.0 10.0 2.4 2.0
7:18 5
7:19 6 107.5 8.1 2.3 22.8 40.5 3.4 11.8
7:21 8 116.8 22.1 5.2 30.0 54.2 6.5 32.5
7:23 10 121.3 28.4 3.3 1.8 38.5 71.6 7.9 1.8 39.2 1.8 1.7 1.6 5.0
7:25 12 124.4 39.5 3.2 1.8 48.0 75.5 15.6 1.8 47.0 2.0 1.8 1.6 6.7
7:28 15 76.6 24.4 1.9 36.6 2.1 1.8 1.6 4.7
7:30 17 124.9 62.2 2.8 34.6 5.8
7:33 20 29.3 23.4 25.8 7.5 4.3 6.5 9.7
7:35 22 126.8 69.1 14.4 56.3 49.4 94.6 28.7
7:38 25 93.7 63.8 29.4 31.7 16.8 29.6 18.1 45.7
7:40 27 126.9 80.3 250.0 58.6 59.2 45.9 58.7 24.8 31.9 26.4 54.6
7:43 30 127.1 87.3 33.5 69.7 72.2 98.6 80.3 55.3 56.6 31.7 35.5 27.2 58.4
7:48 35 127.9 89.4 46.5 85.0 93.2 98.6 89.1 71.7 65.5 44.0 46.4 36.7 63.2
7:53 40 1 127.9 93.2 1 54.7 83.5 93.1 100.2 91.3 59.9 86.1 52.9 51.9 43.6 68.1
7:58 45 23.4 21.9 22.1 133.0 127.8 101.1 67.5 84.7 106.6 97.1 94.4 78.6 92.6 62.7 55.8 47.7 70.4
8:13 60 128.2 102.2 89.9 93.0 105.2 108.0 102.2 88.2 102.7 82.0 68.2 60.3 94.8
8:28 75 129.1 109.6 102.8 102.6 113.8 112.3 108.0 101.2 106.5 91.7 80.6 68.1 104.6
8:43 90 23.9 22.0 22.4 132.0 129.7 117.7 108.5 106.3 110.6 120.2 114.9 106.2 113.6 101.0 82.4 76.5 112.6
8:58 105 132.8 129.5 123.7 109.7 112.5 116.7 124.3 117.6 111.8 118.0 105.5 90.5 86.0 115.8
9:13 120 23.9 22.2 22.6 130.3 125.8 115.3 118.6 119.7 127.5 121.9 119.7 122.4 112.3 94.7 88.5 119.7
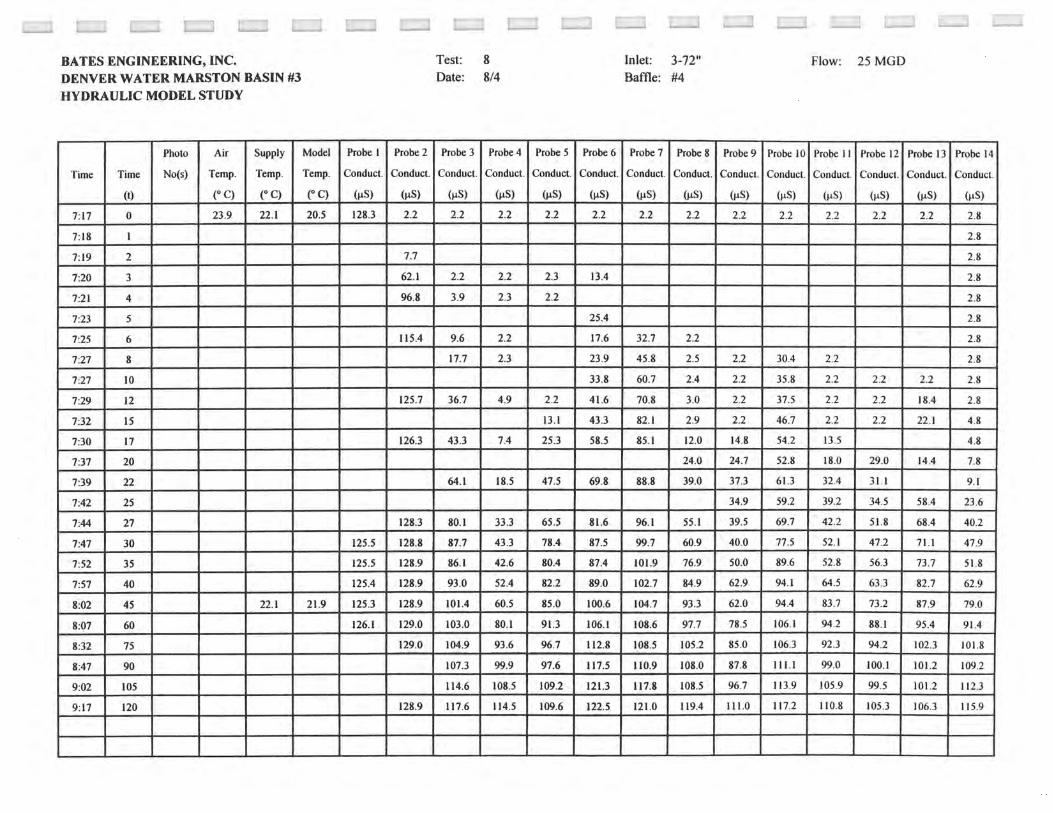
BATES ENGINEERING, INC. Test: 8 Inlet: 3-72" Flow: 25 MGD DENVER WATER MARSTON BASIN #3 Date: 8/4 Baffle: #4
HYDRAULIC MODEL STUDY
Time Time
(t)
Photo
No(s)
Air
Temp.
(° C)
Supply
Temp.
(I C)
Model
Temp.
(` C)
Probe I
Conduct.
(µS)
Probe 2
Conduct.
(µS)
Probe 3
Conduct.
(µS)
Probe 4
Conduct.
(µS)
Probe 5
Conduct.
(µS)
Probe 6
Conduct.
(NS)
Probe 7
Conduct.
(µS)
Probe 8
Conduct.
(NS)
Probe 9
Conduct.
41s)
Probe 10
Conduct.
(NS)
Probe I I
Conduct.
(µS)
Probe 12
Conduct.
(µS)
Probe 13
Conduct.
(µS)
Probe 14
Conduct.
(µS)
7:17 0 23.9 22.1 20.5 128.3 2.2 2.2 2.2 2.2 2.2 2.2 2.2 2.2 2.2 2.2 2.2 2.2 2.8
7:18 1 2.8
7:19 2 7.7 2.8
7:20 3 62.1 2.2 2.2 2.3 13.4 2.8
7:21 4 96.8 3.9 2.3 2.2 2.8
7:23 5 25.4 2.8
7:25 6 115.4 9.6 2.2 17.6 32.7 2.2 2.8
7:27 8 17.7 2.3 23.9 45.8 2.5 2.2 30.4 2.2 2.8
7:27 10 1 1 33.8 60.7 2.4 2.2 35.8 2.2 2.2 2.2 2.8
7:29 12 1 125.7 36.7 4.9 2.2 41.6 70.8 3.0 2.2 37.5 2.2 2.2 18.4 2.8
732 15 13.1 43.3 82.1 2.9 2.2 46.7 2.2 2.2 22.1 4.8
7:30 17 126.3 43.3 7.4 25.3 58.5 85.1 12.0 14.8 54.2 13.5 4.8
7:37 20 24.0 24.7 52.8 18.0 29.0 14.4 7.8
7:39 22 64.1 18.5 47.5 69.8 88.8 39.0 37.3 61.3 32.4 31.1 9.1
7:42 25 34.9 59.2 39.2 34.5 58.4 23.6
7:44 27 128.3 80.1 33.3 65.5 81.6 96.1 55.1 39.5 69.7 42.2 51.8 68.4 1 40.2
7:47 30 1 125.5 128.8 1
87.7 43.3 78.4 87.5 99.7 60.9 40.0 1 77.5 52.1 47.2 71.1 47.9
7:52 35 125.5 128.9 86.1 42.6 80.4 87.4 101.9 76.9 50.0 89.6 52.8 56.3 73.7 51.8
7:57 40 125.4 128.9 93.0 52.4 82.2 89.0 102.7 84.9 62.9 94.1 64.5 63.3 82.7 62.9
8:02 45 22.1 21.9 125.3 128.9 101.4 60.5 85.0 100.6 104.7 93.3 62.0 94.4 83.7 73.2 87.9 79.0
8:07 60 126.1 129.0 103.0 80.1 91.3 106.1 108.6 97.7 78.5 106.1 94.2 88.1 95.4 91.4
8:32 75 129.0 104.9 93.6 96.7 112.8 108.5 105.2 85.0 106.3 92.3 94.2 102.3 101.8
8:47 90 107.3 99.9 97.6 117.5 110.9 108.0 87.8 111.1 99.0 100.1 101-2 109.2
9:02 105 114.6 108.5 109.2 121.3 117.8 108.5 96.7 113.9 105.9 99.5 101.2 112.3
9:17 120 128.9 117.6 114.5 109.6 122.5 121.0 119.4 111.0 117.2 110.8 105.3 106.3 115.9

BATES ENGINEERING, INC. Test: 11 Inlet: 3-72" Flow: 25 MGD DENVER WATER MARSTON BASIN #3 Date: 8/11 Baffle: #6A
HYDRAULIC MODEL STUDY
Time Time
(t)
Photo
No(s)
Air
Temp.
(° C)
Supply
Temp.
V C)
Model
Temp.
(° C)
Probe I
Conduct.
(µ5)µ
Probe 2
Conduct.
1µS)µ6) (µS)
Probe 3
Conduct.
(µS) lµµ (µS)
Probe 4
Conduct.
lµµ (µS)
Probe 5
Conduct.
(µS) 1µs)µ 1µS)
Probe 6
Conduct.
Probe 7
Conduct.
(µS)
Probe 8
Conduct.
Probe 9
Conduct.
Probe 10
Conduct.
(µS)
Probe I I
Conduct.
(µS)
Probe 12
Conduct.
(µS)
Probe 13
Conduct.
(µS)
Probe 14
Conduct.
(µS)
7:52 0 22.7 20.5 19.4 123.2 1.3 1.3 1.4 1.3 1.3 1.3 1.3 1.3 1.3 1.3 1.3 1.3 1.8
7:53 1 17.6
7:54 2
7:55 3 68.1 1.4 21.5
7:56 4 83.8 1 2.6 21.8 1.6
7:57 5 98.1 2.1 10.5 1.3 39.1 9.9
7:58 6 108.1 10.3
8:00 8 116.0 19.6 33.8 1.3 50.5 30.0 1.8 1.3 39.8
8:02 10 4 121.0 32.0 48.3 70.7 40.5 3.2 1.3 53.7 1.3
8:04 12 1 5 123.2 58.5 1.3 74.7 50.3 5.9 1.3 62.8 20.6
8:07 15 6 74.7 59.3 5.4 1.3 63.1 1.3 1.3 23.5 1.8
8:09 17 7 124.4 67.1 73.1 3.2 66.4 10.3 1.3 74.4 1.4 4.7 40.8 3.5
8:12 20 8 3.4 78.7 73.4 25.7 1.3 78.2 2.0 7.3 45.5 5.2
8:14 22 9 124.9 81.9 85.2 4.6 85.7 79.0 43.9 3.9 81.4 4.1 12.3
8:17 25 10 9.8 85.4 5.3 23.8 52.6 20.6
8:19 27 125.0 89.4 90.5 28.9 86.3 89.5 47.6 39.8
8:22 30 123.4 125.1 94.2 90.1 37.0 1 89.3 91.9 51.4 17.9 88.9 20.8 30.4 64.3 40.5
8:27 35 125.2 97.0 94.0 41.0 96.2 94.2 60.3 33.7 91.7 47.2 45.3 1 72.6 47.6
8:32 40 20.6 123.4 125.2 100.2 97.9 48.4 99.7 96.8 72.1 43.4 97.3 54.5 59.5 81.1 52.5
8:37 45 125.2 103.9 102.0 60.7 102.0 100.9 73.6 46.4 101.8 71.4 63.3 85.3 58.2
8:52 60 123.4 125.3 108.0 109.0 72.5 112.1 109.5 87.2 63.9 109.2 83.0 75.8 97.1 75.1
9:07 75 20.7 20.8 123.4 125.3 114.6 114.8 89.8 115.5 115.0 99.0 77.7 113.3 93.5 86.8 104.9 95.0
9:22 90 125.4 119.0 118.6 102.5 120.9 120.4 104.7 88.4 117.0 98.2 98.2 109.5 109.2
9:37 105 125.4 120.7 121.4 108.6 121.5 119.8 111.4 96.5 119.3 105.3 101.1 112.5 110.6
9:52 120 125.4 122.0 123.3 110.6 122.9 122.8 117.1 105.2 119.7 107.9 109.2 114.7 115.1

_..~ r.
BATES ENGINEERING, INC. Test: 13 Inlet: 3-72" Flow: 25 MGD DENVER WATER MARSTON BASIN #3 Date: 8/13 Baffle: #8 HYDRAULIC MODEL STUDY
Time Time
(t)
Photo
No(s)
Air
Temp.
(~ C)
Supply
Temp.
(° C)
Model
Temp.
(~ C)
Probe 1
Conduct.
(µS)
Probe 2
Conduct.
(µS)
Probe 3
Conduct.
(µS)
Probe 4
Conduct.
(NS)
Probe 5
Conduct.
(µS)
Probe 6
Conduct.
(µS)
Probe 7
Conduct.
(µS)
Probe 8
Conduct.
(µS)
Probe 9
Conduct.
(µS)
Probe 10
Conduct.
(µS)
Probe 1 I
Conduct.
(NS)
Probe 12
Conduct.
(µS)
Probe 13
Conduct.
(µS)
Probe 14
Conduct.
(µS)
8:01 0 2 22.9 19.8 18.2 121.2 3.5 3.4 3.4 3.4 3.4 3.3 3.3 3.3 3.3 3.3 3.3 3.3 4.2
8:02 1 3 5.0
8:03 2 4 43.7 3.4 3.5 4.0
8:04 3 5 84.1 3.4 3.5 25.9 3.8
8:05 4 6,8 104.1 3.4 3.6 23.0 7.2
8:06 5 7 112.4 3.7 3.7 3.4 29.2 14.5
8:07 6 8 116.1 5.7 5.3 45.1 21.7 10.8 5.4
8:09 8 9,9 119.5 21.1 13.7 3.4 38.7 41.5 11.6 3.4 32.2 3.4 3.4 3.4 4.2
8: l l 10 10,10 1 120.7 37.7 19.3 3.4 62.6 60.4 29.1 3.4 42.8 3.4 3.4 3.4 4.2
8:13 12 11 120.6 121.8 53.3 23.4 3.4 73.2 63.9 34.9 3.5 47.7 3.4 3.4 34 4.3
8:16 15 12 69.2 65.9 52.5 3.9 64.4 6.2 9.2 17.5 5.0
8:18 17 13,11 122.3 65.2 50.6 3.6 75.7 75.9 65.6 6.8 61.5 10.2 15.5 31.9 4.6
8:21 20 14 71.5 59.1 4.2 69.8 69.5 73.9 6.6 70.4 20.0 20.8 44.9 6.7
8:23 22 15 122.7 71.6 63.0 14.2 82.3 78.6 75.7 8.4 72.6 30.9 28.4 49.9 13.4
8:26 25 16 80.5 77.4 81.4 18.1 76.2 40.9 41.2 56.4 14.0
8:28 27 17 122.9 81.7 72.7 25.0 89.2 84.3 81.3 28.7 80.0 44.5 50.9 59.8 16.9
8:31 30 18 19.8 19.5 120.4 123.0 83.3 80.9 31.8 84.5 81.0 90.1 34.0 82.2 53.8 58.4 64.4 32.5
8:36 35 21.2 120.5 123.2 82.4 84.8 41.7 92.9 86.9 93.5 36.6 87.9 60.7 67.3 67.6 48.4
8:41 40 120.5 123.2 85.8 90.3 47.4 94.4 88.5 95.3 43.3 91.3 68.5 73.8 72.9 58.9
8:46 45 120.6 123.3 90.6 94.3 53.9 100.8 89.0 99.3 61.0 91.6 74.9 75.7 76.8 66.5
9:01 60 20.1 1203 123.5 101.9 1 102.5 69.1 104.5 101.8 105.8 74.1 97.4 89.7 83.1 83.8 83.9
9:16 75 120.7 123.6 107.7 106.1 83.6 109.6 110.2 108.9 89.0 109.7 101.3 90.8 86.9 91.2
9:31 90 120.8 123.7 114.8 112.8 94.7 113.7 116.0 114.4 99.0 112.5 105.9 108.5 98.1 100.4
9:46 105 120.8 123.8 118.9 116.2 103.5 116.8 119.8 118.1 107.5 116.3 111.8 112.2 102.8 109.5
10:01 120 23.2 20.4 21.0 120.7 124.0 121.1 117.0 110.4 119.1 121.6 120.2 112.9 119.1 111.8 1111 110.3 115.2

BATES ENGINEERING, INC. Test: 14 Inlet: 3-72" Flow: 50 MGD DENVER WATER MARSTON BASIN #3 Date: 8/26 Baffle: #8 HYDRAULIC MODEL STUDY
Time Time
(t)
Photo
No(s)
Air
Temp.
(I C)
Supply
Temp.
(° C)
Model
Temp.
(° C)
Probe I
Conduct.
(µS)
Probe 2
Conduct.
(µS)
Probe 3
Conduct.
(µS)
Probe 4
Conduct.
(µS)
Probe 5
Conduct.
(µS)
Probe 6
Conduct.
(µS)
Probe 7
Conduct.
(µS)
Probe 8
Conduct.
(µS)
Probe 9
Conduct.
(µS)
Probe 10
Conduct.
(PS)
Probe 11
Conduct.
(µS)
Probe 12
Conduct.
(µS)
Probe 13
Conduct.
(µS)
Probe 14
Conduct.
(µS)
7:44 0 1 23.4 22.8 20.8 136.4 3.7 3.7 3.6 3.6 3.6 3.6 3.6 1 3.6 3.6 1 3.6 3.6 3.6 4.6
1/2 2 3.7
7:45 1 3 3.7
1 1/2 4 3.7
7:46 2 5 3.7
2 1/2 6 3.7
7:47 3 7 3.7
7:48 4 8 28.7 3.7
7:49 5 9 5.6
7:50 6 10 11.0 3.7 1
60.2 67.0 4.2 3.6 3.6 4.5
7 1/2 11 17.3 3.7 8.6 4.7 34.4
81/2 12 28.4 5.7 8.2 25.4 53.7 5.2
7:54 10 13 42.9 14.6 16.0
7:55 11 14 53.8 20.8 28.5 45.8 69.3 21.5
121/2 15 58.3 22.8 38.3 61.0
131/2 16 30.5 39.2 59.4 73.6 32.6
7:59 15 17 84.3 46.9 49.3 71.5 83.5 21.0
171/2 92.0 66.3 103.4 106.4 94.0 54.2 66.9 77.4 88.1 31.8
8:04 20 139.4 105.8 95.4 79.7 109.5 98.7 65.4 103.7 76.7 83.9 93.5 63.4
221/2 22.7 22.6 136.9 139.5 110.4 103.3 85.5 108.1 115.2 104.0 74.0 107.1 84.9 94.8 100.9 79.3
8:14 30 136.9 139.5 120.7 111.5 98.4 116.2 123.6 113.8 101.1 116.2 97.3 105.4 108.5 103.3
37 1/2 136.9 139.6 128.8 118.4 108.0 118.5 129.6 120.4 113.4 124.5 109.2 115.5 116.5 110.8
8:29 45 137.0 139.6 132.8 124.0 115.8 123.1 134.1 123.6 119.0 128.0 119.8 120.8 123.4 120.7
52 1/2 137.0 139.6 135.7 127.1 122.5 126.8 136.6 129.6 123.6 132.2 125.3 122.9 128.2 126.9
8:44 60 139.5 137.1 130.0 126.4 128.8 138.0 134.1 127.6 132.8 128.1 128.2 129.9 131.3

BATES ENGINEERING, INC. Test: 15 Inlet: 3-72" Flow: 140 MGD DENVER WATER MARSTON BASIN 03 Date: 8/27 Baffle: #8 HYDRAULIC MODEL STUDY
Time Time
(t)
Photo
No(s)
Air
Temp.
(° C)
Supply
Temp.
(° C)
Model
Temp.
(° C)
Probe I
Conduct.
(µ5)
Probe 2
Conduct.
(NS)
Probe 3
Conduct.
(µ5)
Probe 4
Conduct.
(µ5)
Probe 5
Conduct.
(µ5)
Probe 6
Conduct.
(µ5)
Probe 7
Conduct.
(NS)
Probe 8
Conduct.
(µ5)
Probe 9
Conduct.
(µ5)
Probe 10
Conduct.
(µ5)
Probe I I
Conduct.
(µ5)
Probe 12
Conduct.
(µ5)
Probe 13
Conduct.
(µ5)
Probe 14
Conduct.
(0) 9:40 0:00 18 22.3 21.3 19.9 130.7 3.0 3.0 3.0 3.0 3.1 3.1 3.1 3.1 3.1 3.1 3.1 3.1 3.8
0:11 19
0:21 20
0:32 21
0:43 22
0:54 23
1:04 24
1:26 25 3.0
1.47 26 3.3
2:09 27 5.3
2:41 28 7.2
3:02 29 9.2 8.4
3:24 30 54.5
3:56 31 35.7
4:28 32 27.4
4:49 33 34.4 13.2
5:21 34 41.0 60.9 74.9 84.0
6:15 35 79.5 83.1 96.6 45.5
7:09 36 56.2 104.5 61.4
8:02 37 59.0 88.6 122.6 72.4 87.0 113.6 72.1 104.4 106.3 76.4
10:43 125.6 1 87.6 108.2 124.9 84.9 107.1 119.5 82.5 104.5 114.6 90.7
13:24 127.9 97.5 113.3 110.4 124.7 90.7 114.5 120.1 94.2 115.0 118.8 101.4
16:04 131.7 129.2 105.3 118.0 114.0 126.7 103.3 118.4 125.2 101.2 121.1 121.9 111.3
18:45 131.5 129.9 110.3 121.8 119.0 127.5 107.4 121.9 126.6 107.7 122.5 124.5 116.0
21:26 21.5 21.8 131.3 130.2 114.4 124.5 119.9 129.5 110.7 125.0 126.9 113.5 125.3 125.5 121.8

BATES ENGINEERING, INC. Test: 17 Inlet: 3-72" Flow: 100 MGD DENVER WATER MARSTON BASIN 0 Date: 8/28 Baffle: #8 HYDRAULIC MODEL STUDY
Time Time
(t)
Photo
No(s)
Air
Temp.
V C)
Supply
Temp.
(° C)
Model
Temp.
V C)
Probe I
Conduct.
(µs)
Probe 2
Conduct.
(µs)
Probe 3
Conduct.
(µs)
Probe 4
Conduct.
(µs)
Probe 5
Conduct.
(µs)
Probe 6
Conduct.
(µs)
Probe 7
Conduct.
(µs)
Probe 8
Conduct.
(µs)
Probe 9
Conduct.
(µs)
Probe 10
Conduct.
(µs)
Probe I I
Conduct.
(µs)
Probe 12
Conduct.
(µs)
Probe 13
Conduct.
(µs)
Probe 14
Conduct.
(µs)
9:33 0 20.7 19.3 120.1 3.1 3.1 2.1 2.1 2.1 1.9 1.9 1.9 2.0 2.0 2.0 2.0 2.6
1/4 2.0
1/2 2.0
3/4 2.0
9:34 1 2.0
1 1/4 1.9
1 1/2 2.3
9:35 2 2.5 1.9 2.0
2 1/2 26.3 1.9 2.0
9:36 3 13.2
33/4 27.3 1 1.9 2.0
41/4 20.8 2.3 12.6 53.6 3.7
9:38 5
51/2 37.4 66.2 5.7
6 1/4 36.6 8.2
63/4 47.7 48.0 70.7 17.3
71/2 53.3 54.5 58.9 62.9 80.7 26.8
83/4 64.2 j 66.9 68.5 69.6 84.0 43.6
9:43 10 107.8 63.8 71.3 101.2 71.6 76.5 90.2 58.1
111/4 120.7 122.6 111.3 84.2 75.0 85.4 108.7 82.4 82.8 97.0 74.3 88.1 98.8 70.0
9:48 15 1 120.1 1
122.4 116.4 91.0 87.5 98.6 116.3 85.8 92.7 108.0 94.9 95.7 101.2 85.9
183/4 120.6 122.1 118.7 101.9 100.0 102.5 118.5 97.6 100.4 114.5 100.1 100.0 110.5 98.6
221/2 121.8 119.9 106.5 107.0 107.3 120.1 101.3 108.2 116.5 107.3 108.7 112.6 104.3
26 1/4 21.0 121.3 120.7 110.3 113.0 110.5 120.9 107.4 113.5 117.2 110.4 112.7 117.5 110.0
10:03 30 20.9 120.9 121.1 109.2 115.5 112.1 121.5 109.0 115.5 118.1 1119 113.2 118.3 114.8

APPENDIX C - TRACER BREAKTHROUGH CALCULATIONS

Dye Tonk 10
2 14
is 4i 5i
. . . . . . . . . . . . . . . . .
. . 60
. . . . . . . . . . . . . . . .
. . . . . . . . . . . . . . .
70 . 8* . 9i
. . . . . . . . . . . . . .
109 . 11*
10* = Conductivity Probe Location 12 and Number
C
CD
0

TRACER BREAKTHROUGH CALCULATIONS PROBE4
Test 3 - Unbaffled
Conduct. Outlet
µS % 1.8 0.0%
2.0 0.2%
2.0 0.2%
2.0 0.2%
2.0 0.2%
2.2 0.3%
2.3 0.4%
5.2 2.6%
3.3 1.1%
3.2 1.1%
3.0 0.9%
2.8 0.8%
9.8 6.1%
14.4 9.6% 20.8 14.5% 25.0 17.7%
33.5 24.2% 46.5 34.1%
54.7 40.4%
67.5 50.2%
89.9 67.3% 102.8 77.1% 108.5 81.5%
109.7 82.4% 115.3 86.6%
Test 8 - Baffle #4
Conduct. Outlet
µS % 2.2 0.0%
2.2 0.0% 2.2 0.0% 2.2 0.0% 2.2 0.0%
2.2 0.0% 2.2 0.0% 2.3 0.1%
3.6 1.1% 4.9 2.2%
6.4 3.4%
7.4 4.2%
14.1 9.6% 18.5 13.2% 27.4 20.3% 33.3 25.1% 43.3 33.2% 42.6 32.6%
52.4 40.5% 60.5 47.1% 80.1 62.9% 93.6 73.8% 99.9 78.9% 108.5 85.8% 114.5 90.6%
Test 11 - Baffle 46A
Conduct. Outlet
µS % 1.4 0.0% 1.4 0.0% 1.4 0.0% 1.4 0.0% 2.6 1.0% 10.5 7.5% 18.3 13.9% 33.8 26.6% 48.3 38.4% 55.4 44.3% 66.0 53.0%
73.1 58.8% 80.4 64.8%
85.2 68.7% 88.4 71.3% 90.5 73.0% 90.1 72.7% 94.0 75.9% 97.9 79.1%
102.0 82.5%
109.0 88.2% 114.8 93.0% 118.6 96.1% 121.4 98.4% 123.3 99.9%
Test 13 - Baffle #8 Conduct. Outlet
µS % 3.4 0.0%
3.4 0.0% 3.5 0.1%
3.5 0.1% 3.6 0.2%
3.7 0.3%
5.3 1.6% 13.7 8.8% 19.3 13.6% 23.4 17.1% 39.7 31.0% 50.6 40.2%
59.1 47.5% 63.0 50.8% 68.8 55.8% 72.7 59.1% 80.9 66.1% 84.8 69.4%
90.3 74.1% 94.3 77.5%
102.5 84.5% 106.1 87.6% 112.8 93.3% 116.2 962% 117.0 96.8%
Time Time
(minutes) t/T
0 0.0%
1 1.6%
2 3.1%
3 4.7%
4 6.3%
5 7.9%
6 9.4%
8 12.6%
10 15.7% 12 18.9%
15 23.6%
17 26.8%
20 31.5%
22 34.6% 25 39.4% 27 42.5%
30 47.2%
35 55.1%
40 63.0%
45 70.9%
60 94.5%
75 118.1% 90 141.7%
105 165.4% 120 189.0%

TRACER BREAKTHROUGH CALCULATIONS
PROBE 9
Test 3 - Unbaffled Test 8 - Baffle #4 Test I 1 - Baffle #6A Test 13 - Baffle #8
Time Time Conduct. Outlet Conduct. Outlet Conduct. Outlet Conduct. Outlet
(minutes) t/T µS % µS % µS % µS %
0 0.0% 1.8 0.0% 2.2 0.0% 1.3 0.0% 3.3 0.0%
1 1.6% 1.8 0.0% 2.2 0.0% 1.3 0.0% 3.3 0.0%
2 3.1% 1.8 0.0% 2.2 0.0% 1.3 0.00/0 3.3 0.0%
3 4.7% 1.8 0.0% 2.2 0.00/0 1.3 0.0% 3.3 0.0%
4 6.3% 1.8 0.0% 2.2 0.0% 1.3 0.0% 3.3 0.0%
5 7.9% 1.8 0.0% 2.2 0.0% 1.3 0.0% 3.3 0.0%
6 9.4% 1.8 0.0% 2.2 0.0% 1.3 0.0% 3.3 0.0%
8 12.6% 1.8 0.0% 2.2 0.00/0 1.3 0.00/0 3.4 0.1%
10 15.7% 1.8 0.0% 2.2 0.0% 1.3 0.0% 3.4 0.1%
12 18.9% 1.8 0.0% 2.2 0.0% 1.3 0.0% 3.5 0.2%
15 23.6% 1.9 0.1% 2.2 0.0% 1.3 0.0% 3.9 0.5%
17 26.8% 10.5 6.6% 14.8 10.2% 1.3 0.0% 6.8 3.0%
20 31.5% 23.4 16.5% 24.7 18.2% 1.3 0.0% 6.6 2.8%
22 34.6% 25.8 18.3% 37.3 28.3% 3.9 2.1% 8.4 4.3%
25 39.4% 29.4 21.1% 34.9 26.4% 9.8 7.0% 18.1 12.6%
27 42.5% 45.9 33.7% 39.5 30.1% 13.0 9.6% 28.7 21.6%
30 47.2% 55.3 40.8% 40.0 30.5% 17.9 13.6% 34.0 26.1%
35 55.1% 71.7 53.4% 50.0 38.6% 33.7 26.5% 36.6 28.4%
40 63.0% 59.9 44.4% 62.9 49.0% 43.4 34.5% 43.3 34.1%
45 70.9% 78.6 58.6% 62.0 48.3% 46.4 36.9% 61.0 49.1%
60 94.5% 88.2 66.0% 78.5 61.6% 63.9 51.3% 74.1 60.3%
75 118.1% 101.2 75.9% 85.0 66.8% 77.7 62.6% 89.0 73.0%
90 141.7% 106.2 79.7% 87.8 69.1% 88.4 71.3% 99.0 81.5%
105 165.4% 111.8 84.0% 96.7 76.3% 96.5 78.0% 107.5 88.8%
120 189.0% 119.7 90.0% 111.0 87.8% 105.2 85.1% 112.9 93.4%

TRACER BREAKTHROUGH CALCULATIONS
PROBE 12
Test 3 - Unbaffled
Conduct. Outlet
µS %
1.8 0.0%
1.8 0.0%
1.8 0.0%
1.8 0.0%
1.8 0.0%
1.8 0.0%
1.8 0.0%
1.8 0.0%
1.8 0.0%
1.8 0.0%
1.8 0.0%
2.8 0.8%
4.3 1.9%
14.4 9.6%
29.6 21.2%
31.9 23.0%
35.5 25.7%
46.4 34.0%
51.9 38.2%
55.8 41.2%
68.2 50.7%
80.6 60.2%
82.4 61.5%
90.5 67.7%
94.7 70.9%
Test 8 - Baffle #4
Conduct. Outlet
µS %
2.2 0.0%
2.2 0.0%
2.2 0.0%
2.2 0.0%
2.2 0.0%
2.2 0.0%
2.2 0.0%
2.2 0.0%
2.2 0.0%
2.2 0.0%
2.2 0.0%
2.2 0.0%
29.0 21.6%
31.1 23.3%
34.5 26.1%
51.8 40.0%
47.2 36.3%
56.3 43.7%
63.3 49.3%
73.2 57.3%
88.1 69.3%
94.2 74.3%
100.1 79.0%
99.5 78.5%
105.3 83.2%
Test I 1 - Baffle #6A
Conduct. Outlet
µS %
1.3 0.0%
1.3 0.0%
1.3 0.0%
1.3 0.0%
1.3 0.0%
1.3 0.0%
1.3 0.0%
1.3 0.0%
1.3 0.0%
1.3 0.0%
1.3 0.0%
4.7 2.8%
7.3 4.9%
13.9 10.3%
23.8 18.4%
26.4 20.6%
30.4 23.8%
45.3 36.0%
59.5 47.7%
63.3 50.8%
75.8 61.0%
86.8 70.0%
98.2 79.4%
101.1 81.7%
109.2 88.4%
Test 13 - Baffle #8
Conduct. Outlet
µS %
3.3 0.0%
3.3 0.0%
3.3 0.0%
3.3 0.0%
3.3 0.0%
3.3 0.0%
3.3 0.0%
3.4 0.1%
3.4 0.1%
3.4 0.1%
9.2 5.0%
15.5 10.4%
20.8 14.9%
28.4 21.4%
41.2 32.3%
50.9 40.5%
58.4 46.9%
67.3 54.5%
73.8 60.1%
75.7 61.7%
83.1 68.0%
90.8 74.5%
108.5 89.6%
112.2 92.8%
112.1 92.7%
Time Time
(minutes) t/T
0 0.0%
1 1.6%
2 3.1%
3 4.7%
4 6.3%
5 7.9%
6 9.4%
8 12.6%
10 15.7%
12 18.9%
15 23.6%
17 26.8%
20 31.5%
22 34.6%
25 39.4%
27 42.5%
30 47.2%
35 55.1%
40 63.0%
45 70.9%
60 94.5%
75 118.1%
90 141.7%
105 165.4%
120 189.0%

TRACER BREAKTHROUGH CALCULATIONS PROBE 13
Test 3 - Unbaffled
Conduct. Outlet
µS %
1.6 0.0%
1.6 0.0%
1.6 0.0%
1.6 0.0%
1.6 0.0%
1.6 0.0%
1.6 0.0%
1.6 0.0%
1.6 0.0%
1.6 0.0%
1.6 0.0%
3.6 1.5% 6.5 3.7%
11.1 7.3%
18.1 12.6%
26.4 18.9%
27.2 19.5%
36.7 26.8% 43.6 32.0% 47.7 35.1%
60.3 44.7%
68.1 50.7%
76.5 57.1%
86.0 64.3%
88.5 66.2%
Test 8 - Baffle #4
Conduct. Outlet
µS % 2.2 0.0%
2.2 0.0%
2.2 0.0%
2.2 0.0%
2.2 0.0%
2.2 0.0%
2.2 0.0%
2.2 0.0%
2.2 0.0%
18.4 13.1%
22.1 16.1% 29.4 22.0%
40.3 30.8%
47.5 36.6%
58.4 45.4%
68.4 53.4% 71.1 55.6% 73.7 57.7% 82.7 65.0% 87.9 69.2%
95.4 75.2%
102.3 80.8%
101.2 79.9%
101.2 79.9%
106.3 84.0%
Test 11 - Baffle #6A
Conduct. Outlet
µS % 1.3 0.0% 1.3 0.0% 1.3 0.0%
1.3 0.0% 1.3 0.0%
1.3 0.0%
2.5 1.0%
5.0 3.0%
10.0 7.1% 20.6 15.8% 23.5 18.2% 40.8 32.4%
45.5 36.2%
48.3 38.5% 52.6 42.0%
57.3 45.8%
64.3 51.6%
72.6 58.4% 81.1 65.4% 85.3 68.8%
97.1 78.5%
104.9 84.8%
109.5 88.6%
112.5 91.1%
114.7 92.9%
Test 13 - Baffle #8
Conduct. Outlet
µS % 3.3 0.0% 3.3 0.0% 3.3 0.0% 3.3 0.0% 3.3 0.0% 3.3 0.0%
3.3 0.0%
3.4 0.1%
3.4 0.1% 3.4 0.1% 17.5 12.1% 31.9 24.4% 44.9 35.4% 49.9 39.7% 56.4 45.2%
59.8 48.1% 64.4 52.0% 67.6 54.8% 72.9 59.3% 76.8 62.6%
83.8 68.6%
86.9 71.2%
98.1 80.7%
102.8 84.8%
110.3 91.1%
Time Time
(minutes) t/T
0 0.0%
1 1.6%
2 3.1%
3 4.7%
4 6.3%
5 7.9%
6 9.4%
8 12.6%
10 15.7%
12 18.9%
15 23.6%
17 26.8%
20 31.5%
22 34.6%
25 39.4%
27 42.5%
30 47.2%
35 55.1%
40 63.0%
45 70.9%
60 94.5%
75 118.1%
90 141.7%
105 165.4%
120 189.0%

TRACER BREAKTHROUGH CALCULATIONS
PROBE 14 (OUTLET)
Test 3 - Unbaffled
Conduct. Outlet
µS %
2.3 0.0%
2.3 0.0%
2.3 0.0%
2.3 0.0%
2.3 0.0%
2.3 0.0%
2.3 0.0%
2.3 0.0%
4.7 1.8%
4.7 1.8%
4.7 1.8%
5.8 2.7%
9.7 5.7%
28.7 20.2%
45.7 33.3%
54.6 40.1%
58.4 43.0%
63.2 46.7%
68.1 50.4%
70.4 52.2%
94.8 70.9%
104.6 78.4%
112.6 84.5% 115.8 87.0%
119.7 90.0%
Test 8 - Baffle #4
Conduct. Outlet
µS % 2.8 0.0%
2.8 0.0%
2.8 0.0%
2.8 0.0%
2.8 0.0%
2.8 0.0%
2.8 0.0%
2.8 0.0%
2.8 0.0%
2.8 0.0%
4.3 1.2%
4.8 1.6%
7.8 4.1%
9.1 5.1%
23.6 16.9%
40.2 30.3%
47.9 36.6%
51.8 39.7%
62.9 48.7%
79.0 61.8%
91.4 71.9%
101.8 80.3%
109.2 86.3% 112.3 88.8%
115.9 91.7%
Test 1 I - Baffle #6A Conduct. Outlet
µS % 1.8 0.0%
1.8 0.0%
1.8 0.0%
1.8 0.0%
1.8 0.0%
1.8 0.0%
1.8 0.0%
1.8 0.0% 1.8 0.0%
1.8 0.0%
1.8 0.0%
3.5 1.4%
5.2 2.8%
12.3 8.6%
20.0 15.0%
39.8 31.3% 40.5 31.8%
47.6 37.7%
52.5 41.7%
58.2 46.4%
75.1 60.3%
95.0 76.6%
109.2 88.3% 110.6 89.5% 115.1 93.2%
Test 13 - Baffle #8 Conduct. Outlet
µS % 4.2 0.0%
4.2 0.0%
4.2 0.0% 4.2 0.0%
4.2 0.0%
4.2 0.0%
4.2 0.0% 4.2 0.0% 4.2 0.0% 4.3 0.1% 5.0 0.7% 4.6 0.3%
6.7 2.1% 13.4 7.9% 14.0 8.4% 16.9 10.9% 32.5 24.3% 48.4 37.9%
58.9 47.0% 66.5 53.5%
83.9 68.4% 91.2 74.7%
100.4 82.6% 109.5 90.4% 115.2 95.3%
Test 14 - Q = 50 MGD Conduct. Outlet
µS % 4.6 0.0% 4.6 0.0% 4.6 0.0% 4.6 0.0% 4.6 0.0% 4.6 0.0% 4.6 0.0% 4.6 0.0% 4.6 0.0%
4.6 0.0% 4.6 0.0%
5.2 0.5%
15.0 7.8% 21.5 12.8% 28.2 17.8% 32.6 21.1%
21.0 12.4% 31.8 20.5% 63.4 44.4%
79.3 56.4%
103.3 74.5% 110.8 80.2%
120.7 87.7% 126.9 92.4%
131.3 95.7%
Test 17 - Q = 100 MGD Conduct. Outlet
µS % 2.6 0.0%
2.6 0.0% 2.6 0.0% 2.6 0.0%
2.6 0.0% 2.6 0.0% 2.6 0.0% 2.6 0.0% 2.6 0.0% 2.6 0.0% 2.6 0.0% 3.7 0.9% 4.9 1.9% 5.7 2.6% 8.2 4.7% 17.3 12.4% 26.8 20.5% 43.6 34.7% 58.1 46.9% 70.0 57.0% 85.9 70.4%
98.6 81.1% 104.3 86.0% 110.0 90.8% 114.8 94.8%
Test 15 - Q = 140 MGD Conduct. Outlet
µS % 3.8 0.0% 3.8 0.0% 3.8 0.0%
3.8 0.0%
3.8 0.0% 3.8 0.0% 3.8 0.0% 3.8 0.0% 3.8 0.0% 3.8 0.0% 3.8 0.0% 3.8 0.0% 3.8 0.0% 3.8 0.0% 9.4 4.4% 13.2 7.4% 26.1 17.5% 45.5 32.7% 61.4 45.2% 76.4 56.9% 90.7 68.2% 101.4 76.5% 111.3 84.3% 116.0 88.0% 121.8 92.5%
Time Time
(minutes) t/T
0 0.0%
1 1.6%
2 3.1%
3 4.7%
4 6.3%
5 7.9%
6 9.4%
8 12.6%
10 15.7%
12 18.9%
15 23.6%
17 26.8%
20 31.5%
22 34.6%
25 39.4%
27 42.5%
30 47.2%
35 55.1%
40 63.0%
45 70.9%
60 94.5%
75 118.1%
90 141.7%
105 165.4%
120 189.0%

n F
pl APPENDIX D - SELECTED PHOTOGRAPHS
w
Ix
ir. th
iol
)bi
roi rr.
LG
lec
u.
re
C~
at

Photo Captions
1. Overall view of the model in the Water Resources Research Laboratory. The 250-gallon plastic supply tank is at left. Fourteen black conductivity probes are secured to columns and are fed to an electric switching box and conductivity meter (left center). Ladders were used to support camera mount for overhead photographs.
2. Close-up of model at the completion of Test 17 showing conductivity probes and baffles.
3. Filling of the model with de-ionized model prior to Test 17.
4. Close-up of inlet box (right) and weir box (left) during normal flow conditions.
5. Close-up of inlet box (right) and weir box (left) during a submerged weir condition. Note water "tipping" to the left in the weir box as the vacuum on the downstream side of the weir draws water to the right. When the vacuum breaks water again tips to the left. The complete cycle took about 1/2 second.
`] 6. Initial dye penetration of the basin with three 1 1/2-inch (72-inch prototype) outlets (Test 8, t=1
minute).
7. Initial mixing at Probe 3. Note clockwise swirl around the probe (Test number unknown).
8. Initial mixing at Probe 4 with Baffle Configuration 6. Note counterclockwise swirl around the probe (Test 10, t=3 minutes).
9. Detail showing the tendency of the flow to "curve" around comers (Probes 13 and 12 at top and bottom center respectively) and to bypass zones behind baffles (right center). (Test 12, t=11 minutes).
10. Short-circuiting of dyed flow between the inlet and outlet (bottom center) with Baffle Configuration 7. As flow arrives from the north (top) a counterclockwise flow pattern is developed in the basin as water passes through the gap in the baffling at the right and re-mixes with water discharged from the inlet. (Test 12, t=17 minutes).
11. Fanning of flows into the outlet (bottom center) with Baffle Configuration 6. This tendency kept conductivity measurements at Probes 5 and 9 (bottom left and top left respectively) from rising as quickly as other probes. (Test 10, t=20 minutes).
12. Close-up of Baffle Configuration 8 along northwest wall (Test 13, t=17 minutes).
Note: Photographs taken above the model at regular time intervals are included in a separate binder.

Ar
4
-alp

M
~ r
I


F