Dental Students' Research
33
Issue #01 Switzerland, ISSN: 2296 - 1216 EXPLORE, PERCIPIO, INVENIO DSR DENTAL STUDENTS’ RESEARCH OFFICIAL RESEARCH PUBLICATION OF INTERNATIONAL ASSOCIATION OF DENTAL STUDENTS JUNE, 2013
-
Upload
international-association-of-dental-students -
Category
Documents
-
view
242 -
download
3
description
The Journal aims to offer the opportunity to undergraduate and graduate dental students publish the results of the conducted research work. The publication is developed within the Standing Committee on Research and Education of the International Association of Dental Students.
Transcript of Dental Students' Research

Issue #01
Switzerland, ISSN: 2296 - 1216
EXPLORE, PERCIPIO, INVENIO
DSRDENTAL STUDENTS’ RESEARCH
OFFICIAL RESEARCH PUBLICATION OF INTERNATIONAL ASSOCIATION OF DENTAL STUDENTS
JUNE, 2013

2 DENTAL STUDENTS’ RESEARCH
Content02 Relationship between Cervical Column Morphology and Skeletal Deep Bite: A Pilot Study (Iran/USA)
10 Job Satisfaction in Various Medical Specialities (Lithuania)
16 In Vitro Anticancer Activity of Guava (Psidium guajava L.) against HSC-2 Human Oral Cancer Cells (Indonesia)
210
21
16
contents
Content21 Implant Retained Auricular Prosthesis: A Clinical Report (Thailand)
24 Prevalence of Dental Anxiety among Saudi Population in Buraidah (Saudi Arabia)
24

3DENTAL STUDENTS’ RESEARCH
PUBLISHER International Association of Dental Students
EDITORIAL LEADERSHIP Editor-in-chief- Pavel Scarlat (Romania/R. of Moldova)
Scientific Associate Editor- Hossein Basir (USA/Iran)
Communication Associate Editor- Esti Riyanda (Indonesia)
ADVISORY HONORARY BOARD
Dr. Irina Dragan (USA)Dr. Mauricio Gonzalez Balut (Mexico)Dr. Onur Kadioglu (USA)Dr. Derek Mahony (Australia)Dr. Ionut Luchian (Romania)Dr. Joao Malta Barbosa (Portugal)Dr. Mohamed Salman (Saudi Arabia) EDITORIAL BOARD Anka Koskova (Slovakia)Diana Buturca(Romania)Nicolas Cohn (Chile) Diana Maria Constantin (Romania)Enkh - Ochlor Batbayar (Mongolia)Eva Sinic (Slovenia)Fairuz Atig (Tunisia)Flavia Joarza (Romania)Giacomo Armani (Romania/Italy)Goh S. Ling (Malaysia)Gorkem Sengun (Turkey)Jana Nakladova (Czech Republic)Karin Pokoma(Czech Republic)Katerina Miklisova (Czech Republic)Magdalena Wiczak (Poland)Victor Palumbo (Italy)Monica Ferran (Slovenia)Murad Alrsheedi (Saudi Arabia)Petra Horakova (Czech Republic)Petronela Buiga (Romania)Rajan Gupta (India)Ricardo Fillipe Mendes (Portugal)Rifqi Aulia Destiansyah (Indonesia)Sajjad Ashnagar (Iran)Sara Ehsani (Iran)Tarek Omran (United Arab Emirates)Tatiana Vorovchenko (Russian Federation)Tigran Gyokchyan (Armenia)Juan Guttierez Quintero (Columbia)Veronika Piskova (Czech Republic)Wika Ardianti Putri (Indonesia)Yana Sadykova (Kazakhstan) Zen Feng Chong (Malaysia)Ahmad Salah (Sudan)Kiki Saputri (Indonesia)Tsai, Chi - Hasuan (Republic of China - Taiwan)Annina Salmi (Finland)Taher Elkowiery (Egypt)Bold Mon (Mongolia)Abdulla A Alajmi (Sudan)Mustafa Gurkan (Turkey)Resat Batuhan Cetiner (Turkey)Busra Zengin (Turkey)Nur Oztoprak (Turkey)Pelin Turkyimilaz (Turkey)Melike Atalar (Turkey)Emre Kular (Turkey)Kerem Can Isik (Turkey)Sina Saygili (Turkey)Esat Bugrahan Toksoz (Turkey)Can Kerimoglu (Turkey)Mert Kalak (TurkeyMustafa Ozcan (Turkey)Beley Ostap (Ukraine)Gregory Tour (Sweden)Ferdiye Küçük (Cyprus - North Cyprus)Dimitri Mcgregor (Jamaica) Soumia Makhloufi (Algeria)Esraa Al- Sarraf (Kuwait)Pedro Colino Gallardo (Spain)
T he dental research field gets more and more the involvement of dental students who look for the unknown and to create the premises of development
within the field of dentistry. That’s why we have came with the idea to create such a publication “platform” which has involved Editorial Members from nearly 50 countries worldwide and who’s activity is guided by an Advisory Honorary Board.
The journey of the first issue started within the Standing Committee on Research and Education of IADS during the late fall of the last year. We have formed an Editorial Leadership and Board team, which assured the creation of the working framework, guidelines and other standard procedures in such cases.
It was a remarkable experience for everyone who has worked on the creation of the first issue, as it was not only a foundation process, but also one from which we were learning step by step under the guidance of our Advisory Honorary Board members.
It is expected for the publication to develop two issues a year and to be spread among the student community in printed as well as online version.
We wish for the current publication to set up an example and encourage the dental students’ involvement within the research activities. Many challenges await us ahead, but we are confident that “Dental Students’ Research” Journal will become step by step a highly appreciated publication within the dental research field.
Yours sincerely,
Editorial Leadership 2012 - 2013
[email protected]@[email protected]
Dear Reader,
from the editors
4 DENTAL STUDENTS’ RESEARCH
RELATIONSHIP BETWEEN CERVICAL COLUMN MORPHOLOGY
AND SKELETAL DEEP BITE: A PILOT STUDYShahin Emami Meybodi, D.D.S, M.S;1Hajir Rahimi, D.D.S;2 Reza Hamedy, D.D.S;3 Hoda Rahimi D.D.S, M.S;4
1 Associate professor, Orthodontic department, Islamic Azad University, Dental Branch, Tehran, Iran2 Postgraduate student of Orthodontics, Islamic Azad University, Dental Branch, Tehran, Iran3 Shahid Beheshti University of Medical Sciences, School of Dentistry, Tehran, Iran4 Assistant professor; Department of Oral and Maxillofacial Radiology, Kerman school of dentistry, Iran
Authors declare no conflict of interest
Abstract:
Purpose: Previous studies have shown that cervical column morphology is related to head posture, which is associated with craniofacial morphology such as mandibular rotation pattern. Furthermore, cervical column deviations and fusions have been linked with vertical and sagittal facial morphology. In addition, skeletal deep bite may lead to respiratory and swallowing difficulties, aesthetic and functional problems, as well as TMJ and facial pains. The aim of this study was to examine the cervical column morphology in adult patients with skeletal deep bite and to compare it with that of the control group with neutral occlusion and normal craniofacial morphology.Methods: In a case–control study, 25 deep bite patients (17 female, 8 male), aged 17–30 years were compared with 25 controls (16 female, 9 male) of the same age range. For each individual, angular measurements of craniofacial and cervical column dimensions were made on profile radiographs. Anomalies of cervical column such as fusion and arch deficiency were assessed. Jarabak index, ANB, SN-MP, and FMA angles were also evaluated. Results: In the deep bite group, 72% of patients had cervical column fusion compared to 32% of control sample. In the control group, the fusions were always occurred between C2 and C3. However, fusion in the deep bite individuals occurred in the C2-C3, C3-C4 and C4-C5 sites. Fusion occurred significantly more often in the overbite group compared with the control group. (p < 0.001).Conclusion: Associations between skeletal deep bite and cervical column deviations are evident. Most significant deviation in cervical vertebrae was observed at C2-C3 intervertebral space.
Keywords: Cervical Column, Overbite, Skeletal Deep Bite
Introduction
Clinicians can use cephalometric radiographs as a potential resource to screen for pathologic abnormalities of the cervical spine and avert some pathologic complications. Morphological deviations of the upper cervical vertebrae have been described in relation to craniofacial abnormalities and syndromes (1). The cervical spine has been an interest area for orthodontists. Natural head position has commonly been assessed on lateral cephalograms using the cervical spine as the reference structure (2). Different anomalies of cervical vertebrae (fusions and posterior arch deficiency) have been reported to occur in patients with cleft lip and palate (3, 4), craniofacial syndromes (5), sleep apnea (6), and different dentoskeletal malocclusions (7-10). It has previously been shown that the head and neck posture is associated with craniofacial morphology (7, 11, 12). As the morphology of the cervical column is associated with head posture and head posture itself is linked with craniofacial morphology, it could be assumed that there is an association between the structure of the cervical column and the vertical dimensions of the face. Some researchers have confirmed that cervical fusions and craniofacial morphology may be interrelated in twins when analyzed on profile radiographs. Their findings also demonstrated that differences in cervical column morphology could occur among monozygotic (MZ) twins, which illustrated that differences in craniofacial morphology between individuals within a pair of MZ twins could be associated with cervical fusion (13).
5DENTAL STUDENTS’ RESEARCH
The posture of the neck seems to be strongly associated with the sagittal as well as the vertical structure of the face (14). Fusion anomalies were associated with a large sagittal jaw relationship, retrognathia of the jaws, large inclination of the jaws, and extended head posture. Furthermore, a partial cleft was significantly associated with a large cranial base angle (15).All of these studies have not shown any difference in regard to age and gender (7-15). However, most of them were performed on a selected European population, and there has been a paucity of research on this topic in other ethnicities such as the Persian (Iranian) population.The aims of the present study were, therefore, to describe the morphology of the cervical column in selected Persian adult patients with a skeletal deep bite based on lateral cephalogram and to compare the morphology of the cervical column in those patients to that of a control group with neutral occlusion and normal craniofacial morphology.
Materials and Methods
138 individuals were selected from patients presented to the clinic at Tehran Azad Dental School for routine dental visit. All subjects were from Persian ethnicity with both mother and father from Persian background. Participation was based on sequential sampling until inclusion of 50 patients. Twenty five deep bite patients were compared with 25 controls. Sample size was determined in accordance with similar studies (7, 8, 10). Sampling was based on the study purpose, and lateral cephalogram was utilized to diagnose any skeletal abnormality. Lateral cephalograms were obtained in natural head posture. Patients were selected within the age of 17-30 with no history of orthodontic treatment, orthognatic surgery, TMJ disorders, respiratory disorders, syndromes, and head and neck burns, scars or wounds. Individuals with interfering variables such as tongue habits and abnormal tongue posture were excluded. Extreme abnormal tongue posture was evaluated clinically by an orthodontist. All subjects signed written informed consents upon receiving thorough description of the study aim and setting. Individuals in the 5th stage of cervical maturation were selected (16) and were matched based on age and sex in between the groups. On the profile radiographs, a single observer assessed fusion anomalies and cervical curvature, as well as, the head posture.
The entire procedure was in accord with ethical and professional conduct in the dental practice and research, formulated and disseminated by “University Medical Ethics Committee”.
Craniofacial indices in both sagittal and vertical
dimensions were measured. In order to make the measurements blind, the cephalograms were cut in halves to separate the cervical column prior to measurements. The study population was divided into case and control groups based on cephalometric indices and growth patterns. ANB = 2±2 measurement was considered an inclusion criteria for all the cases in this study. Assigning samples to each of the control and deep bite group was based on Jarabak index. Subjects with Jaraback ratio more than 65% were assigned into deep bite group.
Some of the measurements and cephalometric landmarks that were used in present study are described below:
Mandibular Line (ML): the tangent to the lower border of the mandible through Gnathion
Gnathion (Gn): the most outward and everted point on the profile curvature of the symphysis of the mandible, located midway between Pogonion and Menton
Menton (Me): the lowest point on the symphysis of the mandible
Nasion (N): the most anterior point of the frontonasal suture Sella (S): the center of the sella turcicaAnterior Nasal Spine (ANS): the most anterior point on the
maxilla at the nasal baseFrankfort Mandibular-Plane Angle (FMA): The mandibular
plane angle is considered to be a measure of vertical growth pattern, the greater (higher) the angle, the more vertical the growth direction.
Upper Anterior Facial Height (UAFH): a line connecting N to ANS
Lower Anterior Facial Height (LAFH): a line connecting ANS to Me
Jarabak Index (facial height ratio): Compares posterior facial height (S-Go) and anterior facial height (N-Me).
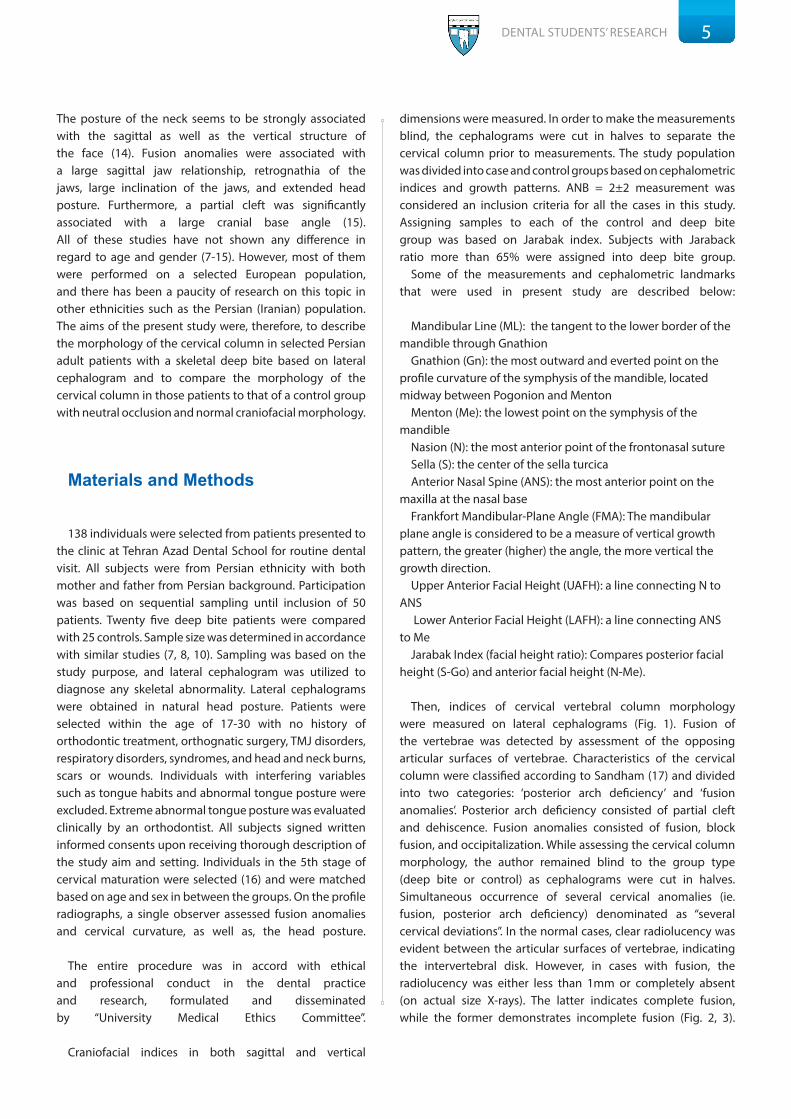
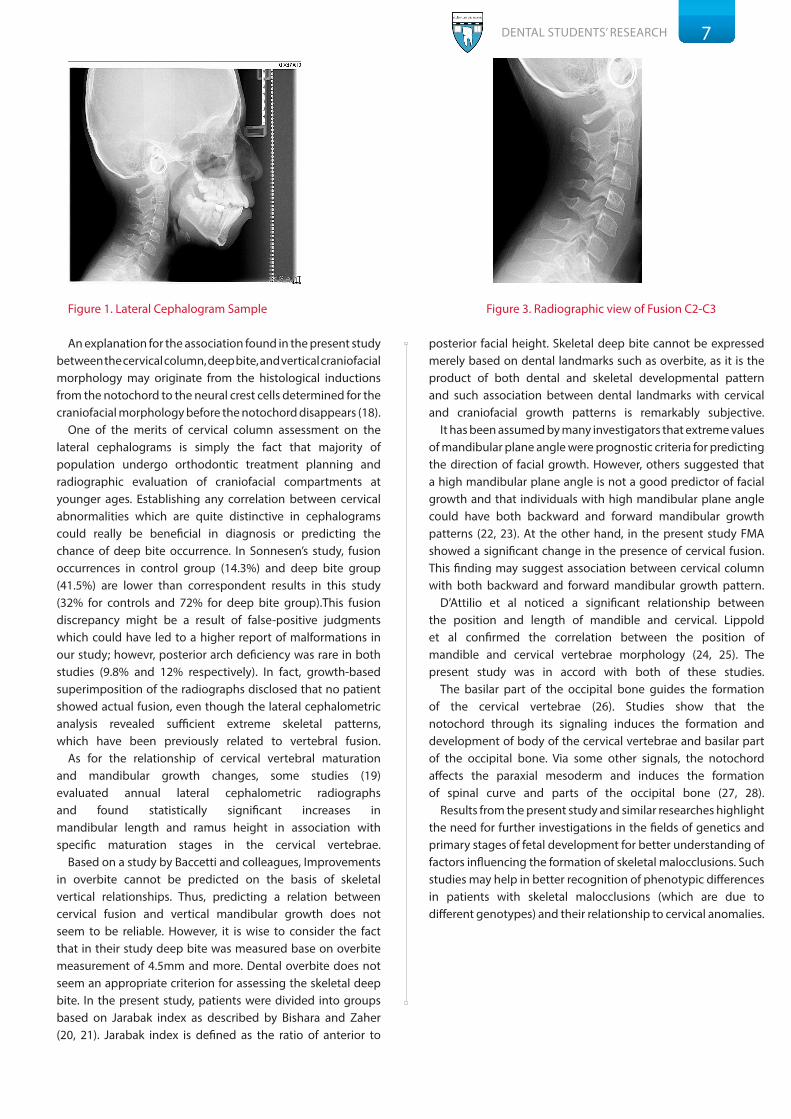
Then, indices of cervical vertebral column morphology were measured on lateral cephalograms (Fig. 1). Fusion of the vertebrae was detected by assessment of the opposing articular surfaces of vertebrae. Characteristics of the cervical column were classified according to Sandham (17) and divided into two categories: ‘posterior arch deficiency’ and ‘fusion anomalies’. Posterior arch deficiency consisted of partial cleft and dehiscence. Fusion anomalies consisted of fusion, block fusion, and occipitalization. While assessing the cervical column morphology, the author remained blind to the group type (deep bite or control) as cephalograms were cut in halves. Simultaneous occurrence of several cervical anomalies (ie. fusion, posterior arch deficiency) denominated as “several cervical deviations”. In the normal cases, clear radiolucency was evident between the articular surfaces of vertebrae, indicating the intervertebral disk. However, in cases with fusion, the radiolucency was either less than 1mm or completely absent (on actual size X-rays). The latter indicates complete fusion, while the former demonstrates incomplete fusion (Fig. 2, 3).

6 DENTAL STUDENTS’ RESEARCH
SPSS 19.0 was used for statistical analysis. A p value <0.05 was considered statistically significant. All the data were analyzed with T-test and assessed by multiple regression tests. Evaluations of variables in both the case and control group were carried out using “Independent Sample T-test”. For vertebral fusion presence and location, “Fisher exact test” was applied, and for fusion number “Mann Whitney test” was used. For assessment of variables in relation to fusion “Backward Binary Regression” test was performed.
Results
Age and sex distribution in groups is illustrated in Table 1. Using “Independent Sample T-test” the following results were obtained: a statistically significant difference was found between deep bite and control groups for FMA angle dissimilarity (p < 0.001); however, there were no significant difference between the groups for Jarabak Index and SN-MP.
Measurements in the control group with normal growth pattern were: Jarabak Index: 62-65 %, FMA angle: 23.6-28.1, SN-ML: 31.8 ± 5.2, UAFH/LAFH: 0.71 ± 0.08. Measurements in the case group with horizontal growth pattern and skeletal deep bite were: Jarabak Index > 65%, FMA angle <23.6, SN-ML < 26.
For vertebral fusion presence and location, “Fisher exact test” was applied, and for fusion number “Mann Whitney test” was used. Fusion results are illustrated in table-2. Fusions in the control group were only observed in C2-C3 site. In deep bite group, fusions occurred in C2-C3, C3-C4 and C4-C5 sites, comprising 80, 12 and 8 percent, respectively.
The results of “Backward Binary Regression” test used to assess variables in relation to fusion are as follows: FMA (p = 0.001), SN-MP (p = 0.993), J. index (p = 0.383). Of all the variables only FMA was related to fusion significantly.
Discussions
The modifications in size and shape of the cervical vertebrae in growing subjects have gained increasing interest in the last decades as a biological indicator of individual skeletal maturity. One of the main reasons for the rising popularity of the method is that the analysis of cervical vertebral maturation is performed on the lateral cephalogram of the patient’s head, a type of film used routinely in orthodontic diagnosis. The anticipated anomalies of the cervical column were vertebral fusion and posterior arch defiency of atlas, both detectable on lateral cephalogram.
In a study by Sonneston et al. no statistically significant gender differences were found in the occurrence of morphological characteristics of the cervical column (females 43.5%, males 38.9%). Morphological deviations of the cervical column occurred significantly more often in the deep bite group compared with the control group (p < 0.05) (10). In this study most of the fusions were found in C2-C3 site which is consistent with other studies (6, 10).
In Sonnesen’s study, correlation analysis showed that the vertical jaw relationship and the vertical overbite were significantly positively correlated with fusion of the cervical column, while upper incisor inclination was significantly negatively correlated with fusion. Furthermore, the vertical jaw relationship, jaw angle, upper incisor inclination, and lower alveolar prognathism were significantly negatively correlated with posterior arch deficiency. These associations were not due to age or gender. The significant Spearman correlation coefficients were low to moderate, numerical values ranging from 0.25 to 0.45. Logistic regression analysis showed that the vertical jaw relationship (p < 0.05), overbite (p < 0.001) and upper incisor inclination (p < 0.01) remained significantly correlated with fusion of the cervical column (r = 0.40). SN-MP, FMA and Jarabak Index were related to fusion (10). However, in the present study only FMA was related to fusion. Such discrepancy could be a result of ANB = 2± 2 condition for all the cases in this study.
Group Age
Gender
Total N.Male Female
N. % N. %
Deep bite 20.4±3.79 9 36 16 64 25
Normal 8 32 17 68 25
Vertical Growth Controls Deep BiteP ValueCervical Vertebrae N. % N. %
Normal 17 68 7 28 <0.001Fusion 8 32 18 72 <0.001Several Deviations 2 8 3 12 0.374
Table 1. Sample size and distribution
Table 2. Fusion and anatomic deviation results
7DENTAL STUDENTS’ RESEARCH
An explanation for the association found in the present study between the cervical column, deep bite, and vertical craniofacial morphology may originate from the histological inductions from the notochord to the neural crest cells determined for the craniofacial morphology before the notochord disappears (18).
One of the merits of cervical column assessment on the lateral cephalograms is simply the fact that majority of population undergo orthodontic treatment planning and radiographic evaluation of craniofacial compartments at younger ages. Establishing any correlation between cervical abnormalities which are quite distinctive in cephalograms could really be beneficial in diagnosis or predicting the chance of deep bite occurrence. In Sonnesen’s study, fusion occurrences in control group (14.3%) and deep bite group (41.5%) are lower than correspondent results in this study (32% for controls and 72% for deep bite group).This fusion discrepancy might be a result of false-positive judgments which could have led to a higher report of malformations in our study; howevr, posterior arch deficiency was rare in both studies (9.8% and 12% respectively). In fact, growth-based superimposition of the radiographs disclosed that no patient showed actual fusion, even though the lateral cephalometric analysis revealed sufficient extreme skeletal patterns, which have been previously related to vertebral fusion.
As for the relationship of cervical vertebral maturation and mandibular growth changes, some studies (19) evaluated annual lateral cephalometric radiographs and found statistically significant increases in mandibular length and ramus height in association with specific maturation stages in the cervical vertebrae.
Based on a study by Baccetti and colleagues, Improvements in overbite cannot be predicted on the basis of skeletal vertical relationships. Thus, predicting a relation between cervical fusion and vertical mandibular growth does not seem to be reliable. However, it is wise to consider the fact that in their study deep bite was measured base on overbite measurement of 4.5mm and more. Dental overbite does not seem an appropriate criterion for assessing the skeletal deep bite. In the present study, patients were divided into groups based on Jarabak index as described by Bishara and Zaher (20, 21). Jarabak index is defined as the ratio of anterior to
posterior facial height. Skeletal deep bite cannot be expressed merely based on dental landmarks such as overbite, as it is the product of both dental and skeletal developmental pattern and such association between dental landmarks with cervical and craniofacial growth patterns is remarkably subjective.
It has been assumed by many investigators that extreme values of mandibular plane angle were prognostic criteria for predicting the direction of facial growth. However, others suggested that a high mandibular plane angle is not a good predictor of facial growth and that individuals with high mandibular plane angle could have both backward and forward mandibular growth patterns (22, 23). At the other hand, in the present study FMA showed a significant change in the presence of cervical fusion. This finding may suggest association between cervical column with both backward and forward mandibular growth pattern.
D’Attilio et al noticed a significant relationship between the position and length of mandible and cervical. Lippold et al confirmed the correlation between the position of mandible and cervical vertebrae morphology (24, 25). The present study was in accord with both of these studies.
The basilar part of the occipital bone guides the formation of the cervical vertebrae (26). Studies show that the notochord through its signaling induces the formation and development of body of the cervical vertebrae and basilar part of the occipital bone. Via some other signals, the notochord affects the paraxial mesoderm and induces the formation of spinal curve and parts of the occipital bone (27, 28).
Results from the present study and similar researches highlight the need for further investigations in the fields of genetics and primary stages of fetal development for better understanding of factors influencing the formation of skeletal malocclusions. Such studies may help in better recognition of phenotypic differences in patients with skeletal malocclusions (which are due to different genotypes) and their relationship to cervical anomalies.
Figure 1. Lateral Cephalogram Sample Figure 3. Radiographic view of Fusion C2-C3

8 DENTAL STUDENTS’ RESEARCH
Conclusion
To conclude, associations between skeletal deep bite and cervical column deviations are evident. Most significant deviation in cervical vertebrae was observed at C2-C3 intervertebral space. However, subjective visual examination of a cephalogram may result in a false-positive finding and does not enable reliable diagnosis of cervical vertebrae anomalies (29); thus, repeating similar studies based on CBCT for confirmation is recommended.
References
1. Vastardis H, Evans CA. Evaluation of cervical spine abnormalities on cephalometric radiographs. Am J Orthod Dentofacial Orthop. 1996 Jun;109(6):581-8.
2. Huggare J. Association between morphology of the first cervical vertebra, head posture, and craniofacial
structures. Eur J Orthod. 1991 Dec;13(6):435-40.3. Ugar DA, Semb G. The prevalence of anomalies of the
upper cervical vertebrae in subjects with cleft lip, cleft palate, or both. Cleft Palate Craniofac J. 2001 Sep;38(5):498-503.
4. Rajion ZA. A three-dimensional computed tomographic analysis of the cervical spine in unoperated infants with cleft lip and palate. Cleft Palate Craniofac J. 2006 Sep;43(5):513-8.
5. Kaplan KM, Spivak JM, Bendo JA. Embryology of the spine and associated congenital abnormalities. Spine J. 2005 Sep-Oct;5(5):564-76.
6. Svanholt P, Petri N, Wildschiødtz G, Sonnesen L, Kjaer I. Associations between craniofacial morphology, head posture, and cervical vertebral body fusions in men with sleep apnea. Am J Orthod Dentofacial Orthop. 2009 Jun;135(6):702.e1-9;
7. Sonnesen L, Pedersen C, Kjær I. Cervical column morphology related to head posture, cranial base angle and condylar malformation. Eur J Orthod. 2007 Aug;29(4):398-403.
8. Sonnesen L, Kjaer I. Cervical column morphology in patients with skeletal open bite. Orthod Craniofac Res. 2008 Feb;11(1):17-23.
9. Koletsis DD, Halazonetis DJ. Cervical vertebrae anomalies in orthodontic patients: a growth-based superimpositional approach. Eur J Orthod. 2010 Feb;32(1):36-42.
10. Sonnesen L, Kjaer I. Cervical vertebral body fusions in patients with skeletal deep bite. Eur J Orthod. 2007 Oct;29(5):464-70.
11. Sonnesen L, Bakke M, Solow B. Temporomandibular disorders in relation to craniofacial dimensions, head posture and bite force in children selected for orthodontic treatment. Eur J Orthod. 2001 Apr;23(2):179-92.
12. Sandikcioglu M, Skov S, Solow B. Atlas morphology in relation to craniofacial morphology and head posture. Eur J Orthod. 1994 Apr;16(2):96-103..
13. Sonnesen L, Pallisgaard C, Kjaer I. Cervical column morphology and craniofacial profiles in monozygotic twins. Twin Res Hum Genet. 2008 Feb;11(1):84-92.
14. D’AttilioM, Caputi S, Epifania E, Festa F, Tecco S. Evaluation of cervical posture of children in skeletal class I, II, and III. Cranio. 2005 Jul;23(3):219-28..
15. Arntsen T, Sonnesen L. Cervical vertebral column morphology related to craniofacial morphology and head posture in preorthodontic children with Class II malocclusion and horizontal maxillary overjet. Am J Orthod Dentofacial Orthop. 2011 Jul;140(1):e1-7.
Figure 2-A. Radiographic and schematic view of Fusion of C2-C3
Figure 2-B. Radiographic and schematic view of Posterior Arch Deficiency
Figure 2-C. Radiographic and schematic view of Occipital structures

9DENTAL STUDENTS’ RESEARCH
16. Baccetti T, Franchi L, McNamara JA Jr. An improved version of the cervical vertebral maturation (CVM) method for the assessment of mandibular growth. Angle Orthod. 2002 Aug;72(4):316-23.
17. Sandham A. Cervical vertebral anomalies in cleft lip and palate. Cleft Palate J. 1986 Jul;23(3):206-14.
18. Sadler TW. Embryology of the neural tube development. Am J Med Genet C Semin Med Genet. 2005 May;135C(1):2-8.
19. O’Reilly MT, Yanniello GJ. Mandibular growth changes and maturation of cervical vertebrae--a longitudinal cephalometric study. Angle Orthod. 1988 Apr;58(2):179-84.
20. Zaher AR, Bishara SE, Jakobsen JR. Posttreatment changes in different facial types. Angle Orthod. 1994;64(6):425-36.
21. Baumrind S, Korn EL, West EE. Prediction of mandibular rotation: An empirical test of clinician performance. Am J Orthod. 1984 Nov;86(5):371-85.
22. Skieller V, Björk A, Linde-Hansen T. Prediction of mandibular growth rotation evaluated from a longitudinal implant sample. Am J Orthod. 1984 Nov;86(5):359-70.
23. Bishara SE, Jakobsen JR. Longitudinal changes in three normal facial types. Am J Orthod. 1985 Dec;88(6):466-502.
24. Lipold C, Danesh G, Hoppe G, Drerup B, Hackenberg L. Sagittal spinal posture in relation to craniofacial morphology. Angle Orthod. 2006 Jul;76(4):625-31.
25. D’Atilio M, Epifania E, Ciuffolo F, Salini V, Filippi MR, Dolci M, et al. Cervical lordosis angle measured on lateral.cephalograms; findings in skeletal class II female subjects with and without TMD: A cross sectional study. Cranio. 2004 Jan;22(1):27-44.
26. Sonesen L, Nolting D, Kjaer KW, Kjaer I. Association between the development of the Body Axis and the Craniofacial Skeleton Studied by Immunohistochemical Analyses Using Collagen II, Pax9, Paxl, and Noggin Antibodies. Spine. 2008 Jul 1;33(15):1622-6
27. Kjaer I. Neuro - osteology. Crit Rev Oral Biol Med. 1998;9(2):224-44.
28. Kjaer I. Human prenatal craniofacial development related to brain development under normal and pathologic conditions. Acta Odontol Scand. 1995 Jun;53(3):135-43.
29. Bebnowski D, Hänggi MP, Markic G, Roos M, Peltomäki T. Cervical vertebrae anomalies in subjects with Class II malocclusion assessed by lateral cephalogram and cone beam computed tomography. Eur J Orthod. 2012 Apr;34(2):226-31.
Hajir Rahimi, D.D.S Postgraduate student of Orthodontics, Islamic Azad
University, Tehran, IranAddress: Department of Orthodontics, Islamic Azad
University, Neyestan 10th, Pasdaran Ave, Tehran, IranEmail: [email protected]

10 DENTAL STUDENTS’ RESEARCH
JOB SATISFACTION IN VARIOUS MEDICAL SPECIALITIES Greta Bacionytė,1 Paulina Čėsnaitė,1 Vilma Brukienė1
Institute of Odontology, Faculty of Medicine, Vilnius University, Vilnius, Lithuania
Authors declare no conflict of interest
Abstract
Purpose: The present study aimed to evaluate job satisfaction in different medical specialties in Lithuania.
Methods: A cross-sectional study among 272 Lithuanian doctors working in both private and public sectors was performed. A previously developed and validated instrument addressing three sections (demographic questionnaire, UWEC and Warr-Cook-Walls scales) and including statements evaluating doctors‘ attitude to their chosen profession was used. Statistical analysis was performed using SPSS W20 (descriptive analysis, Student t test).
Results: Response rate was 45.33%. The survey revealed that dentists were more satisfied with their job (4.2 ± 0.7) than medical doctors (3.95 ± 0.7) (p = 0,004). Both dentists and medical doctors working in capital city notified the same extent of job satisfaction (p = 0.103), while in other Lithuanian regions dentists were more satisfied (p = 0.027). The ones working in private practice were the most satisfied (4.44 ± 0.6), and doctors working in public sector were the least satisfied (3.9 ± 0.76) (p < 0.05). Gender differences, according to objective complex Warr-Cook-Walls scale, were not significant (p = 0.584), but based on their own subjective opinion, men were more critical about their job (p = 0.006). Regarding duration of experience, the most satisfied doctors were who had 10-15 years of work experience (p = 0.032). Both dentists and medical doctors were least satisfied with their salaries (3.3 ± 1.17 and 3.11 ± 1.22, respectively). Almost a half (48.7%) of medical doctors stated not getting enough recognition for a good work. As the most positive feature in their profession both groups notified the variety of activities and tasks (90.8%).
Conclusion: Dentists were more satisfied with their job that medical doctors. The extent of job satisfaction was associated with area of residence, experience, and gender. The most valuable factor was variety of job activities, while salary was the least satisfying factor.
Keywords: Dentists, Experience, Job satisfaction, Medical doctors, Private, Public, UWEC scale, Warr-Cook-Walls scale.
Introduction
A significance of job in everyday life is widely reported. Not only it gives people money to survive, but also it bestows on one a personal identity, self-actualization and social image (1). Job satisfaction is define as pleasurable or positive emotional state resulting from the appraisal of one’s job or job experiences (2). The term determines whether the employee is happy, is contented with trying to reach his/her goals, and has fulfilled needs at work. Job satisfaction depends on motivation, meeting aims, and avoiding the creation of stress-inducing atmosphere at work. It is also influenced by the position of employer, appropriate aiming, understood commissions, communication and colleagues. Studies have shown that people who are more satisfied with their job less frequently endure a burnout stress syndrome and exhaustion (3). Dentists and medical doctors belong to a risk group which is more likely to deal with burnout stress syndrome and exhaustion. It has been revealed that, among dentists, 41% of women and 59% of men were undergoing occupational stress (4). Therefore, it is important to find out all conditions and aspects of work which dissatisfy employee. Subsequently, this will help to create and maintain working conditions for doctors that satisfies them most and reduce the risk of health disorders.
The job satisfaction model, suggested by Hackman and Oldman, demonstrates cohesion between working place conditions and work performance, including employee job satisfaction (5). It states that there are five core job characteristics (skill variety, task identity, task significance, autonomy, and feedback) which impact three critical psychological states (experienced meaningfulness, experienced responsibility for outcomes, and knowledge of the actual results), in turn influencing work outcomes (job satisfaction, absenteeism, work motivation, etc.) (6).
A theory presented by J.Holland suggests that people are more likely to have job satisfaction when their personality and job types are match (7). The following types of job are defined: Realistic, Investigative, Artistic, Social, Enterprising, and Conventional. As dental and medical professions are considered as the investigative type, people having the same type of personality will be more satisfied with their job (7).

11DENTAL STUDENTS’ RESEARCH
Although job satisfaction of dentists was investigated in Lithuania in 2008 (8), overall doctors job satisfaction was not analyzed. According to the authors‘ knowledge, there is no study evaluating the correlation between medical and dental professions and job satisfaction in Lithuania. Such study is important for future dental and medical students as popularity of these professions has been increasing and students need to understand the positive and negative features of these professions. Therefore, the present study aimed to investigate job satisfaction among doctors of different medical specialties in Lithuania.
Materials and Methods
The study was performed in 23 Lithuanian regions including both private and public dental and medical practices. Job satisfaction of dentists and medical doctors was measured. To evaluate the level of job satisfaction, a validated questionnaire was used in order to get accurate and objective answers about chosen specialty and working conditions. The questionnaire consisted of short argument type questions, and the respondents had to express their agreement or disagreement so that their answers could be unified and easily evaluated.
The questionnaire was anonymous so that respondents could answer all questions sincerely. It consisted of three different sections: general demographic questions and Warr-Cook-Wall and UWES scales. General demographic questions comprised gender, age, specialty, sector (private or public) that doctors were working at, and working experience. UWES scale reveals doctors‘ opinion about their job from the positive perspective and consists of three parts: vigor, dedication and absorbtion (15). Each part includes 4 or 5 arguments defining each position. Warr-Cook-Walls scale includes 10 positions: 9 of them measure different aspects of job and working atmosphere influencing the job satisfaction (16). The last one summarizes subjective opinion of respondents when all aspects together are taken into consideration. To assure the accuracy of both scales after translating them from their original language, back translation was performed. Likert-type scale was used with answers ranging from 1 to 6 allocated according to the level of agreement with the given statement. Medium mean of the scale was eliminated to avoid misleading data.
Statistical analysis was performed using SPSS V20. Descriptive analysis, Student‘s t-test were used to analyze data.
Results
Overall, 600 questionnaires were distributed to various specialties doctors at randomly selected clinics in various regions of Lithuania. 272 doctors agreed to participate in the study. Response rate was 45.33 %. Majority of respondents were women (68%). 39.34 % of the study population were dentists (n=107) and 60.66 % were medical doctors (n=165). The distribution of the respondents according to their practice (private or public) is shown in Table 1.
As it is shown in Fig.1, both dentists and medical doctors reported higher satisfaction rates using subjective evaluation compared with complex Warr-Cook-Wall scale. In addition, dentists (4.22 ± 0.7) were more satisfied with their profession than other doctors (3.93 ± 0.7) according to Warr-Cook-Wall scale evaluation (p = 0.004).
The results revealed no difference in job satisfaction of dentists (4.12) and medical doctors (4.08) working in capital city, Vilnius (p = 0,103)(Fig. 2), while the dentists working in other cities of Lithuania notified being more satisfied than medical doctors (4.32 and 4.00, correspondingly; p = 0.027).
The study showed that job satisfaction depended on duration of working experience (Fig. 3). According Warr-Cook-Wall scale, the doctors who had been working for less than 3 years (3.94) and the doctors who had more than 25 years of working experience (3,91) were least satisfied with their job. The most satisfied group were those who had been working for 10-15 years (4.37; p = 0.032).
The present data shows that job satisfaction depended on healthcare sector where doctors worked (Fig. 4). The most satisfied group with their job were doctors who worked in private practice (4.44 ± 0.6), while the least satisfied were those who were involved only in public practice (3.92 ± 0.76; p < 0.05).
The results revealed that women (4.05) were more satisfied with their profession than men (3.97) but gender differences according to objective Warr-Cook-Walls scale were not statistically significant (p = 0.584).
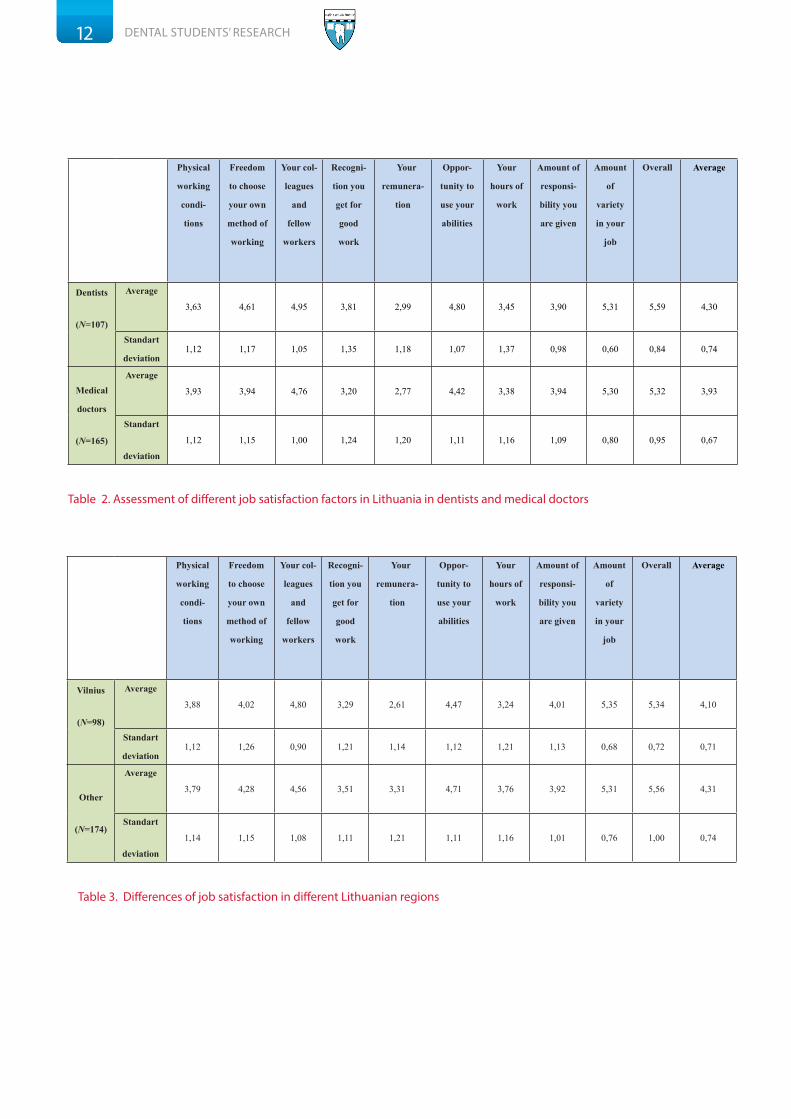
Table 2 and 3 present different aspects of job satisfaction of medical doctors and dentists in Vilnius and other Lithuanian regions.
Private Public Both
N P e r c e n t
(%)
N P e r c e n t
(%)
N P e r c e n t
(%)
Dentists 44 41,12% 29 27,1% 34 31,78%
Medical doctors 18 10,91% 120 72,72% 27 16,36%
Table 1. The distribution of respondents according to their practice (private or public)
12 DENTAL STUDENTS’ RESEARCH
Physical
working
condi-
tions
Freedom
to choose
your own
method of
working
Your col-
leagues
and
fellow
workers
Recogni-
tion you
get for
good
work
Your
remunera-
tion
Oppor-
tunity to
use your
abilities
Your
hours of
work
Amount of
responsi-
bility you
are given
Amount
of
variety
in your
job
Overall Average
Dentists
(N=107)
Average
3,63 4,61 4,95 3,81 2,99 4,80 3,45 3,90 5,31 5,59 4,30
Standart
deviation1,12 1,17 1,05 1,35 1,18 1,07 1,37 0,98 0,60 0,84 0,74
Medical
doctors
(N=165)
Average
3,93 3,94 4,76 3,20 2,77 4,42 3,38 3,94 5,30 5,32 3,93
Standart
deviation
1,12 1,15 1,00 1,24 1,20 1,11 1,16 1,09 0,80 0,95 0,67
Physical
working
condi-
tions
Freedom
to choose
your own
method of
working
Your col-
leagues
and
fellow
workers
Recogni-
tion you
get for
good
work
Your
remunera-
tion
Oppor-
tunity to
use your
abilities
Your
hours of
work
Amount of
responsi-
bility you
are given
Amount
of
variety
in your
job
Overall Average
Vilnius
(N=98)
Average
3,88 4,02 4,80 3,29 2,61 4,47 3,24 4,01 5,35 5,34 4,10
Standart
deviation1,12 1,26 0,90 1,21 1,14 1,12 1,21 1,13 0,68 0,72 0,71
Other
(N=174)
Average
3,79 4,28 4,56 3,51 3,31 4,71 3,76 3,92 5,31 5,56 4,31
Standart
deviation
1,14 1,15 1,08 1,11 1,21 1,11 1,16 1,01 0,76 1,00 0,74
Table 2. Assessment of different job satisfaction factors in Lithuania in dentists and medical doctors
Table 3. Differences of job satisfaction in different Lithuanian regions
13DENTAL STUDENTS’ RESEARCH
Discussion
It was the first study in Lithuania to describe the differences in job satisfaction among medical doctors and dentists. Given that the number of respondents was 272, the response rate was 45.33%, and no data about doctors‘ job satisfaction is available in some Lithuanian regions, generalizations from this study should be done with caution.
In general, the majority of doctors who participated in the survey were satisfied with their profession. 93% of participants stated they are satisfied with their profession notifying higher than average values (Warr-Cook-Wall scale evaluation – 3 or more). It was observed that dentists are more satisfied with their profession than medical doctors. This data is supported by other investigations reporting high levels of job satisfaction among dentists in Lithuania (8) and in the other countries (9). Although it was the first attempt to investigate the levels of job satisfaction in various specialties of doctors in Lithuania, there were similar studies evaluating the same aspects of job satisfaction in the other countries. The authors of the present study tried to create a model of positive and negative factors of medical and dental specialties which could be modified in order to improve their job satisfaction. Furthermore, these results may help the future dental and medical students to choose their career.
The study revealed that Lithuanian doctors who lived and worked in rural environment or smaller towns tended to be more satisfied with their job than those who worked in the capital. The data showed that, in periphery of Lithuania, doctors were more satisfied with their salary and working hours, while doctors in Vilnius had a higher satisfaction level about their colleagues. The possible explanation for this phenomenon could be a slightly different economic situation in periphery with higher purchasing power, which enables doctors to work less to support themselves. The similar results regarding the higher job satisfaction in rural areas can be found in an Australian study (10).
High positive ratings of colleagues in the capital city may be induced by working in larger clinics or health centers, where healthcare staff is more expanded and people may communicate more.
Recently graduated doctors may experience difficulties in finding a job, stressful situations, and lack of self-confidence which may consequently lead to a less satisfaction with
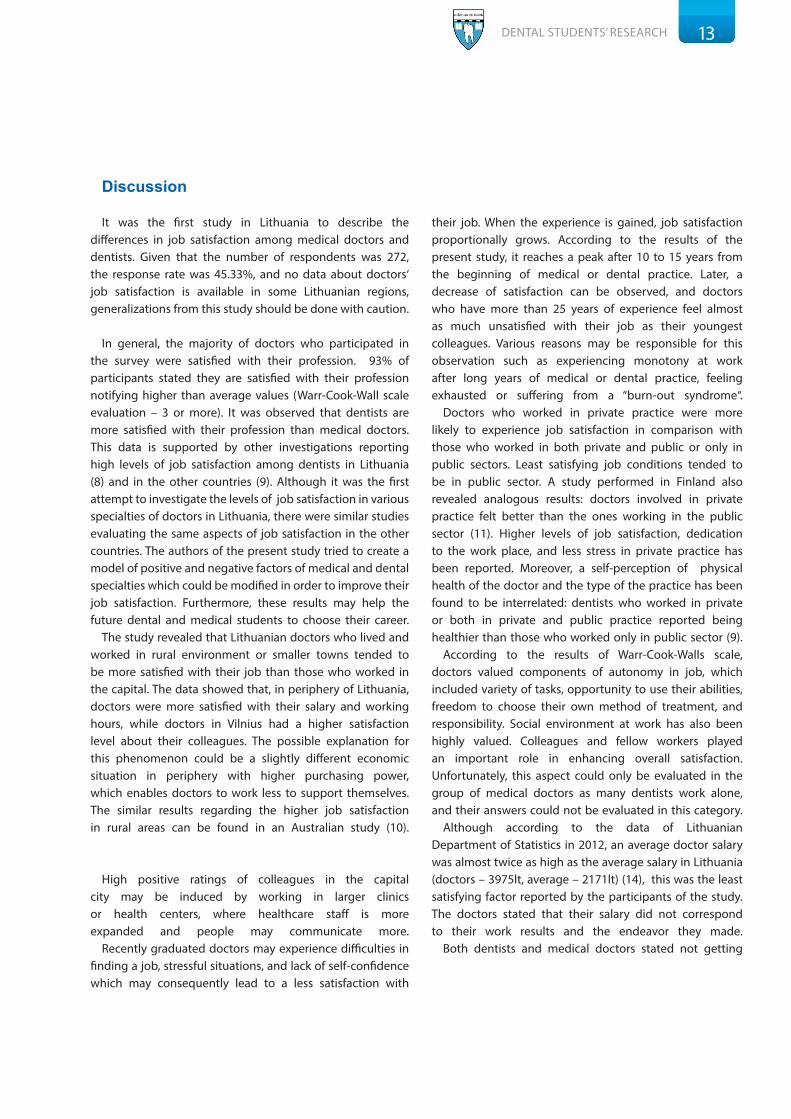
their job. When the experience is gained, job satisfaction proportionally grows. According to the results of the present study, it reaches a peak after 10 to 15 years from the beginning of medical or dental practice. Later, a decrease of satisfaction can be observed, and doctors who have more than 25 years of experience feel almost as much unsatisfied with their job as their youngest colleagues. Various reasons may be responsible for this observation such as experiencing monotony at work after long years of medical or dental practice, feeling exhausted or suffering from a “burn-out syndrome“.
Doctors who worked in private practice were more likely to experience job satisfaction in comparison with those who worked in both private and public or only in public sectors. Least satisfying job conditions tended to be in public sector. A study performed in Finland also revealed analogous results: doctors involved in private practice felt better than the ones working in the public sector (11). Higher levels of job satisfaction, dedication to the work place, and less stress in private practice has been reported. Moreover, a self-perception of physical health of the doctor and the type of the practice has been found to be interrelated: dentists who worked in private or both in private and public practice reported being healthier than those who worked only in public sector (9).
According to the results of Warr-Cook-Walls scale, doctors valued components of autonomy in job, which included variety of tasks, opportunity to use their abilities, freedom to choose their own method of treatment, and responsibility. Social environment at work has also been highly valued. Colleagues and fellow workers played an important role in enhancing overall satisfaction. Unfortunately, this aspect could only be evaluated in the group of medical doctors as many dentists work alone, and their answers could not be evaluated in this category.
Although according to the data of Lithuanian Department of Statistics in 2012, an average doctor salary was almost twice as high as the average salary in Lithuania (doctors – 3975lt, average – 2171lt) (14), this was the least satisfying factor reported by the participants of the study. The doctors stated that their salary did not correspond to their work results and the endeavor they made.
Both dentists and medical doctors stated not getting

14 DENTAL STUDENTS’ RESEARCH
enough recognition for their work, but such tendency was more pronounced in the group of medical doctors. This criteria reflects how much respect and value doctors get from their colleagues. A team work could improve this aspect as it was previously shown that doctors who work alone are less satisfied with their job (12).
The majority of the dentists participating in the study reported discomfort at work because of physical working conditions. Headaches, insomnia, depression, and other psychological disorders were shown to be caused by frequent encounter with stressful situations at work. It has been previously shown that only about 25% of Lithuanian dentists did not suffer from symptoms of depression, and only 10% did not experience increased anxiety (8). In addition, physical musculoskeletal disorders provoked by persistent sedentary position are more common in dentistry, and it is reported that 60% of dentists suffer from backache, overweight or obesity (13).
Gender differences according to the objective complex Warr-Cook-Walls scale were not significant, but based on their own subjective opinion, men were more critical about their job than women. It can be presumed that female doctors are more optimistic. A study from Germany reported female gender as one of the factors positively influencing overall job satisfaction (17).
Conclusion
In conclusion, the survey revealed that dentists were more satisfied with their job that medical doctors. The extent of job satisfaction was associated with the area of residence, experience, and gender. The most satisfying factor was variety of job activities, while salary was the least satisfying factor.
Acknowledgment
We are grateful to all administrative persons of healthcare institutions who helped in handing out the questionnaires, and we thank all the doctors who took the time to respond to the survey. The authors alone are responsible for the views expressed.
0.00
1.00
2.00
3.00
4.00
5.00
6.00
Dentists Medical doctors
5.56 5.32
4.22 3.93Subjectiveevaluation
ObjectiveWarr-Cook-Walls scaleevaluation
Vilnius2.502.753.003.253.503.754.004.254.504.755.00
Dentists Medicaldoctors
4.13 4.08
4.324.00
3.6
3.8
4
4.2
4.4
4.6 4.44
3.9
4
Private
Public
Both
3.603.703.803.904.004.104.204.304.40
<3years
3-10years
10-15years
15-20years
>25years
3.94
4.14
4.37
4.09
3.91
Fig. 1. Job satisfaction among dentists and other medical doctors
Fig. 2. Differences between various medical specialties in different parts of Lithuania
Fig. 3. Job satisfaction differences according to duration of working experience
Fig. 4. Job satisfaction dependence on a type of practice
Others

15DENTAL STUDENTS’ RESEARCH
References
1. Al-Rubaish AM, Rahim SI, Abumadini MS, Wosornu L. Academic job
satisfaction questionnaire: Construction and validation in Saudi Arabia. J Family
Community Med. 2011 Jan;18(1):1-7.
2. Locke EA. What is job satisfaction? Organisational Behaviour and Human
Performance. 1969;4(4):309-36.
3. Renzi C, Tabolli S, Ianni A, Di Pietro C, Puddu P. Burnout and job satisfaction
comparing healthcare staff of dermatological hospital and general hospital. J
Eur Acad Dermatol Venereol. 2005 Mar;19(2):153-7.
4. Murtomaa H, Haavio-Mannila E, Kandolin I. Burnout and its causes in
Finnish dentists. Community Dent Oral Epidemiol. 1990;18(4):208-12.
5. Öztürk H, Bahcecik N, Baumann SL. Nursing Satisfaction and Job
Enrichment in Turkey. Nurs Sci Q. 2006 Oct;19(4): 360-5.
6. Bjorklund C. Work Motivation - Studies of its Determinants and Outcomes.
Stockholm: Elanders Gotab; 2001,pp.7-8.
7. Holland JL. Making vocational choices: A theory of vocational personalities
and work environments. 3rd ed. Odessa, FL: Psychological Assesment Resources;
1997, p.3.
8. Pūrienė A, Aleksejūnienė J, Petrauskienė J, Balčiūnienė I, Janulytė V. Self-
perceived Mental Health and Job Satisfaction among Lithuanian Dentists. Ind
Health. 2008 Jul;46(3):247-52.
9. Newton J T, Gibbons D E. Levels of career satisfaction among dental health
care professionals: comparison of dental therapists, dental hygienists and dental
practitioners. Community Dent Health. 2001 Sep;18(3):172-6.
10. Ulmer B, Harris M. Australian GPs are satisfied with their job: even more so
in rural areas. Fam Pract. 2002 Jun;19(3):300-3.
11. Heponiemi T, Kuusio H, Sinervo T, Elovainio M. Job attitudes and well-
being among public vs. private physicians: organizational justice and job
control as mediators. Eur J Public Health. 2011 Aug;21(4):520-5.
12. Csikar J I, Bradley S, Williams S A, Godson J H, Rowbotham J S. Dental
therapy in the United Kingdom: part 4. Teamwork – is it working for dental
therapists? Br Dent J. 2009 Dec;207(11):529-36.
13. Myers HL, Myers LB. ‘It’s difficult being a dentist’: stress and health in the
general dental practitioner. Br Dent J. 2004 Jul;197(2):89-93.
14. http://db1.stat.gov.lt/statbank/selectvarval/saveselections.asp?MainTab
le=M3060320&PLanguage=0&TableStyle=&Buttons=&PXSId=9010&IQY=&TC
=&ST=ST&rvar0=&rvar1=&rvar2=&rvar3=&rvar4=&rvar5=&rvar6=&rvar7=&rv
ar8=&rvar9=&rvar10=&rvar11=&rvar12=&rvar13=&rvar14=, 2013.02.12
15. Storm K, Rothmann S. Psychometric analysis of the Utrecht Work
Engagement scale in the South African Police servic. SA Journal of Industrial
Psychology. 2003; 29(4): 62-70.
16. Cooper CL, Rout U, Faragher B. . Mental health, job satisfaction, and job
stress among general practitioners. BMJ. 1989 Feb;298(6670):366-70.
17. Goetz K, Musselmann B, Szecsenyi J, Joos S. The influence of workload
and health behavior on job satisfaction of general practitioners. Fam Med. 2013
Feb;45(2):95-101.
18. Gottfredson, Gary D.; Jones, Elizabeth M.; Holland, John L. Personality
and vocational interests: The relation of Holland’s six interest dimensions to
five robust dimensions of personality. Journal of Counseling Psychology. 1993
Oct;40(4): 518-
Greta Bacionytė, Institute of Odontology, Faculty of Medicine, Vilnius
UniversityAddress: Žalgirio 117, LT-08217, Vilnius, Lithuania Email: greta.bacionytė@gmail.com
16 DENTAL STUDENTS’ RESEARCH
IN VITRO ANTICANCER ACTIVITY OF GUAVA (Psidium guajava L.) AGAINST HSC-2 HUMAN ORAL CANCER CELLSEvie Lamtiur Pakpahan, Doc.Clin.Dent., Postgrad.Dip;1 Alveolie Gabriella, B.D.S;2 Melisa, B.D.S;2 Mettasari Wardoyo, B.D.S;2
Rakhmawati Caesaria, B.D.S 2
1 Orthodontic lecturer, Faculty of Dentistry, University Prof. Dr. Moestopo, Jakarta, Indonesia
2 Faculty of Dentistry, University Prof. Dr. Moestopo, Jakarta, Indonesia
Authors declare no conflict of interest
Abstract
Purpose: Cancer and its treatment (prevention and anticancer medication) are widely discussed. There are considerable efforts to identify naturally occurring substances as new drugs in cancer therapy. Many components of medicinal plants have been identified that possess substantial anticancerous properties. Guava (Psidium guajava L.) leaves extract is known for its medicinal properties such as antibactery, antiinflamation, antidiarrhea. This prompted us to investigate the anticancer effect of Psidium guajava L. leaves extract. The purpose of this study was therefor investigate the effect of guava leaves extract on HSC-2 oral cancer cells in vitro.
Methods: This study was done by in-vitro method. The HSC-2 cell lines were treated with various concentrations of leaves extract of Psidium guajava L. to determine their probable anticancer effects in comparison with positive control (cisplatin) and negative control. The treated cancer cells along with positive and negative controls were observed under microscope to follow the cancer progress as well as the apoptosis induction. The parameters that were being observed are cell viability and apoptosis. Cell viability was monitored by MTS assay while cell cycle progression and induction of apoptosis were monitored by sub-G1 apoptosis assay using flowcytometry.
Results: The results obtained indicated that HSC-2 cells treatment with guava leaves ethanolic extract significantly reduced the proliferation and increased apoptosis of HSC-2 cells (p < 0.001).
Conclusion: within limitations of the present study, it could be concluded that the extract of Psidium guajava leaves exhibit a considerable anticancer activity against the HSC-2 cell line of human oral cancer.
Keywords: Anticancer, Apoptosis, HSC-2, Human oral cancer, Psidium guajava L., Viability
Introduction
Cancer is a global health problem with high morbidity and mortality and poses both economic and psychological challenges. Cancer cure and prevention therefore remain a high priority for the scientific and medical community across the world (1). One type of cancer is oral cancer. More than 90% of cancers that occur in the oral cavity and oropharynx are squamous cell carcinoma (2). Oral squamous cell carcinoma (OSCC) is an invasive epithelial neoplasm of the oral cavity showing various degrees of squamous differentiation, and a propensity for early and extensive lymph node metastasis (2, 3).
Treatment of oral cancer has primarily relied on classical modalities encompassing surgery, radiation, chemotherapy, or a combination of these methods (3). Chemotherapy is the treatment of disease, especially cancer, using chemical substances. These chemicals are capable of destroying cancer cells, keeping them from growing and spreading, shrinking the size of tumor or relieving the cancer symptoms. However, chemotherapy can destroy or slow down the growth of normal cells, including cells of the hair, mouth, digestive system, as well as those of blood (4). Cisplatin is one of the chemotherapy drugs that for many types of cancer and is often combined with other cancer drugs. Chemotherapy with cisplatin is effective in patient with advanced squamous cell oral cancer (5). Each person with cancer reacts differently to chemotherapy and its various side effects. Therefore, oncologists are still searching for new anticancer drugs with more potent inhibitory and less side effects (4).
Plants from tropical regions are considered to be one of the potential sources for the screening of anticancer agents; there have been rapid changes in the popularity of the use of natural systems for health maintenance and alternative therapy (6). It is conceivable that effective plant-derived chemoprevention agents might target molecules that regulate the cell cycle, cellular senescence, and apoptosis (3).
Guava (Psidium guajava L.), a fruit plant belonging to the family Myrtaceae, is found all over the world (6). It is a small tree about 8 meter high and often cultivated throughout the tropical regions with the leaves and the fruits as the most frequently used part of the plants (7, 8). It has a long history of

17DENTAL STUDENTS’ RESEARCH
use for dietary and medicinal purposes throughout the tropics (9). The positive effects of guava extracts on human ailments have been described (10). It includes antioxidant effect which is beneficial to the heart as a cardioprotective agent; its analgesic, anti-bacterial, anti-dysenteric, anti-malarial and anti-ulcerous properties has also been documented (10). Guava has also been used as cardio depressant, CNS depressant, cough suppressant, hypotensive agent, sedative, and vasoconstrictor (10). Other properties documented by traditional users include: anti-anxiety, anticonvulsant, blood cleanser, and menstrual stimulant (8).
The long history of guava being used as natural medicine by traditional healers has led to modern-day researchers to study the effect of guava extracts on the treatment of different ailments. However, so far its effect on human oral carcinoma especially oral SCC cell lines such as HSC-2 (cell line derived from carcinoma on the floor of mouth) has not been documented. Therefore, the purpose of the present study was to investigate the effect of guava leaves extract on HSC-2 oral cancer cells in vitro.
Materials and Methods
Preparation of Ethanolic Extract The guava extracts were prepared with leaves of Psidium
guajava L. obtained from Coblong - Bandung, Indonesia and collected in March 2011 (plants were fresh and free of toxic compounds). The guava leaves extract were made in University of Kristen Maranatha Bandung, Indonesia (Fig. 1).
To prepare the extracts, the maceration extract technique was used. First, fresh leaves 600 gram were air dried for 2 to 3 days with calefaction 500C before they were grounded to fine powder. The powder was macerated in 10 L of 96% ethanol (which has been distilled) for 24 hours. Then, the powder residue was macerated in 10 L of 96% ethanol several times until forming colorless filtrate. The extract was then evaporated and filtered with standard paper and stored in sealed containers at 4°C until used (11, 12) (Fig 2). The concentrate selected for the study/experiment were 15.625” μg/ml” , 31.25 “μg/ml” , 62.5 “μg/ml” ,125 “μg/ml” , 250 “μg/ml” , and 500 “μg/ml” .
Preparation for the MediumHSC-2 Oral Squamous Cells Carcinoma cell lines were obtained
from Stem Cell and Cancer Institute (SCI), Pulo Gadung, Jakarta-Indonesia. The cells were maintained in Dulbecco’s Modified Eagle Medium (DMEM) supplemented with 10% Fetal Bovine Serum (FBS) in a 37⁰C incubator with 5% CO2. The guava extract was dissolve in Dimethyl Sulfoxide (DMSO) and added to cultured medium where DMSO concentration was less than 1% (13).
Cell ViabilityCell viability was measured by MTS assay. Cell HSC-2 suspension was
collected into sterile 96-well flat-bottomed microtiter plates (1 × 10⁵ cells/per cell). The HSC-2 cells were divided into 3 groups: negative control, cisplatin as positive control, and Guava Leaves Ethanolic Extract (GLEE) in treatment group. Cisplatin and the guava extract were tested in triplicate. The plates were then incubated at 37°C under 5% CO2 atmosphere for 72 hours. Microtiter wells containing HSC-2 but no anticancer agents were used for negative control of cell viability, in which the total number of tumor cells was equivalent to that in the test wells, and wells containing only a complete medium were used as blank controls for nonspecific dye reduction. After incubation, MTS solution was added to each well at a final concentration of 1 mg/mL per well and the plates were incubated at 37°C for another 4 hours. Then the mixture containing the medium, the drug, and the unconverted MTS was removed. DMSO was added to each well to dissolve the formazan and absorbance was read at 550 nm using a spectrophotometric microplate reader.
Analysis of apoptosisApoptosis was evaluated using an Annexin V-FITC apoptosis
detection kit. Briefly, HSC-2 cells were seeded in a 96-well tissue culture plate and incubated for 24 hours. The cells were randomly divided into treatment, positive control, and negative control groups. Cells in the treatment group were treated with guava extract for 24 hours, cells in the positive control group were treated with cisplatin for 24 hours, and cells in the negative control group were incubated in a medium with neither guava extract nor cisplatin for 24 hours. Subsequently, floating and adherent cells in the medium were collected and centrifuged at 1800 r/min for 6 minutes at 4°C. Cell pellets were washed
Figure 1. Fresh Guava (Psidium guajavaL.) LeavesFigure 7. Analysis of morphological changes resulting from
GLEE treatment of HSC-2 cells. The cells were exposed to various concentration of GLEE: (a): 15,625 “μg/ml” ; (b): 31,25 “μg/ml” ; (c): 62,5 “μg/ml” ; (d): 125 “μg/ml” ; (e) 250 “μg/ml” ; (f ): 500 “μg/ml” . Many cells without nucleolus (lysis of nucleus) were observed.

18 DENTAL STUDENTS’ RESEARCH
twice with cold PBS and then resuspended in a binding buffer at a concentration of 1 × 10⁶ cells/mL, and 100-μL aliquots of this cell suspension (1 × 10⁵ cells) were then transferred to a 5 mL culture tube. Using an Annexin V-FITC apoptosis detection kit, the cells were stained with Annexin V-FITC and propidium iodide (PI) according to the manufacturer’s instructions. 5 μL of annexin V-FITC and 5 μL of PI were added to each 100 μL aliquot of the above-mentioned cell suspension, and the cells were gently vortexed and incubated for 15 minutes at room temperature in the dark. Each sample, to which 400 μL of 1 × binding buffer was added, was analyzed using a FACS flowcytometer within 1 hour. Analyses were performed by the software supplied in the instrument.
Statistical analysisAll data are the means of ± S.D. of three determinations and
the data was analyzed using the SPSS package for Windows (Version 11.5). The data were evaluated by one-way analysis of variance (ANOVA).
Results
In the beginning of the study, the number of cells on each group was the same. After 24 hours of treatment, the result of this study showed different number of cells in the three treatment groups (cisplatin, guava, and negative control) as shown in Fig. 3. The number of cells in the Guava-treated group, which was less than 1000, was significantly lower compared to the cisplatin-treated group with the number of cells of about 6000 and the control group with the number of cells of about 5000 number of cells (p < 0.001). It indicates that HSC-2 cells treatment with GLEE significantly reduced the proliferation of HSC-2 cells (Fig. 3).
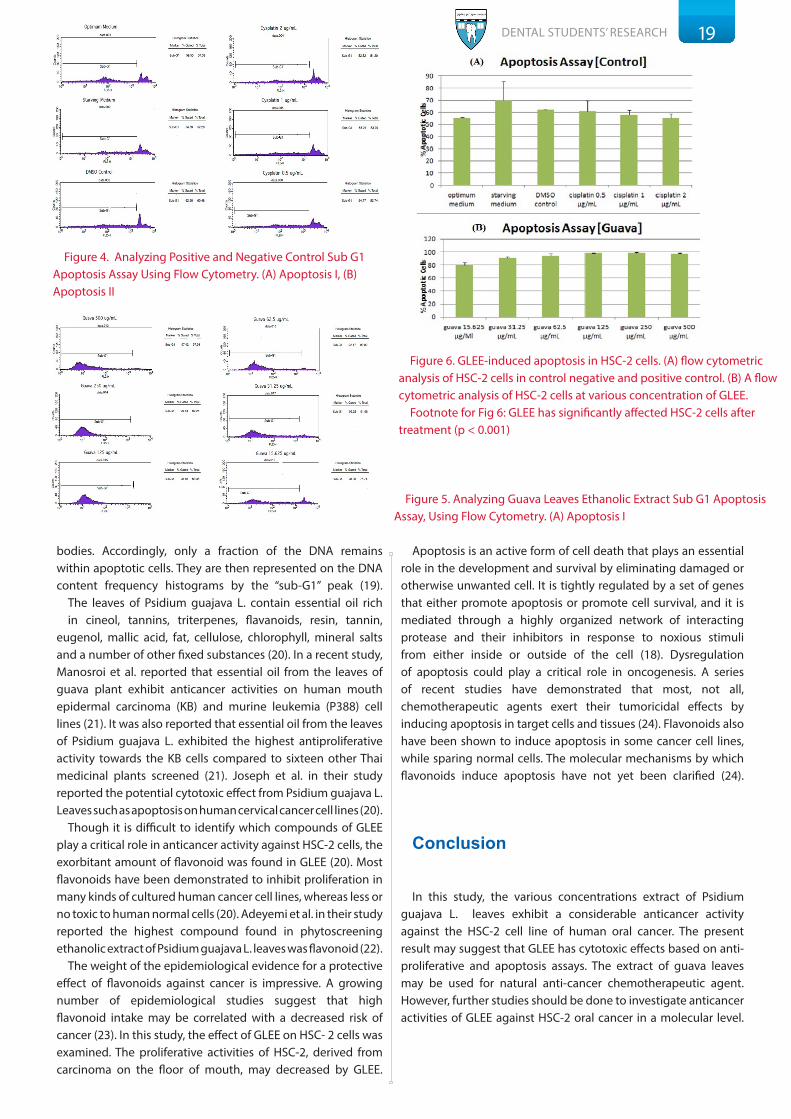
HSC-2 cells that were treated with guava extract showed the activities of apoptosis and thus many dead cells were observed. There was a significant difference in the HSC-2 cells that underwent apoptosis after the treatment with GLEE (p < 0.001) (Fig. 5 and 6) (Table 1). However, as shown in (Fig 4 and 5), the increase of apoptotic cells in the positive and negative controls were not statistically significant (p > 0.05).
When seen under the microscope, many cells without nucleolus (lysis of nucleus) were observed in the group treated with GLEE as shown in Fig. 7
Discussion
We attempted to determine the cytotoxic activity of Guava Leaves Ethanolic Extract. It was measured by the MTS (3-[4,5-dimethylthiazol-2-yl]-5-[3-carboxymethoxyphenyl]-2-[4-sulfophenyl]-2H-tetrazolium) reduction assay because of ease of use, accuracy, and acceptable sensitivity and specificity of this measurement (14). MTS is a recently developed, alternative tetrazolium salt, which also has utility in cell proliferation assays. The major advantage of MTS assays is the ability to measure cell number without having to disturb the cells by the removal of the experimental culture medium (15). MTS has the advantage over MTT (3-(4,5-dimethyethiazol-2-yl)-2,5-diphenyltetrazolium bromide) in that the formazan, which results from its reduction, is soluble in culture medium. In addition, the formazan formed from MTS is water-soluble and less toxic (16).
Flowcytometry is a powerful technique for the study of single cells; thus, it is of particular utility in the study of heterogeneity in microbial populations. The function of flowcytometry are to identify and quantify dead or dying cells, to reveal the mode of cell death (apoptosis or necrosis), and to study the mechanisms involved in cell death (17). Compared to the classic methods of DNA ladder formation by gel electrophoresis and of morphologic examination by electron microscopy for determination of apoptosis, flow cytometry permits rapid and quantitative measurements on apoptotic cells. The capacity of flow cytometry for rapid and individual analysis of a large number of cells would appear to make it ideally adapted for the study of cell death. Thus, apoptotic cells can be recognized by their diminished stainability with DNA specific fluorochromes such as propidium iodide (PI) (18). Apoptotic cells often have fractional DNA content due to the fact that the fragmented DNA undergoes extraction during the PI staining procedure. Some cells also lose DNA (chromatin) by shedding apoptotic
Figure 2. The Process of preparation of GLEE (Guava Leaves Ethanolic Leaves Extract)
Figure 3. Cell viability in various concentration of cisplatin (A), GLEE (B), and negative control medium
Cell viability was measured with MTS reduction assays. The results obtained indicated that HSC-2 cells treatment with GLEE significantly reduced the proliferation of HSC-2 cells (p < 0.001)
19DENTAL STUDENTS’ RESEARCH
bodies. Accordingly, only a fraction of the DNA remains within apoptotic cells. They are then represented on the DNA content frequency histograms by the “sub-G1” peak (19).
The leaves of Psidium guajava L. contain essential oil rich in cineol, tannins, triterpenes, flavanoids, resin, tannin,
eugenol, mallic acid, fat, cellulose, chlorophyll, mineral salts and a number of other fixed substances (20). In a recent study, Manosroi et al. reported that essential oil from the leaves of guava plant exhibit anticancer activities on human mouth epidermal carcinoma (KB) and murine leukemia (P388) cell lines (21). It was also reported that essential oil from the leaves of Psidium guajava L. exhibited the highest antiproliferative activity towards the KB cells compared to sixteen other Thai medicinal plants screened (21). Joseph et al. in their study reported the potential cytotoxic effect from Psidium guajava L. Leaves such as apoptosis on human cervical cancer cell lines (20).
Though it is difficult to identify which compounds of GLEE play a critical role in anticancer activity against HSC-2 cells, the exorbitant amount of flavonoid was found in GLEE (20). Most flavonoids have been demonstrated to inhibit proliferation in many kinds of cultured human cancer cell lines, whereas less or no toxic to human normal cells (20). Adeyemi et al. in their study reported the highest compound found in phytoscreening ethanolic extract of Psidium guajava L. leaves was flavonoid (22).
The weight of the epidemiological evidence for a protective effect of flavonoids against cancer is impressive. A growing number of epidemiological studies suggest that high flavonoid intake may be correlated with a decreased risk of cancer (23). In this study, the effect of GLEE on HSC- 2 cells was examined. The proliferative activities of HSC-2, derived from carcinoma on the floor of mouth, may decreased by GLEE.
Apoptosis is an active form of cell death that plays an essential role in the development and survival by eliminating damaged or otherwise unwanted cell. It is tightly regulated by a set of genes that either promote apoptosis or promote cell survival, and it is mediated through a highly organized network of interacting protease and their inhibitors in response to noxious stimuli from either inside or outside of the cell (18). Dysregulation of apoptosis could play a critical role in oncogenesis. A series of recent studies have demonstrated that most, not all, chemotherapeutic agents exert their tumoricidal effects by inducing apoptosis in target cells and tissues (24). Flavonoids also have been shown to induce apoptosis in some cancer cell lines, while sparing normal cells. The molecular mechanisms by which flavonoids induce apoptosis have not yet been clarified (24).
Conclusion
In this study, the various concentrations extract of Psidium guajava L. leaves exhibit a considerable anticancer activity against the HSC-2 cell line of human oral cancer. The present result may suggest that GLEE has cytotoxic effects based on anti-proliferative and apoptosis assays. The extract of guava leaves may be used for natural anti-cancer chemotherapeutic agent. However, further studies should be done to investigate anticancer activities of GLEE against HSC-2 oral cancer in a molecular level.
Figure 4. Analyzing Positive and Negative Control Sub G1 Apoptosis Assay Using Flow Cytometry. (A) Apoptosis I, (B) Apoptosis II
Figure 5. Analyzing Guava Leaves Ethanolic Extract Sub G1 Apoptosis Assay, Using Flow Cytometry. (A) Apoptosis I
Figure 6. GLEE-induced apoptosis in HSC-2 cells. (A) flow cytometric analysis of HSC-2 cells in control negative and positive control. (B) A flow cytometric analysis of HSC-2 cells at various concentration of GLEE.
Footnote for Fig 6: GLEE has significantly affected HSC-2 cells after treatment (p < 0.001)

20DENTAL STUDENTS’ RESEARCH
References
1. Kaur M, Agarwal C, Agarwal R. Anticancer and cancer chemopreventive potential of
grape seed extract and other grape-based products. J Nutr. 2009 Sep;139(9):1806–12.
2. Jin Y, Jin C . Oral Squamous Cell Carcinoma. Atlas Genet Cytogenet Oncol Haematol.
September 2006 .URL : http://AtlasGeneticsOncology.org/Tumors/OralSquamCellID5368.
html
3. Hsu S, Singh B, Schuster G. Induction of apoptosis in oral cancer cells: Agents and
mechanisms for potential therapy and prevention. Oral Oncol. 2004 May;40(5):461-73.
4. Lajimi AA, Tavirani MR, Mortazavib SA, Barzegar M, Moghadamniaa SY, Rezaee MB.
Study of Anti Cancer Property of Scrophularia striata Extract on the Human Astrocytoma
Cell Line (1321). IJPR. 2010;9(4):403-10.
5. Andreadis C, Vahtsevanos K, Sidiras T, Thomaidis I, Antoniadis K, Mouratidou D.
5-Fluorouracil and Cisplatin in The Treatment of Advanced Oral Cancer. Oral Oncol. 2003
Jun;39(4):380-5.
6. Awang K, Azmi MN, Aun L, Aziz AN, Ibrahim H, Nagoor NH. The Apoptotic Effect
of 1’S-1’-Acetoxychavicol Acetate from Alpinia Conchigera on Human Cancer Cells.
Molecules. 2010 Nov;15(11):8048-59.
7. Hoque MD, Bari ML, Inatsu Y, Juneja V, Kawamoto S. Antibacterial Activity of Guava
(Psidium guajava L.) and Neem (Azadirachta id/ca A. Juss.) Extracts Against Foodborne
Pathogens and Spoilage Bacteria. Foodborne Pathog Dis. 2007 Winter;4(4):481-8.
8. Sambo N, Garba SH, Timothy H. Effect Of The Aqueous Extract Of Psidium Guavaja
On Erythromycin –Induced Liver Damage In Rats. Niger J Physiol Sci. 2009 Dec;24(2):171-
6.
9. Yusuf S, Agunu A, Katung NV, Umana UE. Ethanolic Leaf Extract of Psidium guajava L.
[Myrtaceae] Protects the Stomach against Ischemia-Reperfusion Induced Gastric Mucosal
Injury. Asian Journal of Medical Sciences. 2010;1(1):1-3.
10. Abreu PRC, Almeida MC, Bernardo RM, Bernardo LC, Brito LC, Garcia EAC,
Fonseca AS, Bernado-Filho M. Guava Extract (Psidium guajava) Alters The Labelling of
Blood Constituents with Technetium-99m. Journal of Zhejiang University SCIENCE B.
2006;7(6):429-435.
11. Conde Garcia EA, Nascimento VT, Santiago Santos AB. Inotropic Effects of Extracts
of Psidium guajava L. (guava) Leaves on the Guinea Pig Atrium. Braz J Med Biol Res. 2003
May;36(5):661-8.
12. Arima H, G Danno. Isolation of Antimicrobial Compounds from Guava (Psidium guajava
L.) and Their Structural Elucidation. Biosci Biotechnol Biochem. 2002 Aug;66(8):1727-30.
13. Lee SB, Park HR. Anticancer Activity of Guava (Psidium guajava L.) Branch Extracts Against
HT-29 Human Colon Cancer Cells. Journal of Medicinal Plants Research. 2010;4(10):891-896.
14. Malich G, Markovic B, Winder C. The Sensitivity and Specificity of the MTS Tetrazolium
Assay for Detecting the in vitro Cytotoxicity of 20 Chemicals Using Human Cell Lines. Toxicology.
1997 Dec;124(3):179-92.
15. Huang KT, Chen YH, Walker AM. Inaccuracies in MTS Assays: Major Distorting Effects of
Medium, Serum Albumin, and Fatty Acids. Biotechniques. 2004 Sep;37(3):406,408,410-2.
16. O’Toole SA, Sheppard BL, McGuinness EP, Gleeson NC, Yoneda M, et al. The MTS Assay
as An Indicator of Chemosensitivity/Resistance In Malignant Gynaecological Tumours. Cancer
Detect Prev. 2003;27(1):47-54.
17. Pozarowski P, Grabarek J, Darzynkiewic Z. Flow Cytometry of Apoptosis. Curr Protoc
Cytom. 2003 Aug;7:7-19.
18. Bertho AL, Santiago MA, Coutinho SG. Flow Cytometry in the Study of Cell Death. Mem
Inst Oswaldo Cruz. 2000 May-Jun;95(3):429-33.
19. Pozarowski P, Darzynkiewicz Z. Analysis of Cell Cycle by Flow Cytometry. In: Checkpoint
Controls and Cancer. Humana Press, 2004. 301-11.
20. Joseph B, Priya RM. Phytochemical and Biopharmaceutical Aspects of Psidium guajava
(L.) Essential Oil: A Review. Research Journal of Medicinal Plant. 2011;5(4):432-42.
21. Manosroia J, Dhumtanoma P, Manosroia A.Anti-proliferative activity of essential
oil extracted from Thai medicinal plants on KB and P388 cell lines. Cancer Lett. 2006
Apr;235(1):114-20.
22. Adeyemi OS, Akanji MA, Oguntoye SA. Ethanolic Leaf Extract of Psidium Guajava:
Phytochemical and Trypanocidal Activity in Rats Infected with Trypanosoma Brucei Brucei.
Journal of Medicinal Plants Research. 2009;3(5):420-23.
23. Le Marchand L. Cancer preventive effects of flavonoids—A review. Biomed
Pharmacother. 2002;56(6):296–301.
24. Wenying R, Qiau Z, Wang H, Zhu L, Zhang L. Flavonoids: Promising AnticancerAgents.
Medicinal Research Reviews. 2003;23( 4):519-34.
Melisa Faculty of Dentistry, University Prof. Dr. Moestopo, Jakarta,
IndonesiaEmail: [email protected]
21 DENTAL STUDENTS’ RESEARCH
IMPLANT RETAINED AURICULAR PROSTHESIS: A CLINICAL REPORTDinesh Rokaya, B.D.S.1; Phonepaseut Sitthiphan, D.D.S.1; Pokpong Amornvit, D.D.S, M.Sc2; Arunee Tirasriwat, D.D.S., M.Sc.2; Sita
Thawaranunta, D.D.S., M.S., M.Sc3; Theerathavaj Srithavaj, B.S., D.D.S, M.S.3
1 Resident, Maxillofacial Prosthetic Service, Faculty of Dentistry, Mahidol University, Bangkok, Thailand
2 Instructor, Maxillofacial Prosthetic Service, Faculty of Dentistry, Mahidol University, Bangkok, Thailand
3 Assistant Professor, Maxillofacial Prosthetic Service, Faculty of Dentistry, Mahidol University, Bangkok, Thailand
Authors declare no conflict of interest
Abstract
Ears have an important role in function and aesthetics. The loss of the ear can lead to psychological and hearing problems. Although several reconstructive techniques exist for auricular defect, the use of implants to anchor auricular prosthesis presents a suitable alternative. This article presents a case of right auricular defect which was result of trauma for which two bone-anchored implants were placed. Hader bar with ERA attachments were used for retention of the silicone auricular prosthesis.
Key Words: Auricular defect, ERA, Extraoral implant, Hader bar, Silicone prosthesis
Introduction
Auricular defects may be congenital or acquired which may result from tumors or accidents (1-5). The auricular defect cause esthetic, functional and psychosocial problems for the patient. Rehabilitation of the defect can be achieved by surgical reconstruction or prosthetic rehabilitation. Auricular prosthesis using extraoral implants have been used to offer better retention compared to adhesives or frameworks. However, the main limitation with extraoral implants, including implant retained auricular prosthesis, is the need for hygiene maintenance of the soft tissue around the implants (5). Though the failure rate of the auricular implants due to peri-implantitis is low, it may lead to complications such as bleeding, pain, and discomfort (6-8).
This article presents a case report of implant retained medical grade RTV Silicone auricular prosthesis.
Clinical Report
A 40-year-old male patient was referred to the Maxillofacial Prosthetics Service, Mahidol University for the prosthetic rehabilitation of his right auricular defect which resulted from trauma (Figure 1). On examination, the partial antihelix was remaining. The treatment plan consisted of fabrication of implant retained right auricular prosthesis using Hader bar with ERA attachments in order to obtain a good retention.
After evaluating of the computerized tomography (CT) scan, the first stage surgery was performed with the placement of two (3.7 X 4 mm) craniofacial implants (Entific, Gothenburg, Sweden) in the temporal bone. After 7 months, second stage surgery was performed with a partial thickness skin graft and placement of 5.5 mm abutments (Figure 2).
After 3 weeks, an impression of the defect was made with impression copings (Figure 3-5) using polyvinyl siloxane impression material (3M ESPE, Express, 3M, USA). The impression was removed (Figure 6) and the cast was poured in Type IV die stone (Lafarge Prestia, Meriel, France). Then, Hader bar was fabricated and 2 ERAs and lip were chosen for retention of the auricular prosthesis. (Figure 7). Subsequently, heat resin (Vertex-Dental, Zeist, Netherlands) substructure was fabricated where 1 clip and ERA male parts were attached to it. Wax pattern was sculptured and tried on the patient (Figure 8-9). It was checked for the fit and esthetic. Then, the mould was made from die stone. On next visit after 1 week, the room temperature vulcanizing (RTV) Silicon elastomer (MDX 4-4210, Dow Corning, USA) was mixed chairside and intrinsic coloration was done to simulate the patient’s normal skin color. Afterwards, the mixed silicone was packed at room temperature and allowed to set for 3 days according to the manufacturer’s instructions. After 3 days, the silicone prosthesis was secured, the excess materials were trimmed, and the prosthesis was tried on the patient. Extrinsic coloration was done to match the patient’s left ear. The final auricular prosthesis was delivered (Figure 10-12) to the patient, and the home care instructions were given.
On a recall visits after 1 month (Figure 13), a mild peri-implantitis was noted around the both implants (Figure 14). The peri-implantitis was managed by cleaning the soft tissues around implants, implant abutments, and the Hader bar with hydrogen peroxide (1:1 diluted with normal saline) and betadine. After 4 weeks, peri-implantitis in both implants was healed (Figure 15). The patient was strictly advised for hygiene maintenance of the implants and the prosthesis.

22DENTAL STUDENTS’ RESEARCH
Discussion
The use of craniofacial implants for retention of extraoral prostheses not only offers excellent support and retention, but also improves the patient’s appearance and the quality of life. Implant retained auricular prosthesis provides multiple advantages such as convenience, security, consistent retention and positioning, elimination of the need for adhesives which may cause tissue irritation, and maintenance of marginal integrity and longevity (9).
For an auricular prosthesis, two implants are sufficient to retain the prosthesis. Magnet and bar-clip retention are the two other forms of retention used in the auricular region. Use of magnet was not recommended in this case because though magnet may provide acceptable retention, it is less stable under the lateral force .(10). The bar-clip system provides good retention for the prostheses. However, bars may limit access for performing hygiene procedures. So, in our case, implant retained auricular prosthesis was indicated (11).
Numerous attachments are available for the retention of implant-retained prosthesis. Locator and O-Ring are also used. In addition to the prosthetic ear, implant-retained auricular prosthesis usually requires a bar-clip with other retentive elements like ERA to offer better retention. (9).
The factors that may cause peri-implantitis in extraoral
implants are thick skin graft, movement of skin around the abutment, bar-clip design for retention of the prosthesis, improper hygiene, humid environment, and growth of opportunistic microorganisms (12). In our case, peri-implantitis might be resulted from improper hygiene. This was managed with proper reinforcement of hygiene methods. The patient was satisfied with the prosthesis because of acceptable esthetic and excellent support and retention.
Conclusion
The implant retained silicone auricular prosthesis provides an esthetically and functionally acceptable outcome in patients with auricular defect. Hygiene maintenance is necessary for the success of the implant retained prosthesis.
Pokpong Amornvit, DDS, MScInstructor, Maxillofacial Prosthetics Service, Faculty of
Dentistry, Mahidol UniversityAddress: 6 Yothe Rd. Rajthevee Bangkok 10400 ThailandEmail: [email protected]
Figure 1. Frontal view of the patient with right auricular defect
Figure 2. Two abutments in temporal bone attached to fixtures
Figure 3. Impression copings over the abutments
Figure 4. Making Impression of the defect making with light body polyvinyl siloxane impression material
Figure 5. Making Impression with medium body polyvinyl siloxane impression material
Figure 6. Impression after removal from the defect side
Figure 7. Header bar with ERA placed in attachment
Figure 8. Wax-up try-in from front

23 DENTAL STUDENTS’ RESEARCH
Figure 9. Wax-up try-in from back
Figure 10. Patient with the final prosthesis
Figure 11. Prosthesis in place while opening the mouth
Figure 12. Final prosthesis from right lateral view
Figure 14. Periimplantitis around the implants on recall visit
Figure 15.Healed peri-implantitis after 4 weeks of maintaining hygiene.
Figure 13. Patient at follow-up visit
References
1. Nishimura RD, Roumanas E, Sugai T, Moy PK. Auricular prostheses and
osseointegrated implants: UCLA experience. J Prosthet Dent. 1995 Jun;73(6):553-8
2. Wang RR, Andres CJ. Hemifacial microstomia and treatment options for auricular
replacement: A review of literature. J Prosthet Dent. 1999 Aug;82(2):197-204.
3. Visser A, Raghoebar GM, Van Oort RP, Vissink A. Fate of implant-retained
craniofacial prosthesis: Lifespan and aftercare. Int J Oral Maxillofac Implants. 2008 Jan-
Feb;23(1):89-98.
4. Aydin C, Karakoca S, Yilmaz H, Yilmaz C. Implant-retained auricular prosthesis: An
assessment of implant success and prosthetic complications. Int J Prosthodont. 2008
May-Jun;21(3):241-4.
5. Ozturk N, Usumez A, Tosun Z. Implant-Retained Auricular Prosthesis: A Case Report.
Eur J Dent. 2010 Jan;4(1):71-4.
6. Russell D. Nishimura ER, Toshiro Sugai, Peter K. Moy. Auricular prostheses and
osseointegrated implants:UCLA experience. J Prosthet Dent. 1995 Jun;73(6):553-8.
7. Karakoca AC, Yilmaz H, Bal BT. Survival rates and periimplant soft tissue evaluation
of extraoral implants over a mean follow-up period of three years. J Prosthet Dent. 2008
Dec;100(6):458-64
8. Reyes TA, Granström G. Evaluation of implant losses and skin reactions around
extraoral bone-anchored implants: A 0- to 8-year follow-up. Otolaryngol Head Neck
Surg. 2000 Feb;122(2):272-6.
9. Schaaf NG, Kielich M. Implant-retained facial prostheses. In:McKinstry RL,
Fundamentals of facial prosthetics. Arlington: ABI Professional Publications; 1995.
10. De Vale V, Faulkner MG, Wolfaardt JF, Rangert B, Tan HK. Mechanical evaluation
of craniofacial osseointegration retention systems. Int J Oral Maxillofac Implants. 1995
Jul-Aug;10(4):491-8.
11. Reisberg DJ, Habakuk SW. Hygiene procedures for implant-retained facial
prostheses. J Prosthet Dent. 1995 Nov;74(5):499-502.
12. Klein M, Hohlfeld T, Moormann P, Menneking H. Improvement of epidermal
adhesion by surface modification of craniofacial abutments. Int J Oral Maxillofac
Implants. 2000 Mar-Apr;15(2):247-51.
24 DENTAL STUDENTS’ RESEARCH
PREVALENCE OF DENTAL ANXIETY AMONG SAUDI POPULATION IN BURAIYDAHRasha Alafaleg1
1 Rasha Salman Al-Afaleg,
Dental Student, Qassim University, Buraidah ,Qassim, Saudi Arabia
Authors declare no conflict of interest
Abstract
Purpose: Dental anxiety remains a barrier to dental treatment for many individuals. This study aimed to measure the prevalence of dental fear and anxiety among Saudi citizens in Buriydah, Qassim.
Methods: Data collected through a questionnaire-based cross-sectional survey conducted in different areas of Buriydah (n=1037; 41.1% males, 58.9% females). The first part of the questionnaire consisted of scoring of the Dental Anxiety Scale, Revised (DAS-R) based on Norman Corah’s dental questionnaire, and the second part containing dental concerns assessment to scale the anxiety over different dental procedures.
Results: The study revealed that the mean DAS-R score for study population was 10.16 ± 3.1 with statistically significant difference between males and females, as well as age groups and education level (p<0.05). The dental concerns assessment showed wide variation regarding degree of fear for different dental procedures. The highest percentage of fear was reported for teeth extraction (54.2%) and the lowest for X-ray taking (8.2%).
Conclusion: Females and young adults were found to have higher dental anxiety scores and were more likely to have higher dental fear for some clinical procedures.
Key words: Avoidance, Dental fear, Dental anxiety, Odontophobia, Prevalence
Introduction
Despite the technological advances made in modern dentistry, anxiety about dental treatment and fear of pain associated with it remain widespread (1). Dental anxiety denotes a state of apprehension that something dreadful is going to happen in relation to dental treatment, and it is often coupled with a sense of losing control (2). Dental fear and anxiety (DFA) are characterized by essential and inevitable emotion that appears as a response to various dental procedures (3). It varies in intensity from one patient to another, ranging from a simple nervousness to dental anxiety, which is
a sentiment of fear often unjustified and can disappear spontaneously or amplify, thus defining dental phobia (3).
Dental anxiety and phobia can also be distinguished by looking at the quantity or intensity of the anxiety experience and the patient’s capacity to cope with it. Patients who have dental anxiety can cope with the intensity of their anxiety and receive dental treatment. However, patients who have dental phobia cannot cope with the intensity of their anxiety and thus avoid treatment (4). Dental phobia is a particular form of fear, completely disproportionate to reality, which cannot be explained or voluntarily controlled; if it persists, it can in time induce permanent avoidance of provocative situations (3).
The most frequent causes of dental fear include: fear of pain by anticipation, of being deceived/betrayed, of losing control, fear of the unknown (through lack of information or communication), of invasive procedures, of a psychological aggression (scolding/criticizing), fear of repetition of negative past experiences, of the various dental instruments’ noises, of bleeding, of the unpleasant smells associated with the dental practice, fear of meeting unfriendly medical staff, and of being confined in small places (5). Moreover, studies have revealed that dental fear is a result of negative experiences of dental visits, and that dental fear and anxiety develop in childhood (6), but some studies have suggested that 30–50% of dental fear begins in adolescence or adulthood (6, 7).
Generally, the etiology of dental fear is multifactorial. The exogenous origin of dental fear can be seen as acquisition of fear as a function of direct or vicarious experiences. These experiences might not be the causes of the fear, but they might also be responsible for the development of fear among patients who have endogenous vulnerability to anxiety disorders and multiple fears (8). Development of fear can be seen as a continuum, at one end of the continuum requiring no learning and at the other end requiring a great deal of learning (9). Assessment of dental fear provides information on this psychological construct, which has been shown to predict dental attendance and to affect oral health (10). Numerous measures have been developed for identifying dentally anxious people and for assessing their level of dental fear (11-19).
Daily dental practice is often accompanied by stress, as dentists are restrained by a limited period of time for

25DENTAL STUDENTS’ RESEARCH
individual treatment, accurate diagnosis, pain and discomfort caused by dental diseases, patients being late or missing an appointment as well as communication problems when dealing with difficult patients (20). Dental fear in children has been recognized as a problem in patient management for many years. The effects of this fear have been shown to persist into adulthood, which can lead to dental avoidance (1). Dental avoidance in turn eventually may result in poorer oral health (21).
High dental anxiety has been associated with poor dental health measured as the numbers of decayed, filled or missing teeth. Greater numbers of decayed teeth are found among people with high dental fear compared to people with low dental fear (22, 23). Some studies showed an association between dental fear and subjective oral impacts and quality of life. In a community study made in Hong Kong, those with high dental fear were more likely to report subjective oral impacts than those with lower dental fear (23). In addition, in two studies that included patients at a dental clinic, those with higher dental anxiety more often reported subjective oral impacts than those with lower anxiety (24, 25).
The aim of this study was to measure the prevalence of dental fear and anxiety among Saudi citizens in Buriydah, Qassim.
Materials and methods:
A cross-sectional study through a questionnaire-based survey was conducted among a sample Saudi people living in Buriydah, Qassim Province.
I. Study Settings:Ethical approval for carrying out the present cross
sectional survey was obtained from the dental research center, college of dentistry, Qassim University.
The study area is Buriydah, capital of Qassim Province, 1290 sq. km with population 467,410. The target population for the present study comprised individuals aged 16- 65 years living in Buriydah. The inclusion criteria specified that individuals had to be
aged 16 - 65 years. Subjects who were uncooperative and those who filled incomplete questionnaires were excluded. The sample selected accounted for 1,300 individuals, among whom 1,037 participated in the study.
II. Questionnaire:The purpose of the study was explained to each participant,
and information was retrieved using a questionnaire. The questionnaire consisted of three parts: the first part was composed of items on demographic data: nationality, age, gender, and education level. The second part included the Norman Corah’s Dental Questionnaire (11). It is a four-item questionnaire that asks respondents to indicate their emotional reactions anticipating dental visit, in the waiting room, anticipating drilling, and anticipating scaling. Each question has five response alternatives. According to the individual’s choice, a = 1, b = 2, c = 3, d = 4, e = 5, which e=5 correspond as the highest score and a=1 as the lowest score. The total score is calculated (Total possible = 20) to rate the Dental Anxiety Scale, Revised (DAS-R) (Table 1). The third part contains Dental Concerns Assessment (26), which scales concerns or anxiety over a list of dental procedures.
The questionnaire was written in English and translated into the local language, Arabic. It was then back-translated to English and found to be valid.
III. Data Collection Method:
Approvals for data collection were obtained from authorities of selected locations. Individuals were approached in both public and private dental clinics, as well as malls and secondary schools. The purpose of the study was explained to each participant. Individuals were not under obligation to participate in the study. The questionnaires were distributed and collected back again after being completed. The questionnaires were distributed during the period from September to November 2011.
Score Dental Anxiety
9-12 Moderate anxiety but have specific stressors that should be dis-cussed and managed
13-14 High anxiety
15-20Severe anxiety (or phobia). May be manageable with the Dental. Concerns Assessment but might require the help of a mental health therapist.
Table 1. Scoring of Dental Anxiety Scale, Revised (DAS-R)

26 DENTAL STUDENTS’ RESEARCH
I V. Statistical Analysis:
Collected Data was analyzed using the Statistical Program for Social Sciences (SPSS) version 19. Serial numbers (1-1037) were given for each questionnaire sheet. The questions were given variable names from Q1 to Q4 for part 2 and (1- 24) for questions of the third part of the questionnaire. Then the choices in each question got a numeric value relevant to the corresponding answer of each participant.
Descriptive statistics were performed using frequency count and percentages. T-test, ANOVA and Chi square tests were performed to determine the difference between the study groups at the 5% level of significance.
Results
The survey was conducted with an overall response rate of 79.8%, in which out of the total 1300 distributed questionnaire 1037 questionnaire returned back. Table 2 shows the socio-demographic and background characteristics of the study population.
Mean DAS-R for study population:Table 3 shows moderate dental anxiety of the study
population who had a mean DAS-R of 10.16 ± 3.1; a significant difference between males (9.75 ± 3.251) and females (10.45 ± 2.956) at p ≤ 0.001 was found, which shows females suffered from more dental anxiety.
Regarding age groups, (Table 4) the mean DAS-R showed statistically significant differences between (16y-20y) and (20y -40y) age groups (p = 0.017), as well as between (16y-20y) and (40y -60y) age groups (p = 0.014). No statistically significant differences were found between the other groups (p > 0.05).
Concerning the level of education, Table 5 shows statistically significant differences between the mean DAS-R of subjects with postgraduate education and the mean DAS-R of all other groups except whom holding Bachelor’s degree.
Dental Concerns Assessment: Table 6 shows the percentage of high fear action
for different dental procedures. Teeth extraction was the most frequent dental procedure causing high fear (58.05%). Root canal treatment was the second frequent procedure causing high fear followed by injection of anesthesia (51.98% and 39.44%, respectively). Rubber
dam application and x-ray taking were the lowest frequent procedures to give high fear (9.35% and 8.2%, respectively).
Table 7 shows the relation between gender and fear of different dental procedures. A statistically significant difference was found between males and females regarding their fear of anesthesia injections; 43.4% of females showed high fear of injection, while only 33.8% of males had high fear of injections (p = 0.015). In addition, there was a significant difference for vomiting during impression taking as 15.3% of males were highly afraid of vomiting and 41.1% had low fear, while 19.5% of females had high fear from vomiting during impression taking and 33.1% had low fear (p = 0.034). The fear of x-ray taking also showed a significant difference between males and females; 9.6% of males had high fear, while only 7% of females had the same feeling (p = 0.005). Moreover, The fear of root canal treatment showed a significant difference between males and females; a higher percentage of root canal fear was found in females (53.5% high fear), while 44.8% of males had a high fear of root canal treatment (p = 0.046).
Table 8 shows the relation between age groups and fear of different dental procedures. The difference was statistically significance in anesthesia feeling (p = 0.001); 40.1% of the younger age group (16-20 years) had low fear of this procedure, unlike (20-40y), (40-60y) and (more than 60 y) age groups that 35%, 25.1% and 26.3% of them had low fear for this procedure, respectively. A statistically significant difference was found between age groups regarding the fear of anesthesia injections (p = 0.001), the highest percentage of high fear was for (40-60y) age group (51.5%). The fear of x-ray taking showed a significant difference between age groups (p = 0.013); the highest percent for high fear was among the elderly subjects (more than 60 years) (15.8%), and both (16-20y) and (20-40y) age groups were highly afraid of this procedure (9.4%). Fear from cold air showed a statistically significant difference; 41.5% of (40-60y) age group, 35.3% of (20-40y) group, 31.6% of (more than 60 y) group, and 28.1% of (16-20y) group were highly afraid of the pain from Air Syringe. Most subjects of all age groups showed high fear of root canal treatment with a significant difference (p = 0.016) between them as 55.8%, 49.1%, 55% and 57.9 % of high fear were reported in (16-20y), (20-40y), (40-60y), and (more than 60) age groups, respectively. The
Male (n=426) Female (n=611) Total (n= 1037)
Mean DAS-R 9.75 ±3.251 10.45±2.956 10.16 ± 3.1
t= 3.533, p<0.001 *
Table 3. Relation between DAS-R and Gender* Statistically significant at p ≤ 0.05t: for independent t-test

27DENTAL STUDENTS’ RESEARCH
(40-60y) age group showed the highest percent of fear from multiple visits to the dentist (43.9%) in comparison to the other groups (p = 0.030). A significant difference between age groups was found regarding the fear of the cost (p < 0.001), as 57.9% of (more than 60y), 47.4% of (40-60 y), 33.4% of (20-40y), and 14.2% of (16-20y) age groups had high fear of dental treatment cost. Being shy from the personal oral hygiene status was statistically differed between the age groups, 50.2% of (16-20y) and 46.4% of (20-40y) age groups had a low fear, while 30.4% of (40-60y) and 15.8% of (more than 60y) age groups had high fear of being shy from their own personal oral hygiene status.
Discussion:
Dental fear is commonly suggested to be multifactorial and multidimensional, consisting of behavioral, physiological, and cognitive components (27, 28). It is a unique fear in comparison to other specific fears because it has a stronger component of bodily injury than many other fears. The oral region is a very sensitive area and includes more receptors of somatic sensation than any other part of the human body (29). This study measured the prevalence of dental fear and anxiety among Saudi citizens in Buriydah, Qassim, through questionnaire-based survey conducted in different areas of Buriydah.
Gender differences in dental fear are controversial. In the present study there was a statistically significant difference between males and females in DAS-R, like several studies that have reported similar findings (2, 30, 31). On the other hand, some studies have found no gender differences in dental fear (32, 33).
The results revealed that the younger age groups have a significant more fear with no significant gender effect has been found, which is in line with the study of Neverlien in 1994 (34). On the other hand, a longitudinal birth cohort up to the age of 26 years showed that one third of the
study subjects first experienced dental anxiety during childhood or early adolescence, one third during late adolescence, and one third during early adulthood (35).
The relationship between sensitivity to pain and fear of pain has been shown to be associated with dental anxiety (36, 37). In the current study, 58.05% of the sample population had high fear from teeth extraction, and 52.98% from root canal treatment which thought by many as the most painful dental procedures. A previous study showed that adults who expected more pain before restorative treatment were more anxious than adults who expected less pain, and anxious subjects also experienced more pain during treatment than non-anxious subjects did. In addition, adults who are sensitive to anxiety have been suggested to be prone to exaggerate their expectations of pain (37).
The study also showed other characteristic of dental anxiety that was not in general reported in the literature. Almost half of the sample (39.44%) was afraid of anesthesia injection. A statistically significant difference was found between males and females with the females showing a higher degree of fear (43.4%) compared to males (33.8%), which is in accordance with previous studies (15, 30).
Patients should be encouraged to ask their questions during the first appointment. As 18.8% of the sample have high fear from asking the dentist their questions. Patients should not embarrass or be judged as other study illustrated that embarrassment is a complex dental anxiety manifestation showing clinical differences by complaint characteristics and perceived intensity (37).
Although the avoidance of the dentist is a well-known finding associated with severe dental anxiety, this study did not show a correlation between the frequency of visits to the dentist and severity of dental anxiety. However, this study showed that 33.2% of the sample population has high fear of going to the dentist because it might result in several visits.
Age Groups
16 -20 y 20-40 y 40-60 y More than 60 F (p)
DAS-R10.72 ±3.366 10.03 ± 3.086 9.78 ± 3.167 9.95 ± 3.291 3.92
(0.008)*Mean ± SD
R1(p) 0.017* 0.014* 0.736
R2(p) 0.814 1.000
R3 (p) 0.997
Table 4. Relation between Age groups and DAS-R Score* Statistically significant at p ≤ 0.05; F: for ANOVA Test; R1: Post Hoc Turkey HSD test between 16-20 y and other age groups. ; R2: Post Hoc Turkey HSD
test between 20-40 y and other groups; R3: Post Hoc Turkey HSD test between 40-60 y and other groups

28 DENTAL STUDENTS’ RESEARCH
Conclusion
Generally, the Saudi population in Buriydah has a moderate dental fear with significantly higher dental anxiety scores among females. Also, it was found that young adults had a higher dental anxiety scores and were more likely to have higher dental fear for some clinical procedures. Extraction and Root canal treatment were the dental procedure with higher dental fear among Saudi population in Buriydah. Painful irritants and confidence in dentist are the most significant factors behind the dental fear.
Acknowledgements
I would like to thank Dr. Ramy elmoazen and show my sincere appreciation for supervising my research. It’s truly been a pleasure working with you , thank you for all your effort and for being patient with me .
References
1. Skaret E, Raadal M, Berg E, Kvale G. Dental anxiety and dental avoidance among
12 to 18 year olds in Norway. European journal of oral sciences. 1999 Dec;107(6):422-8.
2. Klingberg G, Broberg AG. Dental fear/anxiety and dental behaviour management
problems in children and adolescents: a review of prevalence and concomitant
psychological factors. International journal of paediatric dentistry / the British
Paedodontic Society [and] the International Association of Dentistry for Children. 2007
Nov;17(6):391-406.
3. Chapman HR, Kirby-Turner NC. Dental fear in children--a proposed model. British
dental journal. 1999 Oct 23;187(8):408-12.
4. Freeman R. A fearful child attends: a psychoanalytic explanation of children’s
responses to dental treatment. International journal of paediatric dentistry / the
British Paedodontic Society [and] the International Association of Dentistry for
Children. 2007 Nov;17(6):407-18.
5. Klaassen MA, Veerkamp JS, Hoogstraten J. Dental fear, communication, and
behavioural management problems in children referred for dental problems.
International journal of paediatric dentistry / the British Paedodontic Society [and]
the International Association of Dentistry for Children. 2007 Nov;17(6):469-77.
6. Locker D, Liddell A, Dempster L, Shapiro D. Age of onsetof dental anxiety.
Journal of dental research. 1999 Mar;78(3):790-6.
7. Ost LG. Age of onset in different phobias. Journal of abnormal psychology.
1987 Aug;96(3):223-9.
8. Armfield JM. Cognitive vulnerability: a model of the etiology of fear. Clinical
psychology review. 2006 Oct;26(6):746-68.
9. Marks I. Innate and learned fears are at opposite ends of a continuum of
associability. Behav Res Ther.40:165-7.
10. Kvale G, Berggren U, Milgrom P. Dental fear in adults: a meta-analysis of
behavioral interventions. Community dentistry and oral epidemiology. 2004
Aug;32(4):250-64.
11. Corah NL. Development of a dental anxiety scale. Journal of dental
research. 1969 Jul-Aug;48(4):596.
12. leinknecht RA, Klepac RK, Alexander LD. Origins and characteristics of fear of
dentistry. J Am Dent Assoc. 1973 Apr;86(4):842-8.
13. Kleinknecht RA, Thorndike RM, McGlynn FD, Harkavy J. Factor analysis of the
dental fear survey with cross-validation. J Am Dent Assoc. 1984 Jan;108(1):59-61.
14. Moore R, Berggren U, Carlsson SG. Reliability and clinical usefulness of
psychometric measures in a self-referred population of odontophobics. Community
dentistry and oral epidemiology. 1991 Dec;19(6):347-51.
15. Schuurs AH, Hoogstraten J. Appraisal of dental anxiety and fear
questionnaires: a review. Community dentistry and oral epidemiology. 1993
Dec;21(6):329-39.
16. Humphris GM, Morrison T, Lindsay SJ. The Modified Dental Anxiety
Scale: validation and United Kingdom norms. Community dental health. 1995
Sep;12(3):143-50.
17. Newton JT, Buck DJ. Anxiety and pain measures in dentistry: a guide to their
quality and application. J Am Dent Assoc. 2000 Oct;131(10):1449-57.
18. Smith TA, Heaton LJ. Fear of dental care: are we making any progress? J Am
Dent Assoc. 2003 Aug;134(8):1101-8.
19. Heaton LJ, Carlson CR, Smith TA, Baer RA, de Leeuw R. Predicting anxiety
during dental treatment using patients’self-reports: less is more. J Am Dent Assoc.
2007 Feb;138(2):188-95; quiz 248-9.
20. Kan M, Ishikawa T, Nagasaka N. A study of psychological stress created in
Levels of Education
Read & Write Basic Secondary Bachelor’s Postgraduate F (p)
DAS-R10.56 ± 3.636 10.56 ± 3.115 10.52 ± 3.218 9.96 ± 3.112 8.91 ± 3.315 3.92
(0.008)*Mean ± SD
R1(p) 1 1 0.825 0.008*
R2(p) 1 0.229 0.008*
R3 (p) 0.129 0.005*
R4 (p) 0.129
Table 5. Relation between Level of Education and DAS-R Score* Statistically significant at p ≤ 0.05
F: for ANOVA Test; R1: p for Post Hoc Turkey HSD test between read & write and other groups.; R2: p for Post Hoc Turkey HSD test between basic
education and other groups; R3: p for Post Hoc Turkey HSD test between secondary education and other groups; R4: p for Post Hoc Turkey HSD test between
bachelor’s education and other groups

29DENTAL STUDENTS’ RESEARCH
dentists by children during pediatric dental treatment. ASDC journal of dentistry for
children. 1999 Jan-Feb;66(1):41-8, 12-3.
21. Skaret E, Raadal M, Kvale G, Berg E. Missed and cancelled appointments among
12-18-year-olds in the Norwegian Public Dental Service. European journal of oral
sciences. 1998 Dec;106(6):1006-12.
22. Hagglin C, Hakeberg M, Ahlqwist M, Sullivan M, Berggren U. Factors associated
with dental anxiety and attendance in middle-aged and elderly women. Community
dentistry and oral epidemiology. 2000 Dec;28(6):451-60.
23. Ng SK, Leung WK. A community study on the relationship of dental anxiety
with oral health status and oral health-related quality of life. Community dentistry and
oral epidemiology. 2008 Aug;36(4):347-56.
24. Mehrstedt M, John MT, Tonnies S, Micheelis W. Oral health-related quality of life
in patients with dental anxiety. Community dentistry and oral epidemiology. 2007
Oct;35(5):357-63.
25. Vermaire JH, de Jongh A, Aartman IH. Dental anxiety and quality of life: the
effect of dental treatment. Community dentistry and oral epidemiology. 2008
Oct;36(5):409-16.
26. Clarke J. Rustvold S. Norman Corah’s Dental Questionnaire and Dental Concerns
Assessment Oregon Health Sciences University School of Dentistry. 1993.
27. Kruger E, Thomson WM, Poulton R, Davies S, Brown RH, Silva PA. Dental caries
and changes in dental anxiety in late adolescence. Community dentistry and oral
epidemiology. 1998 Oct;26(5):355-9.
28. Karjalainen S, Olak J, Soderling E, Pienihakkinen K, Simell O. Frequent exposure
to invasive medical care in early childhood and operative dental treatment associated
with dental apprehension of children at 9 years of age. European journal of paediatric
dentistry : official journal of European Academy of Paediatric Dentistry. 2003
Dec;4(4):186-90.
29. Bear MF, BW C, MA P. Neuroscience: Exploring the Brain. 2nd ed. Baltimore:
Lippincott Williams & Wilkins.; 2001.
30. Raadal M, Milgrom P, Weinstein P, Mancl L, Cauce AM. The prevalence of dental
anxiety in children from low-income families and its relationship to personality traits.
Journal of dental research. 1995 Aug;74(8):1439-43.
31. ten Berge M, Veerkamp JS, Hoogstraten J, Prins PJ. Childhood dental fear in
the Netherlands: prevalence and normative data. Community dentistry and oral
epidemiology. 2002 Apr;30(2):101-7.
32. Majstorovic M, Skrinjaric I, Glavina D, Szirovicza L. Factors predicting a
child’s dental fear. Collegium antropologicum. 2001 Dec;25(2):493-500.
33. Van Meurs P, Howard KE, Versloot J, Veerkamp JS, Freeman R. Child coping
strategies, dental anxiety and dental treatment: the influence of age, gender and
childhood caries prevalence. European journal of paediatric dentistry : official
journal of European Academy of Paediatric Dentistry. 2005 Dec;6(4):173-8.
34. Neverlien PO. Dental anxiety, optimism-pessimism, and dental experience
from childhood to adolescence. Community dentistry and oral epidemiology.
1994 Aug;22(4):263-8.
35. Locker D, Thomson WM, Poulton R. Onset of and patterns of change
in dental anxiety in adolescence and early adulthood: a birth cohort study.
Community dental health. 2001 Jun;18(2):99-104.
36. van Wijk AJ, Hoogstraten J. The Fear of Dental Pain questionnaire:
construction and validity. European journal of oral sciences.. 2003 Feb;111(1):12-
8.
37. Klages U, Kianifard S, Ulusoy O, Wehrbein H. Anxiety sensitivity as predictor
of pain in patients undergoing restorative dental procedures. Community
dentistry and oral epidemiology. 2006 Apr;34(2):139-45.
Procedure No. %Extraction 602 58.05%RCT 539 51.98%Injection 409 39.44%Injury 392 37.80%Pain from air syringe 357 34.43%Multiple –visit 344 33.17%Not anaesthetized 343 33.08%Handpiece 325 31.34%Cost 324 31.24%Anesthesia Feeling 276 26.62%Scaling 273 26.33%OH status 244 23.53%Clinic- Odor 230 22.18%Treatment Needs 229 22.08%No given enough info 228 21.99%Can’t Ask 195 18.80%Vomiting-Impression 185 17.84%Mouth Fatigue 173 16.68%Not Serious 163 15.72%Criticism 159 15.33%Gingival _Examination 152 14.66%Panic attack 143 13.79%Rubber Dam 97 9.35%X-ray 85 8.20%
Table 6. Percentage of high fear for different dental procedures (Descending)
No.(N=1037)
%
Gender
Male 426 41.1%Female 611 58.9%
Age 16 - 20 y 267 25.7%20-40y 580 55.9%40-60 171 16.5%more than 60 19 1.8%
Education
Read & Write 34 3.3%Basic 156 15.0%Secondary 279 26.9%Bachelor’s 512 49.4%Postgraduate 56 5.4%
Table 2. Distribution of studied cases according to demographic data
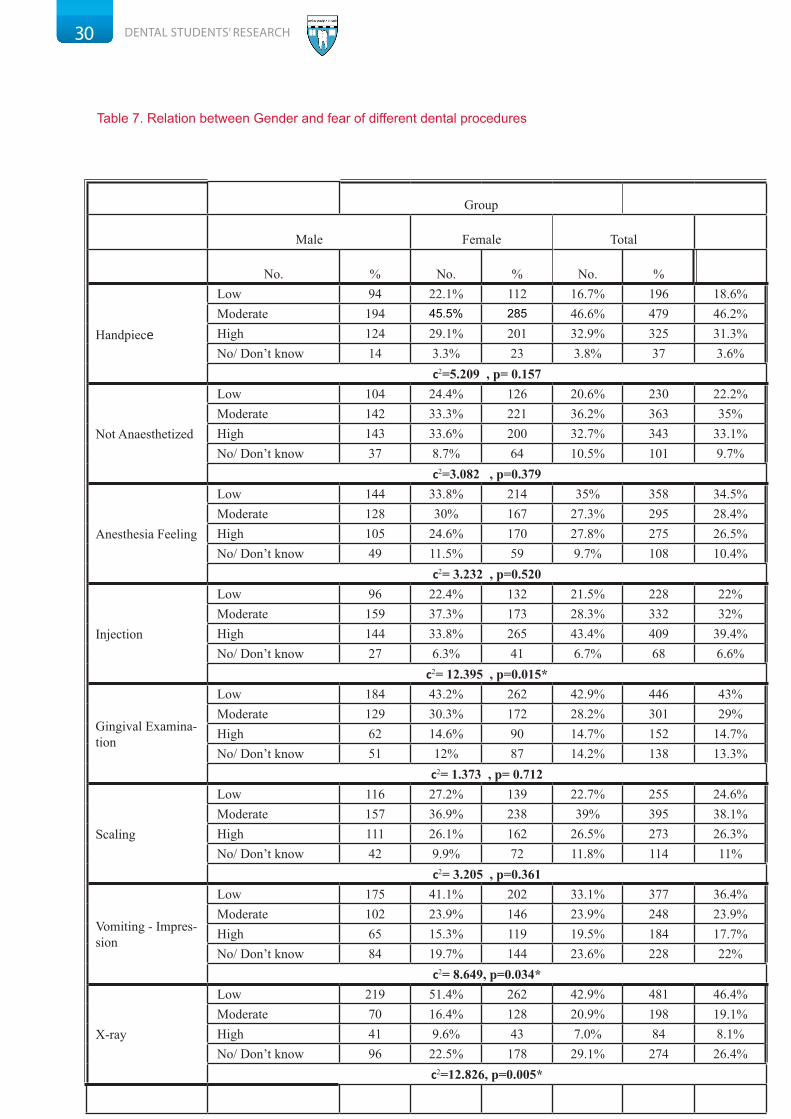
30 DENTAL STUDENTS’ RESEARCH
Group
Male Female Total
No. % No. % No. %
Handpiece
Low 94 22.1% 112 16.7% 196 18.6%Moderate 194 45.5% 285 46.6% 479 46.2%High 124 29.1% 201 32.9% 325 31.3%No/ Don’t know 14 3.3% 23 3.8% 37 3.6%
c2=5.209 , p= 0.157
Not Anaesthetized
Low 104 24.4% 126 20.6% 230 22.2%Moderate 142 33.3% 221 36.2% 363 35%High 143 33.6% 200 32.7% 343 33.1%No/ Don’t know 37 8.7% 64 10.5% 101 9.7%
c2=3.082 , p=0.379
Anesthesia Feeling
Low 144 33.8% 214 35% 358 34.5%Moderate 128 30% 167 27.3% 295 28.4%High 105 24.6% 170 27.8% 275 26.5%No/ Don’t know 49 11.5% 59 9.7% 108 10.4%
c2= 3.232 , p=0.520
Injection
Low 96 22.4% 132 21.5% 228 22%Moderate 159 37.3% 173 28.3% 332 32%High 144 33.8% 265 43.4% 409 39.4%No/ Don’t know 27 6.3% 41 6.7% 68 6.6%
c2= 12.395 , p=0.015*
Gingival Examina-tion
Low 184 43.2% 262 42.9% 446 43%Moderate 129 30.3% 172 28.2% 301 29%High 62 14.6% 90 14.7% 152 14.7%No/ Don’t know 51 12% 87 14.2% 138 13.3%
c2= 1.373 , p= 0.712
Scaling
Low 116 27.2% 139 22.7% 255 24.6%Moderate 157 36.9% 238 39% 395 38.1%High 111 26.1% 162 26.5% 273 26.3%No/ Don’t know 42 9.9% 72 11.8% 114 11%
c2= 3.205 , p=0.361
Vomiting - Impres-sion
Low 175 41.1% 202 33.1% 377 36.4%Moderate 102 23.9% 146 23.9% 248 23.9%High 65 15.3% 119 19.5% 184 17.7%No/ Don’t know 84 19.7% 144 23.6% 228 22%
c2= 8.649, p=0.034*
X-ray
Low 219 51.4% 262 42.9% 481 46.4%Moderate 70 16.4% 128 20.9% 198 19.1%High 41 9.6% 43 7.0% 84 8.1%No/ Don’t know 96 22.5% 178 29.1% 274 26.4%
c2=12.826, p=0.005*
Table 7. Relation between Gender and fear of different dental procedures
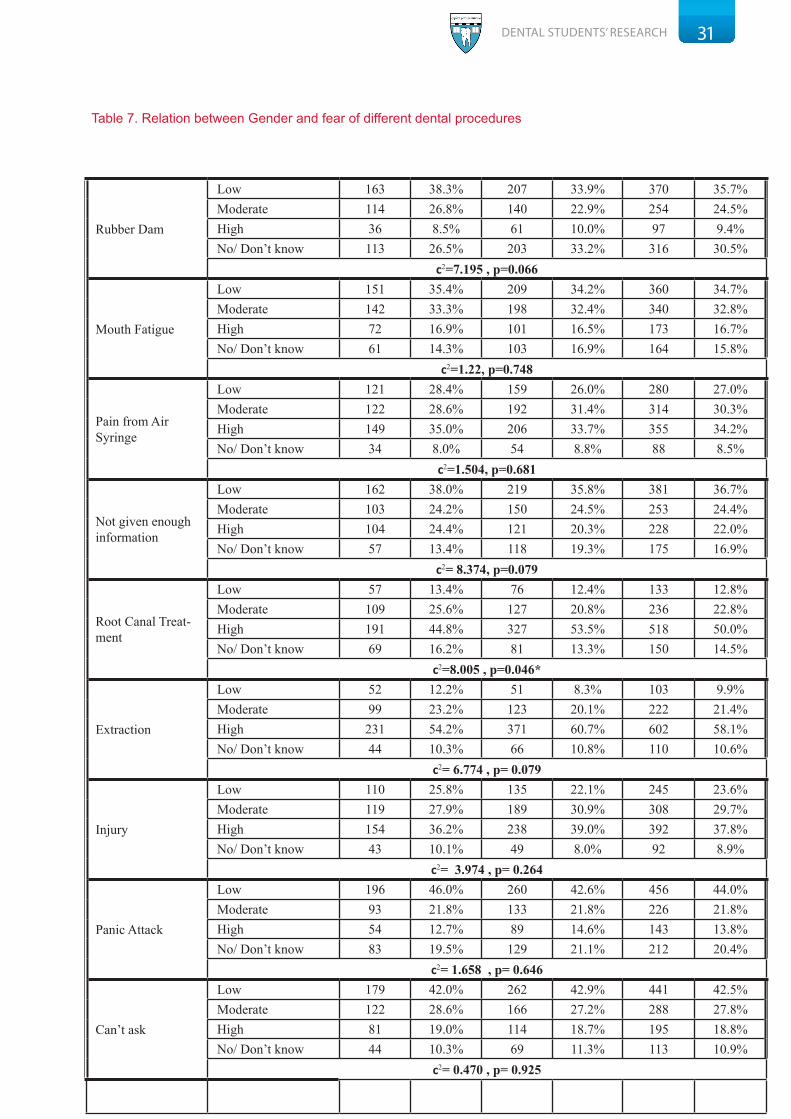
31DENTAL STUDENTS’ RESEARCH
Rubber Dam
Low 163 38.3% 207 33.9% 370 35.7%Moderate 114 26.8% 140 22.9% 254 24.5%High 36 8.5% 61 10.0% 97 9.4%No/ Don’t know 113 26.5% 203 33.2% 316 30.5%
c2=7.195 , p=0.066
Mouth Fatigue
Low 151 35.4% 209 34.2% 360 34.7%Moderate 142 33.3% 198 32.4% 340 32.8%High 72 16.9% 101 16.5% 173 16.7%No/ Don’t know 61 14.3% 103 16.9% 164 15.8%
c2=1.22, p=0.748
Pain from Air Syringe
Low 121 28.4% 159 26.0% 280 27.0%Moderate 122 28.6% 192 31.4% 314 30.3%High 149 35.0% 206 33.7% 355 34.2%No/ Don’t know 34 8.0% 54 8.8% 88 8.5%
c2=1.504, p=0.681
Not given enough information
Low 162 38.0% 219 35.8% 381 36.7%Moderate 103 24.2% 150 24.5% 253 24.4%High 104 24.4% 121 20.3% 228 22.0%No/ Don’t know 57 13.4% 118 19.3% 175 16.9%
c2= 8.374, p=0.079
Root Canal Treat-ment
Low 57 13.4% 76 12.4% 133 12.8%Moderate 109 25.6% 127 20.8% 236 22.8%High 191 44.8% 327 53.5% 518 50.0%No/ Don’t know 69 16.2% 81 13.3% 150 14.5%
c2=8.005 , p=0.046*
Extraction
Low 52 12.2% 51 8.3% 103 9.9%Moderate 99 23.2% 123 20.1% 222 21.4%High 231 54.2% 371 60.7% 602 58.1%No/ Don’t know 44 10.3% 66 10.8% 110 10.6%
c2= 6.774 , p= 0.079
Injury
Low 110 25.8% 135 22.1% 245 23.6%Moderate 119 27.9% 189 30.9% 308 29.7%High 154 36.2% 238 39.0% 392 37.8%No/ Don’t know 43 10.1% 49 8.0% 92 8.9%
c2= 3.974 , p= 0.264
Panic Attack
Low 196 46.0% 260 42.6% 456 44.0%Moderate 93 21.8% 133 21.8% 226 21.8%High 54 12.7% 89 14.6% 143 13.8%No/ Don’t know 83 19.5% 129 21.1% 212 20.4%
c2= 1.658 , p= 0.646
Can’t ask
Low 179 42.0% 262 42.9% 441 42.5%Moderate 122 28.6% 166 27.2% 288 27.8%High 81 19.0% 114 18.7% 195 18.8%No/ Don’t know 44 10.3% 69 11.3% 113 10.9%
c2= 0.470 , p= 0.925
Table 7. Relation between Gender and fear of different dental procedures

32 DENTAL STUDENTS’ RESEARCH
Not serious
Low 190 44.6% 250 40.9% 440 42.4%Moderate 111 26.1% 153 25.0% 264 25.5%High 69 16.2% 94 15.4% 163 15.7%No/ Don’t know 56 13.1% 114 18.7% 170 16.4%
c2= 5.663 , p= 0.129
Criticism
Low 187 43.9% 243 39.8% 430 41.5%Moderate 93 21.8% 121 19.8% 214 20.6%High 72 16.9% 114 18.7% 186 17.9%No/ Don’t know 74 17.4% 133 21.8% 207 20.0%
c2= 4.393 , p= 0.222
Treatment Needs
Low 154 36.2% 222 36.3% 376 36.3%Moderate 127 29.8% 177 29.0% 304 29.3%High 97 22.8% 132 21.6% 229 22.1%No/ Don’t know 48 11.3% 80 13.1% 128 12.3%
c2= 0.896 , p= 0.827
Multiple visits
Low 133 31.2% 196 32.1% 329 31.7%Moderate 105 24.6% 167 27.3% 272 26.2%High 151 35.4% 193 31.6% 344 33.2%No/ Don’t know 37 8.7% 55 9.0% 92 8.9%
c2= 1.903 , p= 0.593
Clinic- Odor
Low 189 44.4% 276 45.2% 465 44.8%Moderate 106 24.9% 138 22.6% 244 23.5%High 93 21.8% 137 22.4% 230 22.2%No/ Don’t know 38 8.9% 60 9.8% 98 9.5%
c2=0.8536 , p= 0.837
Cost
Low 161 37.8% 233 38.1% 394 38.0%Moderate 88 20.7% 145 23.7% 233 22.5%High 146 34.3% 178 29.1% 324 31.2%No/ Don’t know 31 7.3% 55 9.0% 86 8.3%
c2= 4.086 , p= 0.252
OH-Status
Low 188 44.1% 284 46.5% 472 45.5%Moderate 103 24.2% 138 22.6% 241 23.2%High 106 24.9% 138 22.6% 244 23.5%No/ Don’t know 29 6.8% 51 8.3% 80 7.7%
c2=1.912 , p=0.591
Table 7. Relation between Gender and fear of different dental procedures
Rasha Salman Al-Afaleg,Dental Student, Qassim University, Buraidah ,Kingdom of Saudi ArabiaEmail: [email protected]