Denitrification in Galveston Bay Final Report · Denitrification in Galveston Bay Final Report A...
91
Denitrification in Galveston Bay Final Report A final project report submitted to the Texas Water Development Board by: Dr. Samantha B. Joye· Department of Oceanography Texas A&M University College Station, TX, 77843-3146 and Dr. Soonmo An Marine Science Institute University of Texas at Austin Port Aransas, Texas 78373-1267 Tel: 351-749-6719 Fax: 512-749-6777 E-mail: [email protected] *Present Address: Department of Marine Sciences, The University of Georgia, Athens, Georgia, 30602-3636; Tel: 706-542-5893; Fax: 706-542-5888; E-mail: [email protected] TWDB Final Report June 1999
Transcript of Denitrification in Galveston Bay Final Report · Denitrification in Galveston Bay Final Report A...

Denitrification in Galveston Bay Final Report
A final project report submitted to the Texas Water Development Board
by:
Dr. Samantha B. Joye· Department of Oceanography
Texas A&M University College Station, TX, 77843-3146
and
Dr. Soonmo An Marine Science Institute
University of Texas at Austin Port Aransas, Texas 78373-1267
Tel: 351-749-6719 Fax: 512-749-6777
E-mail: [email protected]
*Present Address: Department of Marine Sciences, The University of Georgia, Athens, Georgia, 30602-3636; Tel: 706-542-5893; Fax: 706-542-5888; E-mail: [email protected]
TWDB Final Report June 1999

Table of Contents
List of Figures and Tables
Preface and acknowledgements
I. Introduction
II. Methods
A. Study sites
Table of Contents
B. Water column and sediment variables
C. Benthic chamber incubations
III. Results and Discussion
A. Properties of the water column
1. Temperature, salinity, pH, and oxygen
2. Nutrients
B. Pore water nutrients and N :P ratios
C. Sediment metabolism
1. Benthic fluxes of nutrients and gases
page number
11
iii
2. Spatio-temporal patterns of denitrification
7
7
10
11
12
12
12
29
38
48
48
51
57
61
68
70
74
78
83
3. Nitrification and benthic primary production
4. Conceptual framework and modeling
5. Environmental controls on denitrification
6. Statistical analysis
7. Galveston bay N budget
IV. Concluding Remarks
V. References
TWDB Final Report June 1999

Joye & An pg. ii
List of Fi2ures and Tables: page number
Figure I (A & B): Map of Galveston Bay Sampling Stations
Table 1: Summary of sample locations and environmental parameters
Figure 2 (A- K): Aug. 1998 hydrographic data
Figure 3 (A- D): Aug. 1998 salinity gradient - diss. 0 2 and salinity
Figure 4 (A- L): Nov. 1998 hydrographic data
Figure 5 (A- D): Nov. 1998 salinity gradient - diss. 0 2 and salinity
Figure 6: Nov. diss. 0 2 and salinity in Tx. City and the East Bay
Figure 7: Surface-bottom difference in diss. 0 2, 11197-10/98
Table 2: Surface-bottom difference in nutrient cone., 11197-10/98
Figure 8 (A- J): Surface-bottom difference in nutrient concentration
Figure 9 (A- C): Pore water nutrient profiles, Nov. 1997
Figure 10 (A- C): Pore water nutrient profiles, Jan. 1998
Figure 11 (A -F): Pore water nutrient profiles, Apr. 1998
Figure 12 (A- F): Pore water nutrient profiles, Aug. 1998
Figure 13 (A- F): Pore water nutrient profiles, Oct. 1998
Table 3: Benthic flux data, 1996- 1998.
Table 4: Percent of benthic denitrification coupled to nitrification
Figure 14: Temporal variation in benthic fluxes
Figure 15: Average denitrification rates
Table 5: Modeled remineralization rates
Figure 16: Conceptual schematic of linkages between N cycling
and photosynthesis
Table 6: Analysis of variance results
Figure 17: Principal component analysis results
Figure 18: Whole bay model of denitrification and N removal
Table 7: Annual N budget for Galveston Bay
8, 9
13, 14
16-19
20
21-24
25
27
28
31
33-36
39
40
41-42
44-45
46-47
52
53
54
58
67
69
71
73 75
77
TWDB Final Report May 1999

Joye & An pg. iii
Preface and Acknowledgements
The following report presents an overview of three years of research on
denitrification in Galveston Bay, Texas. Portions of this report have been adapted
from the Ph. D. dissertation of Soonmo An (Texas A&M University, May 1999).
This work was supported by contracts to S. B. Joye from the Texas Water
Development Board (TWDB 96-167, TWDB 97-218, and TWDB 98-239) and
grants to S. B. Joye from the National Science Foundation (OCE 96-96054 and
OCE 98-96216). We thank L. Alford, S. Carini, R. Downer, S. Escorcia, J.
Hohman, R. Lee, K. Mace, A. Pichachy, S. Ravula and S. Miller for assistance in
the field and in the laboratory related to this project. SBJ would like to thank D.
Brock, P. Eldridge, J. Pinckney and L. Cifuentes for stimulating and insightful
discussions about the Galveston Bay ecosystem.
TWDB Final Report May 1999

Joye & An pg. 1
I. Introduction
Coastal environments support extensive biodiversity and provide habitats
for valuable commercial fish stock. They house large reserves of mineral resources
(petroleum, natural gas, phosphates) and support recreational industries that often
form the financial backbone of smaller coastal communities. These ecosystems are
inherently complex: their physical, biological and chemical dynamics are tightly
coupled and are characterized by a multitude of feedback mechanisms that operate
on a variety of spatial and temporal scales. For the appropriate management and
restoration of estuaries, a comprehensive understanding of source and sink terms
of nutrients and materials is essential (Wollast 1983; McClelland and Valiela
1997). The fundamental understanding of these ecosystems therefore requires a
process-oriented, integrated and comparative approach. We have used this
approach to examine N cycling in Galveston Bay, Texas.
Nitrogen availability frequently limits primary production in marine
environments, including estuaries (Ryther and Dunstan 1971; Capone and Kiene
1988). Denitrification affects N availability for primary production by
transforming combined N to forms less available to biota (N2 or N20; Seitzinger
1988; 1990). The source of the N03 used for denitrification comes from water
column influx or in situ nitrification (Sorensen eta!. 1979; Nishio eta!. 1982;
Jenkins and Kemp 1984). In many estuarine environments, 70-100% ofN03-
consumed by denitrifiers is derived from in situ nitrification (Sorensen eta!. 1979;
Jenkins and Kemp 1984). This is commonly referred to as 'coupled' nitrification-
denitrification. Quantifying in situ rates ofN transformations, including N
regeneration, nitrification and denitrification, and identifying linkages between
these processes is essential for developing a system-level N budget for Galveston
TWDB Final Report June 1999

Joye & An pg. 2
Bay. Detailed N budgets provide a basis from which to predict the overall system
response to perturbation, including those resulting from cultural eutrophication.
The cycling of nitrogen (N) between the compartments of a given
ecosystem is driven primarily by microbially-mediated processes, including N
uptake, dinitrogen (N2) fixation, ammonification, N assimilation, nitrification,
dissimilatory nitrate reduction to ammonium, and denitrification (Blackburn and
Sorensen 1988; Cole and Ferguson 1988). Physical dynamics, such as advection,
sedimentation, and sediment resuspension, also contribute to the movement ofN
between compartments; however, microbially mediated processes ultimately
transform N between forms and thus regulate the magnitude ofN loss from an
ecosystem (via denitrification). Dinitrogen gas can serve as a nutritional N source
to only a limited suite of microorganisms (N2 fixers; Knowles 1982; Howarth et
a!. 1988; Zumft et a!. 1988). The process of denitrification thereby serves to
remove combined N from the biologically available pool as denitrifying
microorganisms transform nitrate or nitrite to gaseous forms, N2 or nitrous oxide
(NzO). Denitrifying bacteria respire nitrate when oxygen (02) concentrations are
below 20 !lM; Knowles 1982; Tiedje et a!. 1989); however, some 0 2 tolerant
denitrifiers are known (Robertson and Kuenen 1991 ).
Since denitrification is a sink for N, it is important to identify the
environmental and physiological factors that regulate the process. Denitrification
is frequently controlled by the N03 concentration but temperature and the
concentration of organic carbon, 0 2 and hydrogen sulfide (HS") also influence
activity (Koike and Sorensen 1988; Seitzinger 1988, 1990; Joye and Paerll993).
Sources of nitrate utilized by denitrifiers include nitrification, advection of nitrate
rich ground water, and/or diffusion or advection (bioturbation enhanced) ofN03
TWDB Final Report May 1999

Joye & An pg. 3
from the overlying water column (Vanderborght and Billen 1975; Grundmanis and
Murray 1977; Henriksen and Kemp 1988). Nitrification and bioturbation
(advective exchange) are often positively correlated because bioturbation can
stimulate nitrification by increasing 0 2 availability (Kristensen 1988). Together,
these two processes may regulate pore water N03 concentration and thus
influence denitrification rates (Jenkins and Kemp 1984; Andersen eta!. 1984;
Caffrey 1995).
A large fraction ofN cycling in coastal ecosystems occurs in sediment
environments. This is particularly true in shallow ecosystems like Galveston
Bay. In terms of its sedimentary cycle, N, as either particulate organic or
inorganic forms, is delivered to the sediment, where regeneration occurs (Joye et
a!. 1999). After internal regeneration processes, some portion is returned to the
water column as dissolved inorganic N [DIN= N02 + N03 + NH4]: this can be
considered the "regenerated" fraction. Another portion may be cycled through
nitrification and then denitrification which leads to the loss ofN gases (N2 or
N20); this can be considered the "denitrified" fraction. Finally, some portion of
regenerated NH4 may be permanently buried in sediment porewater. The buried
fraction represents a long term sink for N in the system. However, in the context
of nutrient regeneration and the sustenance of system production on the short
term, the difference between the regenerated and denitrified fractions is the most
important consideration (Joye eta!. 1999).
In many coastal systems, combined N loss occurs largely via coupled
denitrification. The coupled denitrification rate is a function of 1) the nitrification
rate, and, 2) the extent of coupling between nitrification and denitrification
(Jenkins and Kemp 1984; Seitzinger 1988). Denitrification rates in coastal
TWDB Final Report May 1999

Joye & An pg. 4
sediments range between 1 - 6 mmol N m·2 d-1 (Seitzinger 1988), while
nitrification rates range between 0- 5 mmol N m·2 d" 1 (Henriksen and Kemp
1988). Spatio-temporal variations in temperature, organic carbon supply, and 0 2
and Hs- concentration may affect nitrification and, thus indirectly influence
denitrification (Henriksen and Kemp 1988; Joye and Hollibaugh 1995) or coupling
between nitrification and denitrification (Nishio eta!. 1983; Jenkins and Kemp
1984; Christensen eta!. 1987; Caffrey and Kemp 1990; Kemp eta!. 1990;
Binnerup and Sorensen 1992).
The Galveston Bay estuarine ecosystem is the second largest estuarine
complex along the Texas coast. Galveston Bay is surrounded by an urbanized
metropolis. Approximately 3.5 million people inhabit the Galveston Bay
watershed, and, of those, roughly 20% live within 2 miles of the Bay or its tidal
tributaries. The edges of Galveston Bay also serve as home to 30% of the United
State's oil refining capacity and to the Port of Houston, the nation's 3rd largest
port. The impacts of industrial and population pressures on the Galveston Bay
ecosystem are numerous and the system has been altered significantly from its
pristine state.
The health coastal ecosystems depends greatly on watershed management.
A recent Texas Water Development Board (TWDB) Water Plan projects that the
state population will double over the next 25 years. More than half of this
estimated increase (36 million people) is expected to live along the coast. With
respect to Galveston Bay, the result of the increased freshwater demand may be a
shifting of freshwater and nutrients from riverine and agricultural runoff to more
inputs from urban-area wastewater discharges. This could mean higher nutrient
TWDB Final Report May 1999
Joye & An pg. 5
loadings that are delivered more uniformly compared to historical trends of pulsed
events of rainfall runoff and freshwater inflows.
Planning for the future of the Galveston Bay ecosystem requires
integrating the needs of the surrounding watershed (both metropolitan and
industrial uses) with the needs of the estuary. Changes in freshwater inflow result
in decreased particulate and dissolved nutrient inputs, modifications of salinity
structure, alterations of residence time, etcetera. Feedback and interaction
between these three parameters (nutrient inputs, salinity structure and residence
time) can, in tum, serve to regulate/influence internal nutrient cycling. Properly
modeling the ecological and geochemical responses of the Galveston Bay system
to changing freshwater inputs requires accurate measurements of processes made
over long (preferably seasonal) time scales.
In the process of determining estuary inflow requirements, preliminary
results have shown that nutrient loading may be as important a consideration as
inflows needed to maintain salinity gradients or other factors. Assessment of
nutrient requirements depends on adequate knowledge of the nutrient budgets of
the estuarine system, and work has been done to compile meaningful budgets for
Galveston Bay (Brocket a!. 1996). However, the budget exercise revealed areas,
such as knowledge of denitrification, where rates of important processes were not
well known. Without good knowledge of the way nutrient processes vary with
inflow and other parameters, the budgets were relatively static and not well suited
for predicting system behavior under different inflow regimes. The availability of
N often limits production in coastal ecosystems and denitrification can regulate N
levels in shallow coastal systems. Thus, a detailed understanding of the spatio-
TWDB Final Report May 1999

Joye & An pg. 6
temporal trends in denitrification activity must be included in any system level N
budget.
Previous estimates of denitrification in Galveston Bay sediments have
provided two strikingly different scenarios. The average denitrification rate was
found to be 480 J.!mol N m·2 d. 1 by Zimmerman and Benner (1994). Modeling of
these data suggests that denitrification removes 7% of the N on a bay-wide basis
(Brocket a!. 1996). In contrast, Rowe eta!. (submitted) estimated a bay-wide
average denitrification rate of 10 mmol N m-2 d. 1 from benthic flux O:N
stoichiometry. This estimate of denitrification suggest that >50% ofN
mineralized in sediments is lost as N2 gas and, more importantly, that most of the
N input to the Galveston Bay system is removed via denitrification (-66% of the
N load; Rowe et a!. submitted). Obviously, the differences between these two
studies raises serious questions regarding the importance of denitrification in the N
budget of Galveston Bay. However, neither the Zimmerman and Benner nor the
Rowe et a!. studies measured denitrification rates in situ and only the Zimmerman
and Benner study measured rates consistently at the same stations over an annual
cycle. By directly measuring denitrification rates at a series of stations over
several annual cycles, we were able to obtain improved estimates of denitrification
and to re-evaluate the system-level N budget for Galveston Bay.
Our study was carried out between 1996 and 1998. We measured rates of
benthic metabolism and denitrification in situ using benthic chambers three to six
times per year, optimally at bi-monthly intervals. We also determined
sedimentary (grain size, pore water nutrient concentration, porosity, chlorophyll
g concentration) and water column geochemical (nutrient and dissolved gas
concentration, temperature, salinity, pH, chlorophyll g) parameters. Most of the
TWDB Final Report May 1999

Joye & An pg. 7
methods used our studies of denitrification have been published previously (Joye
and An 1997, 1998; An and Joye 1997; Joye et al. 1996, 1997). The objectives
of the study were quantify denitrification rates in Galveston Bay, to assess
denitrification in the context of the net sediment N budget and in terms of net
carbon and oxygen budgets, and to elucidate the environmental factors influencing
denitrification over longer time periods
II. Methods
Study sites. During the 1998 sampling year, we worked at 4-5 stations along the
Trinity River salinity gradient and at three other stations at Texas City (TC), in
the East Bay (EB), and a northern station along the Houston Ship Channel (SC)
(Joye and An 1998; Fig. 1 ). Three to six stations were sampled during the period
covered by this report, November 1997 (3 stations), January 1998 (3 stations),
April 1998 (6 stations), August 1998 (6 stations), and October 1998 (6 stations).
During November and January 1998, sampling was limited to 3 stations because
of high flow conditions (strong currents made scuba diving extremely dangerous).
During August of 1998, no benthic chamber fluxes are available from the Trinity
River stations because our benthic chambers were removed (after emplacement
and during incubation) by some unknown person. The chambers were later
recovered by the Chambers County Sheriffs department. The lack of chamber
data during August 1998 is disappointing because extremely low river flow
resulted in elevated salinity at our fresh water stations. During 1998, salinity at
the Trinity stations varied between 0 and 12 parts per thousand (ppt), compared
to 0 and 8 ppt during 1997, and 0 to 15 ppt during 1996. Four transect stations
that were interspersed between the primary sampling stations were also
monitored. Only surface and bottom nutrient and dissolved gas concentrations
were determined at the transect stations.
TWDB Final Report May 1999

-..r:: t:: 0 z -Q) "0 ::I -:.;:::; <tS
....J
29.40
2920
95.00
Longitude (West)
Trinity River stations St 1-St 5
(See Fig. 1b)
95.40
Figure l(a). Sampling Stations in Galveston Bay. MS 1-6 represent the monitoring stations of the TNRCC. See Fig. 1 b for detail map of the Trinity River chamber and transect stations.
- 8

29.50
29.45
29.40
Station3 •
Station4 • StationS •
94.45
Latitude (West)
94.40
Figure 1 (b). Detail map of the Trinity River chamber (stations 1-5) and transect (TR 1 - 4) stations. [Redrawn from Joye and An (1997)].
9
Joye & An pg. 10
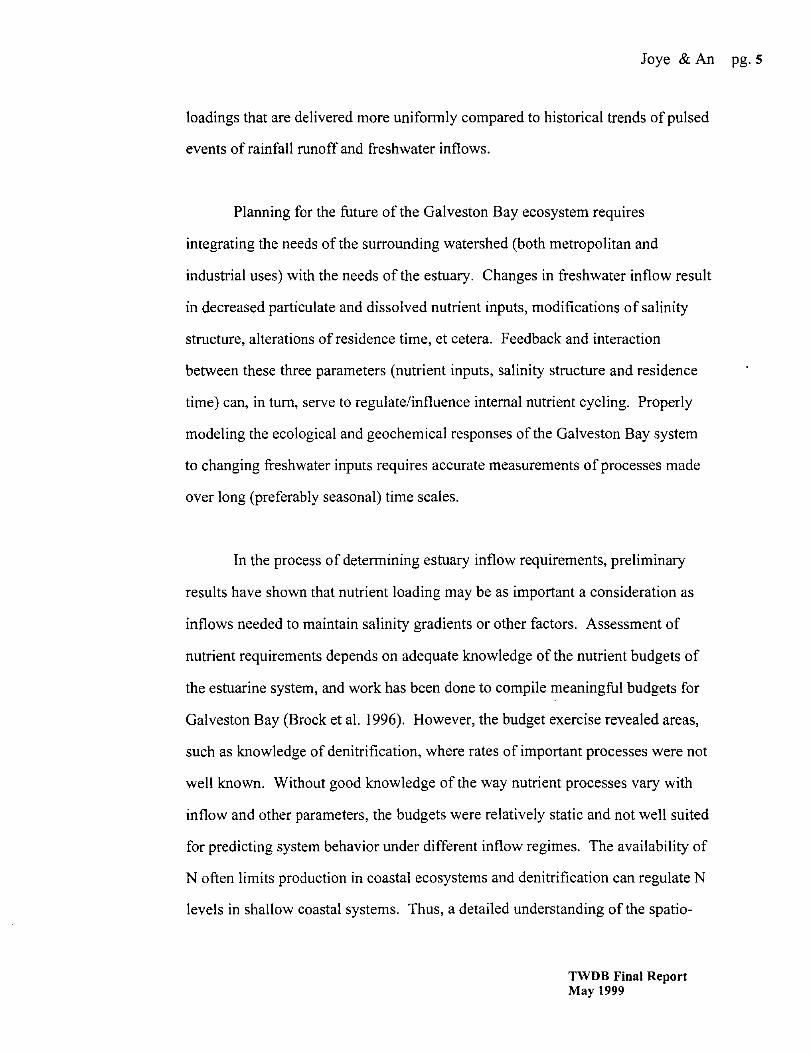
Water column and sediment variables. A suite of environmental variables were
measured at each station. A Hydrolab DataSonde® Multiprobe was used to obtain
water column profiles of temperature, salinity, pH and dissolved oxygen (02)
concentration. Samples for determining nutrient concentration were collected from
ca. 0.5 m below the surface and from ca. 0.5 m above the bottom using a Niskin
bottle. Approximately 40 mL of water was filtered through a Whatman GF/F (0.7
f..Lm optimal pore size) filter into a plastic bottle. Samples were immediately
frozen and stored prior to nutrient analysis. N03 + N02 and P04 concentration
were determined using standard methods on an Alpkem FlowSolution 3000
Autoanalyzer (Joye eta!. 1999). N~ concentration was determined
spectrophotometrically using the pheno-hypochlorite method (Joye eta!. 1999).
Sediment cores (50 em long and 5 em wide) were collected by scuba divers
in order to obtain profiles of pore water nutrient concentration, chlorophyll a
concentration, porosity, and grain size distribution. Pore waters were collected
using a Reeburg Squeezer (Joye and An 1997) which expresses pore water under a
pressurized N2 atmosphere. Pore water samples were passed through a GF/F
filter into an acid-cleaned, deionized water rinsed 7 mL glass scintillation vial.
Samples were immediately frozen and stored as such until nutrient concentrations
were determined (as outlined above). The pore water free sediment (mud cake)
was frozen for the future determination of% organic matter,% organic nitrogen
and carbon, and photopigment concentration; % organic and CHN analyses are
still being completed. Determination of chlorophyll concentration are described
elsewhere (Joye and An 1998; An 1999).
Duplicate samples for porosity determination were collected at 1-5 em
intervals throughout the length of the core. Porosity was estimated from sediment
TWDB Final Report May 1999

Joye & An pg. 11
weight loss after drying at 60° for 48 hours. Grain size distribution was estimated
by determining the amount (mass) of sediment passing through a 63 11m sieve.
Sediment greater than 63 11m is considered coarse grained (sand) while material
passing through the sieve is considered fine grained (silt, clay).
Benthic Chamber Incubation. The protocol we used for benthic chamber
incubations has been presented previously (Joye eta!. 1996). Briefly, duplicate
clear chambers were placed onto the sediment - water interface by a SCUBA
diver. When placing chambers onto the sediment, two valves on the top of the
chamber were kept open to prevent pressure buildup [which could lead to pore
water extrusion] during chamber emplacement. These valves were closed after the
chamber was stablized and initial samples were collected (see below). Chambers
were incubated for 24 (± 3) hours and then final samples were collected (see
below).
Samples for dissolved gases and nutrients were collected as follows.
Triplicate dissolved 0 2 and N2 samples were collected into gas-tight glass syringes
(Glass Pak®) without introducing bubbles. Syringes were stored at 4°C until
analysis via gas chromatography approximately 4 - 7 days later (An and Joye
1997). Syringes were filled with He-purged water prior to sampling to reduce the
possibility of atmospheric contamination and were rinsed by drawing ca. 3 mL of
sample into the syringe, dispelling that volume, and then collecting a "clean" 10
mL sample. Two larger (125 mL) syringes of water from each chamber were
collected after obtaining the N2/02 samples and then the chamber valves were
closed. Dissolved inorganic carbon (DIC) samples were dispensed into 10 mL
vials using a canula to prevent sampie degassing and/or the introduction of
bubbles; vials were over-filled 2X with sample. DIC samples were fixed with
TWDB Final Report May 1999

Joye & An pg. 12
azide (0.5%), capped with teflon coated screw caps without introducing a
headspace, and stored at 4° C prior to analysis via coulometric titration (Joye and
An 1998). Dissolved 0 2, N2, and Ar concentration was quantified using gas
chromatography (An and Joye 1997). Inorganic nutrient concentration was
determined as described for water column and pore water samples.
III. Results and Discussion
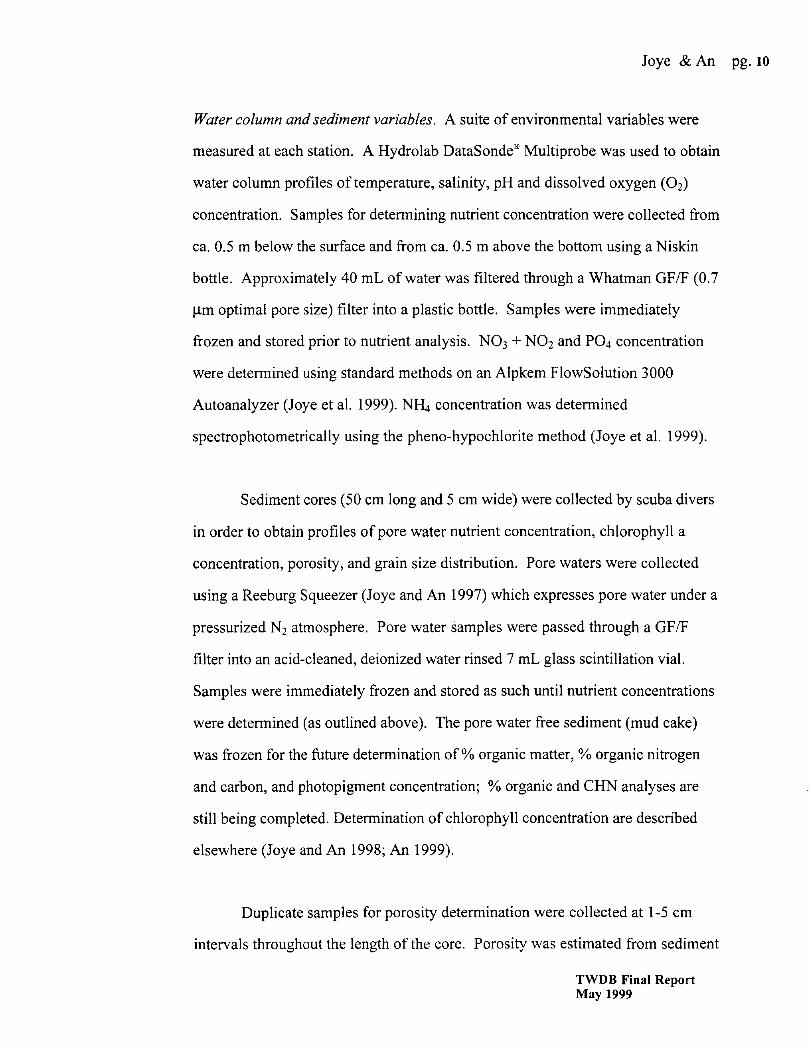
Water column temperature, salinity and dissolved 0 2 distribution. Physico-
chemical characteristics for the study sites during the 1996 - 1998 study period
are presented in Table 1. The depth of the Trinity River stations varied from 1.5
to 3 m in depth. Because dredging activity is frequent in the Trinity, some stations
(e.g., St. 3 between Aug and Nov 1998, see Figs. 2 and 4) exhibited dramatic short
term differences in depth because of dredging. Despite the shallow depths of
these stations, however, temperature stratification was frequent, with surface to
bottom temperatures differing by as much as 2 °C. Temperatures at the Texas
City site were similar (within 1-2 oq to those observed at the Trinity stations.
The salinity at the Trinity stations was zero, except during summer (July-August
are elevated every year). During the summer of 1998, salt intrusion was observed
at Station 1; this station had never exhibited elevated salinity prior to this time.
Salinity at the Texas City station was lowest during January (6- 13 ppt) and
highest during summer (ca. 30 ppt). Salinity at the East Bay site was always
higher than those observed at the Trinity stations but lower than those observed
at Texas City (5 - 20 ppt). Dissolved 0 2 concentration was highest during winter
and at the lowest salinities (Table 1). Significant surface-bottom differences were
apparent at all stations during most sampling periods (see below). Secchi depth
throughout the bay averages 0.6- 0.7 m with a range of0.2 to 1.2 m (An 1999).
TWDB Final Report May 1999
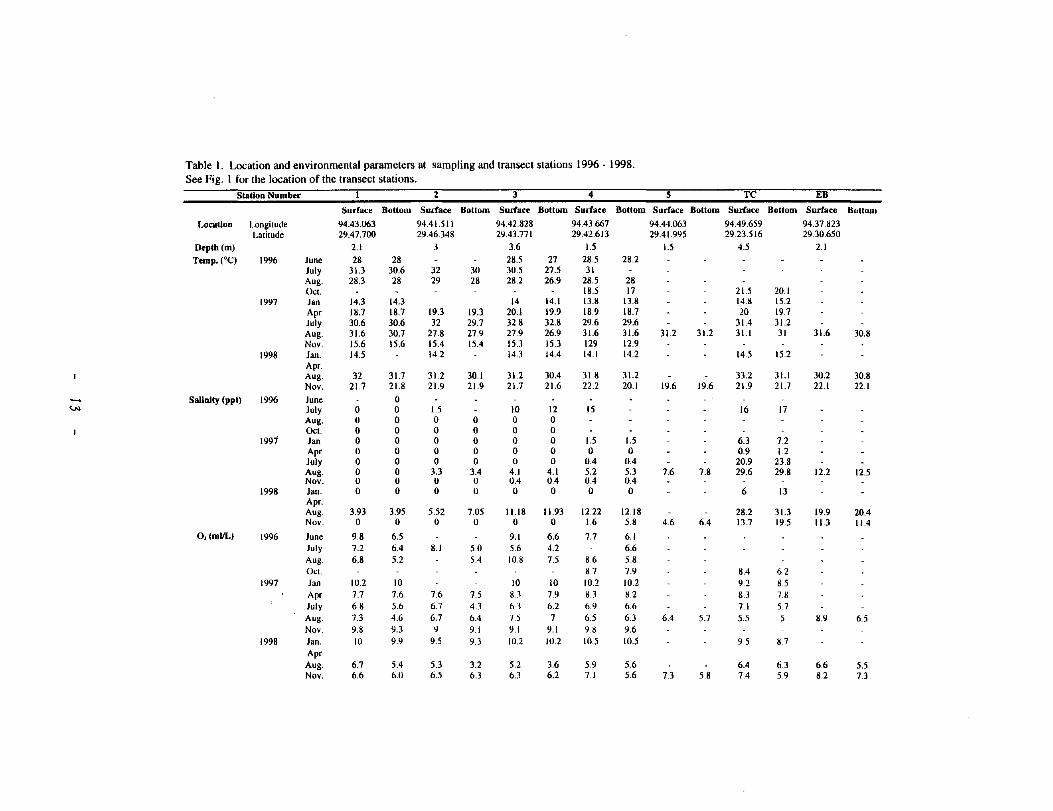
Table I. Location and environmental parameters at sampling and transect stations 1996 - 1998. See Fig. I for the location of the transect stations.
Station Number I 2 3 4 5 TC EB Sudace Bottom Surface Bottom Sudace Bottom Surface Bottom Sudace Bottom Surlace Bottom Surface Bottom
Location Longitude 94.43.063 94.41.511 94.42.828 94.43.667 94.44.063 94.49.659 94.37.823 Latitude 29.47.700 29.46.348 29.43.771 29.42.613 29.41.995 29.23.516 29.30.650
Deplh(m) 2.1 3 3.6 1.5 1.5 4.5 2.1
Temp.(0 C) 1996 June 28 28 28.5 27 28.5 28.2 July 31.3 30.6 32 30 30.5 27.5 31 Aug. 28.3 28 29 28 28.2 26.9 28.5 28 Oct. 18.5 17 21.5 20.1
1997 Jan 14.3 14.3 14 14.1 13.8 13.8 14.8 15.2 Apr 18.7 18.7 19.3 19.3 20.1 19.9 18.9 18.7 20 19.7 July 30.6 30.6 32 29.7 32.8 32.8 29.6 29.6 31.4 31.2 Aug. 31.6 30.7 27.8 27.9 27.9 26.9 31.6 31.6 31.2 31.2 31.1 31 31.6 30.8 Nov. 15.6 15.6 15.4 15.4 15.3 15.3 129 12.9
1998 Jan. 14.5 14.2 14.3 14.4 14.1 14.2 14.5 15.2 Apr. Aug. 32 31.7 31.2 30.1 31.2 30.4 31.8 31.2 33.2 31.1 30.2 30.8 Nov. 21.7 21.8 21.9 21.9 21.7 21.6 22.2 20.1 19.6 19.6 21.9 21.7 22.1 22.1
Salinity (ppl) 1996 June 0 '-"' July 0 0 1.5 10 12 15 16 17
Aug. 0 0 0 0 0 0 Oct. 0 0 0 0 0 0
1991 Jan 0 0 0 0 0 0 1.5 1.5 6.3 7.2 Apr 0 0 0 0 0 0 0 0 0.9 1.2 July 0 0 0 0 0 0 0.4 0.4 20.9 23.8 Aug. 0 0 3.3 3.4 4.1 4.1 5.2 5.3 7.6 7.8 29.6 29.8 12.2 12.5 Nov. 0 0 0 0 0.4 0.4 0.4 0.4
1998 Jan. 0 0 0 0 0 0 0 0 6 13 Apr. Aug. 3.93 3.95 5.52 7.05 11.18 11.93 12.22 12.18 28.2 31.3 19.9 20.4 Nov. 0 0 0 0 0 0 1.6 5.8 4.6 6.4 13.7 19.5 11.3 11.4
O,(mi/L) 1996 June 9.8 6.5 9.1 6.6 7.7 6.1 July 7.2 6.4 8.1 5.0 5.6 4.2 6.6 Aug. 6.8 5.2 5.4 10.8 7.5 8.6 5.8 Oct. 8.7 7.9 8.4 6.2
1997 Jan 10.2 10 10 10 10.2 10.2 9.2 8.5 Apr 7.7 7.6 7.6 7.5 8.3 7.9 8.3 8.2 8.3 7.8 July 6.8 5.6 6.7 4.3 63 6.2 6.9 6.6 7.1 5.7 Aug. 7.3 4.6 6.7 6.4 7.5 7 6.5 6.3 6.4 5.1 5.5 5 8.9 6.5 Nov. 9.8 9.3 9 9.1 9.1 9.1 9.8 9.6
1998 Jan. 10 9.9 9.5 9.3 10.2 10.2 10.5 10.5 9.5 8.7 Apr Aug. 6.7 5.4 5J 3.2 5.2 3.6 5.9 5.6 6.4 6.3 6.6 5.5 Nov. 6.6 6.0 6.5 6.3 6.3 6.2 7.1 5.6 7.3 5.8 7.4 5.9 8.2 7.3

Table I (Continued) Transect Station
OB I 2 3 4 Surface Bottom Surface Bottom Surface Bottom Surface Bottom Surface Bottom
Location Longitude 94.50.87 94.42.551 94.42.275 94.41.479 94.41.991 Latitude 29.16.91 29.47.41 29.46.907 29.45.947 29.44.864
Depth (m) 5.1 3.6 3.6 3.6
Temp.ec) 1996 June 28 28 July 31 31.5 30.5 30.5 31.5 32 31.1 28.2 Aug. 28 27.2 27 Oct. 23 22.5
1997 Jan. 14.3 14.3 14.2 14.3 14.2 14.2 14 14.2 Apr. July 31.5 29 31.5 29.6 31.3 29.9 Aug. 31.3 31.1 31.2 31 30.7 30 29.7 28.9 Nov. 15.5 15.5 15.5 15.5 15.5 15.5
1998 Jan. 14.3 14.3 14.2 14.3 14.1 14.3 14.2 14.2 Apr. Aug. 32.4 32.2 32.2 32 31.3 30.1 32 30.6 Nov. 21.8 21.8 21.9 21.8 21.8 21.8 21.8 21.8
.;.. Salinity (ppt) 1996 June July 32 34 0 0 10 Aug. Oct
1997 Jan. 0 0 0 0 0 0 0 0 Apr. July 0 0 0 0 0 0 Aug. 0 0 0 0 0.4 2.7 1.1 2.3 Nov. 0 0 0 0 0 0
1998 Jan. 0 0 0 0 0 0 0 0 Apr. Aug. 3.12 3.13 3.54 3.6 6.54 8.78 9.38 10.58 Nov. 0 0 0 0 0 0 0 0
0 1 (mliL) 1996 June 6.4 7.2 5.6 6.5 July 7.2 6.2 6.6 43 6.4 4.1 5.8 3.9 Aug. 10.2 4.3 9.3 7.6 Oct. 8.2 4.2
1997 Jan. 10.3 9.8 10.3 9.5 10.1 9.8 10.3 9.7 Apr. July 7.3 4.7 7.3 46 8.2 5.4 Aug. 7.2 5.9 6.5 6 7.7 5.4 7.7 5.6 Nov. 10 9.5 9.2 9 9.2 9
1998 Jan. 98 9.7 10.1 10.1 9.7 9.7 9.6 Apr. Aug. 6.0 5.1 5.6 5.2 5.0 3.6 6.1 4.0 Nov. 6.7 6.3 7.1 6.3 6.9 6.4 6.7 6.5

Joye & An pg. 15
The depth distribution of temperature, salinity, pH and dissolved 0 2
appears to be a function of freshwater inflow rate, particularly in the Trinity
River region. Water column stratification is apparent and significant during
periods of low flow (August), but is less significant during periods of high flow
(November) (Fig. 2-5). The depth distribution of temperature, salinity, pH and
dissolved 0 2 at all stations in August, a period of extremely low flow, is shown in
Figs. 2 and 3. Depth variation in temperature, salinity, pH and dissolved 0 2 are
apparent at more saline stations (Fig. 2A-C) but no obvious depth trends in pH
occur. Along the Trinity River stations, subtle gradients in temperature and
salinity create a stable water column and generate significant 0 2 depletion at
depth, particularly at mid-River sites (Fig. 2 G-1; Fig. 3). Dissolved 0 2 %
saturation varied between 45 and 100% and was as low as 45% at the mid-river
stations (Fig. 3). These low concentrations of dissolved 0 2 resulted in dramatic
changes in nutrient distributions (see below). As reported previously, only a
slightly stratified water column is required to generate strong chemical
stratification with respect to dissolved 0 2 concentration (Joye and An 1998).
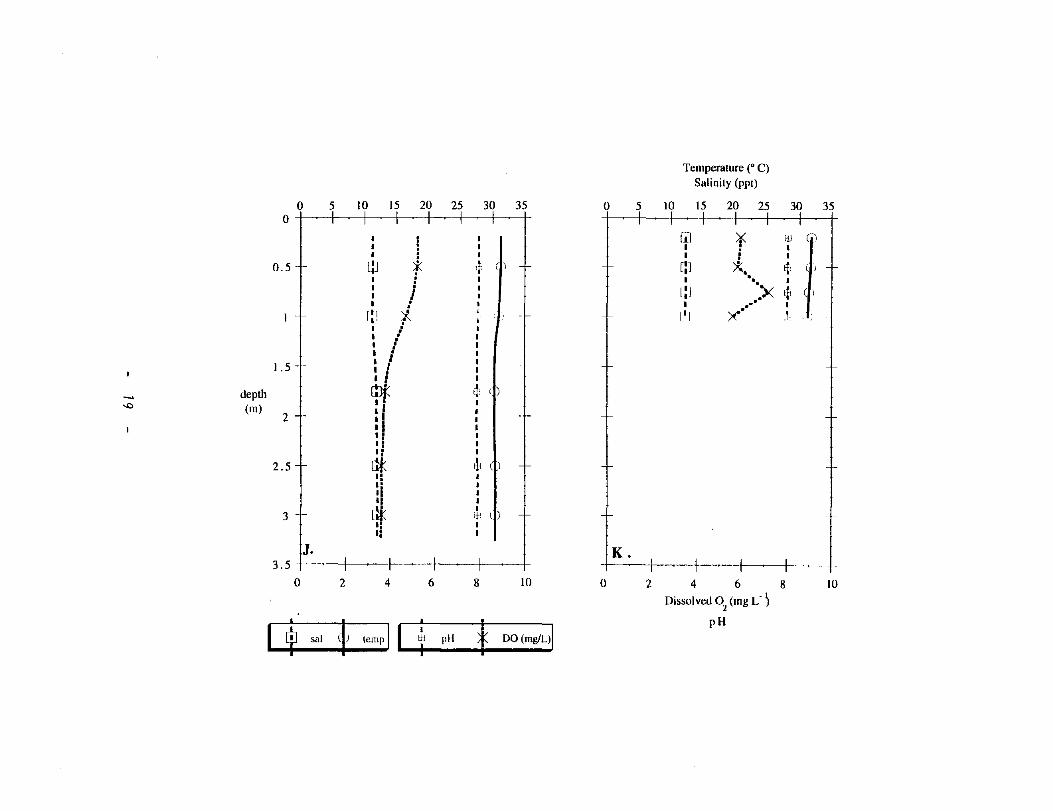
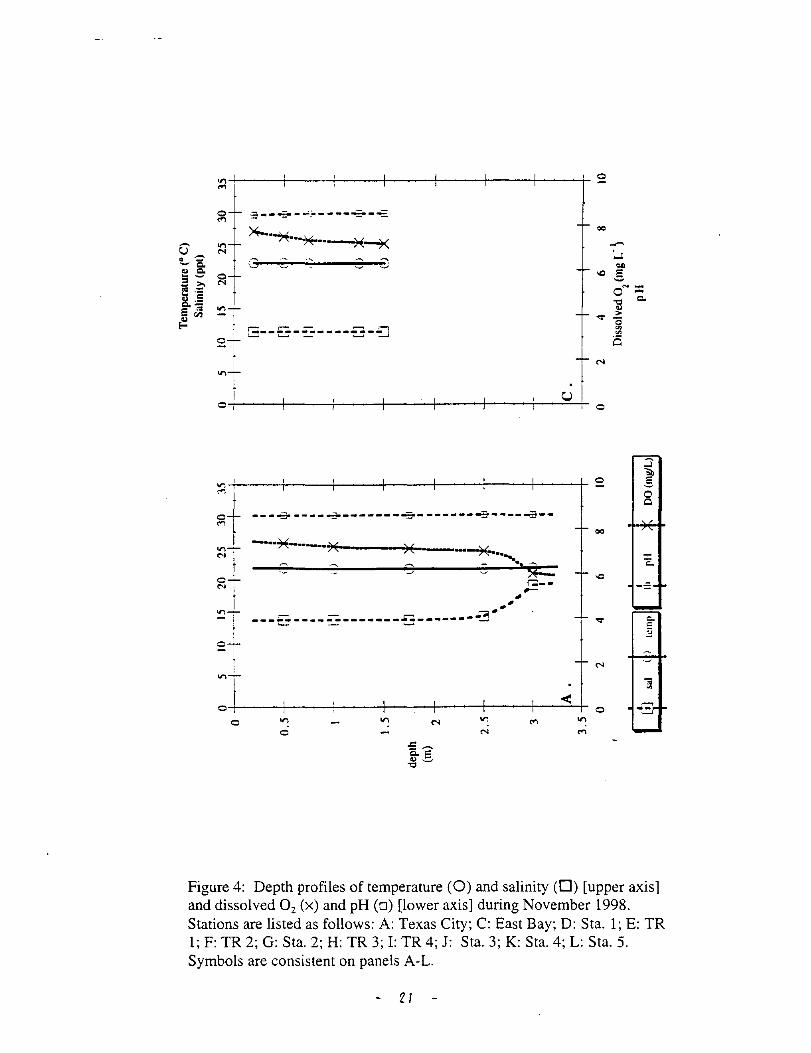
The depth distribution of temperature, salinity, pH and dissolved 0 2
during November, a period of high river flow, is shown in Figs. 4, 5 and 6. As
observed in August, depth variation of salinity and dissolved 0 2 was significant at
the Texas City station (where a halocline was present) but not at the East Bay
station (which had no halocline) (Fig. 4A & C). Depth trends in pH and
temperature were weak. Along the Trinity River, no water column gradient in
temperature or salinity was observed at Stations I through 3 (Fig. 4 D-J);
however, changes in dissoved 0 2 concentration were still apparent even though
they were much less dramatic compared to those observed in August. At Stations
4 and 5, a water column halocline was present and the change in dissoved 0 2 over
TWDB Final Report May 1999

()._
depth (rn)
Temperature (" C) Salinity (ppl)
0 5 I 0 15 20 25 30 35 0 5 I 0 15 20 25 30 35 0 5 10 15 0 1~-~~---1-·-1---t~- -1----t~L j-~-1- -·-1----t~l-~l-------f---.--+ 1~-+--t ,,, ¥ I! I (IJ
I . I . I . I .
0. 5 -·- r:J J:.. ill I ,' I
[~ ''' rJ·, • I ' . I
l' ll< '· lt#i
r I
" I
:' I
1.5 /_I!J I
ik1J
2
2. 5 -·-
3
A.
0 2 4 6 8
B.
10 0 2 4 6
1-. . \ 1:
t f l
Dissolved 02
(rng L- \
pH
[)')I
8
" ' " " " -jl~l· I I
liiJ \li I
!II I I I I
til~
i,l)
c. 10 0 2 4
I t 1,11 1 DO(mg/LJI I T I ·--·' I .. _ -ti ---++----'-
Figure 2: Depth profiles of temperature (0) and salinity (0) [upper axis] and dissolved 0 2 (x) and pH (o) [lower axis] during August 1998. Stations are listed as follows; A: Texas City; B: Ship Channel; C: East Bay; D: Sta. I; E: TR I; F: TR 2; G: Sta. 2; H: TR 3; I: TR 4; J: Sta. 3; K: Sta. 4. Symbols are consistent on panels A-K.
25 35
Ill ¥ Ill (I) I . I I • I . I • I I I I . I . I • r:q:: iJ (It
I . I . 'ij r •I '" -~-
I I ' . I
I I I
llt l!t(IJ
f I
' I
I' I 'I I
*'J '''I)
6 8 10

Temperature (0 C) Salinity (ppt)
0 5 10 15 20 25 30 35 0 5 10 15 20 25 35 0 5 10 15 20 25 30 35 0 I I I t---- I I I
[i] '1( til ('~ I : I li.J ¥ lli c~·~ I . I I . I I . I . . . I : I I . I I . I
'j .
0.5+ I i I I! I ' 1~1 f tJ; (I I I . I lij
I . I I . I 1 I . . ' [II 'f. ;' I i I I
* ! I' ' I I I
I • I I . I I . I ' .{, ' :!1 ::K :I I . I
' I I I ' I ' ' .
I I I I I I I I I
l!J i f~· ( ! I . I l!J i tl! . . I i I
I I I I I I I • I I . I l~J i tf, [IJ * J, 1.5 + I ! I . I . I I ' I • •
L'J x Ji (_) I I I ..... depth
2t
I I I • I
(m) 1!1 * tli I . I I I I I ! I I . I .
2.5+ + +ITJ * ill . ' . .
3t
I I
ID . I I IE. l l F.
3.5 I I I 0 2 4 6 8 10 0 2 4 6 8 10 0 2 4 6 8 10
Dissolved 02
(mg L- ~
pH

Temperature (" C) Salinity (ppt)
0 5 10 15 20 25 30 35 0 5 10 15 20 25 30 35 0
I ; I [i]
y '1 I ; I I ' I I . I I I I
0.5+ m i lil ' ' m 7;;, I!• i ! I : I I •.. I I . I r:J ">< Ill I
. I l I I I I
.. ,• I
r:J
"' .
11
1 x· '- , , I I : I I . I . I . I . I . I •
1.5+ I ' I I --t- --t- + I I I I I I
depth
21
l!Jj: ill <J) I ' I ...,
(m) . I ' I I --t- + + : I I
I II I I l I II I
2.5+ ~ 1!1 <ll + + + I I I ,. I •I I II I
3+ ill: 1!1 1)) + + + ,. . I I' . I
3.5 IJ.
I I I I I K. I I I I 0 2 4 6 8 10 0 2 4 6 8 10
Dissolved 02
(mg L. ~
Ill t pH
sal liJ temp I I pi! DO (mg/L)I

deptb (m)
deptb (m)
SoliDity (ppt)
6 9 12 15 o+---~--~---+---4--~~
0
A. 0 • • >((< • .q. • .q. • .q.
I
~
+ I
~
+ ' >0<
OiuolvedO, (~ saturation)
deplh (m)
deplh (m)
B.
0.5
1.5
2
\ ;. r A.
\'
\ f f
Di"olved O, (~ sarur.uion)
r ,.. -·}-1 .. ..r
·~- )_
0 2<1 40 60 80 100 ot'--~--~--~--~~+
D.
0.5
1.5-
2 !-
2.5
Figure 3: Depth profiles of salinity (A, B) and dissolved 0 2 (C, D) along Trinity River salinity gradient stations in August 1998. Station identifications are provided in the figure legend.
20
:t -'
:t ;<lT ~T
=T "'~
0
3---:E-- ...::_: .... - ---~--=
G--e-~----e--:J
---~----~-------~-------~-----a--
-···~····---.:..< ... ___ .,., 'E-7": 7< ___ _,. __
-~ .. ... - - ... -.., %0: ~--
,......, - ,....... -~· ---~----~-------~------ ~
~ ~ "' .,.,
0 "' .c ~ a 5 .., ""'
~
.~
u ' 0
Figure 4: Depth profiles of temperature (0) and salinity (0) [upper axis] and dissolved 0 2 (x) and pH (o) [lower axis] during November 1998. Stations are listed as follows: A: Texas City; C: East Bay; D: Sta. 1; E: TR 1; F: TR 2; G: Sta. 2; H: TR 3; I: TR 4; J: Sta. 3; K: Sta. 4; L: Sta. 5. Symbols are consistent on panels A-L.
21

Temperature (" C) Salinity (ppt)
15 20 25 30 35 0 5 10 15 20 25 30 35 0 5 10 15 20 25 30 35 0 I I
(J)~ w Ci)¥ fjl C)~ !II . I . I • I . . • . I • I • I • . . 0.5+ ~ I (}j:: Ell ()/.. $ I . • I . I . I . .
'!: . tli 'i· I I I I l)i ~~
I I
··:· ' I I I
$ Ji tlJ I
"! f I I I
"" ~l "" depth I
(m) I 2 I
I
Ji
2.5
3
D E. F. 3.5+-~~--~~--~--~~~--r
0 2 4, 6 8 10 0 2 4 6 8 10 0 2 4 6 8 10 Dissolved 0
2 (mg L' ~
1 T I n · , I ~-f pH * ~mg/L)I pH

Temperature (0 C) Salinity (ppt)
25 30 35 0 10 15 20 25 30 35 0 5 10 15 20 25 30 35 0
Eil n;,:: Ill Ill I : I I I • I I •
0.5 ffi (1: ~l ~I ~~ I I I ,.!, 1t1 ,,, ,. ..
' I I I
tli • I lti I
I I 1f1 $
I 1.5r r r r 1 (.1}:: di
"" depth
....., (m) 2
2.5
3
G. 3.51-----~---+--~1-----~---+
H. I.
0 2 4 6 8 10 0 2 4 6 8 10 0 2 4 6 8 10
I + sal + lemp II i pH t DO (mg/L)I I . .
Dissolved 02
(mg L. ~
pH

Temperature (" C)
Salinity (ppt)
10 15 20 25 30 35 0 5 10 15 20 25 30 35 0 5 10 15 20 25 30 35 0
lll liJ Ill w (~ ¥ 1!1 I I I I • I I I I . .
0. 5 ffi (J! ,, !J •l• I • til I I . I I I I • I • :l! L',l t!l r:] ( )
* ill I ' I I • I • • ' I I . I i!l .
' I I
J I
' I I I
~ ) <!I [!J . ' 111 \ )
I I I I I
1.5 + I + L'J JJ I I I • I I ()I I
depth
2t + + + + l!J i!J
"" (m) I • I
~ I
r I
I I I I
~ ( ill
l I 2.5+ -t- +
3
K. r fL. J. 3.54-~~~--~~--+---~-----r
0 2 4 6 8 10 0 2 4 6 8 10 0 2 4 6 8 10
Dissolved 02
(mg L. ~
pH I ili sal + temp II t pH t DO (mg!L)I I . ,

Salinity Salillity (ppU (pp<)
0 IS 0 9 q 0 .. 0 l
O.l {
' r . • t o.s l • \ •
'1 ' l '·· t·.
1.5 c.
~':t ~:.. \
depth , (m)
\ 1
r I
u + ,: I 1 1
l s! 0 So.l 0 rR! 0 "'' 0 ", I is
SL ~ ,. SL • 'il. :- ~' ~
lliPolv<d01 Dissolved 0,
(lJ', saNnlioa) (IJio sarurar:ian)
0 lO 40 60 80 100 0 20 40 60 80 0
0 ID. c. nr o.s
·: f #t ""~'"'--,' : ... -r • . .
l.S _,,I *-..4-.
depth -!-(m) (m) + 2 2
J... z.s z.s I
lll ~ t t ~ I]
SL! n: TR l SL d SL_ • '" St. .J. 1 'lL i
Figure 5: Depth profiles of salinity (A, B) and dissolved 0 2 (C, D) along Trinity River salinity gradient stations in November 1998. Station identifications are provided in the figure legend.
Z5
·~
'1 t I
f fR I
100
1
.. ,1

Joye & An pg. 26
depth was more significant (Fig. 4 K, L). At this time, salinity variation in the
water column appeared to generate most of the stability that generates changes in
dissoved 0 2. Dissolved 0 2 % saturation varied between 70 and 80 % in the upper
Trinity (St. 1, 2 and TR 1, 2) and at stations with 0 salinity (TR 3, 4, and St. 3)
(Fig. 5). Dissolved 0 2 % saturation varied between 60 and 80 % in the more saline
stations (St. 4 and 5) (Fig. 5). As mentioned previously, dissolved 0 2 %
saturation was correlated with salinity at the most saline stations, Texas City and
the East Bay (Fig. 6).
Both temperature and salinity appear to contribute to water column
stability and thus generate reductions of dissolved 0 2 concentration at depth.
Temperature-salinity patterns are driven, primarily, by variations in freshwater
inflow rate, tidally-induced mixing of the water column, and wind-mixing of the
water column. During periods of low freshwater inflow and reduced turbulent
mixing, biological activity generates chemical gradients even in the presence of
modest thermal or salinity stratification. The most profound decreases in
dissolved 0 2 concentration were observed in August 1998 (Fig. 7 A). The lowest
dissolved 0 2 concentration were observed at St. 2, TR 3 and TR 4; these surface
to bottom changes reflected a 40% decrease in dissolved 0 2 inventory over a 2 m
water column (Fig. 7B). Twenty percent reductions in dissolved 0 2 concentration
were observed at Stations 4 and 5 in October of 1998 (Fig. 7B). The high 0 2
demand apparent from these 0 2 profiles in the Trinity mid-river stations during
August of 1998 are particularly noteworthy. Reduced freshwater inflows resulted
in salinity intrusions past our most 'fresh' station (St. 1 ). At the midpoint of our
Trinity River transect, the bottom water oxygen concentration was low,
approaching hypoxic (=2 mg 0 2 L-1) conditions. Marked affects on water column
nutrient distributions were observed (see below). This pattern suggests that
TWDB Final Report May 1999

0 0
0.5
1
1.5 depth (m)
2
I . i3j •
Salinity I
(ppt)
15 20
• ::q
•
EB } 25
.-p :• "~ I
0 I
~ ~ I ¢' • I
9 I I
If' I I I
$
"!)
TC I
3.5 -+---+--t--'---t----t---r 0 20 40 60 80 100
Dissolved 02 ,..--+' ----:!i---, (% saturation),., -+~--EB--6t-~ -T·c•l
I
Figure 6: Depth profiles of salinity (upper axis) and dissolved 0 2 (lower axis) at Texas City and East Bay stations in November 1998. Station identifications are provided in the figure legend.
- 27

2.5
2
1.5
a Diss 02
([sfc ]-[bottom]) mgL- 1
0.5
0
-0.5
50
40
%a Diss 02
30
([sfc ]-[bottom])/[sfc] . 1
mgL- 20
10
0
-10
0 Nov97 0 Jan98 • Aug98 0
A. <P
r- f f t
~ ~ ¢ - + + - ~ • [] ¢
¢ + ® i ¢ ® • • ® ~ ® ~ ~ ® • El El
~ ~ ,.., --= -- ~
_l _l __]_ I I I l I ...l __]_ I I I I I I I I ' I I
a.: E-o
Station Identification (fresh-> saline)
0 Nov97 0 Jan 89 • Aug98 0
B.
-t- + + t t- + <D
- • ¢ <D <D
• • ¢
¢ -- ¢ 00
~ • ¢ • ® R B -~- ~ ~ ~ ~ _§_ • .... --- -=
I I
...l ...l I I
"' a.: a.: E-o E-o
I I I I
l I I I I I I '
Station Identification (fresh--> saline)
I
'
Oct 98 I 2.5
+ 2
-- 1.5
+ +
-1-- 0.5
_,...,_ 0
...l ' I -0.5
Oct98 1 50
-t- 40
-I- 30
-- 20
• ~- 10
-= 0
I I -10
Figure 7: Difference in dissolved 0 2 concentration over depth at all stations (X axis) between Nov. 1997 and Oct. 1998. Panel (A) illustrates the difference in concentration (mg L' 1
) between surface and bottom stations (i.e., surface concentration- bottom concentration). Panel (B) illustrates the percent change over depth (i.e., [(t. concentration I surface concentration)*100]. Date identifications are provided in the figure legend.

Joye & An pg. 29
reductions in fresh water inflow, whether they arise from increased municipal,
agricultural, or industial exports or from a natural drought, will have deleterious
affects on nutrient and materials cycling in the river, particularly if they occur
during summer months. Though we have no benthic flux data at this time for the
Trinity stations (see methods for explanation), changes in water column nutrient
concentrations and sediment pore water inventories suggest that benthic metabolic
rates were indeed altered.
During the summer months, rates of microbial processes in the sediment an
water column are elevated due to increased temperatures. Increasing salinities
(because of decreased freshwater inflow) along with seasonal highs in temperature
promote stratification of the water column. High rates of benthic metabolism in
this situation can result in 0 2 depletion of bottom waters. Furthermore, when low
0 2 water overlies a sediment, ammonium and phosphorus remineralization are
stimulated. The lack of 0 2 limits coupled nitrification-denitrification, which
increases net N regeneration rates. Low 0 2 also increases rates of reductive
dissolution of iron oxyhydroxides, which effectively increases phosphorus
recycling. Enhanced sediment recycling ofN and P and elevated rates of flux to
the water column could stimulate water column production which will, in tum,
stimulate water column and benthic respiration, exacerbating the problem. Low
0 2 conditions also increase mobilization rates of heavy metals (Cu, Zn).
Additional negative impacts of low 0 2 conditions in river water include reductions
in biomass of sediment infauna (many invertebrates cannot tolerate low 0 2
conditions for prolonged periods of time), fish kills, and harmful algal blooms.
Water column nutrient concentration. Water column nutrient concentrations
varied between different stations in Galveston Bay as well as between surface and
TWDB Final Report May 1999
Joye & An pg. 30
bottom samples (Table 2). In November of 1997, concentrations of ammonium
(NH4), nitrate (N03) and phosphate (P04 ) were low ( 1-6 f.!M) and similar
between surface and bottom waters. Nitrite (N02) concentration was always low
( < 0.5 f.!M) and invariable from St. 1 to 4. NH4 and P04 concentration increased
slightly between St. 1 and 4 while N03 concentration varied between stations.
Lower N03 concentration in St. 4 bottom water suggest consumption at depth
(Fig. SA, B). During periods ofhigh freshwater inflow (Jan, Apr, Oct 1998), N03
concentration in surface and bottom waters are elevated (Fig. 8 C- F, G & H).
N03 is the dominant inorganic nutrient form during high flow periods, being
almost 10 times more abundant than NH4, N02 and P04. Phosphate
concentrations are~ 1-2 f.!M during periods of high flow. Uptake ofN03 and
production ofNH4 are apparent at higher salinity stations even during high flow
(Fig. 8 E, F). During August of 1998, water column NH4 concentration was the
highest we observed during this 3-year study. Bottom water concentrations were
significantly higher than surface water concentrations (Fig. 8 G, H) and the higest
NH4 concentrations were observed at the Trinity mid-rivers stations, which
exhibited the lowest bottom water dissolved 0 2 concentration (Fig. 7, Fig. 8 G,
H). NH4 concentration was also elevated in East Bay bottom water during Aug.
1998 (Table 2). During November 1998, increased freshwater flow resulted in
elevated N03 concentrations, particularly at the freshwater sites (Fig. 8 I, J).
Uptake ofN03 in bottom waters was apparent (bottom water concentration was
less than surface water cone.) in freshwater stations while bottom waters N03
production was suggested at Sta. 5 (Fig. 8 I, J). NH4 production and flux from
sediments (see below) resulted in increased bottom water concentration in Sta. 3, 4
and 5 in Trinity Bay as well as at Texas City and East Bay sites. Bottom water
P04 concentration was highest at Sta. 5, possibly resulting from high rates of
benthic metabolism and release of P04 to the water column.
TWDB Final Report May 1999

Table 2. Surface and Bottom Nutrient Concentrations
S!!tl!IC~ W 11ter ll!!!lom W llt~r Sta. Date Ammonia Nitrite Nitrate Phosphate Ammonia Nitrite Nitrate Phos!!_hate
Nov-97 Stl- 1.50 0.18 3.90 l.IO 3.24 0.34 4.30 1.48 St3 3.06 0.29 3.40 2.06 3.60 0.14 5.56 2.22 St4 4.50 0.11 6.29 3.96 5.31 0.16 3.50 2.61
NO DATA FOR TRANSEC STATIONS IN NOV. /997
Jan-98 TC 0.00 1.38 22.73 0.88 0.00 0.93 18.93 1.23 St 1 0.09 1.08 48.35 0.15 0.00 n.d. n.d. n.d. St 2 0.51 1.16 46.16 0.10 0.00 l.l4 46.41 0.13 St3 0.00 0.92 36.03 0.10 0.05 0.91 34.23 0.15 St4 0.00 0.99 38.21 0.10 0.00 0.96 37.88 0.35 TR I 0.00 0.88 48.20 1.53 0.00 1.02 45.70 0.15 TR2 077 0.98 47.51 l.lO 2.77 0.93 46.42 0.15 TR3 0.00 l.lO 31.81 0.80 0.20 1.02 34.88 0.10 TR4 4.51 l.OI 46.40 0.68 0.09 1.06 48.21 0.65
Apr-98 TC 3.37 0.849 6.30 0.70 4.75 0.44 2.60 1.55 EB 2.20 0.674 1.63 0.75 7.82 0.83 21.56 0.00 Stl 4.18 0.808 45.66 2.20 0.00 0.45 43.99 1.81 St 2 1.18 0.636 45.03 1.83 0.00 0.581 44.75 1.74 St 3 2.27 0.683 43.43 201 1.60 0.37 44.55 1.30 St4 11.07 0.824 41.59 2.58 n. d. n. d. n. d. n. d. TR I 0.00 0.535 44.21 1.55 0.00 0.614 43.67 1.80 TR2 0.40 0.491 44.02 1.69 3.00 0.580 44.47 1.85 TR 3 1.20 0.536 44.72 1.87 1.40 0.624 45.83 1.87 TR4 1.20 0.492 44.76 1.86 2.25 0.564 45.26 1.91
Aug-98 TC 1.27 0.26 0.00 0.31 3.00 0.80 1.25 0.00 EB 3.98 0.36 0.00 1.61 13.00 0.38 0.40 1.70 sc 0.99 0.32 0.00 2.39 1.15 0.60 !.55 1.30 St I 1.91 0.33 0.00 l.l4 2.00 0.35 0.00 1.20 St2 2.99 0.34 0.09 0.90 15.85 0.47 0.50 1.02 St 3 5.52 0.40 0.00 1.20 2.12 0.49 0.45 1.47 St4 1.24 0.42 0.00 1.83 8.62 0.32 0.00 !.55 TR 1 0.64 0.33 0.00 0.86 2.29 0.36 0.00 0.86 TR2 0.99 0.29 0.00 l.OO 3.45 0.43 0.13 1.33 TR3 3.24 0.39 0.25 l.IO 7.49 0.38 0.63 1.46 TR4 2.65 0.35 0.00 1.40 15.08 0.49 0.47 l.l3 lock" 0.75 0.36 0.00 0.79 1.91 0.25 0.00 1.23
Oct-98 TC 0.00 6.70 13.55 5.56 1.86 4.80 11.91 2.83 EB 0.00 6.38 13.08 1.98 1.74 7.10 15.90 2.80 Stl 5.25 0.58 9.86 1.40 4.13 0.55 10.70 0.90 St 2 2.06 0.32 7.33 1.98 1.99 0.12 7.46 1.62 S/3 4.14 0.91 9.76 4.36 7.89 0.65 10.20 1.55 St4 8.92 1.35 9.82 2.91 16.10 2.60. 10.30 3.50 ST5 16.00 3.60 11.54 4.36 14.16 5.80 20.00 6.80 TR I 2.10 0.15 20.10 1.84 2.15 0.27 7.28 1.00 TR2 1.97 0.27 19.99 1.89 2.15 0.15 7.33 1.76 TR3 3.28 1.75 18.50 1.89 1.78 0.31 7.78 1.76 TR4 2.26 0.34 19.91 1.80 2.26 0.36 8.10 1.80
n.d. - no data *bold, italic stations also have dome flux data for this date; see Table 3
•lock =lock on the Trinitv River nnrth of Stntion 1
31

c .g «<,-, =::;; ~:::1. u "-' c 0 u
c . g «<,-, =::;; ~:::1. u "-' c 0 u
7 7 • NH4 A.
6 • • ~· • N02
···~·-· N03 6
--~·-P04
5 5
4 ,_ 4 , , , 3 , 3 , , , _, 2 "" 2
____ ,__ _ ..
1 ~-- 1
········•·-····-· 0 0
Sta 1 Sta3 Sta4 7 7
B.
6 6 .. -~·-, .. . -· . 5 .. ·· ·. 5 . . • • • •
~ 4 4
3 3
---- ---~ --2 --~ 2 ------r.i
1 1
~- . . -. . -. ····-··· 0 0
Sta 1 Sta 3 Sta4
Station Identification (fresh --> saline)
Figure 8: Surface and bottom concentration of ammonium (e), nitrite ( ~ ), nitrate(~), and phosphate (D) in November 1997 (A, B); January 1998 (C, D); April 1998 (E, F); August 1998 (G, H); and November 1998 (1, J). The x-axis is station location, progressing from fresh to saline stations.
32

• NH4
• • •• • N02
--r~-·P04
[NHJ,
[N02],
[P04]
(!lM)
[NH4],
[N02],
[P04
]
(!lM)
6,---.---,--,------------------------~50
5
4
3
2
1
····i_ J... c . I -·~··· N03 I \ . . • • • ·. I ·.. 1 40 \ . . . .. ~--·· -..: 'f' .. ¥ \ • • •
'} .... •• I ~ •• +···
··~ .. ~ .......-: I • ' , I
I
•••••
-en
\ • • ~
u E-
30
20
10
6,----------------------,--------------~50
5
4
3
2
1
~-···~····~····~\ ::· \~ . : ..
-en
·. .. . •• .. .. .J.. ... f. ··~····"'\
• • • • • • • • • • • • • ~
+ ~ . . . . . . .. . . _..,._ , ·<It- •• ............ , ,.z,. - I
-en
Station Identification (fresh--> saline)
33
u E-
D.
40
30
20
10

12 50
• NH4 +·.f.-<}·.+ ·1·. f ·f .. E. I· ·0· . N031 -•+••• N02
•• r;;; •• po.:~- 10 40
[NH4], 8
[N02], 30 [P04] 6 [N03] (f.JM) (!lM)
20 4
-~ 10 2
_ .. ,c ... ~,
0 0 N N M '<!" M '<!" ~ u .... c.:: c.:: .... c.:: c.:: .... .... ~ .... U'l .... .... en .... .... U'l U'l
12 50
0 ~ ~--·~···~·-~···~ F.
... . .. 10 I
I I I 40 I I I I I I
[NH4], 8 I I I I
[N02], I
30 I I I I
[P04] I
[N03] 6 I I I
. (!lM) I I (!lM) • • • 20 • •
4 I • I • I • • I • I 10 • 2 I
I I I I I I I •
0 0 ..... N N M '<!" M '<!" ~ u .... c.:: c.:: ~ c.:: c.:: ....
~ ~ .... U'l .... .... .... .... U'l
Station Identification (fresh--> saline)
34

Concentration Concentration (JlM) (JlM)
.... .... N .... .... N 0 Ul 0 Ul 0 0 Ul 0 Ul 0
I I I
lock._ IHHI St 1 ~t~lf • • • St 1 ~L!J. I I"" z z ~ 0 0 0
~ V-l t--..) ~ ' -
TR 1 (/.)
TR 2 ~ :wl \.___ I - TR2 I» ::!. 0 ;::l - St2*! ~ I St 2 P-('1)
"" ;::l '-" -Si TR3 *ill c;;.,__ I TR3
(') I» ::!.
TR 4 ---wi! ~ I TR4 0 :I
----;:t> S t 3 ~ I!.-;;:,__ I St3 ('1)
V> ::r'
' ' St 4 ~ [•I Jl'o I St 4 v V>
e=..
I ~·
Terry TC ;::l
('1) ~
sc
~ EB T - c;'l
0 Ul - .... N 0 Ul .... .... N 0 Ul 0 0 Ul 0

Concentration Concentration (l.tM} (J.!M)
...... ...... ~ ~ ...... ...... ~ ~ 0 VI 0 VI 0 VI 0 VI 0 VI 0 VI
~ . St I ~I , .. ~ St I ~-·-···-
• .. •·······• . . .
TR I -jettl• ~ TR I .+ • • • • •
TR2 + • TR2 .... ~ • (/) I
~ ····· ~ ··•······ P> St 2 ~-····· ~
St 2 c;· I I
::s • .......... - TR3 + ······· 0.. - ····~ (1> ' TR3 '-" ::s I . ()-. ~
~ • S1 TR4 • • (") •• TR4 * g. •• 0 St 3
.. ....... ::s ~-········· ~ St 3 ::r
St 4 • (1> • V> • ::T ' ... ' ·~·,,! ~ ···-~ St 4 ' ST 5 v ... ... . .
V> ······· e:. ~-····· ST 5 ~~I ~· TC ::s • • (1> . . . • ~ • ····~ • ~ EB '$ TC [;_._lj 1$1
I 11 o o • • • • ' ' I
EB! L!l" ~ ~ 12 8 8 ~ ~ I I I I 0 VI ...... ...... ~ ~ 0 VI ...... ...... ~ ~
0 VI 0 VI 0 VI 0 VI

Joye & An pg. 37
Surface water NH4 concentrations were higher during 1998 than observed
during the previous years of this study (Table 2, Joye and An 1998), with
maximal values (16 J.!M) being- 4 times higher than maximal values observed
previously (- 4J.!M; Joye and An 1998). Bottom water ammonium concentrations
were higher than those observed during 1997 ( 1 J.!M) but similar to those observed
during 1996 (10 J.!M). Dissolved phosphate concentrations did not exhibit as
much variability between 1996 and 1998. Average concentrations in surface
waters were approximately 2-3 J.!M during 1996 and 1998 versus 1 J.!M during
1997.
Water column N03 was the dominant inorganic N form during high flow
(e.g. January 1998) whereas NH4 assumed that role during low flow (e.g. August
1998). N03 concentrations during 1998 ( 45 - 50 J.!M) were higher than those
observed during 1996 or 1997 (30- 35 J.!M). Using data presented in Table 2,
DIN(= nitrate+ nitrite+ ammonium) to DIP ratios> 45 are obtained for the
surface waters during 1998 high flow periods, suggesting the potential for P
limitation of primary production. This is much higher than the DIN/DIP ratios
obtained for 1996 and 1997 (DIN/DIP- 3 to 11), which suggested N limitation of
primary production. During 1998low flow (summer) periods, DIN/DIP ratios of
2.6 to 4.5 were observed in surface waters, while DIN/DIP ratios of0.8- 15
(average= 4) were observed in bottom waters. The DIN/DIP ratios are well
below the Redfield ratio of 16, suggesting an excess of DIP compared to DIN and
DIN limitation of production in Trinity Bay surface and bottom waters during
summer. Similar patterns were observed at Texas City and East Bay stations
during 1998, with excess DIN present during high flow (winter- P limitation) and
excess DIP present during low flow (summer- N limitation).
TWDB Final Report May 1999

Joye & An pg. 38
Pore water nutrient concentrations. Pore water concentrations in sediment cores
collected between November 1997 and October 1998 are shown in Figures 9
though 13. Pore water NH4, nitrate+ nitrite (NOx) and P04 concentration
exhibited significant spatio-temporal variability at all stations. Generally
speaking, pore water concentrations were higher at the more saline sites and lower
at the freshwater sites. In November 1997, pore water NH4 concentration ranged
from 450 J..lM at depth in St. 1 sediments to 1500 J..lM at depth in St. 3 and 4
sediments (Fig. 9). NOx concentration typically exhibited a sub-surface peak in
concentration (ca. 5 em), and the subsurface peak was highest at St. 4. Pore water
P04 concentrations were almost always low ( < 2 J..lM). This probably results
from the binding ofP04 on to solid phase iron oxyhydroxides. In January 1998,
pore water nutrient inventories at all station were much lower than those observed
in Nov. 1997 (Fig. 10). At St. 3 and 4, depletion ofNH4 and production ofNOx
was observed throughout the upper 5 to 10 em of the sediment column. NOx
concentrations were similar to those observed in November and exhibited either a
shallow (St. 4) or deep (St. 3) sub surface peak. P04 concentrations were higher
(10 J..lM) than those observed during November and a pronounced P04 peak was
apparent at 17 em in the St. 4 core. This peak suggests a redox change, as NH4
concentrations also begin to increase at that depth. We believe that this depth
marked the depth extent of bioturbation by burrowing shrimp (An, pers. obs.).
Concentrations of all pore water nutrients were extremely low at the Texas City
site in January, with NH4 and NOx concentrations being similar.
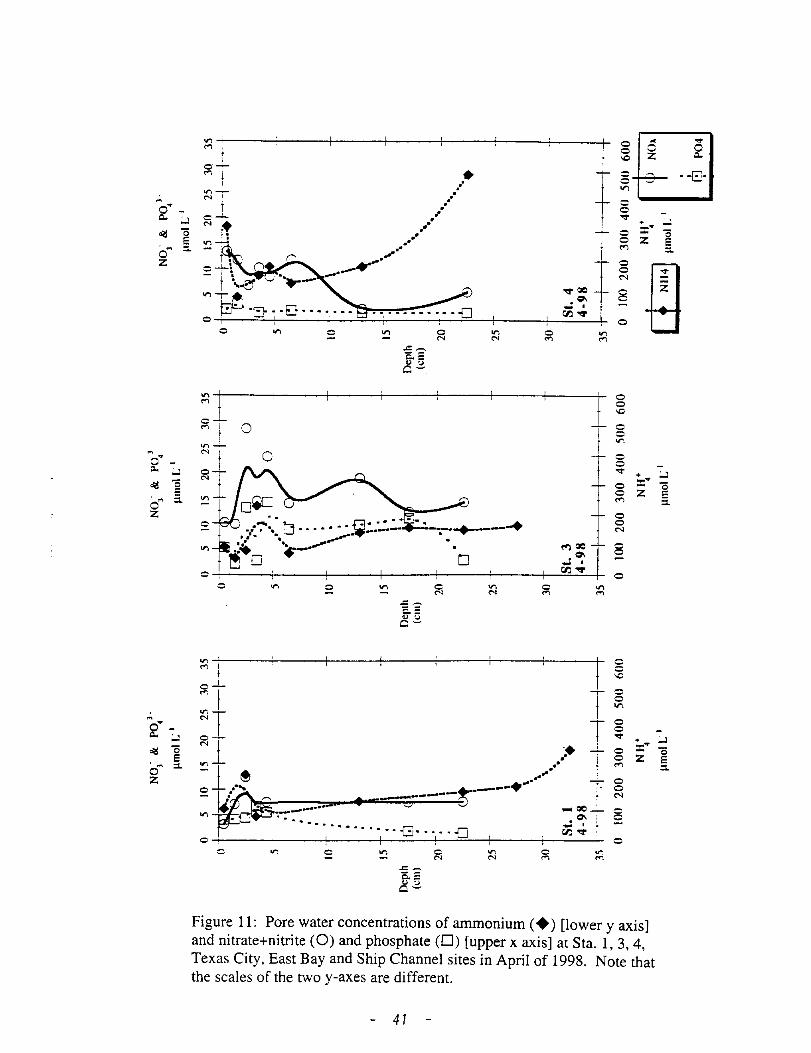
During April 1998, concentration ofNH4 were similar to those observed
during January, except at the Texas City site where concentrations were
approximately 3-fold higher (Fig. 11). P04 concentration was between 2-6 J..lM at
all sites while. Neither NH4 nor NOx exhibited the expected depth-dependent
TWDB Final Report May 1999

~-
.,.,_ N
=-~.
~.-
'"''
·-c~ .·
__ , ... ·· l
... .. ... · .... ~ ....
•·---.....--·· ...... .·
~·'
.~
:~:J S':.~--~·:· 6 '-' .... r;-. - ., ......... - ,. ~ -
:: 0
.= a_ " ~ o-
0 N
0 ~ .
0
T§ "' i -
~~ l~
I 0 Z ~ ="" ' tc: ' "" i Tg
l "'
i 0
~------------~----~---->-----7-----~--~
,.,_ N
c·'""
r :=To .... rt:"~'(:-~-=:::!:
0
.= a_ ~ . ..)
o-
"' N ~. ~.
Figure 9: Pore water concentrations of ammonium ( +) [lower y axis] and nitrate+nitrite (0) and phosphate (0) [upper x axis] at Sta. 1, 3 and 4 in November of 1997. Note that the scales of the two y-axes are different.
39

z
;. 0~Q.. ;,J
o(! 0 E
0~ ::. z
.... • : QIO
u~ . ~~ ~-
=-
~~ 0 o-
:~~-. l ~-···-······-+---·····• t:;o::r::-... -::--. .. -· .. --o . --- -o
o •·· ~ · I
;>;
=" -. oo-
0
'"'
•• -.. =" ,.• •.... .....: I
• .- .. cr.:"'"""' .,..-.. --·--·~ .· ·."' .· .... . .. . '·~ .. · ~ -·-· "'""
/ c+ ...,.J .. ......, - / Q - 1 0 . ~- ~ .. ··- · .. · · .. u.. .. r---, l- .. •c::J· ••.. ·'-'-1· ••
o !ilfi. t+ .... I I :· • ·t;:- · ·1· · ·~-"' .,., 0 0
"'
l I
I
T -i-
I
f j_ i t I
"' "'
'
T i I I
l I "' "'
I
T
! l + t "' "'·
Figure 10: Pore water concentrations of ammonium ( +) [lower y axis] and nitrate+nitrite (0) and phosphate (0) [upper x axis] at Sta. 3, 4 and Texas City in January of 1998. Note that the scales of the two y-axes are different.
40
"'" £ ..,. :::: z
r-
:2 :c 0 0 or. 0 + ;,J 0 ::::- 0 "" 0 z a 0
::.
'"' 0 0 N
8 0
0 0 r-0 c "' 0 .,..,
+ ;,J c ::::- 0 .,. g z E
::.
"' "' g c
~-.~----~-----+------+------+------~----~----_,_
o-"'1
I ...,_ N!
ol .•
. .. ·· .. • /
o[]"" - 0 0 - z "-: ~ ··~· 0 ~ ..., 25 ....
"'. ~· •, olJ ~ n 0"" ~ 11"'1~
.. .. ·· z
0
~.7 0 t
___ ..,... .... ··
0 0 ..,
0 ..,
...,....
"10C ~
-=· Cl.l ....
..., ..,
...,~----~------t-----~------~----~-----+------r .., l gt ~T o-"' l .,..L -1 ~ /' = ~/-.. ~ • --------t·---·
~ -··- ~ Ill ~~--.. , ·---- .......... . ~~ -. I •• G· .... {] 0~-----+------+-----~--~--~-=~~-----+------~
Cl.l ....
c N
0 ..,
0
0 0
"" g or.
0 0 .... +
0 :c· 0 z .,.., 0 0
"' 8 0
0 0
"" 0 0 V\
0 0 .... +
0 :c· 0 z .,.., 0 0
"' 0 :2
0
Figure 11: Pore water concentrations of ammonium ( +) [lower y axis] and nitrate+nitrite (0) and phosphate (D) [upper x axis] at Sta. 1, 3, 4, Texas City, East Bay and Ship Channel sites in April of 1998. Note that the scales of the two y-axes are different.
41
:.J 0 E ::.
:.J 0 E ::.

~
""
NO. & Po'· l 4
j.lmoiL 1
0 5 10 15 20 25 30 35 orn I I I I lc\ I
t.l ··-~ f'l • 5 ·rtJ• ····~~ .... ~
I;] ··~ ..... . I
10 ·J·:
0
15 I .. ..···· Depth ~.-" (em) ,
20 - ~
25
30
35
4 I
1
~ \ ... Bay '•,
4-98
.. •••• .
.. .. ... ·· .. ..
0 100 200 300 400 500 600
NH' 4
j.lmoiL'
Depth (em)
0 5
5
I'J
10
15
20 -·-
25
4J '
30
0
NO- & Po'· l 4
j.lmoiL 1
15 20 25 30 35
e~-1 1 1 -----t----L
Tx. City 4-98
--- 0
35 I I I · 0 100 200 300 400 500 600
NH' 4
j.lmoiL'
Depth (eno)
No· & Po'· 1 4
j.lmoiL 1
0 5 10 15 20 25 30 35
o I L"'
. • 00 .. 5 t- '
[jl i
to·
15
20
25
30
. \ ·. \ ' . ' I ' I
~+ ' I : \ @\ ' I
\ i
rfJ • \ \
(j
0 .: "
h. Chan. 4-98
35~
0 100 200 300 400 500 600
NH' • 4
I f NH41 j.lmoiL 1
N03
rtJ P04

Joye & An pg. 43
increase with depth. Instead, shallow (5 em) peaks in concentration (St. 1, 3, and
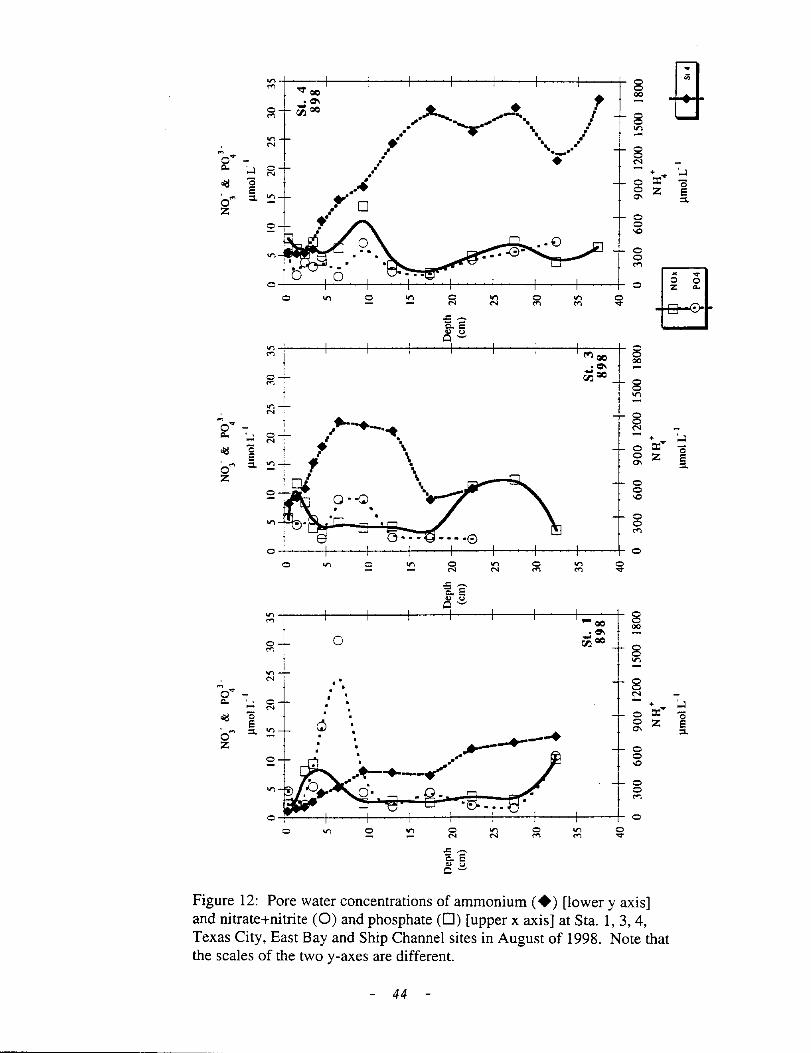
4) or deep (10 em) subsurface peaks were common at this time. In August 1998,
pore water concentrations increased significantly. NH4 concentration increased
with depth at the Trinity stations (St. 1, 3, 4); however, bioturbation had a
significant affect on the pore water distribution ofNH4 at St. 3 (Fig. 12). At the
Texas City and Ship Channel stations, pore water NOx concentrations were
extremely high (>>bottom water concentration) throughout the upper 15 em of
the sediment column. NH4 showed increased concentration with depth but
concentrations were low(< 150 11M; Fig. 12). Despite higher P04 concentrations
in 1998, DIN/DIP ratios were still high, probably as the result ofP sorption to
Fe-minerals, and the predicted DIN/DIP fluxes suggest P limitation during most of
the year in the Trinity Bay region of Galveston Bay.
During November 1998, high river flow appeared to result in groundwater
inputs ofNOx to pore waters. At St. 1, in particular, a deep (25 em) peak in NOx
concentration (70 J.!M) was observed. We believe this deep peak reflects
groundwater input to river sediments. At St. 3 and 4, the depth distribution
patterns ofNOx and NH4 were similar. As we have seen before, bioturbation
results in erratic changes in pore water nutrient concentrations. At St. 5, NH4
concentrations increase linearly with depth and P04 concentrations also increase.
These are the highest P04 concentrations ever measured in Galveston Bay pore
water (by us). The absence ofNOx at depth and the clear pattern ofNH4 and P04
increase suggest that St. 5 sediments differ from sediments at St. 3 and 4, in that
they are not well mixed (bioturbated) and in fact, they are probably anoxic/sulfidic
at depths greater than 20 em (Fig. 13).
TWDB Final Report May 1999
-::I.e c,~
z
~+---r--1---+---r--+---+-~~-+8
0
• ~t ··' ............ ~ ..... ·. . . ... . .• • •. l •• •• I -..._ ••
• • •... ~ .... .. Y D ~ .
~~----r----+----+---~-----r----t----i~~~=--r
0
"'
0
0
• .
0
. "' .. ~-..... --....-.. . 0· .Q.
.. ~ ....... -...
0
"'
·CI'I ~=
00
-+ '...J
0 :c'"" 0 a; z e
0 0
"" 0 0 ,.,
8 00
8 .,.,
0 0
"" 0 0 ,.,
8 .,.,
8 "' -
:::1.
- + '.J oX"" -§; z [
0 0
"" 0 0 ,.,
Figure 12: Pore water concentrations of ammonium(+) [lowery axis] and nitrate+nitrite (0) and phosphate (D) [upper x axis] at Sta. 1, 3, 4, Texas City, East Bay and Ship Channel sites in August of 1998. Note that the scales of the two y-axes are different.
44

NO. & Po'· No· & P0 3 . No· & Po'· 3 4 3 4 3 4
J.LmOI L. 1 J.Lmol L" 1 J.Lmol L" 1
15 20 25 30 0 5 10 15 20 25 30 35 0 5 10 15 20 25 30 35 'N.l. 1?1 I I I 0 0 ·0 0 Sh. Ch (?l 0 898
5 • 5 . • - • :o 10 r1 \ r !Ott ..._ ~ t 10 +~·:··
0
~ 15 ~:/ ) l 15 -l-1 : / -1- 15 ' • -
'-" Depth 20 f.. Depth 20 + I I ~ -p."'l'"' 20 (em) : •. (em)
25 -t- -t- 25 I+ ~ I 25
3o -t- -t- 3o I 3o
BI I ·r r B TC Ill EB 898 ~ 898
4o I I I I I 4o I I I I I 4o
0 300 600 900 1200 1500 1800 0 300 600 900 1200 1500 1800 0 300 600 900 1200 1500 1800 NH• NH' NH'
4 4 4
J.Lmol L. 1
f!mol L" 1 f!mol L" 1

0
I ...,. oc I g "' .... ..:Q
Cl.l-
0 ....
0 0 <">
-+ '...J
0 :t:"" 0 ~ z §.
0 .,.
0 0
0
Figure 13: Pore water concentrations of ammonium ( +) [lower y axis] and nitrate+nitrite (0) and phosphate (0) [upper x axis] at Sta. 1, 3, 4, 5, Texas City and East Bay sites in November of 1998. Note that the scales of the two y-axes are different.
46

-1:>. ......
NO" & P0 3 . 3 4
~tmol I: 1
10 20 30 40 50 60 70 o k, :aalr I I I I I
5
10
15
Depth 20 (em)
25
30
35
~-, 0 .. ·r . ·• 0
+ 0 I
' .
r;> \· ~ .. '\ . .
o· .-. . .._.. . . , .... \ . ~ \ . ' . ~
•0
.. .. . . ·· .. sr .. s
1098 40+-~~---+--~r---+---,_~-r
0 100 200 300 400 500 600 NH+
4
~tmol I: 1
NO" & P0 3 . 3 4
~tmol L" 1
0 5 10 15 20 25 30 35
0 ~ ;:riJ ;::J:: I £)1 I I I
5
10
15
20
25
30
35 EB
1098 40+-----,_ ____ ,_ ____ ,_ ____ ,r
0 100 200 NH+
4
~tmol L. 1
300 400
No· & P0 3 • 3 4
~tmol L- 1
0 5 10 15 20 25 30 35 o +&r.l I =J1 I I I
5
10
15
20
25
30
35 TC
1098 ~+-~--+-----~----~----+
0 100 200 NH+
4
~tmol L" 1
300 400

Joye & An pg. 48
Benthic fluxes. A significant fraction of terrestrial nitrogen input to estuaries is
lost via denitrification (Seitzinger 1988; Nixon et al. 1996; Nowicki et al. 1997).
When denitrification is a major loss term, the process will either mitigate the
impact of increased nitrogen loading or result in nitrogen limitation of ecosystem
production (Seitzinger 1988; Nishio et al. 1982; Nixon et al. 1996; Seitzinger
1990). Studies of denitrification including the seasonal pattern, the controlling
factors and the importance of the process as a nitrogen removal process is
necessary to assess the impact of modified nitrogen loading either by natural or
anthrophogenic perturbations (Brock et al. 1996).
Benthic primary production transforms regenerated inorganic nitrogen
(NH/ and NOx) into organic forms at the sediment water interface (An 1999).
The aerobic microenvironment created by benthic primary producers, however, is
more important to nitrogen cycling than the organic matter production itself
(Revsbech et al. 1988). For example when sediment nitrification and
denitrification coupling is dependent on 0 2 availability (Kemp et al. 1990),
increased oxygen availability resulting from benthic primary production can -
indirectly- enhance denitrification (Risgaard-Petersen et al. 1994; Tomaszek et al.
1997). Benthic primary production in shallow estuaries is primarily light limited
(Revsbech et al. 1988; Macintyre and Cullen 1996). In many shallow estuaries,
however, benthic microalgae can be significant primary producers (Pinckney and
Zingmark 1991 ). Furthermore, their influence on benthic processes such as
aerobic respiration, nitrification, and denitrification (Revsbech et al. 1988;
Tomaszek et al. 1997; Boudreau 1997) can be significant. In the case of nitrogen
cycling in a shallow estuary like Galveston Bay, the role of benthic primary
production must be considered.
TWDB Final Report May 1999
Joye & An pg. 49
A large portion of our effort in this study has focused on determining the
nature of freshwater and nutrient inputs to Galveston Bay and then on correlating
biogeochemical activity with those variables (originally discussed in Joye and An
1998). To evaluate the importance ofbenthic primary production in Galveston
Bay, parameters relating to light availability (freshwater discharge, water column
chlorophyll and Secchi depth) were determined (Joye and An 1998; An 1999).
The seasonal patterns of benthic processes that impact nitrogen transformations,
such as remineralization, nitrification and denitrification, were related to various
environmental conditions that might affect the processes. Finally, the importance
of denitrification as a nitrogen sink in Galveston Bay was determined.
Freshwater inflow. Freshwater inflow was estimated from gauged data gathered at
USGS station # 8066500 which is located along the Trinity River at Romayor.
The amount of freshwater gauged at this station probably accounts for 94% of
estimated total freshwater input to Trinity Bay and 45% of the inflow to the
entire estuary from the drainage basin. Whole bay average fresh water input was
obtained from Brocket al. (1996). A very good linear relationship exists between
the gauged data and freshwater input averaged during 1988-1990 (Brock et al.
1996). The average freshwater input to Galveston Bay is 907 x 106 m3 month-1.
The freshet (high amount of freshwater input) usually occurs during winter and
spring. The average input at this time is 1370 x 106 m3 month-1 (An 1999).
During summer and fall, there is a dramatic decrease of freshwater input (140-580
x 106 m3 month-1 ). In the first year of our study, 1996, the freshwater input was
averaged 179 x 106 m3 month-1. Hydraulic residence time (t), estimated from the
freshness (f), the volume of the bay (V) and the freshwater inflow (Q; t = f"'V/Q;
TWDB Final Report May 1999

Joye & An pg. 50
Armstrong 1982), varied from a month (33 days) during high flow to 8 months
during low flow (summer and fall).
The total nitrogen input into Galveston Bay (gauged stream flow +
ungauged rainfall runoff+ waste water returns+ direct rainfalls) between 1988 to
1990 was estimated by Brocket a!. (1996). A good relationship was observed
between total N loading and freshwater discharge (Joye and An 1998; An 1999).
A linear equation was obtained using data from 1988-1990 (N loading ( 106 mole
N) = 2.7689 x freshwater discharge (106 m3 month ·1) + 749.99 (R2 = 0.99; Joye
and An 1998; An 1999). The total N loading to the bay between 1994-1998,
calculated using this equation, averaged 168 x 106 mol N month-1•
In Galveston Bay, benthic primary production is an important variable
that influences various benthic processes (An 1999). For example, at Station 3
where the benthic primary production is high (see below), measured N~ uptake
by sediments contradicted the calculated flux based on pore water profiles (An
1999). Benthic primary producers probably consume NH4 during
photosynthesis. The activity of benthic microalgae should be highest at the
surface of the sediment interface and the algae may intercept the nutrient flux (An
1999).
In our 1998 report, we showed that chlorophyll a concentrations in
surface sediments were extremely high, up to 1000 mg m·2 (Joye and An 1998; An
1999). Chlorophyll a concentration was low at the freshwater stations ( 1 and 2)
of the Trinity River. The average benthic chlorophyll concentration was 500 mg
chi. a m-2 (An 1999). While these chlorophyll concentrations are lower than those
typical of benthic microalgal mats ( 103 -106 mg chi. a m-2), they are similar to
TWDB Final Report May 1999

Joye & An pg. 51
those observed in other coastal environments (Krause-Jensen and Sand-Jensen
1998; Joye et al. 1996) and infer the importance of benthic primary production.
Warnken (1998) documented 19-65 mmole 0 2 m·2 d" 1 ofbenthic primary
production in Trinity Bay (near our St. 3 & 4) during March 1996 using a
light-dark chamber technique. In this current study, we documented 16 mmole 0 2
m·2 d" 1 net photosynthesis (photosynthesis -total sediment oxygen demand; see
discussion below) at Station 3 in November 1997. The measured benthic primary
production rate in Galveston Bay is higher than the rates found in shallow subtidal
sediments ofNorth inlet, South Carolina (12 mmole 0 2 m·2 d"1; Pinckney and
Zingmark 1993). However, the measurements of benthic primary production
made during this study are not enough to delineate the range of benthic primary
production rates in Galveston Bay. Despite this, the measured rates are
comparable to values obtained for water column primary production in Galveston
Bay (50-500 mmole 0 2 m·2 d" 1, see below).
Seasonal and spatial variation of denitrification. The average
denitrification rate estimated for Galveston Bay sediments during this study was
1.80 mmole N2 m·2 d"1 (Table 3). The highest rate, 4.58 mmole m·2 d" 1, was
measured in Nov. 1997 at Station 1 (Table 4). During summer, rates were high as
was variability between sites (1.93 mmole m·2 d" 1 at Texas City to 4.32 mmole m·2
day·1 at Station 5; Table 3, Figure 14). Denitrification rates were low during
winter, except in Jan-98 at Station 4, when the rate was comparable to the spring
and autumn values measured at the same station. Interannual variability was high
at Station 4 (0.60 and 1.47 mmole m·2 day·1 in Jan. 1997 and 1998, respectively)
and low in Texas City (0.58 and 0. 78 mmole m·2 day·1 in Jan. 1997 and 1998,
respectively) (Table 3-1). In Aug. 1997, the denitrification rates in two new
TWDB Final Report May 1999

Table 3. Benthic fluxes of inorganic nitrogen, N2, 0 2 and dissolved inorganic carbon (mmole m·'d" in Galveston Bay. Positive values represent the fluxes out of sediment. Grain size (% sand) and salinity (ppt), temperature (0 C), N03 and NH4 concentration of bottom water are also presented. ND: no data.
Month Station sand salinity Temp. [NO,] [NH,] N, NO, NH. 0, DIC (%) (ppt) ('C) (l.tM) (J.tM) +NO,
Jun-96 ST4 14 15 27 ND ND 1.67 ND ND ND ND
Aug-96 ST2 98 1.5 30 2.7 14.0 2.04 -0.25 2.97 -2.04 ND ST3 17 12 2.1 14.0 1.31 -0.17 -1.83 -18.97 ND
Texas City 87 17 0.8 0.0 1.04 0.04 0.28 -10.39 ND
Oct-96 ST4 90 3.5 24.5 8.0 12.3 0.90 -0.09 0.64 -14.32 18.45 Texas City 81 15 5.4 3.7 2.57 -0.01 -0.55 -2.00 3.00
Jan-97 ST4 21 5 15.4 0.7 0.3 0.60 0.01 0.03 -2.00 1.15 Texas City 78 23 0.5 0.0 0.58 -0.01 0.00 -1.80 4.50
Apr-97 STI 99 0 19.8 34.3 1.9 ND 2.60 -0.19 ND 30.39 ST4 55 0 37.6 1.0 1.03 -1.12 -0.05 -7.06 36.60
Texas City 79 1.2 16.3 0.5 0.69 0.02 -0.05 -7.28 9.60
Jul-97 ST2 98 0 31.2 1.0 ND 2.30 -0.02 0.10 -6.31 29.20 ST3 17 0 1.7 0.4 2.04 -0.13 0.14 -4.53 40.53 ST4 76 0.4 0.1 0.9 2.45 0.27 0.11 -8.54 21.39
Texas City 88 23.8 0.2 0.8 1.87 0.02 0.94 -6.62 18.35
Aug-97 ST3 17 3.4 31 0.9 1.3 ND 0.00 0.49 7.40 12.09 ST4 ND 5.3 0.9 0.2 2.26 0.14 0.43 -9.41 31.36 ST5 49 7.8 0.8 0.0 4.32 0.95 1.05 -11.12 32.80
East Bay 14 12.5 1.0 2.9 2.80 -0.02 1.36 -8.50 25.40 Texas City 86 28.6 0.4 0.6 1.93 0.02 0.82 -9.23 18.76
Nov-97 STI 99 0 15.6 4.2 4.6 4.58 -0.48 2.25 -5.49 36.30 ST3 17 0.4 4.2 4.2 3.94 -0.14 -0.12 15.90 5.62 ST4 ND 0.4 3.6 5.5 1.79 0.13 1.58 -9.11 19.31
Jan-98 ST3 17 0 14.5 36.4 3.0 0.29 -0.64 -0.12 1.70 9.85 ST4 ND 0 39.1 ND 1.47 -0.64 ND -9.30 ND
Texas City 83 13 20.5 ND 0.78 -1.95 ND -1.03 I 1.68
Apr-98 STI ND 0 18 44.0 0.0 1.40 -0.83 0.85 -1.39 ND ST3 ND 0 44.6 0.0 2.62 -2.10 1.30 16.83 ND ST4 ND 0 41.0 0.0 2.79 ND ND 0.97 ND
East Bay ND 2 21.6 7.8 1.06 0.06 -0.36 1.61 ND Texas City ND 2.5 2.6 4.8 0.44 -0.06 1.55 1.55 ND Ship Chan. ND 5 ND 3.2 1.43 O.D7 2.58 -3.95 ND
Aug-98 East Bay ND 20.4 31 0.4 13.0 0.99 0.00 1.99 -10.16 ND Texas City ND 31.3 0.8 3.0 1.05 0.01 1.69 -6.68 ND Ship Chan. ND 31 0.6 1.2 1.94 0.01 1.90 -6.99 ND
Oct-98 STI ND 0 20 10.7 4.1 2.23 -0.23 -0.08 -2.26 ND ST3 ND 0 10.2 7.9 0.11 -0.16 0.89 -6.20 ND ST4 ND 5.8 10.3 16.1 3.42 -0.18 1.42 -4.71 ND ST5 ND 6.4 20.0 14.2 1.37 0.08 0.41 -3.00 ND
East Bay ND 11.4 15.9 1.7 0.84 -0.66 0.45 -4.27 ND Texas Citv ND 19.5 11.9 1.8 0.47 0.25 0.28 -2.65 ND
52
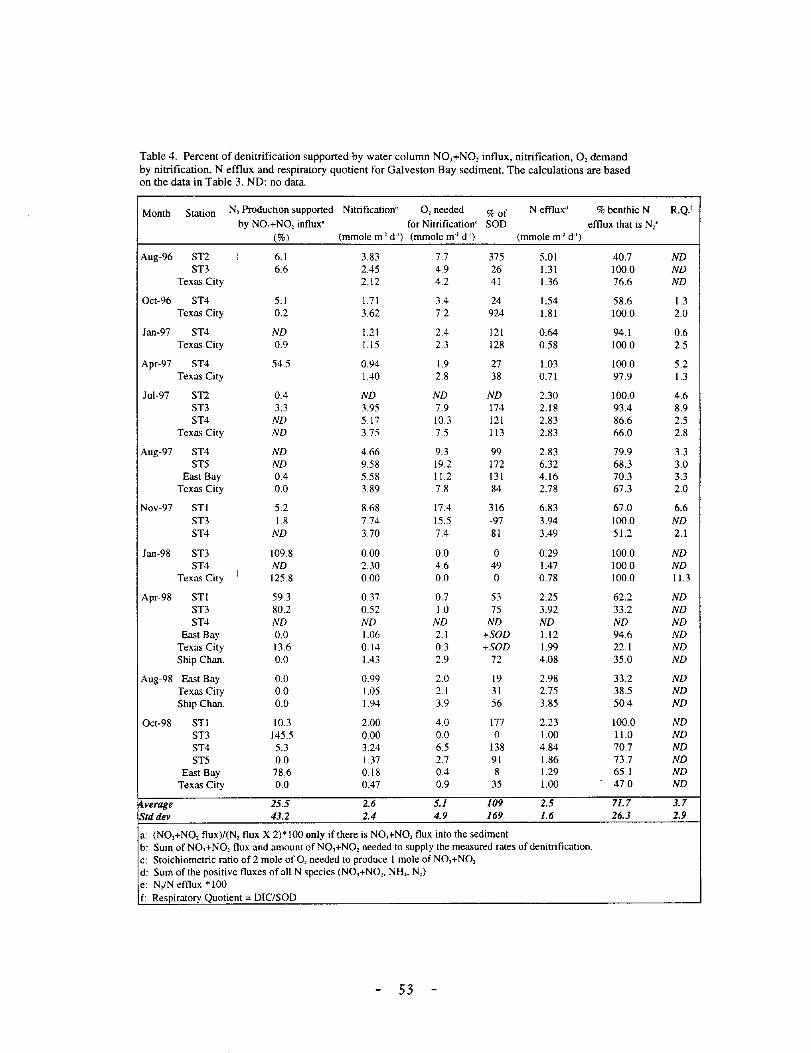
Table 4. Percent of denitrification supported by water column NO,+NO, influx, nitrification, 0, demand by nitrification, N efflux and respiratory quotient for Galveston Bay sediment. The calculations are based on the data in Table 3. NO: no data.
Month Station N, Production supported Nitrification[> 0, needed %of N effluxd %benthic N by NO,+NO, influx' for Nitrification" SOD efflux that is N,e
(%) (mmole m' d·') (mmole m·2 d-1) (mmole m·2 ct·1
)
Aug-96 ST2 J 6.1 3.83 7.7 375 5.01 40.7 ST3 6.6 2.45 4.9 26 1.31 100.0
Texas City 2.12 4.2 41 1.36 76.6
Oct-96 ST4 5.1 1.71 3.4 24 1.54 58.6 Texas City 0.2 3.62 7.2 924 1.81 100.0
Jan-97 ST4 ND 1.21 2.4 121 0.64 94.1 Texas City 0.9 1.15 2.3 128 0.58 100.0
Apr-97 ST4 54.5 0.94 1.9 27 1.03 100.0 Texas City 1.40 2.8 38 0.71 97.9
Jul-97 ST2 0.4 ND ND ND 2.30 100.0 ST3 3.3 3.95 7.9 174 2.18 93.4 ST4 ND 5.17 10.3 121 2.83 86.6
Texas City ND 3.75 7.5 113 2.83 66.0
Aug-97 ST4 ND 4.66 9.3 99 2.83 79.9 ST5 ND 9.58 19.2 172 6.32 68.3
East Bay 0.4 5.58 11.2 131 4.16 70.3 Texas City 0.0 3.89 7.8 84 2.78 67.3
Nov-97 STI 5.2 8.68 17.4 316 6.83 67.0 ST3 1.8 7.74 15.5 -97 3.94 100.0 ST4 ND 3.70 7.4 81 3.49 51.2
Jan-98 ST3 109.8 0.00 0.0 0 0.29 100.0 ST4 ND 2.30 4.6 49 1.47 100.0
Texas City J 125.8 0.00 0.0 0 0.78 100.0
Apr-98 STI 59.3 0.37 0.7 53 2.25 62.2 ST3 80.2 0.52 1.0 75 3.92 33.2 ST4 ND ND ND ND ND ND
East Bay 0.0 1.06 2.1 +SOD 1.12 94.6 Texas City 13.6 0.14 0.3 +SOD 1.99 22.1 Ship Chan. 0.0 1.43 2.9 72 4.08 35.0
Aug-98 East Bay 0.0 0.99 2.0 19 2.98 33.2 Texas City 0.0 1.05 2.1 31 2.75 38.5 Ship Chan. 0.0 1.94 3.9 56 3.85 50.4
Oct-98 STI 10.3 2.00 4.0 177 2.23 100.0 ST3 145.5 0.00 0.0 0 1.00 11.0 ST4 5.3 3.24 6.5 138 4.84 70.7 ST5 0.0 1.37 2.7 91 1.86 73.7
East Bay 78.6 0.18 0.4 8 1.29 65.1 Texas City 0.0 0.47 0.9 35 1.00 47.0
~verage 25.5 2.6 5.1 109 2.5 71.7 Std dev 43.2 2.4 4.9 169 1.6 26.3
a: (NO,+NO, flux)/(N, flux X 2)*1 00 only if there is NO,+NO, flux into the sediment b: Sum ofNO,+N02 flux and amount ofN01+N02 needed to supply the measured rates of denitrification. c: Stoichiometric ratio of 2 mole of 0 2 needed to produce I mole of NO~+N02 d: Sum of the positive fluxes of all N species (NO,+ NO,. NH,. N,) e: N,IN efflux *1 00 f: Respiratory Quotient- DIC/SOD
53
R.Q.'
ND ND ND
1.3 2.0
0.6 2.5
5.2 1.3
4.6 8.9 2.5 2.8
3.3 3.0 3.3 2.0
6.6 ND 2.1
ND ND 11.3
ND ND ND ND ND ND
ND ND ND
ND ND ND ND ND ND
3.7 2.9

(A) Denitrification and N load
.. sr1 oST2 50
4.5 eST3 oST4 .. • '•
4 •ST5 oTC ,, ,, 40 • '• eEB oSC " ''
~ 3.5 0
~ 3 30 j! 0
~ 2.5 • ~
" 0 ·~, '. .. .§. ' 2 " • ... 20 "- o· 0 0
0 a 1.s 0
0 .. • • 1 0
0 ' ,- 0 0 10 '' 0 '&l 0
0.5 :o .. ' I. ·'! . . ' •
0 0 Jan-98 Mar-96 Jun-96 Sep-96 Oec-96 Mar-97 Jun-97 Sep--97 Oec-97 Mar-98 Jun-98 Sep-98 Dec-98
(B) DIC flux and Temperature 50
.. sr1 oST2 • ST3 oST4
40 •ST5 oTC • -::- •EB oSC
2: "II
~ 30
0 ..
Q. 0 E E ~ .§. t-
~ 20 o·· "'
0 0 0
u i5 • 10 0
0 • 0+---~----~----~o ____ ~o~--~--------~--------~----~---------. Jan-96 Mar-96 Jun-96 Sep-96 Dec-96 Mar-97 Jun-97 Sep-97 Oec-97 Mar-98 Jun-98 Sep-98 Dec-98
(C) SOD and temperature
20 .. sr1 oST2 • • ST3 o ST4 • ST5 oTC • EB o SC
0
0
0 l:l
• 0
• • i 0 0
0 • .. i
0 c ~
0 o+-------------~0~--~------~----r---~--~----r---~--~
80
60
40
20
0 Jan-96 Mar-96 Jun-96 Sep-96 Dec-96 Mar-97 Jun-97 Sep-97 Dec-97 Mar-98 Jun-98 Sep-98 Oec-98
Figure 14. A. Temporal variation of denitrification rate (data points), N loading (dotted line), and temperature (solid line); B. DIC flux (data points) and temperature (solid line); and C. sediment oxygen demand (SOD; data points) and temperature (°C). Legends provide site identification.
54
z ~ E
~ 0 .Q
~ Q.
E ~
"5 t-Q.
.s z
I> 0: E ~ t-

Joye & An pg. 55
stations were very high (4.32 and 3.21 mmole m·2 day· 1 at St. 5 and East Bay,
respectively). The high DIC flux and SOD (sediment oxygen demand) and NH4
flux suggest significant rates ofremineralization at these sites (Table 3). In the
Galveston Bay system, the shallow water depth maintains the well-oxygenated
bottom water despite the high SOD recorded at Station 4 (Table 3). This general
statement may not hold true for Trinity mid-River stations, where marked 0 2
depletion in bottom waters was observed during Aug. 1998.
The percent of denitrification supported by water column N03 + N02
versus that supported by in situ nitrification varies with time and space (Table 4).
Water column N03 supported denitrification completely on several occasions.
For example, during April 1997 and January 1998, when the water column N03
concentration was high (20.5 - 45 J.!M) due to increased freshwater discharge,
N03 fluxes into the sediment support a significant fraction of denitrification
activity at St. 3 (110%), St. 4 (55%) and Texas City (126%) (Table 4). Water
column N03 concentration during January 1997 were lower than those measured
in 1998 at St. 4 and Texas City. In January 1998, denitrification rates at St. 4 and
Texas City were higher than those measured in January 1997, and the increased
denitrification rates were reflected in a substantial N03 uptake by the sediments in
1998 relative to 1997.
Benthic N03 fluxes were almost always directed into the sediments,
however the fluxes were usually small compared to the total N2 flux. The N03 flux
into the sediments, even if it is assumed that all fluxes were consumed via
denitrification, supported, on average 25% denitrification (Table 4), suggesting
that the main source ofN03 for denitrification was from in situ nitrification
(Kemp eta!. 1990; Seitzinger 1988).
TWDB Final Report May 1999

Joye & An pg. 56
The seasonal variation in denitrification, temperature and nitrogen loading
in Galveston Bay is shown in Fig. 14 (statistical results discussed later). As
typically observed for any microbially mediated process, denitrification, the DIC
flux and the SOD are well correlated with temperature fluctuations (Fig. 14).
Nitrogen loading, however, did not fully explain the observed variability in
denitrification rates. The highest denitrification rates corresponded to the time
when nitrogen loading were the lowest. The general seasonal pattern of
denitrification observed in many estuaries is a maximum in spring and a depression
in mid summer (Koike and S0rensen 1988; Kemp et a!. 1990). During spring or
early summer, elevated temperatures lead to maximum denitrification rates because
N03 is still abundant. Spring plankton blooms rapidly exhaust riverine N03 and
denitrification is minimal during mid summer (Seitzinger eta!. 1985; J0rgensen and
S0rensen 1985). Oxygen availability also contributes to the mid summer
depression. In many shallow coastal environments, denitrification is closely
coupled to nitrification. Thus, nitrification and denitrification rates exhibit similar
temporal trends (Koike and S0rensen 1988; Kemp et a!. 1990). Sediment
nitrification is generally dependent on the availability ofNH4 and 0 2 (Henriksen
and Kemp 1988). Since NH4 regeneration increases with temperature and
nitrification is a temperature dependent microbial process, nitrification rates
should be maximal during summer (Kemp and Boyton 1981 ). However, Kemp et
a!. (1990) found minimal nitrification (and denitrification) rates during summer
time in Chesapeake Bay, which typically experienced summer time anoxia in
bottom waters. Even if the bottom water does not become anoxic, the oxygen
penetration depth is reduced because of increased SOD and this limits the volume
of sediments in which nitrification can occur (Kemp eta!. 1990).
TWDB Final Report May 1999

Joye & An pg. 57
Unlike Chesapeake Bay, a spring maximum and mid summer depression of
denitrification was not observed in Galveston Bay. Even though some evidence of
stratification is observed during summer, hypoxic/anoxic conditions are not
common in Galveston Bay during the summer at present (except for example in
Offats Bayou). When oxygen is not limiting, coupled nitrification-denitrification
should be maximal during summer when the NH4 regeneration is highest
(MacFarland and Herbert 1984; Jenkins and Kemp 1984). Kemp et al. (1990)
observed summer time maximum concentrations ofNH4 and N2 flux when 0 2 was
not limiting. Though a seasonal trend in the NH4 flux was not obvious,
remineralization activity (DIC flux) was highest during summer in the current
study (Figure 14). In terms of spatial variability, average denitrification rates were
highest at St. 1 in the Trinity River, with rates at the other core stations being
similar (Fig. 15).
Nitrification and benthic primary production. Nitrification can be estimated from
the observed N2 and N03 flux data, assuming there was no N03 or N02 reduction
to NH4 (Table 4; Zimmerman and Benner 1994; Kemp et al. 1990; Koike and
Hattori 1979; Jenkins and Kemp 1984 ). We used stoichiometric ratios between
nitrification and 0 2 consumption, to estimate 0 2 consumption related to
nitrification. Finally, using benthic N flux data, we were able to calculate the
percent of the benthic N flux present as N2 (Table 4, calculations explained on the
table).
The average nitrification rate in Galveston Bay sediments is 2.6 mmol m·2
d·1; this value is higher than the Bay average denitrification rate (1.8 mmol m·2 d" 1).
The average N flux from Galveston Bay sediments is 2.5 1.8 mmol m·2 d-1 and, of
that, 72% is N2 gas (Table 4). The nitrification rate ranged between 0 and 9.6
TWDB Final Report May 1999

-7 ":"
f "C 6
N
E: 5 ~4-0
t E 3-.§. 2 - •
+ LL z 1-0 0
ST1 ST2 ST3 ST4 TC
Stations
Figure 15. Annual average denitrification rate (circle) and standard deviation (bar) in Galveston Bay. See Figure 1 for the locations of stations. TC=Texas City. Stations are arranged from low (STl) to high (TC) salinity.
- 58 -

Joye & An pg. 59
mmole m·2 d" 1 and exhibited distinct seasonal variation. The rate was high during
summer (avg. = 4.7 mmole m·2 d"1) and low during winter (avg. = 0.93 mmole m·2
d"1). Interestingly, nitrification was low during Apr-97 (avg. = 1.2 mmole m·2 d"1)
when the water column N03- concentration was elevated due to high freshwater
flow, as was the case during Jan-98 despite the higher than usual temperature and
fairly high DIC flux.
The 0 2 demand resulting from nitrification accounts for I 09% of the
measured SOD (Table 3, Table 4). In coastal environments, 0 2 consumption by
nitrification frequently accounts for 35% of SOD (Henriksen and Kemp 1988).
Zimmerman and Benner (1994) report a value of21- 35% in Galveston Bay.
Besides the fact that current estimation of 0 2 consumption by nitrifiers is
exceptionally high compared with other estuaries and previous estimates, a value
exceeding 100% of SOD requires an additional 0 2 source. Though the existing
measurements of benthic primary production in Galveston Bay are not enough to
delineate the annual average benthic primary production, the measured benthic
primary production rates in Galveston Bay are comparable to water column
primary production (see discussions above; Amstrong 1987; Zimmerman and
Benner 1994; Krause-Jensen and Sand-Jensen 1998). We have observed 0 2
production during chamber incubations at St. 3 and 4 during this study (Aug. 97,
Nov. 97, Jan. 98, Apr. 98; Table 3). The oxygen production rate in November
1997 at Station 3 (15.9 mmole m·2 day-1) was comparable to the highest SOD
measured at the station. The high benthic chlorophyll a concentration also
indicated active benthic primary production (An 1999).
Benthic microalgal production is important for sustaining benthic
processes such as aerobic respiration, nitrification and denitrification (Risgaard-
TWDB Final Report May 1999

Joye & An pg. 60
-Petersen eta!. 1994; Tomaszek eta!. 1997; Revsbech eta!. 1980; Henriksen and
Kemp 1988; Koike and Sorensen 1988; Anderson et a!. 1984; An 1999).
Recently, enhanced nitrification and denitrification coupling by benthic
photosynthesis was reported {Tomaszek eta!. 1997; Risgaard-Petersen eta!.
1994), which contradicts Henriksen and Kemp's (1988) hypothesis that
photosynthesis should inhibit coupled nitrification and denitrification.
Among the occasions when there were obviously high rates of benthic
photosynthesis (see Table 3), no nitrification was observed only in Jan-98. The
direction of the N03 and NH4 benthic flux was into the sediment and the
denitrification rate was the lowest measured. Although oxygen production was
not detected at Texas City at the same time, the observed 0 2 and DIC flux
(respiratory quotient =11.7) and large influx ofN03 that exceeded the N03 needs
for observed denitrification suggest a high rate of primary production in this site
(Table 3). These observations suggest that photosynthesis inhibited nitrification
and coupled denitrification at this time. However, in Nov. 1997, there was a
considerable amount of nitrification and denitrification. At this time, primary
production did not seem to inhibit nitrification, though the predicted rate of
photosynthesis should have been much higher than in Jan. 98 (the 0 2 production
was an order of magnitude higher and there was DIC flux reduction compared to
other seasons). No obvious environmental factors observed could account for this
difference, other than the large freshwater input and associated increase in N03
concentration in Jan. 98.
Despite the lack of net 0 2 production, the discrepancy between 0 2 needed
for nitrification and measured SOD suggests that the benthic photosynthesis is
required to support the rates of measured nitrification and coupled denitrification
TWDB Final Report May 1999

Joye & An pg. 61
in Galveston Bay. This link between photosynthesis and nitrification was not
evident until the measurements were performed in situ. The effect of increased
photosynthetic 0 2 concentration on denitrification is complicated by the fact that
though increased N03 availability stimulates denitrifying bacteria (by stimulating
nitrification), it may also inhibit facultative anaerobic processes such as
denitrification. A simple three box model was used to evaluate the overall effect of
primary production on denitrification but these results are not presented here (An
1999).
Conceptual framework and Modeling Results. The sediment oxygen demand
(SOD) has been used as a representative index of total remineralization activity
(Smith and Teal1973; Rowe eta!. 1975). In typical estuaries, large portions of
reduced chemicals produced during anaerobic respiration (sulfide or ferrous iron)
are reoxidized within the sediments (Sorensen eta!. 1979; Howes et a!. 1984 ).
When the rexoidation is complete, the SOD represents the total remineralization
activity (Sorensen et a!. 1979; Howes eta!. 1984; Rowe et a!. 1988). In this case,
the SOD should balance the benthic dissolved inorganic carbon (DIC) flux, in other
words, the ratio ofDIC:SOD would be I (Rowe eta!. 1988). DIC:SOD values
greater than I indicate the importance of anaerobic respiration, while a ratio of 1
indicates that 0 2 is the primary oxidant, even if part of the 0 2 flux was consumed
by inorganic oxidation, rather than organic oxidation.
The lowest DIC flux was measured at St. 4 in January 1997 (1.15 mmole
m-2 d" 1) and the highest rate ( 40.5 mmole m·2 d"1) was measured at St. 3 in July
1997 (Table 3). The highest SOD was measured at Sta. 3 in August 1996, but the
DIC:SOD was less than 1. At Station 3, 0 2 production during incubations was
frequently observed. The seasonal and spatial variability of the SOD was usually
TWDB Final Report May 1999

Joye & An pg. 62
less than that of the DIC flux; average fluxes were 17.7 mmole m·2 d- 1 for DIC and
6.9 mmole m·2 d- 1 for the SOD. While the SOD is 50% higher than previous
measurements in Galveston Bay (average SOD= 4.6 mmole m·2 d-1; Zimmerman
and Benner 1994), DIC production is about 4 times larger than the previous
measurement ( 4.3 mmole m·2 d- 1). The respiratory quotient (R.Q.) of the previous
study was almost 1, which is the theoretical value reflecting a dominance of
aerobic respiration processes (Rowe et al. 1988). The R.Q. values in the current
study were usually greater than 1 (except Sta. 4 in January 1997, Table 3) and the
average was 2.6. The highest value (11.3) was observed at St. 4 in January 1998.
High R.Q values (2 to 2.4) have been documented in many coastal
environments (Dollar et al. 1991; Hargrave and Philips 1981; Joye et al. 1996).
Hargrave and Philips ( 1981) suggested that a mismatch or time lag between
anaerobic respiration (sulfate reduction) and oxidation of reduced compound
(sulfide) might be responsible for the high R.Q. According to this explanation,
however, the annual average R.Q. should approach 1 since the 0 2 debt produced
during summer due to the high remineralization rate should be paid off sometime
during winter.
Pyrite formation could also contribute to the high R.Q. If the sulfide
produced during sulfate reduction is not re-oxidized and instead forms pyrite, the
resulting DIC/SOD ratio would be high. Lin and Morse ( 1991) found a linear
relation between pyrite formation and organic matter content in the Gulf of
Mexico. Pyrite formation in Galveston Bay should not be a major contributor
since most of the sulfide is reoxidized and the order of magnitude of DIC flux is
much larger (Morse and Berner 1994). Another possibility that can alter the DIC
flux is the occurrence of carbonate precipitation/dissolution. High rates of organic
TWDB Final Report May 1999

Joye & An pg. 63
matter degradation in the bottom water of coastal environments produce acidic
conditions and can lead to carbonate dissolution (Boudreau 1987; McNichol eta!.
1988; Zimmerman and Benner 1994). Generally, the magnitude of DIC production
due to carbonate dissolution compared to that ofremineralization is considered
minor in coastal environments (Aller 1982; Boudreau and Canifield 1988). The
depth profile of the inorganic carbon concentration of the sediment core from
Station 4 (up to 60 em) was variable but showed a constant trend with depth
(Rowe unpublished data), which suggests that long term carbonate dissolution is
not important at this station.
Nitrification, methane oxidation, and DOC flux could also contribute, to
some degree, to modifYing the R.Q. (Zimmerman and Benner 1994). Another
potentially important process for the DIC and 0 2 inventory at the sediment water
interface is benthic photosynthesis. Benthic photosynthesis appears to be high in
the Galveston Bay system. When the benthic photosynthesis is an important
process, the observed DIC and 0 2 flux will be the net result of organic matter
decay and organic matter production (photosynthesis). Generally, DIC flux
exhibits a positive relationship with the SOD. However, at St. 3, a negative
relationship between the DIC and SOD was observed. An additional process
influencing 0 2 and C02 flux besides remineralization, e.g. photosynthesis, could
explain this negative relationship.
Benthic photosynthesis consumes C02 and produces 0 2. When the R.Q.
is exactly 1, and the photosynthetic quotient (P.Q. = 0 2 production I C02
assimilation during photosynthesis) is also exactly 1, photosynthesis should not
affect the R.Q. value. If the R.Q. is greater than I, however, even if the P.Q. is 1,
the R.Q. value will be increased by photosynthesis. For example, let
TWDB Final Report May 1999

Joye & An pg. 64
R.Q. = rC02/r02
(rC02 , r02 ; C02 production and 0 2 demand during remineralization)
P.Q. = pC02/pOz
(pC02 , p02; C02 assimilation and 0 2 production during photosynthesis)
IfR.Q = P.Q. = 1, after the some amount(<!>) of photosynthesis, the net fluxes of
0 2 and C02 are:
C02 flux= rC02 - <!> x pC02
and
0 2 flux= r02- <!> x p02
Since rC02 = r02, pC02 = p02, the result is R.Q.=l.
However, ifR.Q. = l+a (a= positive number) and P.Q. = 1, after the
same amount(<!>) of photosynthesis, the net fluxes of 0 2 and C02 are:
C02 flux = rC02 - <!> x pC02
and
0 2 flux= r02- <!> x p02
Since rC02 = (1 +a) x r02, pC02 = p02, the resulting R.Q.= 1 +ax r02/ (r02-
<!> x p02). Since the term (r02 - <!> x p02) is smaller than r02, the resulting R.Q. is
larger than 1 +a.
Furthermore, the P. Q. is known to be greater than 1. The theoretical value
of P.Q. estimated from the reduction level of materials that plankton cells
assimilate during photosynthesis is 1.03- 1.3, depending on the nitrogen source
(Falkowski and Raven 1997; Williams and Robertson 1991). When the P.Q. is
greater than 1, the R.Q. value will be affected even more since the denominator
TWDB Final Report May 1999

Joye & An pg. 65
decreases while the nominator increases. The reported P.Q. range of natural
plankton populations is from 0.5 to 3.5, having the bimodal distribution centered
on 1.25-1.5 (when NH/ is nitrogen source) and 2.0-2.5 (when N03· is nitrogen
source) in their frequency distribution (Williams and Robertson 1991; Garcia and
Purdie 1994).
To estimate the rate of photosynthesis that can explain the observed R.Q.
values, a simple model was used to calculate the remineralization rate, the
photosynthetic rate, nitrification and denitrification rates. Regeneration (R),
photosynthesis (P), nitrification (N) and denitrification (D) were assumed to be
the major processes affecting the fluxes (all rates are mmole m-2d- 1). The moles of
ammonia needed to assimilate one mole of C02 (a) during nitrification is known to
vary from 5 to 100 (Zehnder and Stumm 1988). However, the overall result was
not sensitive to this number and a value of 50 was chosen for a .. Molar ratios
between 0 2 and NH4 (~)and between C02 and N2 production (y) of 2 and 2.5,
respectively, were taken from Zimmerman and Benner (1994). A P.Q. of 1.8 was
chosen (Williams and Robertson 1991; Garcia and Purdie 1994), assuming the
source of N supporting photosynthesis was NH4 since it was well known that
phytoplankton prefer NH4 to N03 and it is unlikely that NH4 supply is limited in
sediment. A CIN ratio (C2N) of6 was chosen (Falkowski and Raven 1997) and
two different values ofR.Q. (R.Q.=1 and R.Q.=2) were compared in the
calculation. The equations are:
DIC flux = R- P - N/a + y x D ------------------------------- ( 1)
0 2 flux =- RIR.Q. + P x P.Q.- ~ x N ------------------------- (2)
NH4 flux= RIC2N -P/C2N- N--------------------------------- (3)
N03 flux= Nit- 2 x D ------------------------------------------- ( 4)
TWDB Final Report May 1999

Joye & An pg. 66
The four model equations can be solved simultaneously using the observed
DIC, 0 2, NH4 and N03 flux (Table 3). Except on two occasions (St. 4, Jan-97 and
Texas City, Apr. 97), the equations produce values similar to the observed field
data (Tables 3 & 5). The total (gross) remineralization rate was 2.3 (R.Q.=l) and
1.5 (R.Q.=2) times greater than the observed DIC flux. The modeled nitrification
and denitrification rates did not exhibit a significant relationship to measured
nitrification (estimated from the denitrification and N03 flux) or denitrification
rates (from Table 3). However, the average modeled rate of nitrification (2.56 and
2.67 mmol m-2 d- 1 for RQs of I and 2 respectively) was similar to the average
nitrification rate obtained from field data (2.6 mmol m-2 d-1). Modeled
denitrification rates were about 60% of measured rates. Modeled nitrification and
denitrification rates were not sensitive to variations in the R.Q.; however, total
remineralization and photosynthesis were sensitive to the variations in the R.Q.
(Table 5).
The model average photosynthetic rate was 22.7 (R.Q.=l) or 8.45
(R.Q.=2) mmol m-2 d- 1• The relationship between modeled remineralization rates
and modeled photosynthetic rates was poor. The modeled photosynthetic rates
were high between April and November and low in January. There was a decrease
in photosynthesis in August, but trends were not clear.
The average ratio between photosynthesis and remineralization (P/R) was
0.53 when R.Q.=l and 0.3 when R.Q.=2 (Table 5). When the R.Q. value was
high, lower rates of photosynthesis relative to remineralization were needed to
TWDB Final Report May 1999

Table 5. Calculated remineralization (R), photosynthesis (P), nitrification (N) and denitrification (D) rates (mmole m'd·') from the equations described (See text). Calculations are based on the data in Table 3. ND : no data.
R.Q.=I R.Q.=2
Month Station R p N D P/R R p N D
Oct-96 ST4 22.8 7.0 2.0 1.0 0.3 ND ND ND ND Texas City 4.0 2.1 0.9 0.4 0.5 2.5 0.5 0.9 0.4
Jan-97 ST4 negative solutions negative solutions Texas City 7.7 4.0 0.6 0.3 0.5 4.7 1.0 0.6 0.3
Apr-97 ST1 74.4 46.7 4.8 1.1 0.6 45.8 18.1 4.8 1.1 ST4 69.1 39.9 4.9 3.0 0.6 42.5 13.3 4.9 3.0
Texas City 12.2 4.3 1.4 0.7 0.3 negative solutions
Jul-97 ST2 56.7 32.4 4.0 2.0 0.6 34.9 10.6 4.0 2.0 ST3 83.7 50.1 5.5 2.8 0.6 51.5 17.9 5.5 2.8 ST4 23.0 4.9 2.9 u 0.2 23.0 4.9 2.9 1.3
Texas City 32.6 16.4 1.8 0.9 0.5 20.1 3.9 1.8 0.9
Aug-97 ST3 36.1 25.6 1.3 0.6 0.7 22.2 11.7 1.3 0.6 ST4 58.1 31.5 4.0 1.9 0.5 35.8 9.2 4.0 1.9 ST5 61.5 32.3 3.8 1.4 0.5 37.9 8.6 3.8 1.4
East Bay 45.8 23.4 2.4 1.2 0.5 28.2 5.8 2.4 1.2 Texas City 30.2 13.8 1.9 0.9 0.5 18.6 2.2 1.9 0.9
Nov-97 STI 72.6 40.7 3.1 1.8 0.6 44.7 12.8 3.1 1.8 ST3 31.9 27.5 0.9 0.5 0.9 19.6 15.2 0.9 0.5 ST4 32.1 14.3 1.4 0.6 0.4 19.7 2.0 1.4 0.6
Jan-98 ST3 22.1 14.7 1.4 1.0 0.7 13.6 6.2 1.4 1.0 ST4 ND ND ND ND ND 1D ND ND ND ND
Texas City ND ND ND ND ND ID ND ND ND ND
Average 40.88 22.70 2.57 1.24 0.53 27.37 8.45 2.67 1.29
67
PIR
ND 0.2
0.2
0.4 0.3
0.3 0.3 0.2 0.2
0.5 0.3 0.2 0.2 0.1
0.3 0.8 0.1
0.5 ND ND
0.30

Joye & An pg. 68
explain the observed DIC and 0 2 flux. How well the simplified relationships
between various processes in the simple model equations represent the real
processes occurring in the sediments is difficult to evaluate. The result of this
simple exercise does show, however, the importance of photosynthesis in
shaping, at least in a short time scale, the fluxes ofDIC and 0 2 in shallow
estuarine sediments. This exercise also underscores the importance of in situ
incubation experiments. For example, the effect of photosynthesis could not have
been observed in the previous study of Zimmerman and Benner ( 1994) since their
flux measurements were performed in the dark.
Environmental controls on Denitrification. Figure 16 shows a simplified conceptual
relationships between various processes and relevant materials in coastal sediments, with
an emphasis on denitrification. River discharge introduces organic (labile organic C) and
inorganic materials (N03) that fuel denitrification. At the same time, however, river
discharge decreases salinity (which should increase N removal; Joye, Lee and Carini, in
preparation) and reduces the residence time of the system (which should decrease N
removal; Nixon et a!. 1996). Increased temperature will enhance all microbial processes,
including denitrification and benthic photosynthesis (Jorgensen 1977; Koike and S0rensen
1988; Henriksen and Kemp 1988). Primary producers and nitrifying consume NH4
produced during organic matter degradation. Whether benthic primary producers compete
with nitrifiers for NH4 (thereby inhibiting nitrification) or provide 0 2 for them (thereby
enhancing nitrification) (Henriksen and Kemp 1988) appears to vary seasonally in
Galveston Bay. Increased 0 2 availability due to benthic primary production has been
shown to enhance nitrification in other systems (Risgaard-Petersen eta!. 1994) as well as
TWDB Final Report May 1999

"" "'
-----,
--
t
I ~~;;:h;~li~n ~- - - - - - - - - - _J
Figure 16. Conceptual relationships between various processes emphasizing denitrification. Solid arrows reprcscul positive effect, while broken arrows represent negative effect.

Joye & An pg. 70
in this system (discussion above; An 1999; Joye and An, in preparation). Whether
primary production inhibits or enhances nitrification and nitrification-denitrification
coupling is regulated by the balance between photosynthesis and respiration. High rates
of photosynthesis could stimulate nitrification, but at the same time inhibit denitrification
(high [02] inhibits denitrification {Tiedje et al. 1989). The interaction between benthic
photosynthesis and nitrogen cycling is therefore complex and varies on daily as well as
seasonal/annual time scales.
Joye and Hollibaugh ( 1995) proposed sulfide inhibition of nitrification as a
mechanism to explain the increased coupling efficiency between nitrification and
denitrification in freshwater sediments. Increased salinity will enhance sulfate reduction
(sulfide production rate) and sulfide concentration in sediment. Direct (toxic to
denitrifiers) and indirect effects (via reduced nitrification) of increased sulfide
concentration on denitrification should result in decreased rates of activity. The overall
effect of various environmental factors, such as temperature and freshwater discharge, on
denitrification will be determined by the presence of various processes and compounds
that may enhance or inhibit the denitrification complicated ways.
Statistical analysis. Table 6 presents the result of an Analysis of Variance
(ANOVA) of the process and environmental data collected during this study.
Water temperature explained the 68, 26 and 42% variability of denitrification,
SOD and DIC flux respectively (Table 6). Salinity variability did not significantly
relate to any process. Total nitrogen loading and percent sand accounted for about
TWDB Final Report May 1999

Table 6. Percent of variance accounted for by environmental factors. Data are pooled from all stations and seasons.
Environmental factors Denitrification SOD DIC flux
Water temperature 68 26 42 Salinity 0 0 0
Total nitrogen loading 9 6 6 Percent sand 11 5 4 Chlorophyll 0 15 3
71

Joye & An pg. 72
10% of the variability of denitrification. The variability of SOD was well
explained by sediment chlorophyll g concentration, as opposed to denitrification
and/or DIC flux. Since many environmental variables were inter-dependent, it was
difficult to elucidate the effect of individual variables.
Principal component analysis (PCA) was used to reveal independent
(orthogonal) sets of factors that can be related to each variable or process (Sneath
and Sokal 1973; Figure 17). Three factors explained 82% of the variability and
were used to coordinate the variables and processes (Figure 17). Factor one
explained 44% of the variability and was positively correlated with temperature (r
=0.82), DIC flux (0.90) and denitrification (0.80) and negatively related with
salinity (-0.47) and N03 concentration (-0.24). Factor 1 appeared to represent
season (or temperature). Factors 2 and 3 explained 23.4% and 14.6% of
variability, respectively. N03 concentration had a high positive (0.90) correlation
with factor 2. Sediment oxygen demand also had positive correlation (0.45) but
salinity ( -0.7) had a negative relationship with Factor 2. Factor 2 may represent
freshwater input. Sediment chlorophyll concentration had high positive
correlation with Factor 3 while DIC flux had negative relations. Factor 3 appears
to represent the benthic photosynthesis. Denitrification, N03 concentration,
salinity and sediment oxygen demand had positive relationships with Factor 3.
We believe the factors derived from the PCA can be related to important
environmental conditions that regulate benthic remineralization processes.
Sediment grain size is another important variable but since this variable remains
stable for short periods of time (i.e. months), it was not included in this analysis.
TWDB Final Report May 1999

1
~ . ...
-1 _,
_, _,
DNiS1pl c
CHL 02
N~
SAL
c ~L CHL
SAL DNF 02 NO~ " i .
SAL 02 ONF N03
... TEMifl c TEO!(:
_, _,
FI1CICI'2 Foc:ta-1
Figure 17: Results of the PCA analysis. DNF: denitrification; 02: sediment oxygen demand; DIC: DIC flux; CHL: sediment chlorophyll g; SAND: % sand; LOAD: freshwater input; TEMP: temperature; and, SAL: salinity_
73

Joye & An pg. 74
The seasonal change of temperature (Factor I) was the most important variable;
all the benthic processes exhibited a strong positive relationship to it.
Freshwater loading (Factor 2) does not seem to affect the benthic
processes very much, although the SOD was positively correlated with it.
Denitrification had a negative relationship with freshwater input but the
correlation was weak. The correlation between benthic primary production
(Factor 3) and benthic processes was also weak. Denitrification rates exhibited a
positive correlation to benthic production, which is consistent with the field and
modeling results.
Galveston Bay N Budget. The bay-wide denitrification rate in Galveston Bay was
estimated from the temperature and denitrification relationship (Joye and An
1998; An 1999). Since temperature was the environmental variable explaining
most of the variability of denitrification, temperature dependent regression
equations were derived for fine (% sand < 80) and coarse (% sand> 80) sediments
to estimate the monthly averaged denitrification rates in Galveston bay. The areal
distribution of each sediment type in Galveston Bay was estimated from USGS
maps. Average water temperature for each month was obtained from TNRCC.
The monthly averaged denitrification rates for each sediment type were then
summed to obtain monthly bay-wide denitrification rates. As such, the average
denitrification rate in Galveston Bay was 8.3 x I 07 mol N month·'. Figure 18
shows the 10 year averaged monthly values ofN loading, denitrification and%
load loss via denitrification. Nitrogen removal via denitrification averaged
approximately 52% of total N loading. Nitrogen loading was high during spring
but denitrification was not efficient at removing N at that time. During summer,
TWDB Final Report May 1999

___, V1
6001 '1'120
~ ~---- c 0 N loading 100 0 500 ' '
u..""? -· total DNF -~ ~ ra z .c:: ....a-% loss
\ 0
0 ~ 400 80 ij: "'C 0 'i: c::: E .:!::::: nl Cl z 300 60 c c::: Q) Q) ·-- "0 "'C 0 nl E 200 / 40 C"G 0 - 0 0/ ··o > z ..... - • • -- ~ 1/) 100
~ ~ 20 1/)
• • 0
0 0 ~ 0 2 3 4 5 6 7 6 9 10 11 12
Month
Figure 18. Whole system denitrification, nitrogen loading and% loss via denitrification in Galveston Bay. The rate was calculated using the denitrification rate in the relationship: DNF =ax IO(b x temp). Horizontal line represents the average removal(%).

Joye & An pg. 76
when N loading decreased , denitrification rates increased, resulting in efficient
removal ofup to 110% ofN loading.
The removal rate reported here is similar to that previously reported for
Delaware Bay (Seitzinger 1988) and the Tama Estuary, Japan (Nishio et al. 1982),
but is much higher than previous estimates for Galveston Bay (DNF = 14% ofN
loading; Zimmerman and Benner 1994 ). Zimmerman and Benner (1994) used
dark, laboratory incubations (following a 10 day pre-incubation) to determine
denitrification rates. This pre-incubation probably altered coupling and
interaction between photosynthesis-nitrification-denitrification. Furthermore,
enhanced nitrification-denitrification coupling driven by benthic primary
production would not have been observed using this assay technique since
sediment cores were incubated in the dark (Zimmerman and Benner 1994). In all
likelihood, denitrification rates determined in their study underestimated the true
in situ activity.
Nixon et al. (1996) presented a relationship between hydraulic residence
time and denitrification. According to this relationship, N loss by denitrification in
Galveston Bay should approximate 35% of total N loading. Our calculated
removal rate is about 17% higher than that. Enhancement of denitrification by
benthic primary production in Galveston Bay may serve to stimulate N removal
and complicate the interaction between hydraulic residence time and
denitrification.
Table 7 shows the annual N budget for Galveston Bay (Brocket al. 1996).
In the Brocket al. report, N loss by denitrification (3680 x 106 g N year-1) was
based on data from Zimmerman and Benner (1994). The loss increases from 3680
TWDB Final Report May 1999

Table 7. Annual nitrogen budget for the Galveston Bay system, 1988 to 1990. Data from Table 12 of Brock ( 1996); table been adapted from An ( 1999). Units in 106 g N yr·'.
1988 1989 1990 Average Std. Dev. Input
Fresh water inflow 19500 43550 49250 31525 15790 Nitrogen fixation 560 560 560 560 0
...... I Tidal Entrainment 2330 2440 2240 2385 100
...... Total 22390 46550 52050 34470 15778
Loss Outflow -25420 -42380 -38590 -33900 8902 Denitrification -3680 -3680 -3680 -3680 0 Burial in sediment -690 -2280 -2630 -1485 1034 Fisheries, Fish migration -770 -1070 -1430 -920 330 Total -30560 -49410 -46330 -39985 10112
Water column storage 170 270 -360 220 339
Remainder -8000 -2590 5370 -5295 6725

Joye & An pg. 78
to 14000 x 106 g N year·1 and remainder decreases from -17 40 to -12063 x 106 g
N year· 1 when the denitrification data obtained in study are used (Table 3). The
negative balance might reflect the decreased total N loading to Galveston Bay since
1973 (Shipley & Kiesling 1994) or other internal inputs (e.g. N fixation) that were
not measured during our study. The negative balance might also result from an
underestimation of sources and/or an overestimation oflosses (Brock et a!. 1996).
These trends could not be confirmed since the N budget calculation was based on
relatively short-term data ( 1988-1990; Brock eta!. 1996). Brocket a!. ( 1996)
suggested the source of bias in budget calculation might be the "entrainment rate"
used in budget calculation. The "entrainment rate" was used to estimate the
amount of coastal water mixed with bay water (Brocket a!. 1996). The range of
variability of the remainder using different "entrainment rate" was about 30000 x
106 g N year· 1 (Brock et a!. 1996). It is clear that errors in the estimated
entrainment rate could 'erase' theN deficit noted above: The difference of
remainder between the former budget calculation and the budget calculation using
current denitrification measurement lies within this range of variability. According
to current study, the importance of denitrification as aN sink process in
Galveston Bay is greater than previously estimated. More detailed studies of the
sources and sink terms of total N in Galveston bay are necessary to construct an
improved N budget and confirm the trends speculated upon here.
IV. Concluding Remarks
The method we employed to determine denitrification rates in Galveston
Bay sediments was relatively simple and it provided us with in situ rate estimates
of benthic processes in Galveston Bay. The relatively small sample volume (2 ml)
TWDB Final Report May 1999

Joye & An pg. 79
required for dissolved gas analyses permitted replication of samples, minimizing
the influence of signal dilution. Using benthic incubation chambers, the in situ
method allowed us to observe interactions between denitrification and benthic
photosynthesis. The study of theN processing in sediments has usually
employed dark incubations, such incubations do not permit the effect of benthic
primary production on N cycling in shallow estuaries and could result in
erroneous estimates ofN cycling rates in sediments.
The average Secchi depth in Galveston Bay was 0.65 m (10 year average,
n=1500, standard deviation= 0.4). The depth of the euphotic zone, estimated
from the Secchi depth, was 1.77 to 2.5 m and was similar to the average water
depth (1.74 m). Despite this, benthic chlorophyll concentration in the surface
sediment of Galveston Bay was high (500 mg Chi a m-2) and the measured benthic
primary production is comparable to rates water column primary production.
Results obtained in this study infer a positive feedback between benthic
photosynthesis and coupled nitrification-denitrification. This feedback could
serve as an important regulator ofN cycling in estuarine sediments. Studies such
as those described here should be carried out in other estuarine environments to
evaluate the generality of this conclusion.
Dissolved N2 and dissolved inorganic carbon fluxes from Galveston Bay
sediments ranged from 0.6 to 4.6 (avg. =1.8, n=24, SID= 1.1) and from 1.2 to
TWDB Final Report May 1999

Joye & An pg. 80
40.5 (avg.=l7.7, n = 21, SID= 12) mmol m·2 d·', respectively. Both DIC and N2
fluxes exhibited a summer maximum. The bottom waters of Galveston Bay were
well-oxygenated even during summer and nitrification rates estimated from the
denitrification and N03. fluxes exhibited a summer maximum. Elevated
denitrification rates observed during summer resulted from the stimulation of
nitrification-denitrification coupling by high rates of benthic photosynthesis and
the consumption of 0 2 by respiration (and nitrification). Benthic photosynthesis
provided the 0 2 required to support aerobic respiration and nitrification in
Galveston sediment. Most of the N03· used for denitrification (97%) was
supplied from in situ nitrification. The proportion of denitrification supported by
water column influx was higher during winter and spring, when the water column
N03 concentration was high, than during summer and fall, when the water column
N03 concentration was low.
The ratio between the DIC flux and the SOD was high (2.6) in Galveston
Bay sediments. Model results suggest that when benthic primary production is
important, the observed DIC and 0 2 flux reflect the net result of organic matter
decay and photosynthesis. Although other processes such as carbonate
precipitation/dissolution and pyrite formation might influence these fluxes and the
flux ratio, benthic primary production could produce the high ratio between DIC
flux and SOD in Galveston Bay.
TWDB Final Report May 1999

Joye & An pg. 81
Temperature was the most significant factor explaining the variability in
denitrification rates in Galveston Bay. Denitrification rates were higher in fine-
grained compared to coarse-grained sediment. Bottom water N03 concentration
was not significantly related to denitrification rates. Though freshwater stations
exhibited higher denitrification rates generally, salinity did not explain a significant
fraction of the variability in denitrification rates. Principal component analyses
showed that season (temperature fluctuation), freshwater discharge, and primary
production were important environmental factors influencing benthic processes
and denitrification rates in Galveston Bay.
The average N loading rate (monthly average) to Galveston Bay during this
study was 170 * 106 mol N month"1. Over an annual cycle, denitrification
removed 52% of the annual N loading to Galveston Bay. While N loading was
highest during spring and lowest during summer, denitrification rates were lowest
during spring and highest during summer. Therefore, denitrification was less
effective in removing N during winter and spring. During summer, when
denitrification rates were highest and N loading was lowest, denitrification
removed to 110% of theN load. It is difficult to estimate the specific source ofN
denitrified during benthic chamber incubations. For example, evaluating whether
the denitrified N was delivered from the riverine end member, deposited on the
Bay surface via atmospheric precipitation, or introduced to the system from the
marine end member would require a specific tracer (perhaps stable N isotopes)
TWDB Final Report May 1999
Joye & An pg. 82
that was unique for each 'source' ofN. Nonetheless, we can state that
denitrification rates in this system could remove> 50% of the annual riverine N
load delivered to the system. Future studies should focus on determining the
specific sources ofN that fuel denitrification in the Galveston Bay system
TWDB Final Report May 1999

Joye & An pg. 83
V. References
An, S. 1999. Nitrogen cycling and denitrification in Galveston Bay. Ph. D. Dissertation, Texas A & M University, College Station, TX, 235 pp.
An, S. and S. B. Joye. 1997. An improved gas chromatographic method for measuring nitrogen, oxygen, argon and methane in gas or liquid samples. Marine Chemistry 59 (1,2): 63-70.
Andersen, T. K., M. H. Hensen and J. Sorensen. 1984. Diurnal variation in nitrogen cycling in coastal marine sediments. I. Denitrification. Mar. Bioi. 83:171-176.
Armstrong, N. E. 1982. Responses of Texas estuaries to freshwater inflows. Pg. 103-120. In: Kennedy, V.S. (Ed.) Estuarine Comparisions. Academic Press, N.Y.
Armstrong, N. E. 1987. The ecology of open-bay bottoms of Texas: A community profile. U.S. Fish and Wildlife Service, Biological Report, 85(7.12).
Binnreup, S. J. and J. Sorensen. 1992. Nitrate and nitrite microgradients in barley rhizosphere as detected by a highly sensitive denitrification bioassay. Appl. Environ. Microbial. 58:2375-2380.
Blackburn, T. H. and J. Sorensen. 1988. Nitrogen cycling in coastal marine environments, SCOPE 33, John Wiley & Sons, New York.
Boudreau, B. P. 1996. A method of line code for carbon and nutrient diagenesis in aquatic sediments. Computer Geosci. 22: 479-496.
Boudreau, B. P. 1997. Diagenetic models and their implementation. Springer Verlag Publishers.
Boudreau, B. P, and D. A. Canfield. 1988. A provisional diagenetic model for pH in anoxic sediment porewaters: application to the FOAM site. J. Mar. Res. 46: 429-455.
Brock, D. A., R. S. Solis and W. L. Longley. 1996. Guidelines for water resources permitting: nutrient requirements for maintenance of Galveston Bay productivity. EPA Final Report X-996024-01-2, 128 pp.
Caffrey, J. M. 1995. Spatial and seasonal patterns in sediment nitrogen remineralization and ammonium concentrations in San Francisco Bay, California. Estuaries 18(1B):319-233.
Caffrey, J. M. and W. M. Kemp. 1990. Nitrogen cycling in sediments with estuarine populations of Potamogeton perfoliatus and Zostera marina. Mar. Ecol. Prog. Ser. 66:147-160.
Capone, D. G. and R. P. Kiene. 1988. Comparison of microbila dynamics in marine and freshwater sediments: contrast in anaerobic carbon metabolism. Limnol. Oceanogr. 33: 725-749.
Christensen, J.P., J. W. Murray, A. H. Devol and L. A. Codispoti. 1987. Denitrification in continental shelf sediments has major impact on the oceanic nitrogen budget. Glob. Biogeochem. Cyc., 1(2): 97-116.
Cole, J. A., Fergusen, S. J. 1988. The Nitrogen and Sulfur Cycles, Society of General Microbiology, Cambridge Univ. Press, Cambridge.
Dollar, S. J., S. V. Smith, S.M. Vink, S. Obrebski and J. T. Hollibaugh. 1991. Annual cycle of benthic nutrient fluxes in Tomales Bay, California, and contribution to the benthos to total ecosystem metabolism. Mar. Ecol. Prog. Ser. 79: 115-125.
Falkowski, P. G. and J. A. Raven. 1997. Aquatic Photosynthesis. Blackwell Science.
TWDB Final Report May 1999

Joye & An pg. 84
Fenchel, T and B. J. Straarup. 1971. Vertical distribution of photosynthetic pigments and the penetration of light in marine sediments. OIKOS 22: 172-182.
Garcia, V. M. and D. A. Purdie. 1994. Primary production studies during a Gyrodinium cf. Aureolum (Dinophyceae) bloom in the western English Channel. Mar. Biology. 199(2): 297-305.
Grundmanis, V. and J. W. Murray. 1977. Nitrification and denitrification in marine sediments from Puget Sound. Limnol. Oceanogr. 22:804-811.
Hargrave, B. T. and G. A. Phillips. 1981. Annual in situ carbon dioxide and oxygen flux across a subtidal marine sediment. Estuar. Coast. and Shelf Sci. 12: 725-737.
Henriksen, K. and W. M. Kemp. 1988. Nitrification in estuarine and coastal marine sediments, pp. 207-249. In Blackburn, T. H. and J. Sarensen. (Eds.), Nitrogen cycling in coastal marine environments. SCOPE 33, John Wiley & Sons, New York.
Howarth, R. W., R. Marino, and J. Lane. 1988. Nitrogen fixation in freshwater, estuarine and marine ecosystems. I. Rates and Importance. Limnol. Oceanogr. 33: 669-687.
Howes, B. L., J. W. H. Dacey and G. M. King. 1984. Carbon flow through oxygen and sulfate reduction pathways in salt marsh sediments. Limnol. Oceanogr. 29(5): 1037-1051.
Jenkins, M. C. and W. M. Kemp. 1984. The coupling of nitrification and denitrification in two estuarine sediments. Limnol. Oceanogr. 29: 609-619.
Jmgensen, B. B. 1977. The sulfur cycle of coastal marine sediments (Limfjorden, Denmark). Limnol. Oceanogr. 22(3): 814-832.
Jargensen, K. and J. Sarensen. 1985. Seasonal cycles of 0 2, N03 and S04
reduction in estuarine sediments. The significance of a nitrate reduction maximum in spring. Mar. Ecol. Prog. Ser. 24: 65-74.
Joye, S. B. and H. W. Paerl. 1993. Contemporaneous nitrogen fixation and denitrification in marine microbial mats: Rapid response to runoff events. Mar. Ecol. Prog. Ser. 94: 267-274.
Joye, S. B. and J. T. Hollibaugh. 1995. Sulfide inhibition of nitrification influences nitrogen regeneration in sediments. Science 270: 623-625.
Joye, S. B. and S. An. 1997. Denitrification in Galveston Bay: 1996 Annual Report. Texas Water Development Board. 46 pp.
Joye, S. B. and S. An. 1998. Denitrification in Galveston Bay. 1997 Annual Report. Texas Water Development Board. 50 pp.
Joye, S. B., M. L. Mazzotta and J. T. Hollibaugh. 1996. Community metabolism in intertidal microbial mats: the importance of iron and manganese reduction. Estuar. Coast. Shelf Sci 43: 747-766.
Joye, S.B., S. V. Smith, J. T. Hollibaugh and H. W. Paerl. 1996. Estimating denitrification rate in estuary sediments: A comparison of stochiometric and acetylene based methods. Biogeochem. 33: 197-215.
Joye, S. B., J. T. Hollibaugh, H. W. Paerl and S. V. Smith. 1999. Nitrification and denitrification in the sediments of Tomales Bay, California (USA). Estuaries (in revision).
Kemp, W. M. and W. R. Boynton. 1981. External and internal factors regulating metabolic rates of an estuarine benthic community. Oecologia 51: 19-27.
Kemp, W. M., P. Sampou, J. Caffrey, M. Mayer, K. Henriksen and W. R. Boynton. 1990. Ammonium recycling versus denitrification in Chesapeake Bay sediments. Limnol. Oceano gr. 35: 1545-1563.
TWDB Final Report May 1999

Joye & An pg. 85
Knowles, R. 1982. Denitrification. Microbiol. Rev. 46(1):43-70.
Koike, I. and A. Hattori. 1979. Estimates of denitrification in sediments of the Bering Sea Shelf. Deep-Sea Res. 26: 409-415.
Koike, I. and J. Sorensen. 1988. Nitrate reduction and denitrification in marine sediments, p. 251-273. In Blackburn, T. H., Sorensen, J. (Eds.), Nitrogen cycling in coastal marine environments. SCOPE 33, John Wiley & Sons, New York.
Krause-Jensen, D. and K. Sand-Jensen. 1998. Light attenuation and photosynthesis of aquatic plant communities. Limnol. Oceanogr. 43(3): 396-407.
Kristensen, E. 1988. Benthic fauna and biogeochemical processes in marine sediments: Microbial activities and fluxes, p. 275-299. In Blackburn, T. H., Sorensen, J. (Eds.), Nitrogen cycling in coastal marine environments. SCOPE 33, John Wiley & Sons, New York.
Lin, S. and J. W. Morse. 1991. Sulfate reduction and sulfide mineral formation in Gulf of Mexico anoxic sediments. Amer. Jour. Sci. 291: 55-89.
MacFarland, G. T. and R. A. Herbert. 1984. Dissimilatory nitrate reduction and nitrification in estuarine sediments. J. Gen. Micro bioi. 130: 2301-2308.
McClelland, J. W. and I. Valiela. 1997. Nitrogen stable isotope signature in estuarine food webs: A record of increasing urbanization in coastal watersheds. Limnol. Oceanogr. 42(5): 930-937.
McNicol, A. P., C. Lee and E. R. M. Druffel. 1988. Carbon cycling in coastal sediments: 1. A quantitative estimate of the remineralization of organic carbon in the sediments of Buzzards Bay, MA. Geochim. Cosmochim. Acta. 52: 1531-1543.
Morse, J. W. and R. A. Berner. 1994. What determines sedimentary C/S ratios? Geochim. Cosmochim. Acta. 35: 37-45.
Nishio, T., I. Koike and A. Hattori. 1982. Denitrification, nitrate reduction, and oxygen consumption in coastal and estuarine sediments. Appl. Environ. Microb. 43:648-653.
Nishio, T., I. Koike and A. Hattori. 1983. Estimates of nitrification and denitrification in coastal and estuarine sediments. Appl. Environ. Micro b. 45:444-450.
Nowicki, B. L., 1994. The effect of temperature, oxygen, salinity, and nutrient enrichment on estuarine denitrification rates measured with a modified nitrogen gas flux technique. Estuar. Coast. Shelf. Sci., 38: 137-156.
Nixon, S. W., et al. 1996. The fate of nitrogen and phosphorus at the land-sea margin of the North Atlantic Ocean. Biogeochem. 35:141-180.
Nowicki, B. L., J. R. Kelly, E. Requintina and D. VanKeuren. 1997. Nitrogen losses through sediment denitrification in Boston Harbor and Massachussetts Bay. Estuaries 20:626-639.
Pind, A., N. Risgaard-Peterson and N. P. Revsbech. 1997. Denitrification and microphytobenthic nitrate consumption in a Danish lowland stream: diurnal and seasonal variation. Aquatic Microbiol. Ecol. 12: 275-284.
Pinckney, J. and R. G. Zingmark 1991. Effects of tidal stage and sun angles on intertidal benthic microalgal productivity. Mar. Ecol. Prog. Ser. 76: 81-89.
Pinckney, J. L. and R. G. Zingmark. 1993. Modeling the annual production of intertidal benthic microalgae in estuarine ecosystems. J. Phycol. 29: 396-407.
Revsbech, N. P., J. Sorensen and T. H. Blackburn. 1980. Distribution of oxygen in marine sediments measured with microelectrodes. Limnol. Oceanogr. 25: 403-411.
Revsbech, N. P., J. Nielsen and P. K. Hansen. 1988. Benthic primary production and oxygen profiles. Chapter 4. In: Blackburn, T. H. and J. Sorensen (Eds.) Nitrogen cycling in coastal marine environments. John Wiley & Sons.
TWDB Final Report May 1999

Joye & An pg. 86
Risgaard-Petersen, N., S. Rysgaard, L. P. Nielsen and N. P. Revsbech. 1994. Diurnal variation of denitrification and nitrification in sediments colonized by benthic microphytes. Limnol. Oceanogr. 39(3): 573-579.
Robertson, L. A and J. G. Kuenen. 1991. Physiology of nitrifying and denitrifying bacteria, p. 189-199. In Rogers, J. E., Whitman, W. B. (Eds.), Microbial production and consumption of greenhouse gases: methane, nitrous oxide, and halomethanes. American Society of Microbiology Press, Washington, D.C.
Rowe, G. T., C. H. Clifford, J. K. Smith and P. L. Hamilton. 1975. Benthic nutrient regeneration and its coupling to water column primary productivity in coastal waters. Nature. 255: 215-217.
Rowe, G. T., and others. 1988. Benthic carbon budgets for the continental shelf south of New England. Cont. Shelf Res. 8: 511-527.
Rowe, G. T., G. S. Boland, J. Morse, C. Cooper, M. E. Cruz-Kaegi and E. E. Briones. (submitted) Benthic metabolism in Galveston Bay.
Ryther, J. M. and W. M. Dunston. 1971. Nitrogen, phosphorus and eutrophication in the coastal marine environment. Science. 1 71: 1 008-1013.
Seitzinger, S. P. 1988. Denitrification in freshwater and coastal marine ecosystem: Ecological and geochemical significance. Limnol. Oceanogr., 33:702-724.
Seitzinger, S. P. 1990. Denitrification in aquatic sediments, pp. 301-322. In: Revsbech, N. P. and J. Sorensen (Eds.) Denitrification in soil and sediment. FEMS Symposium No. 56. Plenum Press.
Seitzinger, S. P., S. W. Nixon, M. E. Q. Pilson and S. Burke. 1984. Denitrification and nitrous oxide production in a coastal marine ecosystem. Limnol. Oceanogr. 30(6): 73-83.
Shipley, F. S. and R. W. Kiesling. 1994. The state of the Bay: A characterization of the Galveston Bay ecosystem. The Galveston Bay National Estuary Program Publication GBNEP-44.
Smith, K. L. and J. M. Teal. 1979. Deep-sea benthic community respiration: an in situ study at 1850 meters. Science. 282-283.
Sneath, P. H. A. and R. R. Sokal. 1973. Numerical taxonomy. W. H. Freeman and Company.o
Sorensen, J., B. B. Jorgensen and N. P. Revsbech. 1979. A comparison of oxygen, nitrate and sulfate respiration in coastal marine sediments. Micro. Ecol. 5: I 05-115.
Tiedje, J. M., S. Simkins and P.M. Groffman. 1989. Perspectives on measurement of denitrification in the field including recommended protocols for acetylene --based methods. Plant Soil, 115: 261-284.
Tomaszek, J. A., W. S. Gardener and T. H. Johensen. 1997. Denitrificatoin in sediments of Lake Erie coastal wetland (Old Woman Creek, Huron, Ohio, USA). J. Great Lakes Res. 23: 403-415.
Vanberborght, J. P., Bill en, G. 1975. Vertical distribution of nitrate concentration in interstitial water of marine sediments with nitrification and denitrification. Limnol. Oceanogr. 20:953-961.
Warnken, K. W. 1998. Sediment water exchange of trace metals and nutrients in Galveston Bay, Texas. M. S. Thesis. Texas A&M University, College Station, TX.
Wollast, R. 1983. Interactions in estuaries and coastal waters, p. 385-407. In: Bolin, B. and R. B. Cook (Eds.) The major biogeochemical cycles and their interaction. SCOPE
TWDB Final Report May 1999

Joye & An pg. 87
Zimmerman, A. R., Benner, R. 1994. Denitrification, nutrient regeneration and carbon mineralization in the sediments of Galveston Bay, Texas, USA. Mar. Ecol. Prog. Ser. 114: 275-288.
Zehnder, A. J. B. and W. Stumm. 1988. Geochemistry and biogeochemistry of anaerobic habitats, p. 1-38. In: Zehnder, A. J. B. (Ed.) Biology of anaerobic microorganisms. John Wiley & Sons.
Zumft, W. G., Viebrock, A., Komer, H. 1988. Biochemical and physiological aspects of denitrification, p. 245-279. In Cole, J. A., Ferguson, S. J. (Eds.) The Nitrogen and Sulfur Cycles, Society of General Microbial., Cambridge University Press, Cambridge, England.
TWDB Final Report May 1999