Defining deep decarbonization pathways for Switzerland: An ... · Defining deep decarbonization...
28
Defining deep decarbonization pathways for Switzerland: An economic evaluation based on the computable general equilibrium model GEMINI-E3 ✩ Fr´ ed´ eric Babonneau a,b , Philippe Thalmann a , Marc Vielle a,* a LEURE, Ecole Polytechnique F´ ed´ erale de Lausanne, Lausanne, Switzerland b ORDECSYS, Place de l’Etrier 4, CH-1224 Chˆ ene-Bougeries, Switzerland Abstract This paper presents the Swiss contribution to the Deep Decarbonization Pathways (DDP) project which is an international collaborative initiative aiming at under- standing and showing how individual countries might define a roadmap paving the way to reaching a low carbon economy and how the world can keep global mean temperature increase below 2°C. The Swiss analysis relies on macro-economic simulations of GEMINI-E3, a computable general equilibrium model used to as- sess the energy and economic impacts of a Swiss low carbon society. The DDP scenarios assume a CO 2 emissions target of 1 ton per Swiss inhabitant following the Swiss climate target which represents a 76% abatement with respect to 1990 levels. The paper discusses several options/scenarios compatible with this emis- sions target that appears to be quite challenging. The scenarios are compared to a reference scenario which assumes that Switzerland will reach a 20% reduction of CO 2 emissions relative to 1990 levels, using instruments that have already been de- fined (buildings refurbishment program, regulation on CO 2 emission for new cars, CO 2 tax on stationary fuels, Swiss ETS market). Keywords: Climate policy, Energy policy, Switzerland, Computable general equilibrium model, CCS, Renewable, Nuclear power ✩ The research leading to these results has received funding from the Swiss Federal Office for the Environment. We would like to thank Jos´ e Romero, Rolf Iten, J ¨ urg F¨ ussler, Almut Kirchner, Patrick Criqui, Pierre-Alain Bruchez, the DDPP Swiss working group and the participants of the CERE seminar (Ume˚ a University) for their helpful comments and suggestions. * Corresponding author Email address: [email protected] (Marc Vielle) Preprint submitted to 18th Annual Conference on Global Economic Analysis March 30, 2015
Transcript of Defining deep decarbonization pathways for Switzerland: An ... · Defining deep decarbonization...
Defining deep decarbonization pathways for Switzerland: Aneconomic evaluation based on the computable general
equilibrium model GEMINI-E3I
Frederic Babonneaua,b, Philippe Thalmanna, Marc Viellea,∗
aLEURE, Ecole Polytechnique Federale de Lausanne, Lausanne, SwitzerlandbORDECSYS, Place de l’Etrier 4, CH-1224 Chene-Bougeries, Switzerland
Abstract
This paper presents the Swiss contribution to the Deep Decarbonization Pathways(DDP) project which is an international collaborative initiative aiming at under-standing and showing how individual countries might define a roadmap paving theway to reaching a low carbon economy and how the world can keep global meantemperature increase below 2°C. The Swiss analysis relies on macro-economicsimulations of GEMINI-E3, a computable general equilibrium model used to as-sess the energy and economic impacts of a Swiss low carbon society. The DDPscenarios assume a CO2 emissions target of 1 ton per Swiss inhabitant followingthe Swiss climate target which represents a 76% abatement with respect to 1990levels. The paper discusses several options/scenarios compatible with this emis-sions target that appears to be quite challenging. The scenarios are compared to areference scenario which assumes that Switzerland will reach a 20% reduction ofCO2 emissions relative to 1990 levels, using instruments that have already been de-fined (buildings refurbishment program, regulation on CO2 emission for new cars,CO2 tax on stationary fuels, Swiss ETS market).
Keywords: Climate policy, Energy policy, Switzerland, Computable generalequilibrium model, CCS, Renewable, Nuclear power
IThe research leading to these results has received funding from the Swiss Federal Office for theEnvironment. We would like to thank Jose Romero, Rolf Iten, Jurg Fussler, Almut Kirchner, PatrickCriqui, Pierre-Alain Bruchez, the DDPP Swiss working group and the participants of the CEREseminar (Umea University) for their helpful comments and suggestions.
∗Corresponding authorEmail address: [email protected] (Marc Vielle)
Preprint submitted to 18th Annual Conference on Global Economic Analysis March 30, 2015

1. Introduction
As part of the Deep Decarbonization Pathways (DDP) project1, the present pa-per presents simulation results of deep decarbonization pathways for Switzerland.DDP project is an international collaborative initiative aiming at understandingand showing how individual countries might define a roadmap paving the way toreaching a low carbon economy and how the world can keep global mean tem-perature increase below 2°C. The project is led by the Sustainable DevelopmentSolutions Network and the Institute for Sustainable Development and InternationalRelations. More precisely, the DDP project objective is to explore and analyze foreach country possible transitions to a low-carbon economy, taking into consider-ation national socio-economic conditions, development aspirations, infrastructurestocks, resource endowments, and other relevant factors. An economic modelingpart complements the analysis. Up to now, 15 countries (Australia, Brazil, Canada,China, France, Germany, India, Indonesia, Japan, Mexico, Russia, South Africa,South Korea, UK, and USA) are involved in this initiative.
The Swiss Federal administration and, in particular, the Federal Office for theEnvironment (OFEV) has decided to contribute to the project and therefore to de-velop a national Deep Decarbonization Pathway analysis to 2050 for Switzerland.
The paper discusses several options/scenarios compatible with this Deep De-carbonization Pathway. The paper is structured as follows: Section 2 presentsbriefly the GEMINI-E3 model used to perform the economic simulations. Sections3 and 4 detail the storylines and the assumptions, respectively, of possible DeepDecarbonization Pathway scenarios. Section 5 provides results and analysis and,finally, the last section concludes.
2. The GEMINI-E3 Model
GEMINI-E32[6] is a multi-country, multi-sector, recursive computable gen-eral equilibrium model comparable to the other CGE models (EPPA, OECD-Env-Linkage, etc) built and implemented by other modeling teams and institutions, andsharing the same long experience in the design of this class of economic models.The standard model is based on the assumption of total flexibility in all markets,both macroeconomic markets such as the capital and the exchange markets (withthe associated prices being the real rate of interest and the real exchange rate, which
1http://unsdsn.org/what-we-do/deep-decarbonization-pathways/2All information about the model can be found at http://gemini-e3.epfl.ch/, including its
complete description.
2
are then endogenous), and microeconomic or sector markets (goods, factors of pro-duction).
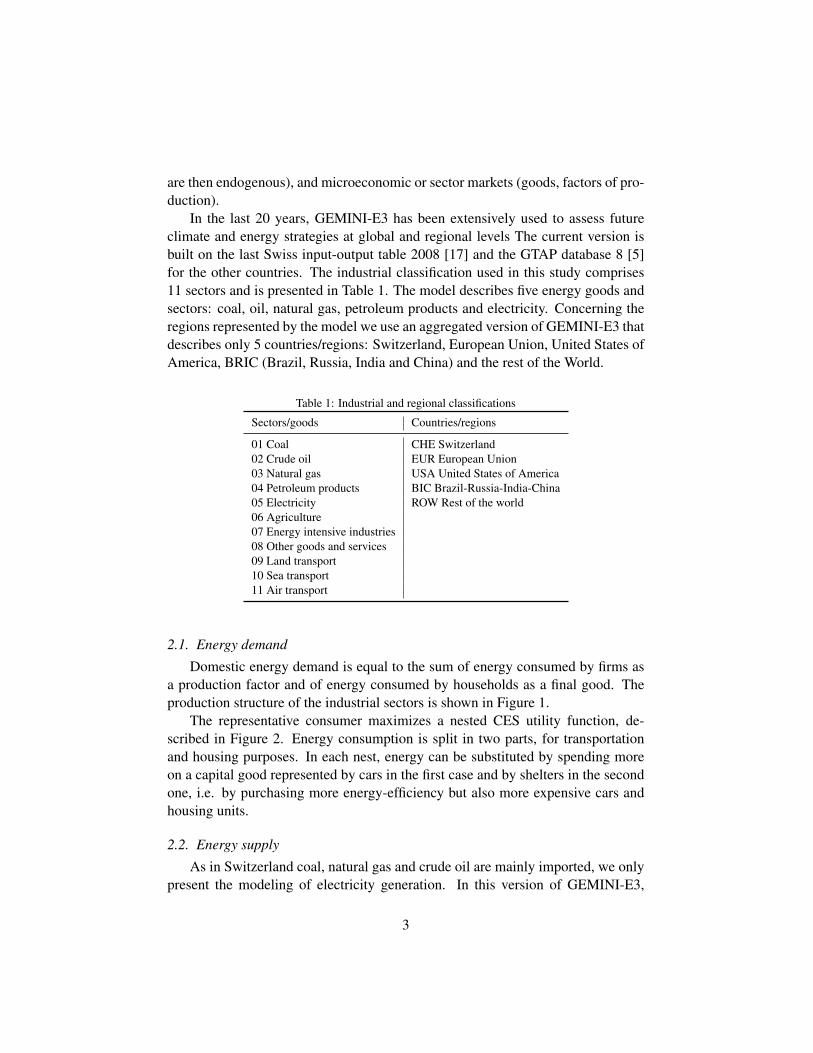
In the last 20 years, GEMINI-E3 has been extensively used to assess futureclimate and energy strategies at global and regional levels The current version isbuilt on the last Swiss input-output table 2008 [17] and the GTAP database 8 [5]for the other countries. The industrial classification used in this study comprises11 sectors and is presented in Table 1. The model describes five energy goods andsectors: coal, oil, natural gas, petroleum products and electricity. Concerning theregions represented by the model we use an aggregated version of GEMINI-E3 thatdescribes only 5 countries/regions: Switzerland, European Union, United States ofAmerica, BRIC (Brazil, Russia, India and China) and the rest of the World.
Table 1: Industrial and regional classifications
Sectors/goods Countries/regions
01 Coal CHE Switzerland02 Crude oil EUR European Union03 Natural gas USA United States of America04 Petroleum products BIC Brazil-Russia-India-China05 Electricity ROW Rest of the world06 Agriculture07 Energy intensive industries08 Other goods and services09 Land transport10 Sea transport11 Air transport
2.1. Energy demand
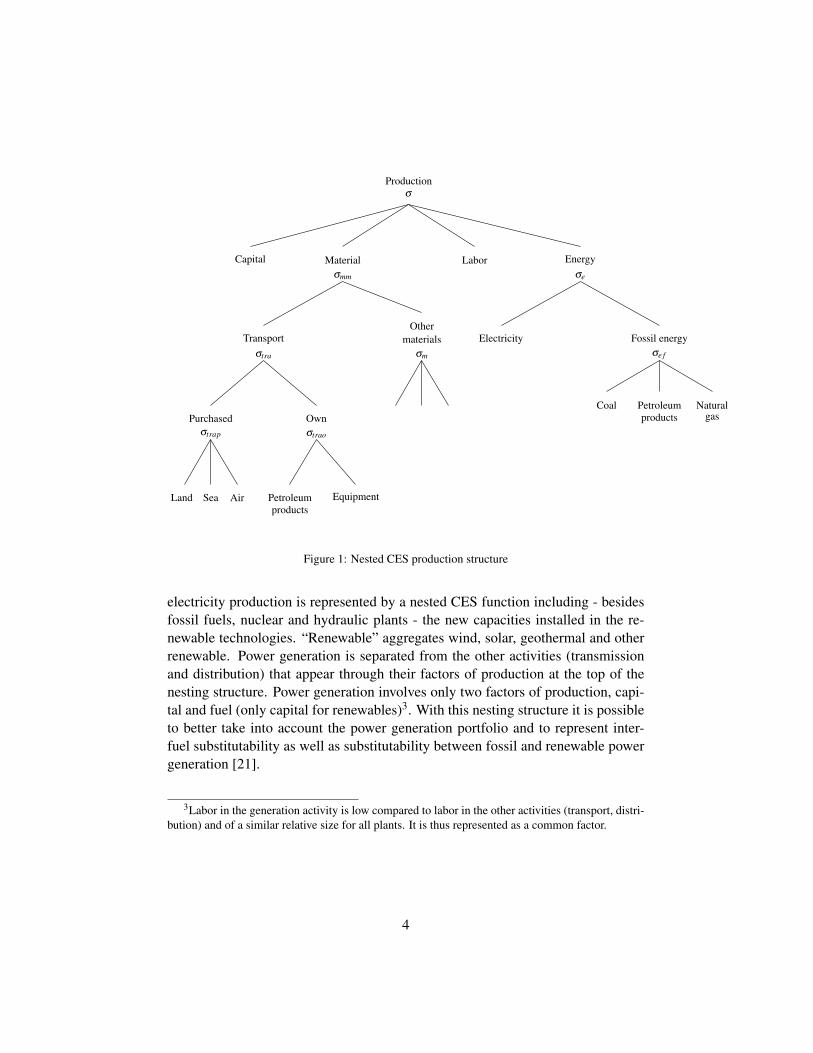
Domestic energy demand is equal to the sum of energy consumed by firms asa production factor and of energy consumed by households as a final good. Theproduction structure of the industrial sectors is shown in Figure 1.
The representative consumer maximizes a nested CES utility function, de-scribed in Figure 2. Energy consumption is split in two parts, for transportationand housing purposes. In each nest, energy can be substituted by spending moreon a capital good represented by cars in the first case and by shelters in the secondone, i.e. by purchasing more energy-efficiency but also more expensive cars andhousing units.
2.2. Energy supply
As in Switzerland coal, natural gas and crude oil are mainly imported, we onlypresent the modeling of electricity generation. In this version of GEMINI-E3,
3
Productionσ
Capital EnergyMaterial Laborσmm
TransportOther
materials
σe
Electricity Fossil energyσe f
Coal Naturalgas
Petroleumproducts
σtra σm
Purchased Ownσtrap σtrao
AirSeaLand EquipmentPetroleumproducts
Figure 1: Nested CES production structure
electricity production is represented by a nested CES function including - besidesfossil fuels, nuclear and hydraulic plants - the new capacities installed in the re-newable technologies. “Renewable” aggregates wind, solar, geothermal and otherrenewable. Power generation is separated from the other activities (transmissionand distribution) that appear through their factors of production at the top of thenesting structure. Power generation involves only two factors of production, capi-tal and fuel (only capital for renewables)3. With this nesting structure it is possibleto better take into account the power generation portfolio and to represent inter-fuel substitutability as well as substitutability between fossil and renewable powergeneration [21].
3Labor in the generation activity is low compared to labor in the other activities (transport, distri-bution) and of a similar relative size for all plants. It is thus represented as a common factor.
4

Consumption
σhc
Housing
σhres
Other
σhoth
Transport
σhtra
Energy
σhrese
Shelter Purchased
σhtrap
Own
σhtrao
Electricity Fossil energy
σhrese f
Naturalgas
Coal Petroleumproducts
LandAir Sea CarPetroleumproducts
Figure 2: Nested CES consumption structure
3. Defining storylines
In this analysis, we have defined and analyzed two sets of scenarios:
• The first one, called “reference scenario”, assumes that Switzerland willachieve by 2020 a 20% reduction of GHG emissions relative to 1990 lev-els in 2020, using instruments that have already been defined (Building Pro-gram, regulation on CO2 emission for cars, etc). After 2020, we suppose thatno additional policy will be implemented but the existing instruments wouldremain applied with their 2020 levels;
• The other ones, called the “DDP scenarios”, all suppose that Switzerland willreach by 2050 a CO2 emissions target of 1 ton of CO2 per Swiss inhabitantbut use alternative assumptions on the technologies available.
Following the Swiss CO2 law these respective CO2 targets concern CO2 emis-sions from all sources, except international aviation. For the purpose of simplifica-
5
tion, we assume in these scenarios that no climate policies are implemented in therest of the world.
Up to 2020, the two scenarios make the same set of assumptions that are mainlydrawn from the Swiss climate policy presented in “Switzerland’s Sixth NationalCommunication and First Biennial Report under the UNFCCC” [19]. More pre-cisely, we assume that the following measures and instruments are implemented upto 2020 in both scenarios:
1. The path for nuclear phase-out is applied;2. The Building Program is extended up to 2020;3. Car regulation on CO2 emissions standard is implemented up to 2020;4. Electric cars significantly penetrate the passenger cars market as well as the
other road transport vehicles;5. No Carbon Capture and Storage (CCS) technology is available;6. A Swiss emission trading scheme for energy intensive industries is imple-
mented. The cap is lowered every year by the same amount (1.74% of thecap set in 2010). GEMINI-E3’s sectors that participate in the ETS are theelectricity generation sector and the energy intensive industries;
7. The present CO2 levy is increased following the official rule, i.e. when theabatement is not sufficient to reach the CO2 target in 2020;
8. After 2012, the climate cent on fuels for transport is replaced by a new in-strument. From 2014, the revised CO2 Act obliges oil importers to offsetdirectly a part of the CO2 emissions from transport fuel use. The offset willbe financed by a levy that shall not exceed CHF 0.05 per liter of fuel. Theshare of transport emissions to be offset may vary from 5% to a maximum of40%. The Federal Council determined the shares as 2% in 2014-2015, 5%in 2016-2017, 8% in 2018- 2019, and 10% in 2020.
After 2020 the two sets of scenarios diverge. The reference scenario does notintegrate new targets on CO2 emissions and does not assume new regulation onenergy efficiency; it freezes the carbon prices to their 2020 levels. It should benoted that the last energy projection done by European Union [2] follows the samephilosophy for the years after 2020. Therefore we use the following assumptionsin the reference scenario:
1. The carbon prices (ETS price, CO2 tax) and levy charged on fuels for trans-port remain constant and equal to their 2020 levels;
2. The Building Program remains constant at its 2020 levels;3. The CO2 emissions standard for new cars remains constant at its 2020 levels.
6

The DDP scenarios assume a much more stringent climate policy that will beachieved mainly by the implementation of a uniform carbon tax. However asthe scenario is based on significant shifts in climate policy we believe that newtechnological options need to be considered. The DDP scenario will assume thefollowing:
1. CCS option becomes available in 2025;2. The Building Program is terminated in 2020;3. Car regulation on CO2 emissions standard is extended after 2020;4. The CO2 prices (ETS price, carbon tax) and the levy charged on fuels for
transport are replaced by a uniform carbon tax applied to fossil energy con-sumption in order to reach the CO2 target by 2050.
Figure 3 gives the emissions profile of the DDP scenarios as well as past emis-sions and the emissions of the reference scenario4 that are presented in section 5.
0
5
10
15
20
25
30
35
40
45
50
1970 1980 1990 2000 2010 2020 2030 2040 2050
Historical values
DDP
Reference
1990
Figure 3: Swiss CO2 emissions in the two scenarios (Reference and DDP) in Mt CO2
The next section detail all these assumptions. Subsection 4.1 presents the com-mon assumptions to both scenarios while subsections 4.2 and 4.3 give scenariospecific ones.
4. Scenarios assumptions
4.1. Common assumptionsTo simulate the evolution of the economy until 2050, GEMINI-E3 uses fore-
casts of population growth, GDP and energy prices, as well as assumptions on
4The emissions reported in Figure 3 include those coming from international aviation.
7

electricity generation as detailed below.
4.1.1. DemographyWe use the evolution of the Swiss population as defined by the A-17-2010
scenario from the Federal Office of Statistic (OFS) [8]. This scenario is based onthe median scenario called A-00-2010 until 2030. After that date, the scenarioassumes a net immigration of population equal to 40 000 persons per year until2060. Table 2 gives the evolution of the Swiss population. In 2050, 9.8 millioninhabitants will live in Switzerland.
Table 2: Swiss Population in thousands
2010 2030 2040 2050 2060
Swiss Population 7’864 9’225 9’568 9’820 9’999
For the rest of the world, assumptions on population are based on the 2010forecast made by United Nations [20]. We use the “median-fertility variant”. In2050, the World population will reach 9.27 billions of inhabitants.
4.1.2. GDP growthFor Switzerland, we compute the GDP growth rate by multiplying the labour
force (given by the demographic scenario done by OFS) with labour productivity.This yields the potential GDP. We suppose that the labour productivity increasesby 0.5% per year in Switzerland over the whole period.
For the rest of the World, we apply a similar methodology. We use the GDPgrowth rates computed in the last World Energy Outlook (WEO) [14] of the In-ternational Energy Agency (IEA) up to 2035. After 2035 we multiply the labourforce by labor productivity based on what is retained by the IEA for the period2011-2035. Table 3 shows the GDP growth used in the reference scenario.
Table 3: Annual GDP growth rate in percentage
2010-2020 2020-2030 2030-2040 2040-2050 2050-2060
CHE 1.3% 0.7% 0.8% 0.7% 0.6%EUR 1.3% 1.8% 1.7% 1.4% 1.2%USA 2.8% 2.2% 2.1% 2.0% 1.8%BIC 7.6% 4.5% 4.3% 3.7% 3.3%ROW 5.4% 4.5% 4.4% 4.4% 4.3%
World 4.0% 3.4% 3.4% 3.4% 3.3%
8

4.1.3. World energy pricesAssumptions concerning energy prices are drawn from the WEO of the IEA [14].
The first preliminary scenarios presented in this report assume that only Switzer-land implements a climate policy, therefore we retain the scenario called “currentpolicies scenario” of the IEA. called “450 scenario”. The predictions of the IEAstop in 2035. After that, we assume that energy prices will continue to grow andconverge to a growth rate of 0.7% per year at the end of the simulation (i.e. 2050).Table 4 shows the energy prices used in the reference scenario. The oil price andthe price of imported gas in Europe are assumed to reach 162$ and 5.1$/Mbtu in2050, respectively.
Table 4: Fossil fuel import prices (dollar per unit) - Source: WEO [14] (Current policies scenario)
2012 2020 2030 2040 2050
Real terms (2012 prices)IEA crude oil imports (barrel) 109.0 120.0 136.0 150.9 161.8Natural gas EU imports (MBtu) 11.7 12.4 13.4 14.6 15.1
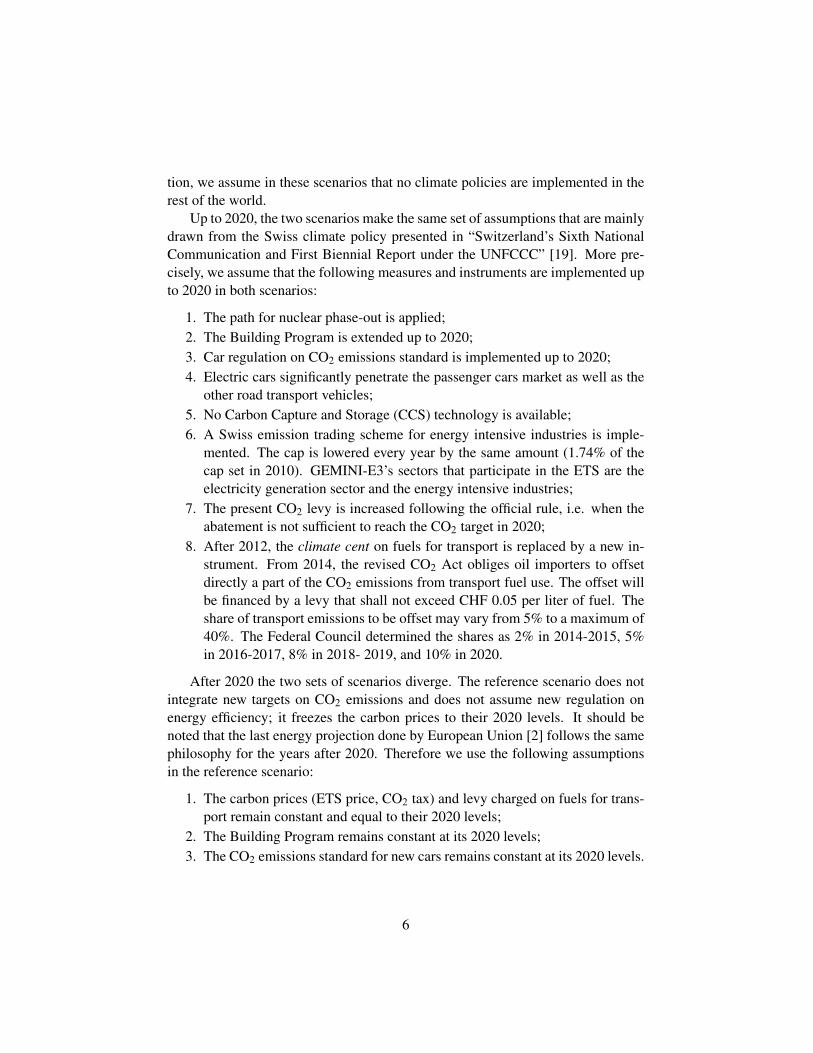
4.1.4. Electricity generationIn May 2011, the Federal government decided, after the devastating earthquake
in Japan and the disaster at Fukushima, to gradually decommission all nuclearpower plants. The strategy is to decommission five nuclear power plants whenthey reach the end of their service life and not to replace them with new ones.However, the Swiss government does not fix the end of their lifetime. The operatorof the Muhleberg power plant already decided to cease all electrical generation in2019. For the 4 remaining power plants we decided to use a lifetime of 60 years.Table 5 shows the operating lifes of the 5 existing nuclear power plants that havebeen introduced in GEMINI-E3. Table 6 shows the renewable potential that weuse in this study. The main source is a publication of the BFE [12] adjusted byINFRAS (on solar P.V. and biomas & biogas). The electricity generation prices fornew renewable capacities are given in Table 7. The expected decline in generationcosts guarantees that the potentials are used.
4.2. Specific assumptions of the reference scenario
4.2.1. TransportationWe assume that the CO2 emissions standards for new vehicles will be 130
grams of CO2 per kilometer in 2015 and 95 grams in 2020. The regulation remainsconstant afterwards. Figure 4 shows the evolution of the emissions standards forpassenger cars in the reference and the DDP scenarios.
9
Table 5: Operating life of Swiss nuclear power plants
Nuclear power plant Operating life
Beznau I (365 Mwe) 1969-2029Beznau II (365 Mwe) 1971-2031Muhleberg (373 Mwe) 1972-2019Gosgen (985 Mwe) 1979-2039Leibstadt (1190 Mwe) 1984-2044
Table 6: 2050 potential of new renewables in GWh - Source: [12]
Solar P.V. 14000Wind 4012Geothermal 4378Biomass and Biogas 4000Other 2163New Hydro 3160Sum 26714
Table 7: Electricity generation cost in Swiss cents per kWh - Source: [18]
2010 2020 2030 2040 2050
Hydro 8.9 10.8 11.5 10.9 11.1Solar P.V. 31.7 16.4 13.0 11.1 9.9Wind 24.1 20.1 15.7 13.9 12.0Geothermal 12.3 10.5 9.8 9.2 8.6
0
20
40
60
80
100
120
140
160
180
200
2000 2005 2010 2015 2020 2025 2030 2035 2040 2045 2050
Reference
DDPP
Figure 4: CO2 emissions standards in grams of CO2 per km for new passenger cars in Switzerland(historical values, Source: [4])
10

For other vehicles (i.e. light commercial vehicles, buses, trucks) we assumea same rate improvement in CO2 emissions. We suppose that electric cars willpenetrate the market of passenger cars in the forthcoming decades and that theshare of passengers cars using electricity will be equal in 2020 to 5% and in 2050to 40%. For other vehicles the share would be equal to 30% in 2050.
The Federal Building Program initiated5 in 2010 by the Confederation and thecantons aims at reducing significantly the energy consumption and the CO2 emis-sions of Swiss buildings. The objective is relevant and reasonable as in Switzer-land around 40% of the energy consumption and CO2 emissions are generatedby the building sector and about 1.5 million of houses and buildings require ur-gent energy retrofit. The program is divided into two streams in the period 2010-2019. The first one (Part A) includes federal subsidies for mainly thermal insu-lation works while the second stream (Part B) encourages investments in renew-able electricity generation in buildings. In the reference scenario we assume thatthe Building Program remains constant after 2020, i.e. that 200 millions of CHFwill be spent every year. In the following, we estimate the direct contribution ofPart A on CO2 savings up to 2050 based on 2011-2013 statistics (yearly subsidies,CO2 savings, etc) available at http://www.dasgebaeudeprogramm.ch/index.php/fr/le-programme-batiments/en-bref and summarized in Table 8. Notethat the column ”Total expected CO2 savings” gives the CO2 savings over all theeffective duration of the measures (about 37 years).
Table 8: Statistics of the Building Program (Part A) on 2011-2013.
Subsidies Total expected CO2 Efficiency ratio(MCHF) savings(Mt of CO2) (Mt of CO2 / MCHF)
2011 136 1.57 0.01152012 174 2.10 0.01212013 131 1.73 0.0132
To estimate the global impact of the Building Program from 2011 until 2050,we made the following assumptions:
• The budget for federal subsidies will attain 200 MCHF per year between2014 and 2050.
• The efficiency ratio (ie, CO2 savings per MCHF) of the implemented mea-sures will decrease by 50% between 2014 and 2050.
5See http://www.dasgebaeudeprogramm.ch/index.php/fr/
le-programme-batiments/en-bref
11
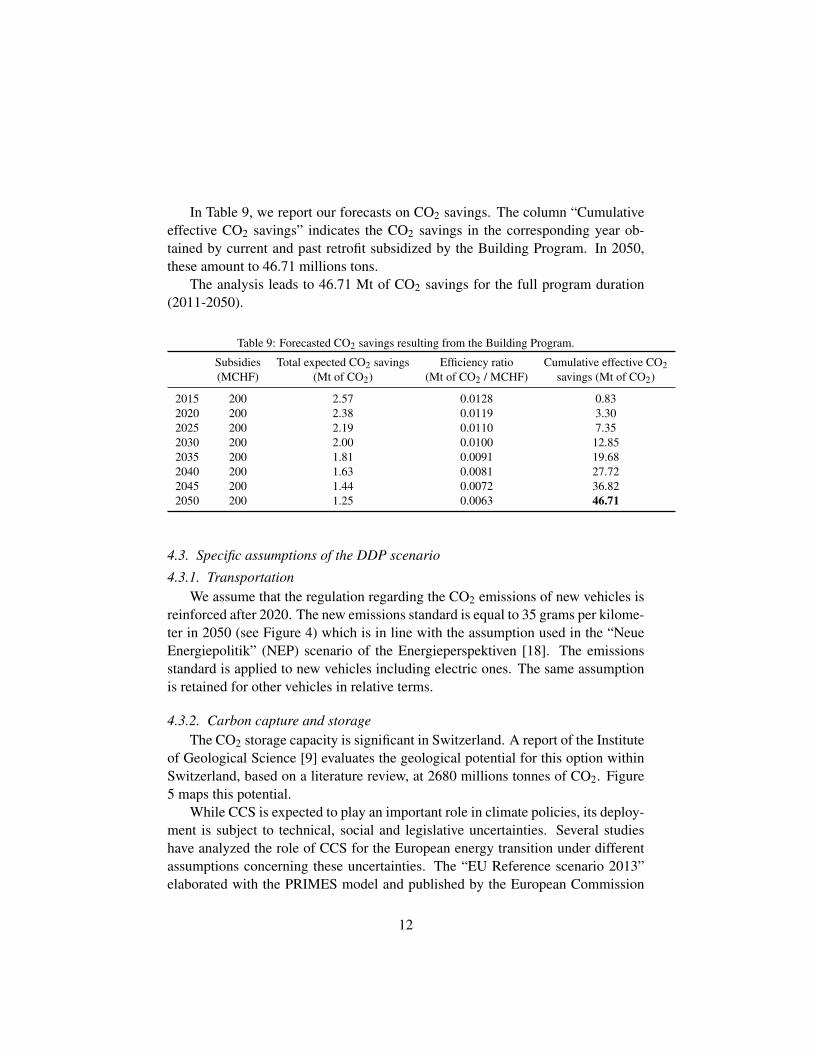
In Table 9, we report our forecasts on CO2 savings. The column “Cumulativeeffective CO2 savings” indicates the CO2 savings in the corresponding year ob-tained by current and past retrofit subsidized by the Building Program. In 2050,these amount to 46.71 millions tons.
The analysis leads to 46.71 Mt of CO2 savings for the full program duration(2011-2050).
Table 9: Forecasted CO2 savings resulting from the Building Program.
Subsidies Total expected CO2 savings Efficiency ratio Cumulative effective CO2(MCHF) (Mt of CO2) (Mt of CO2 / MCHF) savings (Mt of CO2)
2015 200 2.57 0.0128 0.832020 200 2.38 0.0119 3.302025 200 2.19 0.0110 7.352030 200 2.00 0.0100 12.852035 200 1.81 0.0091 19.682040 200 1.63 0.0081 27.722045 200 1.44 0.0072 36.822050 200 1.25 0.0063 46.71
4.3. Specific assumptions of the DDP scenario
4.3.1. TransportationWe assume that the regulation regarding the CO2 emissions of new vehicles is
reinforced after 2020. The new emissions standard is equal to 35 grams per kilome-ter in 2050 (see Figure 4) which is in line with the assumption used in the “NeueEnergiepolitik” (NEP) scenario of the Energieperspektiven [18]. The emissionsstandard is applied to new vehicles including electric ones. The same assumptionis retained for other vehicles in relative terms.
4.3.2. Carbon capture and storageThe CO2 storage capacity is significant in Switzerland. A report of the Institute
of Geological Science [9] evaluates the geological potential for this option withinSwitzerland, based on a literature review, at 2680 millions tonnes of CO2. Figure5 maps this potential.
While CCS is expected to play an important role in climate policies, its deploy-ment is subject to technical, social and legislative uncertainties. Several studieshave analyzed the role of CCS for the European energy transition under differentassumptions concerning these uncertainties. The “EU Reference scenario 2013”elaborated with the PRIMES model and published by the European Commission
12
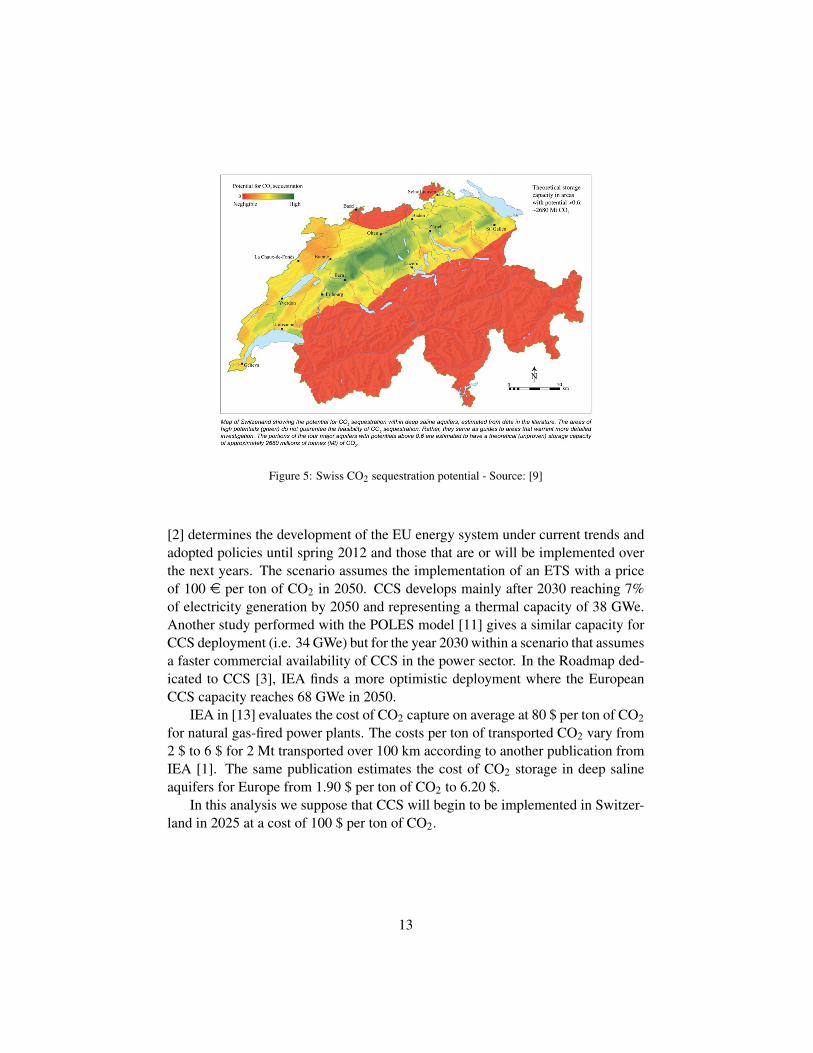
Figure 5: Swiss CO2 sequestration potential - Source: [9]
[2] determines the development of the EU energy system under current trends andadopted policies until spring 2012 and those that are or will be implemented overthe next years. The scenario assumes the implementation of an ETS with a priceof 100 e per ton of CO2 in 2050. CCS develops mainly after 2030 reaching 7%of electricity generation by 2050 and representing a thermal capacity of 38 GWe.Another study performed with the POLES model [11] gives a similar capacity forCCS deployment (i.e. 34 GWe) but for the year 2030 within a scenario that assumesa faster commercial availability of CCS in the power sector. In the Roadmap ded-icated to CCS [3], IEA finds a more optimistic deployment where the EuropeanCCS capacity reaches 68 GWe in 2050.
IEA in [13] evaluates the cost of CO2 capture on average at 80 $ per ton of CO2for natural gas-fired power plants. The costs per ton of transported CO2 vary from2 $ to 6 $ for 2 Mt transported over 100 km according to another publication fromIEA [1]. The same publication estimates the cost of CO2 storage in deep salineaquifers for Europe from 1.90 $ per ton of CO2 to 6.20 $.
In this analysis we suppose that CCS will begin to be implemented in Switzer-land in 2025 at a cost of 100 $ per ton of CO2.
13
5. Simulations results
5.1. The reference scenario
Table 10 gives the CO2 prices and the levy charged on fuels used for transporta-tion. In 2020, one notices that the levy is very low, i.e. around 2 Swiss cents perliter. CO2 emissions from the road transportation sector are thus not affected by thelevy and all CO2 abatement is provided by other sectors. The 60 CHF tax level de-fined for the year 2014 is sufficient to reach the 20% abatement target by 2020. Inthat context the ETS price reaches 40 CHF in 2020, which is mainly driven by thedeployment of gas turbines in electricity generation with 4 TWh of electricity gen-erated in 2020. After 2020, prices remain constant following the rules presented inSection 3.
Table 10: CO2 prices and other levy in CHF2013 - Reference scenario
2020 2030 2040 2050
CO2 tax 60 60 60 60CO2 ETS price 40 40 40 40Levy on fuel transport 0.02 0.02 0.02 0.02
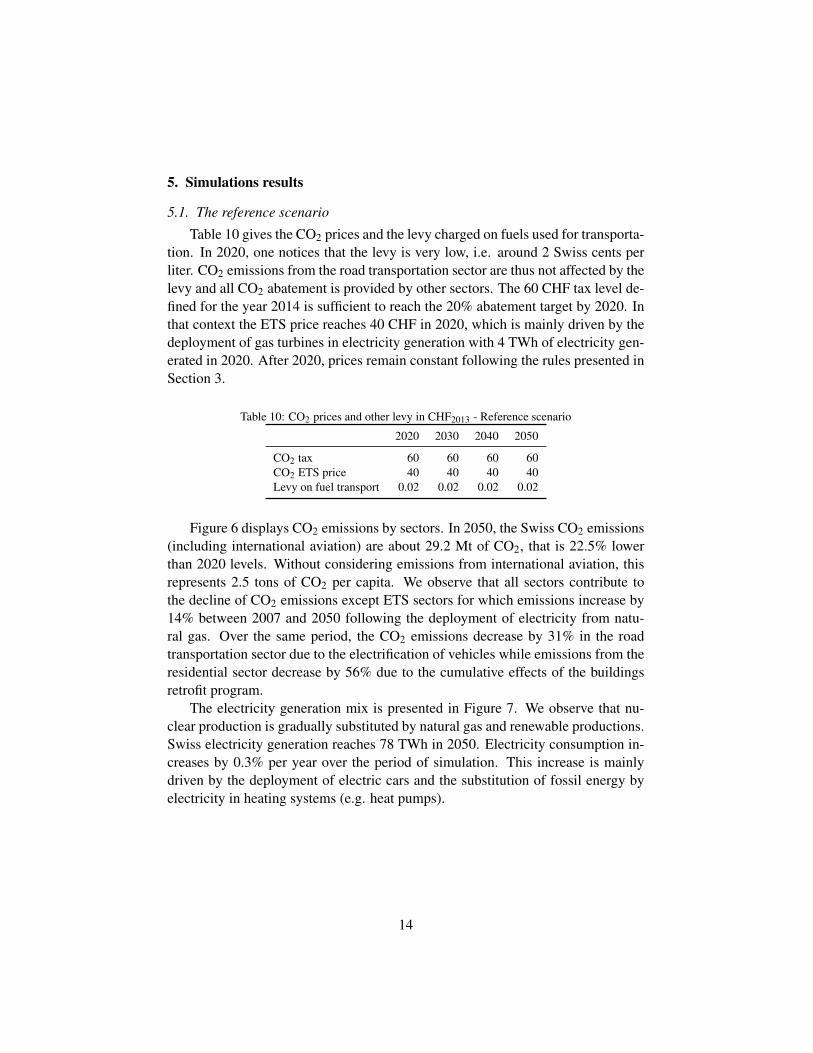
Figure 6 displays CO2 emissions by sectors. In 2050, the Swiss CO2 emissions(including international aviation) are about 29.2 Mt of CO2, that is 22.5% lowerthan 2020 levels. Without considering emissions from international aviation, thisrepresents 2.5 tons of CO2 per capita. We observe that all sectors contribute tothe decline of CO2 emissions except ETS sectors for which emissions increase by14% between 2007 and 2050 following the deployment of electricity from natu-ral gas. Over the same period, the CO2 emissions decrease by 31% in the roadtransportation sector due to the electrification of vehicles while emissions from theresidential sector decrease by 56% due to the cumulative effects of the buildingsretrofit program.
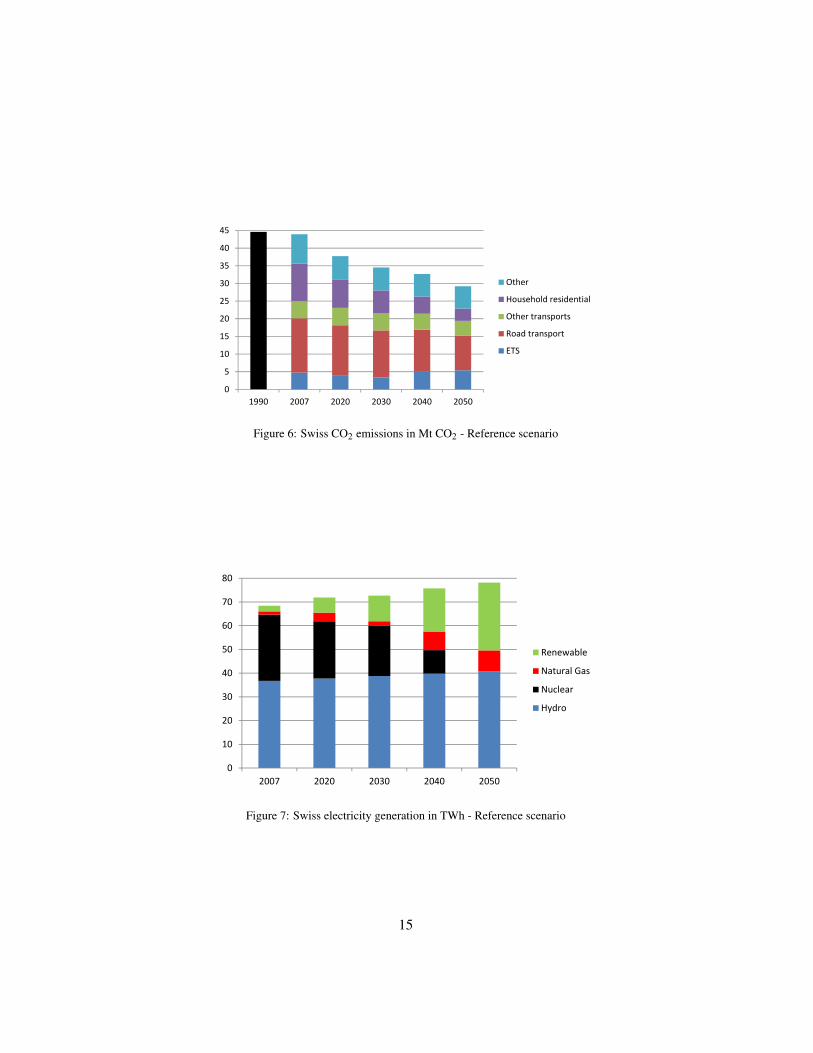
The electricity generation mix is presented in Figure 7. We observe that nu-clear production is gradually substituted by natural gas and renewable productions.Swiss electricity generation reaches 78 TWh in 2050. Electricity consumption in-creases by 0.3% per year over the period of simulation. This increase is mainlydriven by the deployment of electric cars and the substitution of fossil energy byelectricity in heating systems (e.g. heat pumps).
14
0
5
10
15
20
25
30
35
40
45
1990 2007 2020 2030 2040 2050
Other
Household residential
Other transports
Road transport
ETS
Figure 6: Swiss CO2 emissions in Mt CO2 - Reference scenario
0
10
20
30
40
50
60
70
80
2007 2020 2030 2040 2050
Renewable
Natural Gas
Nuclear
Hydro
Figure 7: Swiss electricity generation in TWh - Reference scenario
15

5.2. The DDP scenario
We now suppose that after 2020 a uniform CO2 price is implemented in Switzer-land and gradually increased to reach the objective of 1 ton of CO2 per capita in2050. To achieve this goal, carbon emissions must be taxed at 1556 CHF per tonof CO2 in 2050. As can be seen in Table 14, in the last decade, the CO2 price ismultiplied by a factor two showing the stringency of the target in 2050. A similarresult is found with models used to analyse the European strategy in the EMF28exercice [15]. The welfare cost in percentage of household consumption is shownin Figure 23, it is equivalent to a decrease by 1.7% of household consumption in2050.
Table 11: CO2 prices and other levy in CHF2013 - DDP scenario
2020 2030 2040 2050
CO2 tax 60CO2 ETS price 40Levy on fuel transport 0.02Uniform CO2 tax 257 654 1556
0.0%
0.2%
0.4%
0.6%
0.8%
1.0%
1.2%
1.4%
1.6%
1.8%
2020 2030 2040 2050
Figure 8: Annual welfare cost in % of household consumption compared to reference scenario - DDPscenario
Figures 9 and 10 show the associated CO2 emissions by sectors. They decreaselinearly from 2007 to 2050, and the 2020 committed target appears to be consistentwith the DDP target. All sectors contribute to the abatement except internationalaviation, which is not taxed in the DDP scenario.
16

0
5
10
15
20
25
30
35
40
45
1990 2007 2020 2030 2040 2050
Other
Household residential
Other transports
Road transport
ETS
Figure 9: Swiss CO2 emissions in Mt CO2 - DDP scenario
By assumption all emissions from natural gas power plants are sequesteredafter 2025. Over the whole period (2025-2050) this represents 77 Mt of CO2 and3% of the Swiss sequestration capacity. The decarbonization of the Swiss economyis thus partly realized through the use of more electricity (see Figures 11 and 12)combined with CCS allowing to produce electricity with natural gas free of CO2,and through the use of new renewables whose potential is fully used in 2050. In2050, 90 TWh of electricity are produced, which represents a 15% increase withrespect to the reference scenario. Electricity generation from natural gas is equalto 21 TWh.
0.00
0.740.07
4.641.71
2.66
Electricity
Energy Intensive Industries
Agriculture
Transports
Household residential
Other industries andservices
Figure 10: Swiss CO2 emissions in Mt CO2 in 2050 (excluding international aviation) - DDPPscenario
17

0
20
40
60
80
100
2007 2020 2030 2040 2050
Renewable
Natural gas
Nuclear
Hydro
Figure 11: Swiss electricity generation in TWh - DDP scenario
Figure 12 displays the electricity consumption in its main uses. We remark thatelectric mobility consumption (excluding railways) represents 15 TWh in 2050.
0
10
20
30
40
50
60
70
80
90
100
2010 2020 2030 2040 2050
Electric mobility othersectors
Electric mobility households
Households residential
Transport
Other industries andservices
Energy intensive industries
Figure 12: Swiss electricity consumption in TWh - DDP scenario
5.3. The DDP scenario without CCSWe observed in the previous DDP scenario that CCS represents an important
contribution to CO2 abatement. However CCS is surrounded by several uncertain-ties related mainly to technological issues. The social acceptability of this technol-ogy is also highly uncertain, especially in Switzerland where geological conditions
18
are most favorable in regions close to population centers. Therefore, we have sim-ulated a scenario in which we supposed that CCS would no be implemented inelectricity generation. In this case, CO2 emissions from gas power plant are taxedlike other carbon emissions.
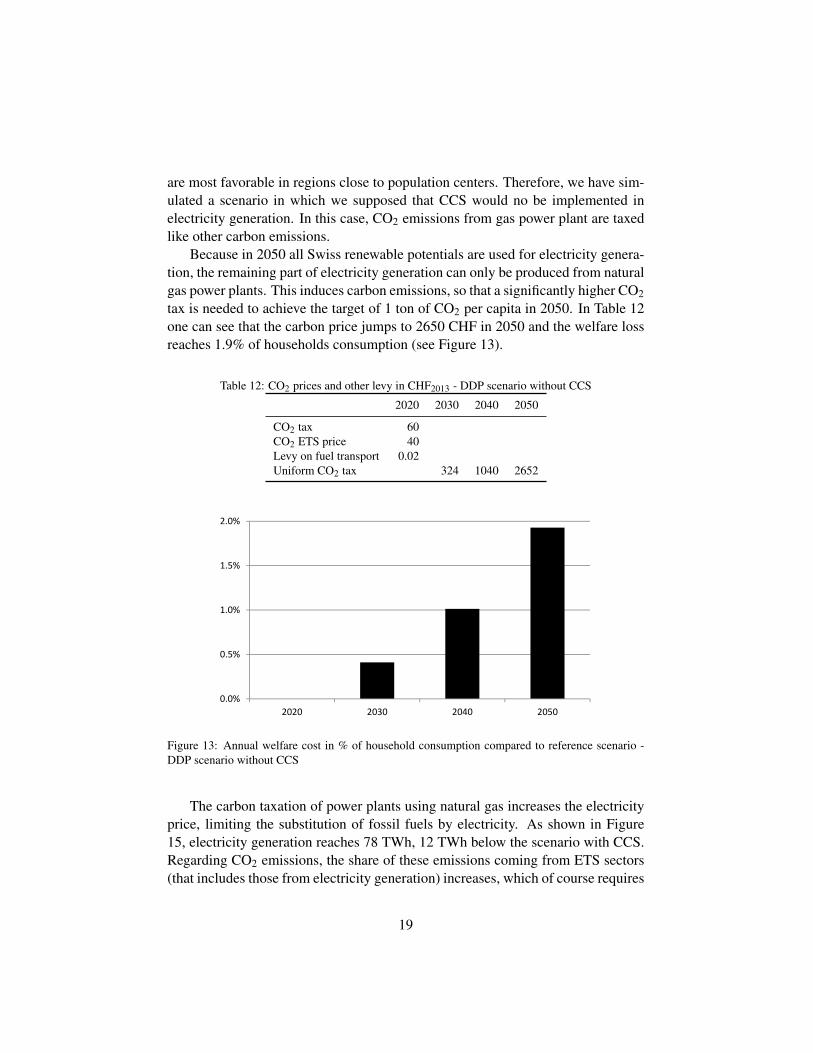
Because in 2050 all Swiss renewable potentials are used for electricity genera-tion, the remaining part of electricity generation can only be produced from naturalgas power plants. This induces carbon emissions, so that a significantly higher CO2tax is needed to achieve the target of 1 ton of CO2 per capita in 2050. In Table 12one can see that the carbon price jumps to 2650 CHF in 2050 and the welfare lossreaches 1.9% of households consumption (see Figure 13).
Table 12: CO2 prices and other levy in CHF2013 - DDP scenario without CCS
2020 2030 2040 2050
CO2 tax 60CO2 ETS price 40Levy on fuel transport 0.02Uniform CO2 tax 324 1040 2652
0.0%
0.5%
1.0%
1.5%
2.0%
2020 2030 2040 2050
Figure 13: Annual welfare cost in % of household consumption compared to reference scenario -DDP scenario without CCS
The carbon taxation of power plants using natural gas increases the electricityprice, limiting the substitution of fossil fuels by electricity. As shown in Figure15, electricity generation reaches 78 TWh, 12 TWh below the scenario with CCS.Regarding CO2 emissions, the share of these emissions coming from ETS sectors(that includes those from electricity generation) increases, which of course requires
19

more abatement from the other sectors (see Figures 15 and 16).
0
20
40
60
80
100
2007 2020 2030 2040 2050
Renewable
Natural gas
Nuclear
Hydro
Figure 14: Swiss electricity generation in TWh - DDP scenario without CCS
0
5
10
15
20
25
30
35
40
45
1990 2007 2020 2030 2040 2050
Other
Household residential
Other transports
Road transport
ETS
Figure 15: Swiss CO2 emissions in Mt CO2 - DDP scenario without CCS
Figure 16 gives for the year 2050 the CO2 emissions levels by sectors. Emis-sions coming from electricity generation are equal to 2.4 Mt CO2 which represents25% of Swiss emissions (excluding international aviation) .
5.4. The DDP scenario with a constraint on electricity consumptionOne of the main conclusions of the DDP scenario analysis is that decarboniza-
tion of the Swiss economy comes with an increase in electricity generation partlyproduced from natural gas. This result is not without rising several issues. First this
20

2.42
0.51
0.05
3.56
1.35
1.94
Electricity
Energy Intensive Industries
Agriculture
Transports
Household residential
Other industries andservices
Figure 16: Swiss CO2 emissions in Mt CO2 in 2050 (excluding international aviation) - DDP sce-nario without CCS
option is cost effective only with CCS implementation, which is at the same timehighly uncertain. Secondly, the significant induced imports of natural gas stand incontradiction with the Swiss energy strategy that promotes energy security goals.
In order to avoid this undesirable effect of natural gas imports, we consider anew scenario with a constraint on long-term electricity consumption. Indeed werely on the planned amendment of the Swiss Energy Act that defines a target forelectricity consumption per capita that has to decrease by 3% in 2020 and by 13%in 2035 with respect to 2000 levels. We extend this target to a 18% reductionin 2050. Therefore, in 2050 electricity consumption would be equal to 63 TWh.The scenario assumes that this target is implemented through additional indirecttaxation of electricity consumption for all uses (intermediate and final).
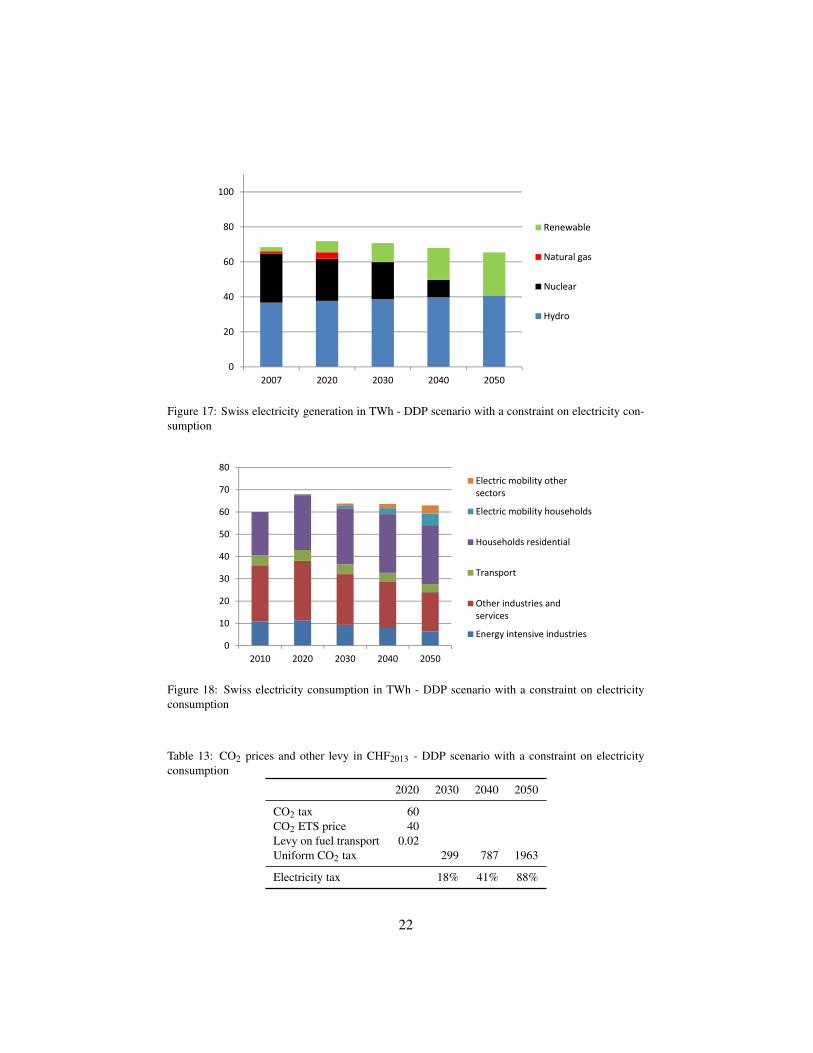
As can be seen in Figure 17, Swiss electricity consumption would remain flatduring the simulation period, and electricity is generated by hydro and other re-newables without any natural gas contribution.
Results are reported in Table 13. The required carbon price increases by 26%in 2050 with respect to the DDP scenario without constraint and reaches 1963CHF. The ceiling on electricity consumption leads to a large increase of electricitytaxation with an indirect tax rate equal to 88% in 2050. Combining a carbon tax anda tax on electricity consumption slightly decreases the welfare cost with respect tothe DDP scenario to 1.5% in 2050 (see Figure 19). This can be partly explained, bya consumption reduction of natural gas which is totally imported in Switzerland.With the constraint of balanced trade assumed, this creates a trade revenue surplus,i.e. less exports are required to equalize the import costs and the consumption levelcould increase. A similar result is found with the GENESwIS model [16].
21
0
20
40
60
80
100
2007 2020 2030 2040 2050
Renewable
Natural gas
Nuclear
Hydro
Figure 17: Swiss electricity generation in TWh - DDP scenario with a constraint on electricity con-sumption
0
10
20
30
40
50
60
70
80
2010 2020 2030 2040 2050
Electric mobility othersectors
Electric mobility households
Households residential
Transport
Other industries andservices
Energy intensive industries
Figure 18: Swiss electricity consumption in TWh - DDP scenario with a constraint on electricityconsumption
Table 13: CO2 prices and other levy in CHF2013 - DDP scenario with a constraint on electricityconsumption
2020 2030 2040 2050
CO2 tax 60CO2 ETS price 40Levy on fuel transport 0.02Uniform CO2 tax 299 787 1963
Electricity tax 18% 41% 88%
22
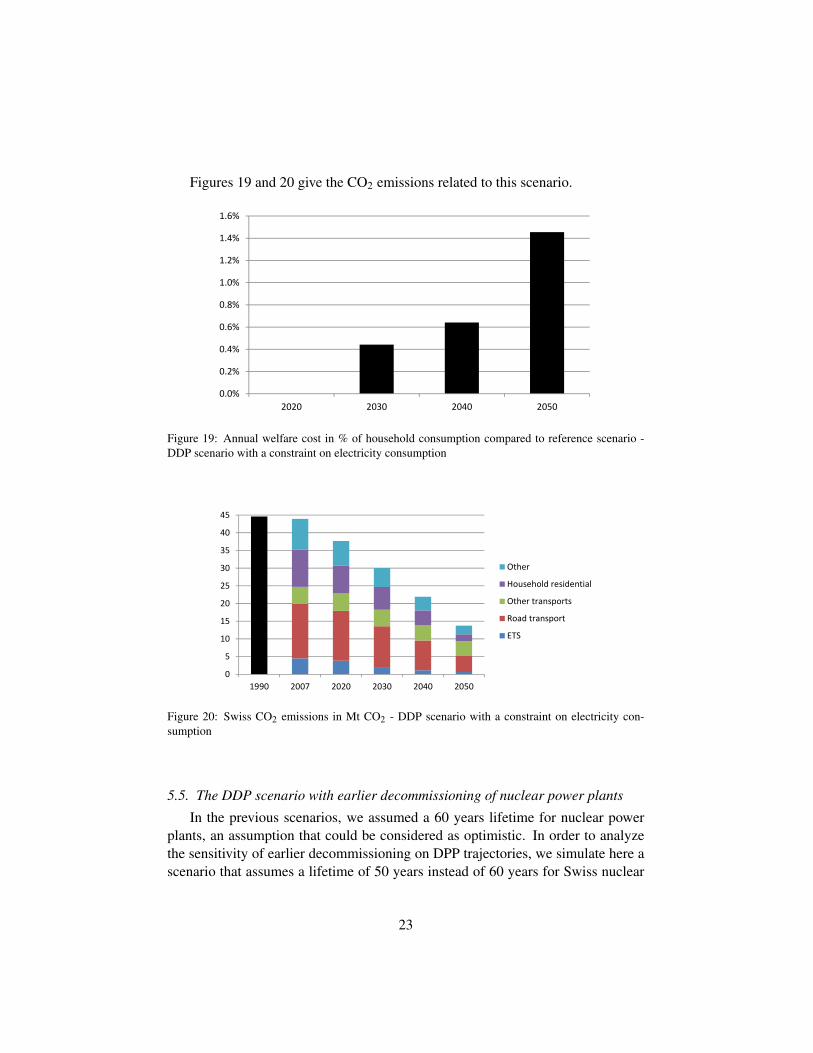
Figures 19 and 20 give the CO2 emissions related to this scenario.
0.0%
0.2%
0.4%
0.6%
0.8%
1.0%
1.2%
1.4%
1.6%
2020 2030 2040 2050
Figure 19: Annual welfare cost in % of household consumption compared to reference scenario -DDP scenario with a constraint on electricity consumption
0
5
10
15
20
25
30
35
40
45
1990 2007 2020 2030 2040 2050
Other
Household residential
Other transports
Road transport
ETS
Figure 20: Swiss CO2 emissions in Mt CO2 - DDP scenario with a constraint on electricity con-sumption
5.5. The DDP scenario with earlier decommissioning of nuclear power plants
In the previous scenarios, we assumed a 60 years lifetime for nuclear powerplants, an assumption that could be considered as optimistic. In order to analyzethe sensitivity of earlier decommissioning on DPP trajectories, we simulate here ascenario that assumes a lifetime of 50 years instead of 60 years for Swiss nuclear
23
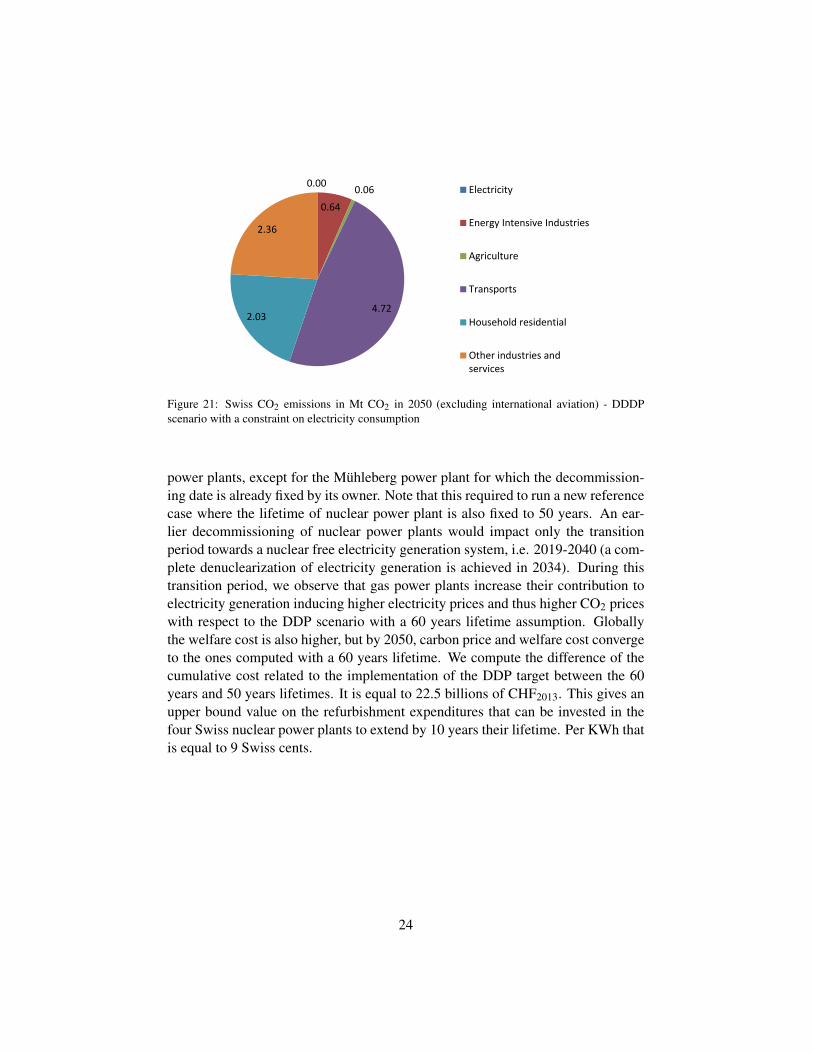
0.00
0.640.06
4.722.03
2.36
Electricity
Energy Intensive Industries
Agriculture
Transports
Household residential
Other industries andservices
Figure 21: Swiss CO2 emissions in Mt CO2 in 2050 (excluding international aviation) - DDDPscenario with a constraint on electricity consumption
power plants, except for the Muhleberg power plant for which the decommission-ing date is already fixed by its owner. Note that this required to run a new referencecase where the lifetime of nuclear power plant is also fixed to 50 years. An ear-lier decommissioning of nuclear power plants would impact only the transitionperiod towards a nuclear free electricity generation system, i.e. 2019-2040 (a com-plete denuclearization of electricity generation is achieved in 2034). During thistransition period, we observe that gas power plants increase their contribution toelectricity generation inducing higher electricity prices and thus higher CO2 priceswith respect to the DDP scenario with a 60 years lifetime assumption. Globallythe welfare cost is also higher, but by 2050, carbon price and welfare cost convergeto the ones computed with a 60 years lifetime. We compute the difference of thecumulative cost related to the implementation of the DDP target between the 60years and 50 years lifetimes. It is equal to 22.5 billions of CHF2013. This gives anupper bound value on the refurbishment expenditures that can be invested in thefour Swiss nuclear power plants to extend by 10 years their lifetime. Per KWh thatis equal to 9 Swiss cents.
24

Table 14: CO2 prices and other levy in CHF2013 - DDP scenario with earlier decommissioning ofnuclear power plants
2020 2030 2040 2050
CO2 tax 60ETS price 124Levy on fuel transport 0.02Uniform CO2 tax 267 663 1559
0
20
40
60
80
100
2007 2020 2030 2040 2050
Renewable
Natural gas
Nuclear
Hydro
Figure 22: Swiss electricity generation in TWh - DDP scenario with earlier decommissioning ofnuclear power plants
0.0%
0.2%
0.4%
0.6%
0.8%
1.0%
1.2%
1.4%
1.6%
1.8%
2020 2030 2040 2050
Figure 23: Annual welfare cost in % of household consumption compared to reference scenario -DDP scenario with earlier decommissioning of nuclear power plants
25

6. Conclusion
This analysis aimed at simulating scenarios of a decarbonization pathway forSwitzerland. To do this analysis we used the GEMINI-E3 model adapted to ac-count for the existing Swiss policies.
These simulations provide several insights. First, the objective of 1 ton of CO2per capita in the next 35 years appears to be quite challenging, especially withthe nuclear phase-out decision by 2044. Nevertheless, it is possible to design afeasible pathway. Assuming CCS deployment, it results in a cumulative welfareloss6 of 1% of household consumption. In 2050 the welfare loss represents 1.7%of household consumption, which is much lower than the estimates of the FP7AMPERE project [10] that range from 2% to 9.5% GDP reduction for the Euro-pean Union. At the end of the period, the CO2 tax is equal to 1556 CHF. Thisprice is high in comparison with those found in the EMF28 exercice [15] for Euro-pean countries where the median value is 521 e/tCO2 with a range of [240 - 1127e/tCO2] by 2050. But it is consistent with previous analyses on Switzerland [7].The main reason is that Switzerland lacks the classical sectors where CO2 can bemitigated at moderate cost (e.g. coal fired electricity generation, heavy industry).In that context the decarbonization of the Swiss economy is achieved through en-ergy efficiency improvements but also through the substitution of fossil energy bycarbon-free electricity. However, as the Swiss renewable potential is not sufficientto satisfy electricity demand, the model shows the deployment of CCS technologyassociated with combined cycle gas turbines. This penetration of CCS technolo-gies is consistent with other EU studies [10, 15], in which CCS is combined with agrowing share of European electricity supply.
Assuming that CCS will no be implemented in Switzerland raises the cost ofthe DDP scenario, but this increase is limited by gains coming from reduced im-ports of natural gas for power generation. The welfare cost reaches 1.9% in 2050.
Finally we simulate a scenario that combines targets on carbon emissions andon electricity consumption. In this case Swiss electricity generation remains free ofcarbon and based on hydro and other renewables. The welfare cost is comparableto the one computed in the DDP scenario but would result in a less energy intensiveeconomy that does not rely on imports of natural gas.
6without discounting.
26

References
[1] CO2 capture and storage A key carbon abatement option. International En-ergy Agency, 2008.
[2] EU Energy, Transport and GHG Emissions, Trends to 2050, Reference Sce-nario 2013. European Commission, 2013.
[3] International Energy Agency. Technology Roadmap Carbon Capture andStorage. 2013.
[4] Auto-Suisse. Rapport annuel sur la reduction de la consommation normaliseede carburant des voitures de tourisme dans le cadre de l’Ordonnance surl’energie. Technical report, 2012.
[5] Badri Narayanan, Angel Aguiar, and Robert McDougall, editors. GlobalTrade, Assistance, and Production: The GTAP 8 Data Base. Center forGlobal Trade Analysis, Purdue University, 2012.
[6] A. Bernard and M. Vielle. GEMINI-E3, a General Equilibrium Model ofInternational National Interactions between Economy, Energy and the Envi-ronment. Computational Management Science, 5(3):173–206, May 2008.
[7] Christoph Bohringer and Andre Muller. Environmental Tax Reforms inSwitzerland A Computable General Equilibrium Impacst Analysis. SwissJournal of Economics and Statistics, 150(1):1–21, 2014.
[8] Office Federale de la Statistique. Les scenarios de l’evolution de la populationde la Suisse 2010-2060. Technical report, 2010.
[9] Larryn W. Diamond, Werner Leu, and Gabriel Chevalier. Potential for geo-logical sequestration of CO2 in Switzerland. Technical report, Bundesamt furEnergie BFE, 2010.
[10] E3MLab and ICCS. Ampere Assessment of Climate Change Mitigation Path-ways and Evaluation of the Robustness of Mitigation Cost Estimates. Tech-nical report, 2013.
[11] Enerdata. Cost and benefits to EU Member States of 2030 Climate and En-ergy targets. Technical report, 2014.
[12] Conseil federal. Potentiel des energies renouvelables dans la productiond’electricite. Technical report, Office federal de l’energie OFEN, 2012.
27
[13] Matthias Finkenrath. Cost and performance of carbon dioxide capture frompower generation. Technical report, International Energy Agency, 2011.
[14] International Energy Agency. World Energy Outlook 2013. 2013.
[15] Weyant J, Knopf B., de Cian E., Keppo I., and van Vuuren D. Introduction tothe EMF28 Study on scenarios for transforming the European energy system.Climate Change Economics, 4, 2013.
[16] Sophie Maire, Rajesh Pattupara, Kannan Ramachandran, Marc Vielle, andFrank Vohringer. Electricity markets and trade in Switzerland and its neigh-bouring countries (ELECTRA). Technical report, Econability, PSI, EPFL,2015.
[17] C. Nathani, D. Sutter, R. van Nieuwkoop, M. Peter, S. Kraner, M. Holzhey,H. Rtter, and R. Zandonella. Energy related disaggregation of the SwissInput-Output Table. Technical report, SFOE, EWG Publication, Bern, 2011.
[18] Prognos. Die Energieperspektiven fur die Schweiz bis 2050 - Energienach-frage und Elektrizitatsangebot in der Schweiz 2000-2050. Technical report,Study commissioned by the Swiss Federal Office of Energy, Basel, 2012.
[19] Swiss Confederation. Switzerland’s Sixth National Communication and FirstBiennial Report under the UNFCCC. 2013.
[20] Department of Economic United Nations and Population Division Social Af-fairs. World Population Prospects: The 2010 Revision. Technical report,2011.
[21] Ian Sue Wing. The synthesis of bottom-up and top-down approaches to cli-mate policy: Electric power technologies and the cost of limiting US CO2emissions. Energy Policy, 34:3847–3869, 2006.
28