Means and ends toward the broadband society: Net neutrality and ...

1st Quarter FY’16
Investor Presentation
DEN Networks Ltd

Forward Looking Statements
This presentation may contain “forward-looking statements” which are statements that refer to expectations and plans for the future and include, without limitation,
statements regarding Den’s future results of operations, financial condition or business prospects as well as other statements based on projections, estimates and
assumptions. In some cases, these statements can be identified by terms such as "expect," "intend," "plan," "believe," "estimate," "may," "will," "should" and
comparable words (including the negative of such words). These forward-looking statements, reflect the current expectations and plans of the directors and
management of Den, which may not materialize or may change. Many risks, uncertainties and other factors, some of which are unpredictable and beyond Den’s
control, could affect the matters discussed in these forward-looking statements. These factors include, without limitation, economic and business conditions globally
and in the countries where we operate, Den’s ability to predict and respond quickly to market developments, consumer demand, pricing trends and competition;
changes in applicable laws and regulations (including applicable tax and tariff rates). Any variance from the expectations or plans on which these forward-
looking statements are based could cause Den’s actual results or actions to differ materially from those expressed or implied in these statements. These forward-
looking statements are not guarantees of future performance and you are cautioned not to place undue reliance on these statements. Den undertakes no
obligation to update any forward-looking statements in this presentation, whether as a result of new information or any subsequent change, development or
event. All forward-looking statements in this presentation are qualified by reference to this paragraph.
2

Business Performance
Pradeep ParameswaranCEO
3

Deployed 185,000 STBs in the quarter;
56% customers digitized of 13mn total
13 DAS Cities generating Billing, Net of
Taxes of more than ₹80 in 1Q’16 vs 11
cities in 4Q’15 and 8 cities in 1Q’15
– >60% of DAS paying subscribers
above ₹80 per box net billing vs
50% in 4Q’15 and 38% in 1Q’15
1Q’16 Highlights
On target to achieve 1mn Homes Passed
and 100k Subscribers in FY’15-16
– Added 157k homes passed
taking total to 486k as on 30
June
– Added 12k subscribers in quarter
taking total to 35k as on 30 June
₹760 ARPU for 1Q’16
INR 144 Crore annualised GMV at
current run rate
>33mn home reach
~32% conversion of the total call
received in the quarter
4

Group KPIs
5
6.4
7.0
7.2
1Q'15 4Q'15 1Q'16
₹ 76 ₹ 74₹ 78
1Q'15 4Q'15 1Q'16
0.00
0.33
0.49
1Q'15 4Q'15 1Q'16
4
23
35
1Q'15 4Q'15 1Q'16
Cable Digital Subscribers (Mn)Cable DAS ARPU Per Box
(Net of LCO, Net of Taxes)
Broadband Homes
Passed (mn)
Broadband Subscribers
(‘000)
1Q’16 Additions +185k +5% +0.16Mn +12k

Road Ahead – Value Drivers
6
Value Drivers for FY’16 Progress in 1Q’16
Improve monetisation in DAS I and II
markets - Pricing, Packaging, HD, Pre-paid
Billing, Net of Taxes at INR 78 per box vs 74 in 4Q’15
44% of DAS subscribers on packaged schemes as on 30 June
HD – WIP
Broadband execution – Multi channel sales,
roll-out factory
Added 12k Subscribers
Added 157k Homes Passed
On track for 1 million Homes passed and 100k subscribers in FY 15-16
Box seeding - phase III and IV markets
Substantial market development
2.25 million boxes deployed in DAS 3 and 4 markets at end of 1Q’16, ahead of Dec’15
deadline.
TV shop – increase the reach TV Shop reach 33 million on 30 June vs 25 million as at 31 March
Strengthen IR management On track

Financial Performance
Manish DawarGroup CFO
7
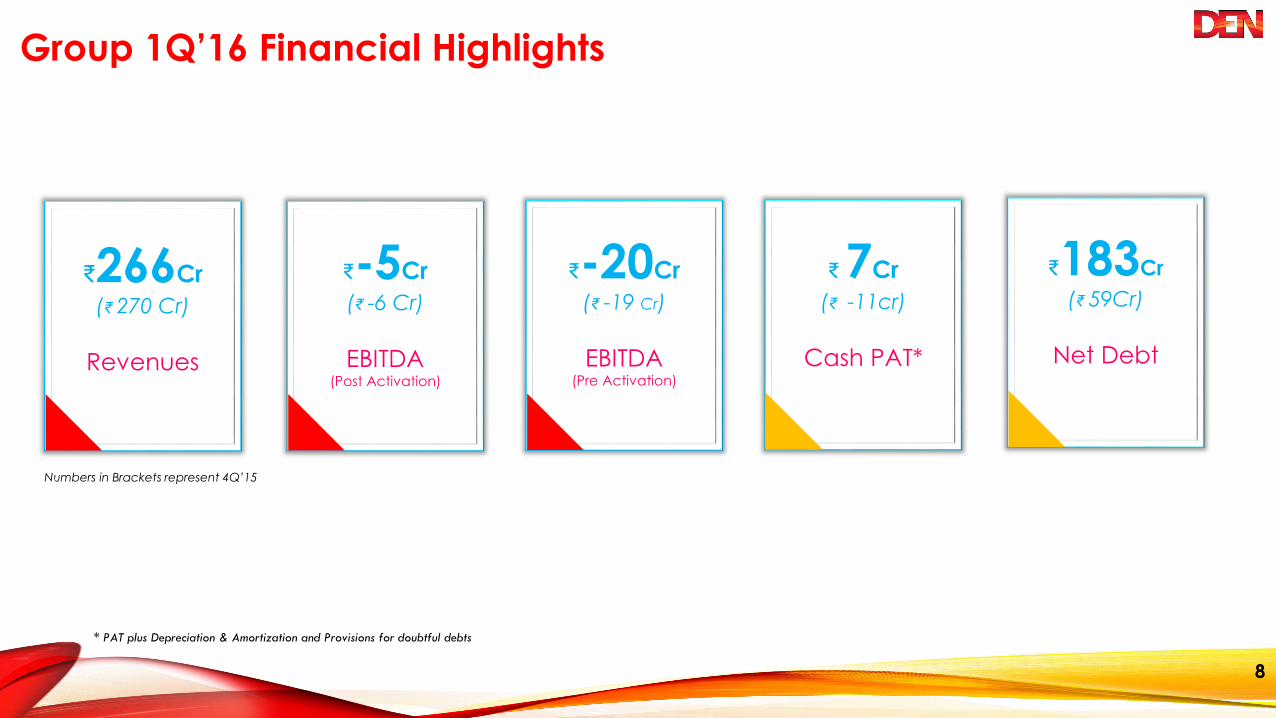
Group 1Q’16 Financial Highlights
₹266Cr
(₹ 270 Cr)
Revenues
₹-5Cr
(₹ -6 Cr)
EBITDA(Post Activation)
₹183Cr
(₹ 59Cr)
Net Debt
Numbers in Brackets represent 4Q’15
8
₹-20Cr
(₹ -19 Cr)
EBITDA (Pre Activation)
* PAT plus Depreciation & Amortization and Provisions for doubtful debts
₹7Cr
(₹ -11cr)
Cash PAT*

Group 1Q’16 Segment View
9
INR Crore
Cable Broadband Soccer TV Commerce Distribution Consolidated
Total Revenues 1Q'16 256 5 0.9 1.8 1.3 266
4Q'15 265 3 (0.0) 1.0 1.2 270
1Q'15 254* 1 - - 12.7 268
EBITDA (Post Activation) 1Q'16 18 (18) (0.1) (4.4) (0.2) (5)
4Q'15 14 (14) (2.3) (2.7) (1.0) (6)
1Q'15 69 (8) (4.0) - (0.3) 57
EBITDA (Pre Activation) 1Q'16 3 (18) (0.1) (4.4) (0.2) (20)
4Q'15 1 (14) (2) (3) (1) (19)
1Q'15 49 (8) (4.0) - 0.3 37
PBT 1Q'16 (20) (20) (1.4) (4.4) 0.2 (46)
4Q'15 (26) (16) (3.5) (2.7) 1.1 (47)
1Q'15 25 (9) (4.2) - 0.9 13
PAT 1Q'16 (26) (20) (1.4) (4.4) 0.2 (52)
4Q'15 (41) (16) (3.5) (2.7) 1.1 (62)
1Q'15 13 (9) (4.2) - 0.7 1
* Cable Business Revenues Adjusted for LCO Share of INR 31 Cr in 1Q FY'15

Consolidated Income Statement
10
INR Crore
Y-o-Y Q-o-Q1Q'16 4Q'15 1Q'15 Change Change
Revenues 266 270 268* -1% -2%
Content Costs 136 139 106 28% -2%
Personnel Costs 34 30 28 20% 13%
Other Opex 91 103 61* 49% -12%
Provision for doubtful debts 9 4 15 -38% 116%
EBITDA (5) (6) 57 -108% 22%
EBITDA % -1.8% -2.2% 21.3%
Other Income 27 23 19 43% 17%
Dep & Amort 50 47 43 16% 6%
Finance Costs 18 16 20 -8% 12%
Profit Before Tax (PBT) (46) (47) 13 -464% 1%
Provisions for Tax 3 14 4 -19% -76%
Minority Interest 2 1 7 -71% 129%
Net Income (52) (62) 1 -4723% 16%
* Revenues and Expenses adjusted for LCO Share of INR 31 Cr in 1Q FY'15 for an like to like comparision
Actual
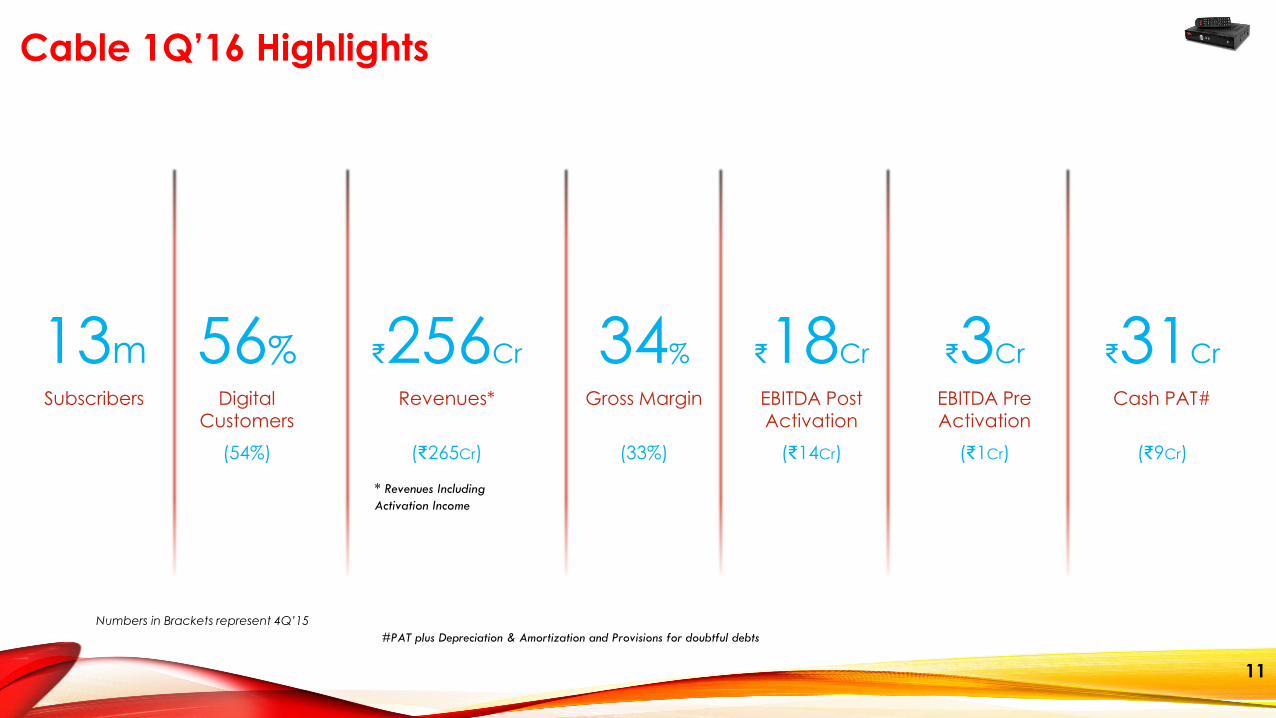
Cable 1Q’16 Highlights
13m 56% ₹256Cr 34% ₹18Cr ₹3Cr ₹31Cr
Subscribers Digital Customers
Revenues* Gross Margin EBITDA Post Activation
EBITDA Pre Activation
Cash PAT#
(54%) (₹265Cr) (33%) (₹14Cr) (₹1Cr) (₹9Cr)
11
Numbers in Brackets represent 4Q’15
* Revenues Including
Activation Income
#PAT plus Depreciation & Amortization and Provisions for doubtful debts

Cable Subscribers – 13M
Total Digital Subscribers (Million)
6.40
6.64
6.84
7.03
7.22
1Q FY'15 2Q FY'15 3Q FY'15 4Q FY'15 1Q FY'16
DAS 1and 2 Markets (Million STBs)
1.99 2.09 2.09 2.10 2.12
2.78 2.78 2.81 2.84 2.84
1Q FY'15 2Q FY'15 3Q FY'15 4Q FY'15 1Q FY'16
Phase 1 Phase 2
DAS 3 Markets - Analog (Million STBs)
1.63 1.77
1.94 2.09
2.25
1Q FY'15 2Q FY'15 3Q FY'15 4Q FY'15 1Q FY'16
49% 56%
Digital Subscribers % in Total Subscriber Base
24% 25%
DEN Market Share* in DAS 1 & 2 Markets Phase 3 & 4 expected to implement by end of
2015 and 2016 respectively providing a huge opportunity to increase the digital subscriber base where DEN has ~6 Million subscribers
4.8 4.9 4.9 4.9
* Market Share based on MPA Estimates (MPA 2014) 12
5.0
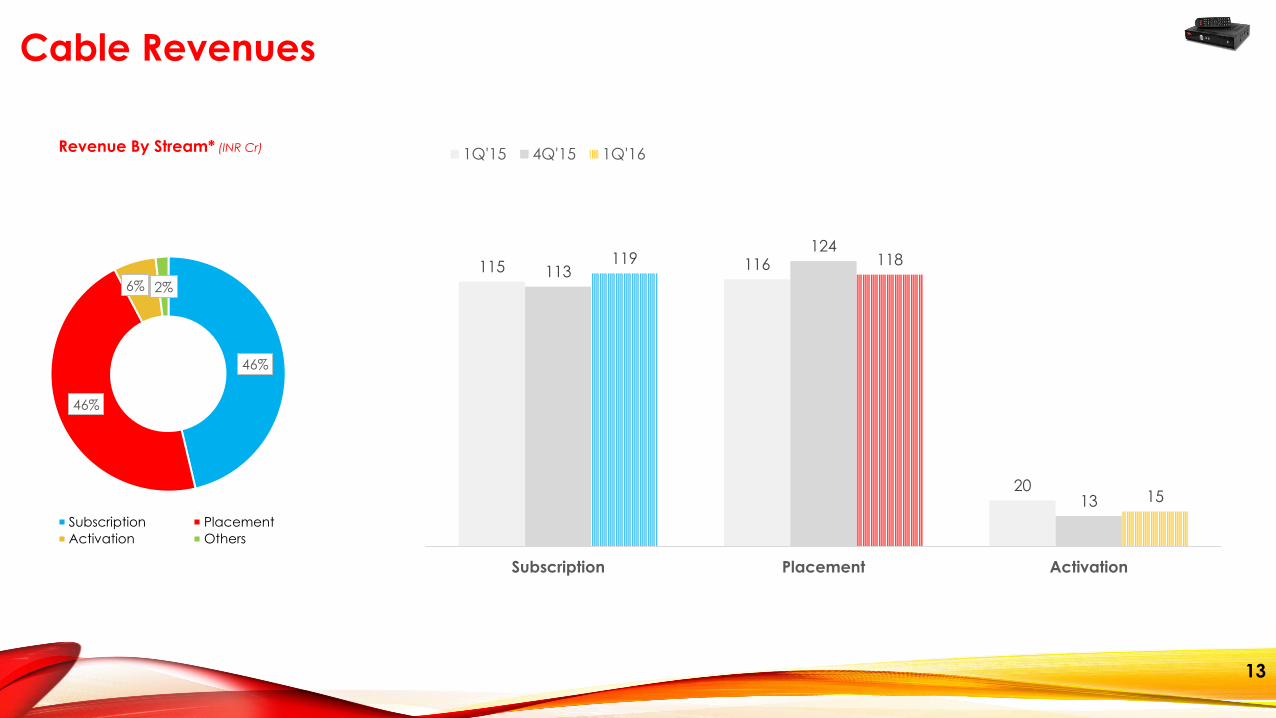
46%
46%
6% 2%
Subscription Placement
Activation Others
Revenue By Stream* (INR Cr)
Cable Revenues
115 116
20
113
124
13
119 118
15
Subscription Placement Activation
1Q'15 4Q'15 1Q'16
13

Cable Income Statement
14
INR Crore
Y-o-Y Q-o-Q
1Q'16 4Q'15 1Q'15 Change Change
Subscription (Net of LCO Share) 119 113 115* 3% 5%
Placement 118 124 116 2% -5%
Other Operating Income 4 15 3 49% -70%
Revenues Pre Activation 241 252 234 3% -4%
Activation Revenues 15 13 20 -24% 15%
Revenues (Post Activation) 256 265 254 1% -3%
Content Costs 136 139 106 27% -2%
Personnel Costs 26 26 21 27% 1%
Other Opex 68 82 49* 38% -17%
Provision for doubtful debts 9 4 9
EBITDA (Post Activation) 18 14 69 -75% 26%
EBITDA % 6.9% 5.3% 27%
EBITDA (Pre Activation) 3 1 49 -95% 193%
EBITDA % 1.0% 0.3% 21.1%
Other Income 26 21 18 46% 27%
Dep & Amort 48 46 43 11% 5%
Finance Costs 16 14 20 -17% 13%
Profit Before Tax (20) (26) 25 NM 21%
Provisions for Tax 3 14 4 -18% -76%
Minority Interest 2 1 7 -71% 129%
Net Income (26) (41) 13 NM 37%
* Revenues and expenses Adjusted for LCO Share of INR 31 Cr in 1Q FY'15 for an like to like comparison
Actual

Number of Cities with Billing, Net of Taxes, Range
8
65
8
11
1
87
13
2
7
5
>80 65-80 50-65 <50
1Q'15 4Q'15 1Q'16
15
38%
17%
21%24%
50%
5%
22%23%
60%
4%
20%16%
>80 65-80 50-65 <50
% of Paying DAS Subscribers with Billing, Net of Taxes, Range
Billing, Net of Taxes, Across DAS Markets

Broadband Highlights
* Year To Date Numbers
30
160
272 329
486
1Q'15 2Q'15 3Q'15 4Q'15 1Q'16
Homes Passed (‘000)
4 8
14
23
35
1Q'15 2Q'15 3Q'15 4Q'15 1Q'16
Subscribers (‘000)
740 740
746
759 760
1Q'15 2Q'15 3Q'15 4Q'15 1Q'16
ARPU INR
16
3%
7% 8% 8%12%
0-3 3-6 6-9 9-12 12+
Cohort Analysis
RFS Tenor Slab (Months)

TV Commerce Key Takeaways
Annualised GMV on Current Rate
₹144Cr
Reach (Million Homes)
33mn
Average Daily
Transactions
1,526Conversion Ratio of Calls Received
32%
Repeat
Customers
16%
17
(₹117Cr) (25mn) (1,312) (30%) (17%)

DEN Operating Cycle
18
Cable Business Expansion (Increase Subscriber Base)
TV Commerce
Improve
Monetization
of DAS 1 and
2 Markets
Strengthen Cash Position
Broadband
EnterpriseValueSTB seeding in
and Monetize
DAS 3 and 4
Markets
Leverage
Costs
LCO
Engagement

19
Jatin Mahajan
+91 11 4052 2200
DEN Networks Ltd.
(CIN No. L92490DL2007PLC165673)
Shogun Jain / Payal Dave
[email protected] / [email protected]
+91 77 3837 7756 / +91 98 1991 6314
Strategic Growth Advisors Pvt. Ltd.
(CIN No. U74140MH2010PTC204285)
For Further Information Please Contact