An ESG Walkthrough -ESG Federation website -- DCC File system for ESG Muhammad Atif.

FINANCE
Demystifying Sovereign ESG
Ekaterina M. Gratcheva, Teal Emery, and Dieter Wang
F I N A N C E
EQUITABLE GROWTH, FINANCE & INSTITUTIONS INSIGHT
Pub
lic D
iscl
osur
e A
utho
rized
Pub
lic D
iscl
osur
e A
utho
rized
Pub
lic D
iscl
osur
e A
utho
rized
Pub
lic D
iscl
osur
e A
utho
rized

© 2020 International Bank for Reconstruction and Development / The World Bank1818 H Street NW, Washington DC 20433Telephone: 202-473-1000; Internet: www.worldbank.org
Some rights reserved.This work is a product of the staff of The World Bank with external contributions. The findings, interpretations, and conclusions expressed in this work do not necessarily reflect the views of The World Bank, its Board of Executive Directors, or the governments they represent. The World Bank does not guarantee the accuracy of the data included in this work. The boundaries, colors, denominations, and other information shown on any map in this work do not imply any judgment on the part of The World Bank concerning the legal status of any territory or the endorsement oracceptance of such boundaries.
Nothing herein shall constitute or be considered to be a limitation upon or waiver of the privileges and immunities of The World Bank, all of which are specifically reserved.
Rights and Permissions
This work is available under the Creative Commons Attribution 3.0 IGO license (CC BY 3.0 IGO), http:// creativecommons.org/licenses/by/3.0/igo. Under the Creative Commons Attribution license, you are free to copy, distribute, transmit, and adapt this work, including for commercial purposes, under the following conditions:
Attribution—Please cite the work as follows: Ekaterina M. Gratcheva, Teal Emery, and Dieter Wang. 2020. “Demystifying Sovereign ESG” EFI Insight-Finance. Washington, DC: World Bank.
Translations—If you create a translation of this work, please add the following disclaimer along with the attribution: This translation was not created by The World Bank and should not be considered an official World Bank translation. The World Bank shall not be liable for any content or error in this translation.
Adaptations—If you create an adaptation of this work, please add the following disclaimer along with the attribution: This is an adaptation of an original work by The World Bank. Views and opinions expressed in the adaptation are the sole responsibility of the author or authors of the adaptation and are not endorsed by The World Bank.
Third-party content—The World Bank does not necessarily own each component of the content contained within the work. The World Bank therefore does not warrant that the use of any thirdparty-owned individual component or part contained in the work will not infringe on the rightsof those third parties. The risk of claims resulting from such infringement rests solely with you.If you wish to reuse a component of the work, it is your responsibility to determine whether permission is needed for that reuse and to obtain permission from the copyright owner. Examples of components can include, but are not limited to, tables, figures, or images.
All queries on rights and licenses should be addressed to World Bank Publications, The World Bank Group, 1818 H Street NW, Washington, DC 20433, USA; e-mail: [email protected].

1>>>DEMYSTIFYING SOVEREIGN ESG
This paper forms part of a series of publications under the Global Program on Sustainability (GPS). The series is a knowledge product of GPS Pillar 3 with the objective to promote the use of high-quality data and analysis of sustainability to better inform decisions made by governments, the private sector, and financial institutions. GPS Pillar 3 is led by the World Bank’s Finance, Competitiveness and Innovation (FCI) Global
Practice (GP) in collaboration with World Bank Treasury (TRE), Development Economics Vice Presidency (DEC), and other GPs. Focusing on ESG issues in sovereign investing, the series disseminates practical, evidence-based recommendations for market participants, including institutional investors, sovereign issuers, credit rating agencies, and ESG data and service providers, among others.
> > >
“A New Dawn: Rethinking Sovereign ESG” proposes improvements to the sovereign ESG framework and builds on findings and recommendations discussed in other papers in the series.
“Demystifying Sovereign ESG” focuses on comparing the sovereign ESG methodologies of leading sovereign ESG providers and describes structural challenges posed by the current sovereign ESG framework.
“Riding the Wave: Navigating the ESG Landscape for Sovereign Debt Managers” provides a thorough discussion of sovereign ESG from a debt management office perspective.
“Paving the Path: Lessons from Chile’s Experiences as a Sovereign Issuer for Sustainable Finance Action” provides a concentrated study of Chile’s ESG-focused issuances to date and relevant lessons.
“Spatial Finance: Challenges and Opportunities in a Changing World” (produced in partnership with the World Wildlife Fund) discusses challenges with the E data, including at the sovereign level, and explores the use of satellite data to address the quality and availability of E data.
“Credit Worthy: ESG Considerations in Sovereign Credit Ratings” demystifies the role of ESG factors in country credit ratings and highlights potential ESG impact on the creditworthiness of countries with the application of the World Bank’s wealth and stranded asset data.
“1% Growth in Natural Capital: Why It Matters for Sovereign Bonds” quantifies the materiality of natural capital and its impact on sovereign bonds by adjusting for ingrained income bias.
The chapter “Natural Allies: Wealth and Sovereign ESG” from the book The Changing Wealth of Nations 2021: Managing Assets for the Future focuses on challenges in ESG data and discusses solutions with the application of the World Bank wealth data.
“Natural Capital and Sovereign Bonds” introduces the concept of ingrained income bias and presents evidence that sovereign bond yields reflect a country’s various types of natural capital.


3>>>DEMYSTIFYING SOVEREIGN ESG
Abbreviations 5Acknowledgments 7Executive Summary 91. Introduction: Rise of Sovereign ESG Integration 152. State of Sovereign ESG: Empirical Analysis of Sovereign ESG Scores 23Key questions: 1. Is there agreement among sovereign ESG data providers on how to measure a sovereign’s ESG performance? Does this measurement differ depending on the pillar? 2. How does this measurement compare with the well-documented divergence among ESG data providers for corporate ESG scores? 233. Relationship of Sovereign ESG Scores to a Country’s National Income 31Key questions: 1. What is the relationship between sovereign ESG scores and a country’s level of development, or national income? 2. What are the important policy implications of that relationship? 3. How does adjustment of the sovereign ESG methodology for income affect sovereign ESG scores? 314. Comparing Sovereign ESG Score Methodologies 41Key questions: 1. What are the key tenets of the sovereign ESG score methodologies of ESG data providers? 2. What are their unique aspects, and how do these differences contribute to differences in respective sovereign ESG scores? 415. Conclusion 47Appendix A Research Methodology 49Appendix B Principal Component Analysis of Sovereign ESG Scores 51Appendix C Supplementary Data Description 55Appendix D Key Tenets of ESG Providers’ Methodologies 57References 63
>>> Contents
4 >>> EQUITABLE GROWTH, FINANCE & INSTITUTIONS INSIGHT
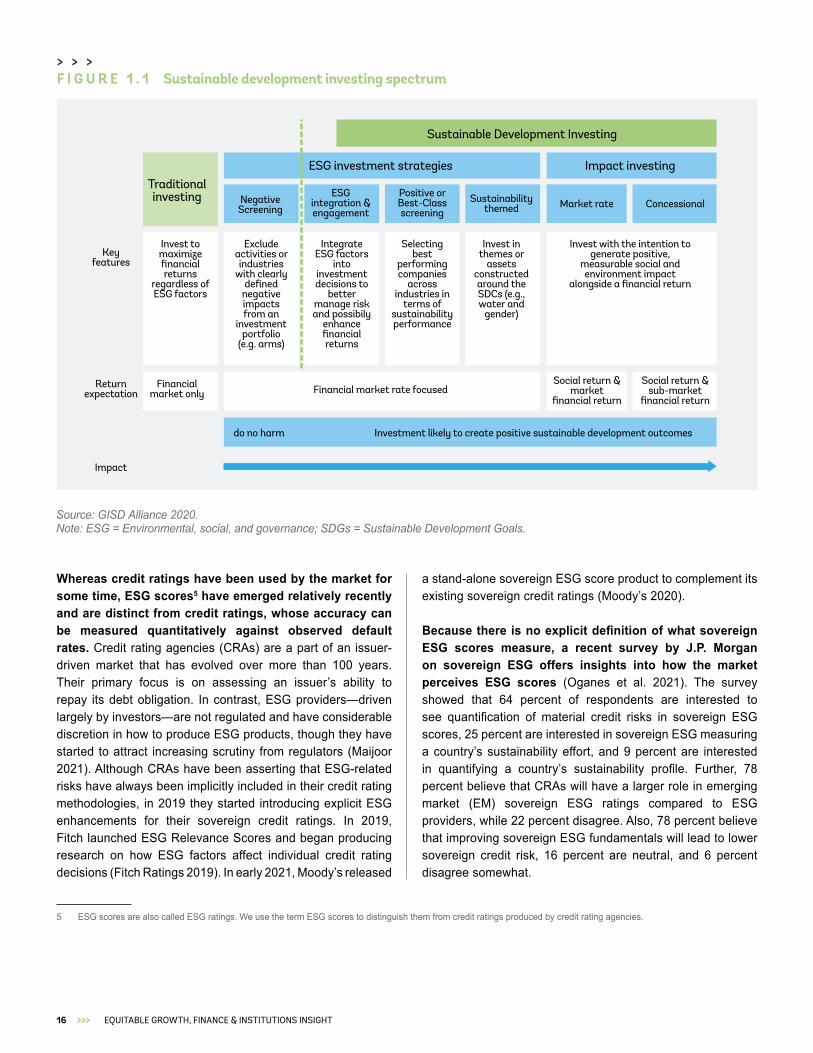
FiguresFigure ES.1 Correlations of ESG-related indexes with a country’s national income (GNI per capita) 11Figure ES.2 “Wheel of Fortune”: Network analysis of ESG providers’ methodologies 13Figure 1.1 Sustainable development investing spectrum 16Figure 1.2 The structure of sovereign ESG financial ecosphere 18Figure 2.1 Composition of sovereign ESG scores by pillars for major ESG providers 26Figure B3.1 GDP adjustment for the ND-GAIN Country Index 34Figure 3.1 Correlations of ESG-related indexes with a country’s national income (GNI per capita) 33Figure 3.2 Scatter matrix for sovereign ESG scores 36Figure 3.3 Scatter matrix for sovereign ESG scores, linearly adjusted for national income 37Figure 3.4 Sovereign ESG scores and sovereign ESG income-adjusted scores for ESG providers collectively 38Figure 3.5 Sovereign ESG scores and sovereign ESG income-adjusted scores for individual ESG providers 39Figure 3.6 Environmental Kuznets curve 39Figure 4.1 Clusters of ESG providers for sovereign ESG and individual pillars 42Figure 4.2 Word clouds for ESG providers’ sovereign ESG methodologies 43Figure 4.3 “Wheel of Fortune”: Network analysis of ESG providers’ methodologies 45Figure B.1 Sovereign ESG scores’ variance explained by principal components 52Figure B.2 Principal component 1 for ESG scores, individual pillars, a country’s national income 53Figure B.3 Correlation of sovereign ESG principal component 1 with sustainability variables 54Figure C.1 Total Wealth Composition. 56Figure D.1 FTSE Russell/Beyond Ratings Sovereign Risk Monitor Framework 58Figure D.2 ISS ESG Country Ratings Framework 58Figure D.3 MSCI ESG Government Ratings Framework 59Figure D.4 Robeco Country Sustainability Ranking Framework 60Figure D.5 Sustainalytics Country Risk Ratings Framework 61
TablesTable 2.1 Summary of ESG providers included in analysis 25Table 2.2 Correlation of aggregate sovereign ESG scores for major ESG providers 27Table 2.3 Illustrative comparison of ESG scores for companies versus sovereigns 27Table 2.4 Correlation of sovereign E pillar scores for major ESG providers 27Table 2.5 Correlation of sovereign S pillar scores for major ESG providers 28Table 2.6 Correlation of sovereign G pillar scores for major ESG providers 28Table 3.1 Correlations of aggregate ESG and individual pillar scores with a country’s national income (GNI per capita) for ESG providers. 32
BoxesBox 1.1 Select findings from market survey on ESG investing in the EM sovereign asset class by J.P. Morgan 17Box 1.2 NGFS’s 2021 Sustainable Finance Market Dynamics Report: Role of ESG data providers 21Box 1.3 Divergence of ESG scores for firms: Key drivers 24Box 3.1 Existing methodologies for sovereign ESG income adjustment 34Box D.1 V.E Sovereign Sustainability Ratings Framework 62

5>>>DEMYSTIFYING SOVEREIGN ESG
CRA Credit Rating Agency
E Environmental
EKC Environmental Kuznets Curve
EM Emerging Market
EPI Environmental Performance Index (Yale)
ESG Environmental, Social, and Governance
G Governance
GDP Gross Domestic Product
GNI Gross National Income
GPS Global Program on Sustainability
IIB Ingrained Income Bias
JESG J.P. Morgan ESG
ND-GAIN Notre Dame Global Adaptation Initiative (Country Index)
NGFS Network for Greening the Financial System
NLP Natural Language Processing
OECD Organisation for Economic Co-operation and Development
PCA Principal Component Analysis
RRI RepRisk Country ESG Risk Index
S Social
SDG Sustainable Development Goals
UN United Nations
WAVES Wealth Accounting and the Valuation of Ecosystem Services
WBG World Bank Group
WGBI World Government Bond Index
WGI Worldwide Governance Indicators
>>> Abbreviations

6 >>> EQUITABLE GROWTH, FINANCE & INSTITUTIONS INSIGHT

7>>>DEMYSTIFYING SOVEREIGN ESG
This publication was prepared by a team consisting of Ekaterina M. Gratcheva, Teal Emery, and Dieter Wang, with substantive input from Bryan Gurhy, under the supervision of Anderson Silva, all from the Finance, Competitiveness and Innovation (FCI) Global Practice of the World Bank Group (WBG).1
The authors would like to thank those who provided the comments received during the formal peer review process, including Girum Dagnachew Abate (Economist, CROCR), Kassia Antoine (Economist, CROCR), Michael Brown (Economist, CROCR), Marc Schrijver (Senior Financial Sector Specialist, EAEF2), Heike Reichelt (Head Financial Officer/Head of Investor Relations and New Program Development, TRECI), Fiona Stewart (Lead Financial Sector Specialist, EFNLT, FCI), Aart C. Kraay (Deputy Chief Economist and Director of Development Policy, DECVP), James Cust (Economist, AFECE), Raffaello Cervigni (Lead Environmental Economist, SENGL, and Task Team Leader for the Global Program on Sustainability), Eric Bouyé (Manager, TREPK), Rodrigo Cabral (Senior Financial Officer, EMFMD), James Seward (Senior Financial Officer, TRECI), Nepomuk Dunz (Junior Professional Officer, EFNLT), and Samantha Power (Consultant, EFNLT).
External comments and feedback were also received from FTSE Russell/Beyond Ratings, ISS, MSCI, RepRisk, Robeco (formerly RobecoSAM), Sustainalytics, and V.E; Robert Patalano, OECD; Harun Đogo, Morgan Stanley; Liliana Jerónimo, Central Bank of Portugal; Diane Menville, Scope, Credit Rating Agency; Rodolphe Bocquet, Qontigo, founder of Beyond Ratings; Jonathan Amacker, Imperial College; and Yvette Babb, William Blair and Co.
Also, a special thank you to Jean Pesme, Global Director of the Finance, Competitiveness and Innovation Global Practice of the World Bank Group.
The authors would also like to thank the J.P. Morgan team for the collaboration. Special thanks to Luis Oganes, Lydia Harvey, Jarrad K. Linzie, Katherine Marney, Jessica Murray and Rupert Rink.
The publication has been funded by the Global Program on Sustainability. The views expressed herein are solely the authors’ and should not be attributed to the WBG.
The report was edited by Mary-Ann Moalli and Marcy Gessel, Publications Professionals LLC. Florencia Micheltorena led the creative design and formatting of the publication.
We thank them all.
1 E-mail contacts: Ekaterina M. Gratcheva ([email protected]), Teal Emery ([email protected]), and Dieter Wang ([email protected]).
>>> Acknowledgements

8 >>> EQUITABLE GROWTH, FINANCE & INSTITUTIONS INSIGHT

9>>>DEMYSTIFYING SOVEREIGN ESG
The evolution of sustainable finance to mainstream finance has been motivated by a growing demand for the financial sector to play a greater role in the transformation of the current economic model into a more sustainable one (Boitreaud et al. 2020). The introduction of the United Nation’s (UN) Sustainable Development Goals (SDG) and the Paris Agreement on climate change in 2015 have helped galvanize a societal shift to ensure a sustainable future and to fight climate change in particular. As a result, the pace of environmental, social, and governance (ESG) integration,1 which has become the most prevalent form of sustainable finance, has accelerated in recent years.
Market participants continue to grapple with adapting the ESG framework to the sovereign context, despite significant progress of ESG integration in the corporate bond and equity asset class. This challenge is due to the multifaceted nature of ESG-related issues facing governments in relation to corporate entities, as well as a more complex transmission mechanism of the sovereign debt asset class to sustainable outcomes in the real economy.
Sovereign ESG is distinct from corporate ESG on both data and methodology levels. Because sovereign ESG is an underresearched area of ESG investing, the current vacuum has been filled with heuristics and extrapolations from the more developed area of corporate ESG. Specifically, the financial industry’s emerging consensus for what needs to be addressed for corporate ESG in terms of quality of input data and methodologies has been applied to all asset classes. Our empirical analysis, however, reveals that issues with sovereign ESG are unique and call for different actions by stakeholders to ensure that the operationalization of ESG investing evolves in line with the fast-changing sustainable finance landscape and political commitments.
This paper demystifies sovereign ESG as a distinct segment of the ESG sector by assessing the major sovereign ESG providers that have laid the foundation for the operationalization of ESG investing in sovereign fixed income markets. This is the first publication that provides an empirically based assessment of sovereign ESG as a sector, the way leading sovereign ESG providers compare and contrast with each other, and the way their respective sovereign ESG product contributes to the industry’s increasing demand for being able to measure sustainability within different investments. To illuminate distinct features of sovereign ESG, we analyze sovereign ESG methodologies and their outputs—sovereign ESG scores—from the leading sovereign ESG providers, including FTSE Russell/Beyond Ratings, ISS, MSCI, RepRisk,2 Robeco (previously known as RobecoSAM), Sustainalytics, and V.E (previously known as Vigeo Eiris).
1 Environmental, social, and governance integration is the practice of incorporating ESG-related information into investment decisions to help enhance risk-adjusted returns, regardless of whether a strategy has a sustainable mandate.
2 Its product (RepRisk Country ESG Risk Index) does not have official environmental, social, and governance pillars, but we processed it to create proxies based on ESG percentages for the purpose of comparability.
>>> Executive Summary

10 >>> EQUITABLE GROWTH, FINANCE & INSTITUTIONS INSIGHT
Our analysis reveals that contrary to the divergent corporate ESG scores—dubbed as “aggregate confusion” (Berg, Kölbel, and Rigobon 2019)—there is convergence among sovereign ESG scores across ESG providers. Sovereign ESG scores exhibit different patterns from corporate ESG scores at the aggregate and individual E, S, and G pillar levels. Most notably, the E pillar is the most challenging of the three pillars for sovereigns because sovereign E scores vary widely among the providers. This variance contrasts with the highest level of convergence for E scores for corporate entities as compared to other corporate ESG pillars. Although our methods shed limited additional insight into the cause of divergence for the E pillar at the sovereign level, our inquiry provides plausible explanations for this divergence among ESG providers, including sovereign environmental data lags
(five years on average), lack of consensus on the definition of a “good” environmental performance, longer time horizon for environmental risks to materialize, and the nonlinear nature of environmental risks, among other factors.
Our findings suggest that ingrained income bias is a plausible explanation for the convergence in sovereign ESG scores. We find that about 90 percent of a country’s sovereign ESG score is explained by the country’s level of development and that a country’s national income permeates all sustainability-linked measures used by the market. Failure to account for this bias in investment decisions would lead to misaligned incentives for investors and could potentially divert flows to wealthier countries at the expense of lower-income countries in need of finance for development. This

11>>>DEMYSTIFYING SOVEREIGN ESG
consideration is critical because sovereign ESG scores by their nature should measure aspects in addition to income which other metrics, such as credit ratings, already reflect. We also find that sustainability-related data and indexes, such as the SDG (Sustainable Development Goal) Index, EPI (Yale Environmental Performance Index), and ND-GAIN (Notre Dame Global Adaptation Initiative) Country Index, are affected by the same structural issue: they are mostly explained by the country’s level of development, or its income. Figure ES.1 presents individual ESG providers and sustainability-linked indices’ correlation with national income.
As investors pursue different objectives in integrating sovereign ESG into their investment decisions—from risk management to measurable sustainability impact—a robust taxonomy of sovereign ESG methodologies that clearly define unique features of individual ESG providers would provide clarity to the market for better alignment of their investment strategies with the right sovereign ESG tools. Although the current level of disclosure by ESG providers presents challenges to produce a well-defined taxonomy, the results of our analysis provide a helpful first step as presented in Figure ES.2
> > >
SDG Index
EPI
ND-GAIN Country Index
84.7%
86.9%
91.0%
Aggregate E Score
Aggregate G Score
Aggregate ESG Score
Aggregate S Score
Note: ESG = environmental, social, and governance; GNI = gross national income; BR = Beyond Ratings.
Note: EPI = Environmental Performance Index (Yale); ND-GAIN = Notre Dame Global Adaptation Initiative; SDG = Sustainable Development Goals. Source: World Bank staff analysis.
F I G U R E E S . 1 Correlations of ESG-related indicators with national income (GNI per capita)
MSCI
Vigeo Eiris
Vigeo Eiris
Vigeo Eiris
Vigeo Eiris
MSCI
MSCI
MSCI
FTSE R
usse
ll/BR
Beyon
d Ratin
gs
Beyon
d Ratin
gs
Beyon
d Ratin
gs
Susta
inalytics
Susta
inalytics
Susta
inalytics
RepRisk
Robes
co SAM
Robes
co SAM
Robes
co SAM
Robes
co SAM
Susta
inalytics
RepRisk
RepRisk
RepRisk
58.5%(mean)
69.8%(mean)
83.2%(mean)
85.2%(mean)
a. Income and sovereign ESG scores of six providersThe E, S, and G individual scores and combined ESG scores are correlated with GNI per capita to varying degrees, depending on the ESG provider. The S scores are most correlated with little variation across providers, while the E
scores are least correlated with large discrepancies among providers.
b. Income and other indicesThe SDG Index, EPI, and ND-GAIN Index are similarly and strongly correlated with GNI per capita.

12 >>> EQUITABLE GROWTH, FINANCE & INSTITUTIONS INSIGHT

13>>>DEMYSTIFYING SOVEREIGN ESG
Investors that engage in sovereign ESG outlays rely extensively on ESG providers for data, methodology, or advice. Sovereign ESG scores are becoming part of the structural foundations for the investment industry, so it is critical that their methodologies are clear and transparent. The different approaches to measuring countries’ ESG performance may appeal to different investment objectives, as long as these differences are in fact representing measurable methodological differences. In contrast, the current sovereign ESG scores converge due to the strong income component.
Current sovereign ESG scores are affected by structural issues, such as the ingrained income bias and the lack of clarity around the environmental pillar. Sovereign ESG approaches need to evolve in line with growing demand for better attribution to sustainability outcomes. A more transparent framework needs to include (1) clarity on investment objective (2) transparent methods, (3) improved
data, (4) incorporation of forward-looking scenarios and (5) unbiased from a country’s level of income (Gratcheva et al. 2021).
This approach calls for more transparency in both sovereign ESG methodology and its data sources. While this is true for all pillars, it is especially important for the E pillar. Given significant challenges in the quality and availability of E data comparable across countries, new solutions and approaches to measuring ESG are needed to provide a stronger data foundation as a critical input into sovereign ESG investment decisions. Geospatial and wealth solutions are promising and can address challenges of sovereign ESG that did not befall corporate ESG. At the same time, these novel data sources require technical expertise that is not always available. More research is needed to ensure that a new generation of ESG scores is developed using these lessons and that these new ESG scores foster sustainability.
> > >F I G U R E E S . 2 “Wheel of Fortune”: Network analysis of ESG providers’ methodologies
V.E
MSCI
Sustainalytics
ISS
Robeco
RepRisk
FTSE Russell/BR exposure
value
indexdebt
managem
entbusiness
capitalcom
panies
ratings
creditinvestment
risk
repor
tprofi
le
criteria
performance
state
source
group
countries
energy
governance
development
impact
income
corruption
environment la
bor
sust
aina
bilit
yrig
hts
polic
ies
inequality
met
hodo
logy
info
rmat
ion
indi
cato
r
resea
rchscoreframework
trend
model
weight
data
assessment
approach
syst
em
number
anal
ysis
Sustainability/SDG-related
Methodological
Descriptive
Financial
Source: World Bank staff. Note: ESG = environmental, social, and governance; SDG = Sustainable Development Goals; BR = Beyond Ratings.
This network positions various ESG providers based on how often their technical and marketing documents contain the terms noted on the periphery. The thicker the chords, the more often a word is mentioned. While recognizing the limitations of this depiction, we can distinguish ISS, V.E, and RepRisk as more specialized providers from the more
balanced providers MSCI, FTSE Russell/Beyond Ratings, Robeco, and Sustainalytics.

14 >>> EQUITABLE GROWTH, FINANCE & INSTITUTIONS INSIGHT
1.

15>>>DEMYSTIFYING SOVEREIGN ESG
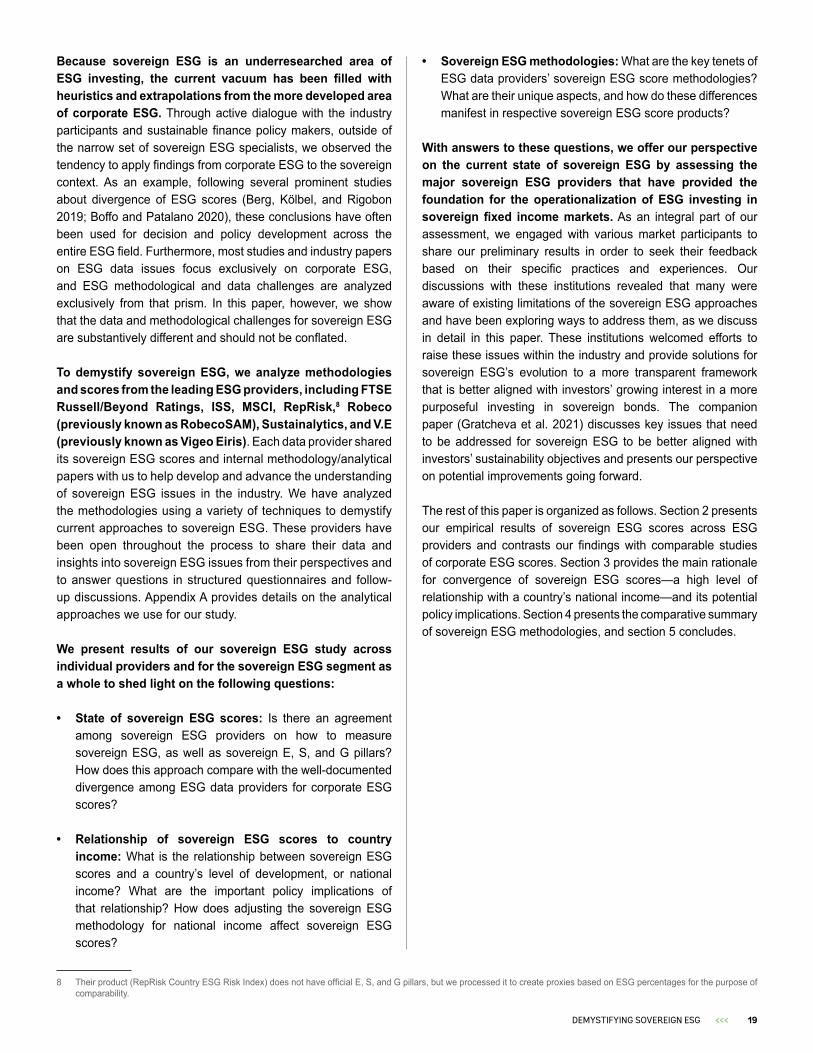
>>> Introduction: Rise of Sovereign ESG IntegrationThe shift to sustainable finance has been motivated by a growing demand for the financial sector to play a greater role in the transformation of the current economic model into a more sustainable one (Boitreaud et al. 2020). The introduction of the United Nation’s (UN) Sustainable Development Goals (SDG) and the Paris Agreement on climate change in 2015 have helped galvanize the societal shift to ensure a sustainable future and to fight climate change in particular. The pace of environmental, social, and governance integration,3 which has become the most prevalent form of sustainable finance, has accelerated over recent years. (This is illustrated by Figure 1.1 and is reflected in the results of a recent J.P. Morgan survey presented in Box 1.1.) The International Monetary Fund; Network for Greening the Financial System (NGFS);4 Organisation for Economic Co-operation and Development (OECD); the World Bank Group; and numerous policy, academic, and financial institutions have been documenting extensively how these changes affect the evolving financial sector ecosystem and investment decision-making processes across different asset classes (Boffo and Patalano 2020; CFA Institute 2020; NGFS 2021).
The ESG ratings industry has emerged and grown considerably over the past decade in response to the market demand for sustainability-related data, evolving from specialized companies providing ESG-specific products to influencers of public debate on sustainable finance. ESG data providers have been offering a growing set of ESG-related data and scores, starting coverage initially with corporate entities before expanding in recent years into the sovereign space. This growth has been accompanied by a significant body of research on the ESG rating industry’s evolution, ESG methodologies, and the issue of whether integration contributes to improved sustainability (Escrig-Olmedo et al. 2019; Wong and Petroy 2020). Most research has focused, however, on ESG for corporate entities, which we will denote as “corporate ESG” in this paper. Box 1.2 presents the key points and relevant statistics on the current ESG data landscape from the latest report by NGFS (2021), and Box 1.3 also gives an overview of key findings related to corporate ESG.
3 Environmental, social, and governance integration is the practice of incorporating ESG-related information into investment decisions to help enhance risk-adjusted returns, regardless of whether a strategy has a sustainable mandate.
4 The Network for Greening the Financial System (NGFS) is a group of Central Banks and Supervisors to shre best practices and contribute to the development of the environmental and climate risk management in the financial industry and to mobilize mainstream finance to support transition toward a sustainable economy. NGFS produces regular reports on the progress to date on “greening” of the financial sector.
16 >>> EQUITABLE GROWTH, FINANCE & INSTITUTIONS INSIGHT
Whereas credit ratings have been used by the market for some time, ESG scores5 have emerged relatively recently and are distinct from credit ratings, whose accuracy can be measured quantitatively against observed default rates. Credit rating agencies (CRAs) are a part of an issuer-driven market that has evolved over more than 100 years. Their primary focus is on assessing an issuer’s ability to repay its debt obligation. In contrast, ESG providers—driven largely by investors—are not regulated and have considerable discretion in how to produce ESG products, though they have started to attract increasing scrutiny from regulators (Maijoor 2021). Although CRAs have been asserting that ESG-related risks have always been implicitly included in their credit rating methodologies, in 2019 they started introducing explicit ESG enhancements for their sovereign credit ratings. In 2019, Fitch launched ESG Relevance Scores and began producing research on how ESG factors affect individual credit rating decisions (Fitch Ratings 2019). In early 2021, Moody’s released
5 ESG scores are also called ESG ratings. We use the term ESG scores to distinguish them from credit ratings produced by credit rating agencies.
a stand-alone sovereign ESG score product to complement its existing sovereign credit ratings (Moody’s 2020).
Because there is no explicit definition of what sovereign ESG scores measure, a recent survey by J.P. Morgan on sovereign ESG offers insights into how the market perceives ESG scores (Oganes et al. 2021). The survey showed that 64 percent of respondents are interested to see quantification of material credit risks in sovereign ESG scores, 25 percent are interested in sovereign ESG measuring a country’s sustainability effort, and 9 percent are interested in quantifying a country’s sustainability profile. Further, 78 percent believe that CRAs will have a larger role in emerging market (EM) sovereign ESG ratings compared to ESG providers, while 22 percent disagree. Also, 78 percent believe that improving sovereign ESG fundamentals will lead to lower sovereign credit risk, 16 percent are neutral, and 6 percent disagree somewhat.
> > >
Source: GISD Alliance 2020. Note: ESG = Environmental, social, and governance; SDGs = Sustainable Development Goals.
Traditionalinvesting Negative
Screening
Keyfeatures
Returnexpectation
Impact
Financialmarket only Financial market rate focused
do no harm Investment likely to create positive sustainable development outcomes
Social return &market
financial return
Social return &sub-market
financial return
Invest tomaximizefinancialreturns
regardless ofESG factors
Excludeactivities orindustries
with clearlydefined
negativeimpactsfrom an
investmentportfolio
(e.g. arms)
IntegrateESG factors
intoinvestmentdecisions to
bettermanage riskand possibily
enhancefinancialreturns
Selectingbest
performingcompanies
acrossindustries in
terms ofsustainabilityperformance
Invest inthemes or
assetsconstructedaround theSDCs (e.g.,water and
gender)
Invest with the intention togenerate positive,
measurable social andenvironment impact
alongside a financial return
ESGintegration &engagement
Positive orBest-Classscreening
Sustainabilitythemed Market rate Concessional
ESG investment strategies Impact investing
Sustainable Development Investing
F I G U R E 1 . 1 Sustainable development investing spectrum

17>>>DEMYSTIFYING SOVEREIGN ESG
> > > B O X 1 . 1 Select findings from the market survey on ESG investing in the emerging market sovereign asset class by J.P. Morgan
ESG investing: interest and implementation. Most respondents agree that client demand/fiduciary duty/mission statement are primary drivers. Sustainable Development Goals (SDGs)/Paris Agreement goals are not the primary drivers, and there is wide disagreement on the degree of their relevancy. In general, asset managers are either fully committed or not committed at all to environmental, social, and governance investing—a finding based on the amount of assets under management for emerging market (EM) ESG strategies.
The vast majority of clients interested in sovereign ESG strategies are in Europe, 6 percent are in the United States, and 4 percent are in Asia-Pacific. In EM sovereign ESG strategies, 94 percent are pursuing ESG integration, 76 percent are pursuing exclusionary screening, and 50 percent are interested in engagement/stewardship (although half of respondents reported that they do not perform engagement with debt management offices enough and want to improve). In addition, 25 percent do sustainability-themed investing in specific themes or assets (such as clean energy, green technology, or sustainable agriculture). The response “1.5 or 2°C alignment and/or transition risk assessment” was the least relevant for EM sovereign debt investment strategy (selected by 16 percent of respondents).
Responses showed that 70 percent of interested clients do not manage against ESG benchmarks while 30 percent do so. One-half of respondents expressed that the key issues with ESG benchmarks for them are ESG methodology and/or lack of industry standards, while data transparency is the key concern of 24 percent of respondents.
Income bias. The most dominant primary concern about sovereign ESG investing is the income bias, expressed by 24 percent of respondents, followed by coverage (21 percent) and timeliness (20 percent). Concerns such as transparency, regional inconsistencies, methodology, and some others are far less prevalent as a primary concern.
View on sustainability. Ranging from strongly to somewhat, 74 percent of respondents agree that sovereign ESG should support sovereign issuers that have the greatest sustainable development to accomplish rather than the best ESG scores, while 13 percent are neutral and only 11 percent somewhat disagree. Furthermore, 65 percent are interested in the reflection in sovereign ESG scores of a recent success or setback in sustainable developments rather than a long-term trend such as national income; 15 percent are neutral and 17 percent disagree.
Asset managers do focus on sustainability. For 30 percent of respondents, it is integral to their sovereign ESG framework, 60 percent have a separate but complementary SDG framework, and 10 percent note that sustainability is separate from the ESG framework. Only 16 percent of respondents say their greatest concern is that sovereign ESG lacks intended real world impact, while 42 percent are primarily concerned with the lack of ESG standardization and 24 percent primarily with greenwashing.
Relationship with credit rating agencies (CRAs)/credit risks. Only 25 percent of respondents want sovereign ESG to capture the quantification of a country’s sustainability effort and 9 percent want quantification of a country’s sustainability profile, while 64 percent want to see quantification of material credit risks in sovereign ESG scores.
Further, 78 percent believe that CRAs will have a larger role in EM sovereign ESG ratings compared to ESG providers, while 22 percent disagree. Also, 78 percent believe that improving sovereign ESG fundamentals will lead to lower sovereign credit risk, 16 percent are neutral, and 6 percent disagree somewhat.
Role of ESG providers. Only 17 percent of respondents produce proprietary sovereign ESG framework in house, while 71 percent have a combination of ESG providers and in-house producers, and 10 percent use EGS provider(s) exclusively. Further, 10 percent do not license any ESG providers, 24 percent license one provider, 30 percent license two providers, and 36 percent license three or more providers. Sustainalytics and MSCI are used by 33 percent of respondents, and no other provider in our sample came close to that number
ESG pillars. Although 50 percent of respondents consider G as the most important pillar, only 2 percent consider E or S as the most important. Further, 35 percent consider pillars based on their materiality, and 11 percent consider them equally. Owing to data challenges, 70 percent of respondents underrepresent E pillar, 26 percent S pillar, and only 4 percent G pillar.
Source: Oganes et al. 2021.> > >

18 >>> EQUITABLE GROWTH, FINANCE & INSTITUTIONS INSIGHT
Despite significant progress in ESG investing in the corporate bond and equity space, market participants continue to grapple with adapting this framework to the sovereign context. For example, investor engagement on ESG-related issues with companies has gone mainstream, while engagement with sovereigns has been more difficult and, at times, politically sensitive. This sentiment, however, has been changing in the industry with the COVID-19 pandemic bringing a strong reminder of the importance of sovereign ESG performance in shaping sustainable development globally and nationally. Many investors are increasingly realizing that sovereigns play a fundamental role in setting national policies—including public health and environmental and sustainable infrastructure investment—that drive a country’s development and its response to crises, as well as in shaping international agreements, such as the Paris Agreement and Sustainable Development Goals (SDGs).
The sovereign ESG landscape has started to change with notable developments across the industry over the past couple years (Figure 1.2). Sovereign bonds are the largest asset class,6 and expectations for ESG integration for sovereign
6 In 2019, the total outstanding value of global bond markets amounted to US$106 trillion, exceeding global stock market capitalization of US$95 trillion and US$21 trillion of bonds issued, compared to US$541 billion in new equity (SIFMA 2019).
7 In 2018, J.P. Morgan introduced a new class of ESG-tilted benchmark indexes for emerging market sovereign bonds, and in 2019, FTSE Russell introduced a climate-adjusted developed market sovereign bonds index (Boitreaud et al. 2020).
fixed income have become mainstream (CFA Institute 2020). Although investment managers had undertaken some form of nonfinancial screening for sovereign bonds to various degrees, since 2017 an increasing number of asset managers have started publishing white papers on their approaches to ESG investing in sovereign bonds, most major investment managers having done so by 2020 (Boitreaud et al. 2020). Further, over the past three years two index providers introduced ESG indices for sovereign bonds, which was a highly anticipated addition to a wide variety of ESG benchmarks in the equity space.7
The scale and breadth of ESG-related issues that arise for governments versus corporate entities, as well as more complex transmission mechanisms for these issues to the real economy, are among key challenges in advancing ESG integration for sovereign bonds compared to other asset classes. Sovereign debt is a unique asset class. The sovereign issuer is fundamentally different from a corporate issuer because of its differing roles, scale, and incentive structures. As a result, the external validity of empirical findings and mechanisms related to corporate ESG should not be assumed to apply to sovereign ESG.
The structure of the sovereign ESG financial ecosphere> > >F I G U R E 1 . 2
Sovereign issuers
Financial Intermediation
End investorsCredit rating agencies
ESG rating providers
ESG index providers
Asset managers
Institutional investors
All issuers that receive an ESG rating
Firms that rate ESG issuers
Firms that provide raw
ESG data and composite
ESG scores
Firms that construct
ESG indices
Firms that construct and market ESG funds, ETFs,
etc.
-duciary respon-
sibilitites to manage assets
Owners who bear
the ultimate reward and
risks
Rules & requirements(such as regulators, supervisors)
Ethical standard setters(such as WBG, UN, OECD, CBI, ICMA)
Source: Boitreaud and others 2020.Note: CBI = Climate Bonds Initiative; ESG = environmental, social, and governance; ETF = exchange-traded fund; ICMA = International Capital Market Association; OECD = Organisation for Economic Co-operation and Development; UN = United Nations; WBG = World Bank Group.
19>>>DEMYSTIFYING SOVEREIGN ESG
Because sovereign ESG is an underresearched area of ESG investing, the current vacuum has been filled with heuristics and extrapolations from the more developed area of corporate ESG. Through active dialogue with the industry participants and sustainable finance policy makers, outside of the narrow set of sovereign ESG specialists, we observed the tendency to apply findings from corporate ESG to the sovereign context. As an example, following several prominent studies about divergence of ESG scores (Berg, Kölbel, and Rigobon 2019; Boffo and Patalano 2020), these conclusions have often been used for decision and policy development across the entire ESG field. Furthermore, most studies and industry papers on ESG data issues focus exclusively on corporate ESG, and ESG methodological and data challenges are analyzed exclusively from that prism. In this paper, however, we show that the data and methodological challenges for sovereign ESG are substantively different and should not be conflated.
To demystify sovereign ESG, we analyze methodologies and scores from the leading ESG providers, including FTSE Russell/Beyond Ratings, ISS, MSCI, RepRisk,8 Robeco (previously known as RobecoSAM), Sustainalytics, and V.E (previously known as Vigeo Eiris). Each data provider shared its sovereign ESG scores and internal methodology/analytical papers with us to help develop and advance the understanding of sovereign ESG issues in the industry. We have analyzed the methodologies using a variety of techniques to demystify current approaches to sovereign ESG. These providers have been open throughout the process to share their data and insights into sovereign ESG issues from their perspectives and to answer questions in structured questionnaires and follow-up discussions. Appendix A provides details on the analytical approaches we use for our study.
We present results of our sovereign ESG study across individual providers and for the sovereign ESG segment as a whole to shed light on the following questions:
• State of sovereign ESG scores: Is there an agreement among sovereign ESG providers on how to measure sovereign ESG, as well as sovereign E, S, and G pillars? How does this approach compare with the well-documented divergence among ESG data providers for corporate ESG scores?
• Relationship of sovereign ESG scores to country income: What is the relationship between sovereign ESG scores and a country’s level of development, or national income? What are the important policy implications of that relationship? How does adjusting the sovereign ESG methodology for national income affect sovereign ESG scores?
8 Their product (RepRisk Country ESG Risk Index) does not have official E, S, and G pillars, but we processed it to create proxies based on ESG percentages for the purpose of comparability.
• Sovereign ESG methodologies: What are the key tenets of ESG data providers’ sovereign ESG score methodologies? What are their unique aspects, and how do these differences manifest in respective sovereign ESG score products?
With answers to these questions, we offer our perspective on the current state of sovereign ESG by assessing the major sovereign ESG providers that have provided the foundation for the operationalization of ESG investing in sovereign fixed income markets. As an integral part of our assessment, we engaged with various market participants to share our preliminary results in order to seek their feedback based on their specific practices and experiences. Our discussions with these institutions revealed that many were aware of existing limitations of the sovereign ESG approaches and have been exploring ways to address them, as we discuss in detail in this paper. These institutions welcomed efforts to raise these issues within the industry and provide solutions for sovereign ESG’s evolution to a more transparent framework that is better aligned with investors’ growing interest in a more purposeful investing in sovereign bonds. The companion paper (Gratcheva et al. 2021) discusses key issues that need to be addressed for sovereign ESG to be better aligned with investors’ sustainability objectives and presents our perspective on potential improvements going forward.
The rest of this paper is organized as follows. Section 2 presents our empirical results of sovereign ESG scores across ESG providers and contrasts our findings with comparable studies of corporate ESG scores. Section 3 provides the main rationale for convergence of sovereign ESG scores—a high level of relationship with a country’s national income—and its potential policy implications. Section 4 presents the comparative summary of sovereign ESG methodologies, and section 5 concludes.

20 >>> EQUITABLE GROWTH, FINANCE & INSTITUTIONS INSIGHT

21>>>DEMYSTIFYING SOVEREIGN ESG
> > > B O X 1 . 2 NGFS’s 2021 Sustainable Finance Market Dynamics Report: Role of ESG data providerss
The recent report by the Network for Greening the Financial System (NGFS) on the state of the greening of the financial section distills key findings across a wide array of market participants and acknowledges the issues arising from the heterogeneity of green and sustainable finance definitions and the wide variety of approaches taken by many investors and financial institutions around the concepts of sustainability, or environmental, social, and governance. The NGFS report focuses in particular on the impact of ESG-related data in the transformation of the financial industry.
The NGFS (2021) report describes the large private market for ESG data that has emerged to support investors and financial institutions. With the help of traditional and new technologies, ESG data providers offer a growing set of ESG data and scores for firms and, since relatively recently, sovereigns. Using information from the NGFS (2021) report accounts for some 150 ESG data providers, although the market has been consolidating and is currently dominated by a handful of players. Their products include climate data, analytics, advisory services, corporate and country ESG research and scores, alternative data on controversies, ESG portfolio monitoring, second opinions on compliance with bond principles, third-party assurance, certification and verification, and proxy-voting advisory services. The report also presents estimates by Foubert (2020) that annual spending on ESG data has grown by double digits since 2016 and is expected to reach US$1 billion in 2021. It also notes that the recently launched World Bank Sovereign ESG Data Portal makes quality sovereign ESG data for 139 countries across 67 ESG metrics publicly available.
The NGFS (2021) report details the fast-moving landscape for ESG data for corporates. It is based on Escrig-Olmedo et al. (2019) and Wong and Petroy (2020) and notes that major ESG ratings providers cover around 4,000 to 22,000 firms, and as of 2018 more than 600 ESG ratings data products were offered in the market. It also presents recent findings by Boffo and Patalano (2020) on corporate ESG scores’ dispersion and low correlation that result from differences in methodologies among providers and lack of consistent, comparable, and reliable data—particularly in weights for E, S, and G factors within the total ESG scores for firms. The report also highlights the findings by Boitreaud et al. (2020) that, in contrast to ESG scores for corporates, sovereign ESG scores are highly correlated among major providers, with the exception of the E pillar.
The NGFS (2021) report concludes that ESG scores lack transparency and face methodological challenges. One of the report’s recommendations (Takaway 3) states that “there is a need for credit as well as ESG rating providers to enhance transparency surrounding their methodologies, disclosing the criteria they use to assess the materiality of climate and sustainability factors, the manner in which these are measured and incorporated into ratings, and the weights they assign to them.”
> > >

22 >>> EQUITABLE GROWTH, FINANCE & INSTITUTIONS INSIGHT
2.

23>>>DEMYSTIFYING SOVEREIGN ESG
Our analysis reveals convergence of sovereign ESG scores among all providers. Within individual pillars, we find consistency among S and G pillar scores but a wide deviation among sovereign E pillar scores. The fact that sovereign ESG scores do not conform to the well-documented divergence of corporate ESG scores discussed in Box 1.3 was first introduced by Bouyé and Menville (2021). Their inquiry focused on, among other issues, the aggregate sovereign ESG level and found a high level of convergence for sovereign ESG scores with correlation ranging from 72 percent to 95 percent among the four sovereign ESG providers examined (Bouyé and Menville 2021). Motivated to understand the underlying causes of this convergence and the respective contributions of individual E, S, and G pillars, we pursued a more granular analysis. We also expanded the list of the participating ESG providers from four to seven to include ISS, Robeco, and V.E in addition to FTSE/Beyond Ratings, MSCI, RepRisk, and Sustainalytics, which were included in the original study. Table 2.1 presents the summary of the ESG providers in our study, Table 2.1 presents weighs for each ESG pillar, and Appendix D presents the key tenets of their respective ESG methodologies.
>>> State of Sovereign ESG: Empirical Analysis of Sovereign ESG Scores
> > > Key questions
1. Is there agreement among sovereign ESG data providers on how to measure a sovereign’s ESG performance?
2. Does this measurement differ depending on the pillar? 3. How does this measurement compare with the well-documented divergence among
ESG data providers for corporate ESG scores?> > >
24 >>> EQUITABLE GROWTH, FINANCE & INSTITUTIONS INSIGHT
> > > B O X 1 . 3 Divergence of ESG scores for firms: Key drivers
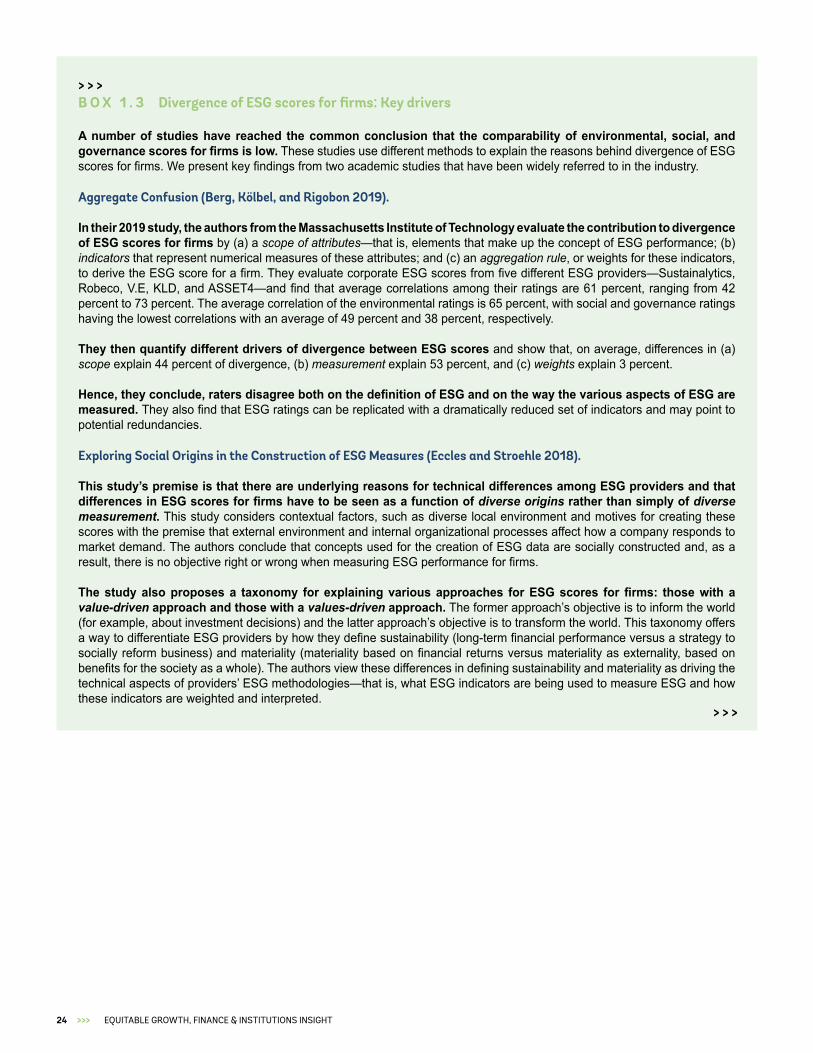
A number of studies have reached the common conclusion that the comparability of environmental, social, and governance scores for firms is low. These studies use different methods to explain the reasons behind divergence of ESG scores for firms. We present key findings from two academic studies that have been widely referred to in the industry.
Aggregate Confusion (Berg, Kölbel, and Rigobon 2019).
In their 2019 study, the authors from the Massachusetts Institute of Technology evaluate the contribution to divergence of ESG scores for firms by (a) a scope of attributes—that is, elements that make up the concept of ESG performance; (b) indicators that represent numerical measures of these attributes; and (c) an aggregation rule, or weights for these indicators, to derive the ESG score for a firm. They evaluate corporate ESG scores from five different ESG providers—Sustainalytics, Robeco, V.E, KLD, and ASSET4—and find that average correlations among their ratings are 61 percent, ranging from 42 percent to 73 percent. The average correlation of the environmental ratings is 65 percent, with social and governance ratings having the lowest correlations with an average of 49 percent and 38 percent, respectively.
They then quantify different drivers of divergence between ESG scores and show that, on average, differences in (a) scope explain 44 percent of divergence, (b) measurement explain 53 percent, and (c) weights explain 3 percent.
Hence, they conclude, raters disagree both on the definition of ESG and on the way the various aspects of ESG are measured. They also find that ESG ratings can be replicated with a dramatically reduced set of indicators and may point to potential redundancies.
Exploring Social Origins in the Construction of ESG Measures (Eccles and Stroehle 2018).
This study’s premise is that there are underlying reasons for technical differences among ESG providers and that differences in ESG scores for firms have to be seen as a function of diverse origins rather than simply of diverse measurement. This study considers contextual factors, such as diverse local environment and motives for creating these scores with the premise that external environment and internal organizational processes affect how a company responds to market demand. The authors conclude that concepts used for the creation of ESG data are socially constructed and, as a result, there is no objective right or wrong when measuring ESG performance for firms.
The study also proposes a taxonomy for explaining various approaches for ESG scores for firms: those with a value-driven approach and those with a values-driven approach. The former approach’s objective is to inform the world (for example, about investment decisions) and the latter approach’s objective is to transform the world. This taxonomy offers a way to differentiate ESG providers by how they define sustainability (long-term financial performance versus a strategy to socially reform business) and materiality (materiality based on financial returns versus materiality as externality, based on benefits for the society as a whole). The authors view these differences in defining sustainability and materiality as driving the technical aspects of providers’ ESG methodologies—that is, what ESG indicators are being used to measure ESG and how these indicators are weighted and interpreted.
> > >
25>>>DEMYSTIFYING SOVEREIGN ESG
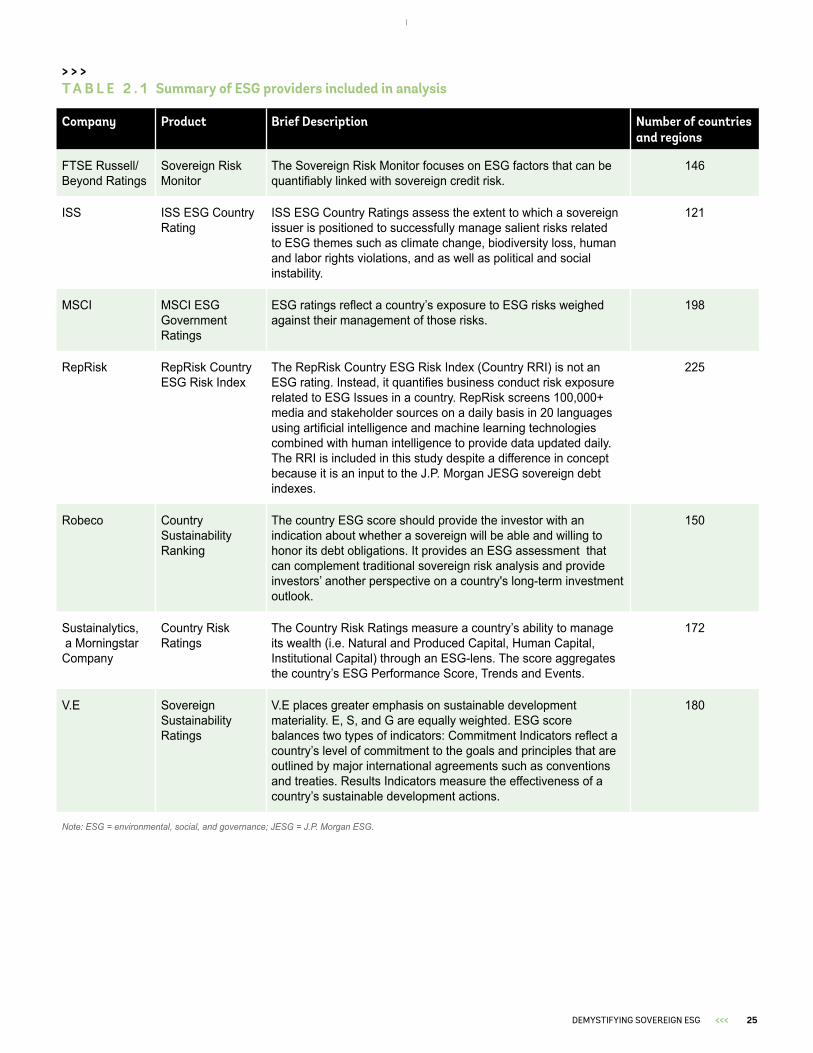
> > > T A B L E 2 . 1 Summary of ESG providers included in analysis
Company Product Brief Description Number of countries and regions
FTSE Russell/ Beyond Ratings
Sovereign Risk Monitor
The Sovereign Risk Monitor focuses on ESG factors that can be quantifiably linked with sovereign credit risk.
146
ISS ISS ESG Country Rating
ISS ESG Country Ratings assess the extent to which a sovereign issuer is positioned to successfully manage salient risks related to ESG themes such as climate change, biodiversity loss, human and labor rights violations, and as well as political and social instability.
121
MSCI MSCI ESG Government Ratings
ESG ratings reflect a country’s exposure to ESG risks weighed against their management of those risks.
198
RepRisk RepRisk Country ESG Risk Index
The RepRisk Country ESG Risk Index (Country RRI) is not an ESG rating. Instead, it quantifies business conduct risk exposure related to ESG Issues in a country. RepRisk screens 100,000+ media and stakeholder sources on a daily basis in 20 languages using artificial intelligence and machine learning technologies combined with human intelligence to provide data updated daily. The RRI is included in this study despite a difference in concept because it is an input to the J.P. Morgan JESG sovereign debt indexes.
225
Robeco Country Sustainability Ranking
The country ESG score should provide the investor with an indication about whether a sovereign will be able and willing to honor its debt obligations. It provides an ESG assessment that can complement traditional sovereign risk analysis and provide investors’ another perspective on a country's long-term investment outlook.
150
Sustainalytics, a Morningstar Company
Country Risk Ratings
The Country Risk Ratings measure a country’s ability to manage its wealth (i.e. Natural and Produced Capital, Human Capital, Institutional Capital) through an ESG-lens. The score aggregates the country’s ESG Performance Score, Trends and Events.
172
V.E Sovereign Sustainability Ratings
V.E places greater emphasis on sustainable development materiality. E, S, and G are equally weighted. ESG score balances two types of indicators: Commitment Indicators reflect a country’s level of commitment to the goals and principles that are outlined by major international agreements such as conventions and treaties. Results Indicators measure the effectiveness of a country’s sustainable development actions.
180
Note: ESG = environmental, social, and governance; JESG = J.P. Morgan ESG.
26 >>> EQUITABLE GROWTH, FINANCE & INSTITUTIONS INSIGHT
The underlying data for sovereign ESG scores largely come from publicly available data sources provided by multilaterals, such as the World Bank, and large nongovernmental organizations, comprising up to 70 percent of data used by ESG providers (Herzog et al. 2020). Data providers have responded to the market demand for scoring that covers the entire universe of sovereign fixed income issuers or potential issuers. Only a limited universe of underlying sovereign-level data sets provides sufficiently broad country coverage over a time series. An analysis of the data in the World Bank’s Sovereign ESG Data Portal found that data have significant lags and gaps (Herzog et al. 2020). Social and governance pillar data had a three-year median lag, while environmental pillar data had a five-year median lag.9 In sum, the key value proposition for sovereign ESG providers is in constructing a coherent methodology for aggregating data and dealing with the challenges of gaps and lags in the underlying data.
Our study also reveals that, on average, sovereign ESG scores of the seven providers are highly correlated with each other. Average correlation among providers is 85 percent
9 The analysis was conducted in June 2020, and the years of lag are defined as the current year minus the last year of available data. Many key data sources, such as the World Bank’s Worldwide Governance Indicators, are updated in the second half of the year.
with correlation ranging from 69 percent to 98 percent across individual providers as Table 2.2 presents. For illustrative purposes, Table 2.3 also compares average correlations across individual pillars for our sovereign ESG analysis and the findings by Berg, Kölbel, and Rigobon (2019) for corporate ESG scores, though not for the same set of ESG providers. It is quite notable that the E pillar has the highest correlation for corporate ESG scores, whereas it constitutes the lowest correlation for sovereign ESG scores. Similarly, while S and G pillars are relatively low for corporate ESG scores, they are comparatively high for sovereign ESG scores, as presented in Table 2.3.
Our results further highlight that there is little agreement on how to measure the sovereign E pillar among ESG providers. In contrast to the relatively high level of correlation for aggregate ESG scores, there is a markedly lower level of correlation among E pillar scores. The E pillar has an average correlation of 42 percent with aggregate ESG scores and ranges from -14 percent to 88 percent as presented in Table 2.4. The lack of consensus on the E pillar highlights the difficulties that investors and policy makers alike have in deciphering how the different environmental issues contribute to sustainability.
> > >
FTSE Russell/Beyond Ratings
Enviromental Social Governance
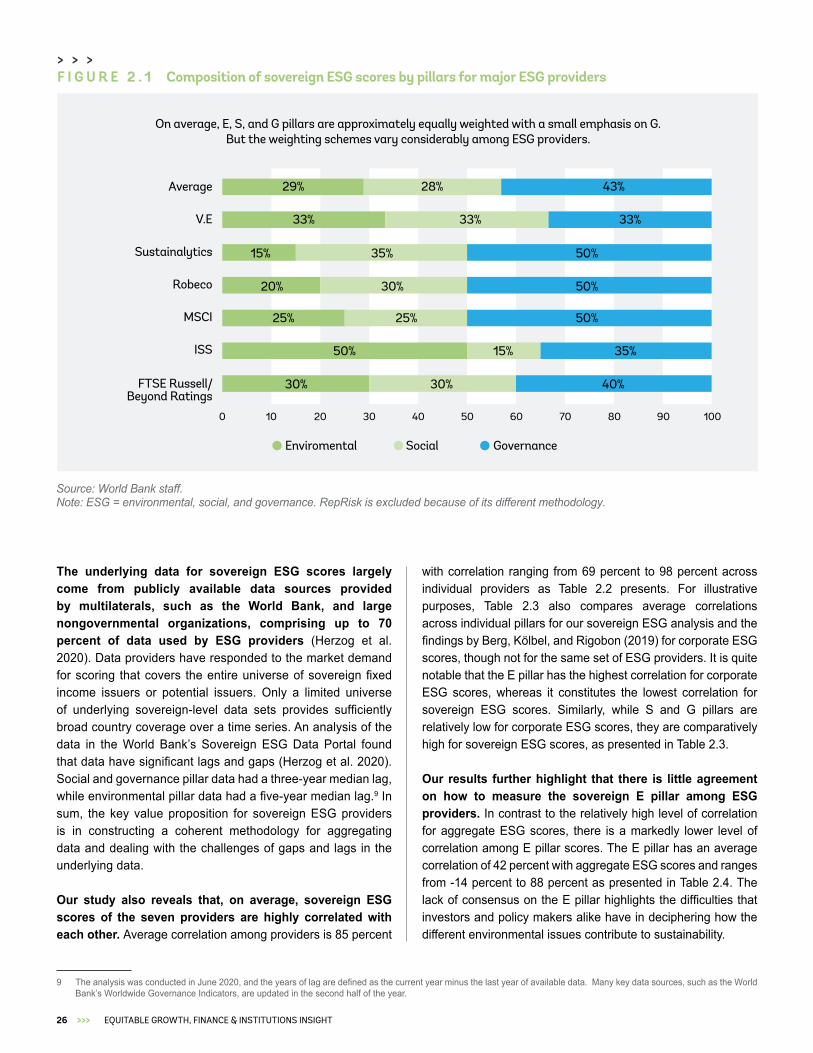
Average 29% 28% 43%
33% 33% 33%
15% 35% 50%
20% 30% 50%
25% 25% 50%
50% 15% 35%
30%
0 10 20 30 40 50 60 70 80 90 100
30% 40%
V.E
Sustainalytics
Robeco
MSCI
ISS
F I G U R E 2 . 1 Composition of sovereign ESG scores by pillars for major ESG providers
Source: World Bank staff.Note: ESG = environmental, social, and governance. RepRisk is excluded because of its different methodology.
On average, E, S, and G pillars are approximately equally weighted with a small emphasis on G.But the weighting schemes vary considerably among ESG providers.

27>>>DEMYSTIFYING SOVEREIGN ESG
More generally, our analysis also shows that the E pillar had a relatively low contribution to aggregate ESG scores. This finding is consistent with multiple academic studies that have had trouble empirically documenting the financial materiality of environmental factors on sovereign debt markets. Capelle-Blancard et al. (2016) examine ESG performance and sovereign spreads in OECD countries. They find that
governance has the highest impact, followed by social factors, while finding that environmental performance appears to have had no impact. Margaretic and Pouget (2018) find a similar lack of evidence for the financial materiality of environmental factors when looking at emerging market hard currency bonds. Kling et al. (2018) do find evidence that climate-vulnerable countries pay a risk premium for debt, after controlling for relevant
> > > T A B L E 2 . 2 Correlation of aggregate sovereign ESG scores for major ESG data providers
Provider ISS FTSE Russell/BR MSCI RepRisk Robeco Sustainalytics V.E
ISS 0.80 0.77 0.80 0.85 0.78 0.87
FTSE Russell/BR 0.80 0.94 0.91 0.98 0.97 0.76
MSCI 0.77 0.94 0.86 0.95 0.93 0.75
RepRisk 0.80 0.91 0.86 0.91 0.86 0.69
Robeco 0.85 0.98 0.95 0.91 0.96 0.77
Sustainalytics 0.78 0.97 0.93 0.86 0.96 0.72
V.E 0.87 0.76 0.75 0.69 0.77 0.72Source: World Bank staff. Note: BR = Beyond Ratings; ESG = environmental, social, and governance.
> > > T A B L E 2 . 4 Correlation of sovereign Environmental scores for major ESG providers
Provider ISS FTSE Russell/BR MSCI RepRisk Robeco Sustainalytics V.E
ISS 0.18 0.05 0.23 0.41 0.32 0.63
FTSE Russell/BR 0.18 0.38 0.49 0.68 0.63 0.34
MSCI 0.05 0.38 -0.14 0.29 0.32 0.36
RepRisk 0.23 0.49 -0.14 0.74 0.72 0.29
Robeco 0.41 0.68 0.29 0.74 0.88 0.51
Sustainalytics 0.32 0.63 0.32 0.72 0.88 0.43
V.E 0.63 0.34 0.36 0.29 0.51 0.43Source: World Bank staff. Note: BR = Beyond Ratings; ESG = environmental, social, and governance.
> > > T A B L E 2 . 3 Illustrative comparison of ESG scores for companies versus sovereigns (percentage)The first column contains correlation figures from Berg, Kölbel, and Rigobon (2020) for corporate ESG scores. The second column presents the average correlations among seven sovereign ESG providers in our study: ISS, FTSE Russell/Beyond Ratings. MSCI, RepRisk, Robeco, Sustainalytics, and V.E.
Provider Coporate ESG Sovereign ESG
ESG
Environmental
Social
GovernanceSource: World Bank staff.Note: ESG = environmental, social, and governance.
61%
65%
49%
38%
85%
42%
85%
71%

28 >>> EQUITABLE GROWTH, FINANCE & INSTITUTIONS INSIGHT
macroeconomic variables. Notably, the academic literature on the financial materiality of environmental factors on sovereign debt is nascent, and studies tend to use different data, making them difficult to compare. Furthermore, as we show later in this paper, studies such as these use data sources that are likely to be affected by ingrained income bias, predominantly reflecting countries’ level of development, or national income, rather than underlying materiality of ESG-related factors.
Although our exploratory methods shed limited additional insight into the cause of divergence for the E pillar, our inquiry provides insights into plausible explanations: (a) environmental data lags, (b) nonalignment of financial and environmental materiality, and (c) the longer time horizon and nonlinear nature of environmental risks. Gaps and lags for sovereign-level environmental data are particularly severe; the most comprehensive sovereign ESG data indicate they are about five years (WWF and World Bank 2020). Further, the E pillar in particular appears to try to balance the measuring of
financial materiality with that of environmental materiality, which may not always be aligned. In addition, many environmental risks materialize over a long time frame (with the notable exception of accelerating climate change risks)—that is, they become financially material over time periods longer than most investors’ investment horizons (Carney 2015). Finally, as the Bank for International Settlements recently highlighted in The Green Swan (Bolton et al. 2020), environmental risks are nonlinear and are likely to be worse in the future than in the past. Dealing with forward-looking risks requires models and assumptions that will increase the potential for divergent outcomes even when using similar underlying data.
In contrast to corporate ESG scores, sovereign ESG scores have a relatively high correlation for S and G pillars, 85 percent and 71 percent, on average, respectively. Tables 2.5 and 2.6 present correlations across individual providers. For the S pillar, RepRisk stands out with an average correlation of 74 percent with the other six
> > > T A B L E 2 . 5 Correlation of sovereign S pillar scores for major ESG providers
Provider ISS FTSE Russell/BR MSCI RepRisk Robeco Sustainalytics V.E
ISS 0.88 0.90 0.70 0.92 0.88 0.87
FTSE Russell/BR 0.88 0.95 0.73 0.89 0.91 0.88
MSCI 0.90 0.95 0.77 0.91 0.94 0.89
RepRisk 0.70 0.73 0.77 0.76 0.76 0.72
Robeco 0.92 0.89 0.91 0.76 0.88 0.86
Sustainalytics 0.88 0.91 0.94 0.76 0.88 0.86
V.E 0.87 0.88 0.89 0.72 0.86 0.86Source: World Bank staff. Note: BR = Beyond Ratings; ESG = environmental, social, and governance.
> > > T A B L E 2 . 6 Correlation of sovereign G pillar scores for major ESG providers
Provider ISS FTSE Russell/BR MSCI RepRisk Robeco Sustainalytics V.E
ISS 0.90 0.86 0.42 0.91 0.88 0.70
FTSE Russell/BR 0.90 0.94 0.52 0.99 0.95 0.55
MSCI 0.86 0.94 0.49 0.94 0.90 0.53
RepRisk 0.42 0.52 0.49 0.53 0.48 0.30
Robeco 0.91 0.99 0.94 0.53 0.96 0.55
Sustainalytics 0.88 0.95 0.9 0.48 0.96 0.52
V.E 0.70 0.55 0.53 0.3 0.55 0.52Source: World Bank staff. Note: BR = Beyond Ratings; ESG = environmental, social, and governance.

29>>>DEMYSTIFYING SOVEREIGN ESG
providers (Figure 2.5). Excluding RepRisk,10 sovereign S pillar correlation increases to 89 percent. Similarly, for the sovereign G pillar, RepRisk and V.E stand out for having a lower correlation with other providers with 46 percent and 53 percent, respectively. For the other five providers, the average correlation is 92 percent (Figure 2.6). One-half of the J.P. Morgan survey’s respondents consider G pillar as the most important for sovereign ESG, while only 2 percent consider E or S pillar as the most important (Oganes et al. 2021). Further, 35 percent of respondents consider pillars on the basis of their materiality, and 11 percent consider them equally. Owing to data challenges, 70 percent of respondents underrepresent E pillar, 26 percent S pillar, and only 4 percent G pillar. Finally, 70 percent of respondents use the World Bank’s Worldwide Governance Indicators11 for G pillar.
Sovereign ESG Scores are dominated by one specific variable—a country’s level of development, or national
10 As we mentioned earlier, RepRisk quantifies business conduct risk exposure related to ESG issues in a country, and it does not consider that a sovereign ESG rating. 11 World Bank, Worldwide Governance Indicators, https://info.worldbank.org/governance/wgi/.
income. To better understand the nature of sovereign ESG scores, we use principal component analysis (PCA), a useful technique for finding structure in data sets of highly correlated variables. We find that for aggregate ESG scores, the first principal component explains nearly 90 percent of the variance of the data set, which confirms the convergence across ESG providers on sovereign ESG scores. This finding has two intuitive interpretations. First, most of the information of the data set is related to one component. Second, we can use the first principal component as a representation of aggregate sovereign ESG scores for the ESG industry as a whole. The other notable finding, in line with what we saw in the correlation analysis, is that for the E scores, the subsequent principal components explain a more sizable amount of the variance. Details of PCA are included in Appendix B. In the next section, we explore the significant impact of national income on sovereign ESG scores and determine whether this impact can be mitigated.

30 >>> EQUITABLE GROWTH, FINANCE & INSTITUTIONS INSIGHT
3.

31>>>DEMYSTIFYING SOVEREIGN ESG
Our analysis reveals a high correlation between sovereign ESG scores and a country’s national income: 81 percent for aggregate ESG, 85 percent for S pillar, 70 percent for G pillar, and 51 percent for E pillar. Table 3.1 presents details for individual providers’ correlation with national income for each ESG pillar. At the aggregate sovereign ESG level and on average across different pillars, Sustainalytics has the highest correlation with national income, while V.E has the lowest. In our discussions with providers, some shared that they were aware of this phenomenon and indicated that they have been exploring adjustments in their methodologies. One provider expressed surprise at the level of the correlation with the national income because it said it had developed its methodology explicitly to address the relationship with a country’s level of development.
These results suggest that the ingrained income bias is a possible explanation for the sovereign ESG convergence. Several studies have found that countries with high ESG scores tend also to rank high in income and development levels. This finding is not surprising because, among other reasons, high labor participation and access to electricity, political stability, rule of law, and forest depletion do not exist in a vacuum. These indicators are representative of a country’s long-term growth and development. In the case of ESG scores, investors are expecting them to capture some form of sustainability distinct from a country’s national income, creditworthiness, or credit ratings. Thus, sovereign ESG scores currently are affected by excessive representation of the country’s national income, which we term ingrained income bias
>>> Relationship of Sovereign ESG Scores to a Country’s National Income
> > > Key questions
1. What is the relationship between sovereign ESG scores and a country’s level of development, or national income?
2. What are the important policy implications of that relationship? 3. How does adjustment of the sovereign ESG methodology for income affect sovereign
ESG scores?> > >

32 >>> EQUITABLE GROWTH, FINANCE & INSTITUTIONS INSIGHT
(IIB) (Gratcheva, Gurhy, and Wang 2021; Wang 2021), and this bias is ingrained into any type of cross-country analysis that compares development-related indicators.12 Failure to account for the IIB leads to two important consequences:
• The income bias leads to perverse investment outcomes: tilting investment portfolios towards higher ESG scores leads to rewarding rich countries for their prosperity.
• The ingrainedness leads to disheartening policy incentives: policy efforts in the short run are unlikely to affect a country’s income level, which is the result of decades or centuries of development.
Similar bias with potential for misallocation of capital to wealthier countries at the expense of lower-income countries has also been found in corporate ESG scores affected by a company’s size. Drempetic, Klein, and Zwergel (2020) find that current corporate ESG scores in Thomson Reuters’s ASSET4 database have a firm-size bias, wherein larger firms are more highly rated after controlling for other relevant factors, and measures of sustainability. They explain that the key mechanism driving this bias is that larger companies have a greater capacity to supply ESG data compared to that of smaller companies. By implication, this bias means that the scores do not measure corporate sustainability performance correctly and will not fulfill the goal to “reorient capital flows towards sustainable investment in order to achieve sustainable and inclusive growth”. Thus, similar to our finding in relation to ingrained income bias in sovereign ESG scores, the size bias in corporate ESG scores leads to a perverse policy incentive from misdirecting capital flows intended for greater sustainability impacts.
We further find that other commonly used measures of sustainable development and resilience also demonstrate a similar strong relationship with a country’s level of income, that is, they are subject to ingrained income bias. We examined the SDG Index, the Yale Environmental Performance Index (EPI), and the Notre Dame Global Adaptation Initiative (ND-GAIN) Country Index and found a similar high correlation
12 In econometric terms, these types of analyses suffer from endogeneity, or, specifically, omitted variable bias. See Wang (2021) for an in-depth discussion.
with a country’s level of income. Appendix C describes the data series and indexes that we included in our income analysis, and Figure 3.1 provides the correlation of these variables with national income.
Income has long been recognized as a key factor driving sovereign credit risk (Cantor and Packer 1996), and wealthier countries have greater resources to mitigate ESG risks. For example, a wealthy country may have more resources to reinforce critical infrastructure for more resilience to the rise of extreme weather events related to climate change. Such investments in risk mitigation may help the country avoid disruptions to economic activity or the fiscal costs of rebuilding, both of which may be relevant to financial assessments of sovereign credit risk.
Practitioners have been cognizant about the IIB and have proposed ways to adjust for its impact, in particular using linear adjustment as discussed in Box 3.1. While noting that this method has emerged as a practical solution in the industry, we caution that its application has shortcomings: namely, that while expected to produce income-adjusted outputs (scores, index values, and so on), linearly adjusted values still exhibit income bias. After decorrelating the scores with respect to gross national income (GNI) per capita, we observe that the first principal component still explains more than 70 percent of the total variation in the sovereign ESG scores (as compared with 90 percent for the original sovereign ESG scores), and adjusted scores still seem to be in agreement regarding what ESG measures, even after eliminating income. Figure 3.2 presents a scatter matrix for original sovereign ESG scores of the ESG providers, while Figure 3.3 presents the sovereign ESG scores adjusted by us for national income. Although this approach is intuitively appealing, our review of approaches presented in Box 3.1 led us to conclude that they do not necessarily lead to the desired outcome. In some cases, they also rely on third-party data or subjective inputs or both that, as we have shown, may also be subject to biases and are impossible to reproduce independently.
> > > T A B L E 3 . 1 Correlations of aggregate ESG and individual pillar scores with a country’s national income (GNI per capita) for ESG providers
Factor ISS FTSE Russell/BR
MSCI RepRisk Robeco Sustainalytics V.E Sovereign ESG
ESG 0.68 0.91 0.84 0.78 0.89 0.95 0.60 0.81
E 0.07 0.74 0.10 0.79 0.82 0.83 0.23 0.51
S 0.86 0.88 0.90 0.75 0.85 0.94 0.79 0.85
G 0.77 0.84 0.77 0.37 0.85 0.93 0.39 0.70 Source: World Bank staff. Note: BR = Beyond Ratings; ESG = environmental, social, and governance.

33>>>DEMYSTIFYING SOVEREIGN ESG
> > >
> > >
Note: E = environmental; G = governance; S = social; GNI = gross national income; BR = Beyond Ratings.
Note: Natural, produced, and human capital figures are presented in total (transformed with base-10 logarithm) or per capita nu mbers. Natural capital is least correlated with GNI per capita.
Source: World Bank staff.Note: EPI = Yale Environmental Performance Index; ND-GAIN = Notre Dame Global Adaptation Initiative; SDG = Sustainable Development Goals. The SDG Index, Yale EPI, and ND-GAIN Country Index are similarly and strongly correlated with GNI per capita.
The E, S, and G individual and combined ESG scores are correlated with GNI per capita to varying degrees, depending on the ESG provider. The S scores are most correlated with little variation across providers, while the E scores are
least correlated with large discrepancies among providers.
Natural capital (total, log 10)
Natural capital (per capita)
Human capital (total, log 10)
Produced capital (total, log 10)
Human capital (per capita)
Produced capital (per capita)
b. Income and wealth accounting
c. Income and other indexes
14.0%
31.4%
59.0%
66.7%
78.3%
81.1%
SDG Index
EPI
ND-GAIN Country Index
84.7%
86.9%
91.0%
Aggregate E Score
Aggregate G Score
Aggregate ESG Score
Aggregate S Score
F I G U R E 3 . 1 Correlations of ESG-related indexes with a country’s national income (GNI per capita)
a. Income and sovereign ESG scores of six providers
MSCI
Vigeo Eiris
Vigeo Eiris
Vigeo Eiris
Vigeo Eiris
MSCI
MSCI
MSCI
FTSE R
usse
ll/BR
Beyon
d Ratin
gs
Beyon
d Ratin
gs
Beyon
d Ratin
gs
Susta
inalytics
Susta
inalytics
Susta
inalytics
RepRisk
Robes
co SAM
Robes
co SAM
Robes
co SAM
Robes
co SAM
Susta
inalytics
RepRisk
RepRisk
RepRisk
58.5%(mean)
69.8%(mean)
83.2%(mean)
85.2%(mean)

34 >>> EQUITABLE GROWTH, FINANCE & INSTITUTIONS INSIGHT
> > > B O X 3 . 1 Existing methodologies for sovereign ESG income adjustment
Some academic and market practitioners have dealt with ingrained income bias by adjusting for GDP per capita. The key argument given is that because these indices are highly correlated with national income, countries should be judged on the basis of whether they outperform or underperform for their income level. We present a sample of approaches based on publicly available sources.
Notre Dame Global Adaptation Initiative (ND-GAIN) Country Index: The ND-GAIN Country Index measures a country’s vulnerability to climate change along with its readiness to improve resilience. The creators of the index note in the methodology document that despite purposefully excluding GDP per capita or any closely related measures, the final index is highly correlated with a country’s level of income. As a result, they create a version that adjusts the index scores for a country’s GDP per capita. Figure B3.1.1 presents ND-GAIN Country Index and ND-GAIN Country Index GDP-adjusted scores and the impact of the adjustment on countries. The adjusted version still exhibits a much weaker but still discernable income bias.
Renaissance Capital: In a 2018 report, Robertson and Lopez (2018) construct and analyze sovereign ESG scores. Noting the strong relationship between environmental, social, and governance scores and national income, they calculate overperformance and underperformance of a country versus its GDP per capita. They comment that many emerging markets have better ESG standards than developed countries did when those countries were at similar income levels. Robertson and Lopez (2018) argue that for investors wishing to improve ESG outcomes, emerging and frontier markets offer the greatest opportunity, despite having lower ESG scores. In contrast, investing in countries that are already wealthy and have high ESG scores promises very little future improvement. They also comment that for unadjusted ESG scores, there is a relationship with a country’s ESG scores. They further conclude that once per capita GDP is removed, the correlation with ESG effectively disappears.
> > >
> > >F I G U R E B 3 . 1 GDP adjustment for the ND-GAIN Country Index
a. ND-GAIN Country Index
Low income
GNI per capitaGNI per capita
b. ND-GAIN Country Index, GDP adjusted
Lower middle income Upper middle income High income
-2
30
40
50
60
70
-40
-30
-20
-10
0
10
-1 0 1 -2 -1 0 1
Source: World Bank staff.
Panels a and b show the ND-GAIN Country Index and the GDP-adjusted version, respectively. Both indexes are plotted against GNI per capita. Panel a shows a strong income effect. Panel b still exhibits a weak income effect after the GDP
adjustment. In addition, the adjustment leads to some high-income countries (from low to high: Qatar, Kuwait, Luxembourg, Singapore, Ireland, United Arab Emirates, and Saudi Arabia) to take on significantly lower values than their income peers.

35>>>DEMYSTIFYING SOVEREIGN ESG
> > > B O X 3 . 1 continued Morgan Stanley Investment Management: In a 2019 white paper, Caron and Emery (2019) note the challenge of finding a standardized methodology to benchmark ESG factors among a broad array of issuers across the wide spectrum of their level of development. They argue that standard ESG scores are systematically biased against developing countries and propose an adjustment framework: (a) adjust scores based on GDP per capita; and (b) adjust scores based on a momentum factor, consisting of two parts. The first part is provided by a third party and is based on momentum in the existing data. The second part is a momentum factor based on an MSIM (Morgan Stanley Investment Management) sovereign analyst’s subjective analysis of the ESG developments in a country over the past 12–18 months. They argue that this focus on change at the margin aligns better with investors’ sustainability goals and provides a more interesting opportunity set for investing.
HSBC Global Research: In a 2020 report, Kini, Phippen, and White (2020) [[AQ: Add missing entry to references]] analyze emerging market local currency bond portfolios using two sovereign ESG scores, one adjusted for GDP per capita and one not adjusted. They explore a strategy for optimizing impact by treating risk, return, and ESG as three separate dimensions. They perform a portfolio optimization exercise that concludes that both sovereign ESG score–constrained approaches can achieve excess returns close to an unconstrained portfolio optimization. Given this finding, they favor the income-adjusted approach to ESG because it increases the ESG level of the portfolio, without penalizing poor issuers in favor of richer issuers or sacrificing much excess return.
> > >
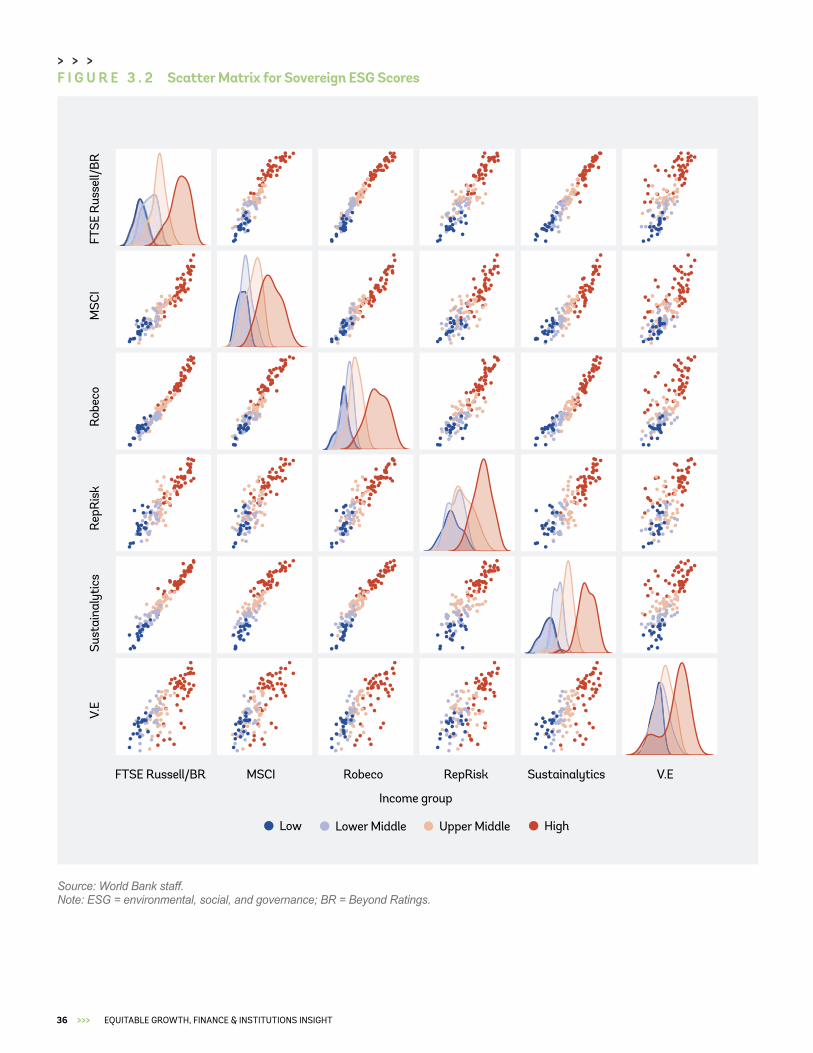
36 >>> EQUITABLE GROWTH, FINANCE & INSTITUTIONS INSIGHT
F I G U R E 3 . 2 Scatter Matrix for Sovereign ESG Scores> > >
Low Lower Middle
Income group
Upper Middle High
Source: World Bank staff.Note: ESG = environmental, social, and governance; BR = Beyond Ratings.
FTSE Russell/BR
FTSE
Rus
sell/
BR
MSCI
MSC
I
Robeco
Rob
eco
RepRisk
Rep
Ris
k
Sustainalytics
Sust
aina
lyti
cs
V.E
V.E

37>>>DEMYSTIFYING SOVEREIGN ESG
F I G U R E 3 . 3 Scatter Matrix for Sovereign ESG Scores, Linearly Adjusted for Income
Low Lower Middle
Income group
FTSE Russell/BR
FTSE
Rus
sell/
BR
MSCI
MSC
I
Robeco
Rob
eco
RepRisk
Rep
Ris
k
Sustainalytics
Sust
aina
lyti
cs
V.E
V.E
Upper Middle High
> > >
Source: World Bank staff.Note: ESG = environmental, social, and governance; BR = Beyond Ratings.

38 >>> EQUITABLE GROWTH, FINANCE & INSTITUTIONS INSIGHT
> > >F I G U R E 3 . 4 Sovereign ESG scores and sovereign ESG income-adjusted scores for ESG providers collectively
a. Original score exhibit linear income bias
Lowincome
GNI per capitaGNI per capita
b. Income elimination reveals quadratic income bias
Aver
age
ESG
Sco
re
Lower Middleincome
Nonlinear income bias
Linear income bias
Upper Middle income
High income
Source: World Bank staff. Note: ESG = environmental, social, and governance.
Panels a and b show the before and after of a regression-based income adjustment, respectively. Although this income adjustment mechanically removes the linear income bias, panel b shows that a nonlinear income bias still remains.
Our analysis reveals that income-adjusted sovereign ESG scores of the ESG providers still exhibit nonlinear income bias. A closer look at the orthogonalized ESG scores reveals that although the linear dependency between income category and ESG scores has been removed, the new scores exhibit a U-shaped relationship, or nonlinear relationship. Both high- and low-income countries score high on the orthogonalized ESG scale, while middle-income countries score the lowest. Figure 3.4 presents original (panel a) and income-adjusted sovereign ESG scores (panel b) for sovereign ESG providers collectively, and Figure 3.5 presents both original and adjusted scores for individual providers. This U-shaped relationship resembles the environmental Kuznets curve (Figure 3.6).
Grossman and Krueger (1991) postulate an inverted, U-shaped relationship between environmental degradation
and per capita income: environmental pressure increases income rises and then it decreases. The environmental Kuznets curve (EKC) is a hypothesized relationship between a country’s income and its level of environmental degradation. As a country begins to industrialize, its activity also begins to take a toll on the environment. The EKC postulates the existence of a turning point, beyond which further economic growth begins to halt and reverse environmental degradation. Stronger regulation and better technologies are possible reasons for this reversal. The empirical validity of the EKC is, however, widely debated. The reversal is particularly questionable when environmental degradation is irreversible, such as resource exploitation or loss of biodiversity. Further research is needed to understand the nonlinear impact on sovereign ESG scores and its relation to the EKC.

39>>>DEMYSTIFYING SOVEREIGN ESG
> > >F I G U R E 3 . 5 Sovereign ESG scores before and after income adjustment
d. Robeco e. Sustainalytics f. V.E
a. FTSE Russell/Beyond Ratings b. MSCI c. RepRisk
Log GNI per capita
ESG
sco
res
(z−s
core
)
Income adjusted ESG scoreStandard ESG score
Source: World Bank staff. Note: ESG = environmental, social, and governance.
Income adjustment is conducted here by orthogonalizing ESG scores with respect to GNI per capita
> > >
Middle income levels
Low income levels
Scale effect
Pre industrial economy
Income levels
Envi
ronm
enta
l deg
rada
tion
Post industrial economy
Compositionand technique
effect
High income levels
F I G U R E 3 . 6 Enviornmental Kuznets Curve
industrial economy
This stylized figure describes the main characteristics of the hypothesized environmental Kuznets curve. The inverted U-shape peaks for industrialized economies that have the largest negative effect on the environment.
Source: Sarkodie and Streznov (2018).

40 >>> EQUITABLE GROWTH, FINANCE & INSTITUTIONS INSIGHT
4.

41>>>DEMYSTIFYING SOVEREIGN ESG
Investors that engage in sovereign ESG investing rely extensively on ESG providers for data, methodology, or advice. Based on the recent J.P. Morgan survey, 71 percent of respondents use a combination of ESG providers and in-house analytics, and 10 percent use one or more ESG providers exclusively. While 10 percent of respondents do not license any ESG providers, 24 percent license one provider, 30 percent license two, and 36 percent license three or more. Sustainalytics and MSCI are used by one-third of respondents, and no other provider in our sample came close. These figures suggest that (a) the sovereign ESG industry is still evolving and (b) the investment community navigates the lack of clarity among the providers’ sovereign ESG approaches by augmenting the third-party sovereign ESG scores with their own proprietary analytics and/or subscriptions to several ESG providers. The objective of our research is to better understand the structure of the sovereign ESG landscape and the way various providers relate to each other.
Because our analysis reveals broad similarity of sovereign ESG scores of these ESG providers, we seek to understand specific nuances of their methodologies and their impact on aggregate ESG scores, individual pillar scores, or both. More broadly, our objective is to be able to categorize ESG providers on the basis of their unique characteristics, such as labeling corporate ESG providers as value versus values approaches (Eccles and Stroehle, 2018). Regarding sovereign ESG, this analysis is challenging given the high level of convergence of sovereign ESG scores across providers. Furthermore, analysis of individual methodologies is hampered by significant differences across providers on the type of documents and/or the level of granularity of their individual methodologies disclosed to us. Thus, given the nature of the sovereign ESG data and information, we performed two high-level quantitative analyses: (a) a cluster analysis
>>> Comparing Sovereign ESG Score Methodologies
> > > Key questions
1. What are the key tenets of the sovereign ESG score methodologies of ESG data providers?
2. What are their unique aspects, and how do these differences contribute to differences in respective sovereign ESG scores?
> > >

42 >>> EQUITABLE GROWTH, FINANCE & INSTITUTIONS INSIGHT
of sovereign ESG scores and (b) a simple natural language processing (NLP) analysis of providers’ technical and marketing documents. As a data-driven approach, clustering analysis aims at organizing ESG providers within the least number of groups (that is, clusters) that describe similarities among providers in our sample. This method compares ESG scoring outcomes
(that is, objectively using a purely analytical approach) without comparing scoring methodologies. The NLP analysis is not entirely agnostic about the scoring methodology, because some input documents contain methodological descriptions. As a result, the NLP output is highly dependent on the types of documents used as inputs and should be interpreted cautiously.
> > >F I G U R E 4 . 1 Clusters of ESG providers for sovereign ESG and individual pillars
FTSERussell/BeyondRatings
MSCIRobeco
RepRisk
Sustainalytics
V.E
E
FTSERussell/BeyondRatings
MSCI
Robeco
RepRisk
Sustainalytics
V.E
ESG
FTSERussell/BeyondRatings
MSCI
Robeco
RepRisk
SustainalyticsV.E
G
FTSERussell/BeyondRatings
MSCI
Robeco
RepRisk Sustainalytics
V.E
S
Source: World Bank staff. Note: ESG = environmental, social, and governance.
a. ESG score b. Environmental score
c. Governance score d. Social score
Cluster analysis attempts to form groups based on how similarly ESG providers score individual countries. Providers (blue boxes) are connected to a cluster (colored bubbles) if they tend to score similarly the 133 countries analyzed. If there is significant disagreement among providers, then each provider forms its own cluster or bubble (for example, E pillar).
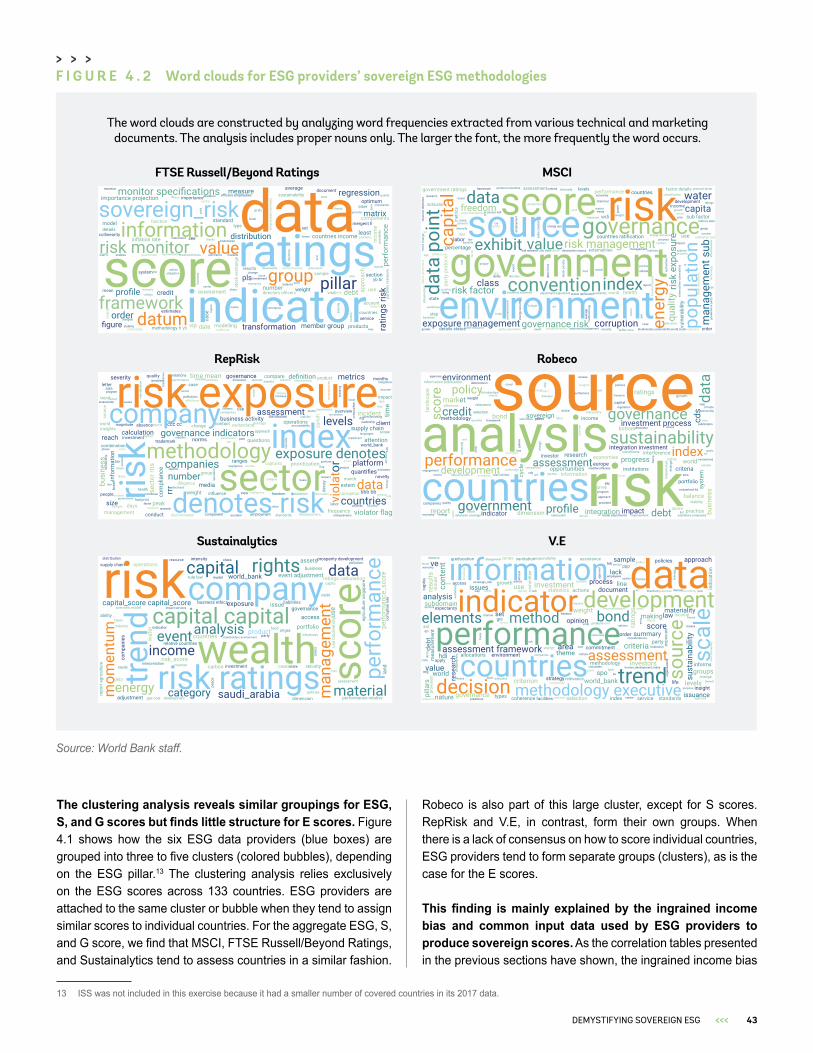
43>>>DEMYSTIFYING SOVEREIGN ESG
The clustering analysis reveals similar groupings for ESG, S, and G scores but finds little structure for E scores. Figure 4.1 shows how the six ESG data providers (blue boxes) are grouped into three to five clusters (colored bubbles), depending on the ESG pillar.13 The clustering analysis relies exclusively on the ESG scores across 133 countries. ESG providers are attached to the same cluster or bubble when they tend to assign similar scores to individual countries. For the aggregate ESG, S, and G score, we find that MSCI, FTSE Russell/Beyond Ratings, and Sustainalytics tend to assess countries in a similar fashion.
13 ISS was not included in this exercise because it had a smaller number of covered countries in its 2017 data.
Robeco is also part of this large cluster, except for S scores. RepRisk and V.E, in contrast, form their own groups. When there is a lack of consensus on how to score individual countries, ESG providers tend to form separate groups (clusters), as is the case for the E scores.
This finding is mainly explained by the ingrained income bias and common input data used by ESG providers to produce sovereign scores. As the correlation tables presented in the previous sections have shown, the ingrained income bias
> > >F I G U R E 4 . 2 Word clouds for ESG providers’ sovereign ESG methodologies
FTSE Russell/Beyond Ratings MSCI
RepRisk Robeco
V.ESustainalytics
Source: World Bank staff.
The word clouds are constructed by analyzing word frequencies extracted from various technical and marketing documents. The analysis includes proper nouns only. The larger the font, the more frequently the word occurs.

44 >>> EQUITABLE GROWTH, FINANCE & INSTITUTIONS INSIGHT
most strongly influences the G scores and, to a lesser degree, the S scores. Therefore, if the IIB permeates G and S scores, it is not surprising to find higher degrees of convergence among ESG providers. In addition, we also recognize the role of common input data sources. Convergence among G scores is likely due to the reliance on the World Governance Indicators (WGI), which are widely used as inputs, because 70 percent of survey respondents noted its use in their sovereign ESG analyses. In contrast, there is much less convergence across E scores. The cluster analysis results paint a fragmented picture; almost all ESG data providers form their own clusters. The only exceptions are Robeco and Sustainalytics, which tend to resemble each other in their E scoring results.
Using product brochures and technical methodology documents provided to us by the seven ESG providers, we conducted a simple word frequency analysis. Figure 4.2 presents a word cloud—a visual display of word frequencies in an ESG provider’s documents. After selecting the set of documents with the most comparable information across providers, we counted all proper nouns that were pertinent to our analysis and grouped them in Figure 4.3 into financial (orange), methodological (purple), SDG-related (red), and descriptive (green) terms. We included only terms that occur
14 Wealth accounting data are available at World Bank, Wealth Accounting (database), https://datacatalog.worldbank.org/dataset/wealth-accounting.
significantly often in the content of at least two providers. This approach excludes, however, terms like wealth, which features prominently in the word cloud of Sustainalytics, whose framework revolves around World Bank wealth data (described in Appendix C).
While acknowledging limitations of this analysis, we find that the network output provides helpful insights about the uniqueness of ESG providers. The network result, which we refer to as a “wheel of fortune”, is presented in Figure 4.3. It reveals that MSCI, Robeco, and FTSE Russell/Beyond Ratings are closely related providers, as shown by their center positions in the network of four different categories of our inquiry (financial, methodological, SDG-related, and descriptive). In contrast, ISS, V.E, and RepRisk are uniquely positioned within the network in relation to those categories. Sustainalytics is the only provider that uses the World Bank wealth accounting framework (Lange, Cust, et al., forthcoming; Lange, Wodon, et al. 2018),14 which differentiates it from other sovereign ESG data providers. ISS appears more focused on SDG-related materiality. RepRisk quantifies the corporate reputational risk of operating in a country rather than a measure of a country’s ESG score, and its position within the network is oriented toward financial materiality.

45>>>DEMYSTIFYING SOVEREIGN ESG
> > >F I G U R E 4 . 3 “Wheel of Fortune”: Network analysis of ESG providers’ methodologies
V.E
MSCI
Sustainalytics
ISS
Robeco
RepRisk
FTSE Russell/BR exposure
value
index
debt
managem
entbusiness
capitalcom
panies
ratings
creditinvestment
risk
repor
tprofi
le
criteria
performance
state
source
group
countries
energy
governance
development
impact
income
corruption
environment la
bor
sust
aina
bilit
yrig
hts
polic
ies
inequality
met
hodo
logy
info
rmat
ion
indi
cato
r
resea
rchscoreframework
trend
model
weight
data
assessment
approach
syst
em
number
anal
ysis
Sustainability/SDG-related
Methodological
Descriptive
Financial
Source: World Bank staff. Note: ESG = environmental, social, and governance; SDG = Sustainable Development Goals; BR = Beyond Ratings.
This network positions various ESG providers based on how often their technical and marketing documents contain the terms noted on the periphery. The thicker the chords, the more often a word is mentioned. While recognizing the limitations of this depiction, we can distinguish ISS, V.E, and RepRisk as more specialized providers from the more
balanced providers MSCI, FTSE Russell/Beyond Ratings, Robeco, and Sustainalytics.
A robust taxonomy of sovereign ESG methodologies is a useful first step toward clearly defining unique features of individual providers and the network output. The limitation of the network analysis will need to be addressed with a deeper and more comprehensive examination to obtain more informative and conclusive results, because the network analysis results
depend strongly on the types of input documents used in the process. Although we select documents as similar in nature as possible, a significant degree of heterogeneity remains because there are no standard disclosure requirements for ESG providers. Finally, some of the terms could arguably belong to more than one of the four colored categories (such as “value”).

46 >>> EQUITABLE GROWTH, FINANCE & INSTITUTIONS INSIGHT
5.

47>>>DEMYSTIFYING SOVEREIGN ESG
Sovereign ESG has evolved organically from ESG developments in other asset classes, such as equities and corporate bonds, and uses intuitive analytical approaches, such as linear income adjustment. Through our empirical analysis, we find that these developments have led to the state of sovereign ESG that does not necessarily result in intended or desired outcomes for investors interested in more transparent and measurable sustainable investment opportunities. Furthermore, the current sovereign ESG approach is affected by perverse incentives when higher-income countries are rewarded at the expense of lower-income countries, which have larger SDG funding gaps and offer the most potential for making ESG-related improvements.
Our analysis reveals that sovereign ESG is a distinct segment within the ESG landscape and that sovereign ESG challenges are distinct from those of corporate ESG. First, the ingrained income bias permeates the sovereign ESG segment overall, as well as sovereign G and S pillars. Second, the sovereign E pillar is the most challenging, which is consistent with the challenging and opaque data landscape of underlying environmental variables. The dominating effect of the ingrained income bias deprives G and S scores of their pillar-specific information, while divergence among E scores casts doubt on the pillar as it has been treated. Currently, practical solutions adopted by select practitioners to adjust income rely on subjective inputs, assumptions, and nontransparent adjustment to existing data gaps and lags. This approach renders the resulting scores difficult to interpret and compare, presenting significant challenges to investors interested in measurable sovereign ESG outcomes.
Sovereign ESG scores are becoming part of the structural foundations for the investment industry, and thus it is critical that their methodologies are clear and transparent. The different approaches to measuring countries’ ESG performance may appeal to various investment objectives, as long as these differences represent measurable methodological differences. The challenge with the current sovereign ESG framework is the ESG score convergence because of the structural reasons: the ingrained income bias and the lack of clarity around the E pillar. Evolving sovereign ESG framework needs to acknowledge these shortcomings, and the methods used to achieve a more transparent framework need to account for (a) explicit investment objectives, (b) transparent methodology and data, (c) explicit forward-looking ESG factors, and (d) adjustment of income bias (Gratcheva et al. 2021).
>>> Conclusion

48 >>> EQUITABLE GROWTH, FINANCE & INSTITUTIONS INSIGHT
This approach calls for more transparency in both sovereign ESG methodology and data sources. While this is true for all pillars, it is especially important for the E pillar. New solutions and approaches to measure ESG are needed and must be grounded in a stronger data foundation. Geospatial solutions are promising and could potentially meet
specific challenges of sovereign ESG, which did not befall corporate ESG. At the same time, these novel data sources require technical expertise that is not always available. More research is needed to ensure that a new generation of ESG scores are based on these lessons and lead to ESG scores that foster sustainability.

49>>>DEMYSTIFYING SOVEREIGN ESG
Treatment and standardization of data
We standardized the direction of the scores for ease of interpretability. For most data providers, higher scores indicate better environmental, social, and governance performance. For those providers whose lower scores indicate better ESG performance, we changed the direction of the scores by subtracting the score from the maximum score. This approach eases interpretability by ensuring that high scores always indicate better ESG performance for all data providers.
Most of the data providers have annual data. We used the 2017 scores because most ESG data providers could more easily provide data pro bono for the study if the data were sufficiently lagged from their current offering. For the purpose of the study, it is important that data have a common base year. Some data providers have subannual data. We aggregated subannual data to annual data using its simple average.
For the ESG pillars, we worked with data providers to determine the most appropriate scores to use, because each data provider has a different data taxonomy. RepRisk quantifies corporate reputational risk of operating in a country, and it does not consider that factor an ESG score. Despite the differences, that factor is included because it is an input into J.P. Morgan’s ESG tilted sovereign debt indexes and it maintains consistency with analysis (Bouyé and Menville 2021). RepRisk does not have official E, S, and G pillars either, but we processed it to create proxies for the sake of comparability.
Finally, using z-scores, we centered and scaled the data using a group of 133 countries that had scores available from all data providers. Countries covered by only a subset of providers include many countries that are outliers in some respect, such as small island nations, active conflict zones, or low-income countries.
This analysis also made use of other data sets. The country coverage for those data sets, such as the World Bank’s wealth accounting data, resulted in an overlapping group of 123 countries. For income data, we used the natural log value of per capita income. Using a log transformation better reflects the nonlinear nature of income. There is a substantial difference between a country increasing from US$5,000 to US$10,000 per capita versus increasing from US$45,000 to US$50,000. When we compared changes in national income, we used the changes in log per capita income. Z-scores were then calculated from these log per capita values.
>>> Appendix AResearch Methodology

50 >>> EQUITABLE GROWTH, FINANCE & INSTITUTIONS INSIGHT
Methods
Correlation. The initial analysis aimed to explore to what extent sovereign ESG providers agree with each other in their aggregate ratings and in their assessments of the E, S, and G pillars. The most straightforward process is to calculate the correlation of scores among data providers. These correlations among providers are then aggregated using simple averages to show the level of pairwise agreement about the aggregate scores and the pillar scores. However, the pairwise nature of correlations does not imply overall agreement. The principal component analysis (PCA) approach is better suited to measure this correlation.
Principal component analysis. Next, we used PCA as a dimensionality reduction tool. On a practical level, PCA allowed us to quantify how much of the overall variance of a data set is explained by a single principal component. In our case, the variance stems from the level of disagreement among ESG
ratings about the score of a country. The first component aimed at summarizing as much information as possible across all ratings. The second component summarized the information that was left unexplained by the first component, and so on. The components were constructed in such a way that they were uncorrelated to each other. If ESG ratings are largely in agreement, we would expect the first component to explain most of the variance. If ESG ratings are in complete disagreement, the individual components would have similar shares of explained variance.
Cluster analysis. Cluster analysis is a type of unsupervised machine learning method that aims at finding as few clusters or groups as necessary to describe the data. The K-means approach separates the data into K disjoint clusters that minimize the inertia criterion. We chose the number of clusters using common heuristics. The colors of the clusters are arbitrary and should not be compared among E, S, G, and ESG scores.

51>>>DEMYSTIFYING SOVEREIGN ESG
Principal Component Analysis (PCA) is a technique for dimensionality reduction that can be useful for finding structure in data sets of highly correlated variables. For each variable examined—aggregate environmental, social, and governance, E, S, and G scores—we used the six data providers.15 We then examined the principal components against other sustainability-related variables. These variables include elements of the World Bank’s wealth accounting framework, which attempts to provide a more holistic view of national wealth that includes natural capital and human capital. We also included some commonly used environmental and sustainability indices. A full description of selected data and indices is included in Appendix C. Finally, we included a traditional financial measure of national income—that is, GNI per capita. This exercise is meant to be an initial exploration of key relationships in terms of both additional variables and analytical techniques.
The correlation analysis in figures 3.2 and 3.3 included 133 countries that have ESG scores from all six data providers.16 Ten countries from this sample did not have World Bank wealth accounting data, so the sample size for the PCA analysis is 123 countries. All the ESG data and the supplementary variables were centered and scaled into z-scores on the basis of this 123-country sample.
We calculated the variance explained by each principal component for each of the data pillars presented in Figure B.1. Because there are six data providers, there are six principal components. We found that for aggregate ESG scores, the first principal component explains nearly 90 percent of the variance of the data set. The second principal component explains only 6 percent of the variance of the data set. Intuitively, these findings mean two things. First, most of the information of the data set is related to one component. Second, we can confidently use the first principal component to describe aggregate ESG scores in general, particularly if we also keep the bivariate correlation plots in mind. The other notable finding, in line with what we saw in the correlation analysis, is that for the E scores, the subsequent principal components explain a more sizable amount of the variance.
15 FTSE Russell/Beyond Ratings, MSCI, RepRisk, Robeco, Sustainalytics, and V.E are included in PCA, while ISS was excluded because its sovereign scores cover fewer countries for the 2017 data.
16 ISS was not included in the PCA analysis because it has only 55 overlapping countries for the 2017 data used.
>>> Appendix B Principal Component Analysis of Sovereign ESG Scores

52 >>> EQUITABLE GROWTH, FINANCE & INSTITUTIONS INSIGHT
The first principal components of aggregate ESG scores and all the pillars are highly correlated with GNI per capita, ranging from) 83 percent to 91 percent. The aggregate ESG scores have an average correlation of 89 percent, as presented in Figure B.2.
Most notable is that many of the other measures of sustainability or augmented measures of income examined display the same high correlation with GNI per capita. This finding suggests that a better interpretation is to say that all these variables measure an unobserved variable of development. The first principal component of ESG scores has the highest level of correlation, 95 percent, with the
ND-GAIN (Notre Dame Global Adaptation Initiative) Country Index, suggesting that they are measuring a similar concept of development compared to a simpler financial measure like GNI per capita, as presented in Figure B.3.
Interpretation of subsequent principal components. Although the interpretation of the first principal component is clear, we are able to find no policy-relevant findings for the subsequent principal components for each pillar using PCA analysis only. We focus most closely on the E pillar, because the subsequent principal components contain a greater amount of information.
> > >F I G U R E B . 1 Sovereign ESG scores’ variance explained by principal components
0.89
0.06
0.03
0.01
0
0
0.75
0.12
0.1
0.02
0.01
0
0.87
0.06
0.03
0.02
0.01
0.01
0.58
0.21
0.11
0.06
0.03
0.02
c. Aggregate G score d. Aggregate E score
a. Aggregate ESG score b. Aggregate S score
0.00 0.25 0.50 0.75 1.00 0.00 0.25 0.50 0.75 1.00
PC6
PC5
PC4
PC3
PC2
PC1
PC6
PC5
PC4
PC3
PC2
PC1
Source: World Bank staff.Note: PC = principal component.

53>>>DEMYSTIFYING SOVEREIGN ESG
> > >F I G U R E B . 2 First principal component 1 for ESG scores, individual pillars, a country’s national income
Corr: 0.921*** Corr: 0.960***
Corr: 0.856***
Corr: 0.978***
Corr: 0.863***
Corr: 0.900***
Corr: 0.888***
Corr: 0.832***
Corr: 0.913***
Corr: 0.836***
AggregateESG score
Aggregate E score
Aggregate S score
Aggregate G score
GNI per capita
Aggregate
ESG score
Aggregate E score
Aggregate S score
Aggregate G
scoreG
NI
per capita
Source: World Bank staff. Note: Corr = correlation; ESG = environmental, social, and governance.Three stars (***) indicate that the correlation is significant on a 1% level.

54 >>> EQUITABLE GROWTH, FINANCE & INSTITUTIONS INSIGHT
> > >F I G U R E B . 3 Correlation of sovereign ESG principal component 1 with sustainability variables
Corr:
0.888***
Corr:
0.703***
Corr:
0.877***
Corr:
0.863***
Corr:
0.966***
Corr:
0.837***
Corr:
0.945***
Corr:
0.910***
Corr:
0.800***
Corr:
0.881***
Corr:
0.874***
Corr:
0.869***
Corr:
0.702***
Corr:
0.837***
Corr:
0.864***
Corr:
0.876***
Corr:
0.847***
Corr:
0.794***
Corr:
0.787***
Corr:
0.903***
Corr:
0.846***
Aggregate ESG score
PC1
GNI percapita
CO2emissionsper capita
Totalwealth
ND-GAINcountry index
YaleEPI
SDGindex
Aggregate
ESG score
PC1
GN
Iper capita
CO
2em
issions per capita
Totalw
ealthN
D-G
AIN
country index
YaleEPI
SDG
index
Source: World Bank staff. Note: CO2 = carbon dioxide; EPI = Environmental Performance Index; ESG = environmental, social, and governance; ND-GAIN = Notre Dame Global Adaptation Initiative; PC = principal component; SDG = Sustainable Development Goal.Three stars (***) indicate that the correlation is significant on a 1% level.

55>>>DEMYSTIFYING SOVEREIGN ESG
Traditional financial measure of income. We use gross national income (GNI) per capita, from the World Bank. This is the measure of national income that the World Bank uses to determine income groupings and operational lending policy.
World Bank augmented income data. Given that we know that sovereign environmental, social, and governance scores have a strong relationship with a country’s level of income, we wanted to test whether perhaps they more closely resemble an augmented measure of income versus a more traditional financial measure of income.
The World Bank’s Wealth Accounting and the Valuation of Ecosystem Services (WAVES) partnership has created a national wealth accounting framework that works to incorporate the value of natural capital and human capital alongside traditional financial measures of national income in order to create a more holistic accounting of national wealth (Figure C.1). The purpose is to move beyond traditional GDP and capture the interaction among economic activity, the environment, and the human capital of a country’s citizens.
Natural capital. Natural capital includes the value of natural resources and ecosystem services.
Human capital. Human capital is the present value of future earnings for the labor force.
Produced capital. Produced capital is the value of machinery, equipment, and structures, as well as urban land.
Total wealth. Total wealth captures the sum of the produced capital, natural capital, human capital, and net foreign assets.
Sustainable Development Goals. In the European Union Action Plan and elsewhere, sustainable finance is seen as a tool to help achieve sustainability outcomes, such as the Sustainable Development Goals (SDGs). Investors and data providers note a push to map ESG risks to specific SDGs. As such, we have decided to see the relationship between sovereign ESG scores and the SDG Index published by the Sustainable Development Solutions Network and Bertelsmann Stiftung.
>>> Appendix C Supplementary Data Description

56 >>> EQUITABLE GROWTH, FINANCE & INSTITUTIONS INSIGHT
SDG Index. This index is the global index score quantifying a country’s level of progress toward achieving the 17 sustainable development goals.
There are also scores quantifying progress on each of the 17 goals, as well as underlying data. Future analysis may examine this index with greater granularity.
Environmental Indices. Given the focus of this report on the aggregate ESG scores and on the environmental scores, we wanted to look at the relationship with two often-cited environmental indices, and their high-level subindices. Both measure some concept of environmental risk and sustainability, and we wanted to see the relationship between these indices and the environmental scores. Future analysis may examine these indices with greater granularity.
Notre Dame Global Adaptation Initiative (ND-GAIN). The initiative promotes adaptation by identifying the places most vulnerable to the changing climate and identifying real-world solutions that can prevent these changes from becoming disasters. To help, ND-GAIN has developed the following indices.
• ND-GAIN Country Index. This index is the overarching score summarizing a country’s vulnerability to climate change and its readiness to address such change.
• ND-GAIN Vulnerability Index. This subindex summarizes a country’s vulnerability to climate change.
• ND-GAIN Readiness Index. This subindex summarizes a country’s readiness to address the challenges of climate change.
Environmental Performance Index (EPI). The EPI is produced in collaboration by Yale University and Columbia University. It uses 32 performance indicators across 11 issue categories to quantify national progress on environmental health and ecosystem vitality, and it can be used to gauge a country’s progress toward established environmental policy targets.
• EPI: This index is the overarching score measuring environmental performance.
• EPI Environmental Health Index. This subindex measures environmental health.
• EPI Ecosystem Vitality Index. This subindex measures ecosystem vitality.
> > >F I G U R E C . 1 Total wealth composition
Long=term prosperity and well-being
National income/GDP
Total wealth
Natural capitalProduced capital Human capital Net foreignassets
Machineryequipmentstructures
Urbanland
Energy and
minerals
Agriculturalland Forest Protected
areasMale/female
and employed/self-employed
Total assetstotal
liabilities
Source: Lange (2018), World Bank Wealth Accounts.

57>>>DEMYSTIFYING SOVEREIGN ESG
>>> Appendix D Key Tenets of ESG Providers MethodologiesFTSE Russell/Beyond Ratings. FTSE Russell bought Beyond Ratings in 2019. Beyond Ratings’ Sovereign Risk Monitor is divided between an economic-financial profile (50 percent), which measures traditional macroeconomic measures of sovereign risk, and a sustainability profile (50 percent), which aims to quantify environmental, social, and governance factors that are material to sovereign credit risk (Figure D.1). In this study, we use the sustainability profile as our aggregate ESG measure and the underlying E, S, and G measures for the pillar scores.
In 2020, FTSE Russell launched climate-adjusted versions of its World Government Bond Indices (WGBIs), which cover primarily developed market sovereign bonds. The indices are tilted using climate risk scores from Beyond Ratings.
ISS. ISS acquired Oekom Research AG’s ESG Country Ratings in 2018. Its standard of materiality balances financially material ESG risks with assessments of a country’s alignment with internationally accepted norms. It has the highest weight (50 percent) for environmental scores of any of the data providers included in the study. Given the significant data lags in the underlying data sources, ISS augments backward-looking hard data with forward-looking qualitative assessments (Figure D.2).
Although ISS has expanded to cover 121 countries and territories, they have only 55 countries overlapping with the common sample for the 2017 data year used for the study. As such, the correlation statistics reported for ISS are calculated separately using z-scores for the 55 overlapping countries, and ISS is not included in the principal component analysis or in the scatter matrices.
MSCI. MSCI ESG Government Ratings quantify a government’s ESG risk exposures and its ability to manage risks that are material to the long-term competitiveness and resilience of the country’s economy (Figure D.3). The ratings cover 198 countries and regions. MSCI is one of the largest ESG data providers.

58 >>> EQUITABLE GROWTH, FINANCE & INSTITUTIONS INSIGHT
> > >F I G U R E D . 1 FTSE Russell/Beyond Ratings Sovereign Risk Monitor Framework
Environmental
-Economic prosperity-Monetary policy-Fiscal policy-Budget balance-Credit quality-Credit gap-External balance sheet-Exchange
-Climate physical risk-Energy policy-Air & Water-Societal-Health-Emplyment-Corruption-Political stability-Regulatory quality
SocialGobernance
4Themes
Economic& financial
50%
Sustainability50%
3Themes
30%30%40%
Economic performanceFiscal flexibilityFinancial systemExternal performance
40%30/25%20/10%10/25%
Source: FTSE Russell/Beyond Ratings 2020.
> > >F I G U R E D . 2 ISS ESG Country Ratings Framework
• Land Use• Biodiversity• Water• Climate Change• Energy• Agriculture• Industry• Transport• Private Construction• And more
• Political System• Political Stability• Corruption and Money Laundering• Safeguarding of Civil and Political Rights• And more
• Health• Education and Comunication• Labor Rights and Working Conditions• Social Cohesion• And more
Environment Social
Performance Data on a Wide Range of ESG TopicsEvaluation based on qualitative and quantitative criteria
Governance
Source: ISS. Note: ESG = environmental, social, and governance.
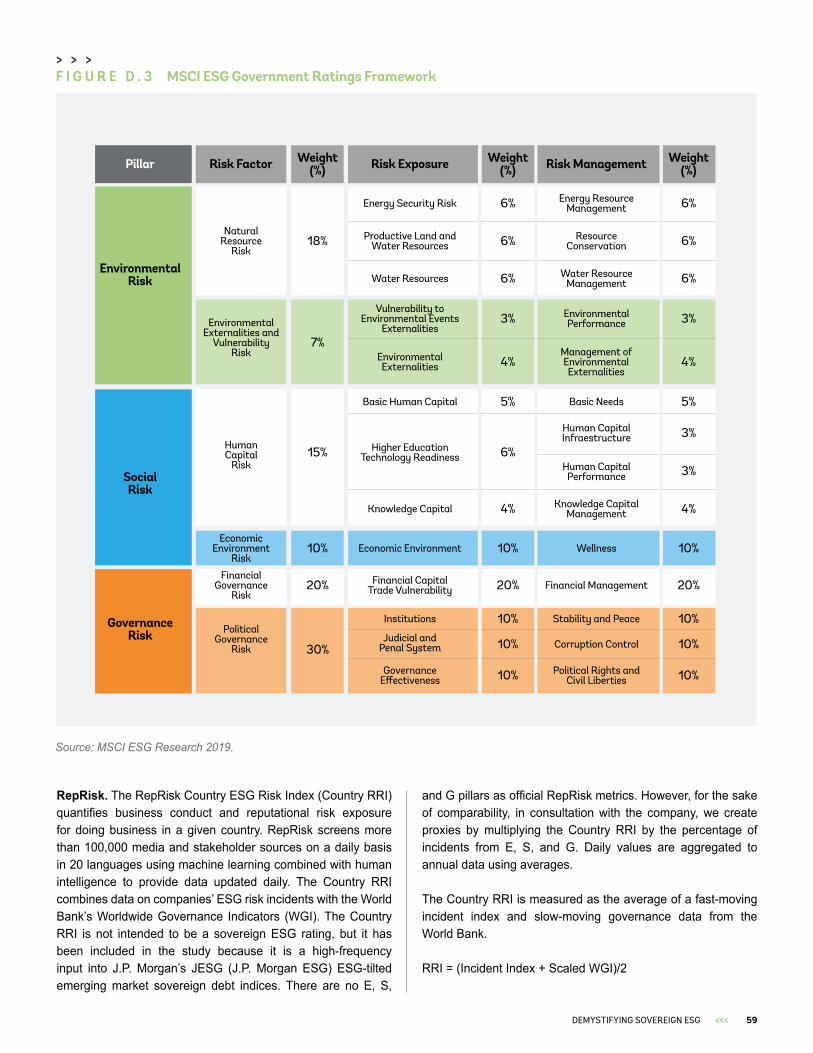
59>>>DEMYSTIFYING SOVEREIGN ESG
RepRisk. The RepRisk Country ESG Risk Index (Country RRI) quantifies business conduct and reputational risk exposure for doing business in a given country. RepRisk screens more than 100,000 media and stakeholder sources on a daily basis in 20 languages using machine learning combined with human intelligence to provide data updated daily. The Country RRI combines data on companies’ ESG risk incidents with the World Bank’s Worldwide Governance Indicators (WGI). The Country RRI is not intended to be a sovereign ESG rating, but it has been included in the study because it is a high-frequency input into J.P. Morgan’s JESG (J.P. Morgan ESG) ESG-tilted emerging market sovereign debt indices. There are no E, S,
and G pillars as official RepRisk metrics. However, for the sake of comparability, in consultation with the company, we create proxies by multiplying the Country RRI by the percentage of incidents from E, S, and G. Daily values are aggregated to annual data using averages.
The Country RRI is measured as the average of a fast-moving incident index and slow-moving governance data from the World Bank.
RRI = (Incident Index + Scaled WGI)/2
> > >
F I G U R E D . 3 MSCI ESG Government Ratings Framework
EnvironmentalRisk
SocialRisk
Pillar Risk Factor
NaturalResource
Risk
Energy Security Risk Energy ResourceManagement
ResourceConservation
Water ResourceManagement
EnvironmentalPerformance
Management ofEnvironmentalExternalities
Basic Needs
Human CapitalInfraestructure
Human CapitalPerformance
Knowledge CapitalManagement
Wellness
Financial Management
Stability and Peace
Corruption Control
Political Rights andCivil Liberties
Productive Land andWater Resources
Water Resources
Vulnerability toEnvironmental Events
Externalities
EnvironmentalExternalities
Basic Human Capital
Higher EducationTechnology Readiness
Knowledge Capital
Economic Environment
Financial CapitalTrade Vulnerability
Institutions
Judicial andPenal System
GovernanceEffectiveness
EnvironmentalExternalities and
VulnerabilityRisk
HumanCapital
Risk
EconomicEnvironment
Risk
FinancialGovernance
Risk
PoliticalGovernance
Risk
Risk Exposure Risk ManagementWeight(%)
18%
6%
6%
6%
3%
4%
5%
6%
4%
10%
10%
10%
10%
20%
6%
6%
6%
3%
4%
5%
3%
3%
4%
10%
10%
10%
10%
20%
7%
15%
10%
20%
30%
Weight(%)
Weight(%)
GovernanceRisk
Source: MSCI ESG Research 2019.
> > >

60 >>> EQUITABLE GROWTH, FINANCE & INSTITUTIONS INSIGHT
Where
• the Incident Index is based on the RepRisk ESG Risk Platform and is updated daily, and
• the Scaled WGI is based on the World Bank’s WGI, which are updated yearly.
Robeco. Robeco’s Country Sustainability Score quantifies how ESG factors can affect the long-term resilience and debt-servicing capacity of a country (Figure D.4). It is meant as a complement to traditional sovereign risk analysis. Robeco currently ranks 150 countries. Robeco sold its corporate ESG ratings business to S&P in 2020, but the country sustainability ratings were not part of that sale and remain with Robeco.
F I G U R E D . 4 Robeco Country Sustainability Ranking Framework
Indicator LevelFor each country, numerous data series on a varietyof ESG features are collected and summarized in 40indicators. Each indicator gets a predefined weightand a relative score arnging from 1 to 10.
•Environmental Performance ndex
•Climate Risk Index
•ND-GAIN Index
•Natural Environment
•Energy Trilemma Index
•World Risk Index
•Environmental Quality
•Environmental Pref. (5.0%)
•Environmental Risk (7.5%)
•Environmental Status (7.5%) Environmental (20%)
Governance (50%)
CountrySustainabilityScore
•Aging (7.5%)
•Human Capital (5.0%)
•Inequality (5.0%)
•Social Conditions (5.0%)
•Social Unrest (7.5%) Social (30%)
•Corruption (10.0%)
•Globalization & Innovation (5.0%)
•Institutions (10.0%)
•Personal Freedom (5.0%)
•Political Risk (10.0%)
•Political Stability (5.0%)
•Regulation &
Fin. Development (5.0%)
•Labor Force Participation Rate 55-64
•Retirement Age
•Health
•Gender Inequality Index
•Women, Business & Law Index
•Basic Human Needs
•Human Develotment Index
•Inclusiveness
World Happiness Ranking
Criteria LevelThe indicators are aggregatedto 15 criteria, whereby eachcriterion is also assigneda predefined weight.
Dimesion LevelEach dimension weightis the sum of the criteriaweight within therespective dimension.
CountrySustainability ScoreThe country score isthe weighted sumof all standardized indicator scores.
•Old-Age Dependency Ratio 2050
•Education
•Economic Inequality
•GNI Coefficient
•Children´s Rights in the Workplace
•Economic Decline & Poverty
•Safety & Security
•Corruption Perception Index
•Goal Innovation Index
•Rule of Law
•Human Rights
•Political Risk Rating
•Political Stability/No Violence
I•ndex of Economic Freedom
•Control ofCorruption
•Economic Globalization
•Government Effectiveness
•State Legitimacy
•Freedom in the World
•Voice & Accountability
•Political Risk Assessment
•External Intervention
•Financial Development Index
•Regulatory Quality
Source: Robeco 2020.Note: ESG = environment, social, and governance; Fin. = financial; Perf. = performance.
> > >

61>>>DEMYSTIFYING SOVEREIGN ESG
Sustainalytics. Sustainalytics’ Country Risk Ratings quantify an ESG-augmented conception of a country’s level of wealth and its ability to manage that wealth. The framework is based on the World Bank’s wealth accounting database. It measures natural and produced capital (environment), human capital (social), and institutional capital (governance). The management of these areas of national wealth are measured using indicators that attempt to quantify ESG trends, momentum (direction), and ESG-relevant events. They cover 172 countries and territories currently. Sustainalytics is owned by Morningstar. Sustainalytics’ Country Risk Ratings are used as an input into J.P. Morgan’s JESG ESG-tilted emerging market sovereign debt indices.
V.E. Previously known as Vigeo Eiris, V.E was bought by Moody’s and rebranded in 2020. V.E’s Sovereign Sustainability Ratings quantify a country’s efforts to achieve globally recognized sustainability standards (Box D.1). V.E measures this through commitment indicators and results indicators. Commitment indicators quantify a country’s commitment to the goals and principles of globally recognized conventions, treaties, and agreements related to sustainability goals. Results indicators attempt to quantify the effectiveness of a country’s sustainable development actions. V.E’s Sovereign Sustainability Ratings cover 180 countries and regions.
> > >
Source: Sustainalytics 2020.Note: ESG = environmental, social, and governance; m = meter.
F I G U R E D . 5 Sustainalytics Country Risk Ratings Framework
National Wealth
Risk to a country´s long term prosperity and economic development
Management of Wealth
Natural + ProducedCapital
Natural + ProducedCapital
Energyandclimatechange
BasicNeeds
InstitutionalStrength
Civil Conflict
Discrimination
Disease Outbreak
Environmental Pollution
Labour Rights
Natural Disaster
State Corruption and Fraud
State Repression
Transnational Conflict
Violent Crime
Rights andFreedoms
Peace andSecurity
Health and Well-Being
Equity andOpportunity
Resourceuse
Governance
ESGPerformace
ESGTrend
ESGEvents
HumanCapital
Human Capital(Social)
Performance and Trends
InstitutionalCapital
Institutional Capital(Governance) Events
•Energy Intensity
•Carbon Intensity
•Renewable energy
consumption
•Energy Imports
•Percent land below 5m
•Natural Disaster Risk
•Access to Water
•Access to Sanitation
•Food Security
•Access to Electricity
•Secondary Education
•Government
Effectiveness
•Regulatory Quality
•Rule and Law
•Corruption
•Ease of Doing Business
•Political Rights
•Civil Liberties
•Voice and
Accountability
•Political Stability
•Level of peace
•Life Expentancy at Birth
•Physicians per 1,000
Population
•Air Polution
•Gender Development
•Unemployment
•Percentage of Individuals
using the Internet
•Water Productivity
•Water Stress
•Habitat Protection
•Corruption
•Rule of Law

62 >>> EQUITABLE GROWTH, FINANCE & INSTITUTIONS INSIGHT
> > > B O X D . 1 V.E Sovereign Sustainability Ratings Framework
V.E’s Sovereign Sustainability Ratings balances two types of indicators:
• Commitment Indicators measure a country’s commitment to the goals and principles of globally recognized conventions, treaties, and agreements related to sustainability goals.
• Results Indicators measure the effectiveness of a country’s sustainable development actions.
The Four Levels of Analysis for V.E’s Sovereign Sustainability Ratings are as follows:
• 3 pillars (domains)• 17 themes (subdomains)• 56 criteria• 172 indicators (48 for environmental, 61 for social, and 63 for governance)
Source: V.E. 2020.> > >

63>>>DEMYSTIFYING SOVEREIGN ESG
Berg, Florian, Julian F. Kölbel, and Roberto Rigobon. 2019. “Aggregate Confusion: The Divergence of ESG Ratings.” MIT Sloan School Working Paper 5822-19, MIT Sloan School of Management, Massachusetts Institute of Technology, Cambridge, MA.
Berg, Florian, Julian F. Kölbel, and Roberto Rigobon. 2020. “Aggregate Confusion: The Divergence of ESG Ratings.” May 17 update of MIT Sloan School Working Paper 5822-19.
Boffo, Riccardo, and Robert Patalano. 2020. ESG Investing: Practices, Progress and Challenges Paris: OECD.
Boitreaud, Sebastien, Ekaterina Gratcheva, Bryan Gurhy, Cindy Paladines, and Andrius Skarnulis. 2020. “Riding the Wave: Navigating the ESG Landscape for Sovereign Debt Managers.” Working paper, World Bank Group, Washington, DC. https://documents.worldbank.org/en/publication/documents-reports/documentdetail/186931603441706045/riding-the-wave-navigating-the-esg-landscape-for-sovereign-debt-managers.
Bolton, Patrick, Morgan Despres, Luiz Awazu Pereira da Silva, Frédéric Samama, and Romain Svartzman. 2020. The Green Swan: Central Banking and Financial Stability in the Age of Climate Change Basel: Bank for International Settlements.
Bouyé, Eric, and Diane Menville. 2021. “The Convergence of Sovereign Environmental, Social and Governance Ratings.” Policy Research Working Paper 9583, World Bank, Washington, DC.
Cantor, Richard, and Frank Packer. 1996. “Determinants and Impact of Sovereign Credit Ratings.” FRBNY Economic Policy Review 2 (2): 18.
Capelle-Blancard, Gunther, Patricia Crifo, Marc-Arthur Diaye, Rim Oueghlissi, and Bert Scholtens. 2016. “Environmental, Social and Governance Performance and Sovereign Bond Spreads: An Empirical Analysis of OECD Countries.” EconomiX Working Papers 2017-7, University of Paris Nanterre. https://ideas.repec.org/p/drm/wpaper/2017-7.html.
Carney, Mark. 2015. “Breaking the Tragedy of the Horizon—Climate Change and Financial Stability.” Speech given at Lloyd’s of London, London, October 1.
Caron, Jim, and Teal Emery. 2019. “ESG and Sovereign Fixed Income Investing: A Better Way.” Sustainability Insight, Morgan Stanley Investment Management.
>>>References
64 >>> EQUITABLE GROWTH, FINANCE & INSTITUTIONS INSIGHT
CFA Institute. 2020. Future of Sustainability in Investment Management: From Ideas to Reality. Charlottesville, VA: CFA Institute.
Drempetic, Samuel, Christian Klein, and Bernhard Zwergel. 2020. “The Influence of Firm Size on the ESG Score: Corporate Sustainability Ratings Under Review.” Journal of Business Ethics 167 (1): 333–60.
Eccles, Robert G., and Judith C. Stroehle. 2018. “Exploring Social Origins in the Construction of ESG Measures.” Working Paper, Saïd Business School, University of Oxford, United Kingdom.
Escrig-Olmedo, Elena, María Fernández-Izquierdo, Idoya Ferrero-Ferrero, Juana Rivera-Lirio, and María Muñoz-Torres. 2019. “Rating the Raters: Evaluating How ESG Rating Agencies Integrate Sustainability Principles.” Sustainability 11 (3): 915.
Fitch Ratings. 2019. “What Investors Want to Know: ESG Relevance Scores for Sovereigns,” Fitch Ratings. https://www.fitchratings.com/research/sovereigns/what-investors-want-to-know-esg-relevance-scores-for-sovereigns-08-04-2019.
Foubert, Anne-Laure. 2020. ESG Data Market: No Stopping Its Rise Now. Optimas, March 9. http://www.opimas.com/research/547/detail/.
FTSE Russell/Beyond Ratings. 2020. Product Overview: Sovereign Risk Monitor—An Augmented Credit Risk Model. FTSE/Beyond Ratings, London.
GISD (Global Investors for Sustainable Development) Alliance. 2020. “Definition of Sustainable Development Investing.” GISD Alliance, United Nations, New York. https://www.gisdalliance.org/sites/default/files/2020-08/SDI%20Definition%20-%20Final%202020%2006%2004.pdf.
Gratcheva, Ekaterina, Bryan Gurhy, Teal Emery, and Dieter Wang. 2021. “A New Dawn—Rethinking Sovereign ESG.” EFI Insight-Finance, World Bank, Washington, DC.
Gratcheva, Ekaterina, Bryan Gurhy, and Dieter Wang. 2021. “1% Growth in Natural Capital: Why it Matters for Sovereign Bonds.” EFI Insight-Finance, World Bank, Washington, DC.
Grossman, Gene M., and Alan B. Krueger, 1991, Environmental Impacts of a North American Free Trade Agreement, National Bureau of Economic Research.
Herzog, Tim, R. Andres Casteneda Aguilar, Tony Fujs, Andrei Ilas, and Hiroko Maeda. 2020. “An Analysis of Coverage Gaps in Sovereign ESG Data.” White Paper, World Bank, Washington, DC.
ISS. 2020. ESG Country Rating: Methodology. ISS, Rockville, MD.
Kini, Dominic, Piran Phippen, and Jonathan White. 2020. “EM Sovereigns and ESG: ESG without Penalising the Poor.” Fixed Income Emerging Markets, HSBC Global Research.
Kling, Gerhard, Yuen C. Lo, Victor Murinde, and Ulrich Volz. 2018. “Climate Vulnerability and the Cost of Debt.” Working Paper, SOAS University of London. https://eprints.soas.ac.uk/26045/.
Lange, Glenn-Marie, James Cust, Grzegorz Peszko, Luis Diego Herrera Garcia, and Esther Naikal. Forthcoming. The Changing Wealth of Nations 2021: Managing Assets for the Future Washington, DC: World Bank.
Lange, Glenn-Marie, Quentin Wodon, and Kevin Carey, eds. 2018. The Changing Wealth of Nations 2018: Building a Sustainable Future Washington, DC: World Bank.
Maijoor, Steven. 2021. “ESMA Letter to EC on ESG Ratings,” European Securities and Markets Authority, Paris, January 28. https://www.esma.europa.eu/document/esma-letter-ec-esg-ratings.
Margaretic, Paula, and Sébastien Pouget. 2018. “Sovereign Bond Spreads and Extra-Financial Performance: An Empirical Analysis of Emerging Markets.” International Review of Economics and Finance 58: 340–55.
Moody’s. 2020. “General Principles for Assessing Environmental, Social and Governance Risks: Proposed Methodology Update.” Moody’s Investors Service, Moody’s, September 23.
MSCI. 2019. MSCI ESG Government Ratings: Methodology. MSCI ESG Research LLC, New York.
NGFS (Central Banks and Supervisors Network for Greening the Financial System). 2021. “Sustainable Finance Market Dynamics: An Overview.” NGFS Technical Document, NGFS, Paris, March. https://www.ngfs.net/sites/default/files/medias/documents/ngfs_report_sustainable_finance_market_dynamics.pdf.
Oganes, Luis, Jarrad K Linzie, Lydia Harvey, Rupert Rink, Katherine Marney, and Jessica Murray. 2021. Hurdles for EM Sovereign ESG Strategies. Emerging Markets Research, J.P. Morgan.
Robeco. 2020. Country ESG Assessment and Integration in Sovereign Debt: The Robeco Approach. Robeco, Rotterdam.

65>>>DEMYSTIFYING SOVEREIGN ESG
Robertson, Charles, and Vikram Lopez. 2018. “ESG in EM and FM—Really? Thoughts from a Renaissance Man.” Renaissance Capital (Cyprus), Nicosia, October 17.
Sarkodie, Streznov (2018) “Empirical study of the Environmental Kuznets curve and Environmental Sustainability curve hypothesis for Australia, China, Ghana and USA”. Journal of Cleaner Production.
SIFMA (Securities Industry and Financial Markets Association). 2019. 2019 Capital Markets Fact Book. New York: SIFMA.
V.E. 2020. “SSR Methodology: Executive Summary.” V.E., London.
Wang, Dieter. 2021. “Natural Capital and Sovereign Bonds.” Policy Research Working Paper 9606, World Bank, Washington, DC.
Wong, Christina, and Erika Petroy. 2020. Rate the Raters 2020: Investor Survey and Interview Results, SustainAbility Institute, ERM Company, London.
WWF (World Wildlife Fund) and World Bank. 2020. Spatial Finance: Challenges and Opportunities in a Changing World. Washington, DC: World Bank.
66 >>> EQUITABLE GROWTH, FINANCE & INSTITUTIONS INSIGHT
Other insights into sustainable finance you may be interested in
The Global Program on Sustainability (GPS) promotes the use of high-quality data and analysis on natural capital, ecosystem services, and sustainability to better
inform decisions made by governments, the private sector, and financial institutions.
Riding the Wave: Navigating the ESG Landscape for Sovereign Debt Managers. by S. Boitreaud, E. Gratcheva, B. Gurhy, C. Paladines and A. Skarnulis
Demystifying Sovereign ESG. by E. Gratcheva, T. Emery and D. Wang
A New Dawn - Rethinking Sovereign ESG. by E. Gratcheva, B. Gurhy, T. Emery and D. Wang
Credit Worthy: ESG Considerations in Sovereign Credit Ratings. by E. Gratcheva, B. Gurhy, F. Stewart, A. Skarnulis and D. Wang
1% Growth in Natural Capital: Why it Matters for Sovereign Bonds. by E. Gratcheva, B. Gurhy and D. Wang
Natural Allies: Wealth and Sovereign ESG, in: The Changing Wealth of Nations 2021: Managing Assets for the Future. by E. Gratcheva and D. Wang
Natural Capital and Sovereign Bonds. by D. Wang
Spatial Finance: Challenges and Opportunities in a Changing World by WWF and World Bank.
Find out more on http://worldbank.org/gps
Full-pageversion