Fouling of Ultrafiltration Membrane during Adsorption of Long Chain ...

DEMONSTRATION OF ULTRAFILTRATION AND CARBON ADSORPTIONFOR TREATMENT OF INDUSTRIAL LAUNDERING WASTEWATER
Final Report
by
Myles H. KleperRobert L. GoldsmithArye Z. Gollan
Walden Division of Abcor, Inc.Wilmington, Massachusetts 01887
Contract No. S-804367-01
Project OfficerRonald Turner
Industrial Pollution Control DivisionIndustrial Environmental Research Laboratory
Cincinnati, Ohio 45268
This study was conducted in cooperation with the
Institute of Industrial LaunderersWashington, D.C. 20036
INDUSTRIAL ENVIRONMENTAL RESEARCH LABORATORYOFFICE OF RESEARCH AND DEVELOPMENT
U.S. ENVIRONMENTAL PROTECTION AGENCYCINCINNATI, OHIO 45268

DISCLAIMER
This report has been reviewed by the Industrial Environmental ResearchLaboratory, U.S. Environmental Protection Agency, and approved forpublication. Approval does not signify that the contents necessarily reflectthe views and policies of the U.S. Environmental Protection Agency, nor doesmention of trade names or commercial products constitute endorsement orrecommendation for use.

FOREWORD
When energy and material resources are extracted, processed, converted,and used, the related pollutional impacts on our environment and even onour health often require that new and increasingly more efficient pollutioncontrol methods be used. The Industrial Environmental Research Laboratory -Cincinnati (IERL-Ci) assists in developing and demonstrating new and improvedmethodologies that will meet these needs both efficiently and economically.
The results of a research and demonstration project for treatingindustrial laundry wastewaters using ultrafiltration - activated carbontreatment processes are presented herein. The principal treatment step wasultrafiltration (UF). The UF process concentrates suspended solids and emul-sified oils while producing a high quality permeate stream. A portion of theUF permeate was then treated by activated carbon for removal of residualorganics and color. It is hoped that the results of this study will aidindustrial launderers and municipal treatment authorities in better under-standing the problems unique to this industry and will encourage furtherresearch in this area.
The Organic Chemicals and Products Branch of the Industrial PollutionControl Division Industrial Environmental Research Laboratory - Cincinnati45268 should be contacted for further information on this subject.
David G. StephenDirector
Industrial Environmental Research LaboratoryCincinnati

ABSTRACT
The treatment of industrial laundering wastewaters by ultrafiltration(UF) and activated carbon adsorption (ACA) has been investigated. Threeprogram tasks were performed:
Task 1: Pilot-scale testing at Abcor, Inc. facilities
Task 2: Pilot-scale testing at a field demonstration site
Task 3: Economic analysis of full-scale treatment systems.
All experiments were conducted with non-cellulosic spiral-wound UF modules.
This study of industrial laundry wastewater treatment by ultrafiltrationand activated carbon adsorption has indicated that a consistently highquality product water, potentially reusable within the laundry, can beproduced. The operation of the spiral-wound ultrafiltration modules was,however, hindered by the fouling tendency of the feed stream. Averagemodule permeate flux was therefore low. This factor, in turn, resulted inhigh capital and operating cost estimates for full-scale treatment systems.
Successful feasibility tests with industrial laundering effluents wereperformed with the spiral-wound modules during Task 1. Average flux levelsof 40-50 gal/ft2-day (125oF) and stable membrane performance were realized.Adsorption isotherms conducted with composite UF permeate samples indicatedthat carbon adsorption capacity for color bodies was quite good, whereasTOC adsorption was marginal.
In Task 2, field demonstration experiments with a 5000 gpd (nominalcapacity) treatment system were conducted. Initial tests identified theneed for prefiltration to prevent plugging of the spiral-wound modules bylint. A successful, but temporary and non-commercial, prefiltration stepwas developed for lint removal.
Subsequently, four 2-week demonstration tests were conducted. Althoughplugging by lint was eliminated, severe membrane surface fouling occurredand difficulty in recovering membrane flux using standard detergent cleaningprocedures was encountered. UF membrane flux at system conversions rangingfrom 67% to 99% averaged 14 gfd (135oF).
iv

A slip-stream of UF permeate was continuously passed through a 2-inchdiameter carbon column. Overall UF/ACA removal efficiencies were 99.2% forturbidity and 98% for oils and grease. Also, BOD, COD, and TOC removals were82%, 86%, and 82% respectively.
Capital and operating cost estimates for treatment systems employingspiral-wound UF modules are, based on the low permeate flux, understandablyhigh. For a 100,000 gpd treatment system (assuming 14 gfd flux and 98%water recovery), operating cost for the prefiltration and UF systems isestimated to be $9.01/1000 gal. Total carbon adsorption costs of $1.07/1000 gal could be offset by credits gained from reuse of the product waterwithin the laundry. Reuse of this product water was not demonstrated duringthis program.
This report was submitted in fulfillment of the original scope-of-workfor Grant No. S-804367-01 by the Walden Division of Abcor, Inc. under thesponsorship of the Institute of Industrial Launderers and the U.S. Environ-mental Protection Agency. The original grant was twice amended to includesampling and analysis for priority pollutants at industrial laundries and anassessment of sludge disposal alternatives for industrial launderies. Workon both of these amendments is ongoing and will be reported as addenda.This report covers the period from March 15, 1976 to March 14, 1977, and workwas completed as of April 8, 1977.

CONTENTS
vi

FIGURES
v i i

TABLES
viii

ix

ENGLISH-METRIC CONVERSION TABLE*
To Convert From To Multiply by
*The units most familiar to the projected readership of this reporthave been maintained.

ACKNOWLEDGMENTS
The efforts and dedication of Mr. Charles E. Humphrey, ResearchCoordinator of the Institute of Industrial Launderers, in maintaining programdirection and in providing technical assistance to the authors isacknowledged.
The technical guidance of Mr. Mervyn Sluizer, Jr., and Mr. Manfred Tidorof the Institute of Industrial Launderers, and Mr. Ron Turner of EPAthroughout the entire program is also gratefully acknowledged.
Roy F. Weston, Inc., as consultants to the Institute of IndustrialLaunderers, served in a review capacity for this program.
The authors thank the management and staff of all the industriallaundries that participated in this program and are particularly gratefulto the employees of Standard Uniform Rental Service, Dorchester,Massachusetts, for their helpfulness and support during the field demonstra-tion program.
Ms. Cheryl Renaud prepared the draft of this report and Ms. SharonCollins typed the final manuscript.
SECTION 1
INTRODUCTION
NATURE OF THE PROBLEM
Industrial laundries handle a variety of items, including uniforms,shop towels, printers towels, mops, mats and gloves. The wastewatersgenerated from the laundering of these items are of significant environmentalimpact in terms of both waste volume and contaminant loading. Althoughwastewaters from all laundry sources are reported to account for 5% to 10% ofmunicipal sewer discharges the portion of these wastewaters attributable toindustrial laundries is in the order to 0.5% (8). Industrial laundry waste-waters can be from 3 to 20 times higher in suspended solids and BOD thanaverage domestic sewage (1).
Representative wastewater contaminant data for a typical industriallaundry operation (1) are presented in Table 1, along with the sewer dis-charge limits set by the City of Chicago, where this plant is located. Inaddition to high suspended solids and BOD loadings, the levels of oil andgrease, lead, and mercury in the plant effluent are in excess of theMunicipal Discharge Standards. Other characteristics of industriallaundering effluents are:
-- both flow and composition are highly variable, overboth short-term (minutes to hours) and long-term(days to months) operations, and
-- the emulsions are very stable chemically.
It is apparent from these observations that this industry will require astable treatment system highly efficient in waste removal to meet sewerdischarge standards.
CURRENT TREATMENT
One of the most thoroughly investigated methods of treating commerciallaundry wastewaters consists of coagulation and flocculation followed bydissolved air flotation with polishing of the underflow by sand ordiatomaceous earth (DE) filtration and dewatering of the flotation scum byvacuum filtration (1). Though this sequence was found acceptable for

TABLE 1. LAUNDRY WATER CONTAMINANT LEVELS FOR ONE TYPICALPLANT AND ITS SEWER DISCHARGE STANDARDS (1)
*Surcharge assessed based on mass discharge above acceptable limitationand not concentration.
** Oil and Grease

uniform and linen laundry wastewater, it could not consistently produce aneffluent meeting municipal sewer standards when processing industrial laundrywastes.*
The ranges of removal efficiencies by the flotation portion of thetreatment system alone and the flotation/DE filter combination are given inTable 2 for industrial laundry wastewater processing. Although very goodquality water can be achieved by the dissolved air flotation/filtrationscheme, the inconsistency of this system in treating the highly variableindustrial laundering effluents is evident from these data. Therefore, evenwith this method of treatment, industrial launderers might periodically incurmunicipal sewer surcharges for suspended solids and BOD above those normallypresent in domestic sewage. Heavy metals may have to be removed completelyaccording to local ordinances and the capacity of municipal treatmentfacilities. Annual operating costs without these surcharges were estimatedat $2.70/1000 gal if chemicals were supplied in bulk.
A dissolved air flotation scheme employing an electrolytic process thatinvolves an electrocoagulation cell followed by an electro-flotation basinwas tested at an industrial laundry for 7 days (8 hours per day ) (2).Maximum suspended solids, BOD, and hexane extractible reductions of 92%,86%, and 94%, respectively, were observed. Though reported power andchemical costs for this system are low ($0.66/1000 gal) no estimation wasmade of the cost for operating labor. This cost could be quite highbecause of the constant variability of the waste. Waste equalization canpotentially lower the labor cost. A trade off must be made, however,between reduced operating costs and the high space requirement for holdingtanks.
TREATMENT APPROACH SELECTED FOR EVALUATION
The overall goal of this program was to develop an economically viablewastewater treatment system which could consistently produce an effluentmeeting municipal sewer discharge standards. The method of industrial laundrywastewater treatment investigated was ultrafiltration (UF) followed byactivated carbon adsorption (ACA). Ultrafiltration is the principal unitprocess. The UF system concentrates suspended solids and high-molecularweight solutes, producing two streams: a purified product water (permeate)and a concentrate. Typically, the concentrate volume is 1% to 5% of theinfluent volume. Further treatment of the UF permeate, principally forremoval of residual low molecular weight organics (i.e., dissolved detergent,dyes, and solvents), is achieved by adsorption on activated carbon.
As defined in reference (1), an industrial laundry washes mostly shoptowels, printers towels, and dust mops, which results in wastewatercontamination that is abnormally high compared to other laundry types.
3

TABLE 2. RANGES OF WASTE TREATMENT EFFICIENCIES FOR A CONVENTIONALINDUSTRIAL LAUNDRY WASTE TREATMENT SYSTEM (1)


A generalized flow schematic of this treatment process is given inFigure 1. Laundry wastes flow into a sump and are transferred through astrainer to the ultrafiltration system. The strainer removes coarse solidsand lint that could plug pumps, valves, and controllers. The strainedfeed stream is recirculated within the UF membrane loop. A small concentratestream is continually bled off, and a permeate stream, essentially free ofsuspended solids, is continuously produced. The permeate is passeddirectly into a column packed with granular activated carbon. The carbon-column effluent is potentially suitable for reuse within the laundry.
Features of the ultrafiltration/activated carbon treatment approach are:
Ultrafiltration is largely insensitive to waste shockloads. Since the bulk of the contaminant removal isin the ultrafiltration step, the overall process willbe shock insensitive.
No chemicals are added. This eliminates both chemicalcosts and chemical handling equipment. Also,operating and maintenance labor requirements associatedwith chemical addition are eliminated. Membrane systemswill operate successfully in the pH range 0.5 to 13and in-the presence of free chlorine (up to 50 ppm).
The effluent from the system will be essentially freeof suspended solids and will have a low organic content.With regard to these contaminants, a reusable water willbe available.
Dissolved inorganics will tend to build up in the systemto a steady state level. This will be established whenthe rate of addition of salts in makeup water, detergentformulations, and soiled articles equals the rate ofremoval in the ultrafiltration concentrate. It may bedesirable to reformulate detergents to have a lowerbuilder content and/or to demineralize the makeup water.
Heavy metals (except hexavalent chromium and mercury)may be efficiently removed in the ultrafiltrationstep. This is because the metals may be insolubilizedby reaction with anionic detergents and do not passthrough the ultrafiltration membrane.
There is no need to cool the waste before treatment. Thehotter the effluent the better the ultrafiltration systemwill perform at the temperature levels encountered inlaundry wastewaters. Temperature will have only aminimal effect on carbon adsorption efficiency. Thus theoverall process will conserve the sensible heat of thewater for reuse, providing a major process credit.
A total package system will be compact and easy to install.

SECTION 2
CONCLUSIONS
This study of industrial laundry wastewater treatment by ultrafiltrationand activated carbon adsorption has indicated that a consistently highquality product water, potentially reusable within the laundry, can beproduced. However, the performance of the spiral-wound ultrafiltrationmodules was unacceptable due to membrane fouling by oil and grease and theineffectiveness of standard membrane cleaning procedures. Average modulepermeate flux was therefore low. This factor, in turn, resulted in highcapital and operating cost estimates for full-scale treatment systems.
Specific conclusions reached during this program are:
1. Contaminant Removal Efficiencies
- The overall UF/ACA product water averaged <17 mg/lsuspended solids, 190 mg/l BOD, 353 mg/l COD, 123 mg/lTOC, and <9 mg/l total freon extractibles. An effluentof this quality indicates average removal efficienciesfor the treatment process of >96% for suspended solids, >97%for freon extractibles (oil and grease) and 82%, 86%, and 82%for BOD, COD, and TOC, respectively. An effluent of thisquality should be acceptable for discharge to municipalsewer systems. Based on local ordinances, a surchargemay be applied if the mass discharge of BOD andsuspended solids exceed acceptable limits.
- Metals removal by the UF/ACA process was, in general,calculated from the lower detection limit values of theassays. All metals of interest, except mercury, wereremoved to levels below those specified in the sewerordinances of the Metropolitan Sanitary District (MSD)of Greater Chicago.
2. Membrane Flux
- Severe membrane fouling by free oil occurred forthe three types of spiral-wound modules evaluated. Avariety of membrane cleaning techniques was largelyineffective in restoring membrane flux.
- Of the three spiral-wound module feed-side spacers andtwo UF membrane materials investigated, the bestperformance was obtained with Abcor, Inc. Type HFM

membranes in open-spacer spiral-wound modules. Forthese, average permeate flux was 14 gal/sq. ft.-day(gfd) [135oF] during eight weeks of tests at systemconversions of 67% to >99%. A flux level of thismagnitude is not economically acceptable for treatmentof industrial laundry wastewaters:
- It is doubtful if a spiral-wound membrane configurationcan withstand prolonged operation in an industriallaundry. A membrane configuration, which is lesssusceptible to fouling and more amenable to cleaning,e.g., tubular, is clearly required.
3. Estimated Process Costs
- Assuming stable performance could be achieved at anaverage flux of 14 gfd, spiral-wound UF system andpretreatment operating costs are estimated to rangefrom $11.82/1000 gal when processing 25,000 gpd to$9.01/1000 gal when processing 100,000 gpd.
- The activated carbon's adsorptive capacity for colorbodies is greater than its adsorptive capacity forTOC. Breakthrough curves developed for color indicatea carbon replacement cost of $0.85/1000 gal.

SECTION 3
RECOMMENDATIONS
On the basis of the knowledge gained during this program, the followingrecommendations for future work are offered:
- No further ultrafiltration work should be conductedwith spiral-wound membrane modules.
- The flux performance of tubular UF assemblies shouldbe evaluated to verify or amend the capital and operatingcost projections developed for the tubular configuration.If a flux rate of 40 gfd is assumed for tubular UFmodules rather than the 14 gfd observed for spiral-wound modules, estimated operating costs become $4.88,$2.82, and $2.57/1000 gal for treatment systems of25,000, 75,000, and 100,000 gpd, respectively. Forthe 100,000 gpd system, operating costs for tubularsystems are predicted to be $2.39/1000 gal because ofadvances in membrane technology expected in the next2 to 4 years.
- In conjunction with a tubular UF evaluation, an engineer-ing and economic survey of UF concentrate disposaloptions should be performed. For higher capacity UFsystems, concentrate disposal by contract hauling wascalculated to be as high as 17% of the UF systemoperating costs. Significant reductions in this costcould greatly enhance the economics of the entiretreatment system.
- Should tubular UF prove to be economically viable, thesuitability of the final UF/ACA product water for reusemust be evaluated.

SECTION 4
DISCUSSION OF UNIT PROCESSES
The purpose of this section is to set forth certain principles anddefinitions which will be used in subsequent sections. Many generalreferences are available which describe the relevant unit processes inmore detail.
ULTRAFILTRATION
Ultrafiltration and reverse osmosis (RO) are similar processes in thatboth employ a semipermeable membrane as the separating agent and pressureas the driving force to achieve separation. There are important differences,however, which lead to different applications, process conditions andequipment for each of the two processes. Although the approach in thisprogram is based on ultrafiltration, the differences between UF and RO arepresented in Table 3 to aid reader understanding of the subject matter.
In an ultrafiltration process a feed solution/suspension is introducedinto a membrane unit, where water and certain solutes pass through themembrane under an applied hydrostatic pressure. Solutes whose sizes aregreater than the pore size of the membrane and all suspended solids areretained and concentrated. The pore structure of the membrane thus actsas a molecular filter, passing smaller size solutes and retaining thelarger size solutes. The pore structure of this molecular filter is suchthat it does not become plugged because suspended solids are rejected atthe surface and do not penetrate the membrane.
For solutions which have no rejected species, such as water, the fluxthrough the membrane is given by:
where,
(1)

TABLE 3. DIFFERENCES BETWEEN REVERSE OSMOSIS AND ULTRAFILTRATION
Item Reverse Osmosis Ultrafiltration

No material from the process stream builds up on the membrane surface and,therefore, for water the flux is pressure dependent and flow independent.
When ultrafiltering solutions having high concentrations ofrejected material, the observed flux levels are much lower than the waterflux of the clean membrane. A gel layer develops and the followingequation applies:
(2)
For solutions with high concentrations of rejected materials, the flux ispressure independent (above ~10 psig) and flow dependent.
The removal efficiency, r, of a UF module for a given species isdefined by the relationship:
(3)
where Cf and Cp are the feed and permeate concentrations for a moduleoperated with significant water recovery.
COMMERCIALLY AVAILABLE ULTRAFILTRATION MEMBRANES AND MODULES
Industrial ultrafiltration membranes are classified by molecularweight cut-off, and are available from either cellulosic or non-cellulosicmaterials. The cellulosic membranes can be employed at pH 2.5 to 9, whilethe ranges for others vary. For example, Abcor, Inc.‘s non-cellulosic TypeHFD membrane has a pH tolerance range from 3 to 12 and can withstandoperating temperatures in excess of 165oF. This membrane is, however,sensitive to oxidation by free-chlorine. Abcor Inc.'s Type HFM non-cellulosic membrane can tolerate up to 50 ppm free-chlorine, has a pHrange of 0.5 to 12 and can operate at up to 185oF.

Four module configurations are available commercially to house theultrafiltration membranes. These are plate-and-frame, tubular, spiral-wound, and hollow-fine-fiber (tubeside feed) geometries. For treatment ofindustrial laundry wastes the tubular and spiral-wound geometries arejudged to be most suitable in terms of both process reliability and systemexpense.
A tubular membrane, as shown in Figure 2, consists of a porous tubularsupport with the membrane either cast in place, or inserted into thesupport tube. The feed solution is pumped through the tube; the concentrateis removed downstream; and the permeate passes through the membrane/porous support composite.
A spiral-wound module is shown in Figure 3. It consists of a largemembrane sheet(s) wound into a compact spiral configuration around a centralpermeate collector tube. The feed solution is passed over one side of thesheet, and the permeate is withdrawn from the other side.
Each module configuration has particular advantages and disadvantageswhich are summarized in Table 4. Tubular membranes are desirable in thatthey can process feeds containing high suspended solids with minimalpretreatment, and can be easily cleaned, either chemically or mechanically,if they become fouled. Spiral-wound modules are less expensive than tubularmodules in dollars/sq. ft of membrane area, generally have lower powerrequirements, and are more compact. Spiral-wound modules are, however,more susceptible to plugging and may be difficult to clean. Because of theirpotential cost savings, spiral-wound modules were chosen for testing inthis program.
TABLE 4. COMPARISON OF MEMBRANE CONFIGURATIONS OF INTERESTFOR INDUSTRIAL LAUNDRY WASTE TREATMENT SYSTEMS
Configuration Advantages Disadvantages
Tubular 1. easily cleaned chemically 1. high holding volumeor mechanically if required per unitmembranes become fouled. membrane area
2. can process dirty feeds 2. moderately expensivewith minimal pretreat- at presentment
3. individual tubes canbe replaced
Spiral-wound 1. compact-good membrane 1. susceptible to pluggingsurface to volume ratio by particulates
2. less expensive thantubular membranes
2. badly fouled membranesare difficult to clean


Three different types of spiral-wound modules are currently available. Thedifference between them is the spacer geometry employed on the feed flowchannel side. The module depicted in Figure 3 utilizes a Vexar spacer. TheVexar material is a 1 mm (nominal) turbulence promoting spacer. Corrugatedspacer material consists of 2 mm (nominal) corrugation. Open-spacer feedchannels have a 4 mm (nominal) mesh-like geometry similar to the Vexardesign.
Of the three spacer geometries, the narrow Vexar spacing is the mostsusceptible to plugging by suspended solids, while the open-spacer materialis the least susceptible to plugging. Should one passage within a Vexar oropen-spacer module become plugged, the feed solution can bypass that passageand little effective membrane area is lost. However, with corrugated spacermodules, once a feed channel becomes plugged the entire membrane area alongthat channel is lost.
One significant advantage of Vexar spacer modules over the corrugatedand open-spacer modules is their lower power requirement. Vexar modulesoperate with feed circulation rates of 10 to 20 gpm, while the other spiral-wound module types require 50 to 100 gpm circulation flow.
The three different type spacers produce different feed flow patternswithin a module thus influencing ultrafiltrate flux. Also, the width of thespacer material controls the membrane surface area per module. Forcommercial-scale modules (4-inch diameter x 36 inches long) the membranesurface area is 40 ± 2 sq. ft. for the Vexar spacer spirals, 34 ± 2 sq. ft.for the corrugated spacer spirals and 18 ± 2 sq. ft. for the open-spacerspirals.
SYSTEM DESIGNS FOR ULTRAFILTRATION EQUIPMENT
Three common ultrafiltration system designs are shown in Figure 4. Inthe batch concentration mode of operation (Figure 4a), the feed tank ischarged with waste only at the beginning of each concentration cycle.During operation the permeate is continuously withdrawn while the concentrateis recycled to the feed tank. As the run proceeds the volume of waste in thefeed tank decreases, and its concentrationwaste is sufficiently low, it is dischargedcharged to the feed tank. The degree of volby
increases. When the volume ofand a fresh batch of waste isumetric concentration is given
(4)
where Vo and Vp are the initial batch volume and the collected permeatevolume, respectively. The degree of volumetric concentration, Cv, isrelated to the overall water recovery, by the relationship
(5)

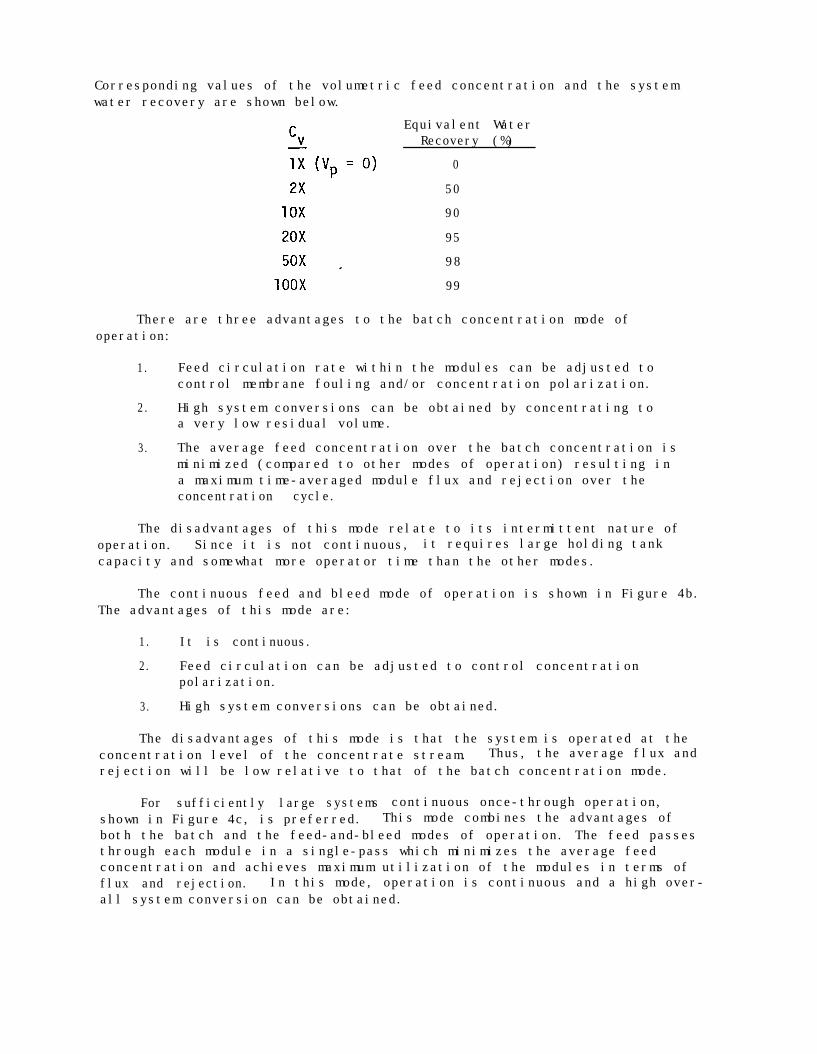
Corresponding values of the volumetric feed concentration and the systemwater recovery are shown below.
Equivalent WaterRecovery (%)
0
50
90
95
98
99
There are three advantages to the batch concentration mode ofoperation:
1. Feed circulation rate within the modules can be adjusted tocontrol membrane fouling and/or concentration polarization.
2. High system conversions can be obtained by concentrating toa very low residual volume.
3. The average feed concentration over the batch concentration isminimized (compared to other modes of operation) resulting ina maximum time-averaged module flux and rejection over theconcentration cycle.
The disadvantages of this mode relate to its intermittent nature ofoperation. Since it is not continuous, it requires large holding tankcapacity and somewhat more operator time than the other modes.
The continuous feed and bleed mode of operation is shown in Figure 4b.The advantages of this mode are:
1. It is continuous.
2. Feed circulation can be adjusted to control concentrationpolarization.
3. High system conversions can be obtained.
The disadvantages of this mode is that the system is operated at theconcentration level of the concentrate stream. Thus, the average flux andrejection will be low relative to that of the batch concentration mode.
For sufficiently large systems continuous once-through operation,shown in Figure 4c, is preferred. This mode combines the advantages ofboth the batch and the feed-and-bleed modes of operation. The feed passesthrough each module in a single-pass which minimizes the average feedconcentration and achieves maximum utilization of the modules in terms offlux and rejection. In this mode, operation is continuous and a high over-all system conversion can be obtained.

The preferred mode of operation for any given application may be amodified form of one of these three more common modes. The operating modeselection depends upon UF feed flow conditions, membrane flux, waterrecovery desired, membrane cleaning frequency, etc.
CARBON ADSORPTION
Adsorption by activated carbon is a surface phenomenon in whichdissolved organics are removed from wastewater and concentrated at the carbon-liquid interface. The degree of adsorption which occurs is a combinationof solute solubility in the wastewater and the strength of the attractiveforces between the solute and the carbon. The more hydrophilic the organic,the less likely it is to move toward the carbon-water interface. Thus,highly soluble organics tend to be poorly adsorbed by carbon; whereas lesssolute organics are more highly adsorbed.
Activated carbon is a highly porous material which is characterized bya typical surface area yield of 1000 m2/gram. Since adsorption is a surfacephenomenon, activated carbon has the potential (depending on the nature ofthe dissolved organics) to be a highly-effective, economical unit processfor improving water quality.
There are two important factors in the evaluation of carbon adsorption:the amount of organic adsorbed at equilibrium and the rate at whichequilibrium is attained. The equilibrium uptake is usually expressed by an"adsorption isotherm". The isotherm is a plot of the weight of organicadsorbed per unit weight of carbon (X/M) versus the organic concentration inthe waste (C) when equilibrium is established at a constant temperature.Three types of hypothetical isotherms are shown in Figure 5a. Type II is alinear isotherm over the region of interest. Type I is a favorable isothermsince the adsorptive capacity of the carbon remains high at low feedconcentrations. This results in lower carbon dosages for a given organicremoval. Type III is an unfavorable isotherm since uptake at a givenconcentration is low requiring a high carbon dosage for a given organicremoval.
A number of mathematical expressions have been proposed (3) to describethe shape of the isotherm. The most generally applicable expression is theFreundlich adsorption equation:
where,
X = amount of organic adsorbedM = weight of carbonk = constantn = constantC = concentration of unadsorbed organic in surrounding
solution at equilibrium
(6)


Restating this equation in logarithmic form,
(7)
A plot of X/M vs. C on logarithmic paper will yield a straight line withslope l/n if the Freundlich isotherm is followed.
Little progress has been made for liquid systems in predicting theisotherm from the properties of the carbon and organic. Therefore, iso-therms must be determined experimentally for each waste-carbon combination.The Freundlich expression given by Equations (6) and (7) is useful forcorrelating the experimental data.
In a practical system, the amount of contaminant removed may be limitedby the rate of adsorption, in addition to the equilibrium uptake. Thetransport of a dissolved organic molecule from the bulk solution to attach-ment at an adsorption site on the carbon can be broken into threeconsecutive steps:
-- diffusion through the liquid film surrounding thecarbon particle,
-- diffusion through the carbon pores to an availableadsorption site, and
-- adsorption.
In principle any of these sequential steps could limit the observed rateof adsorption. However, in practice, adsorption is very fast relative todiffusion. For fixed bed contractors operated at normal velocities, filmdiffusion is generally the rate limiting step (4).
The effect of adsorption rate on the performance of a carbon columnis to govern the shape of the breakthrough curve. The breakthrough curveis a plot of the concentration of contaminant in the column effluent as afunction of the volume of waste treated. Two hypothetical breakthroughcurves are shown in Figure 5b. The favorable Type A curve makes muchbetter use of the adsorptive capacity of the carbon before the quality ofthe effluent exceeds the maximum allowed concentration (Cmax). A sharpbreakthrough curve is obtained when the rates of film and pore diffusionare fast relative to the linear velocity of the waste through the column.Generalized correlations are available (5,6) for the prediction of theshape of the breakthrough curve. Factors influencing the shape include:linear velocity of the waste, diameter of carbon particles, film diffusioncoefficient, pore diffusion coefficient, and isotherm shape. For complexwastes, such as industrial laundry wastes, the breakthrough curve must bedetermined experimentally.

Both the adsorption rate and capacity of the carbon can be adverselyaffected by the presence of particulates in the feed. These tend to coatthe carbon particles reducing access to the internal porous structure.Therefore, pretreatment (usually by depth filtration) is required forsuspended solids removal.
For system capacities of interest to industrial launderers carbonregeneration would be performed off-site.

SECTION 5
PROGRAM OVERVIEW
The program for evaluating ultrafiltration and carbon adsorptiontreatment of industrial laundry wastewaters was divided into three programtasks:
Task 1: Pilot-scale Testing at Abcor, Inc.'s Facilities
Task 2: Pilot-scale Testing at a Field DemonstrationSite
Task 3: Economic Analysis of Full-scale TreatmentSystems
All UF experiments were performed with spiral-wound modules manufactured byAbcor, Inc. Carbon adsorption testing was conducted with Filtrasorb 400,a general purpose granular activated carbon, produced by Calgon Corporation.
In Task 1 three actual industrial laundry wastewaters, each from adifferent source and each representing a different strength industrial load,were processed by ultrafiltration modules at Abcor's pilot laboratory. Twomembrane types and two module feed-side spacers were evaluated to selectthe preferred membrane/module combination for field testing. Compositesamples of the ultrafiltrates were further treated with granular activatedcarbon in isotherm experiments.
The Task 2 field demonstration was conducted at Standard UniformRental Service, Dorchester, Massachusetts. The average wastewater fromthis plant was considered to be of a "light" to "medium" industrial loading.Initial work under Task 2 consisted of test system design, construction,installation, and shakedown testing. Several preliminary experiments andfour two-week concentration cycles were performed with the 5000 gpd(nominal) test system. A slip stream of UF permeate was continuously drawnoff and passed through a two-inch diameter column for ACA treatment.
Based on the results of the Task 2 studies, the economics of full-scale treatment systems were analyzed. This third program task developedcapital and operating cost estimates for industrial laundries discharging25,000, 75,000 and 100,000 gpd.

SECTION 6
TEST SYSTEMS, PROCEDURES, AND ANALYSES
ULTRAFILTRATION
Test System
The basic operation of the UF test system employed during the in-house tests is similar to that of the field demonstration test system;therefore, only the latter will be described. The field test system,including the carbon column, is shown schematically in Figure 6. Plantwastewater was collected in an existing sump and delivered to the UF feedtank (Tl) by a transfer pump. The suction line of the pump was connectedto a float and withdrew liquid from ~15 inches below the surface,minimizing free oil content in the feed. The transfer pump was equippedwith a low pressure switch and a bypass loop. A Y-strainer on the dis-charge line removed gross solids.
The plant wastewater was fed into the UF feed tank (Tl) assignalled by a high/low level switch mounted within the tank. The averagevolume in Tl was maintained at 75 gallons. A polyurethane foam partition,3 inches in thickness, was positioned vertically within the feed tank.This partition was not originally incorporated into the test unit; it wasdevised during preliminary testing when lint breakthrough to the UFmodules proved troublesome. Besides effectively trapping lint particleswithin its pore structure, it also served as an oil coalescer.
Feed was withdrawn from the side of Tl and passed by a booster pumpthrough one of two parallel 100 mesh stainless steel basket strainers.A differential pressure switch measured the pressure drop across thestrainer in use and indicated when the second strainer should be broughton-line and the first strainer cleaned. A check valve prevented any backpressure at the strainer outlet.
The feed entered the suction of a centrifugal circulation pump andwas delivered in parallel to the inlet of the two module housings. Thecirculation pump was equipped with a low pressure switch/alarm (LPS) toprotect it against running dry and a temperature indicator/alarm toprotect the system against excessive temperatures.


Each module housing was equipped with two spiral-wound UFcartridges in a series arrangement. The type of spiral-wound moduleswithin each housing is identified in the Results and Discussion Section.The feed flow through each housing was indicated and could be controlledby butterfly valves at the housing inlets and by a ball valve on the by-pass loop. Pressures before and after each housing were measured. Themain portion of the concentrated waste was returned to the suction of thecirculation pump while the remainder was bled from the system to maintainthe desired conversion. When very high conversions (i.e., very lowconcentrate bleed flows) were being investigated a timer controlled theoperation of a solenoid valve to maintain the proper concentrate dis-charge.
The UF permeate flow rate from each housing was measured before thepermeates were combined. The overall permeate pressure was indicatedand a flow totalizer on the permeate line recorded the cumulative volumeof permeate produced.
The UF permeate flowed into a 50 gallon surge tank (T2) which servedas the carbon column feed reservoir. The overflow from T2 was deliveredto holding tank T3 and pumped to the sewer.
A metering pump provided a constant feed flow through the carboncolumns which were operated in the upflow mode. The feed pressures atthe inlet and outlet of the carbon columns were measured. The carboneffluent flowed into a four gallon surge tank (T4) which also overflowedto T3.
Test Procedures
Task 1 Experiments--Task 1 in-house tests were conducted on samples (250 gallons each)
from the wastewater sumps of three different industrial laundries. Priorto discharge of wastewater on the day of sampling the waste collectionpits at each site were drained. Also, all accumulated sediment wasremoved from the pit before sampling at one of the three sampling sites("light" loading wastewater). The 250 gallon sample was returned toAbcor and pumped into a 500 gallon holding tank for next-day processing.
The wastewaters were processed in the batch concentration mode (i.e.,concentrate returned to the feed tank and permeate continuously withdrawn).The UF module pressure drop and the UF permeate flux vs. feed concentrationand time were monitored. Initial feed, final concentrate and compositepermeate samples were analyzed for a number of constituents (see below).
Operating conditions for these tests were:
Feed Circulation Rate
Open-Spacer Modules: 60-95 gpmCorrugated Spacer Modules: 45-90 gpm

Inlet Pressure: 45-50 psig
Feed Temperature: 125oF
Feed pH: Actual
Upon completion of each batch concentration experiment, proportionateamounts of UF permeate and concentrate were combined to provide a 5X feedfor total recycle processing by the UF system. A 5X feed volumetricconcentration (80% conversion) corresponds to the average feed concentrationwithin the membrane loop during an entire batch concentration to avolumetric feed concentration of 50X. In experiments of this type, boththe concentrate and permeate are returned to the feed tank. Thus, the feedconcentration remains the same throughout the test allowing permeate fluxto be monitored as a function of time. The total recycle tests wereconducted for ten day periods and feed and permeate samples were collectedon the first and tenth days.
Task 2 Experiments--Field experiments were conducted with the UF system operated in the
feed-and-bleed mode. The UF system was maintained at each of fourdifferent system conversions for a period of two weeks. System operationwas continuous, 24-hours/day.
At the start of each experiment, the UF feed tank was filled withlaundry waste and the system was started. Until the desired systemconversion was reached all concentrate was returned to the suction of thecirculation pump. When the concentration within the membrane loop reachedthe proper level, the concentrate bleed timer was engaged and concentratewas periodically ejected through a solenoid valve to drain. The amount ofconcentrate removed was controlled by the timer which was set in proportionto the total permeate flow, maintaining the proper system conversion.
Task 2 UF system operating conditions were:
Feed Circulation Rate
Open-Spacer Modules: 45-90 gpmCorrugated Spacer Modules: 55-75 gpmVexar Spacer Modules: 15-20 gpm
Inlet Pressure: 45-60 psig
Feed Temperature: 135oF
Feed pH: Actual
UF permeate flux and the standard operating data were monitored daily.During each 24-hour period composite samples of the feed, ultrafiltrate,and carbon effluent were collected using a metering pump. In addition, agrab sample of UF concentrate was taken each day. Corresponding dailysamples were combined to form a weekly composite sample for analysis.Additional assays were performed on "two-week" composites.
27

UF Membrane Cleaning--Various chemical formulations were employed during the UF membrane
detergent cleaning cycles. These formulations and the entire cleaningoperation are discussed in more detail in Section 7. A generalizedprocedure for cleaning the spiral-wound UF membranes is presented below.
1. The concentrated waste was drained from the system.
2. Clean water was passed through the system at a lowflowrate (~ 20 gpm) to flush out the residualconcentrate.
3. A l%, by weight, solution of Abcor, Inc.'s "Ultra-clean"was recirculated through the system for 30 minutesunder the following operating conditions:
Recirculation Flowrate: 20-25 gpm
Inlet Pressure: 20-25 psig
Temperature: 115-120°F
The "Ultra-clean" was dissolved in warm water thenadded to tap water being circulated through thesystem under the proper operating conditions.
4. Clean water was passed through the system for 20-30minutes at low flow and low pressure to flush out alltraces of the detergent.
5. The water flux of the clean membranes was determined.
CARBON ADSORPTION
Isotherm Procedures
The carbon adsorption isotherm tests were conducted using the followingprocedure.
1. “Filtrasorb 400 granular activated carbon was groundwith a mortar and pestle and sifted through a 335 meshscreen.
2.
3.
4.
5.
6.
Seven samples of dried carbon were weighted out:2 mg, 5 mg, 10 mg, 20 mg, 50 mg, 100 mg, and 500 mg.
Each sample of dried carbon was placed in a separateerlenmeyer flask.
100 (±1) ml of ultrafiltrate were added to eachflask.
The flasks were stoppered and placed on a BurrelWrist Action Shaker for 24-48 hours.
The flask contents were filtered through a 0.22 micronMillipore Filter, and the center portion of filtratewas collected for analysis.

7. The seven carbon treated samples, an original feedsample taken through all procedures except for carbonaddition, an original feed sample not taken throughthe isotherm procedures , and a high purity water sampleare analyzed. Isotherms were developed for both TOCand color.
Carbon Column Operation
A slip stream of UF permeate was continuously fed into a Z-inch diametercarbon column during the field demonstration tests. A flow diagram showingthe carbon column's operation is given in Figure 7. The column contained2400 grams of Filtrasorb 400 (Calgon Corp) granular activated carbon and hada residence time of 11.3 minutes. The column was operated in an upflow modeat a flowrate of 6.7 gpm/ft2 (480 cc/min). The carbon effluent flowed intoa 4-gallon surge tank from which a composite sample was continuously with-drawn. Excess liquid overflowed to drain.
ANALYSES
Table 5 lists the assays routinely performed during both the in-houseand field demonstration experiments. Also indicated are the methods employedduring each analysis. All assays, except mercury, were performed by Abcor'sAnalytical Laboratory. The mercury analyses were conducted by EnvironmentalResearch and Technology, Concord, Massachusetts.


TABLE 5. CHEMICAL ANALYSES ROUTINELY PERFORMED DURINGIN-HOUSE AND FIELD DEMONSTRATION EXPERIMENTS
Constituent Assay Method Reference
Alkalinity as CaC03
BOD
Cadmium
Chromium
COD
Color
Iron
Lead
Mercury
Nickel
pH
Suspended Solids
TOC
Total Freon Extractibles
Total Solids
Turbidity
Zinc
HCl Titration
5 Day Incubation, Electrode
Atomic Absorption
Atomic Absorption
Dichromate Reflux
Visual Comparison
Atomic Absorption
Atomic Absorption
Atomic Absorption
Atomic Absorption
Meter Reading
Glass Fiber Filtration
Combustion-Methane Detection
Separatory Funnel Extraction
Gravimetric
Meter Reading
Atomic Absorption
SM 403*
SM 507, 422F, 422B
SM 301A
SM 301A
SM 508; EPA, p. 21**
SM 204A
SM 301A
SM 301A
SM 301A VI
SM 301A
Manufacturer'sManual
SM 208D
EPA, p. 236
SM 502A, EPA, p. 229
SM 208A
SM 214A
SM 301A
*SM 403 (etc) refers to procedure number in "Standard Methods for theExamination of Water and Wastewater," 14th Edition, APHA, 1975.
**EPA refers to "Manual of Methods for Chemical Analysis of Water and Wastes,"U.S. EPA, 1974.

SECTION 7
RESULTS AND DISCUSSION
PILOT SCALE TESTING AT ABCOR INC.'S
Introduction
FACILITIES
The Task 1 tests were designed to determine whether spiral-wound UFprocessing of industrial laundry wastewaters is feasible, and if so, todetermine the preferred membrane type and module spacer. Each of the threelaundry wastewaters tested was of a different industrial strength and wasclassified by the Institute of Industrial Launderers as either a light,medium, or heavy industrial load.
Four membrane/spacer combinations were tested during these in-houseexperiments. These combinations are summarized below:
Membrane Type
Abcor, Inc. Type HFDAbcor, Inc. Type HFDAbcor, Inc. Type HFMAbcor, Inc. Type HFM
Spacer Configuration
CorrugatedOpen-SpacerCorrugatedOpen-Spacer
Vexar spacer modules were not tested since at this stage of the program itwas felt the very narrow channel Vexar spacer would be plugged by lint.
Washroom production schedules for the time periods during whichsampling occurred are given in Appendix A.
Ultrafiltration
UF Membrane Flux--
Average UF membrane flux levels during the batch pumpdown and totalrecycle experiments are given in Table 6 (the permeate flux vs. time curvesfor each test are presented in Figures Al through A6 in Appendix A). Thesedata indicate slightly better flux performance for the Type HFM membraneas opposed to the Type HFD membrane.


The final volumetric concentration achieved was limited by the samplesize and the dead volume of the UF system. For the three batch pumpdowns,with an average final concentration factor of 13.9X (92.8% water recovery)the HFM membrane modules averaged ~140 gfd (125
oF) and the HFD membranemodules averaged ~38 gfd (125
oF). During the total recycle experiments,however, the average flux levels were 37 gfd (125oF) for the HFM modules and27 gfd (125oF) for the HFD modules.
The duration of the total recycle experiments with the "light" and"heavy" loading waste streams was 10 days. The total recycle test with the"medium" loading wastewater was curtailed after two days due to a sharpdecline in the permeate flux for both modules. A review of membrane moduleperformance before this flux decline and during subsequent operations ispresented in Table 7. As the data of Table 7 indicate, the standard cleaningcycle with "Ultra-clean" recovered the flux for both membrane modules toacceptable levels following the batch pumpdown. When the low membrane fluxlevels were observed during this total recycle test, a second washing with"Ultra-clean" was performed, resulting in flux recoveries to 47 gfd (69% ofinitial flux) for the HFM module and 21 gfd (29% of initial flux) for theHFD module. These flux levels were not considered acceptable.
"Dishmate" (Calgon Corporation), a detergent containing free-available-chlorine, was used during the next cleaning cycle. Because of thesusceptibility of the HFD membrane to chemical attack by free chlorine, onlythe HFM membrane module could be cleaned with "Dishmate". The resultant HFMwater flux was 76 gfd (112% of initial flux). As discussed in the followingparagraph, the validity of this flux measurement is in question.
Since the HFD module remained fouled, a 10% kerosene in water mixturewas circulated through the modules. Little change in water flux occurredfor either membrane type. The flux for the HFM membrane module wasacceptable, and therefore, the extended recycle experiment was reinitiatedwith only the HFM open-spacer module. Upon system startup a leak wasdetected in the HFM module which caused feed to enter the permeate stream.Since it is not known precisely when this leak developed, the water fluxmeasurements for the HFM module following the last two cleaning cycles arequestionable.
The HFM module was removed from its housing, carefully cut open, andunwound. A coating of free oil was observed on the membrane surface. Theleak in the module occurred at the interior glue seam where the membraneand spacer material begin to wrap around the permeate collection tube. Thespacer material was inserted slightly askew during manufacture, placingexcess stress on the glue seam and causing it to fail. The module failurewas attributed entirely to this manufacturing defect.
ultrafiltratthe membrane
It is suspected that the flux decline observed with the "medium" loadingsample was related to the free oil found in this wastewater. As the
ion process proceeds, oil droplets may progressively adhere tosurface to form a water impervious coating. In a properly
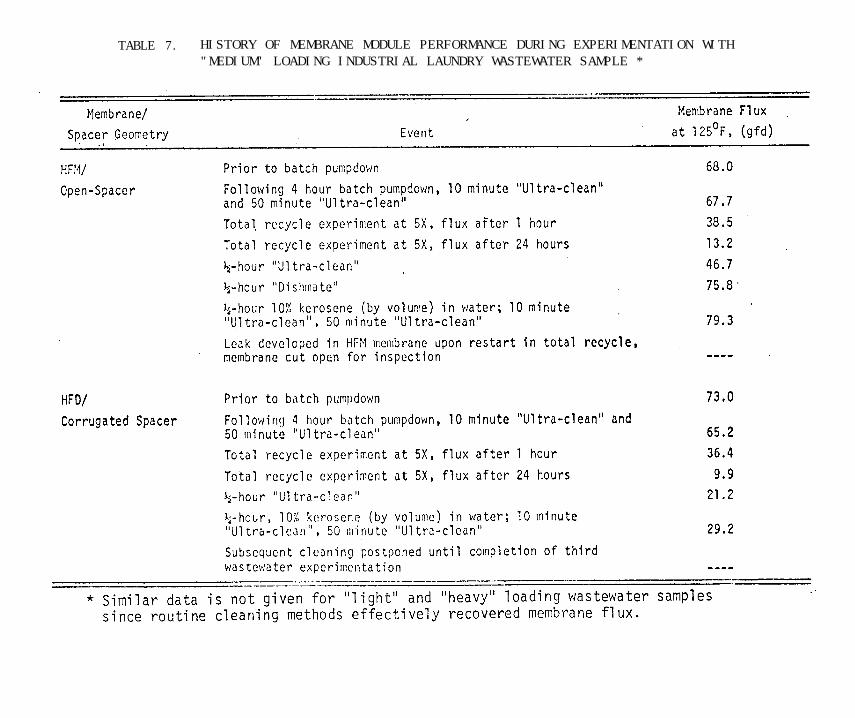
TABLE 7. HISTORY OF MEMBRANE MODULE PERFORMANCE DURING EXPERIMENTATION WITH"MEDIUM" LOADING INDUSTRIAL LAUNDRY WASTEWATER SAMPLE *

designed system, free oil droplets would be removed from the feed prior toits introduction to the membrane system. The treatment of the "light" and"medium" loading wastewater was performed without the inclusion of oilremoval in an attempt to eliminate the oil separation step. The severefouling encountered during the total recycle test with the "medium" loadingwastewater suggests that this would not be a preferred mode of operation.
The removal of free oil from industrial laundry wastewater can beaccomplished by a number of commercially available oil skimmers. In lieu ofan oil skimmer, testing with the "heavy" loading wastewater sample wasconducted in the following manner. The wastewater sample was pumped into the1500-gallon feed tank, and, one hour prior to processing by the UF system,was well-agitated for 15 minutes. Feed was drawn into a 55-gallon feed tankfrom the bottom of the 1500-gallon tank allowing free oil to remain floatingin the larger tank. The concentrate from the membrane loop was returned tothe 55-gallon tank, preventing any mixing of the free oil into the feedstream. Comparison of the flux data for this test with the previousexperiments (see Table 6) shows the advantage of free oil flotation (orskimming). The average flux for both membrane modules was 45-50 gfd (125oF)while processing the wastewater with the heaviest loading.
Module Pressure Drop--
The two types of spacer materials used in constructing the spiral-woundmodules tested during the Task 1 experiments create different feed flowpatterns within each module. Variations in the feed transport through themodules results in different pressure drops across each spiral and thussignificantly affects the UF system power requirement.
The power requirement for a UF system is determined almost entirely bythe power input to the feed circulation pump. This power input is directlyproportional to the product of the volumetric output of the pump and thepressure drop across the membrane system. Table 8 presents the projectedhorsepower requirements for each type of spiral-wound module evaluated fromthe data obtained during the batch pumpdown and the total recycle experimentswith each industrial laundry wastewater. The horsepower requirement permodule was higher for the corrugated spacer module during all experimentswith the exception of the "medium" loading batch pumpdown. For this test theopen-spacer and corrugated spacer modules had essentially identical horse-power requirements.
The horsepower requirement, per gallon of product per day, favors theuse of corrugated spacer modules because of their increased membrane surfacearea over open-spacer modules. The corrugated flow channels are, however,more susceptible to plugging than the open-spacer flow channels. Therefore,preference for one feed-side spacer geometry over the other was not clearlydemonstrated.


UF Membrane Flux Recovery--
The measurement of the flux of tap water through UF membranes, understandardized conditions, indicates the water transport properties of themembrane and is one means of detecting membrane degradation due to compaction,plugging, biological fouling and/or chemical attack. This measurement isalways performed after membrane cleaning. Except for the one instance ofsevere membrane fouling after exposure to free oil (the "medium" loadingwastewater test), reasonable membrane flux recoveries were obtained after upto 330 hours of accumulated exposure to industrial laundry wastewater. Thus,free oil must be removed prior to the ultrafiltration process so membranecleaning can be performed effectively using straight-forward, standardizedcleaning procedures.
UF Membrane Removal Efficiency--
Initial feed, composite permeate, and final concentrate samples weretaken during each batch pumpdown and analyzed for a wide range of contam-inants. The composite permeate analyses were made on a mixed sample of thetotal ultrafiltrate produced by both the HFD and HFM membranes. Detailedanalytical results for the "light", "medium", and "heavy' wastewaters arepresented in Tables A4, A5, and A6 of Appendix A. These results aresummarized, in terms of membrane removal efficiency, in Table 9.
Nearly complete removal of suspended solids and freon extractibles(i.e., oil and grease) was obtained for all three wastewaters Overallremoval efficiencies for BOD ranged from 66.5%-88%, averaging 80.6%.Composite permeate BOD analyses ranged from 360 mg/l for the "light"wastewater to 930 mg/l for the "heavy" loading sample. In all three cases,COD and TOC rejections of >80% were noted. It is thus apparent that asignificant contribution to the organic pollutant loading in industriallaundry wastewater is associated with suspended matter. Based on theindividual test results, the UF rejection of metals (and metallic compounds)generally ranged from >70 to 98% during the in-house experiments. Only therejection for mercury (20% for the "medium" loading waste and 11.1% forthe "heavy" loading sample) was low. The average mercury concentration inboth the initial feed and final composite permeate was, however, <O.OOl mg/l.
Rejection of dissolved solids is not characteristic of ultrafiltrationmembranes, and therefore, low removal efficiencies for dissolved solids andalkalinity are expected. Post treatment by carbon absorption can be employedto remove dissolved organic species.
Feed and individual permeate grab samples were also collected at thebeginning and end of the total recycle experiments. These data are presentedin Table 10. Due to the short duration of the "medium" loading wastewaterrecycle experiment, no samples were analyzed for this run.

TABLE 9. AVERAGE CONTAMINANT ANALYSES AND MEMBRANE REMOVAL EFFICIENCIESFOR UF BATCH CONCENTRATIONS OF "LIGHT," "MEDIUM," AND "HEAVY"LOADING INDUSTRIAL LAUNDRY WASTEWATERS
NOTE: See Appendix A for detailed data from each experiment.

As shown in Table 10, the permeate quality of the two membrane typeswas quite similar. For the "light" loading wastewater the average removalefficiency for total solids was 59% and for TOC, 84%. Ultrafiltration ofthe "heavy" loading wastewater resulted in average removal efficiencies overthe ten day period of 92% and 97% for total solids and TOC, respectively.
Carbon Adsorption
Equilibrium adsorption isotherms at 20°C were determined for each UFcomposite permeate for both TOC removal and color removal. Figure 8 presentsthe equilibrium isotherms for the "medium" loading industrial laundry waste.This figure is representative of the data obtained from all waste samples.The isotherms for the "light" and "heavy" loading wastes can be found inAppendix A. The points in most curves fall reasonably close (withinexperimental error) to straight lines indicating agreement with theFreundlich isotherm expression. Similar curves for TOC removal were obtainedin all cases. Likewise, the adsorptive capacity for color followed the sametrend for all three permeates.
The steep slope of the TOC isotherms indicates that as the TOC concen-tration decreases, the loading drops off very rapidly. For a two-folddecrease in concentration (see Figure 8) the adsorptive capacity of thecarbon decreased by over an order of magnitude. This indicates that the TOCcontent of the waste is composed of a small amount of strongly adsorbedmaterial and a larger amount of weakly adsorbed material. Isotherms of thisnature indicate that a rapid breakthrough of TOC will occur during processingof industrial laundry ultrafiltrates through a carbon column.
The adsorption isotherms for color removal exhibit much more gradualslopes than the TOC isotherms. This indicates that the carbon's adsorptivecapacity for color producing compounds remains high even as the color ofthe UF permeate becomes reduced.
For the "heavy" loading wastewater, an additional isotherm was performedto determine the effect of neutralization of the sample pH on the carbon'sadsorptive capacity. This isotherm is also presented in Appendix A. If asubstantial improvement in organic adsorption occurred, then a trade offstudy between pH adjustmentcosts and increased carbon efficiency would bewarranted. However, performing the adsorption isotherm test on a neutralizedindustrial laundry UF permeate (pH = 7.1) had little, if any, affect on thecarbon's adsorptive properties for either TOC or color.
From the above discussion, it appears that activated carbon treatmentof industrial laundry UF permeates will prove very beneficial in terms ofcolor removal, but will only marginally lower the TOC of the ultrafiltrate.
Task 1 Conclusions
Based on the Task 1 experimental results, the following conclusions canbe drawn relative to UF/activated carbon treatment of industrial launderingeffluents.

TABLE 10. CONTAMINANT ANALYSES DURING UF TOTAL RECYCLE EXPERIMENTATION

Figure 8. Equilibrium adsorption isotherms for TOC and color removalfrom "medium loading" industrial laundry waste UF permeate.

The Type HFM membrane is preferred over the HFDmembrane because of its higher flux level, itsgreater resistance to environmental attack, andits tolerance to free chlorine (for cleaningpurposes).
It appears from the limited test data that averageflux levels of 40-50 gfd (125oF) can be maintainedif the feed is pretreated for free oil removal.
Both membrane spacer types, corrugated and open-spacer, appear applicable for processing industriallaundry wastes. Field tests with both feed-sidechannel spacers will determine the preferred option.
Membrane rejection for suspended solids was >99%,and for freon extractibles, >98%. BOD, COD, andTOC rejections were typically >80%. Rejections forall metals except mercury generally ranged from>70-98%.
If free oil is removed from the feed prior to UFtreatment, the membrane flux should be recover-able by standard detergent formulation and cleaningprocedures.
Based on the projected power requirements for thespiral-wound modules, and a power cost of $O.O4/kw-hr,power costs of $0.25/1000 gal and $0.52/1000 gal arepredicted for operation of the corrugated and open-spacer modules, respectively. Power costs of themagnitude are considered acceptable for spiral-woundmodule UF systems.
Carbon adsorption treatment is technically feasiblefor color removal from the UF permeate; however, onlymarginal TOC removal is anticipated.
PRELIMINARY FIELD DEMONSTRATION EXPERIMENTS
Introduction
Four experiments were conducted at the field demonstration site priorto the initiation of the formal test program. These preliminary experimentsserved as shakedown runs for the UF/ACA system and were designed to obtaindata on a number of parameters:
effectiveness of pretreatment in preventing lintbreakthrough to the membrane system circulationloop;
membrane flux vs. time relationships at low (67%)and high (99%) conversions;

comparative flux levels for open-spacer and corrugatedspacer spiral-wound modules;
feasibility of employing Vexar spacer spiral-woundmodules;
contaminant removal efficiencies for UF membranesand activated carbon over an extended time period; and
effectiveness of establishing cleaning procedures inrecovering membrane water flux.
The results of these experiments and their implications for the formal testprogram are discussed below.
Ultrafiltration
UF Membrane Flux, Tests Pl and P2--
The first preliminary test (Pl) was conducted with the feed transferpump suction line inadvertently placed 15 inches from the bottom of the sumprather than 15 inches beneath the liquid surface. A 20 mesh Y-strainer waslocated on the discharge of the transfer pump and a wooden board was situatedin the UF feed tank to provide a quiescent region (-15 minute residence time)from which feed to the UF system was withdrawn. The feed was then screenedthrough 30 mesh basket strainers. Type HFM membrane corrugated spacer andopen-spacer modules were tested in parallel housings. Each housingcontained two membrane cartridges.
With a system conversion of 65-70% (~3X concentration factor) the fluxof the corrugated modules averaged 33 gfd (135oF), and the flux for theopen-spacer modules averaged 36 gfd (135oF). Although no severe membranefouling was observed, the test was concluded after four hours due to pluggingof the 30 mesh basket strainers with lint. The permeate flux vs. time curvefor this test is shown in Appendix B.
Prior to the second preliminary experiment (P2) the suction line fromthe sump was raised to the proper height. This action had little, if any,effect on the rate at which the basket strainers became plugged. The secondtest also had to be terminated early (after 5 hours operation) and, asevidenced by the reduced circulation flow through the modules during P2,plugging of the spiral-wound feed-side spacers was occurring. During Pl thefeed circulation rate was 70-75 gpm. In P2 this rate was reduced to 55-69gpm.
The open-spacer module flux was similar for Tests Pl and P2 until thefinal hour of operation, at which point it began to decline more rapidlyfor Test P2. For the corrugated module the permeate flux during P2 waslower than in the first test by as much as 50%. These losses in flux areprobably a result of the lower feed velocity through the cartridges, and inthe case of the corrugated module, loss of membrane exposure due to channelplugging. The flux curve for Test P2 is also given in Appendix B.
44.

Improved Pretreatment--*
System operation was clearly limited by the plugging of both basketstrainers and modules with lint particles and threads. To provide improvedlint removal a new tank partition, constructed of reticulated polyurethanefoam, was positioned in the center of the UF feed tank. The foam is highlyporous and had been shown during pilot studies on other programs (7) to bean effective depth filter. It was also anticipated that the foam partitionwould act as an oil coalescer. Once the foam becomes loaded with suspendedsolids and/or oil, it can be removed from the tank and regenerated (alimited number of times) by surface cleaning and squeezing.
Grab samples of the feed from the sump, the feed prior to the foampartition and the feed after the foam partition were analyzed for suspendedsolids content. These assays are shown below.
Feed Feed Prior to Feed AfterAssay from Sump Foam Partition Foam Partition
Suspended Solids (mg/l> 1940 2610 976
It is clear from these data that the foam acted mainly as a Surface filter,concentrating the suspended solids in the first portion of the tank.Regardless of the mechanism of filtration, the foam's potential forsuspended solids removal was evident.
A further demonstration of the effectiveness of lint removal by thefoam partition was the continuous operation of 100 mesh basket strainers inthe ultrafiltration system. With both strainers in line, overnight operationwas successfully achieved.
UF Membrane Flux, Tests P3 and P4--
After installing the foam partition, two more preliminary experimentswere performed. Run P3 began with testing of open-spacer modules at a 67%(3X concentration factor) system conversion; however, the conversionincreased during an unattended overnight shift. The average conversion overthe first 70 hours of Test P3 was determined from analytical data (see below)to be 97% (30X concentration factor). The 99% (100X) system conversion aimedfor during the final 100 hours of the test was determined by sample analysisto be from 99.5-99.8% (200-500X concentration factor). Variations in theconcentrate flow with time account for the discrepancies between the plannedand the actual system conversions.
The flux data for Test P3 are plotted in Figure 9. The open-spacer fluxthrough the first five hours declined from 35 to 22 gfd (135oF). At thispoint, the system was left unattended overnight and the feed concentrationwithin the loop increased beyond a 3X concentration factor. As a result ofthe increased concentration, the flux declined to 14 gfd (135oF). When thesystem conversion was corrected to 67% the flux returned to 22 gfd andremained stable for 20 hours.
* This pretreatment method was instituted for these pilot studies only. It isnot a commercially-available process. For full-scale spiral module opera-tion further investigation of pretreatment alternatives is necessary.
45


Two corrugated modules were operated in parallel with the open-spacermodules beginning at the start of the third day. The flux for bothmodule types declined steadily and continued to decline as the systemconversion was increased. As mentioned above, the conversion achievedinadvertently exceeded 99%.
With about two-thirds of the test completed, the open-spacer moduleswere replaced with a single Vexar module. The flux of this module declinedover three days to the level of the corrugated modules. The final processflux at 135oF and 99.5-99.8% conversion was about 5 gfd for each module type.
The fourth preliminary test was conducted to compare the Vexar andopen-spacer configurations. The laundry wastewater was concentrated to a100X concentration factor and then the UF system was operated in the feed-and-bleed mode to maintain this conversion. The flux for the open-spacermodule remained stable from 20 to 75 hours operating time; the flux for theVexar module constantly declined with time (see flux curve, Appendix B).The final flux levels were 20 gfd (135oF) for the open-spacer module and6 gfd (135oF) for the Vexar module.
UF Membrane Flux Recovery--
Recovery of the UF membrane water flux to acceptable levels was achievedfollowing each preliminary test; however, the cleaning procedure was, attimes, lengthy. Multiple detergent cleanings were always required, andfrequently, from 5 to 7 cleaning cycles had to be performed. A tabulation ofthe flux recovery data is given in Appendix B.
Module Pressure Drop--
The installation of the foam partition within the UF feed tank eliminatedthe plugging of the feed-side spacer channels of the UF modules with lint.No increase in pressure drop was observed across any of the module types,including Vexar.
The projected horsepower requirements for each module type arepresented in Table 11. Clearly the low flow rate required by a Vexar moduleenhances its power requirement relative to the corrugated and open-spacermodules. The higher membrane area per Vexar module (40 sq. ft. vs. 34 sq.ft. and 18 sq. ft. for the corrugated and open-spacer modules, respectively)makes its use even more economically attractive. The power cost forprocessing 20,000 gallons per day of laundry wastewater at a 67% conversionis roughly 6 times less for Vexar modules than corrugated modules, andnearly 13 times less for Vexar modules than open-spacer modules.
UF Membrane Rejection--
Twice during Test P3 samples of the feed (from the sump), the UFconcentrate and the UF permeate were analyzed. These samples were collectedon a continuous basis each day and then combined into either two-or four-day composite samples. The first series of samples was taken at a 97%
47

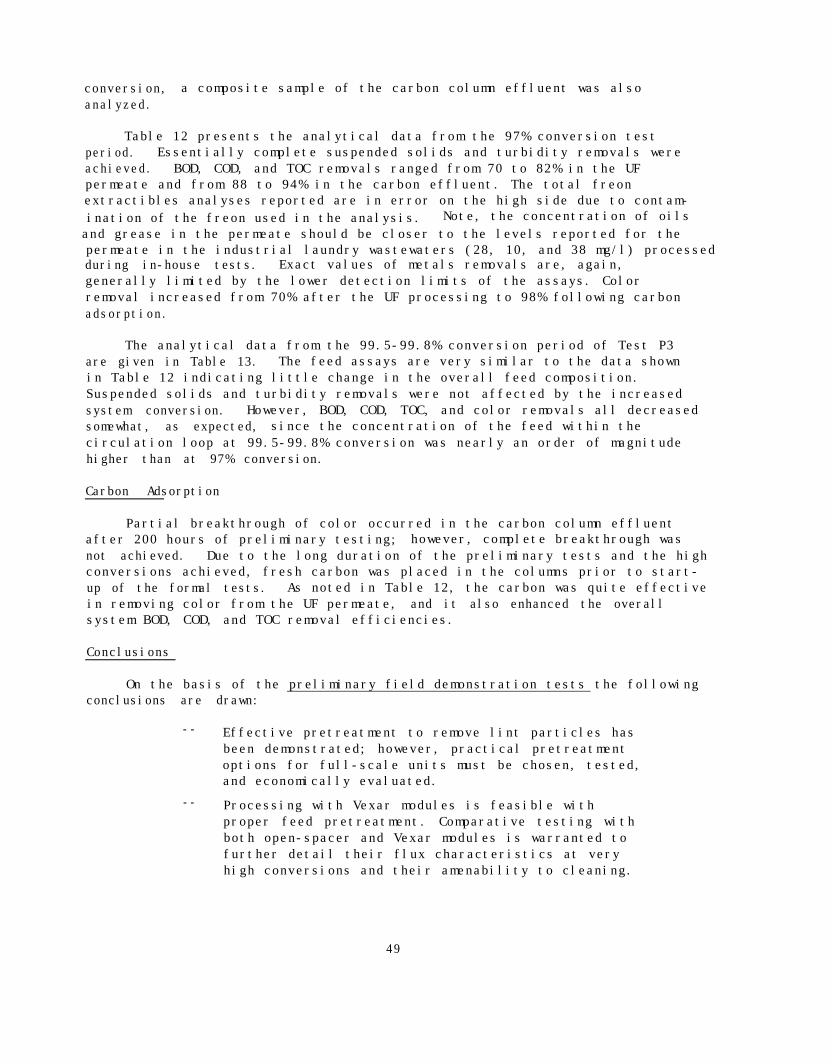
conversion, a composite sample of the carbon column effluent was alsoanalyzed.
Table 12 presents the analytical data from the 97% conversion testperiod. Essentially complete suspended solids and turbidity removals wereachieved. BOD, COD, and TOC removals ranged from 70 to 82% in the UFpermeate and from 88 to 94% in the carbon effluent. The total freonextractibles analyses reported are in error on the high side due to contam-ination of the freon used in the analysis. Note, the concentration of oils
and grease in the permeate should be closer to the levels reported for thepermeate in the industrial laundry wastewaters (28, 10, and 38 mg/l) processedduring in-house tests. Exact values of metals removals are, again,generally limited by the lower detection limits of the assays. Colorremoval increased from 70% after the UF processing to 98% following carbonadsorption.
The analytical data from the 99.5-99.8% conversion period of Test P3are given in Table 13. The feed assays are very similar to the data shownin Table 12 indicating little change in the overall feed composition.Suspended solids and turbidity removals were not affected by the increasedsystem conversion. However, BOD, COD, TOC, and color removals all decreasedsomewhat, as expected, since the concentration of the feed within thecirculation loop at 99.5-99.8% conversion was nearly an order of magnitudehigher than at 97% conversion.
Carbon Adsorption
Partial breakthrough of color occurred in the carbon column effluentafter 200 hours of preliminary testing; however, complete breakthrough wasnot achieved. Due to the long duration of the preliminary tests and the highconversions achieved, fresh carbon was placed in the columns prior to start-up of the formal tests. As noted in Table 12, the carbon was quite effectivein removing color from the UF permeate, and it also enhanced the overallsystem BOD, COD, and TOC removal efficiencies.
Conclusions
On the basis of the preliminary field demonstration tests the followingconclusions are drawn:
-- Effective pretreatment to remove lint particles hasbeen demonstrated; however, practical pretreatmentoptions for full-scale units must be chosen, tested,and economically evaluated.
-- Processing with Vexar modules is feasible withproper feed pretreatment. Comparative testing withboth open-spacer and Vexar modules is warranted tofurther detail their flux characteristics at veryhigh conversions and their amenability to cleaning.
49


Testing with corrugated modules is no longer warranted.Their operation is -limited to temperatures <l25oF, theyare not as compact as Vexar modules; and they are moredifficult to clean than the open-spacer modules.
Conversions as high as 99.8% (500X) can be achievedwith process flux levels ranging from 4-10 gfd (135oF).
At a conversion of 97% UF removal efficiencies of 70%for BOD, 80% for COD, and 82% for TOC can be expected.
Optimization of cleaning procedure; is a necessary stepbefore scale-up of the pilot unit.
FORMAL FIELD DEMONSTRATION PROGRAM
Introduction
The formal field demonstration program was designed to provide simulationof system conversions typical in a four-stage ultrafiltration system. Thesesystem conversions and their corresponding feed volumetric concentrationsare:
These system conversions were skewed toward the higher concentrations becauseperformance characteristics at these levels will have a major impact on theprocess economics. That is, if concentrations of 100X or higher could beachieved the costs associated with concentrate disposal would be greatlyreduced. Note that since most of the permeate will be produced by the firststages in a full-scale system, flux data for these stages are as critical asfor the latter stages in determining membrane area requirements.
By operating the UF pilot system in the feed-and-bleed mode, eachsystem conversion listed above was maintained for a two-week period, andbetween each test the membranes were chemically cleaned. Two open-spacermodules and two Vexar spacer modules, containing Type HFM membranes, wereevaluated simultaneously.
Ultrafiltration
UF Membrane Flux--
The UF permeate flux vs. time curves for the field demonstration testsconducted at 67%, 90%, 97%, and 99% conversion are presented in Figures 10,11, 12, and 13, respectively. Average flux levels are summarized below.
52


Average UF Permeate Flux (gfd @ 135oF)
The apparent inconsistencies in the trends for these data are readilyexplainable. First, the tests were conducted sequentially from highestconversion to lowest conversion. Therefore, a reduction in flux recoveryfollowing cleaning, or a gradual degradation of the membrane modules due toincreased exposure to industrial laundry wastes could adversely affect theflux in the latter (lower conversion) tests. Secondly, for the open spacermodules, the formation of a thin oil layer on the membrane surface during the90% conversion test limited the average permeate level to 8 gfd (135oF). Theoil film reduced the passage of water through the membrane, while permeatingoil (see below) into the product stream. The exact nature of this oil filmand why it had a greater affect on the open-spacer, rather than the Vexarmodules, has not been clearly defined.
A third factor influencing the average module flux levels is that afterthe 97% conversion experiment the water flux of the Vexar modules could notbe recovered. Thus, new Vexar spacer modules were installed in the test unitfor the 90% conversion experiment. While these new membranes exhibited highflux initially (see Figure 11), the flux curve has a steep slope throughoutthe first 175 hours of the test. At this point the permeate flux stabilizeswithin the 2-5 gfd (135oF) range. Once having been exposed to industriallaundry wastewater, as shown in Figure 10, the Vexar modules exhibit thesame magnitude of permeate flux (2-5 gfd) as observed in the higherconversion experiments.
With the exception of the sharp flux decline for the Vexar modulesduring the 90% conversion experiment, the spiral-wound modules exhibited verystable flux performance. The average values of the permeate flux were 14 gfdfor the open-spacer modules and 3 gfd (excluding the initial portion of the90% conversion test) for the Vexar spacer modules. The open-spacer moduleflux during the formal field tests was, however, substantially below theTask 1, in-house test values. Also, the flux levels for both the open-spacerand Vexar spacer modules were below what would be predicted from thepreliminary field tests. The reasons for these differences in membranemodule flux performance include:
The in-house tests were conducted with a limitedvolume of wastewater, and therefore, the membraneswere exposed to only a relatively low fixed levelof foulants.
The first two preliminary field tests had a totalduration of only 9 hours; therefore, no long-termfouling effects were observed.
57

All modules used in the first formal field test hadalready accumulated between 100 and 200 hoursexposure to the industrial laundry wastewater duringthe preliminary tests.
UF Membrane Flux Recovery--
Table 14 presents the UF membrane flux recovery data during all fielddemonstration tests. (The corrugated modules were eliminated from evaluationafter the preliminary testing and are not discussed below.) The same twoopen-spacer spiral-wound modules were used throughout the preliminary andformal test programs. They each accumulated over 1000 hours exposure toindustrial laundry wastes and typically recovered 70% of their initial waterflux after detergent cleaning. The final water flux for these modules was,however, only 53.5 gfd (135oF). As the tests proceeded, recovery of thewater flux became more difficult for these modules. After 4 hours exposureto the waste (Test Pl), two detergent cleaning cycles were required forsatisfactory flux recovery. After 169 hours accumulated exposure (followingall preliminary tests) 7 detergent cleaning cycles were required. Duringthe formal field testing the number of detergent washings required to recoverthe flux of the open-spacer modules increased progressively from 3 to 6.When the formal field tests began, a reducing agent for iron foulant removalwas added to the cleaning formulation. Although the extent of membrane ironfouling was not precisely determined, this change in the formulation of thecleaning solution was beneficial.
The Vexar spacer modules proved much more difficult to clean. In fact,following the second field test (533 hours cumulative exposure) the waterflux of the Vexar modules could only be recovered to 11.3 gfd (135oF). Thesemodules were discarded and new modules were installed in the test system.Following the final experiment (488 hours of exposure to the waste) the fluxfor these modules was recovered to only 17.6 gfd (135oF).
Clearly, the rate of irreversible flux decline for the Vexar modules isunacceptable. Also, the number of detergent cycles needed to clean the open-spacer modules or even partially clean the Vexar modules is excessive.Optimization of the module cleaning formulations and procedures is thereforerequired either before, or in conjunction with, any further testing ofspiral-wound modules for the treatment of industrial laundry wastes.
Preferred UF Module Spacer Geometry--
As discussed above, the flux of the open-spacer module averaged 14 gfd(135oF) while the flux for the Vexar spacer module averaged 3 gfd (135oF)throughout the formal field test program. Vexar modules contain 40 sq. ft.of active membrane area while open-spacer modules contain 18 sq. ft. ofactive membrane area. Daily module productivity is calculated by multiplyingsquare feet of membrane area in a given module type by the average moduleflux. Average module productivity, in terms of gallons per day is therefore252 gpd and 120 gpd for the open-spacer and Vexar configurations,respectively.
58


Power considerations for each are also based on the average module fluxlevels and active membrane areas just given. The theoretical horsepowerrequirements per gallon of product per day are 2.4 x 10⁻³ hp/gpd for open-spacer modules and 1.9 x 10⁻³ hp/gpd for Vexar modules. Thus, the powerrequirements for the two types of modules are much closer than observedduring the preliminary field tests (see Table 11). One reason that thesevalues are closer is that the Vexar module power was calculated with a feedflowrate of 20 gpm and a pressure drop of 20 psig. This circulation rateand its resulting pressure drop were used during the final two field tests inan effort to improve the Vexar module flux performance from that observed at15 gpm ( r P = 15 psig) circulation rate.
Another factor which must be considered before selecting the preferredmodule type is the relative response of the modules to cleaning. As notedabove, the open-spacer modules showed considerably greater flux recovery thanthe Vexar modules.
Therefore, with regard to process flux, daily module productivity, andflux recovery, the open-spacer module is preferred to the Vexar spacermodule. Since the power savings for the two module types are reasonablyclose in terms of hp/gpd, the open-spacer configuration is clearly preferred.
UF Membrane Removal Efficiency--
Tables 15 through 18 present the entire analytical data sets for thefour field demonstration tests. Any deviations from the standard samplingprocedures are noted in the footnotes to each table. Also, oil permeationthrough the membranes of the open-spacer modules resulted in abnormally lowremoval efficiencies for suspended solids and total freon extractibles duringthe 90% conversion test. With the exception of the data obtained during thatparticular test, the average UF removal efficiencies are:
The UF
Average UFAssay Removal Efficiency, %
Total SolidsSuspended SolidsDissolved SolidsBODCODTOCTurbidityTotal Freon Extractibles
process removed >95% of suspended solids, turbidity, and totalfreon extractibles. These values are somewhat lower than the correspondingTask 1 data. This suggests that although severe oil permeation wasexperienced in only one instance, minor oil permeation was a regularoccurrence. This was probably the result of small quantities of free oilin the feed stream continuously adhering to the membrane surface anddiffusing through it. In a full-scale operation this problem can be elim-inated by installing a free-oil skimmer or coalescer upstream of theUF modules.
60


The range of BOD, COD, and TOC removal efficiencies - 76, 82, and 78%respectively - are consistent with previous results and indicate that nomembrane or module failures occurred. These values would, however, havebeen slightly improved if the free-oil had been completely eliminated fromthe feed stream. In terms of actual permeate quality, average BOD was302 mg/l; COD, 634,mg/l; and TOC 194,mg/l.
Mass balance calculations performed with the data presented in Tables 15through 18 indicate that the system conversion was not maintained at exactlythe desired level throughout each test. For example, during week #1 of the97% conversion test a system conversion of 96-98% (25-50X concentrationfactor) is indicated from the analytical data. For the second week of thistest, conversions of 80-94% (5-18X concentration factor) are indicated. Thelower conversion during the second week is attributed to a slight mismatchbetween total permeate flow and possible concentrate bleed settings. Thetimer-solenoid valve arrangement used for withdrawing a constant flowrate ofconcentrate was only adjustable in increments of 18 ml/min and thereforeprecise control at the desired conversion was not always attainable.
Carbon Adsorption
Carbon Removal Efficiency--
Throughout the four field demonstration experiments a slip-stream of UFpermeate was continuously fed to a 2-inch diameter carbon column. The assaysperformed on the carbon effluent composite samples are presented along withthe initial feed, UF concentrate and UF permeate analyses in Tables 15through 18. Table 19 condenses these data giving average values for the feed,UF permeate, carbon effluent and carbon removal efficiency based on the UFpermeate quality. Overall UF/ACA removal efficiencies are discussed in asubsequent section.
As observed in Table 19 the activated carbon reduced the UF permeate or-ganic loading and oxygen demand by -40%. Freon extractibles were decreased by
over 55%. All of these removal efficiencies are based on weekly or biweeklycomposite samples indicating that the activated carbon consistently improvedthe UF permeate quality.
Adsorptive Capacity of Carbon--
The adsorptive capacity (maximum loading) of a particular carbon columnfor a given contaminant is determined by measuring the volume of liquidprocessed before the concentration of that contaminant in the carbon columneffluent approaches or equals its concentration in the feed stream. Whenthese concentrations approach each other complete "breakthrough" is said tohave occurred. By analyzing periodic grab samples for TOC and color, break-through curves for these contaminants were developed for the field demon-stration tests.
65

TABLE 19. AVERAGE CARBON REMOVAL EFFICIENCY DATA(UF Permeate as Feed, Basis)

TWO sets of breakthrouqh curves were qenerated: One set was qeneratedduring the 67 and 90% conversion tests; the other, during the 97 and 99%conversion tests. These data are shown in Figures 14 and 15, respectively.New carbon was placed in the columns prior to the collection of each dataset. The average UF permeate color and TOC concentrations were 195 colorunits and 143 mg/l in one test compared to 750 color units and 213 mg/l TOCin the test at the higher UF system conversions. The substantial differencein average ultrafiltrate color concentration, while attributable in part tochanges in system conversion, may also be the result of variations in the mixof articles laundered.
For TOC, both curves indicate that the carbon effluent concentrationapproaches the UF permeate concentration at -2250 gallons processed. Afterthis point the concentration of TOC in the carbon effluent increased abovethe average UF permeate concentration in one case and returned to -50% of theaverage UF permeate concentration in the other. In the former instance, theincrease can be attributed to desorption of contaminants from the fullyloaded carbon. In the latter case, the low final TOC concentration may bethe result of biological activity within the column. Breakthrough after2250 gallons were processed through the column corresponds to a carbon re-placement cost of $1.32/1000 gal (at a carbon cost of 56¢/lb).
A lower carbon replacement cost may be indicated if column operation isdictated by effluent color concentration only. While color breakthroughoccurred at approximately the same time as TOC breakthrough in the test atthe higher UF system conversions, complete color breakthrough did not occurduring the test at the lower UF system conversions. At the time when theseUF tests were completed, 3234 gallons of ultrafiltrate had already beenprocessed through the carbon column. Since color breakthrough was in no wayindicated at this point (see Figure 14), a conservative estimate for thecarbon replacement frequency would be after the processing of 3500 gallonsthrough the 2-inch column. This corresponds to a carbon replacement cost of$0.85/1000 gallon.
Without performing similar tests on other laundry wastewaters, it isdifficult to assess the degree to which these costs are representative ofall industrial laundering operations. Furthermore, it is possible thatcarbon treatment of UF permeates for color removal may not be necessary forlaunderies which wash colored articles.
Overall UF/ACA Removal Efficiency
The overall contaminant removal efficiency of the ultrafiltration/activated carbon adsorption treatment combination was quite good. Thesedata were presented for the individual field tests in Tables 15 through 18and are summarized in Table 20. Turbidity removal averaged 99.2%, andsuspended solids removal, determined by the UF permeate concentration, was> 96.2%. Most of the suspended solids which did pass the UF process wereeliminated from the final effluent by the depth filter characteristics of thecarbon column. The average reduction in total freon extractibles was > 97.7%.Overall removal efficiencies for BOD, COD, and TOC averaged 82%, 86% and
82%, respectively.
67


TABLE 20. SUMMARY OF AVERAGE UF/ACA PRODUCT WATER QUALITY ANDREMOVAL EFFICIENCIES DURING FIELD DEMONSTRATION TESTS
70

Industrial laundries are typically surcharged by municipal treatmentauthorities on the mass of BOD and suspended, solids discharged. The minimumallowable discharge before a surcharge is assessed varies between localities;however, it is clear from these data that the UF/ACA process will eliminateor greatly reduce these charges. The effluent oil and grease level of<9 mg/l should satisfy all sewer discharge standards.
As discussed previously, the metals removal efficiencies for thecombined treatment process were generally limited by the lower detectionlimit of the assays. The MSD of Greater Chicago Sewer Discharge Standardswere easily met for all metals, except mercury. For mercury, an averageremoval efficiency of 41.5% was achieved with an average effluent concentra-tion of 0.001 mg/l. The MSD's standard for mercury, 0.005 mg/l, is quitelow. A survey of 20 municipal sewer discharge standards has indicated a rangeof 0.005 - 1.5 mg/l for the allowable concentration of mercury inindustrial effluents (1).
Conclusions
With the conclusion of the formal field demonstration experiments, theentire test program was completed. On the basis of these experiments,conclusions derived relative to UF/ACA treatment of industrial laundrywastewaters are:
-- Open-spacer, spiral-wound, UF modules are preferredto Vexar spacer modules since they offer higher permeateflux rates and higher daily productivities. Open-spacermodules are also more easily cleaned than Vexar modules.The small savings in power cost per gallon of product perday offered by Vexar modules is far outweighed by theopen-spacer modules' advantages.
-- Average permeate flux for the open-spacer modules was14 gfd (135oF); for the Vexar modules the average fluxwas 3 gfd (135oF). Flux levels of this magnitude arenot economically acceptable for treatment of industriallaundry wastewaters.
--
--
Free oil in the waste stream can seriously effect theperformance of the UF membranes. Both permeate fluxand permeate quality deteriorate rapidly if a free oillayer coats the membrane surface.
Optimization of UF module cleaning formulations andprocedures is required in conjunction with any furthertesting of spiral-wound modules for the treatment ofindustrial laundry wastewaters. In fact, it is doubtfulif a spiral-wound membrane configuration can withstandprolonged operation in an industrial laundry. A mem-brane configuration, which is less susceptible to foulinge.g., tubular, is clearly required.
71

-- The overall UF/ACA product water averaged <17 mg/l suspended solids, 190 mg/l BOD, 353 mg/l COD, 123 mg/lTOC, and <9 mg/l total freon extractibles. An effluentof this quality indicates average removal efficienciesfor the treatment process of >96% for suspended solids,>97% for freon extractibles and 82%, 86%, and 82% forBOD, COD, and TOC, respectively. An effluent of thisquality should be acceptable for discharge to municipalsewer systems. Based on local ordinances, a surchargemay be applied if the mass discharge of BOD and suspendedsolids exceed acceptable limits.
-- Metals removed by the UF/ACA process was, in general,calculated from the lower detection limit values of theassays. All metals of interest, except mercury, wereremoved to levels below those specified in the sewerordinances of the Metropolitan Sanitary District (MSD) ofgreater Chicago.
-- Activated carbon treatment improved UF permeate qualitysubstantially. Further reductions in the BOD, COD, andTOC of the wastewater averaged -40%.
-- The carbon's adsorptive capacity for color bodies isgreater than its adsorptive capacity for TOC. Break-through curves developed for color indicate a carbonreplacement cost of $0.85/1000 gal.
72

SECTION 8
ECONOMIC SCALE-UP ANALYSIS
INTRODUCTION
In this section purchased equipment (capital) costs and operating costsare projected for UF/ACA systems treating industrial laundry wastewaters.Cases are presented for launderies discharging 25,000, 75,000 and 100,000 gpdof waste.
A generalized flow schematic for the waste treatment system is shown inFigure 16. Two basic alternatives have been examined: waste treatment fordischarge to the sewer and waste treatment with water reuse. The latteralternative requires post-treatment of the UF permeate by carbon adsorptionand the installation of a large product water holding tank.
Figure 16 assumes a 100,000 gpd waste discharge. The waste is trans-ferred from the plant sump to a 75,000 gal surge tank. This surge capacitypermits 24 hour/day operation of the UF system even though the plant has an8 hour/day waste generation cycle. Waste pretreatment before the UF systemwill consist of three steps:
(1) Microstraining for lint removal (e.g. Swecovibrating screen or Bauer Hydrasieve).
(2) Skimming for free oil removal in the surgetank (e.g. rope skimmer).
(3) Filtration for additional suspended solidsremoval. The type of filter to be used hasnot yet been specified. This step requiresadditional investigation, the degree of whichwas not anticipated at the start of this program.
The ultrafiltration system costs are based on Abcor, Inc. Type HFMmembranes in open-spacer, spiral-wound modules. Since the average permeateflux was not strongly dependent on the system conversions, the use of asingle-stage rather than a multi-stage system is preferred.
Key design bases are outlined below:
73


PURCHASED EQUIPMENT COSTS FOR PRETREATMENT AND ULTRAFILTRATION SYSTEMS
Purchased equipment costs for the three system capacities are given inTable 21. The purchased equipment cost per gallon of wasted treated perday ranges from $4 to $4.65. The Table 21 costs are based on carbon steelsystems containing all necessary monitors and controllers for unattendedoperation, a temperature control loop, a product water turbidity monitorand a central control panel. These costs exclude costs for an activatedcarbon adsorption system, which is addressed separately in a subsequentsection. Also excluded is installation cost which will be highly sitespecific. If all utilities (power, water, and sewer connections, etc.) arein place, and no new facility must be constructed, installation costs mightbe as low as $25,000 to $50,000. If not, installation costs may be as highas 100% of the system cost. Installation costs must be calculated on anindividual, site-by-site basis.
ANNUAL OPERATING COST FOR PRETREATMENT AND ULTRAFILTRATION SYSTEMS
Table 22 contains operating cost projections for the three systemcapacities. These do not include capital-related costs such as amortization,interest, and taxes. Also, carbon adsorption operating costs and water reusecredits are addressed in a subsequent section. Details of the power costestimates are given in Table 23. All UF system costs are based on systemoperation six days per week with system cleaning taking place on the seventhday. Pre-treatment system costs are based on operation six days per weekonly. The operating costs range from $11.82/1000 gal when processing25,000 gpd to $9.01/1000 gal when processing 100,000 gpd. These costs areclearly impractical and necessitate the evaluation of an alternative UFapproach, presented at the end of this section, which is predicted tosignificantly lower the operating expenses.
PURCHASED EQUIPMENT AND ANNUAL OPERATING COSTS FOR ACTIVATED CARBONTREATMENT AND COMPLETE WATER REUSE
Pretreatment and ultrafiltration system costs have been discussed thusfar with the assumption that all UF permeate would be discharged to municipalsewers. However, it is possible that some, if not all, of the UF permeate
75

NOTES: 1. This cost analysis does not include installation costs which will vary considerably fromsite to site depending on availability of utility connections, space, etc.
2. This analysis assumes discharge of UF permeate to the sewer and therefore carbon adsorptionand product water storage costs are omitted.


TABLE 23. ESTIMATED POWER REQUIREMENTS FOR WASTEWATERTREATMENT SYSTEMS OF VARIOUS CAPACITIES

could be reused directly within a laundry which handles a minimum of whitearticles. Nevertheless, because of the questionability of UF permeatereuse, no projections of water reuse credits were made.
As water discharge standards become more stringent and if "closed-loop"treatment systems become mandatory, activated carbon treatment of the UFpermeate for color removal will be a logical continuation of the waste treat-ment sequence. It is anticipated that the additional capital investmentnecessary to meet any zero discharge limitation will depend largely on thenature of the effluent guidelines which may be promulgated for the industriallaunderers. These additional capital costs, associated annual operatingcosts, and water reuse credits are discussed below.
Estimated additional purchased equipment costs for complete water reuseare detailed in Table 24. A carbon adsorption system and a product waterstorage tank with a capacity equal to one day's discharge would be required.The carbon system costs are based on a projected carbon capacity of -3color units/mg carbon, an average removal of 500 color units per liter, anda bed service time of two months. The purchased equipment costs total$17,300 for the 25,000 gpd system, $40,800 for the 75,000 gpd system, and$51,000 for the 100,000 gpd system.
Operating costs for the carbon adsorption system are also given inTable 24. These costs range from $1.09 to $1.68/1000 gal of treated water.Carbon replacement costs account for 50% to 80% of these annual operatingexpense estimates.
Certain credits for water reuse within the laundry may be applied tothe annual system operating costs to arrive at a significantly reduced nettreatment cost. These credits are summarized in Table 25. The exact amountof credit possible for any particular industrial laundry depends upon thewater consumption and sewer use charges in the city where it is located.High, low, and average values of potential water reuse credits werecalculated using published data (1). The water reuse credits range from$0.55 to $2.8/1000 gal of water reused with an average credit of $1.08/1000gal of water. All of these estimated credits are based on charges pre-vailing in 1971. Charges for consumption for water have undoubtedly risenwhile sewer surcharges are now in effect in more areas. Therefore, thesefigures should be considered as conservative estimates of potential waterreuse savings. Even at the 1971 levels, however, these credits offset the cost of carbon adsorption treatment.
PROJECTED ECONOMICS FOR TUBULAR ULTRAFILTRATION SYSTEMS
Introduction
Two factors contributed most significantly to the capital and operatingcosts for open-spacer, spiral-wound-module, UF systems. First, the averageUF permeate flux was low (14 gfd) causinq membrane area requirements at any
ity to be high: Since UF system capital costs are calcu lated ongiven capac
79

TABLE 24. ESTIMATED ADDITIONAL PURCHASED EQUIPMENT AND OPERATINGCOSTS FOR COMPLETE WATER REUSE (Thousands of dollars)

TABLE 25. ESTIMATED ANNUAL CREDITS FOR REUSE OF TREATED WATER
81

a $/ft2 basis, these costs became quite substantial. Also, the more modulesin the system, the more pumping power required. As shown in Table 22, for a100,000 gpd treatment system power costs were >$89,00O/yr. A second factor,affecting operating expense only, is membrane life. The replacement cyclefor the spiral-wound modules is estimated to be one year. At a replacementcost of $20/ft2, this amounts to ~$143,00O/year for a 100,000 gpd system.Since only a modest improvement in the performance of spiral-wound modulescan be expected by changing the operating conditions, cost projections havebeen developed for an alternative UF module geometry, namely, tubularassemblies.
The tubular configuration, as discussed in Section 4, is preferredover the spiral-wound configuration from a technical standpoint: It iseasier to clean (either chemically or mechanically) and would not besusceptible to plugging by lint. The spiral-wound configuration was chosenfor this program since it was potentially a lower-cost geometry. However,for this particular application, the disadvantages of spiral-wound modulespredominate their cost advantage, and tubular systems are projected to bemore cost effective as discussed below.
Projected Purchased Equipment and Annual Operating Costsfor Tubular Ultrafiltration Systems
Cost estimates for tubular UF systems were developed for the threesystem capacities of interest. For each capacity two system options werecosted: The first option is based on typical current prices of tubular UFsystems from Abcor, Inc. and a projected membrane flux of 40 gfd; thesecond option is an optimistic case which assumes that improvements intubular membrane technology over the next 2-4,years will increase membraneflux (from 40 to 50 gfd), increase life (from 2 years to 3 years), reducesystem costs (from $65/ft2 to $45/ft2) and reduce membrane replacementcosts (from $15/ft2 to $10/ft2). All four sources of potential costreduction are considered realistic and achievable.
A summary of purchased equipment and annual operating costs fortubular UF systems is presented in Table 26. A breakdown of these costsand a listing of the design bases used in their calculation is given inAppendix C. Capital costs are ~50% lower for tubular UF systems usingcosts for current technology than for open-spacer, spiral-wound systems ofcomparable capacity. These costs range from $1.97 to $2.22 per gallon ofwaste treated per day. Future technological advances should reduce thesecosts to $1.31 to $1.62 per gallon of waste treated per day.
Estimated system operating costs are reduced from the $9 to $12/1000 galestimated for the spiral module systems to $2.6 to $5/1000 gal when currenttechnology UF is employed. For the 25,000 gpd treatment capacity today'scosts are $4.88/1000 gal. At this low capacity technological advances arenot predicted to keep pace with inflation and future costs become $5.18/1000gal. Treatment costs at the 75,000 gal capacity fall from $2.82/gal to$2.69/1000 gal as lower cost tubular UF systems are developed. The effect ofthese technological advances on the 100,000 gpd treatment system are tolower costs from $2.57 to $2.39/1000 gal.
82

TABLE 26. SUMMARY OF ESTIMATED CAPITAL AND OPERATING COSTS FOR WASTEWATERTREATMENT SYSTEMS EMPLOYING TUBULAR ULTRAFILTRATION MODULES

The tubular UF configuration will produce an effluent similar in qualityto the spiral-wound configuration since both configurations are availablewith Type HFM membranes; Since the treatment costs for the higher capacitytubular UF systems are competitive with the currently employed dissolved airflotation systems, tubular UF should be investigated for the treatment ofindustrial laundry wastes. Such an investigation would allow the costestimates presented herein to be revised on the basis of actual permeate fluxmeasurements.
8 4

REFERENCES
1, Douglas, Gary. "Modular Wastewater Treatment System Demonstrationfor the Textile Maintenance Industry". EPA-660/Z-73-037, January 1974.
2. Ramirez, Ernest. "LectroClear™ Treatment of Industrial LaunderingWastewaters". Swift Environmental Systems Company, November 20, 1975.
3. Thomas, J.M. and Thomas, W.S. Introduction to the Principles ofHeterogenous Catalysis. Academic Press, New York, p. 32 (1967).
4. Weber, W.J. Physiochemical Processes for Water Quality Control.Wiley-Interscience, New York, p. 213 (1972).
5. Vermeulen, T. "Separation by Adsorption Methods", in Advances inChemical Engineering, Vol. II, T.B. Drew and J.W. Hooper, eds.Academic Press, New York, p. 148 (1958).
6. Hiester, N.K., Vermeulen, T., and Klein, G. "Adsorption and IonExchange", in Chemical Engineers' Handbook, J.H. Perry, ed., 4th Ed.McGraw-Hill, New York, Section 16 (1963).
7. Walden Division of Abcor, Inc. Internal Report. February, 1976.
8. Sluizer, Mervyn Jr., Letter from Institute of Industrial Launderersto Office of Analyses and Evaluation (WH-586), EnvironmentalProtection Agency, Washington, D.C., May 16, 1977.
85


TABLE A4. CONTAMINANT ANALYSES AND MEMBRANE REMOVAL EFFICIENCIES FOR UFBATCH CONCENTRATION OF "LIGHT LOADING" INDUSTRIAL LAUNDRY WASTEWATER
89

TABLE A5. CONTAMINANT ANALYSES AND MEMBRANE REMOVAL EFFICIENCIES FOR UF BATCHCONCENTRATION OF "MEDIUM LOADING" INDUSTRIAL LAUNDRY WASTEWATER
90

TABLE A6. CONTAMINANT ANALYSES AND MEMBRANE REMOVAL EFFICIENCIES FOR UF BATCHCONCENTRATION OF "HEAVY LOADING" INDUSTRIAL LAUNDRY WASTEWATER


Figure A9. Equilibrium adsportion isotherm for TOC and color removalfrom "heavy loading" industrial laundry waste UF permeate,pH adjusted to 7.1.
100


![The use of ultrafiltration in enhancement of chemical coke ... · vated carbon adsorption [10,11]. The basic scheme of a coke oven wastewater treatment plant is presented in Fig.](https://static.fdocuments.net/doc/165x107/5e1bf34e932c67585c63c1aa/the-use-of-ultrafiltration-in-enhancement-of-chemical-coke-vated-carbon-adsorption.jpg)