Demonstration of Energy Savings in Commercial Buildings ...
72
(EW-201408) Demonstration of Energy Savings in Commercial Buildings for Tiered Trim and Respond Method in Resetting Static Pressure for VAV Systems March 2017 This document has been cleared for public release; Distribution Statement A
Transcript of Demonstration of Energy Savings in Commercial Buildings ...
(EW-201408)
Demonstration of Energy Savings in Commercial Buildings for Tiered Trim and Respond Method in Resetting Static Pressure for VAV Systems March 2017
This document has been cleared for public release; Distribution Statement A
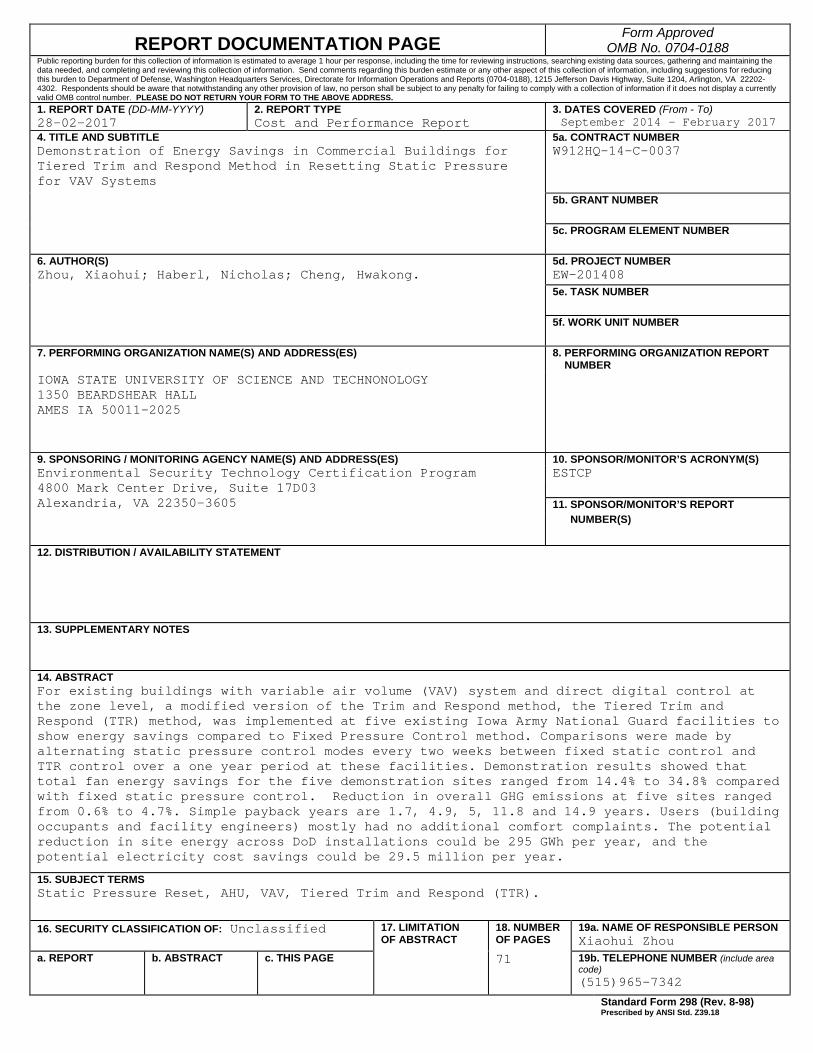
REPORT DOCUMENTATION PAGE Form Approved
OMB No. 0704-0188 Public reporting burden for this collection of information is estimated to average 1 hour per response, including the time for reviewing instructions, searching existing data sources, gathering and maintaining the data needed, and completing and reviewing this collection of information. Send comments regarding this burden estimate or any other aspect of this collection of information, including suggestions for reducing this burden to Department of Defense, Washington Headquarters Services, Directorate for Information Operations and Reports (0704-0188), 1215 Jefferson Davis Highway, Suite 1204, Arlington, VA 22202-4302. Respondents should be aware that notwithstanding any other provision of law, no person shall be subject to any penalty for failing to comply with a collection of information if it does not display a currently valid OMB control number. PLEASE DO NOT RETURN YOUR FORM TO THE ABOVE ADDRESS. 1. REPORT DATE (DD-MM-YYYY)28-02-2017
2. REPORT TYPECost and Performance Report
3. DATES COVERED (From - To)September 2014 – February 2017
4. TITLE AND SUBTITLEDemonstration of Energy Savings in Commercial Buildings for Tiered Trim and Respond Method in Resetting Static Pressure for VAV Systems
5a. CONTRACT NUMBER W912HQ-14-C-0037
5b. GRANT NUMBER
5c. PROGRAM ELEMENT NUMBER
6. AUTHOR(S)Zhou, Xiaohui; Haberl, Nicholas; Cheng, Hwakong.
5d. PROJECT NUMBER EW-201408 5e. TASK NUMBER
5f. WORK UNIT NUMBER
7. PERFORMING ORGANIZATION NAME(S) AND ADDRESS(ES)
8. PERFORMING ORGANIZATION REPORTNUMBER
IOWA STATE UNIVERSITY OF SCIENCE AND TECHNONOLOGY 1350 BEARDSHEAR HALL AMES IA 50011-2025
9. SPONSORING / MONITORING AGENCY NAME(S) AND ADDRESS(ES) 10. SPONSOR/MONITOR’S ACRONYM(S)Environmental Security Technology Certification Program 4800 Mark Center Drive, Suite 17D03 Alexandria, VA 22350-3605
ESTCP
11. SPONSOR/MONITOR’S REPORTNUMBER(S)
12. DISTRIBUTION / AVAILABILITY STATEMENT
13. SUPPLEMENTARY NOTES
14. ABSTRACTFor existing buildings with variable air volume (VAV) system and direct digital control at the zone level, a modified version of the Trim and Respond method, the Tiered Trim and Respond (TTR) method, was implemented at five existing Iowa Army National Guard facilities to show energy savings compared to Fixed Pressure Control method. Comparisons were made by alternating static pressure control modes every two weeks between fixed static control and TTR control over a one year period at these facilities. Demonstration results showed that total fan energy savings for the five demonstration sites ranged from 14.4% to 34.8% compared with fixed static pressure control. Reduction in overall GHG emissions at five sites ranged from 0.6% to 4.7%. Simple payback years are 1.7, 4.9, 5, 11.8 and 14.9 years. Users (building occupants and facility engineers) mostly had no additional comfort complaints. The potential reduction in site energy across DoD installations could be 295 GWh per year, and the potential electricity cost savings could be 29.5 million per year.
15. SUBJECT TERMSStatic Pressure Reset, AHU, VAV, Tiered Trim and Respond (TTR).
16. SECURITY CLASSIFICATION OF: Unclassified 17. LIMITATIONOF ABSTRACT
18. NUMBEROF PAGES
19a. NAME OF RESPONSIBLE PERSONXiaohui Zhou
a. REPORT b. ABSTRACT c. THIS PAGE 71 19b. TELEPHONE NUMBER (include area code)(515)965-7342 Standard Form 298 (Rev. 8-98)
Prescribed by ANSI Std. Z39.18

Page Intentionally Left Blank

This report was prepared under contract to the Department of Defense Environmental Security Technology Certification Program (ESTCP). The publication of this report does not indicate endorsement by the Department of Defense, nor should the contents be construed as reflecting the official policy or position of the Department of Defense. Reference herein to any specific commercial product, process, or service by trade name, trademark, manufacturer, or otherwise, does not necessarily constitute or imply its endorsement, recommendation, or favoring by the Department of Defense.

Page Intentionally Left Blank
i
COST & PERFORMANCE REPORT Project: EW-201408
TABLE OF CONTENTS
Page
EXECUTIVE SUMMARY ...................................................................................................... ES-1
1.0 INTRODUCTION ................................................................................................................. 1 1.1 BACKGROUND .......................................................................................................... 1 1.2 OBJECTIVE OF THE DEMONSTRATION ............................................................... 2 1.3 REGULATORY DRIVERS ......................................................................................... 3
2.0 TECHNOLOGY DESCRIPTION ......................................................................................... 5 2.1 TECHNOLOGY OVERVIEW ..................................................................................... 5 2.2 ADVANTAGES AND LIMITATIONS OF THE TECHNOLOGY .......................... 10
3.0 PERFORMANCE OBJECTIVES ....................................................................................... 13
4.0 FACILITY/SITE DESCRIPTION ....................................................................................... 17 4.1 FACILITY/SITE LOCATION AND OPERATIONS ................................................ 17 4.2 FACILITY/SITE CONDITIONS ............................................................................... 22
5.0 TEST DESIGN .................................................................................................................... 25 5.1 CONCEPTUAL TEST DESIGN ................................................................................ 25 5.2 BASELINE CHARACTERIZATION ........................................................................ 25 5.3 DESIGN AND LAYOUT OF TECHNOLOGY COMPONENTS ............................ 26 5.4 OPERATIONAL TESTING ....................................................................................... 26 5.5 SAMPLING PROTOCOL .......................................................................................... 28 5.6 SAMPLING RESULTS .............................................................................................. 28
6.0 PERFORMANCE ASSESSMENT ..................................................................................... 31 6.1 QUANTITATIVE PERFORMANCE ........................................................................ 31
6.1.1 Facility Energy Use ...................................................................................................... 31 6.1.2 Indirect Greenhouse Gas Emissions: ........................................................................... 32 6.1.3 System Economics: ...................................................................................................... 33
6.2 QUALITATIVE PERFORMANCE ........................................................................... 37 6.2.1 User Satisfaction .......................................................................................................... 37 6.2.2 Scalability across the Department of Defense: ............................................................ 38 6.2.3 AHU Fan Reset Strategy Technical Performance Comparison: .................................. 39
7.0 COST ASSESSMENT ......................................................................................................... 41 7.1 COST MODEL ........................................................................................................... 41 7.2 COST DRIVERS ........................................................................................................ 42 7.3 COST ANALYSIS AND COMPARISON ................................................................. 43
8.0 IMPLEMENTATION ISSUES ........................................................................................... 45

TABLE OF CONTENTS (Continued)
Page
ii
8.1 REGULATIONS AND PERMITS REQUIRED ........................................................ 45 8.2 PROCUREMENT ISSUES ........................................................................................ 45 8.3 COMMISSIONING ISSUES...................................................................................... 45
8.3.1 HVAC System Design Issues ...................................................................................... 46 8.3.2 Building Operation Issues ............................................................................................ 47 8.3.3 Mechanical and Control Hardware and Software Issues ............................................. 48
8.4 FACILITY ENGINEER TRAINING ......................................................................... 48 8.5 END-USER CONCERNS, RESERVATIONS, AND DECISION-MAKING
FACTORS................................................................................................................... 48 8.6 THE BEST DOD FIXED INSTALLATION APPLICATIONS ................................ 49
9.0 REFERENCES .................................................................................................................... 51
APPENDIX A POINTS OF CONTACT............................................................................... A-1
iii
LIST OF FIGURES
Page
Figure 1. A Typical Single-duct CAV System Schematic .............................................................. 5 Figure 2. A Typical Single-duct VAV System Schematic ............................................................. 6 Figure 3. A Sample Histogram of Total Air Flow at a Site ............................................................ 6 Figure 4. Ideal Pressure Reset Curve .............................................................................................. 7 Figure 5. Typical VAV Damper vs. Air Flow Characteristics ....................................................... 7 Figure 6. Static Pressure Reset Methods Flow Chart ..................................................................... 9 Figure 7. JFHQ.............................................................................................................................. 17 Figure 8. JFHQ Basic Building Information ................................................................................. 17 Figure 9. Muscatine AFRC ........................................................................................................... 18 Figure 10. Muscatine AFRC Basic Building Information ............................................................ 18 Figure 11. Waterloo Army Aviation Support Facility (AASF/ARMORY) ................................. 19 Figure 12. Waterloo AASF Basic Building Information .............................................................. 19 Figure 13. Boone Readiness Center .............................................................................................. 20 Figure 14. Boone Readiness Center Basic Building Information ................................................. 20 Figure 15. Des Moines MEPS ...................................................................................................... 21 Figure 16. Des Moines MEPS Basic Building Information ......................................................... 21 Figure 17. Site Maps for the Five Demonstration Sites ................................................................ 22 Figure 18. Demonstration Timeline .............................................................................................. 28 Figure 19. Fan Power Data Correction Illustration ....................................................................... 29
iv
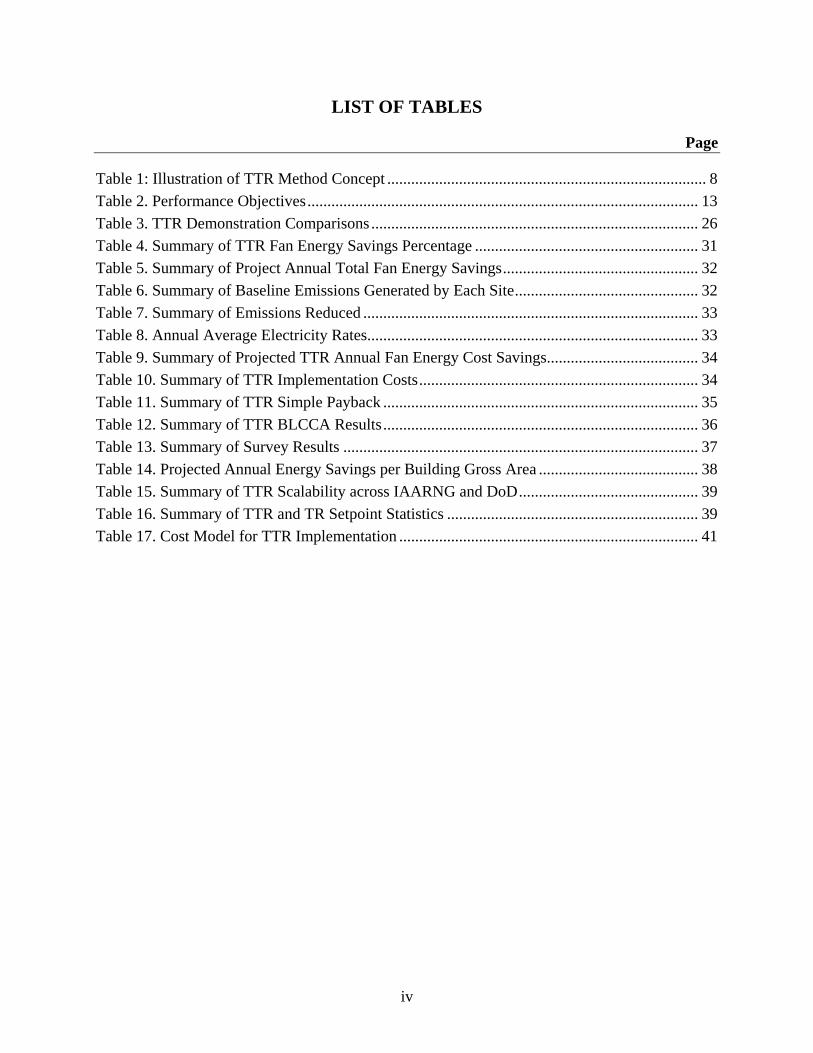
LIST OF TABLES
Page
Table 1: Illustration of TTR Method Concept ................................................................................ 8 Table 2. Performance Objectives .................................................................................................. 13 Table 3. TTR Demonstration Comparisons .................................................................................. 26 Table 4. Summary of TTR Fan Energy Savings Percentage ........................................................ 31 Table 5. Summary of Project Annual Total Fan Energy Savings ................................................. 32 Table 6. Summary of Baseline Emissions Generated by Each Site .............................................. 32 Table 7. Summary of Emissions Reduced .................................................................................... 33 Table 8. Annual Average Electricity Rates ................................................................................... 33 Table 9. Summary of Projected TTR Annual Fan Energy Cost Savings ...................................... 34 Table 10. Summary of TTR Implementation Costs ...................................................................... 34 Table 11. Summary of TTR Simple Payback ............................................................................... 35 Table 12. Summary of TTR BLCCA Results ............................................................................... 36 Table 13. Summary of Survey Results ......................................................................................... 37 Table 14. Projected Annual Energy Savings per Building Gross Area ........................................ 38 Table 15. Summary of TTR Scalability across IAARNG and DoD ............................................. 39 Table 16. Summary of TTR and TR Setpoint Statistics ............................................................... 39 Table 17. Cost Model for TTR Implementation ........................................................................... 41

v
ACRONYMS AND ABBREVIATIONS
AASF Army Aviation Support Facility AFRC Armed Forces Reserve Center AHU Air Handling Unit ANSI American National Standards Institute ASA Assistant Secretary of the Army ASHRAE American Society of Heating, Refrigeration, and Air-Conditioning
Engineers BLCC Building Life-Cycle Cost BRAC Base Realignment and Closure CAV Constant-Air-Volume CEC California Energy Commission CO2 Carbon Dioxide DDC Direct Digital Control DoD Department of Defense DOE Department of Energy eGRID Emissions & Generation Resource Integrated Database EO Executive Order ESTCP Environmental Security Technology Certification Program EUI Energy Use Intensity EW Energy and Water GHG Greenhouse Gas GWh Gigawatt hours IAARNG Iowa Army National Guard IE&E Installations, Energy & Environment IESNA Illuminating Engineering Society of North America HVAC Heating, Ventilation and Air Conditioning JFHQ Joint Forces Headquarters kBTU/ft2 One Thousand British Thermal Units Per Square Foot kWh Kilowatt Hour LEED Leadership in Energy & Environmental Design MEPS Military Entrance Processing Station MMBtu/ft2 One Million British Thermal Units Per Square Foot OAT Outside-Air Temperature
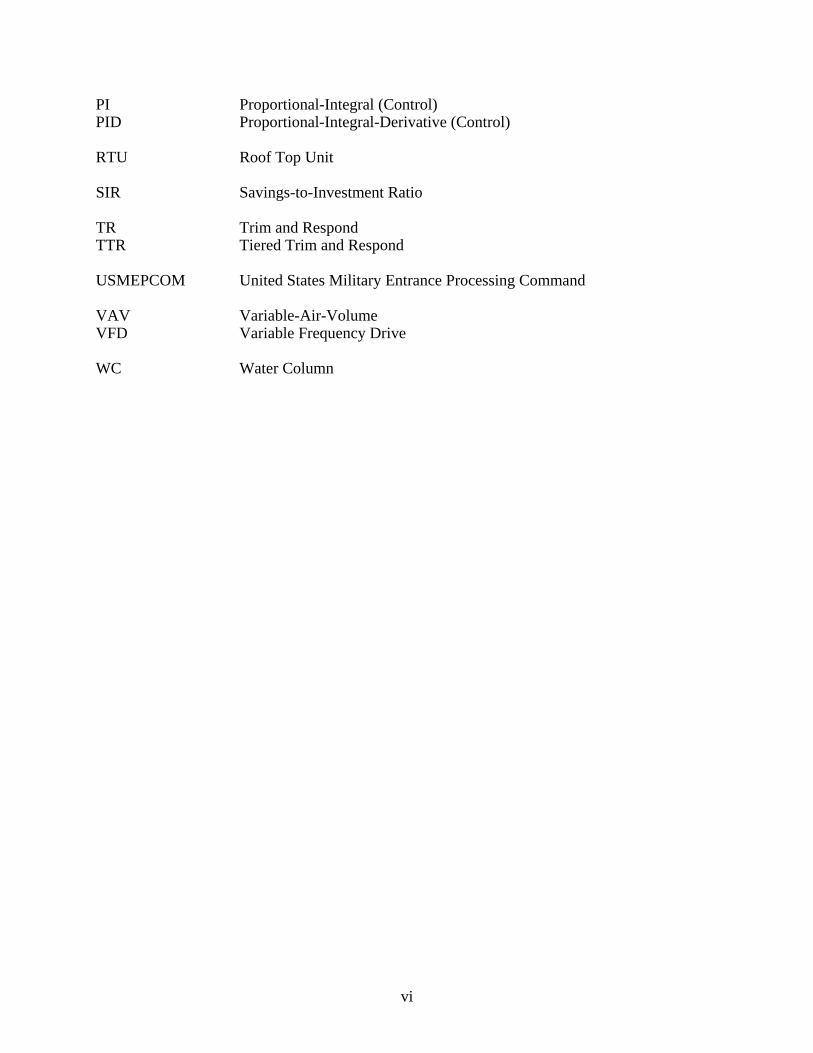
vi
PI Proportional-Integral (Control) PID Proportional-Integral-Derivative (Control) RTU Roof Top Unit SIR Savings-to-Investment Ratio TR Trim and Respond TTR Tiered Trim and Respond USMEPCOM United States Military Entrance Processing Command VAV Variable-Air-Volume VFD Variable Frequency Drive WC Water Column

vii
ACKNOWLEDGEMENTS
This work is supported by the U.S. Department of Defense (DoD) Environmental Security Technology Certification Program (ESTCP) program under Project Energy and Water [EW]-201408. The team would like to thank ESTCP Program Managers Dr. Jim Galvin and Mr. Timothy Tetreault for their leadership during the project. We are also thankful for the technical guidance and support provided by Peter Knowles and Scott Clark (HydroGeoLogic, Inc.), Sarah Medepalli and Stephanie Smith (Noblis), and Meredith McKinney (U.S. Army Corps of Engineers).
The following current or former team members contributed to this demonstration project:
Iowa Energy Center: Xiaohui Zhou, Scott Lochhead, Troy Barker, Keith Kutz, Britta Sandberg
Iowa State University: Nicholas Haberl, Yi Liu, Ganesh Krishnan Iowa Army National Guard: Kimberly Dickey, David Shea, Eric Challen, David Umland, Jeffrey
Heddens, Christopher Repp, Dan Jave Taylor Engineering: Steve Taylor, Brent Eubanks, Jeff Stein, Hwakong Cheng, Adam
Williams
The following local building controls contractors helped with custom control software programming and troubleshooting of Heating, Ventilation and Air Conditioning (HVAC) and control problems in this project:
Woodman Controls: Dave Wingert, Ryan Flaherty Johnson Controls: John Hamilton, Jason Perry Baker Group: Bill Ware Halvorson Trane: Michael Abbott, Keith Olberding, Steve Brimeyer
The following team members contributed to the writing of this report: Nicholas Haberl, Hwakong Cheng

viii
Page Intentionally Left Blank

ES-1
EXECUTIVE SUMMARY
Many existing Department of Defense (DoD) facilities nationwide operate their Heating, Ventilation and Air Conditioning (HVAC) systems at design static pressure setpoint meant to alleviate building loads during hot summer or cold winter days. However, these design loads are not present the majority of the time. By optimizing static pressure rise in HVAC systems, significant fan energy savings can be achieved. Recognizing this, American Society of Heating, Refrigeration, and Air-Conditioning Engineers (ASHRAE) has moved forward in requiring the supply air static pressure setpoint be reset at the zone level in new buildings to satisfy the most critical zone. The reset can be accomplished through custom building control software programming, and the state-of-art algorithm is the trim and respond (TR) method. A modified version of the TR method, the tiered trim and respond (TTR) method, has shown promise in reducing air handling unit (AHU) fan energy use while maintaining steadier static pressure control in a lab study and a University campus building pilot study. For this demonstration, the TTR method was implemented at five existing Iowa Army National Guard (IAARNG) facilities to show energy savings and control stability. Comparisons were made by alternating static pressure control modes every two weeks between fixed static control and TTR control over a one year period at these facilities.
Key benchmarks were used to determine the success of the project: fan energy savings of 30% or greater over fixed static pressure (FSP) strategies (based on past studies on the TR method), 6% reduction in overall Greenhouse Gas (GHG) emissions, six-months to one-year simple payback (based on a university campus building TTR pilot study,) and no additional user complaints.
Demonstration results showed that total fan energy savings for the five demonstration sites ranged from 14.4% to 34.8% compared with fixed static pressure control. Reduction in overall GHG emissions at five sites ranged from 0.6% to 4.7%. Simple payback years are 1.7, 4.9, 5, 11.8 and 14.9 years. Users (building occupants and facility engineers) mostly had no additional comfort complaints. The potential reduction in site energy across DoD installations could be 295 Gigawatt hours (GWh) per year, and the potential electricity cost savings could be $29.5 million per year.
Overall, the key energy savings results and user satisfactions met or partially met project objectives, while other targets, such as system economics, fell short of the original project goals. Contributing factors include low local electricity cost, non-ideal mechanical equipment and control operating conditions, and the need to hire control contractors to troubleshoot and solve “rogue zone” problems to make TTR method work effectively.
The factors influencing the energy savings and cost-effectiveness of building controls retrofit projects to convert fixed static pressure control to either TTR or TR method are summarized in the following table:
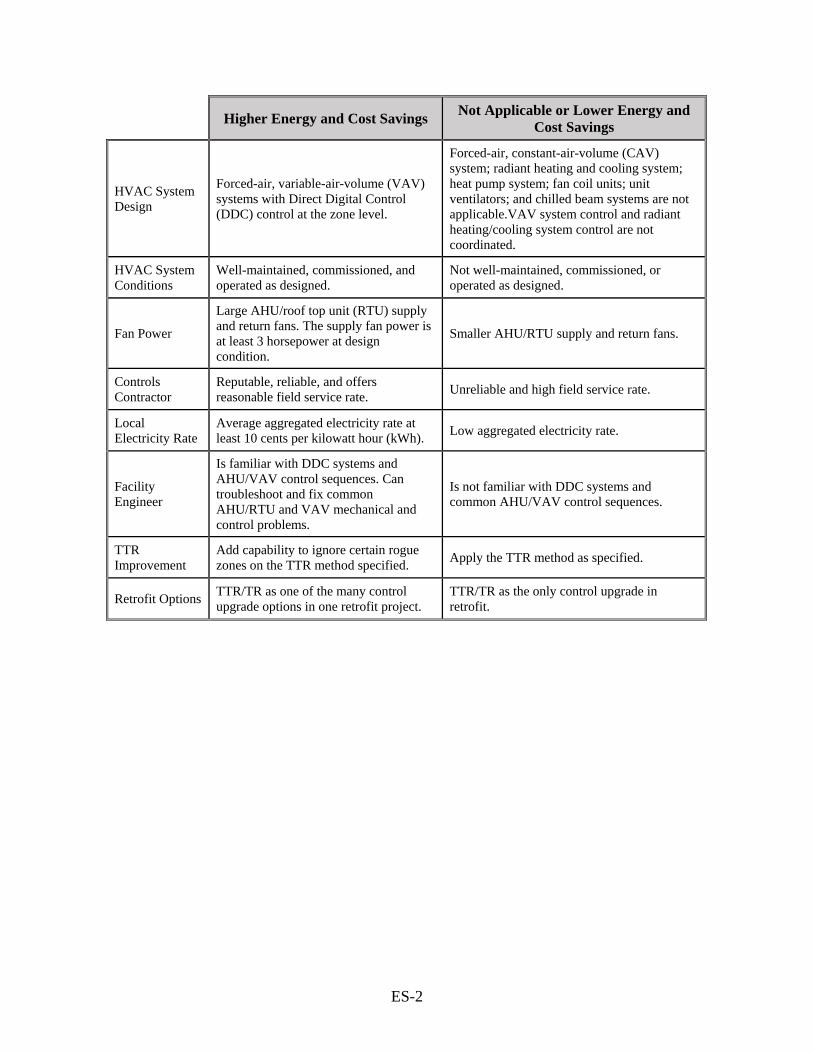
ES-2
Higher Energy and Cost Savings Not Applicable or Lower Energy and Cost Savings
HVAC System Design
Forced-air, variable-air-volume (VAV) systems with Direct Digital Control (DDC) control at the zone level.
Forced-air, constant-air-volume (CAV) system; radiant heating and cooling system; heat pump system; fan coil units; unit ventilators; and chilled beam systems are not applicable.VAV system control and radiant heating/cooling system control are not coordinated.
HVAC System Conditions
Well-maintained, commissioned, and operated as designed.
Not well-maintained, commissioned, or operated as designed.
Fan Power
Large AHU/roof top unit (RTU) supply and return fans. The supply fan power is at least 3 horsepower at design condition.
Smaller AHU/RTU supply and return fans.
Controls Contractor
Reputable, reliable, and offers reasonable field service rate. Unreliable and high field service rate.
Local Electricity Rate
Average aggregated electricity rate at least 10 cents per kilowatt hour (kWh). Low aggregated electricity rate.
Facility Engineer
Is familiar with DDC systems and AHU/VAV control sequences. Can troubleshoot and fix common AHU/RTU and VAV mechanical and control problems.
Is not familiar with DDC systems and common AHU/VAV control sequences.
TTR Improvement
Add capability to ignore certain rogue zones on the TTR method specified. Apply the TTR method as specified.
Retrofit Options TTR/TR as one of the many control upgrade options in one retrofit project.
TTR/TR as the only control upgrade in retrofit.

1
1.0 INTRODUCTION
The goal of this project was to demonstrate the energy savings and control stability of a new method for controlling air handling units (AHUs) and rooftop units’ fan speeds at five Iowa Army National Guard (IAARNG) facilities.
1.1 BACKGROUND
Based on the U.S Department of Energy (DOE) 2011 Building Energy Data Book [DOE, 2012], ventilation represents approximately 15.9% of a commercial building’s overall building electricity use and 8.9% of total building energy use. Ventilation energy is mostly driven by an AHUs supply and return fans. The two most common Heating, Ventilation and Air Conditioning (HVAC) system designs in commercial buildings are constant-air-volume (CAV) and variable-air-volume (VAV). In a CAV system, AHUs supply and return fans run at a constant speed, and the supply air temperatures vary to meet the building thermal load. In a VAV system, the supply and return fans’ speeds vary to change the supply air flow rates while maintaining the supply air temperature constant. The VAV system gradually replaced the CAV system in building design because a VAV system is usually more energy efficient.
Since 1999, American Society of Heating, Refrigeration, and Air-Conditioning Engineers (ASHRAE) Standard 90.1 [ASHRAE, 2010] has required that static pressure setpoint be reset for VAV systems with direct digital controls (DDC) at the zone level, and California Title 24 Building Energy Efficiency Standards, California Energy Commission [CEC, 2008] has a similar requirement. Various academic studies and empirical evidence have shown fan energy savings vary between 30% and approximately 50% compared with the constant static pressure control strategy [Hartman, 1993] [Hydeman, 2003] [Taylor, 2007].
The static pressure reset strategy is still very under-utilized in many existing buildings with DDC controls, especially in commercial buildings with older generations of DDC systems. Many technical and economic reasons have contributed to the problem. Barriers to wider adoption of static pressure reset strategy also include limited or no programming or code modules readily available due to the proprietary nature of different programming languages used by DDC vendors. Consulting and facility engineers often fail to understand, emulate, and maintain this software implementation properly. Few case studies exist regarding the economic implications or analyses using this strategy in either new construction or retrofit projects.
Demonstrations and case studies focused on actual Department of Defense (DoD) buildings using different DDC systems highlighting the real economic benefits and providing programming examples will be extremely helpful in determining the practicality of implementing the control strategy as a retrofit solution in other existing DoD buildings that may have many different DDC systems. This demonstration project addresses the barriers and problems that have prevented the broader adoption of the reset strategy, which could generate substantial energy savings and reduce building operation cost by tens of millions of dollars per year with a very quick payback period.
Currently, the Trim and Respond (TR) method is the state-of-the-art approach in adjusting VAV system AHU static pressure setpoint and is part of the proposed ASHRAE Guideline 36 - High-Performance Sequences of Operation for HVAC Systems, which is still in public review. This method still requires careful tuning in the field and may experience control stability issues.
2
In the 2011 ASHRAE Handbook on HVAC Applications, the pressure reset strategy is described in a simplified form - a variation of the TR method. In this method, a constant incremental (e.g., 5% of the design range) is recommended to be added (or deducted) to the current pressure setpoint when the maximum damper position is above or below a certain threshold (e.g., 98% and 90% respectively). Based on Nelson’s study [Nelson, 2011], the Tiered Trim and Respond (TTR) method is the “improved” version of the TR method and is used in this project to demonstrate the energy savings and control stability compared to existing AHU fan control strategies at DoD buildings.
Many of the existing DoD buildings are still using fixed static pressure control (no reset) for AHU supply fans. Several years ago, DDC system vendors started to provide static pressure reset control options for projects with new DDC systems (new construction or DDC system retrofit.) Having multiple different DDC system providers complicates a systematic approach to implementing a standard best practice across all DoD buildings.
This demonstration addresses the barriers and problems that have prevented the broader adoption of the AHU static pressure reset strategy which could generate substantial energy savings and reduce building operation cost in tens of millions of dollars per year with a very quick payback period.
The TTR method was implemented at five IAARNG buildings of different sizes, building types and functions, and building control systems. The official demonstration period was one year which spanned various weather conditions. During the project, the AHU fan control strategies were switched between existing control method (fixed or TR method) and the new TTR method once every two weeks.
1.2 OBJECTIVE OF THE DEMONSTRATION
The main objective of this project was to demonstrate the control stability, ease of implementation and potential energy savings of the TTR method for different DoD building types. The second objective was to generate practical sample control programming codes under different DDC system platforms. These programming codes would then serve as “templates” for others (i.e., controls contractors, consulting engineers, facility engineers) to emulate and implement at additional future DoD sites. The third objective was to analyze the economic benefit and demonstrate the cost effectiveness of applying the proposed method to different DoD building types using a basic life-cycle cost analysis.
Demonstration results showed that total fan energy savings for the five demonstration sites ranged from 14.4% to 34.8% compared with fixed static pressure control. Reduction in overall Greenhouse Gas (GHG) emissions at five sites ranged from 0.6% to 4.7%. Simple payback years are 1.7, 4.9, 5, 11.8, and 14.9 years. Users (building occupants and facility engineers) mostly had no additional comfort complaints. The potential reduction in site energy across DoD installations could be 295 Gigawatt hours (GWh) per year, and the potential electricity cost savings could be $29.5 million per year.
Overall, the key energy savings results and user satisfactions met or partially met project objectives, while other targets such as system economics fell short of the original project goals.

3
Contributing factors include low local electricity cost, non-ideal mechanical equipment and control operating conditions, and the need to hire control contractors to troubleshoot and solve “rogue zone” problems to make TTR method work effectively.
1.3 REGULATORY DRIVERS
Existing regulations, Executive Orders (EOs), DoD directives, industry standards or other drivers that the proposed technology addresses are listed below:
• Executive Order: EO 13693, Planning for Federal Sustainability in the Next Decade, March 2015;
• Legislative Mandates: Energy Independence and Security Act, 2007, Public Law 110-140; • Legislative Mandates: Energy Policy Act 2005, Public Law 109-58; • Federal Policy: Guiding Principles for Federal Leadership in High Performance and
Sustainable Buildings, December 2011; • DoD Policy: Department of Defense Strategic Sustainability Performance Plan, FY 2011; • Service Policy: Memorandum, Assistant Secretary of the Army (ASA) Installations,
Energy & Environment (IE&E), 28 Jan 2014, Subject: Army Directive 2014-02 (Net Zero Installations Policy);
• Service Policy: Memorandum, ASA (IE&E), 14 Jun 2013, Subject: Sustainable Design and Development Policy Update;
• Service Policy: Memorandum, ASA (IE&E), 24 Aug 2012, Subject: Energy Goal Attainment Responsibility Policy for Installations;
• Service Policy: Programmatic Environmental Assessment: Army Net Zero installations, Final July 2012;
• Service Policy: U.S. Army Energy and Water Campaign Plan for Installations, Dec. 2007; • Service Policy: AR 420-1 Chapter 22, Army Energy and Water Management Program; • Specifications: American National Standards Institute (ANSI)/ASHRAE/ Illuminating
Engineering Society of North America (IESNA) Standard 90.1-2012 (ASHRAE 90.1-2010 and ASHRAE 189.1), Energy Standards for Buildings (Except Low-Rise Residential Buildings), 2010;
• State of Iowa Executive Order 41: all agencies shall identify and implement energy efficiency measures and reduce energy consumption in all conditioned facilities owned by the State as provided for in Iowa Code Section 473.13A.
These drivers call for a reduction in building energy consumption and greenhouse gas emission reductions, which are the two primary goals of this demonstration project.

4
Page Intentionally Left Blank
5
2.0 TECHNOLOGY DESCRIPTION
In this chapter, an overview of the technology is given, and advantages and limitations of the technology are described.
2.1 TECHNOLOGY OVERVIEW
Description:
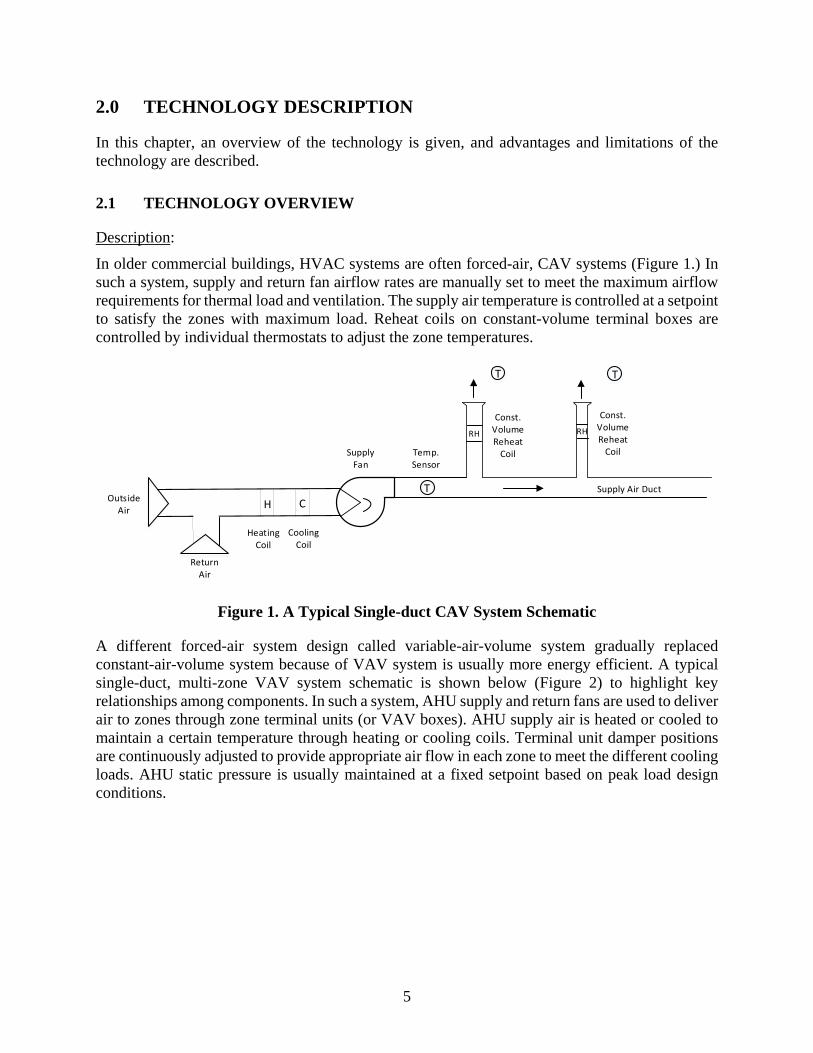
In older commercial buildings, HVAC systems are often forced-air, CAV systems (Figure 1.) In such a system, supply and return fan airflow rates are manually set to meet the maximum airflow requirements for thermal load and ventilation. The supply air temperature is controlled at a setpoint to satisfy the zones with maximum load. Reheat coils on constant-volume terminal boxes are controlled by individual thermostats to adjust the zone temperatures.
Figure 1. A Typical Single-duct CAV System Schematic
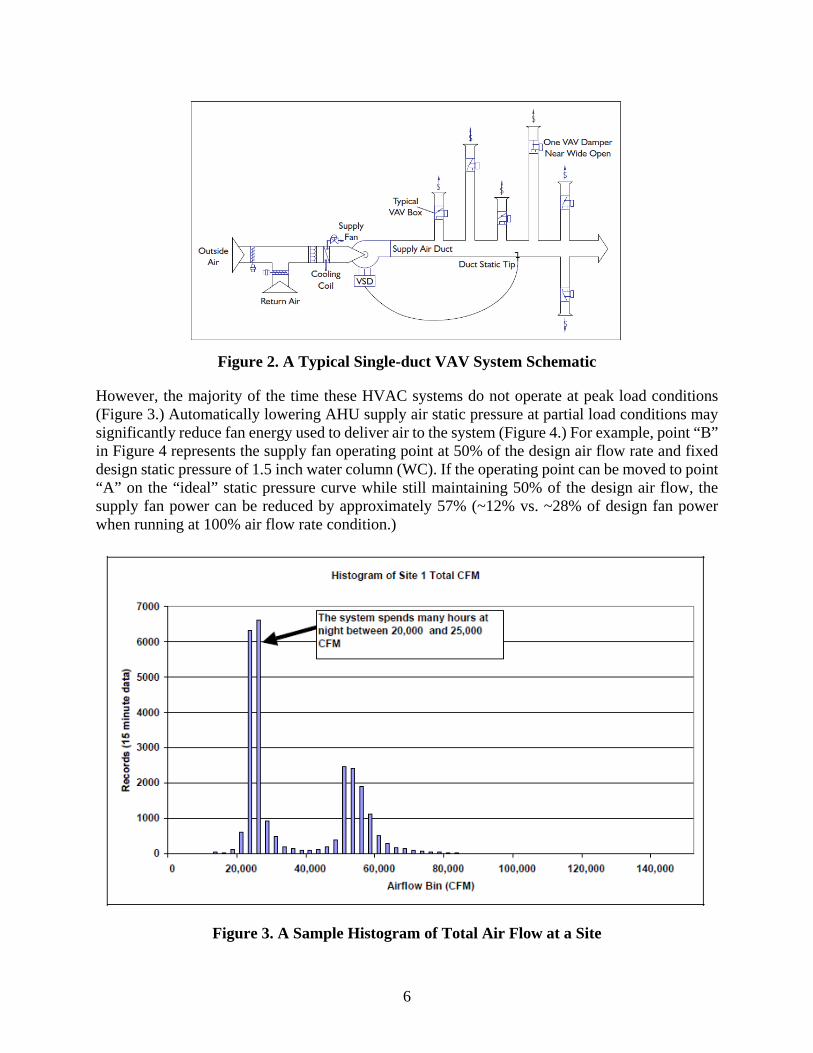
A different forced-air system design called variable-air-volume system gradually replaced constant-air-volume system because of VAV system is usually more energy efficient. A typical single-duct, multi-zone VAV system schematic is shown below (Figure 2) to highlight key relationships among components. In such a system, AHU supply and return fans are used to deliver air to zones through zone terminal units (or VAV boxes). AHU supply air is heated or cooled to maintain a certain temperature through heating or cooling coils. Terminal unit damper positions are continuously adjusted to provide appropriate air flow in each zone to meet the different cooling loads. AHU static pressure is usually maintained at a fixed setpoint based on peak load design conditions.
H CT
RH RH
Outside Air
Return Air
Heating Coil
Cooling Coil
Supply Fan
Temp. Sensor
Const. VolumeReheat
Coil
Const. VolumeReheat
Coil
Supply Air Duct
T T
6
Figure 2. A Typical Single-duct VAV System Schematic
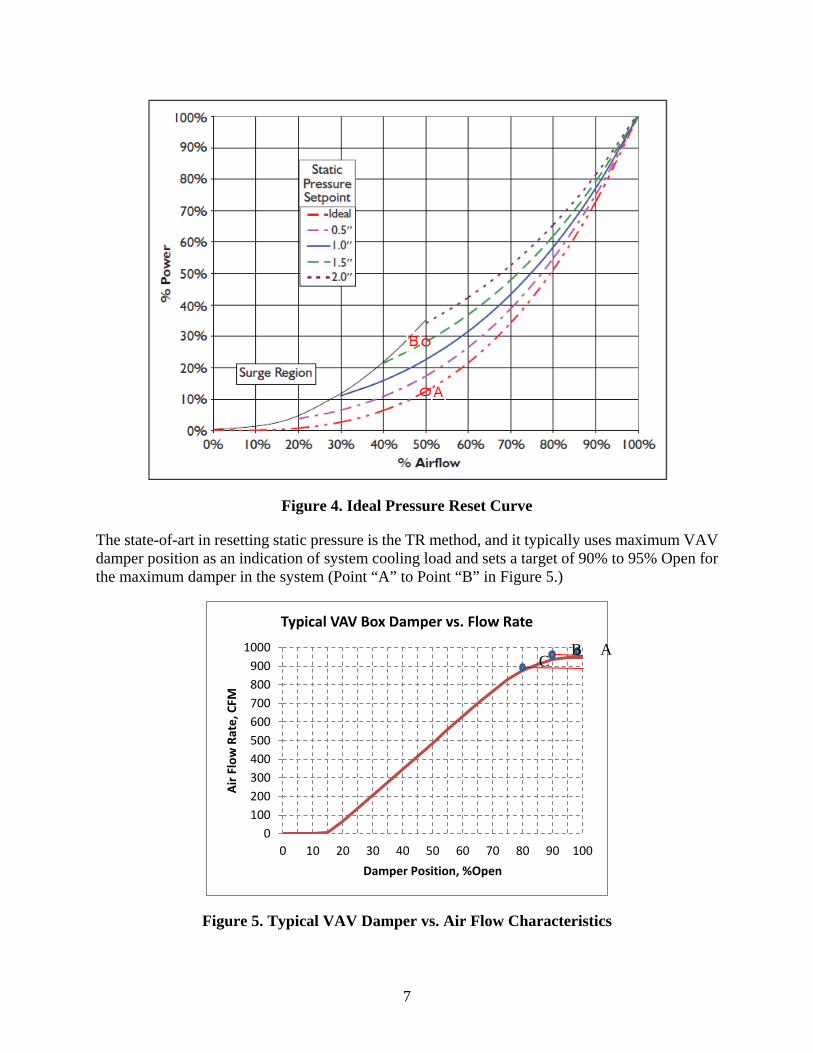
However, the majority of the time these HVAC systems do not operate at peak load conditions (Figure 3.) Automatically lowering AHU supply air static pressure at partial load conditions may significantly reduce fan energy used to deliver air to the system (Figure 4.) For example, point “B” in Figure 4 represents the supply fan operating point at 50% of the design air flow rate and fixed design static pressure of 1.5 inch water column (WC). If the operating point can be moved to point “A” on the “ideal” static pressure curve while still maintaining 50% of the design air flow, the supply fan power can be reduced by approximately 57% (~12% vs. ~28% of design fan power when running at 100% air flow rate condition.)
Figure 3. A Sample Histogram of Total Air Flow at a Site
7
Figure 4. Ideal Pressure Reset Curve
The state-of-art in resetting static pressure is the TR method, and it typically uses maximum VAV damper position as an indication of system cooling load and sets a target of 90% to 95% Open for the maximum damper in the system (Point “A” to Point “B” in Figure 5.)
Figure 5. Typical VAV Damper vs. Air Flow Characteristics
0100200300400500600700800900
1000
0 10 20 30 40 50 60 70 80 90 100
Air F
low
Rat
e, C
FM
Damper Position, %Open
Typical VAV Box Damper vs. Flow Rate
A B C

8
The TTR method is an improved version of the TR method. Research done by Dr. Ron Nelson and his students [Nelson, 2011] showed that the target of 95% to 98% threshold value as described in the ASHRAE handbook and other papers might be too high for stable control. Figure 4 shows a typical VAV box curve for damper position vs. air flow rate volume. At higher damper position ranges, large percentage changes in VAV damper position, e.g., point “A” 98% open to point “B” 90% open, can only marginally decrease air flow rate due to the flattened curve in that region. On the other hand, the change in VAV air flow setpoint due to small to modest zone load changes or disturbance could cause a relatively large change in damper command and position, e.g., point “A” to point “B,” or point “A” to point “C.” This significant change in damper command or position will affect the setpoint reset calculation since the damper output itself is usually the result of a Proportional-Integral (PI) control loop output for VAV box cooling and is subject to oscillation if not properly tuned. The PI and Proportional-Integral-Derivative (PID) control methods are standard classical control methods that calculate control output based on the difference between a process variable and a setpoint. The control performances using these methods are highly subject to proper parameter tuning in the field. Further tests also concluded the trim and respond rate change were not a major factor in control stability, but the reset time interval could be a factor. Too short of a time interval, e.g., 1 minute, could easily cause the system to be unstable. While a longer time interval, e.g., 15 minutes, increases system stability, it also may save less energy and respond to system changes too slowly.
In the TTR method, if the maximum damper output or position is within a specified narrow range [Low1, High1], the static pressure setpoint will not change. However, if the damper deviates from this range, the setpoint will be adjusted based on three tiers of ranges ([Low1, High1], [Low2, High2], and [Low3, High3]). The rates of change will be based on preset trim rates (TM1, TM2, TM3) and respond rates (RP1, RP2, RP3) as illustrated in Table 1. The technology is innovative in a sense it recognizes a major factor that causes the instability of static pressure reset control and difficulty in tuning parameters, and provides a solution to alleviate the problem. The approach has better control or adjustment capability for various building types and building mechanical systems. It is a variation and improvement on the state-of-the-art TR method, and it allows a smooth, energy-efficient transition between states. Lower fan speed and more stable control would also result in reduced noise levels compared to constant pressure control and traditional TR method.
Table 1: Illustration of TTR Method Concept
Condition Response If MDP > High3 SPSet = SPSet + RP1 + RP2 + RP3 If MDP > High2 SPSet = SPSet + RP1 + RP2 If MDP > High1 SPSet = SPSet + RP1
If MDP < High1 & MDP > Low1 SPSet = SPSet (no change) If MDP < Low1 SPSet = SPSet - TM1 If MDP < Low2 SPSet = SPSet - TM1 - TM2 If MDP < Low3 SPSet = SPSet - TM1 - TM2 - TM3
MDP: Maximum Damper Command or Position SPSet: Static Pressure Setpoint TM1,2,3: Trim Rates; RP1,2,3: Respond Rates; All are positive numbers
9
Chronological Summary:
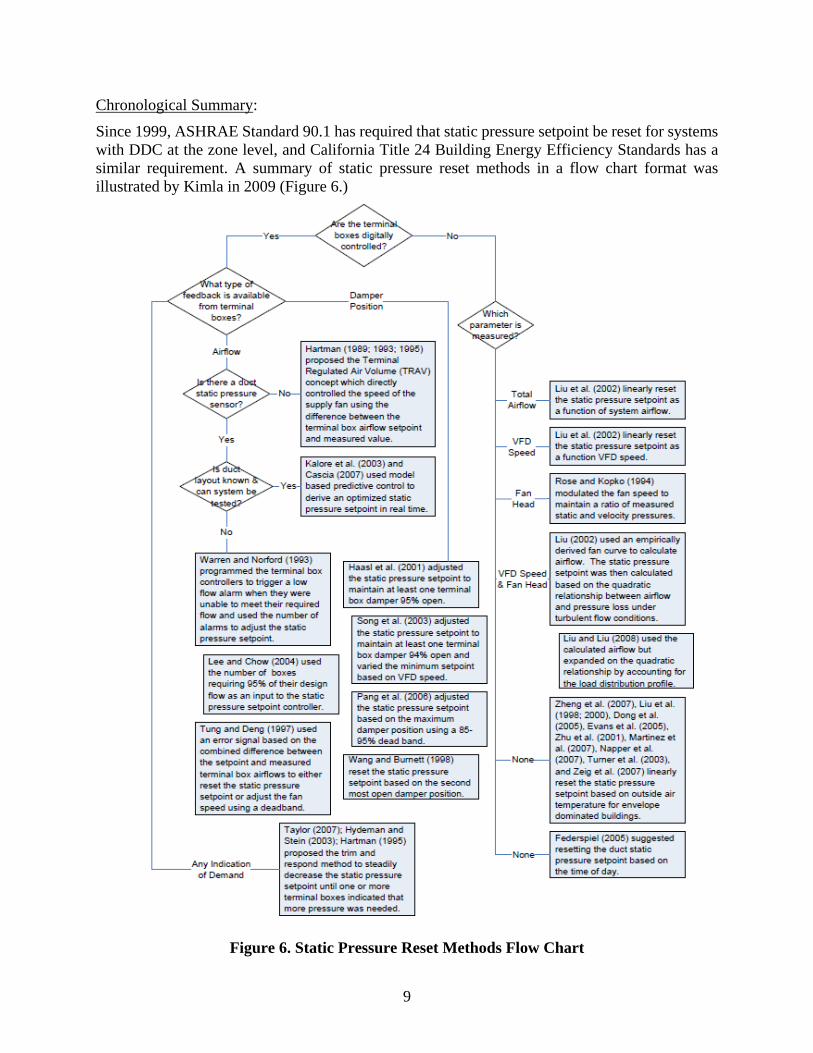
Since 1999, ASHRAE Standard 90.1 has required that static pressure setpoint be reset for systems with DDC at the zone level, and California Title 24 Building Energy Efficiency Standards has a similar requirement. A summary of static pressure reset methods in a flow chart format was illustrated by Kimla in 2009 (Figure 6.)
Figure 6. Static Pressure Reset Methods Flow Chart

10
2.2 ADVANTAGES AND LIMITATIONS OF THE TECHNOLOGY
Performance Advantages:
Compared to fixed static pressure control that is widely used in many existing DoD buildings, the TTR method can significantly increase the efficiency of AHU operations. Compared to the TR method that sees more implementation in new construction, the TTR method is designed to be more stable in control performance and, in theory, more closely tracks building load changes. This performance improvement will likely increase AHU fan service life as well as the acceptance by building operators and facility managers.
Cost Advantages:
The long-term cost advantage for TTR method vs. fixed setpoint is the HVAC system operational cost savings for the TTR method due to fan energy savings. For TTR method vs. TR method, the cost of implementing both approaches and their energy saving potentials are similar. Both methods are in public domain, so there is no licensing or software subscription cost. The first cost and installation cost for implementing the TTR method are hiring a control contractor/technician to perform customized programming on the existing or new DDC systems and commissioning the system. The method is fairly straightforward and simple enough so that the customized programming can be done by a control technician in a few hours for each AHU. There are minimal operational and maintenance costs involved as these are software implementations and the life of the algorithm is the same as the DDC system for the building, typically 15 to 20 years.
Performance Limitations:
There is a risk that “rogue zones” may be present at the selected demonstration buildings and may limit the effectiveness of this reset strategy. A “rogue zone” refers to a zone controlled by a VAV terminal unit with a damper position that is driving the reset strategy a disproportionately large amount of the time. Unaddressed, even just one or two “rogue zones” may prevent the reset strategy from efficient operation and diminish the energy savings potential. The rogue zone problem can be solved or alleviated with proper mechanical and control system adjustments performed by experienced engineers or commissioning agents. Facility engineers need to monitor system performance closely. Monitoring dashboards that highlight performance degradation, advanced building analytics, or periodic re-commissioning could make TTR effective long-term. The TTR method can also be more robust by adding the capability to ignore certain zones.
The energy savings potential of the static pressure control strategy can be minimal if a facility’s existing constant setpoint has been reduced significantly from its design or commissioning setpoint. In some cases, facility managers have significantly reduced air handling setpoint due to occupant complaints of noise or design flaws resulting in the frequent shutdown of units from high static pressure alarm faults. For these AHUs, the TTR method can also have issues with faulting high static pressure alarms.
11
Cost Limitations:
Building owners should hire qualified control contractors to perform customized programming and implementation of the TTR method. The first cost and installation cost depend on the local control contractor or technician’s charge rate and their level of technical expertise to do customized programming on the DDC system platform for the building. Additional costs may arise from routine maintenance on related equipment such as AHU and VAV terminal unit dampers, boiler, and chiller as the TTR method is dependent on the proper operation of the HVAC equipment.
Potential Barriers to Acceptance:
Training is needed for building operators or facility engineers or maintainers to understand the static pressure reset strategy and know what to expect regarding how the AHU fans operate under various load conditions. Management needs to be convinced of the long-term energy impact and cost benefit through case studies, presentations, and publications.

12
Page Intentionally Left Blank

13
3.0 PERFORMANCE OBJECTIVES
The TTR performances demonstrated in this project is being evaluated for existing buildings in a building retrofit application. For new construction, static pressure reset (TR, TTR, or other pressure reset method) is prescriptively required, and the incremental first cost is minimal. In both cases, only building control software customization is involved and no HVAC equipment replacement is necessary. A summary of the performance objectives and results are listed in Table 2.
Table 2. Performance Objectives
Performance Objective Metric Data Requirements Success Criteria Results
Quantitative Performance Objectives
Facility Energy Usage
Energy Intensity One Million British Thermal Units Per Square Foot (MMBtu/ft2) or One Thousand British Thermal Units Per Square Foot (kWh/ft2)
Meter readings of fan energy used by AHUs; Total meter readings by the installations; Square footage of buildings using energy; Zone and outside air temperatures.
On average 30% reduction in AHU fan energy for AHUs selected for fixed setpoint vs. TTR method
Objectives partially met. Fan energy savings for 11 AHU/roof top units (RTUs) range from 1.48% to 52.85%. For the five sites, fan energy savings range from 14.4% to 34.8%
Indirect Greenhouse Gas Emissions
Indirect fossil fuel GHG emissions (metric tons)
Total meter readings by the installations; Estimated release of GHG emissions based on electricity saved.
On average 6% reduction in indirect GHG emissions for AHUs selected for fixed setpoint vs. TTR method
Objectives not met. Reduction in indirect GHG emissions ranges from 0.6% to 4.7% for the five demo sites.
System Economics
Simple payback years, Savings -to -Investment Ratios (SIRs) for 5, 10, 20 years
Dollar costs for retrofit and training, projected electricity savings, discount rate, local utility rates.
Six months to one-year simple payback; SIR of 6, 12, 22 for 5, 10, 20 years’
Objectives not met. Simple payback 1.7 to 14.9 years for the five demo sites. SIRs for 5, 10, 20 years are 2.11, 3.99, 7.04 for Site #2, and 1.03, 1.94, 3.41 for Site #3.
14
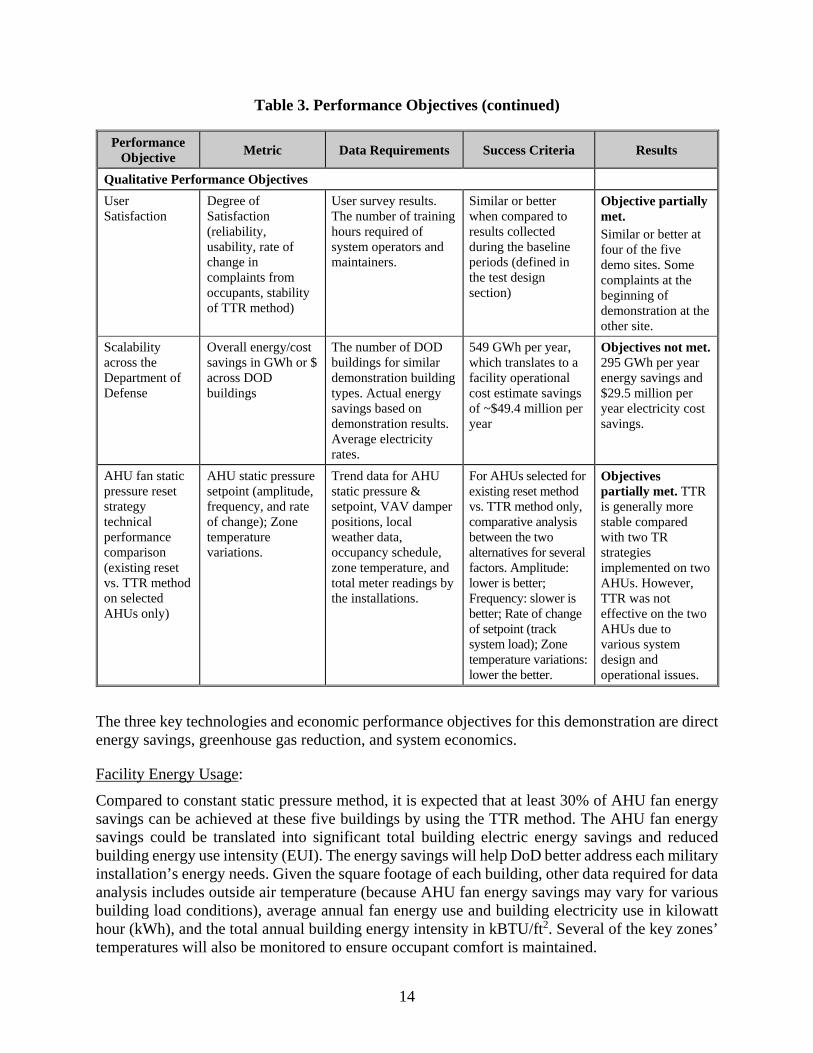
Table 3. Performance Objectives (continued)
Performance Objective Metric Data Requirements Success Criteria Results
Qualitative Performance Objectives User Satisfaction
Degree of Satisfaction (reliability, usability, rate of change in complaints from occupants, stability of TTR method)
User survey results. The number of training hours required of system operators and maintainers.
Similar or better when compared to results collected during the baseline periods (defined in the test design section)
Objective partially met. Similar or better at four of the five demo sites. Some complaints at the beginning of demonstration at the other site.
Scalability across the Department of Defense
Overall energy/cost savings in GWh or $ across DOD buildings
The number of DOD buildings for similar demonstration building types. Actual energy savings based on demonstration results. Average electricity rates.
549 GWh per year, which translates to a facility operational cost estimate savings of ~$49.4 million per year
Objectives not met. 295 GWh per year energy savings and $29.5 million per year electricity cost savings.
AHU fan static pressure reset strategy technical performance comparison (existing reset vs. TTR method on selected AHUs only)
AHU static pressure setpoint (amplitude, frequency, and rate of change); Zone temperature variations.
Trend data for AHU static pressure & setpoint, VAV damper positions, local weather data, occupancy schedule, zone temperature, and total meter readings by the installations.
For AHUs selected for existing reset method vs. TTR method only, comparative analysis between the two alternatives for several factors. Amplitude: lower is better; Frequency: slower is better; Rate of change of setpoint (track system load); Zone temperature variations: lower the better.
Objectives partially met. TTR is generally more stable compared with two TR strategies implemented on two AHUs. However, TTR was not effective on the two AHUs due to various system design and operational issues.
The three key technologies and economic performance objectives for this demonstration are direct energy savings, greenhouse gas reduction, and system economics.
Facility Energy Usage:
Compared to constant static pressure method, it is expected that at least 30% of AHU fan energy savings can be achieved at these five buildings by using the TTR method. The AHU fan energy savings could be translated into significant total building electric energy savings and reduced building energy use intensity (EUI). The energy savings will help DoD better address each military installation’s energy needs. Given the square footage of each building, other data required for data analysis includes outside air temperature (because AHU fan energy savings may vary for various building load conditions), average annual fan energy use and building electricity use in kilowatt hour (kWh), and the total annual building energy intensity in kBTU/ft2. Several of the key zones’ temperatures will also be monitored to ensure occupant comfort is maintained.
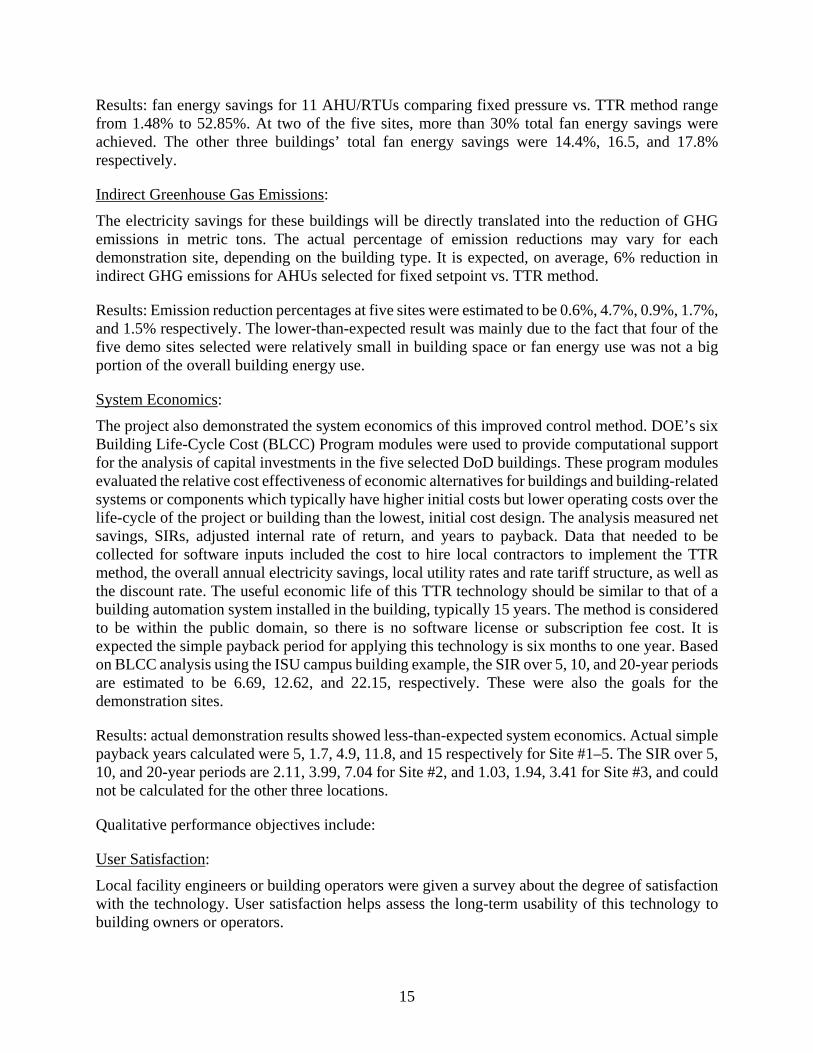
15
Results: fan energy savings for 11 AHU/RTUs comparing fixed pressure vs. TTR method range from 1.48% to 52.85%. At two of the five sites, more than 30% total fan energy savings were achieved. The other three buildings’ total fan energy savings were 14.4%, 16.5, and 17.8% respectively.
Indirect Greenhouse Gas Emissions:
The electricity savings for these buildings will be directly translated into the reduction of GHG emissions in metric tons. The actual percentage of emission reductions may vary for each demonstration site, depending on the building type. It is expected, on average, 6% reduction in indirect GHG emissions for AHUs selected for fixed setpoint vs. TTR method.
Results: Emission reduction percentages at five sites were estimated to be 0.6%, 4.7%, 0.9%, 1.7%, and 1.5% respectively. The lower-than-expected result was mainly due to the fact that four of the five demo sites selected were relatively small in building space or fan energy use was not a big portion of the overall building energy use.
System Economics:
The project also demonstrated the system economics of this improved control method. DOE’s six Building Life-Cycle Cost (BLCC) Program modules were used to provide computational support for the analysis of capital investments in the five selected DoD buildings. These program modules evaluated the relative cost effectiveness of economic alternatives for buildings and building-related systems or components which typically have higher initial costs but lower operating costs over the life-cycle of the project or building than the lowest, initial cost design. The analysis measured net savings, SIRs, adjusted internal rate of return, and years to payback. Data that needed to be collected for software inputs included the cost to hire local contractors to implement the TTR method, the overall annual electricity savings, local utility rates and rate tariff structure, as well as the discount rate. The useful economic life of this TTR technology should be similar to that of a building automation system installed in the building, typically 15 years. The method is considered to be within the public domain, so there is no software license or subscription fee cost. It is expected the simple payback period for applying this technology is six months to one year. Based on BLCC analysis using the ISU campus building example, the SIR over 5, 10, and 20-year periods are estimated to be 6.69, 12.62, and 22.15, respectively. These were also the goals for the demonstration sites.
Results: actual demonstration results showed less-than-expected system economics. Actual simple payback years calculated were 5, 1.7, 4.9, 11.8, and 15 respectively for Site #1–5. The SIR over 5, 10, and 20-year periods are 2.11, 3.99, 7.04 for Site #2, and 1.03, 1.94, 3.41 for Site #3, and could not be calculated for the other three locations.
Qualitative performance objectives include:
User Satisfaction:
Local facility engineers or building operators were given a survey about the degree of satisfaction with the technology. User satisfaction helps assess the long-term usability of this technology to building owners or operators.
16
Results: At three of the five sites, users did not have any additional complaints or differences in comfort level between the existing pressure control method and the TTR method. At one site at the beginning of the demonstration, significant noise, vibration, and tripping of a high static pressure sensor occurred when the static pressure was set by TTR to approach the design values. The problem is mainly due to an improperly designed HVAC system rather than a problem caused by TTR method.
Scalability across the Department of Defense:
Based on demonstrated energy savings from the five selected DoD buildings, more accurate energy savings potential across all DoD buildings can be assessed.
Results: 295 GWh per year energy savings and $29.5 million per year electricity cost savings were projected based on demonstration results. These are lower than estimated in the proposal.
AHU fan reset strategy performance comparison:
On selected AHUs that were controlled by existing static pressure control strategies (implemented by different control vendors), the existing reset strategies were compared to TTR method by studying the amplitude, frequency, and rate of change for AHU supply static pressure vs. its setpoint and compared with building load profile. The impact on occupant comfort (indicated by zone temperature variations) was also studied.
Results: TTR is more stable compared with two TR strategies implemented on two AHUs. However, TTR was not effective due to various system design and operational issues so the comparison result of control stability in this demonstration is mute.
17
4.0 FACILITY/SITE DESCRIPTION
In this chapter, the five IAARNG facilities selected for this demonstration and their HVAC equipment and building controls’ system configurations and conditions are described.
4.1 FACILITY/SITE LOCATION AND OPERATIONS
Demonstration Site Description:
Five Iowa National Guard facilities that were selected for this demonstration.
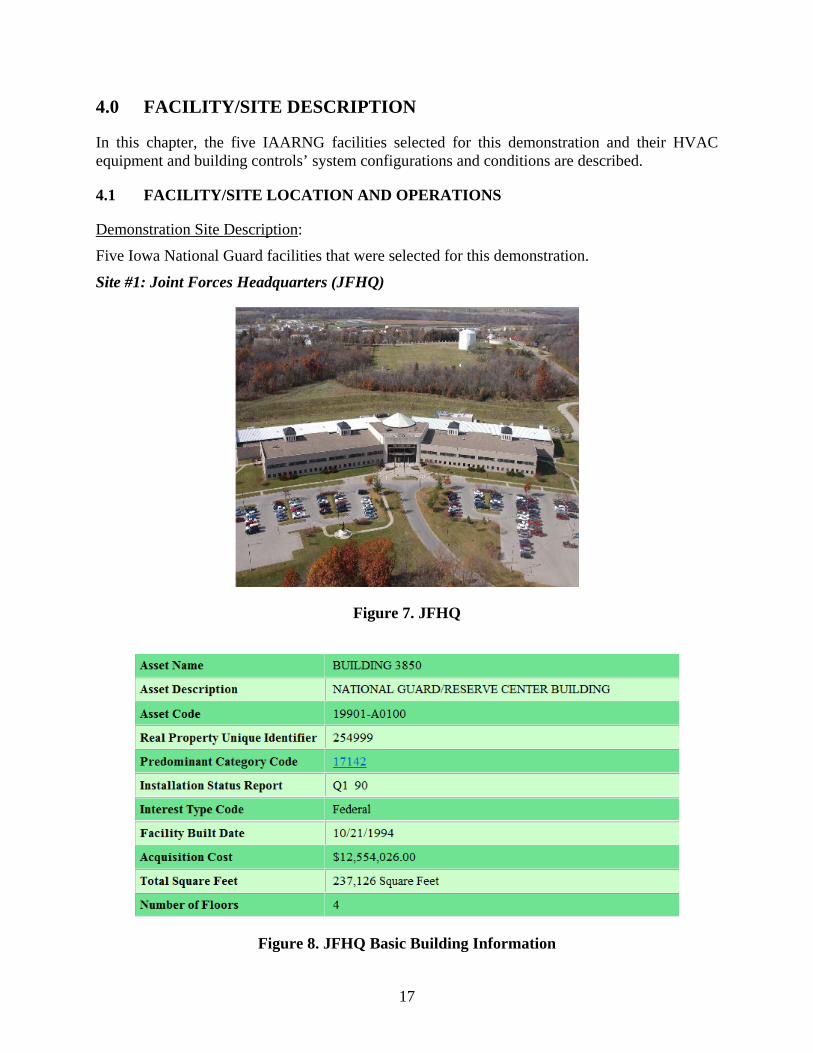
Site #1: Joint Forces Headquarters (JFHQ)
Figure 7. JFHQ
Figure 8. JFHQ Basic Building Information
18
The IAARNG JFHQ is located at 7277 Northwest 70th Avenue in Johnston, Iowa. This support facility (237,126 sq. ft.) houses several IAARNG Executive Leadership Offices, Directorates, Drill Hall, Motor Vehicle Service Bays, Classrooms, and Department of Homeland Security components including Iowa Homeland Security and Emergency Management. Broadly speaking, the facility has DoD-wide applicability in that every U.S. state has similar facilities serving similar emergency response and readiness support functionalities.
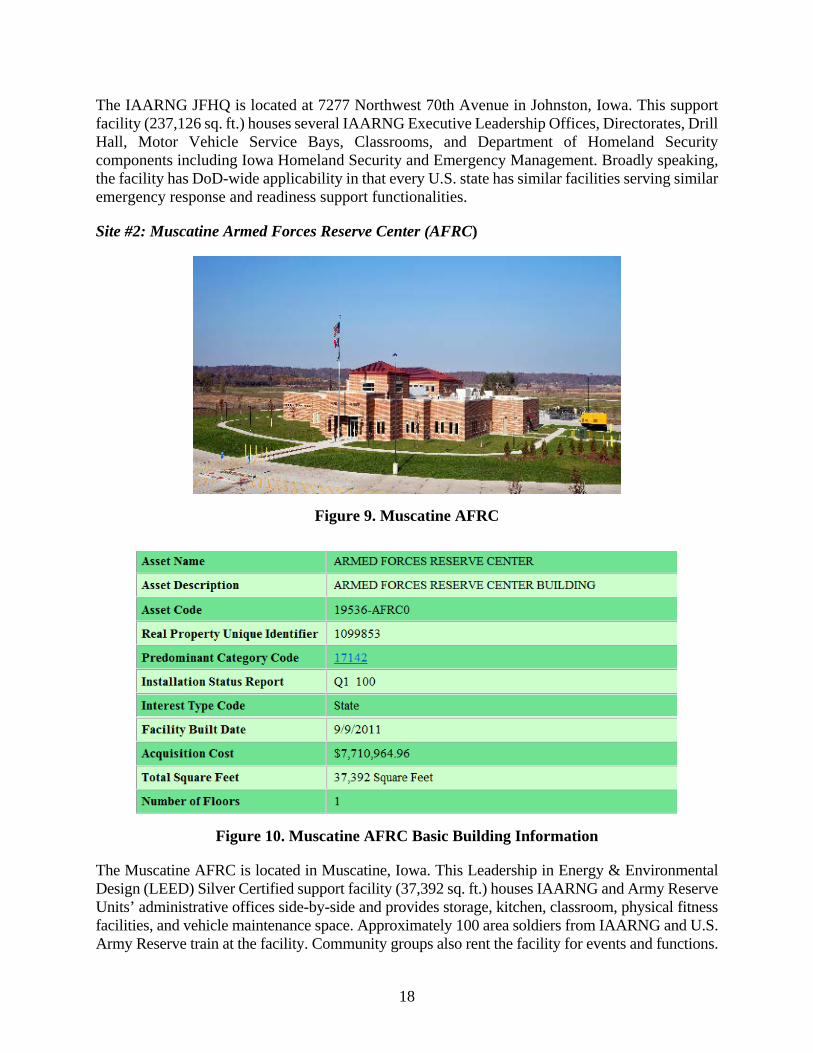
Site #2: Muscatine Armed Forces Reserve Center (AFRC)
Figure 9. Muscatine AFRC
Figure 10. Muscatine AFRC Basic Building Information
The Muscatine AFRC is located in Muscatine, Iowa. This Leadership in Energy & Environmental Design (LEED) Silver Certified support facility (37,392 sq. ft.) houses IAARNG and Army Reserve Units’ administrative offices side-by-side and provides storage, kitchen, classroom, physical fitness facilities, and vehicle maintenance space. Approximately 100 area soldiers from IAARNG and U.S. Army Reserve train at the facility. Community groups also rent the facility for events and functions.

19
In general, the facility has DoD-wide applicability in that hundreds of Base Realignment and Closure (BRAC) sites exist across all Agencies (Army Corps of Engineers, Defense Logistics Agency, Department of Defense, National Guard, U.S. Air Force, U.S. Army, and U.S. Navy).
Site #3: Waterloo Readiness Center (RC)
Figure 11. Waterloo Army Aviation Support Facility (AASF/ARMORY)
Figure 12. Waterloo AASF Basic Building Information
The Waterloo Readiness Center (34,185 sq. ft.) is an addition to a larger AASF (84,764 sq. ft.) that was installed in 1974. This aviation and maintenance support facility and Armory houses aircraft and personnel offices, latrines, storage, kitchen, classroom, physical fitness facilities, and aviation/hangar equipment testing, training and maintenance space. From a DoD-wide applicability standpoint, hundreds of similar aviation support facilities exist and stand to benefit economically from the implementation of the proposed method.
20
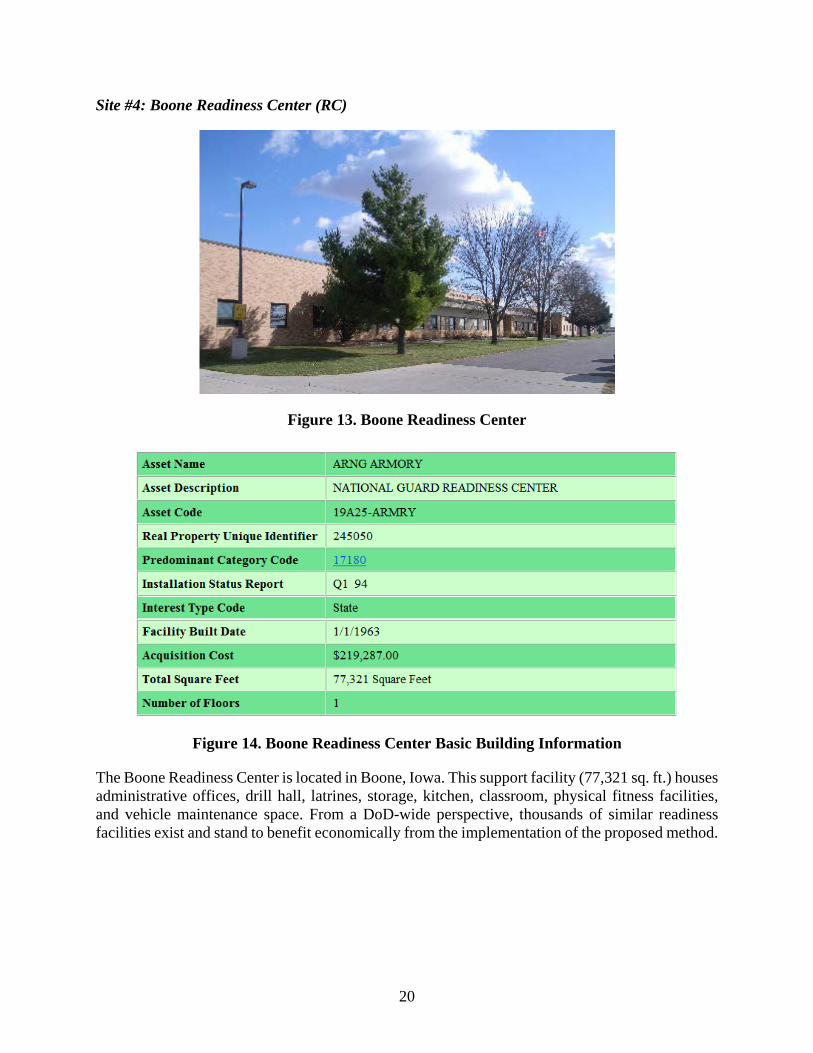
Site #4: Boone Readiness Center (RC)
Figure 13. Boone Readiness Center
Figure 14. Boone Readiness Center Basic Building Information
The Boone Readiness Center is located in Boone, Iowa. This support facility (77,321 sq. ft.) houses administrative offices, drill hall, latrines, storage, kitchen, classroom, physical fitness facilities, and vehicle maintenance space. From a DoD-wide perspective, thousands of similar readiness facilities exist and stand to benefit economically from the implementation of the proposed method.
21
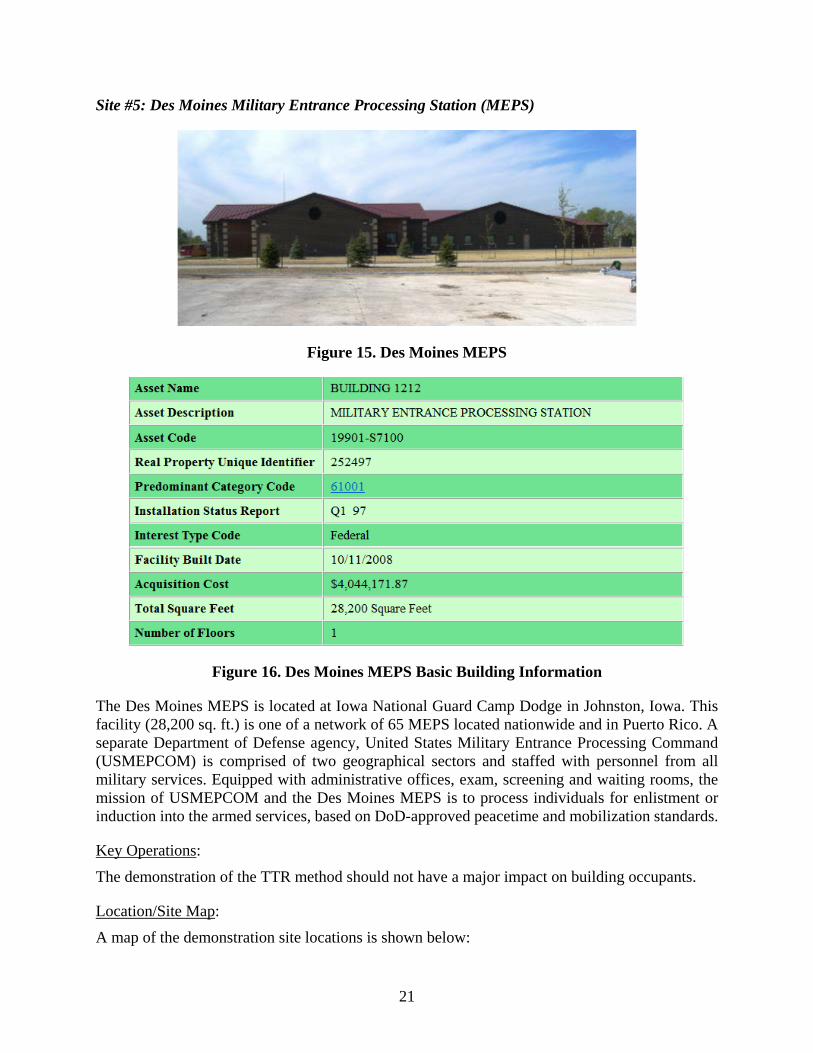
Site #5: Des Moines Military Entrance Processing Station (MEPS)
Figure 15. Des Moines MEPS
Figure 16. Des Moines MEPS Basic Building Information
The Des Moines MEPS is located at Iowa National Guard Camp Dodge in Johnston, Iowa. This facility (28,200 sq. ft.) is one of a network of 65 MEPS located nationwide and in Puerto Rico. A separate Department of Defense agency, United States Military Entrance Processing Command (USMEPCOM) is comprised of two geographical sectors and staffed with personnel from all military services. Equipped with administrative offices, exam, screening and waiting rooms, the mission of USMEPCOM and the Des Moines MEPS is to process individuals for enlistment or induction into the armed services, based on DoD-approved peacetime and mobilization standards.
Key Operations:
The demonstration of the TTR method should not have a major impact on building occupants.
Location/Site Map:
A map of the demonstration site locations is shown below:
22
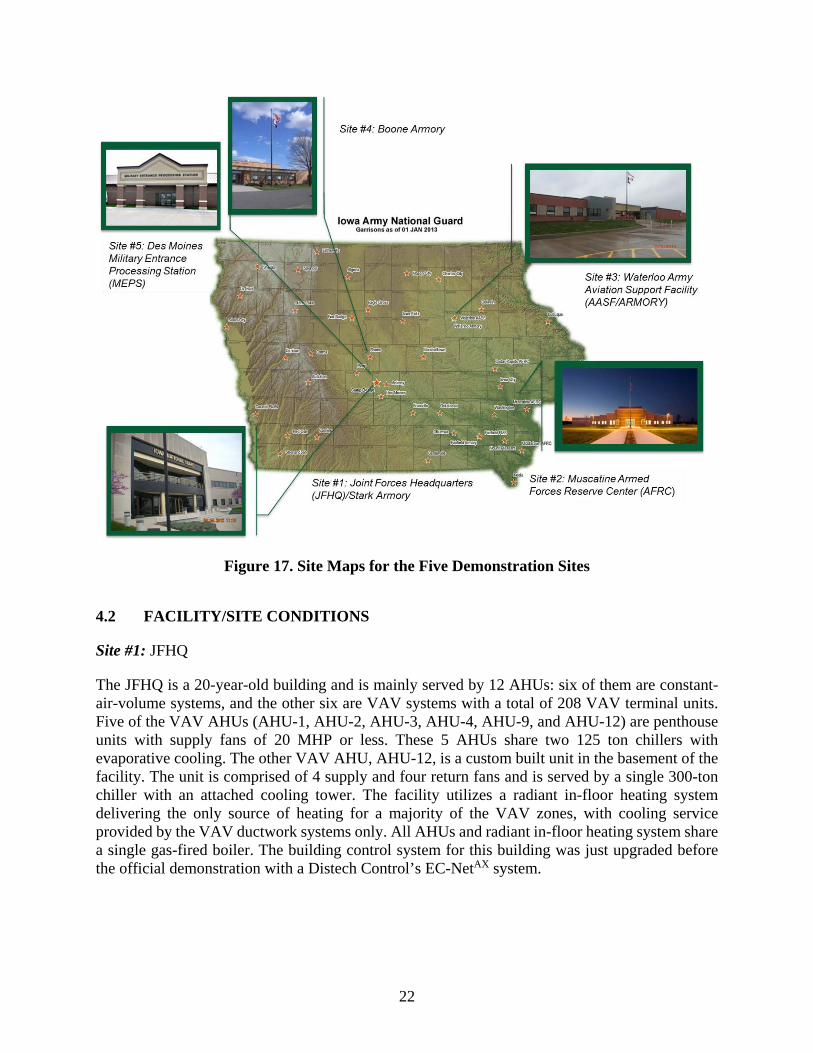
Figure 17. Site Maps for the Five Demonstration Sites
4.2 FACILITY/SITE CONDITIONS
Site #1: JFHQ
The JFHQ is a 20-year-old building and is mainly served by 12 AHUs: six of them are constant-air-volume systems, and the other six are VAV systems with a total of 208 VAV terminal units. Five of the VAV AHUs (AHU-1, AHU-2, AHU-3, AHU-4, AHU-9, and AHU-12) are penthouse units with supply fans of 20 MHP or less. These 5 AHUs share two 125 ton chillers with evaporative cooling. The other VAV AHU, AHU-12, is a custom built unit in the basement of the facility. The unit is comprised of 4 supply and four return fans and is served by a single 300-ton chiller with an attached cooling tower. The facility utilizes a radiant in-floor heating system delivering the only source of heating for a majority of the VAV zones, with cooling service provided by the VAV ductwork systems only. All AHUs and radiant in-floor heating system share a single gas-fired boiler. The building control system for this building was just upgraded before the official demonstration with a Distech Control’s EC-NetAX system.
23
Site #2: Muscatine AFRC
The Muscatine AFRC is a new LEED Silver facility and is served by five RTUs, three of which are VAV system configuration with 36 VAV terminal units in total. The building control system is Johnson Controls’ METASYS system. The first RTU, RTU-1, serves 3 VAV zones, all in kitchen areas. RTUs 3 and 4 serve the east and west portions of the facility, with 17 and 16 VAV boxes, respectively. RTU-1 normal occupied hours are from 6:00 am to noon, while RTU-2 and RTU-3 normal occupied hours are from 6:00 am to 6:00 pm.
Site #3: Waterloo Readiness Center
The Waterloo AASF/ARMORY was initially built in 1974 and is served by three RTUs, with one of them, RTU-1, being a VAV system that supplies air to 14 VAV terminal units. RTU-1 is managed by Johnson Controls’ METASYS system. This building did not have pressure reset control before this demonstration project. The facility’s normal HVAC equipment operation hours are from 5 am to 4 pm, even though RTU-1 runs 24 hours per day.
Site #4: Boone Readiness Center
The Boone Readiness Center added an addition and received two major renovations since initially built in 1963. The most recent in 2005 included installation of its current HVAC equipment and DDC system. The facility is served by 3 AHUs, two (AHU-1 and AHU-2) of which are VAV systems serving the north and south areas of the facility. Both AHUs are factory built units, serving 66 VAV terminal units in total (31 and 35 for AHU-1 and AHU-2 respectively) and are managed by Trane’s Tracer Summit building automation system. This building did not have pressure reset control in place. Both AHUs run from 5 am to 4 pm in the summer and 4 am to 4 pm in the winter.
Site #5: Des Moines MEPS
The Des Moines MEPS is served by one AHU with 34 VAV terminal units and is controlled by Schneider Electric/TAC/Invensys’s I/A series building control system. The AHU also contains a heat recovery unit, with heating service supplied by two boilers and cooling service by a single 72-ton chiller. The boilers and chillers are controlled by a separate control system due to a system upgrade. The building’s normal HVAC occupancy schedule is from 5:20 am to 9:20 pm on weekdays. On weekends, the building is usually unoccupied, and no HVAC system is set to run.

24
Page Intentionally Left Blank

25
5.0 TEST DESIGN
This chapter provides a description of the system design and testing conducted during the demonstration.
5.1 CONCEPTUAL TEST DESIGN
Hypothesis:
The proposed TTR method will save 30% AHU fan energy compared to fixed static pressure control. The proposed TTR method has superior system economics so that it can be widely adopted DoD-wide. TTR method can be more stable in controlling AHU static pressure while saving energy without compromising occupant comfort.
Test Design:
The demonstration was conducted at five IAARNG facilities by the method of sequential testing, switching control methods once every two weeks, over a one-year period. The comparisons were between fixed static pressure control and TTR method for a majority of the AHUs, and between existing pressure reset methods and TTR method for a small number of selected AHUs.
Dependent and independent variables were trended and collected during the one-year demonstration period. The cost data for hiring building control system vendors to perform customized control programming, training, and troubleshooting before and during the official demonstration were also collected. Local weather information was downloaded from local weather station website for weather normalization of energy comparisons.
Test Phases:
There were eight test phases for this demonstration:
Task 1: Identify five demonstration sites Task 2: Review building mechanical and control systems and design energy monitoring system Task 3: Monitoring instrumentation procurement and installation Task 4: Customized software programming and implementation Task 5: System troubleshooting, facility operator training, energy data monitoring and collection Task 6: Survey data collection Task 7: Data analysis Task 8: Technology Transfer and Reporting
5.2 BASELINE CHARACTERIZATION
Since the demonstration was designed to be conducted by the method of sequential testing with switching control methods automatically once every two weeks over a one-year period, the baseline period was defined as the first of the two alternating periods. For comparison of fixed pressure control vs. TTR, the baseline period was the period running the fixed pressure control method. For comparison of existing reset method vs. TTR, the baseline period was the period running the existing reset control method. Because there were no mechanical system changes made during the control method switchover, and the baseline methods are from original control system settings, the baseline represents typical operating conditions and adequate time to cover seasonal variations.
26
5.3 DESIGN AND LAYOUT OF TECHNOLOGY COMPONENTS
System Design:
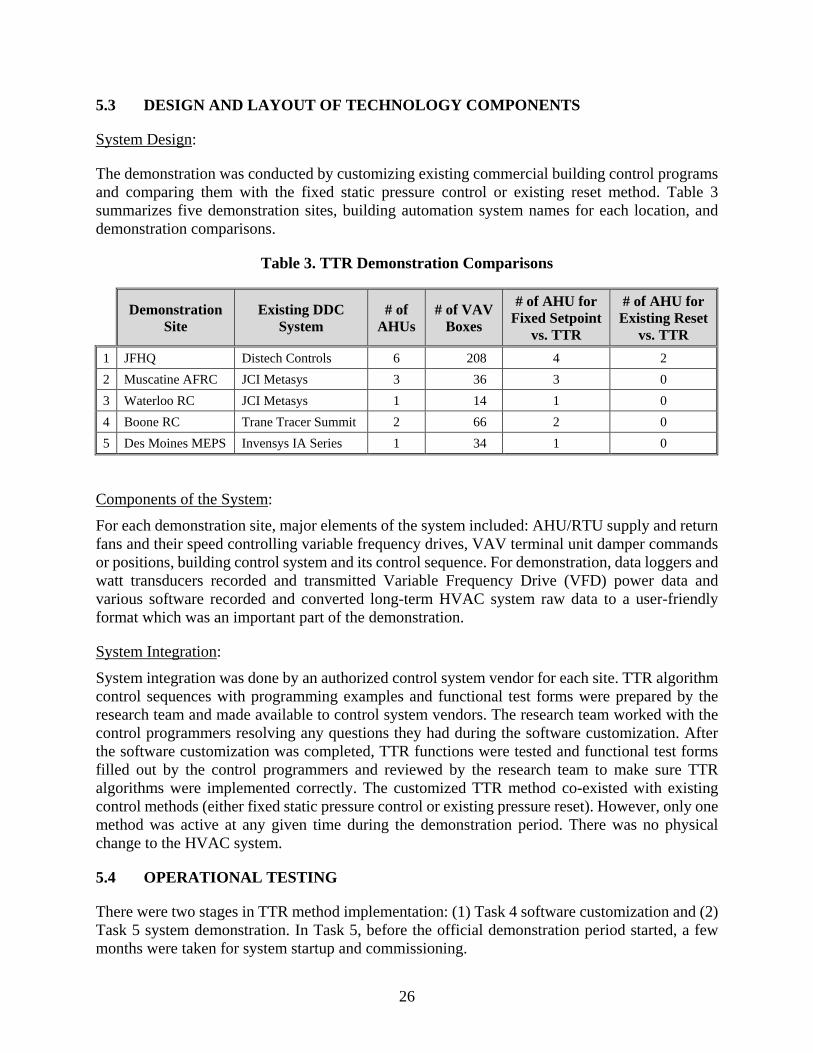
The demonstration was conducted by customizing existing commercial building control programs and comparing them with the fixed static pressure control or existing reset method. Table 3 summarizes five demonstration sites, building automation system names for each location, and demonstration comparisons.
Table 3. TTR Demonstration Comparisons
Demonstration Site
Existing DDC System
# of AHUs
# of VAV Boxes
# of AHU for Fixed Setpoint
vs. TTR
# of AHU for Existing Reset
vs. TTR 1 JFHQ Distech Controls 6 208 4 2 2 Muscatine AFRC JCI Metasys 3 36 3 0 3 Waterloo RC JCI Metasys 1 14 1 0 4 Boone RC Trane Tracer Summit 2 66 2 0 5 Des Moines MEPS Invensys IA Series 1 34 1 0
Components of the System:
For each demonstration site, major elements of the system included: AHU/RTU supply and return fans and their speed controlling variable frequency drives, VAV terminal unit damper commands or positions, building control system and its control sequence. For demonstration, data loggers and watt transducers recorded and transmitted Variable Frequency Drive (VFD) power data and various software recorded and converted long-term HVAC system raw data to a user-friendly format which was an important part of the demonstration.
System Integration:
System integration was done by an authorized control system vendor for each site. TTR algorithm control sequences with programming examples and functional test forms were prepared by the research team and made available to control system vendors. The research team worked with the control programmers resolving any questions they had during the software customization. After the software customization was completed, TTR functions were tested and functional test forms filled out by the control programmers and reviewed by the research team to make sure TTR algorithms were implemented correctly. The customized TTR method co-existed with existing control methods (either fixed static pressure control or existing pressure reset). However, only one method was active at any given time during the demonstration period. There was no physical change to the HVAC system.
5.4 OPERATIONAL TESTING
There were two stages in TTR method implementation: (1) Task 4 software customization and (2) Task 5 system demonstration. In Task 5, before the official demonstration period started, a few months were taken for system startup and commissioning.

27
System startup and commissioning were completed by local control contractors who were trained and authorized to perform control program customization on the existing building control systems. The team developed functional test scripts covering various operating conditions (including extreme conditions), and data for appropriate monitoring and control points were collected and reviewed to make sure the TTR method was correctly implemented. The potential of a rogue zone problem (a zone controlled by a VAV terminal unit with a damper position that is driving the reset strategy a disproportionately large amount of the time) was mitigated during this phase by troubleshooting and conducting a small-scale retrofit on existing HVAC and control systems.
The cost for the control contractors to perform program customization, troubleshoot and debug, add long-term trends for the points of interest, install and configure software for storing and converting HVAC raw data, were collected for cost analysis.
During the official demonstration period, the TTR program and parameters were kept the same. Relevant building HVAC and control system data and AHU fan energy data were continuously recorded for both baseline periods and demonstration periods to study energy savings and control methods stability performance comparisons. IAARNG facility engineers collected the HVAC data locally and sent it to the research team once every two weeks for demonstration monitoring and data analysis.

28
Timeline:
Figure 18 shows the overall timeline for Task 4, 5, 6, and 7 that are related to demonstration and data analysis. The official demonstration period started in July/August 2015, with several months before that for system troubleshooting and preliminary testing.
Figure 18. Demonstration Timeline
5.5 SAMPLING PROTOCOL
During the one-year demonstration period, some AHU/RTU fan energy data were recorded automatically by Onset HOBO data loggers at a minimum of every 15 minutes per sample. Other AHU/RTU fan energy data and other HVAC and controls data were collected by local BAS at one or two-minute intervals. Each building meter is equipped with onboard I/O capabilities and 800 kB storage space to store building electric energy use and can be accessed remotely. Besides technical data collected, all invoices from local building controls contractors were collected for cost analysis and system economics analysis.
5.6 SAMPLING RESULTS
Raw demonstration data were processed for data analysis following the data processing procedure described below:
Step 1: Combine demonstration raw data from different sources.
Step 2: Identify “invalid demonstration dates” and exclude data from those days.
Step 3: Correct fan power data based on reference power meter field measurements.
1 2 3 4 5 6 7 8 9 10 11 12 13 14 15 16 17 18 19 20 21 22 23 24 25 26 27 289/ 14
10/ 14
11/ 14
12/ 14
1/ 15
2/ 15
3/ 15
4/ 15
5/ 15
6/ 15
7/ 15
8/ 15
9/ 15
10/ 15
11/ 15
12/ 15
1/ 16
2/ 16
3/ 16
4/ 16
5/ 16
6/ 16
7/ 16
8/ 16
9/ 16
10/ 16
11/ 16
12/ 16
D D
Task 4 Customize software programming and implementationTask 5 Troubleshooting, energy data monitoring, collection, and analysisTask 6 Survey data collectionTask 7 Data analysisD: Decommissioning
Project and Calendar Months
5
6
7
Task
4

29
Field measurements were taken at multiple fan speeds using reference power meter and compared with either the HOBO data logger readings or VFD readings. All fan power data are corrected based on the established relationship curve from these field measurements. An illustration of field measurements and fan power corrections is shown in Figure 19.
Figure 19. Fan Power Data Correction Illustration
Step 4: Calculate average daily fan energy use and derive average “nominal” weekly fan energy use.

30
Page Intentionally Left Blank

31
6.0 PERFORMANCE ASSESSMENT
6.1 QUANTITATIVE PERFORMANCE
6.1.1 Facility Energy Use
Fan energy savings based on nominal average weekly results:
Results for 11 AHU/RTUs that were evaluated to compare fan energy savings for TTR vs. Fixed Pressure are listed in the following table (Table 4). The baseline period represents the days that the Fixed Pressure method was applied.
Table 4. Summary of TTR Fan Energy Savings Percentage
Site Unit FSP kWh/weekly
TTR kWh/weekly
% Fan % Total Fan
Energy Savings
Energy Savings
#1: JFHQ
AHU-1 555.23 511.69 7.84%
14.41% AHU-4 284.82 247.83 12.99% AHU-9 108.03 50.94 52.85%
AHU-12 3164.47 2714.67 14.21%
#2: Muscatine AFRC RTU-1 19.01 15.97 16.00%
33.53% RTU-3 467.95 352.21 24.73% RTU-4 422.52 282.77 33.08%
#3: Waterloo RC RTU-1 288.83 188.40 34.77% 34.77%
#4: Boone RC AHU-1 602.10 415.45 31.00%
16.47% AHU-2 661.10 651.30 1.48%
#5: Des Moines MEPS AHU-1 454.22 373.23 17.83% 17.83%
In all cases, the TTR method saved fan energy compared to the Fixed Pressure method. The percentage savings for each AHU/RTU, however, vary significantly from 1.5% to 52.9%. The total fan energy savings for the five demonstration sites ranged from 14.4% to 34.8%. The empirical demonstration shows that the TTR method can still save a significant amount of fan energy for various DoD building types with different DDC systems. The demonstration results are reasonable because, in theory, the TTR would save somewhat less energy than the traditional TR method, and the 30% energy saving goal is based on past case studies comparing the traditional TR method to the Fixed Pressure method in non-DoD commercial buildings.
Projected annual fan energy savings for these sites:
Because daily weather conditions may or may not significantly affect AHU/RTU total fan energy use, correlations between total fan energy use and daily average outside air temperatures were explored using scatter plots. Polynomial curve fitting or linear regression was used to express the relationships.

32
Table 5 summarizes the result of projected annual fan energy savings for a one-year demonstration period.
Table 5. Summary of Project Annual Total Fan Energy Savings
Site Unit
FSP Projected Total
Fan Annual Energy Use
(kWh)
TTR Projected Total Fan
Annual Energy Use (kWh)
Projected Annual Total Fan Energy
Savings (kWh)
#1: JFHQ AHU-1, 4, 9 &12 244,459.71 216,932.06 27,527.65 #2: Muscatine AFRC RTU-1, 3 & 4 48,887.73 34,363.39 14,524.34
#3: Waterloo RC RTU-1 16,354.70 10,764.50 5,590.20 #4: Boone RC AHU-1 & 2 67,293.81 58,338.09 8,955.72
#5: Des Moines MEPS AHU-1 23,003.84 17,269.59 5,734.25
6.1.2 Indirect Greenhouse Gas Emissions:
Baseline emissions generated:
Baseline emissions generated = Projected annual building electricity used when AHU/RTUs operated in Fixed Pressure Control mode × Emissions factor (7.03 × 10⁻⁴ metric tons Carbon Dioxide [CO2] / kWh) The emissions factor (7.03 × 10⁻⁴ metric tons CO2 / kWh) is based on Emissions & Generation Resource Integrated Database (eGRID), U.S. annual non-baseload CO2 output emission rate; year 2012 data.
Projected annual building electricity used in the baseline period is calculated based on daily total building electricity use in Fixed Pressure Control mode, normalized for weather.
Table 6. Summary of Baseline Emissions Generated by Each Site
Site
Projected Annual Fan Energy Use
(Baseline, kWh)
Average Fan Energy Use Percentage
Projected Annual Total Building
Energy Use (Baseline, kWh)
Projected Annual GHG Emissions
(metric ton of CO2)
#1: JFHQ 244,460 5.0% 4,860,034 3,416.6 #2: Muscatine AFRC 48,888 15.8% 308,530 216.9
#3: Waterloo RC 16,355 2.5% 645,224 453.6 #4: Boone RC 67,294 12.9% 521,091 366.3
#5: Des Moines MEPS 23,004 5.9% 392,960 276.3
33
Emissions reduction percentages:
The following simple formula is used to calculate emission reduction from reduced use of electricity by AHU/TRU fans:
Emissions reductions = Annual reduction of electricity by AHU/RTU fans (kWh) × Emissions factor (7.03 × 10⁻⁴ metric tons CO2 / kWh)
Indirect Greenhouse Gas Emission reduction percentages are listed in Table 7.
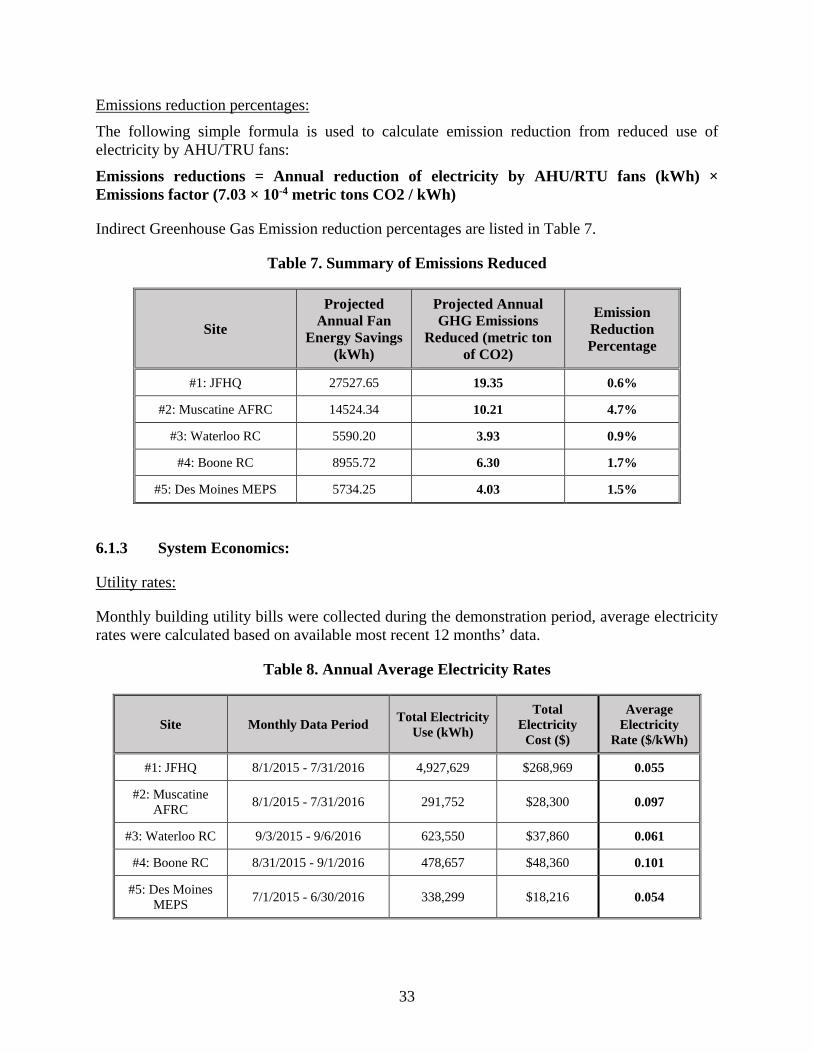
Table 7. Summary of Emissions Reduced
Site
Projected Annual Fan
Energy Savings (kWh)
Projected Annual GHG Emissions
Reduced (metric ton of CO2)
Emission Reduction Percentage
#1: JFHQ 27527.65 19.35 0.6%
#2: Muscatine AFRC 14524.34 10.21 4.7%
#3: Waterloo RC 5590.20 3.93 0.9%
#4: Boone RC 8955.72 6.30 1.7%
#5: Des Moines MEPS 5734.25 4.03 1.5%
6.1.3 System Economics:
Utility rates:
Monthly building utility bills were collected during the demonstration period, average electricity rates were calculated based on available most recent 12 months’ data.
Table 8. Annual Average Electricity Rates
Site Monthly Data Period Total Electricity Use (kWh)
Total Electricity
Cost ($)
Average Electricity
Rate ($/kWh)
#1: JFHQ 8/1/2015 - 7/31/2016 4,927,629 $268,969 0.055
#2: Muscatine AFRC 8/1/2015 - 7/31/2016 291,752 $28,300 0.097
#3: Waterloo RC 9/3/2015 - 9/6/2016 623,550 $37,860 0.061
#4: Boone RC 8/31/2015 - 9/1/2016 478,657 $48,360 0.101
#5: Des Moines MEPS 7/1/2015 - 6/30/2016 338,299 $18,216 0.054

34
Projected annual fan energy cost savings for these sites:
Table 9. Summary of Projected TTR Annual Fan Energy Cost Savings
Site Annual Total Fan Energy
Savings (kWh)
Average Electricity Rate
($/kWh)
Annual Total Fan Energy Cost
Savings ($)
#1: JFHQ 27,527.7 $0.055 $1,514.02
#2: Muscatine AFRC 14,524.3 $0.097 $1,408.86
#3: Waterloo RC 5,590.2 $0.061 $341.00
#4: Boone RC 8,955.7 $0.101 $904.53
#5: Des Moines MEPS 5,734.3 $0.054 $309.65
Energy cost savings vary significantly by site, due to differences in building size, type, function, the number of occupants, and effectiveness of the TTR methods.
Costs for implementing TTR and system troubleshooting/maintenance:
Invoices were collected from four control contractors who were involved in this demonstration project’s TTR implementation, troubleshooting, training, maintenance or repair, and demonstration setup. Costs were analyzed to determine the portion of demonstration, or actual retrofit implementation, training, and troubleshooting or maintenance. Table 16 summarizes the results of costs analysis for the five sites:
Table 10. Summary of TTR Implementation Costs
Site Hardware capital costs
Installation costs Maintenance Operator
training Total Cost
#1: JFHQ $0 $5,850 $1,725 $0 $7,575
#2: Muscatine AFRC $0 $1,043 $323 $1,042 $2,407
#3: Waterloo RC $0 $598 $0 $1,072 $1,671
#4: Boone RC $799 $3,904 $3,782 $2,176 $10,661
#5: Des Moines MEPS $0 $1,875 $1,875 $880 $4,630
Simple Payback:
Simple paybacks are calculated using projected annual energy cost savings divided by the total costs of implementing TTR, training, and maintenance during the first year.
35
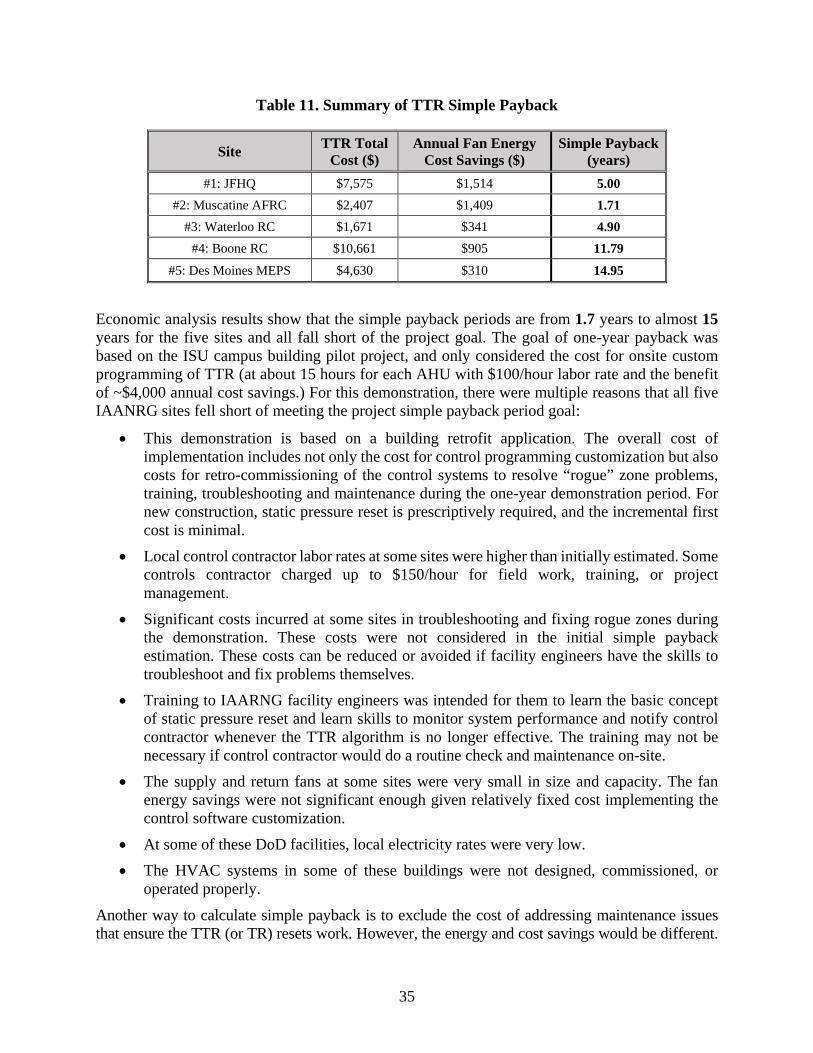
Table 11. Summary of TTR Simple Payback
Site TTR Total Cost ($)
Annual Fan Energy Cost Savings ($)
Simple Payback (years)
#1: JFHQ $7,575 $1,514 5.00 #2: Muscatine AFRC $2,407 $1,409 1.71
#3: Waterloo RC $1,671 $341 4.90 #4: Boone RC $10,661 $905 11.79
#5: Des Moines MEPS $4,630 $310 14.95
Economic analysis results show that the simple payback periods are from 1.7 years to almost 15 years for the five sites and all fall short of the project goal. The goal of one-year payback was based on the ISU campus building pilot project, and only considered the cost for onsite custom programming of TTR (at about 15 hours for each AHU with $100/hour labor rate and the benefit of ~$4,000 annual cost savings.) For this demonstration, there were multiple reasons that all five IAANRG sites fell short of meeting the project simple payback period goal:
• This demonstration is based on a building retrofit application. The overall cost of implementation includes not only the cost for control programming customization but also costs for retro-commissioning of the control systems to resolve “rogue” zone problems, training, troubleshooting and maintenance during the one-year demonstration period. For new construction, static pressure reset is prescriptively required, and the incremental first cost is minimal.
• Local control contractor labor rates at some sites were higher than initially estimated. Some controls contractor charged up to $150/hour for field work, training, or project management.
• Significant costs incurred at some sites in troubleshooting and fixing rogue zones during the demonstration. These costs were not considered in the initial simple payback estimation. These costs can be reduced or avoided if facility engineers have the skills to troubleshoot and fix problems themselves.
• Training to IAARNG facility engineers was intended for them to learn the basic concept of static pressure reset and learn skills to monitor system performance and notify control contractor whenever the TTR algorithm is no longer effective. The training may not be necessary if control contractor would do a routine check and maintenance on-site.
• The supply and return fans at some sites were very small in size and capacity. The fan energy savings were not significant enough given relatively fixed cost implementing the control software customization.
• At some of these DoD facilities, local electricity rates were very low. • The HVAC systems in some of these buildings were not designed, commissioned, or
operated properly.
Another way to calculate simple payback is to exclude the cost of addressing maintenance issues that ensure the TTR (or TR) resets work. However, the energy and cost savings would be different.
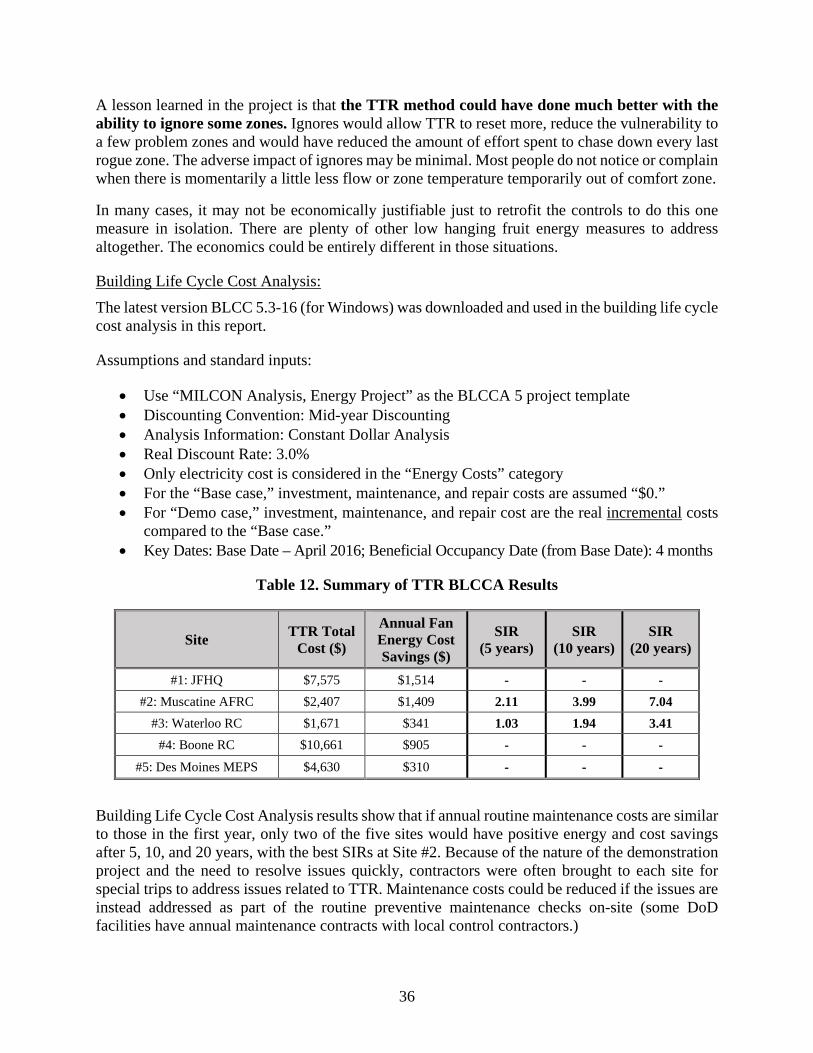
36
A lesson learned in the project is that the TTR method could have done much better with the ability to ignore some zones. Ignores would allow TTR to reset more, reduce the vulnerability to a few problem zones and would have reduced the amount of effort spent to chase down every last rogue zone. The adverse impact of ignores may be minimal. Most people do not notice or complain when there is momentarily a little less flow or zone temperature temporarily out of comfort zone.
In many cases, it may not be economically justifiable just to retrofit the controls to do this one measure in isolation. There are plenty of other low hanging fruit energy measures to address altogether. The economics could be entirely different in those situations.
Building Life Cycle Cost Analysis:
The latest version BLCC 5.3-16 (for Windows) was downloaded and used in the building life cycle cost analysis in this report.
Assumptions and standard inputs:
• Use “MILCON Analysis, Energy Project” as the BLCCA 5 project template • Discounting Convention: Mid-year Discounting • Analysis Information: Constant Dollar Analysis • Real Discount Rate: 3.0% • Only electricity cost is considered in the “Energy Costs” category • For the “Base case,” investment, maintenance, and repair costs are assumed “$0.” • For “Demo case,” investment, maintenance, and repair cost are the real incremental costs
compared to the “Base case.” • Key Dates: Base Date – April 2016; Beneficial Occupancy Date (from Base Date): 4 months
Table 12. Summary of TTR BLCCA Results
Site TTR Total Cost ($)
Annual Fan Energy Cost Savings ($)
SIR (5 years)
SIR (10 years)
SIR (20 years)
#1: JFHQ $7,575 $1,514 - - - #2: Muscatine AFRC $2,407 $1,409 2.11 3.99 7.04
#3: Waterloo RC $1,671 $341 1.03 1.94 3.41 #4: Boone RC $10,661 $905 - - -
#5: Des Moines MEPS $4,630 $310 - - -
Building Life Cycle Cost Analysis results show that if annual routine maintenance costs are similar to those in the first year, only two of the five sites would have positive energy and cost savings after 5, 10, and 20 years, with the best SIRs at Site #2. Because of the nature of the demonstration project and the need to resolve issues quickly, contractors were often brought to each site for special trips to address issues related to TTR. Maintenance costs could be reduced if the issues are instead addressed as part of the routine preventive maintenance checks on-site (some DoD facilities have annual maintenance contracts with local control contractors.)
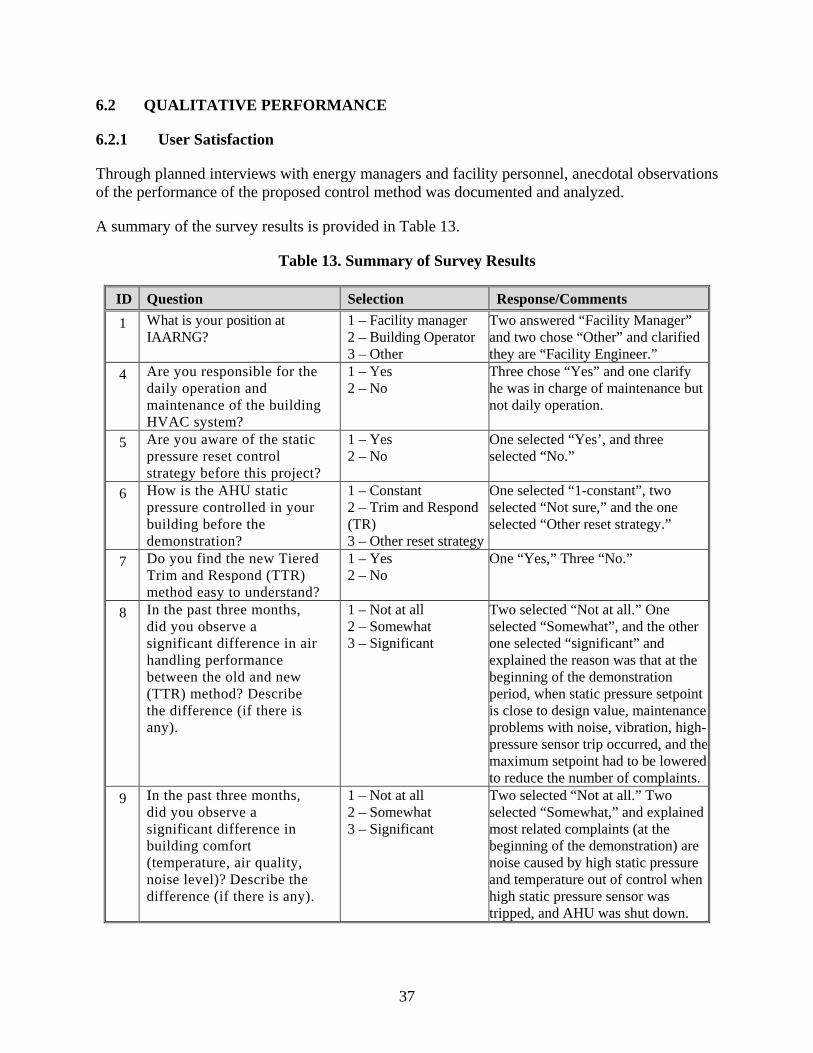
37
6.2 QUALITATIVE PERFORMANCE
6.2.1 User Satisfaction
Through planned interviews with energy managers and facility personnel, anecdotal observations of the performance of the proposed control method was documented and analyzed.
A summary of the survey results is provided in Table 13.
Table 13. Summary of Survey Results
ID Question Selection Response/Comments
1 What is your position at IAARNG?
1 – Facility manager 2 – Building Operator 3 – Other
Two answered “Facility Manager” and two chose “Other” and clarified they are “Facility Engineer.”
4 Are you responsible for the daily operation and maintenance of the building HVAC system?
1 – Yes 2 – No
Three chose “Yes” and one clarify he was in charge of maintenance but not daily operation.
5 Are you aware of the static pressure reset control strategy before this project?
1 – Yes 2 – No
One selected “Yes’, and three selected “No.”
6 How is the AHU static pressure controlled in your building before the demonstration?
1 – Constant 2 – Trim and Respond (TR) 3 – Other reset strategy
One selected “1-constant”, two selected “Not sure,” and the one selected “Other reset strategy.”
7 Do you find the new Tiered Trim and Respond (TTR) method easy to understand?
1 – Yes 2 – No
One “Yes,” Three “No.”
8 In the past three months, did you observe a significant difference in air handling performance between the old and new (TTR) method? Describe the difference (if there is any).
1 – Not at all 2 – Somewhat 3 – Significant
Two selected “Not at all.” One selected “Somewhat”, and the other one selected “significant” and explained the reason was that at the beginning of the demonstration period, when static pressure setpoint is close to design value, maintenance problems with noise, vibration, high-pressure sensor trip occurred, and the maximum setpoint had to be lowered to reduce the number of complaints.
9 In the past three months, did you observe a significant difference in building comfort (temperature, air quality, noise level)? Describe the difference (if there is any).
1 – Not at all 2 – Somewhat 3 – Significant
Two selected “Not at all.” Two selected “Somewhat,” and explained most related complaints (at the beginning of the demonstration) are noise caused by high static pressure and temperature out of control when high static pressure sensor was tripped, and AHU was shut down.

38
The facility engineers have different backgrounds and experience in facility maintenance, and may or may not have expertise in building HVAC systems and controls. Sometimes when HVAC equipment or control issues occurred, they had to coordinate with local mechanical or control contractors to resolve the issues. At three of the five sites, users did not have any additional complaints or differences in comfort level between the existing pressure control method and the TTR method. At one site, however, at the beginning of the demonstration, significant noise, vibration, and tripping of a high static pressure sensor occurred when the static pressure was set by TTR to approach the design values. Improper HVAC system design or commissioning was the key reason, and it significantly affected the effectiveness of the TTR method. IAARNG facility engineers had already lowered static pressure setpoint to almost half of the design value during daily operations to avoid these problems before the official demonstration started.
6.2.2 Scalability across the Department of Defense:
Projected total fan energy savings and demonstration site building gross areas were used to calculate average energy savings per square foot for the demonstration sites. The ratio was used to project energy savings across the IAARNG and DoD facilities. The total building areas for IAARNG was based on the Iowa Public Building Benchmarking Program database (https://ia.b3benchmarking.com/) where all of Iowa Public Defense’ buildings and energy or cost information were entered and their building energy use are benchmarked. DoD’s gross building area number is based on the “Base Structure Report – Fiscal Year 2015 Baseline” [DoD, 2016].
Projected annual energy cost savings are estimated based on projected annual total fan energy savings and average of $0.10/kWh across DoD facilities.
Table 14. Projected Annual Energy Savings per Building Gross Area
Site Unit
FSP Projected Annual
Total Fan Energy Use
(kWh)
TTR Projected Annual
Total Fan Energy Use
(kWh)
Projected Annual
Total Fan Energy Savings (kWh)
Building Area (sq. ft.)
Projected Annual Energy Savings
(kWh/sq. ft.)
#1: JFHQ AHU-1, 4, 9 &12 244,459.71 216,932.06 27,527.65 237,126 0.1161
#2: Muscatine AFRC RTU-1, 3 & 4 48,887.73 34,363.39 14,524.34 37,392 0.3884
#3: Waterloo RC RTU-1 16,354.70 10,764.50 5,590.20 84,764 0.0660 #4: Boone RC AHU-1 & 2 67,293.81 58,338.09 8,955.72 77,321 0.1158
#5: Des Moines MEPS AHU-1 23,003.84 17,269.59 5,734.25 28,200 0.2033
Five Sites: 62,332.17 464,803 0.1341
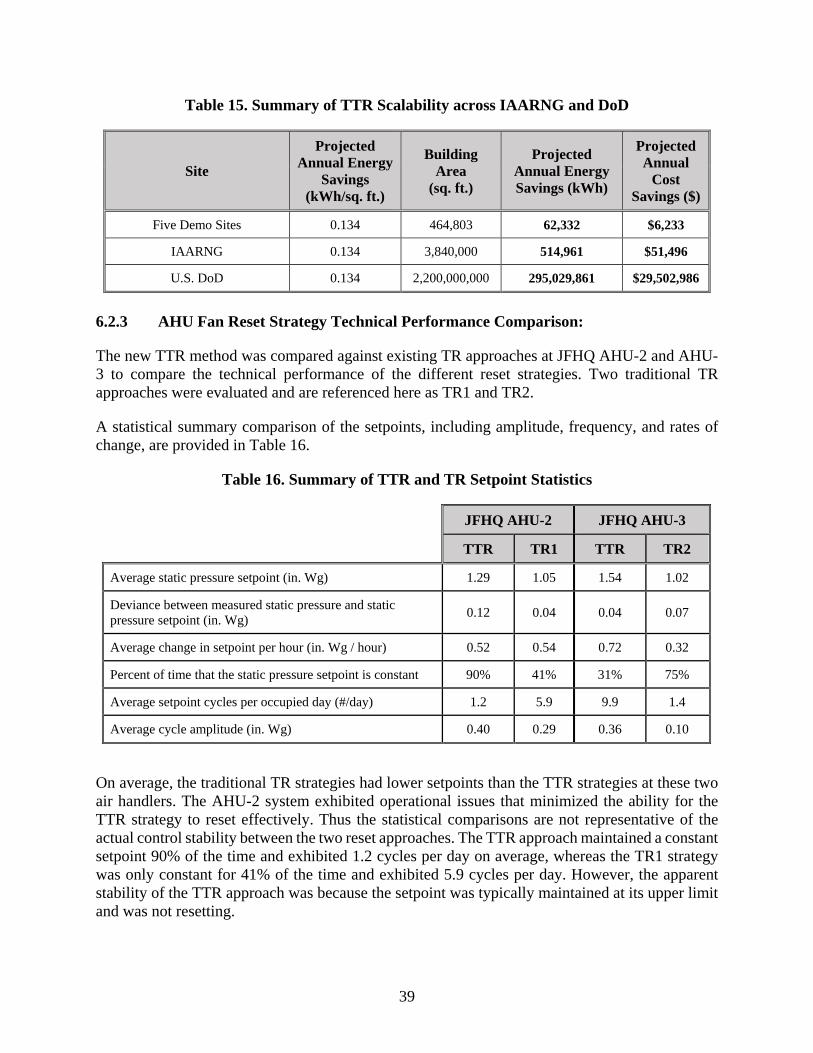
39
Table 15. Summary of TTR Scalability across IAARNG and DoD
Site
Projected Annual Energy
Savings (kWh/sq. ft.)
Building Area
(sq. ft.)
Projected Annual Energy Savings (kWh)
Projected Annual
Cost Savings ($)
Five Demo Sites 0.134 464,803 62,332 $6,233
IAARNG 0.134 3,840,000 514,961 $51,496
U.S. DoD 0.134 2,200,000,000 295,029,861 $29,502,986
6.2.3 AHU Fan Reset Strategy Technical Performance Comparison:
The new TTR method was compared against existing TR approaches at JFHQ AHU-2 and AHU-3 to compare the technical performance of the different reset strategies. Two traditional TR approaches were evaluated and are referenced here as TR1 and TR2.
A statistical summary comparison of the setpoints, including amplitude, frequency, and rates of change, are provided in Table 16.
Table 16. Summary of TTR and TR Setpoint Statistics
JFHQ AHU-2 JFHQ AHU-3
TTR TR1 TTR TR2
Average static pressure setpoint (in. Wg) 1.29 1.05 1.54 1.02
Deviance between measured static pressure and static pressure setpoint (in. Wg) 0.12 0.04 0.04 0.07
Average change in setpoint per hour (in. Wg / hour) 0.52 0.54 0.72 0.32
Percent of time that the static pressure setpoint is constant 90% 41% 31% 75%
Average setpoint cycles per occupied day (#/day) 1.2 5.9 9.9 1.4
Average cycle amplitude (in. Wg) 0.40 0.29 0.36 0.10
On average, the traditional TR strategies had lower setpoints than the TTR strategies at these two air handlers. The AHU-2 system exhibited operational issues that minimized the ability for the TTR strategy to reset effectively. Thus the statistical comparisons are not representative of the actual control stability between the two reset approaches. The TTR approach maintained a constant setpoint 90% of the time and exhibited 1.2 cycles per day on average, whereas the TR1 strategy was only constant for 41% of the time and exhibited 5.9 cycles per day. However, the apparent stability of the TTR approach was because the setpoint was typically maintained at its upper limit and was not resetting.

40
Air handler AHU-3 provided a more suitable case to analyze data, where the TTR strategy appears to adapt to feedback more often and responded faster than traditional static pressure requests. Ten cycles per work day on average is a stable and well-performing control sequence. The TR2 strategy operated at its lower limit for a large percentage of the time which skews the apparent stability.
41
7.0 COST ASSESSMENT
7.1 COST MODEL
A simple cost model for implementing the TTR technology is presented in Table 17. Cost estimates are based on actual costs for the five demonstration sites.
Table 17. Cost Model for TTR Implementation
Cost Element
Site #1 (6 AHUs
& 208 VAVs)
Site #2 (3AHUs
& 36 VAVs)
Site #3 (1 AHU
& 14 VAVs)
Site #4 (2 AHUs
& 66 VAVs)
Site #5 (1 AHU
& 34 VAVs)
Cost Range
Hardware Capital Costs $0 $0 $0 $799 $0 $0–$799
Installation Costs $5,850 $1,043 $598 $3,904 $1,875 $598–$5,850
Maintenance $1,725 $323 $0 $3,782 $1,875 $0–$3,782
Operator Training $0 $1,042 $1,072 $2,176 $880 $0–$2,176
Site Totals $7,575 $2,407 $1,671 $10,661 $4,630 $1,671–$10,661
The cost elements are explained below:
Hardware capital: There should not be any hardware capital costs for implementing the TTR method on existing DDC systems. There could be some hardware capital costs associated with correcting “rogue” zones to improve the TTR method control performance, such as replacing failed temperature sensor or VAV differential pressure sensor.
Installation: This is the labor cost for the controls contractor to implement the TTR method on-site according to TTR method control sequence specification. Typically this cost varies depending on the control technician or engineer’s charged rate, skills, and the number of AHU and VAVs involved.
Maintenance: Cost related to troubleshooting and fixing of various mechanical and control issues that prevented effective TTR algorithm. Typically this is done by a controls contractor.
Operator training: Training needed for building operators and local facility engineers to understand the TTR method theory, operation, maintenance, system monitoring, and data collections. Typically this is done by a controls contractor.
The installation cost increased approximately proportionally with the number of AHUs. The sizes of the supply and return fans do not matter much. The maintenance costs were largely dependent on how well the HVAC system was commissioned, maintained, operated, and the service rate for control contractors.

42
The biweekly control strategy changes at all five sites were done automatically through simple programming by local controls contractors. It took a few hours of contractors’ time to set it up at each location. Since the biweekly control mode switchover is only needed for this demonstration project and not part of a normal retrofit project, the labor costs for programming the biweekly switchover is not counted in the TTR implementation cost. For a retrofit application, changing control mode from Fixed Pressure Control to TTR/TR would be a single event, and the cost would be minimal.
Since TTR implementation cost is mostly labor cost, control contractors’ labor rates are a significant factor in the overall cost. The control contractors charged between $100 to $150 per hour during this demonstration project for implementing TTR program and troubleshooting control/HVAC issues on-site. Some contractors also charge program manager’s time for managing projects.
The more AHU or RTU units that are involved in implementing TTR, the more time is needed in custom programming and troubleshooting of TTR. The more VAV terminal units that are controlled by one AHU or RTU, the higher chance that TTR will not be effective in saving energy – if the TTR method does not have the capability to ignore a certain number of rogue zones.
Buildings with high-quality control hardware and software and those are sufficiently maintained will have fewer operational issues that may adversely impact the effectiveness of the TTR algorithm. Problems with control sensors, actuators, building HVAC network and communication could all have a negative impact on the overall effectiveness of TTR. The need to have control contractors troubleshooting to resolve these issues on-site added increased maintenance cost.
If a mechanical system was not properly designed or there were many alterations to the original building space and mechanical system, TTR may not be effective. Each terminal units’ parameters should be carefully reviewed and units commissioned. Mechanical system operations should follow design intent. Otherwise, costs related to troubleshooting and fixing these issues could be significant over time.
Scalability is not an issue for TTR implementation. It is desirable and more cost effective to implement TTR on systems with large AHUs or RTUs. The cost for TTR software customization is not proportionally higher for larger AHU or RTUs, but the benefit of fan energy savings could be significantly more.
7.2 COST DRIVERS
When selecting the technology for future implementation, factors discussed in the previous section should be fully considered. The most significant cost comes from installation and tuning of the TTR method. Maintenance cost of fixing various issues comes second. Improper monitoring and maintenance of HVAC and building control systems could reduce the effectiveness of TTR method long-term. Unfortunately, DoD facility maintenance staff often do not have enough time to perform detailed monitoring of HVAC system operations and performances. When problems occur, the control contractors often need to be called for an on-site investigation. A facility in need of maintenance or rebalancing may experience difficulties in the initial commissioning of the system after TTR implementation. TTR (or TR) method costs could be minimized and benefit maximized if:

43
• Local control contractor labor rate is reasonable, and service quality is good.
• Mechanical system design is appropriate, and the system is operated as intended.
• Mechanical system has significant fan energy use.
• Problems with existing control system hardware and software are minimal.
• Incorporating the ability to ignore some rogue zones.
7.3 COST ANALYSIS AND COMPARISON
Overall first year costs for implementing TTR, training, and maintenance vary considerably from $1,671 to $10,661. Differences in cost are expected because the size, capacity of the HVAC systems and building control systems involved at the five sites were all different. While the lowest cost (Site #3) was due to a smaller HVAC system (only one RTU and 14 VAV terminal units), the highest cost (Site #4) was not the site with the largest building space and the most complicated HVAC system. The reason for the high cost at Site #4 is mainly due to its higher labor rate, and labor cost required for troubleshooting and fixing issues related to normal operation and control of the two AHUs and 66 VAV terminal units due to its older mechanical and building control system.
It is recommended that TTR/TR training can be included in existing facility engineer’s routine professional training, be part of a new construction project delivery process, or be part of an onboarding training for new facility engineers. The TTR implementation, training, re-commissioning, and troubleshooting for rogue zone problems could also be implemented by a controls contractor who might be in the building for routine maintenance, lowering overall cost.

44
Page Intentionally Left Blank
45
8.0 IMPLEMENTATION ISSUES
8.1 REGULATIONS AND PERMITS REQUIRED
For new construction, static pressure reset is a prescriptive requirement in ASHRAE Standard 90.1 when there is DDC control at the zone level. This requirement may also apply to significant HVAC additions or alterations, but otherwise generally does not apply to existing buildings. Minor control retrofits, including programming changes, generally do not require permitting.
There is no special permit required to implement the static pressure reset strategy.
8.2 PROCUREMENT ISSUES
Implementation of static pressure reset can be performed by a trained or qualified controls contractor or a building controls manufacturer with commercial, off-the-shelf building controls software. For VAV systems, only custom programming changes are required; no additional hardware is necessary. It is worth mentioning that different building control systems may have their proprietary control software or programming packages with various features and capabilities.
Hiring a good, qualified controls contractor with reasonable labor rate is the most important factor in making procurement decisions. Besides having programming expertise to use the proprietary building controls software or programming package, the selected controls contractor should also be knowledgeable on overall HVAC system control sequence and operations, as well as possess troubleshooting skills related to mechanical and control issues.
8.3 COMMISSIONING ISSUES
After custom programming of TTR by a controls contractor, commissioning of the TTR implementation should be completed to verify the TTR code runs as intended. Commissioning efforts should also include a review of setpoint reset strategies to check that the resets are operating effectively, tune them as necessary, and identify any potential rogue zones. The review should occur in different seasons or different weather conditions if possible. Any rogue zones identified should be investigated to determine the cause.
During the demonstration, the following commissioning issues were encountered:
• Incorrectly implemented TTR sequence. One control manufacturer initially had difficulty correctly implementing the sequence. The main problem was that the proprietary programming tool (Logic Connector Tool from Johnson Controls) could not run at specific time intervals (e.g., once every 90 seconds). The problem was discovered during the functional testing. Eventually, the controls programmer found a workaround to fix the issue. Other controls contractors did not have problems implementing TTR.
• Control contractors needed training on how to conduct TTR functional test and fill out the functional test form.

46
• Initial TTR parameters, as suggested in the TTR specification, needed tuning to make the system work as intended. Early in the initial demonstration, instances of excessive static pressure oscillation were present in nearly all TTR days across each site. Static pressure control oscillated heavily with the initial TTR parameters showing cases of quick ramp-ups and downs in static pressure. TM and RP rates for all AHUs and RTUs were adjusted smaller and time interval for TTR program execution were extended. Because of this problem, the TTR method did not show advantage in terms of stability and ease of parameter tuning compared to traditional TR method.
During the commissioning of TTR, the most challenging and time-consuming tasks were identifying any potential rogue zones, troubleshooting the cause, and fixing the problems. Major issues can be categorized into three main categories: HVAC system design issues; building operations issues; mechanical and control hardware and software issues.
8.3.1 HVAC System Design Issues
In retrofit applications, the cost effectiveness of implementing static pressure reset may be improved if done in conjunction with other controls improvements and upgrades to take advantage of synergies with other measures and economies of scale with contractor programming and mobilization efforts. With DDC to the zone, typical retro-commissioning measures include demand-based supply air temperature and duct static pressure reset, dual maximum VAV logic with low VAV minimums, fixing faulty economizers and control valve leakage, and scheduling updates. In particular, low VAV minimum airflow setpoints has a direct impact on the savings potential for static pressure reset. Recent studies [Taylor, 2012] [Arens, 2015] [Kaam, 2017] have shown that VAV zones commonly spend a large percentage of time in deadband mode at minimum airflow setpoint. Unnecessarily high minimums may risk overcooling spaces and limit the turndown capability of the fans, which would reduce savings potential for static pressure reset.
Proper HVAC system design is one of the key factors in successful implementation of static pressure reset strategies. Improper system design not only can result in oversized or undersized equipment (AHU, RTU, VAV terminal units), but also noisy ducts, falling debris, and AHU shut down due to high static pressure. Some zones could be permanent “rogue” zones, making TTR method ineffective. For buildings with both VAV and radiant floor heating systems controlling the same zones, care should be taken in the control design of both systems, so simultaneous heating and cooling is minimized. For HVAC system retrofit during building additions and alterations, overall HVAC system modification design should be reviewed to make sure all VAV terminal units have the proper AHU supply air temperature and static pressure to handle zone heating and cooling loads.
Reset strategies that rely on zone demand should incorporate a mechanism to identify rogue zones or those zones that continuously drive the reset logic. Design should include monitoring graphics requirements to include zone summary tables of all main zone parameters, including which zones are generating requests and their cumulative request-hours. Alarms should provide notification to operators of rogue zones. See ASHRAE Guideline 36 and Taylor [2015] for more information.
In theory, static pressure reset strategy should work if HVAC system design is done properly and system operations run as intended. All zones should be controlled within design heating and cooling setpoints. In practice, perfect design and operation unfortunately almost never happen.
47
Therefore, static pressure reset strategy should incorporate a user-adjustable mechanism to ignore certain zones from reset logic, whether specific individual zones are locked out, or there is a generic number of zones that can be ignored. Some practitioners use an importance multiplier and number of ignores described in Guideline 36 to accomplish both options. The importance multiplier also provides the ability to weight the demand more heavily in some zones than others.
Supply air temperature and duct static pressure control could affect each other. Operating with warmer supply air temperatures results in the need for more airflow, which may, in turn, impact the ability of the static pressure setpoint to reset. Resetting AHU supply air temperature based on Outside Air Temperature (OAT) may be problematic in that it is not a feedback-based control strategy, and OAT is not always representative of thermal load (e.g., interior zones not impacted by OAT).
Some practitioners suggest the AHU/RTU supply and return fan minimum speed should be set to no more than 10%, or to whatever makes the fan wheel turn when starting from a stop, in order to fully realize the potential fan power reductions during periods of low airflow. Many operators insist on maintaining a 20%–25% minimum speed to protect the motor from overheating.
The designer should take care to avoid creating excessively critical zones, e.g., a CAV zone that has a long duct run with high pressure drop.
The designer should also include graphics requirements showing a basic time-series trend graph of static pressure and setpoint to facilitate review of the reset operation by simple inspection and to remove the obstacle of requiring the operator to navigate through the front-end trend historians, which are often cumbersome to set up.
8.3.2 Building Operation Issues
HVAC system operation based on design intent is the second most important factor in effective static pressure reset implementations. Improper or irregular building operation often results in “rogue” zones. Operation issues such as:
• Boiler and chiller on/off not determined automatically based on actual building heating and cooling loads
• Airflow setpoints increased above design values • Zone temperature setpoints set too low; setpoint adjustments should be limited in software • Airflow restrictions (e.g., flex duct compressed, poorly designed fittings, undersized ducts,
volume dampers incorrectly set, fire damper closed) • Incorrect calibration factors at VAV box controllers • AHU air-side economizer not working properly
Operators, especially DoD facility engineers, often do not have the time, expertise, or resources to monitor system performance for energy efficiency carefully. Typically, other issues such as addressing failed equipment, occupant complaints, and performing preventative maintenance take a higher priority. To ensure the systems continue to operate efficiently, alternative means to monitor performance should be considered, such as AFDD, energy monitoring dashboards that highlight performance degradation, advanced building analytics, or periodic re-commissioning.
48
8.3.3 Mechanical and Control Hardware and Software Issues
Mechanical and control hardware and software issues are other factors that could significantly reduce the effectiveness of static pressure reset. Issues such as:
• Old DDC systems may need to be upgraded. • Failed thermostats and VAV differential pressure sensors can lead to rogue zones, making
pressure reset ineffective. • Failed AHU economizer control can lead to high supply air temperature rogue zone
problem as well. • Building control network problem or interruption may prevent the TTR algorithm to run
properly. • Failed VFD drives can result in zone temperature out of control.
When these problems occur, mechanical or control contractors should be contacted for investigation and repair or replacement.
8.4 FACILITY ENGINEER TRAINING
Facility engineers should be trained to understand how the trim and respond reset is intended to operate and which settings are adjustable to maintain stability and balance energy efficiency with achieving setpoints. It is also desirable that facility engineers be trained to identify rogue zones and what to do about them. Ignoring some rogue zones may improve system reset performance but at the cost of further limiting airflow to those spaces, which results in poor zone temperature control. Care should be taken when applying temporary overrides to address short-term issues. Setpoint overrides should be done with an expiration, if possible, to avoid the risk of forgetting to restore to automatic control. Setpoint overrides can also often be reviewed through an audit feature in many control systems.
However, because of diverse backgrounds and experience with DDC, DoD facility engineers may or may not fully understand the theory or essence of the reset strategy and why it can save fan energy. Therefore, it is important for a controls contractor to create simple graphics to identify rogue zones easily. The controls contractor should then be called to investigate the cause of the problem and recommend adjustments.
8.5 END-USER CONCERNS, RESERVATIONS, AND DECISION-MAKING FACTORS
For this demonstration, the only end-user concern was at one site where occupant experienced significant noise from AHU fans ramping up and down, debris falling from the ceiling and temperature discomfort (due to AHU tripping on high static pressure) when AHU static pressure was running at or close to design setpoint. As discussed before, this was mainly due to HVAC system design flaws and improperly tuned TTR parameters. The facility engineer at this site had previously lowered the normal operating static pressure to a much lower value. There were no other significant complaints from occupants or facility engineers during the one-year demonstration period.

49
For new construction, static pressure reset is a prescriptive requirement in ASHRAE Standard 90.1 when there is DDC control at the zone level. This requirement may also apply to significant HVAC additions or alterations. Potential DoD fixed installation applications are in existing buildings that have VAV systems with zone-level DDC but are still using the fixed static pressure control strategy. From energy saving and system economic analysis results based on this demonstration, the decision-making factors regarding switching to static pressure reset strategy (either TTR or TR) could include:
• HVAC system design • Local utility’s electricity rate • Local controls contractor’s labor rate, service capability, and quality of work • AHU/RTU system’s size and overall fans energy use • Existing mechanical and building control systems’ condition, quality, and stability • DoD facility engineer’s familiarity with DDC system, time available to continue
monitoring HVAC system’s performance, and expertise to resolve related mechanical and control problems
From this demonstration project, the energy savings and system economics at the five IAARNG buildings are somewhat lower than previously estimated due to many factors. It is predicted that practitioners can find ways to improve the algorithm to make things work better in real buildings in the future. For example, by allowing some zones to be ignored from the reset strategy, the operator is implicitly sacrificing airflow and potentially temperature control in some spaces for minimizing energy use. Occupants often do not complain when zone temperatures are off a few degrees compared to setpoints. Automated Fault Detection and Diagnostics (AFDD) could be a useful tool for facility engineers and control contractors to quickly identify rogue zones and fix problems, maximizing energy and cost savings.
8.6 THE BEST DOD FIXED INSTALLATION APPLICATIONS
Based on the findings from the demonstration, the best DoD fixed installation applications for TTR method (or traditional TR method) in a building retrofit project would be a combination of the following:
• The majority of the HVAC systems are forced-air variable-air-volume systems with DDC control at the zone level. This method is not applicable to other HVAC systems such force-air constant-air-volume system, radiant heating and cooling system, heat pump system, fan coil units, unit ventilators, and chilled beam systems.
• Common applicable DoD fixed installation building types include JFHQ medium or large offices, classrooms, auditoriums, reserve centers, and armories. Other building types such as apartments, multi-family housing, maintenance repair shops, warehouses, or motor vehicle storage buildings may be less applicable.
• The building’s VAV systems have large AHU/RTU supply and return fans. The supply fan power is at least 3 horsepower at design condition.
• Local utility’s average aggregated electricity rate is at or above the national average with at least more than 10–12 cents per kWh.

50
• Local controls contractor is reputable and reliable and offers reasonable field service rate (less than $120 per hour.)
• The building’s VAV systems are well-maintained, commissioned, and operated as designed. The DDC system is not too old (less than ten years old) or obsolete.
• DoD facility engineers have a good understanding of how DDC system works, and have the capability of troubleshooting and fixing general AHU/RTU and VAV terminal unit mechanical and control problems.
51
9.0 REFERENCES
1. Arens, E., H. Zhang, T. Hoyt, S. Kaam, F. Bauman, Y. Zhai, G. Paliaga, J. Stein, R.Seidl, B. Tully, J. Rimmer, J. Toftum. 2015. Effects of diffuser airflow minima on occupant comfort, air mixing, and building energy use (RP-1515), Sci.Technol. Built Environ. 21 1075–1090, pendixhttp://dx.doi.org/10.1080/23744731.2015.1060104 .
2. ASHRAE. 2010. ANSI/ASHRAE/IESNA Standard 90.1- 2010: Energy Standard for Buildings Except Low-Rise Residential Buildings. ISSN 1041-2336.
3. ASHRAE. 2011. 2011 ASHRAE Handbook – HVAC Applications. ISSN 1078-6074.
4. California Energy Commission. 2008. Title 24 Building Energy Efficiency Standards. http://www.energy.ca.gov/title24/.
5. Department of Defense, Base Structure Report – Fiscal Year 2015 Baseline, http://www.acq.osd.mil/eie/Downloads/BSI/Base%20Structure%20Report%20FY15.pdf.
6. Hartman, T. 1993. Terminal Regulated Air Volume (TRAV) systems. ASHRAE Transactions 99(1):791-800.
7. Hydeman, M. and J. Stein. 2003. A Fresh Look at Fans: Preliminary Findings from California Research Project Provide Insight into Fan Design and Energy Savings. Heating/Piping/Air Conditioning Engineering (5).
8. Kaam, S., P. Raftery, H. Cheng, G. Paliaga. 2017. Time-Averaged Ventilation for optimized control of Variable-Air-Volume systems, Energy Build. 139. http://dx.doi.org/10.1016/j.enbuild.2016.11.059
9. Kimla, W. 2009. Optimized Fan Control in Variable Air Volume HVAC System Using Static Pressure Resets: Strategy Selection and Savings Analysis. Master Thesis. Texas A&M University.
10. Nelson, R., and B. Householder. 2011. Final Report for Iowa Energy Center Grant 90-86: A Study on Static Pressure Reset and Instability in Variable Air Volume HVAC systems. http://www.iowaenergycenter.org/wp-content/uploads/2013/01/Static-Pressure-Reset-Final-Report_Secured-file.pdf
11. Taylor, S. 2007. Increasing Efficiency with VAV System Static Pressure Setpoint Reset. ASHRAE Journal June 2007:24– 32.
12. Taylor, S., J. Stein, G. Paliaga, H. Cheng. 2012. Dual maximum VAV box control logic, ASHRAE Journal. 54:16–24
13. Taylor, S. 2015. Resetting Setpoints Using Trim & Respond Logic. ASHRAE Journal November 2015:52-57.

52
14. U.S. Department of Energy. 2012. 2011 Buildings Energy Data Book. http://buildingsdatabook.eren.doe.gov/.\\Wang, J. and Y. Wang. 2008. Performance Improvement of VAV Air Condition System Through Feedforward Compensation Decoupling and Genetic Algorithm. Applied Thermal Engineering 28:566-574.

A-1
APPENDIX A POINTS OF CONTACT
Project team members, support staff, subcontractor, and DDC system vendors:
Point of Contact Name
Organization Name
Address
Phone Email Role in Project
Xiaohui Zhou Iowa Energy Center 2521 University Blvd. Ste. 124
Ames, IA 50010-8629
515-965-7055; [email protected]
PI
Kimberly Dickey* Iowa Army National Guard 7105 NW 70th Avenue
Johnston, IA 50131-1824
Co-PI
Steve Taylor Taylor Engineering 1080 Marina Village Parkway,
Suite 501 Alameda, CA 94501-1142
510-749-9135; [email protected]
Co-PI, Subcontractor
Britta Sandberg Iowa Energy Center 2521 University Blvd. Ste. 124
Ames, IA 50010-8629
515-294-3332; [email protected]
IEC contract coordinator
Heather Peterson Iowa State University Sponsored Programs Accounting
2221 Wanda Daley Drive Administrative Services Building,
Room 1810 Ames, IA 50011-1004
515-294-5330; [email protected]
ISU financial reporting
Brian Schmidt Iowa Department of Public Defense
7105 NW 70th Avenue Johnston, IA 50131-1824
MIPR contract administration
Troy Barker Iowa Energy Center 2521 University Blvd. Ste. 124
Ames, IA 50010-8629
515-382-5766; [email protected]
IEC team member
Nicholas Haberl**
Iowa State University Sponsored Programs Accounting
2221 Wanda Daley Drive Administrative Services Building,
Room 1810 Ames, IA 50011-1004
IEC team member
Yi Liu Iowa State University Sponsored Programs Accounting
2221 Wanda Daley Drive Administrative Services Building,
Room 1810 Ames, IA 50011-1004
515-965-7055; [email protected]
IEC team member

A-2
Point of Contact Name
Organization Name
Address
Phone Email Role in Project
Ganesh Krishnan Iowa State University Sponsored Programs Accounting
2221 Wanda Daley Drive Administrative Services Building,
Room 1810 Ames, IA 50011-1004
515-965-7055; [email protected]
IEC team member
Jeff Stein Taylor Engineering 1080 Marina Village Parkway,
Suite 501 Alameda, CA 94501-1142
(510) 749-9135; [email protected]
Subcontractor, Engineer
Hwakong Cheng Taylor Engineering 1080 Marina Village Parkway,
Suite 501 Alameda, CA 94501-1142
(510) 749-9135; [email protected]
Subcontractor, Engineer
Eric Challen Iowa Army National Guard 7105 NW 70th Avenue
Johnston, IA 50131-1824
(515) 210-1025; [email protected]
IAARNG Facility Engineer
David Shea Iowa Army National Guard 7105 NW 70th Avenue
Johnston, IA 50131-1824
515-250-6107; [email protected]
IAARNG Facility Engineer
Jeff Heddens Iowa Army National Guar 7105 NW 70th Avenue
Johnston, IA 50131-1824d
(515) 252-4766; [email protected]
IAARNG Facility Engineer
David Umland Iowa Army National Guard 7105 NW 70th Avenue
Johnston, IA 50131-1824
515-252-4489; [email protected]
IAARNG Facility Engineer
David Wingert Woodman Controls 813 SW Ordnance Road
Ankeny, IA 50023
515-964-0904; [email protected]
DDC programmer
Bill Ware Baker Group 4224 Hubbell Avenue Des Moines, IA 50317
515-208-3074; [email protected]
DDC programmer
Joh Hamilton Johnson Controls 1351 60th Street NE
Cedar Rapids, IA 52402
319-395-0007; [email protected]
DDC programmer
Jason Terry Johnson Controls 1351 60th Street NE
Cedar Rapids, IA 52402
319-395-0007; [email protected]
DDC programmer
Michael Abbott Halvorson Trane 2220 NW 108th St.
Clive, IA 50325
515-270-0004; [email protected]
DDC programmer
*Kimberly Dickey left Iowa Army National Guard in September, 2016.
** Nick Haberl graduated from Iowa State University in summer, 2016.
A-3
Project sponsor contacts:
Point of Contact Name
Organization Name
Address
Phone Email Role in Project
Timothy Tetreault U.S. Department of Defense
4800 Mark Center Drive, Suite 17D08
Alexandria, VA 22350-3605
571-372-6397;
DoD ESTCP EW Program Manager
Sarah Medepalli Noblis 2002 Edmund Halley Drive
Reston, VA 20191
703-610-2158; [email protected]
DoD ESTCP EW Program Area
Technical Assistant Stephanie Smith Noblis
2002 Edmund Halley Drive Reston, VA 20191
703-610-2817; [email protected]
DoD ESTCP EW Program Area
Technical Assistant Meredith
McKinney U.S. Army Corps of
Engineers 441 G Street NW
Washington, DC 20314-1000
[email protected] Contract Specialist

A-4
Page Intentionally Left Blank