Sådan bliver du klar til nyt digital projekt morgeninspiration 190315
Upload
cambridgeshireinsightCategory
view
239download
2
Demography &
Pupil Forecasting
Sarah Bedford, Nicola Gowers, Anna Jones,
Lawrence Morris, Alan Fitz
19th March 2015
Who are we?Hopefully, most of you know…
• The County Council’s central research & information section.
• We provide a wide variety of information on the people and economy of Cambridgeshire in order to help plan services for the county.
• Our work is divided up into a number of specific research areas including:
– Informing policy and service development
• Population and demographic areas
• School pupil forecasting
• Economic and labour market analysis
• Crime & community safety research
• Housing research
• Health data
• Deprivation research
• Census and Quality of Life information
– Consultations & surveys
– Data dissemination
LARF (Local Area Research Fortnight)
• Mon 16th: Who we are, Cambridgeshire Insight and Open Data
• Thurs 19th: Demography and Pupil Forecasting
• Mon 23th: Economy and Housing
• Thurs 26th: Consultations, Customer Insight, and Community Safety
• 16-27 March Lunchtime drop-ins, Room 015
The next 30 mins…
• Overview of pupil forecasting
• Overview of demography
– Population forecasts
• Over 65s
– Migration
• Our Data
– Visualisation
– Reports
• Questions
Pupil Forecasting
• What we do….
– Forecasts: school, catchment, district
– New communities forecasts
– School Census analysis
• Why we do it…
– School place planning
– To inform budgets
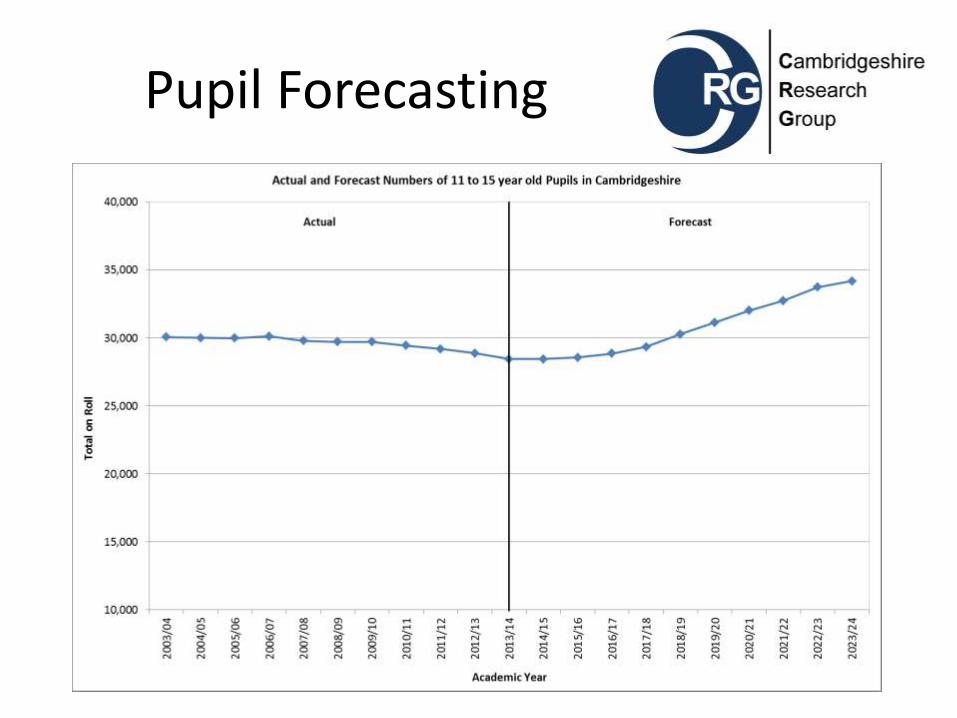
Pupil Forecasting
Demography
• What we do….
– Population estimates and forecasts
– Dwelling stock estimates and forecasts
– Migration
– Population characteristics
• Why we do it…
– Business planning, provision of services
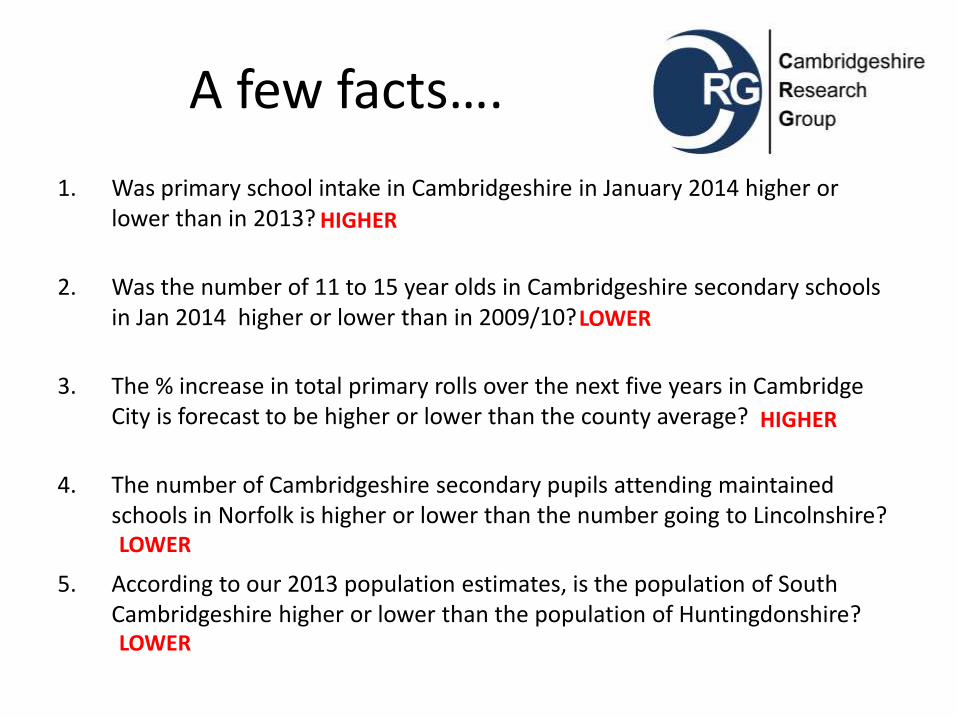
A few facts….
1. Was primary school intake in Cambridgeshire in January 2014 higher or lower than in 2013?
2. Was the number of 11 to 15 year olds in Cambridgeshire secondary schools in Jan 2014 higher or lower than in 2009/10?
3. The % increase in total primary rolls over the next five years in Cambridge City is forecast to be higher or lower than the county average?
4. The number of Cambridgeshire secondary pupils attending maintained schools in Norfolk is higher or lower than the number going to Lincolnshire?
5. According to our 2013 population estimates, is the population of South Cambridgeshire higher or lower than the population of Huntingdonshire?
HIGHER
HIGHER
LOWER
LOWER
LOWER
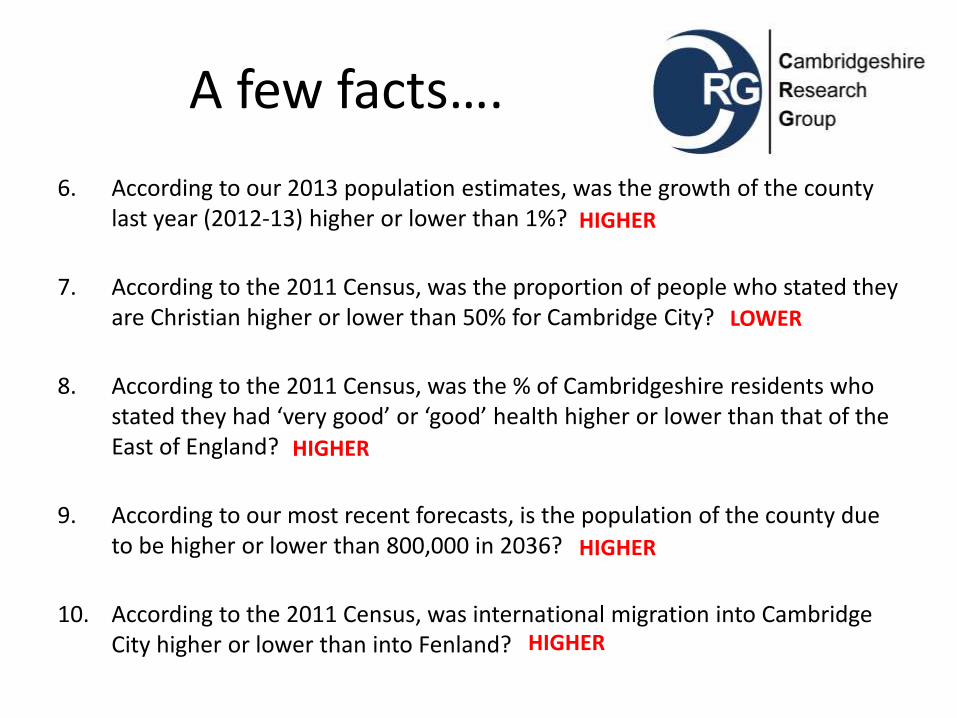
A few facts….
6. According to our 2013 population estimates, was the growth of the county last year (2012-13) higher or lower than 1%?
7. According to the 2011 Census, was the proportion of people who stated they are Christian higher or lower than 50% for Cambridge City?
8. According to the 2011 Census, was the % of Cambridgeshire residents who stated they had ‘very good’ or ‘good’ health higher or lower than that of the East of England?
9. According to our most recent forecasts, is the population of the county due to be higher or lower than 800,000 in 2036?
10. According to the 2011 Census, was international migration into Cambridge City higher or lower than into Fenland?
HIGHER
HIGHER
LOWER
HIGHER
HIGHER
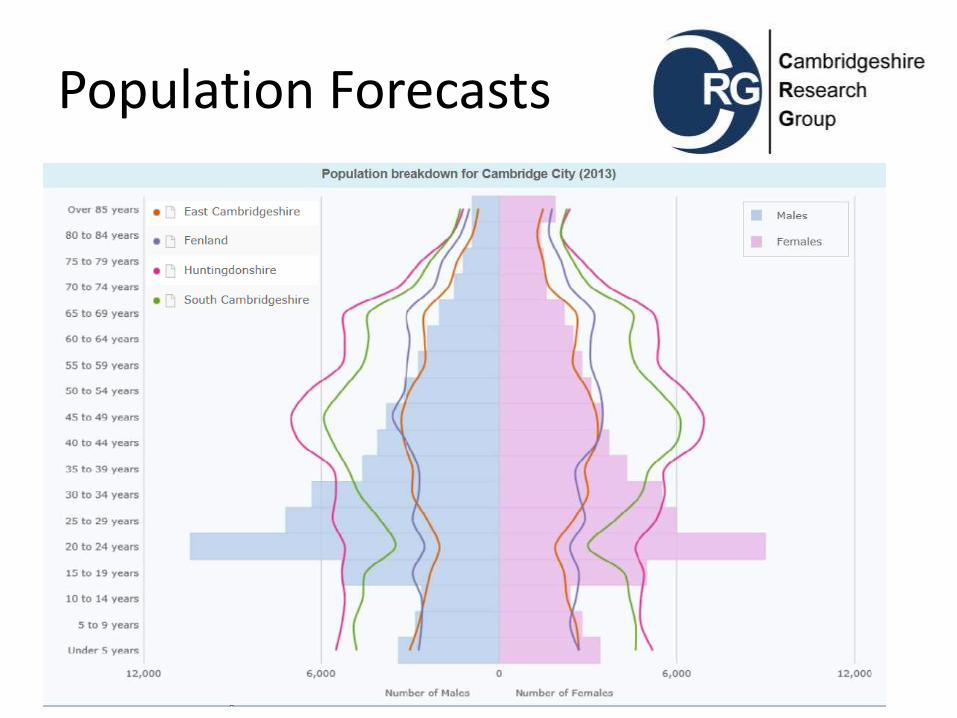
Population Forecasts
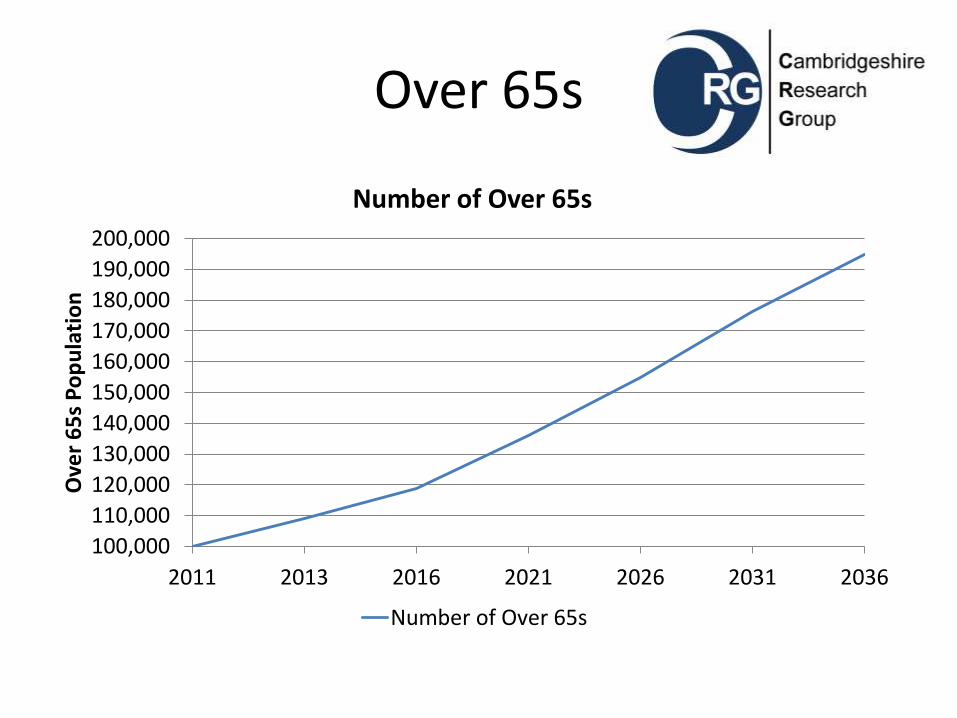
Over 65s
100,000
110,000
120,000
130,000
140,000
150,000
160,000
170,000
180,000
190,000
200,000
2011 2013 2016 2021 2026 2031 2036
Ove
r 6
5s
Po
pu
lati
on
Number of Over 65s
Number of Over 65s
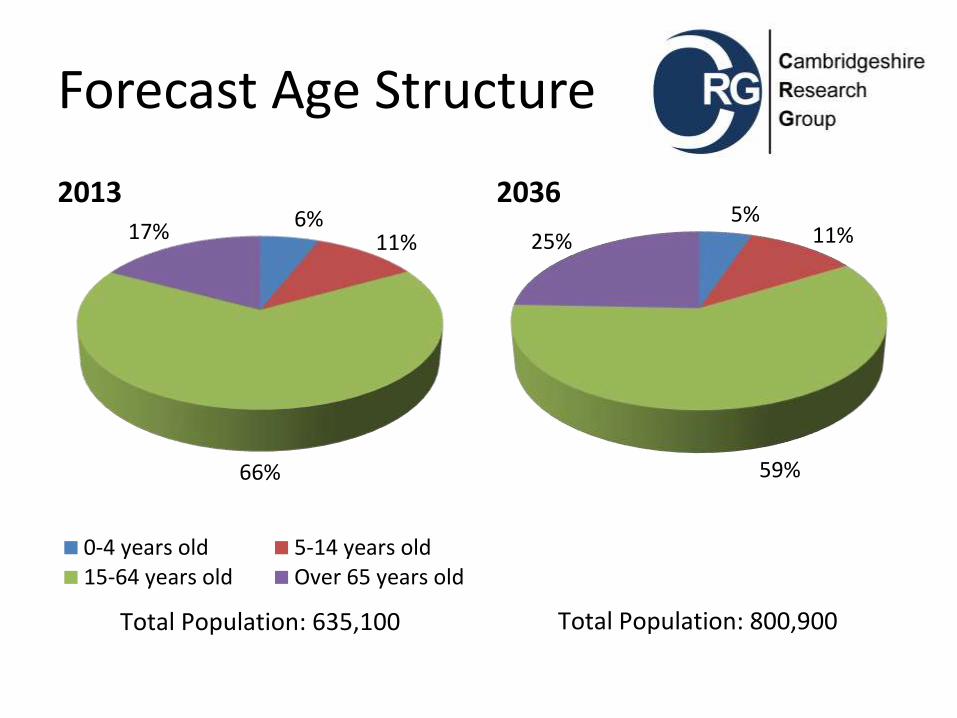
Forecast Age Structure
6%11%
66%
17%
0-4 years old 5-14 years old15-64 years old Over 65 years old
2013
Total Population: 635,100
5%11%
59%
25%
2036
Total Population: 800,900
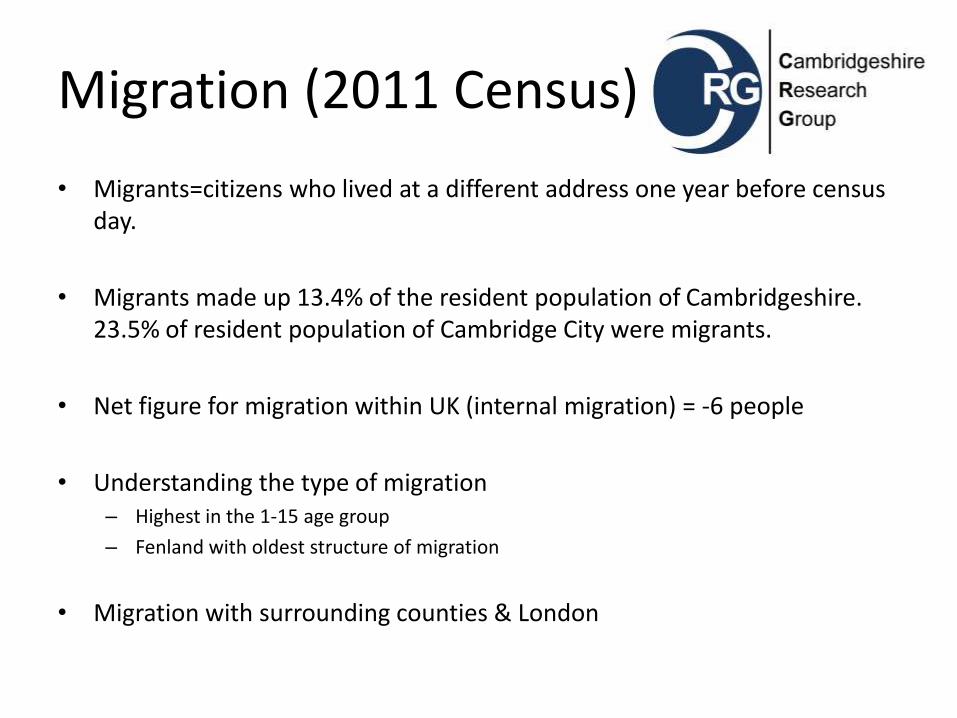
Migration (2011 Census)
• Migrants=citizens who lived at a different address one year before census day.
• Migrants made up 13.4% of the resident population of Cambridgeshire. 23.5% of resident population of Cambridge City were migrants.
• Net figure for migration within UK (internal migration) = -6 people
• Understanding the type of migration– Highest in the 1-15 age group
– Fenland with oldest structure of migration
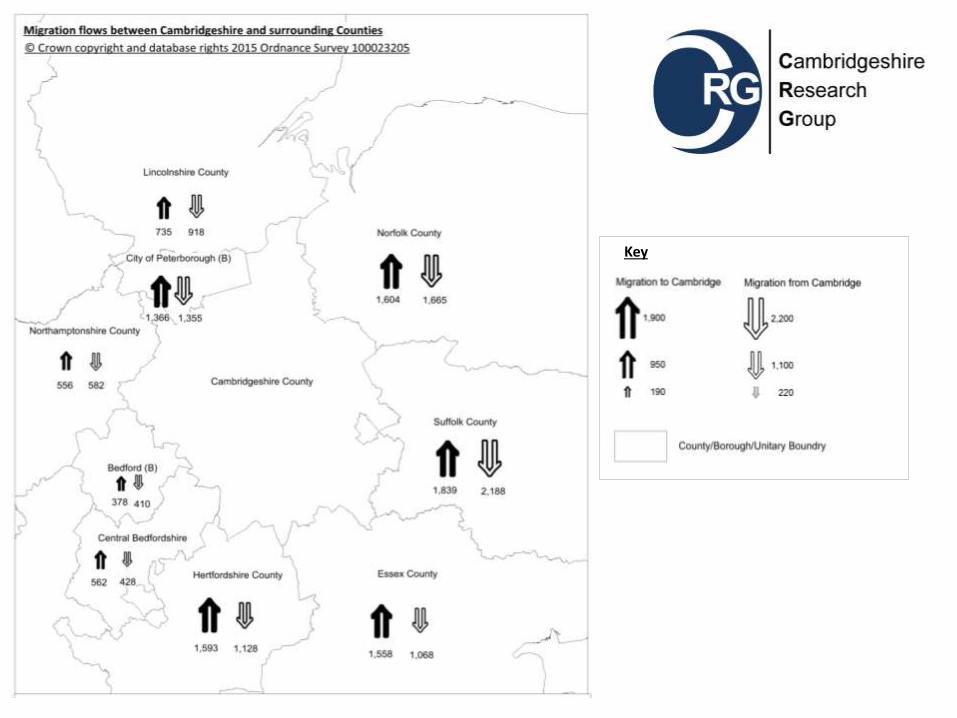
• Migration with surrounding counties & London
Key
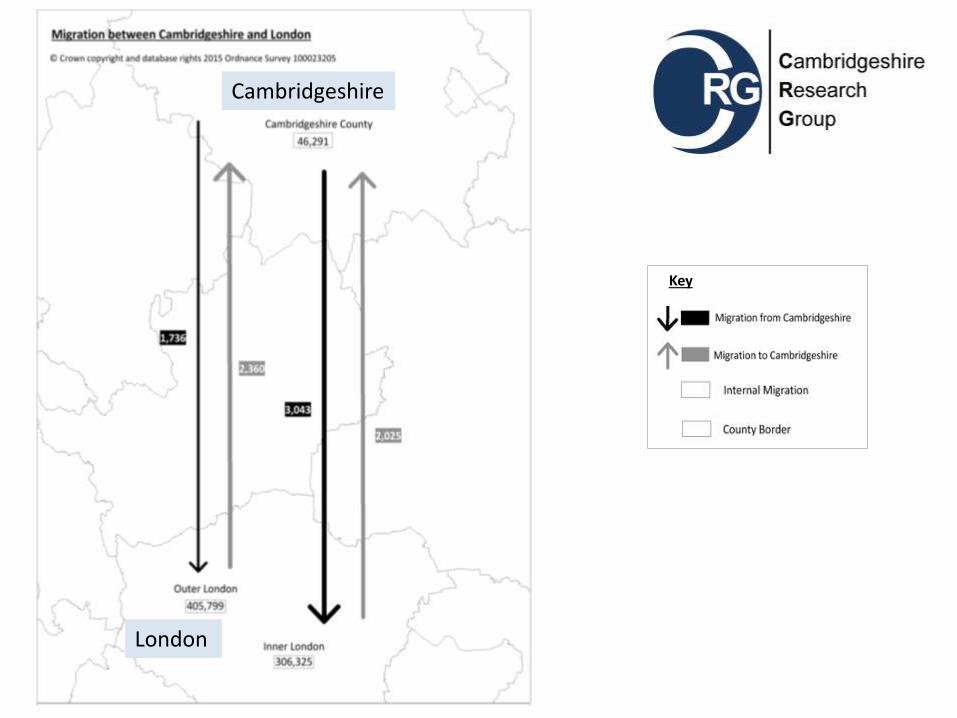
Cambridgeshire
London
Key
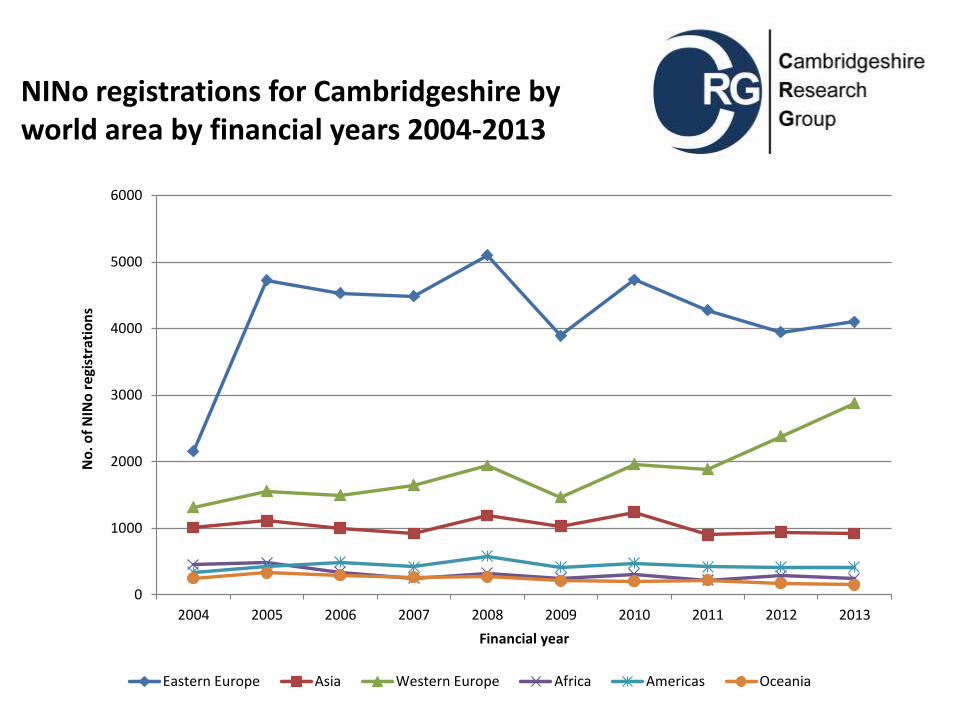
NINo registrations for Cambridgeshire by world area by financial years 2004-2013
0
1000
2000
3000
4000
5000
6000
2004 2005 2006 2007 2008 2009 2010 2011 2012 2013
No
. of
NIN
o r
egi
stra
tio
ns
Financial year
Eastern Europe Asia Western Europe Africa Americas Oceania
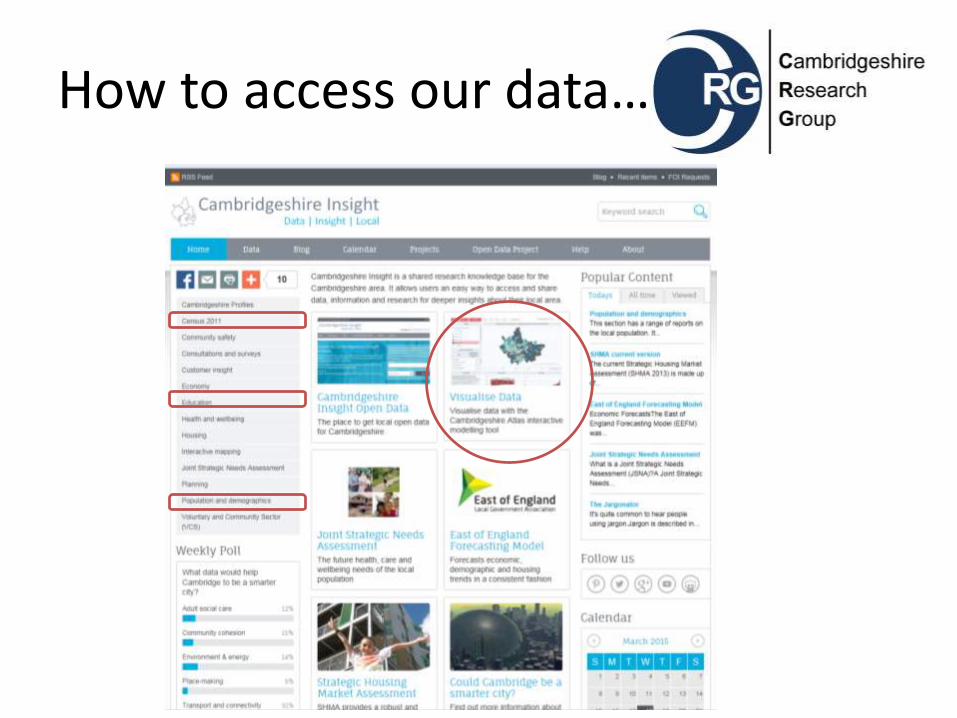
How to access our data…
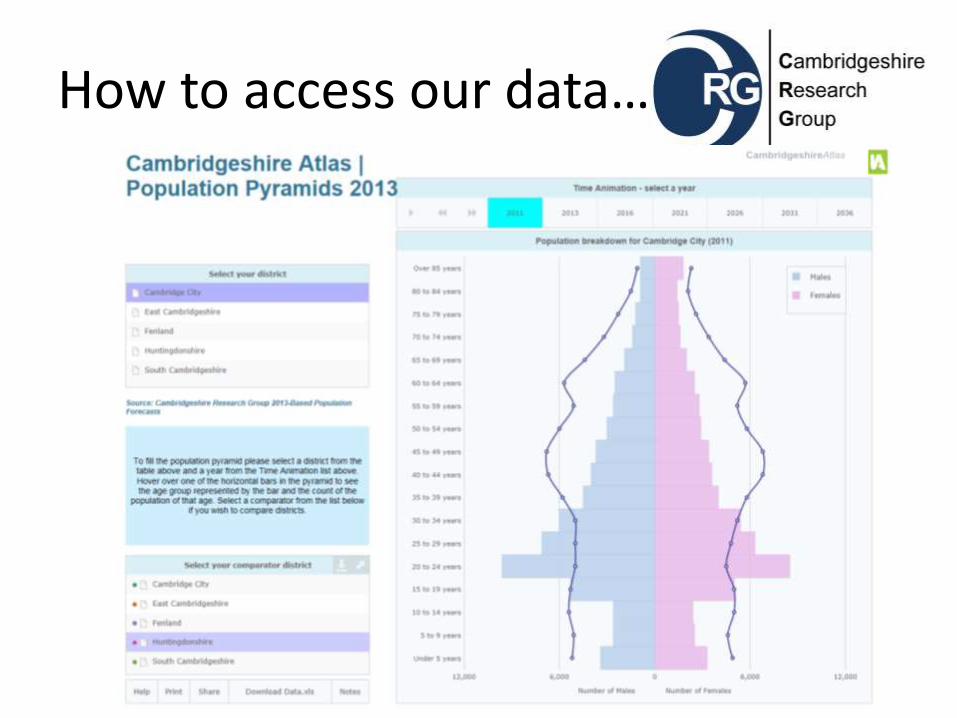
How to access our data…
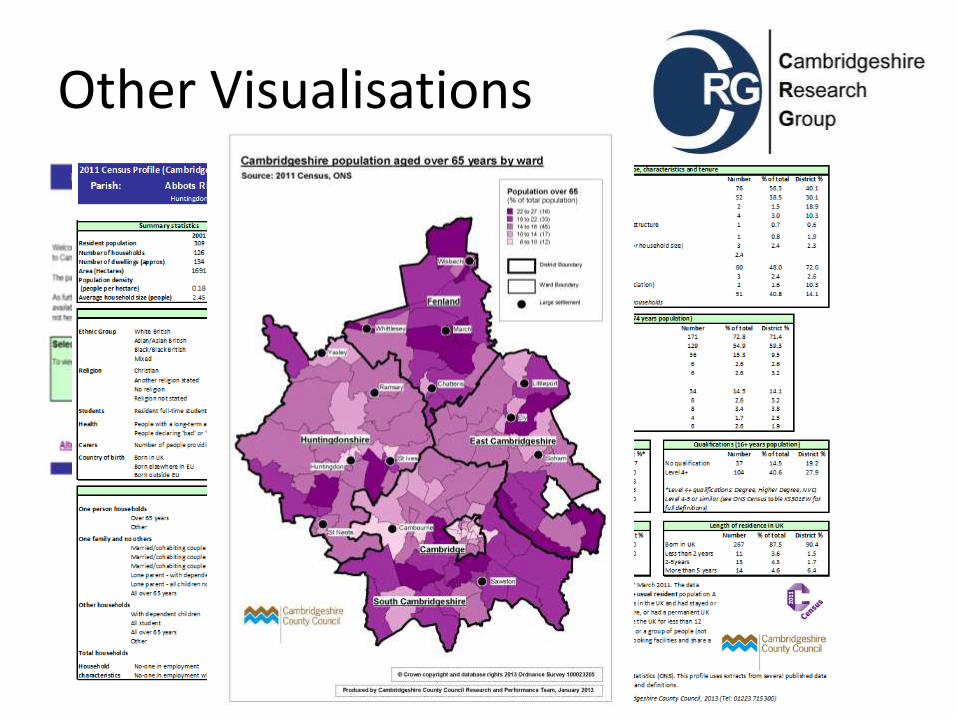
Other Visualisations
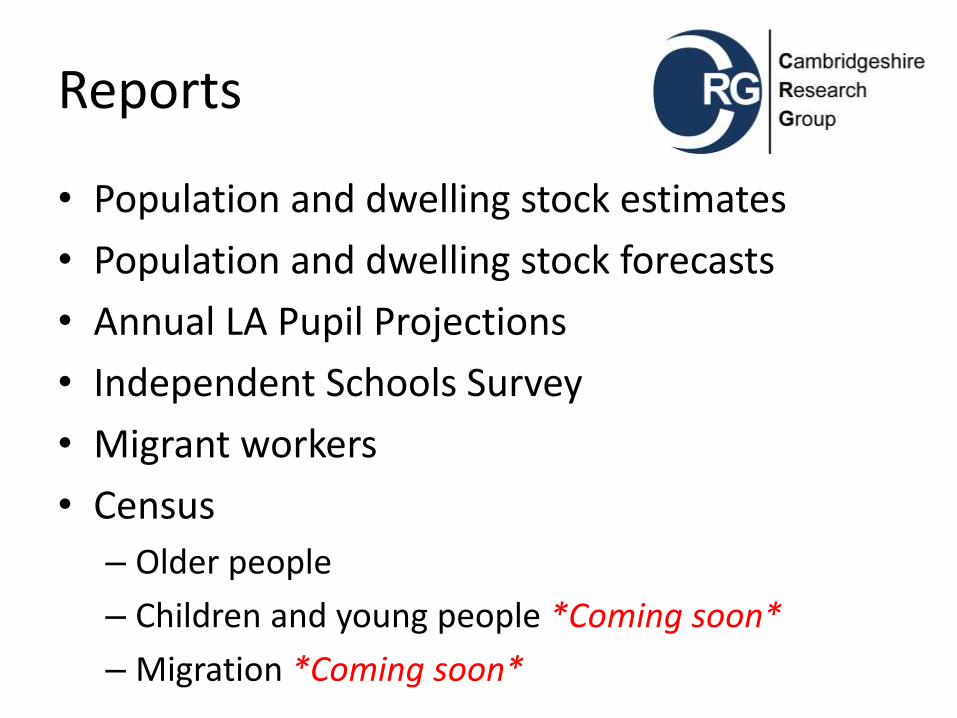
Reports
• Population and dwelling stock estimates
• Population and dwelling stock forecasts
• Annual LA Pupil Projections
• Independent Schools Survey
• Migrant workers
• Census
– Older people
– Children and young people *Coming soon*
– Migration *Coming soon*
@CambsInsight
pinterest.com/cambsinsight
Cambridgeshire Insight
Come visit us! Shire Hall – Room 015
W: www.cambridgeshireinsight.org.uk
T: 01223 715300
Next week in the council chamber….
Mon 23th: Economy and Housing
Thurs 26th: Consultations, Customer Insight, and Community Safety