Demographic and life-history variability across the range...
152
Demographic and life-history variability across the range of a widespread herb: the role of environmental, geographical and genetic factors Variabilidad demográfica y de historia vital en una planta de amplia distribución: el papel de los factores medioambientales, geográficos y genéticos Jesús Villellas Ariño Aquesta tesi doctoral està subjecta a la llicència Reconeixement- NoComercial – CompartirIgual 3.0. Espanya de Creative Commons. Esta tesis doctoral está sujeta a la licencia Reconocimiento - NoComercial – CompartirIgual 3.0. España de Creative Commons. This doctoral thesis is licensed under the Creative Commons Attribution-NonCommercial- ShareAlike 3.0. Spain License.
Transcript of Demographic and life-history variability across the range...
Demographic and life-history variability across
the range of a widespread herb: the role of environmental, geographical
and genetic factors
Variabilidad demográfica y de historia vital en una planta de amplia distribución: el papel de los factores medioambientales, geográficos y genéticos
Jesús Villellas Ariño
Aquesta tesi doctoral està subjecta a la llicència Reconeixement- NoComercial – CompartirIgual 3.0. Espanya de Creative Commons. Esta tesis doctoral está sujeta a la licencia Reconocimiento - NoComercial – CompartirIgual 3.0. España de Creative Commons. This doctoral thesis is licensed under the Creative Commons Attribution-NonCommercial-ShareAlike 3.0. Spain License.


Demographic and life-history variability across the range of a widespread herb: the role
of environmental, geographical and genetic factors
Variabilidad demográfica y de historia vital en una planta de amplia distribución: el papel de
los factores medioambientales, geográficos y genéticos
Jesús Villellas Ariño
Zaragoza, enero de 2013


Demographic and life-history variability across the range of a widespread herb: the role
of environmental, geographical and genetic factors
Variabilidad demográfica y de historia vital en una planta de amplia distribución: el papel de
los factores medioambientales, geográficos y genéticos.
Memoria presentada por Jesús Villellas Ariño para optar al grado de Doctor por la
Universidad de Barcelona.
Programa de Doctorado de “Biodiversidad”, Programa Interdepartamental de la Universidad
de Barcelona y la Universidad Autónoma de Barcelona, correspondiente al bienio 2007-2009.
Este trabajo se ha llevado a cabo en el Instituto Pirenaico de Ecología (CSIC) bajo la
dirección de la Dra. Mª Begoña García González y la tutoría de F. Xavier Sans Serra.
Doctorando Directora de tesis Tutor
Jesús Villellas Ariño Mª Begoña García González F. Xavier Sans Serra


No puede impedirse el viento. Pero pueden construirse molinos
Proverbio holandés
A mis padres

Contents
Agradecimientos 1
General Introduction 5
1. Widespread plants 7
2. Sources of variation in widespread plants 8
2.1. Spatio-temporal variation in environmental conditions 9
2.2. The position of populations within species’ ranges 9
2.3. Natural selection vs. neutral demographic processes 10
3. Study species 11
4. Introduction to the study area and data collection 12
Objectives 15
Publications 19
Chapter 1. Plant performance in central and northern peripheral populations of the widespread Plantago coronopus 21
Chapter 2. Variation in stochastic demography between and within central and peripheral regions in a widespread short-lived herb 33
Chapter 3. The role of the tolerance-fecundity trade-off in maintaining intraspecific seed trait variation in a widespread dimorphic herb 59
Chapter 4. Environmental, genetic and geographical correlates of phenotypic variation within populations of a common herb in Europe 73
General Discussion 89
1. Factors influencing population performance across species’ ranges 91
2. Life-history variability: the key to success in widespread plants 94
3. The importance of large-scale integrative analyses 96
4. What is next? Considerations for future work 97

Conclusions 99
Resumen (en castellano) 103
1. Introducción general y objetivos del estudio 105
2. Publicaciones 107
3. Discusión global y conclusiones 111
Report of the supervisor 115
References 121
Appendices 133

1
Agradecimientos

Agradecimientos
3
Agradecimientos
En primer lugar, quiero agradecer a mi directora de tesis, Mª Begoña García, la oportunidad
que me dio acogiéndome en el IPE allá por 2006. Gracias por todo lo que me has enseñado,
los modelitos matriciales, tu implicación en el trabajo de campo y, claro está, por la
oportunidad de conocer tantos sitios bajo la “bandera” del Plantago coronopus.
I would also like to thank in English my two supervisors during my short-term stays
abroad, Bill in Durham and Johan in Stockholm, for opening my eyes to new ways of thinking
and putting ecology into practice, and for being always ready to help me during my thesis. I
would also like to thank Dan, for his valuable comments in some of my manuscripts, and for
giving such interesting lectures on population dynamics in Jaca and Barcelona.
Esta tesis está enmarcada dentro de un proyecto de investigación en el que han
participado muchísimas personas, sin cuya ayuda todo esto habría sido imposible. En primer
lugar, quería agradecer a Rita su generosidad al compartir sus datos de campo y material
vegetal (semillas) para posteriores análisis. También quería agradecer a una larguísima lista
de personas que han colaborado formal o informalmente: a Jens Olesen por su ayuda en el
trabajo de campo y en la elaboración del manuscrito; a Anass Terrab y Xavier Picó por su
ayuda en los análisis genéticos e interpretación de los mismos; a Paz Errea y Jesús Martínez,
por su ayuda con los mapas y el breve paso por el Arc-GIS; a Joan Pedrol y Santiago Silvestre
por su ayuda en la identificación taxonómica a partir de pliegos; a Melchor Maestro por los
análisis de suelo; a Sergio Vicente por su ayuda con los cálculos de evapotranspiración; a
Redouan Ajbilou por su ayuda con los datos climáticos de Marruecos; y a Violeta Simón,
John Thompson, Anna Traveset, Alfredo Valido y Stefania Pisanu por el material vegetal
enviado para los análisis genéticos. Por otra parte, una beca predoctoral FPU del Ministerio de
Educación y Ciencia y varios proyectos nacionales (CGL2010-21642, 018/2008, CGL2006-
08507/BOS) hicieron posible esta tesis.
Un párrafo aparte merecen todas las personas que me han ayudado en el trabajo de
campo, desde los chiringuitos de Cádiz hasta las tabernas de Escocia, y también las personas
que me han ayudado a contar y medir semillas, y a hacer mapas varios. Aguantásteis conmigo
la lluvia, la solana, los mosquitos, el viento, los dolores de espalda y de cabeza, y demás
inconvenientes. Es una larga lista, ahí vais: Aída, Alberto, Rulo, Robin, Robert, Ángel
(“Primilla”), Eva, Jesús, Kike, Camilla, Ángel Vale, Gastón, Paz, Johan, Fernando, Jens, Sara,
Iker, Ari, Mª Luisa, Carmela, Pedro, Ángela y Marc.

Agradecimientos
4
También quería dar las gracias a mi tutor en la UB, Xavier Sans, que siempre estuvo
dispuesto a ayudarme en todo lo que necesité. Además, numerosas personas leyeron,
comentaron, revisaron, etc, los manuscritos: Juan Arroyo, Xavier Picó, Pablo Vargas, Bill
Morris. También quiero reconocer la labor de los revisores anónimos de las revistas (glups!),
a pesar de todos los dolores de cabeza que me dieron. Gracias a todos ellos me he dado cuenta
de que la unión hace la fuerza. También me gustaría mencionar a otra gente que colaboró o
colabora con nosotros trabajando con P. coronopus desde otros enfoques, como Bodil Ehlers
con la biología reproductiva, o Joao Loureiro, con el genoma.
También me gustaría agradecer a mis compañeros de despacho y de grupo, Iker, María y
Sam. Aunque han ido apareciendo más bien hacia el final de mi tesis, me han ayudado
muchísimo con discusiones varias, análisis estadísticos, y mucho más importante que todo
eso, con risas y muy buenos momentos en el despacho (¿qué haréis si se va la estufa?). Por
supuesto, también merecen una mención aparte mis antiguos compañeros de despacho, Pablo,
Jorge y Mattía, y todos mis compañeros del IPE y del CITA en general, con quienes he
compartido tantos desayunos, viajes, historietas, partidos de ping-pong y crapuleo durante
estos años. No me quiero olvidar de la gente de ECOFLOR, por el buen rollo transmitido en
las reuniones y en las visitas a Sevilla y Vigo. Gracias también a Laura y a Blanca, por su
ayuda con las matrículas en la Universidad de Barcelona. A Pablo Tejero, compañero de
aventuras en Groenlandia y que seguramente, sin saberlo, me dio un empujoncito para
meterme en el mundo de la investigación. A los “palotes”, por alegrarme los fines de semana
y ayudarme a desconectar del IPE, y porque en el fondo, sé que os gusta mi plantita. A Lola,
que siempre me animó en mis luchas con los revisores, y me dio ejemplo de lo que es hacer
ciencia comprometida con la sociedad. Y a Paloma, por ayudarme a ver el lado positivo de las
cosas y enseñarme a bailar por la vida.
Para acabar, quería agradecer de manera muy especial a mis padres, Pilar y Mariano, y a
mis hermanas, Ana y María. Gracias por vuestro cariño y ayuda, por alegraros con mis
publicaciones en revistas de nombres raros, por estar siempre a mi lado en los buenos y malos
momentos, y sobre todo, ¡por aprenderos el nombre y apellido de la planta!
A todos y todas, esta tesis también es un poco vuestra.

5
General Introduction


General introduction
7
General Introduction
1. Widespread plants
Widespread and common species, those presenting large range sizes and high abundances,
have traditionally received much less attention than rare and endemic ones in the ecology and
conservation literature (Gaston 2011). The greater concern that scientists usually have about
rare phenomena and taxa likely explains why the importance of widespread species has been
so far overlooked. However, the interest in these organisms has increased in the last decade.
Firstly, widespread taxa deserve attention because they are relatively rare in terms of number
of species (Jaccard 1912, Preston 1948, Margules and Usher 1981), and because steady
declines in abundance have been reported for a number of them (Gaston and Fuller 2007,
Gaston 2010). In addition, their importance in macroecological patterns of species richness
and species spatial turnover (e.g., Jetz and Rahbek 2002, Lennon et al. 2004, Pearman and
Weber 2007), and in ecosystem structure and functioning (Smith and Knapp 2003, Solan et al.
2004, Bunker et al. 2005, Emery and Gross 2007, Polley et al. 2007, Gaston and Fuller 2008)
is becoming increasingly recognized. On the other hand, many widespread species are
invasive or alien (Stohlgren et al. 2011), and may have detrimental effects on host
ecosystems. Hence, understanding the characteristics that allow widespread organisms to
extend over large areas has a high interest from both theoretical and applied perspectives,
especially if we consider the low phylogenetic signal shown by species’ range sizes and thus
the low predictability of range size (Gaston 2003).
The search for features characteristic of plant species with small vs. large distribution
ranges is indeed common in the scientific literature (e.g., Fiedler 1987, Byers and Meagher
1997, Hegde and Ellstrand 1999, Walck et al. 2001, Brown et al. 2003, Köckemann et al.
2009). Some reproductive traits have been typically found in widespread plants in comparison
with species of smaller range sizes, such as higher levels of sexual reproduction, higher
reproductive output and/or higher dispersal abilities (Kunin and Gaston 1993, Kelly 1996,
Byers and Meagher 1997, Murray et al. 2002, Lavergne et al. 2004). These results point to a
higher capacity of colonization in widespread plants (Fiedler 1987, Lavergne et al. 2004),
although some studies have found different patterns (Brown et al. 2003, Simon and Hay
2003). Integrative analyses combining different vital rates, and/or describing population
dynamics are scarcer. Some studies comparing the overall performance of congener plants

General introduction
8
with similar habitats found higher growth rates and/or lower extinction risks in populations of
widespread compared to rare species (Fiedler 1987, Münzbergová 2005), whereas another
study reported no clear relationship between the range sizes and population growth rates of
two perennial plants (Byers and Meagher 1997).
One of the most frequent hypotheses to explain the success of plants distributed over
large areas is that they show much wider ecological niches (Brown 1984). For example,
weeds are the paradigm of widespread organisms with tolerance to a broad range of
environmental conditions (Baker 1974). A positive relationship between niche width and
range size has also been found in the herbaceous flora of central England (Thompson et al.
1998) and in European tree species (Kolb and Diekmann 2005, Köckemann et al. 2009).
Other studies, in contrast, have failed to find such relationship in plant taxa (Burgman 1989,
Thompson and Ceriani 2003, Kolb et al. 2006), suggesting no consistent pattern. If
widespread species truly show higher niche breadth, a high variability in their life-history and
demographic traits with respect to biotic and abiotic conditions is expected. Some transplant
experiments have reported such life-history adaptability across widespread plants’ ranges
(Joshi et al. 2001, Santamaría et al. 2003), but other studies found no higher variation in
phenotypic traits in common than in rare species (Primack 1980). Genetic diversity could also
contribute to the ecological breadth of plants, and several reviews have shown indeed a
tendency towards higher genetic variation in widespread taxa (Hamrick and Godt 1996,
Gitzendanner and Soltis 2000, Cole 2003), although two of them warned that generalizations
might be problematic (Hamrick and Godt 1996, Gitzendanner and Soltis 2000).
2. Sources of variation in widespread plants
The literature shows some common attributes of widespread plants, although there are also
numerous exceptions and contradictory results, as seen above. It seems that studies are often
very specific and carried out over small spatio-temporal scales, which hinders a general
understanding of demographic, life-history and genetic variation in widespread taxa. In fact,
different biological characteristics may be affected by different processes throughout species’
ranges. Environmental and geographical gradients, which are intimately associated, seem to
be appropriate scenarios in which to analyze the possible causes and the magnitude of natural
intraspecific variation (Gaston et al. 2008).

General introduction
9
2.1. Spatio-temporal variation in environmental conditions
Environmental factors constitute major agents of divergence in plant traits. Many studies have
shown indeed intraspecific variation in different life-history traits in relation with climate
(Murray et al. 2004, Nakazato et al. 2008, Koenig et al. 2009), moisture (Schimpf 1977),
length of the growing season (Johnson and Cook 1968, Winn and Gross 1993), soil properties
(Treseder and Vitousek 2001, Braza et al. 2010) or biological interactions (Pajunen 2009).
Environmental stress, which may be caused by some of these factors, is central in the ecology
and evolution of plants (Grime 1977, Odum 1985, Nevo 2001, Callaway et al. 2002) and has
been found to trigger intraspecific variation as well (e.g., Loreti and Oesterheld 1996, Hester
et al. 1998, Scarano et al. 2002). In this context, studies across large latitudinal gradients are
very useful, as they often provide the opportunity to analyze environmentally driven variation
in life-history traits among populations (Moles and Westoby 2003, Gaston et al. 2008, De
Frenne et al. 2011).
Temporal variability in environmental conditions is another key factor shaping life
history and demographic performance (Stearns 1976, Tuljapurkar et al. 2003). In fact,
temporal variation in vital rates, such as fecundity or survival, due to environmental
fluctuations, usually reduces population performance in the long term (Lewontin and Cohen
1969, Gillespie 1977). However, very few studies have quantified the real effect of
intraspecific differences in vital rates’ variation on the differences in population growth rates
(Davison et al. 2010). Thus, further research is needed to explore the consequences of
temporal variation in plant performance, especially if we consider the predictions of
increasing variability in climatic parameters with global warming (Karl and Trenberth 2003,
Salinger 2005).
2.2. The position of populations within species’ ranges
The central vs. peripheral position of populations within species’ ranges should also be
accounted for when analyzing intraspecific variability. Central and peripheral populations are
indeed expected to differ in a number of demographic, life-history and genetic traits. For
example, the abundant-centre model assumes that core populations will present higher
densities than peripheral ones, because environmental conditions tend to be more favorable in
the centre of species’ ranges (e.g. Hengeveld and Haeck 1982, Brown 1984, Lawton 1993).
Some studies have found lower abundances in central than in peripheral populations (e.g.,
Carey et al. 1995, Curnutt et al. 1996, Jump and Woodward 2003), but the opposite pattern

General introduction
10
has been also reported (Ribeiro and Fernandes 2000, Herlihy and Eckert 2005, Kluth and
Bruelheide 2005a). Overall, the abundant-centre model has received weak support from recent
reviews as a general theory (Sagarin and Gaines 2002, Gaston 2003, Sagarin and Gaines
2006), and more information has to be gathered before general patterns can be determined.
The abundant-centre model has inspired many hypotheses regarding genetic and
demographic patterns. For example, the central-marginal model predicts decreasing genetic
diversity towards the periphery of species’ ranges, due to processes such as genetic drift,
inbreeding or reduced gene flow (Brussard 1984). There is evidence for (e.g., Cwynar and
MacDonald 1987, Kuittinen et al. 1997, Lammi et al. 1999) and against (e.g., Tigerstedt 1973,
Hamrick et al. 1989, Yakimowski and Eckert 2008) this theory, although the pattern of lower
genetic diversity in range edges is supported in the majority of cases (Eckert et al. 2008).
From a demographic perspective, peripheral populations have often been assumed to show
lower values in vital rates, higher temporal fluctuations or higher vulnerability to stochastic
events (Lawton 1993, Lesica and Allendorf 1995, Vucetich and Waite 2003). However, while
some studies have found lower survival (Carey et al. 1995), seed production (García et al.
2000, Jump and Woodward 2003), or seedling recruitment (Tremblay et al. 2002) in
peripheral populations, others have reported increased values in vital rates towards range
edges (e.g. Kluth and Bruelheide 2005b, Angert 2009, Samis and Eckert 2009). In this
context, the distinction between geographical and ecological marginality might be crucial
(Soulé 1973). Indeed, geographically peripheral populations may be found in ecologically
favorable conditions (Lennon et al. 2002), whereas populations far from the periphery may
occur in ecologically marginal environments or atypical habitats (Grant and Antonovics 1978,
Shumaker and Babble 1980). Given that widespread plants frequently encounter different
biotic and abiotic conditions throughout their distribution, comparative studies should both
consider the location of populations within species’ ranges and analyze variation in the most
relevant environmental parameters.
2.3. Natural selection vs. neutral demographic processes
Large-scale studies also allow us to analyze evolutionary and historical processes in plants.
Phenotypic variation in ecologically relevant traits is expected to be shaped by selective
agents, such as climate or other relevant environmental factors, as seen above. In contrast,
genetic diversity is typically measured in neutral loci (Lynch et al. 1999, Holderegger et al.
2006), and may instead reflect the consequences of random demographic processes

General introduction
11
experienced by populations in the past (Holderegger et al. 2006, Mitchell-Olds and Schmitt
2006, Lawton-Rauh 2008). This is frequently encountered along the central-peripheral
gradient, in which gene flow tends to decrease towards range edges, favoring isolation and
increasing the influence of genetic drift and founder effects in peripheral populations (Lesica
and Allendorf 1995, Vucetich and Waite 2003). Thus, analyzing the effects of natural
selection and range position on the phenotypic and genetic variation of populations might also
help to understand the causes of variability in life-history traits.
3. Study species
The genus Plantago contains several herbaceous taxa with a nearly cosmopolitan distribution,
such as P. lanceolata, P. major or P. media, characterized many times by a notable
ecological, life-history and genetic variation (Kuiper and Bos 1992). For the present work, we
have chosen a widespread and particularly variable short-lived herb, Plantago coronopus L.
We have restricted our study to P. coronopus ssp. coronopus, which is the most common
subspecies throughout the range and differs from the others in the morphology of the bracts
(Chater and Cartier 1976, Pedrol 2009). Still, this is a very complex and polymorphic taxon,
and future taxonomic reorganizations within the species should not be discouraged (J. Pedrol,
personal communication). For simplicity, we will hereafter refer to the studied subspecies as
P. coronopus.
The distribution of P. coronopus ranges from North Africa to North Europe, and the
species also extends to SW Asia (Hultén and Fries 1986). In North Europe, the species is
frequently restricted to coastal areas, although it seems to be expanding inland (and to coastal
areas of other continents; Global Biodiversity Information Facility, http://www.gbif.org). P.
coronopus can be found in different habitats, such as sand dunes, coastal prairies or human-
modified areas, which are usually characterized by relatively low levels of competition from
other plants, or by disturbances such as human and cattle trampling (Dodds 1953, Chater and
Cartier 1976, Pedrol 2009).
In addition to its wide distribution and habitat diversity, Plantago coronopus shows a
large variability in several ecological and life-history traits. For example, it presents either
annual or short-lived perennial populations (Chater and Cartier 1976), though no
corresponding variation has been found in life-history components such as fruit set, seed
production or seed mass (Braza et al. 2010). Additionally, plants present flat or ascending

General introduction
12
rosettes with numerous leaves, which are very variable in size, pubescence, dentation or
degree of succulence. Another sign of the high versatility of P. coronopus is its reproductive
system. The species is gynodioecious (Koelewijn 1996), with female percentages ranging
from ca. 10 % to 50% (M. B. García, unpublished data). Reproductive individuals produce
several spikes with tetramerous flowers that are wind-pollinated (Dodds 1953), and present
intermediate to high outcrossing rates, with large variation among populations (ranging from
0.34 to 0.93; Wolff et al. 1988). Interestingly, P. coronopus presents seed dimorphism: each
fruit may produce up to four big basal seeds, and one or no small apical seed (Dowling 1933).
Basal seeds produce a coat that become mucilaginous when moistened, thanks to the presence
of pectinic material in the epidermal cells (Gutterman and ShemTov 1996), virtually absent in
apical seeds. Mucilaginous coats are thought to affect important processes such as water
absorption, competition via allelopathy, adherence to the soil, or DNA protection from
irradiation damage (Harper and Benton 1966, Hasegawa et al. 1992, Lu et al. 2010, Yang et
al. 2011). Overall, basal seeds show higher germination rates than apical ones (Schat 1981,
Braza and García 2011).
Numerous studies have analyzed intrinsic and extrinsic factors affecting the
performance of P. coronopus. For example, seed production increases with plant size (Braza
et al. 2010), and plant density negatively affects vegetative and reproductive performance
(Waite and Hutchings 1982, Waite 1984, Hutchings and Waite 1985, Koelewijn 2004a),
although the effect of seed density on germination seems to differ between greenhouse and
field experiments (Waite and Hutchings 1978, 1979, Schat 1981). In addition, seed size
positively affects plant performance, since a larger size in basal seeds leads to an advantage
through the plant’s life in terms of germination, size, survival and fecundity (Koelewijn
2004b, Koelewijn and Van Damme 2005). Finally, negative effects from drought, nutrient
shortage or salinity stress have been reported on germination, seedling recruitment, and
reproductive output (Dowling 1933, Onyekwelu 1972, Waite and Hutchings 1978, Schat
1981, Waite 1984, Schat and Scholten 1985, Woodell 1985, Luciani et al. 2001, Friesberg et
al. in press).
4. Introduction to the study area and data collection
Many of the above mentioned studies on P. coronopus have been carried out in the laboratory
(e.g., Waite and Hutchings 1978, Schat 1981, Smekens and van Tienderen 2001, Koelewijn
2004b, Koelewijn and Van Damme 2005), and those in the field spanned small areas of the

General introduction
13
species’ distribution (Onyekwelu 1972, Waite and Hutchings 1979, 1982, Braza et al. 2010,
Braza and García 2011). However, to understand the biology of widespread taxa in a
comprehensive way, we need to analyze individual and population performance throughout
species’ ranges, at large spatio-temporal scales.
In the present study, we examine life-history, demographic and genetic variation in up to
22 populations of P. coronopus in Europe and North Africa, spanning most of the species
latitudinal gradient (Fig. 1; Table 1; Appendix 1, 2, 3 and 4). We selected only perennial
populations (which are more common across the species’ latitudinal range) to reduce the
variables affecting our comparative analysis, as our focus was on the effects of geographical
and environmental gradients. For our purposes, we carried out intensive monitoring in the
period 2007-2010 (Appendix 5) in four central populations in Spain (T, CA, C and TB) and
six northern peripheral populations in Denmark (DH and DS), Sweden (SG and ST) and
Scotland (EA and ES). In these populations, we collected field data (life-history and
Fig. 1 Distribution map with sampled populations of Plantago coronopus in Chapters 1 and 2 (demographic analyses; white dots), Chapter 3 (analysis of variation in reproductive traits among populations; white and grey dots), and Chapter 4 (analyses of phenotypic and genetic variation within populations; white and black dots except for TB). In grey, distribution range of Plantago coronopus (including coastal outlines in dark grey) according to Hultén and Fries 1986).

General introduction
14
demographic traits) and plant material (seeds and leaves for analyses of reproductive traits
and genetic diversity, respectively) that constituted the main source of information for the
present study. We also used field data previously gathered from two additional populations of
P. coronopus located in France (F) and Spain (BN), and from one extra year for a subset of
the monitored populations (T, C, F, DS, SG and ST; R. Braza and M. B. García). To increase
sample size in the analyses of seed traits and genetic diversity, we also obtained plant material
from three and eight additional populations, respectively (Fig. 1, Table 1).
Table 1 Populations of Plantago coronopus sampled in this study. Information is given about their location, geographical coordinates, habitat and chapters of this thesis where each population is analyzed.
Population Location Coordinates Habitat Chapters MT Tiznit (Morocco) 29º45’ N, 09º53’ W Coastal cliff 3 CS Cap Spartel (Morocco) 35º47’ N, 05º55’ W Coastal cliff 3 CT Ceuta (Spain) 35º54’ N, 05º21’ W Coastal cliff 3 T Tarifa (Spain) 36º02’ N, 05º38W Sand dune 1, 2, 3 & 4
CA Camposoto (Spain) 36º25’ N, 06º13W Sand dune 1, 2, 3 & 4 BN Bosque Niebla (Spain) 36º06’ N, 05º32’ W Forest gaps 1, 2, 3 & 4 AL Almería (Spain) 36º43’ N, 02º11’ W Sandy cliff 4 NA Nazare (Portugal) 39º35’ N, 09º04’ W Sand dune 4 MA Mallorca (Spain) 39º46’ N, 03º45’ E Sand dune 4 Z Zaragoza (Spain) 41º39’ N, 0º50’ W Riverside 4 C Corrubedo (Spain) 42º33’ N, 09º01’ W Sand dune 1, 2, 3 & 4
TB Traba (Spain) 43º11’ N, 09º03’ W Sand dune 1, 2 & 3 SET Sète (France) 43º24’ N, 03º39’ E Lagoon rocks 4 FSM Fos sur mer (France) 43º27’ N, 04º52’ E Lagoon rocks 4
F Bretagne (France) 47º18’ N, 02º30’ W Sand dune 1, 2, 3 & 4 DH Helnaes (Denmark) 55º08’ N, 09º59’ E Coastal meadow 1, 2, 3 & 4 DS Skallingen (Denmark) 55º29’ N, 08º15’ E Coastal meadow 1, 2, 3 & 4 SO Ottenby (Sweden) 56º13’ N, 16º24’ E Coastal meadow 4 ST Torekov (Sweden) 56º23’ N, 12º38’ E Coastal meadow 1, 2, 3 & 4 SG Glommen (Sweden) 56º55’ N, 12º21’ E Coastal meadow 1, 2, 3 & 4 EA Aberdeen (Scotland) 57º20’ N, 01º55’ W Coastal meadow 1, 2, 3 & 4 ES Skye (Scotland) 57º30’ N 06º26’ W Coastal meadow 1, 2, 3 & 4

15
Objectives


Objectives
17
Objectives
The general objective of this thesis is to analyze the variability in population dynamics, life-
history traits, and genetic diversity across the latitudinal range of the short-lived herb P.
coronopus, in relation with 1) the position of populations within the species’ range and 2) the
most relevant environmental gradients at different spatial scales. In this way, we aim to better
understand the causes underlying the success of widespread plants over large distribution
areas, and how such variability is structured in time and space. The specific objectives
associated to the different chapters of the study are the following:
Chapter 1
In the first chapter, we test the predictions from classical central-marginal theories in P.
coronopus, by comparing density and mean values and variability in vital rates between
central and northern peripheral populations in Europe. We also analyze the effects of
environmental factors on vital rates, and evaluate the ecological marginality of populations
across the species’ range.
Chapter 2
In the second chapter, we combine the different vital rates of the life cycle to calculate
stochastic population growth rates, in order to compare overall population performance
between central and peripheral regions. We also evaluate the contribution of each life cycle
component to differences in population growth rates at two spatial scales, between and within
regions. Finally, we analyze the relationship between variation in population dynamics and
variation in environmental conditions.
Chapter 3
We analyze in detail several reproductive traits and their variability among populations, in a
large latitudinal gradient from North Africa to North Europe. We search for relationships
between these traits and environmental conditions, and analyze the possible trade-offs
involved in resource allocation to seeds at the fruit and individual level. In particular, we test
whether a trade-off between fecundity and stress tolerance of seeds promotes variability
among populations in reproductive traits such as seed size and proportion of two seed morphs.

Objectives
18
Chapter 4
We explore the patterns and causes of phenotypic and genetic variation in a large number of
populations across Europe. In particular, we aim to disentangle the effects of environmental
selective agents from the influence of range position, in order to better understand the
historical and evolutionary processes that might have shaped variation within populations of
P. coronopus.

19
Publications


Chapter 1
21
Chapter 1
Plant performance in central and northern peripheral populations of the
widespread Plantago coronopus
Jesús Villellas1*, Johan Ehrlén2, Jens M. Olesen3, Rita Braza4 and María B. García1
1Instituto Pirenaico de Ecología (IPE-CSIC), Avda. Montañana 1005, Apdo. 13034, 50080 Zaragoza, Spain.
Fax: 0034976716019. 2Department of Botany, University of Stockholm, S-106 91, Stockholm, Sweden. 3Department of Biological Sciences, University of Aarhus, Ny Munkegade Building 1540, DK-8000 Aarhus C,
Denmark. 4Facultad de Biología, Universidad de Sevilla, Avda. Reina Mercedes s/n, 41012 Sevilla, Spain.
Ecography (in press). doi 10.1111/j.1600-0587.2012.07425.x.


Early View (EV): 1-EV
Plant performance in central and northern peripheral populations of the widespread Plantago coronopus
Jes ú s Villellas , Johan Ehrl é n , Jens M. Olesen , Rita Braza and Mar í a B. Garc í a
J. Villellas ([email protected]) and M. B. García, Inst. Pirenaico de Ecología (IPE-CSIC), Apdo. 13034, ES-50080 Zaragoza, Spain. – J. Ehrlén, Dept of Botany, Univ. of Stockholm, SE-106 91 Stockholm, Sweden. – J. M. Olesen, Dept of Biological Sciences, Univ. of Aarhus, Ny Munkegade Building 1540, DK-8000 Aarhus C, Denmark. – R. Braza, Facultad de Biología, Univ. de Sevilla, Avda. Reina Mercedes s/n, ES-41012 Sevilla, Spain.
Peripheral populations have long been predicted to show lower vital rates, higher demographic fl uctuations, and lower densities than central populations. However, recent research has questioned the existence of clear patterns across species ’ ranges. To test these hypotheses, we monitored fi ve central and six northern peripheral populations of the widespread herb Plantago coronopus along the European Atlantic coast during 5 yr. We estimated population density, and calculated mean values and temporal variability of four vital rates (survival, individual growth, fecundity and recruitment) in hundreds of plants in permanent plots. Central populations showed higher fecundity, whereas peripheral populations had higher recruitment per reproductive plant, indicating a higher overall reproductive success in the periphery. Central populations showed a marginally signifi cant tendency for higher growth, and there were no diff erences between range positions in survival. Fecundity and growth were aff ected by intraspecifi c competition, and recruitment was aff ected by precipitation, highlighting the importance of local environmental conditions for population performance. Central and peripheral populations showed no signifi cant diff erences in temporal variability of vital rates. Finally, density was sig-nifi cantly higher in peripheral than in central populations, in discrepancy with the abundant-centre model. Density was correlated to seedling recruitment, which would counterbalance in peripheral populations the lower fecundity and the tendency for lower growth of established plants. Such compensations among vital rates might be particularly common in widespread plants, and advise against simplistic assumptions of population performance across ranges. Th e whole species ’ life cycle should be considered, since diff erent arrangements of vital rates are expected to maximize fi tness in local environments. Our results show also the importance of discerning between geographical periphery and ecological marginality. In a context of climate-induced range shifts, these considerations are crucial for the reliability of niche-models and the management of plant peripheral populations.
Peripheral populations are a popular topic of research in ecology, evolutionary biology and genetics (Eckert et al. 2008, Sexton et al. 2009). Th ese studies provide insight into critical phenomena such as speciation, adaptive radiation, and natural selection (Grant and Antonovics 1978, Holt and Keitt 2005), and there is a strong debate about their evolu-tionary potential (Lesica and Allendorf 1995), particularly in the context of global warming and its eff ects on range-margin dynamics (Hampe and Petit 2005). For example, northern populations often constitute leading edges in spe-cies ’ distribution shifts in the northern hemisphere (Travis and Dytham 2004). Additionally, it is important to evalu-ate intraspecifi c variation in population performance across ranges, to improve the reliability of comparative analyses across taxa (Frederiksen et al. 2005) and of niche-based models forecasting biodiversity responses in future ecologi-cal scenarios (Lavergne et al. 2010).
Th e abundant-centre model predicts higher densities in central than in peripheral populations due to more
favourable conditions in the core of species ’ ranges (Hengeveld and Haeck 1982, Brown 1984). Th is model has been a tenet in much theoretical and empirical research, e.g. in the central-marginal model, which predicts decreasing genetic diversity towards the range periphery (Brussard 1984). In a demographic context, lower den-sity, greater isolation and lower habitat suitability at the periphery are often referred as the main causes to expect lower values in vital rates, higher variability in abundance or higher vulnerability to stochastic events (Lawton 1993, Lesica and Allendorf 1995, Vucetich and Waite 2003). However, although some studies have reported an actual decrease in abundance towards range margins (Carey et al. 1995, Curnutt et al. 1996, Jump and Woodward 2003), the abundant-centre theory has received weak support in recent reviews (Sagarin and Gaines 2002, Gaston 2003, Sagarin et al. 2006), which inevitably ques-tions some of the above predictions based on the model (Eckert et al. 2008).
Ecography 35: 001–010, 2012
doi: 10.1111/j.1600-0587.2012.07425.x
© 2012 Th e Authors. Ecography © 2012 Nordic Society Oikos
Subject Editor: Francisco Pugnaire. Accepted 23 January 2012

2-EV
Demographic performance of populations seems to be indeed rather variable across many species ’ ranges (Carey et al. 1995, Nantel and Gagnon 1999, Garc í a et al. 2000, Kluth and Bruelheide 2005a, Purves 2009), probably refl ect-ing specifi c local environmental conditions. In addition, populations at the range margin may or may not be con-sidered marginal from an ecological point of view (Grant and Antonovics 1978, Herrera and Bazaga 2008). Although both concepts often overlap, not all ecologically marginal populations are peripherally located, and not all geographi-cally peripheral populations are ecologically marginal (Soul é 1973). Peripheral populations may occur in locally favour-able conditions (Lennon et al. 2002), such as high water availability, high soil organic matter content or low competi-tion. Th us, there is no reason to expect that individuals in peripheral populations will always under-perform relative to those in central populations. While some studies have found lower fecundity (Garc í a et al. 2000, Jump and Woodward 2003), recruitment (Tremblay et al. 2002) or survival (Carey et al. 1995) in peripheral populations, others have reported increased values in diff erent vital rates towards range edges (Kluth and Bruelheide 2005a, Angert 2009, Samis and Eckert 2009). Moreover, many widespread plants are exposed to diff erent environments across their distribution, yet appear to be well adapted to these varied conditions (Joshi et al. 2001). In these cases, diff erent fi tness components such as survival, growth, fecundity or recruitment may show dif-ferent patterns across the range. For example, Doak and Morris (2010) illustrated how life histories of two tundra plants change in the southern limit, where higher individual growth counteracts lower survival and recruitment rates, and Suryan et al. (2009) reported intraspecifi c trade-off s between survival and fecundity in marine taxa present both in the Atlantic and the Pacifi c Ocean. Th us, a correct assessment of population performance across species ’ distributions should analyze the full spectrum of vital rates and consider variation in local environmental conditions.
Variability in vital rates may also be very important when analyzing demography across species ’ ranges (Gould and Nichols 1998, Morris and Doak 2004), as it usually reduces long-term population growth (Gillespie 1977). Populations seem to fl uctuate more in peripheral than in central areas (Gaston 2009, Sexton et al. 2009), although most research on this topic has been done with animals (Curnutt et al. 1996, Williams et al. 2003). In plants, few range-wide stud-ies have specifi cally analyzed temporal variation of vital rates. Some of them confi rmed the expected higher variability inperipheral areas (Nantel and Gagnon 1999, Gerst et al. 2011), but others did not (Volis et al. 2004, Kluth and Bruelheide 2005a, Angert 2009). However, many of these studies lasted no more than 3 yr, analyzed few populations per species and did not consider the eff ects of sampling error, which can artifi cially increase the real variability found in nature (Gould and Nichols 1998). Th us, multi-population approaches with accurate measurements of the variation in vital rates are needed to reach general conclusions about plant dynamics across ranges.
Recent reviews of population performance in central and peripheral areas of species ’ distributions (Gaston 2009, Sexton et al. 2009) show that generalizations are diffi cult to
establish, partly because few studies are designed to cover a signifi cant fraction of species spatio-temporal variability. In the present work we analyze variation in vital rates and den-sity in the widespread Plantago coronopus subsp. coronopus , a circum-Mediterranean short-lived herb also present in the coasts of northern Europe. We collected demographic data over 5 yr from ca 11 000 individuals in fi ve central and six northern peripheral populations along the European Atlantic coast. Using this spatially and temporally exten-sive dataset, we tested the following hypotheses: 1) periph-eral populations show lower average vital rates, i.e. survival, individual growth, fecundity and recruitment, than central populations; 2) peripheral populations exhibit higher tem-poral variability in vital rates; and 3) peripheral populations show lower density. We also analyze the eff ects of intraspe-cifi c competition, precipitation and soil richness, to account for diff erences in vital rates across the species ’ range, and we discuss our results in the context of geographical periphery vs ecological marginality.
Material and methods
Species and populations studied
Plantago coronopus (Plantaginaceae) is a widespread, short-lived herb that occurs from north Africa and the Iberian Peninsula to SE Asia. It reaches north Europe through a nar-row strip along the Atlantic coast (Hult é n and Fries 1986; Fig. 1). We have focussed on the subspecies coronopus , which is present throughout the whole species ’ distribution and diff ers from other much less widespread subspecies in the morphology of the bracts (Chater and Cartier 1976). Hereafter, we will refer to it as P . coronopus . Individuals have one or a few basal rosettes, and produce several spikes with wind-pollinated fl owers. Spontaneous autogamy is pos-sible but very variable among and within populations, and fruit set is very high (between 80 and 100%; Villellas et al. unpubl.).
Plantago coronopus is present in a wide variety of environ-mental conditions across its range, in terms of climate, soil richness and vegetation cover. In central areas, the species is found in coastal and inland locations, in contrasting habitats such as sand dunes, shrublands or human-disturbed areas, and as annual or short-lived perennial life-forms (Chater and Cartier 1976). In contrast, northern populations are restricted to coastal areas, such as seashore meadows or salt marshes, and present a short-lived perennial life-form. For our study, we chose 11 perennial populations along the Atlantic coast (Fig. 1, Table 1) to minimize habitat diff er-ences across the species ’ distribution. We spanned more than two thirds of the whole subspecies latitudinal range (Hult é n and Fries 1986), encompassing a substantial part of its eco-logical variation in coastal environments. We monitored fi ve central populations in sand dunes of S and NW Spain, and NW France, along a latitudinal transect of ca 1500 km; we also monitored six peripheral populations in coastal mead-ows of S Denmark, SW Sweden and N Scotland, along a longitudinal transect of ca 1500 km. All populations con-tained thousands of individuals.

3-EV
Table 1. Characterization of central and peripheral populations of Plantago coronopus in the study area. See methods for details on the estimation of plant size (cm), population density � SE (ind m� 2 ), percentage vegetation cover (by other plant species), SOM (percentage of soil organic matter content), mean annual precipitation (mm) and its coeffi cient of variation (CV).
Position Population LocationYears of study
Plant size
Population density
Vegetation cover (%) SOM (%)
Precipitation (and CV)
Central Tarifa (T) 36 ° 02 ′ N, 5 ° 38 ′ W 5 91.3 10.3 � 2.9 0 – 25 0.7 634 (0.18)Camposoto (CA) 36 ° 25 ′ N, 6 ° 13 ′ W 4 152.4 13.2 � 2.8 0 – 25 0.4 608 (0.25)Corrubedo (C) 42 ° 33 ′ N, 9 ° 01 ′ W 5 36.0 212.1 � 43.5 0 – 25 1.1 1003 (0.29)Traba (TB) 43 ° 11 ′ N, 9 ° 03 ′ W 4 28.2 145.8 � 39.1 25 – 50 1.4 842 (0.20)Pen Bron (F) 47 ° 18 ′ N, 2 ° 30 ′ W 5 56.2 182.6 � 112.6 25 – 50 0.9 680 (0.37)
Peripheral Helnaes (DH) 55 ° 8′N, 9 ° 59 ′ E 4 62.9 112.4 � 20.6 75 – 100 5.6 757 (0.17)Skallingen (DS) 55 ° 29′N, 8 ° 15 ′ E 5 48.9 175.8 � 71.0 75 – 100 17.9 906 (0.17)Glommen (SG) 56 ° 55 ′ N, 12 ° 21 ′ E 5 25.1 579.5 � 173.1 75 – 100 0.8 962 (0.24)Torekov (ST) 56 ° 23 ′ N, 12 ° 38 ′ E 5 41.9 268.3 � 63.7 75 – 100 6.1 733 (0.21)Aberdeen (EA) 57 ° 20 ′ N, 1 ° 55 ′ W 4 40.8 388.4 � 19.1 75 – 100 18.1 840 (0.13)Skye (ES) 57 ° 30 ′ N, 6 ° 26 ′ W 4 27.1 498.5 � 17.9 75 – 100 17.7 2020 (0.16)
Figure 1. Location of central and peripheral populations of Plantago coronopus in this study (black dots). Th e distribution range of the species and the subspecies coronopus is highlighted in grey (including the coastal outlines) according to Hult é n and Fries (1986). Notice the species is restricted to coastal locations in the northern periphery. See Table 1 for population acronyms.
Monitoring and data collection
Field data were collected in the period 2007 – 2010, except for the population F, which was monitored in the period 2003 – 2006. However, we verifi ed that the average and the variance of climatic variables at site F were similar between both sampling periods. To calculate vital rates, we monitored
all the populations over 4 yr, yielding three annual transi-tions. An additional fi fth year of data was collected in a sub-set of three central and three peripheral populations (2006 for T, C, DS, SG and ST, and 2007 for F), and used for the analysis of temporal variability in vital rates (Table 1; see below). In the fi rst year of study for each population, we established randomly-distributed permanent plots that

4-EV
Inst. (SG and ST); and Met Offi ce (EA and ES). For each population, we also calculated the mean annual precipita-tion and the coeffi cient of variation (CV) for the sampling period. Intraspecifi c competition was estimated the fi rst year scanning the maps with the position of each plant within plots, and measuring Voronoi polygons with Arc-GIS (ver. 9.3). Th ese polygons contain the area closer to each plant than to any other conspecifi c, and thus represent individual resource availability (thereafter ‘ resource area ’ ). Resource area mainly allowed us to analyze the eff ects of intraspecifi c competition on per capita vital rates but, averaged across individuals, constituted an additional estimate of population density. We also measured the abundance of other plant spe-cies as percentage of vegetation cover in plots, by using the categories 0 – 25, 25 – 50, 50 – 75 and 75 – 100%.
Statistical analyses
Statistical analyses were made with SPSS (ver. 17.0) unless specifi ed otherwise. To test for diff erences in mean vital rates between central and peripheral populations, we used linear mixed models (LMM) for continuous variables, i.e. growth, fecundity and recruitment (log-transformed), and a general-ized linear mixed model (GLMM; GLIMMIX procedure, SAS ver. 9.1) for the binomial variable, i.e. survival (Table 2). Th e central or peripheral position of populations was a fi xed factor, and year and population (nested within position) were random factors. Th e factor plot was not included in the mod-els because according to preliminary analyses it did not aff ect the signifi cance of position and population. Likewise, interac-tions between position and year were removed from the analy-ses when their eff ect was not signifi cant. Life stage and plant size (log-transformed) were also included in models as a fi xed factor and a covariate, respectively. Th e signifi cance of ran-dom factors in the GLMM was evaluated by testing whether z-values (the covariance parameter estimates divided by the standard errors) signifi cantly diff ered from zero (Juenger and Bergelson 2000). Additionally, we tested for diff erences between range positions in lifetime fecundity and in mean plant size with LMMs, including plant stage as a fi xed factor and year as a random factor in the analysis of plant size.
To analyze the role of environmental factors in the dif-ferences in vital rates between range positions (Results), we
varied in number (3 to 10) and size (0.25 to 5 m 2 ) depend-ing on local plant density. Annual censuses were done during fruit maturation and before seed dispersal. Due to regional diff erences in phenology, central populations were monitored in July and peripheral populations in August. In each census, we recorded between 100 and 400 individuals older than1-yr within the plots, which we relocated the following year with the aid of tags and hand-drawn maps showing the posi-tion of plants. For each individual, we recorded life stage as vegetative (V) or reproductive (R), the number of leaves and infl orescences, and the length of an average leaf and an aver-age infl orescence. We also counted and mapped new seed-lings in each census.
Growth, fecundity and survival rates of P . coronopus were then calculated annually for all non-seedling individuals monitored in the plots. We estimated plant growth rate as the ratio between plant size in a given year and that in the previ-ous year. Plant size was defi ned as number of leaves � length of an average leaf. We estimated fecundity in reproductive individuals as number of infl orescences � length of an aver-age infl orescence � number of seeds per unit of infl orescence length (calculated with a regression equation for each popu-lation). We also calculated the total number of reproductive years and the lifetime fecundity (total seed production over the lifespan) of those reproductive individuals that were monitored for their entire lives. Recruitment was estimated within each plot as the number of new seedlings in a given year divided by the number of reproductive individuals pres-ent in the previous year (the seed bank contribution is negli-gible in this species).
Plant density (D) was estimated annually from linear transects (Strong 1966) using the equation D � Σ (1/d) � (1/T), where T is total transect length (it varied from 10 to 200 m depending on local density), and d is the diameter perpendicular to the transect of non-seedling plants inter-cepting the transect.
Environmental factors were estimated as follows. In all populations, we collected 10 cm deep soil cores the fi rst year, to estimate soil organic matter content from the organic carbon (Heanes 1984). We obtained annual precipitation data for the sampling period from public databases: Spanish National Meteorological Agency (T and CA); MeteoGalicia (C and TB); MeteoFrance (F); Danish Meteorological Inst. (DH and DS); Swedish Meteorological and Hydrological
Table 2. Comparison of mean vital rates between central and peripheral populations of Plantago coronopus . Results from analyses (linear mixed models for fecundity, recruitment and growth, and generalized linear mixed model for survival) and average values per position ( � SE).
Fecundity Recruitment Growth Survival
F p F p F p F p
Effects in analysesPosition 13.60 1,7 0.007 5.07 1,9 0.050 4.51 1,11 0.057 1.51 1,9 0.250Population 39.60 9 � 0.001 4.69 9 � 0.001 21.21 9 � 0.001 0.64 � 0.31 ∗ 0.038Year 1.83 2 0.353 7.86 2 0.001 8.82 2 0.101 0.44 � 0.44 ∗ 0.308Position � year 38.29 2 � 0.001 4.97 2 0.007Plant size 1685.97 1 � 0.001 156.73 1 � 0.001Life stage 388.17 1,4899 � 0.001 49.45 1,10379 � 0.001
Average valuesCentral 1089.5 � 200.0 2.4 � 0.7 1.7 � 0.1 42.7 � 5.1Peripheral 203.1 � 33.0 6.6 � 1.8 1.3 � 0.1 53.7 � 5.7
* Values correspond to covariance parameter estimates � SE, instead of F statistic.

5-EV
tested with a set independent analyses (LMMs) the eff ect of resource area (as an estimate of intraspecifi c competition), annual precipitation and soil organic matter on vital rates, and if the eff ect of position remained signifi cant after con-trolling for those explanatory variables. First, we analyzed the eff ect of resource area, including population as a random factor and plant size as a covariate, because of its potential infl uence on resource area. Second, we tested the eff ect of annual precipitation, using annual population averages of vital rates and including year as a random factor. Th ird, the eff ect of soil organic matter was tested on average popula-tion vital rates across all years (here we used a linear model instead of a LMM). In addition, we tested for diff erences in resource area and in annual precipitation between central and peripheral positions with LMMs (including population as a random factor), and for diff erences in soil organic matter and in CV in precipitation with t tests.
Temporal variability in vital rates was analyzed in a sub-set of three central (T, C, F) and three peripheral (DS, SG, ST) populations monitored during 5 yr (four transitions). To accurately estimate this variability, we fi rstly accounted for sampling error: for each vital rate, we fi tted a model with an intercept and a random factor of year, and we obtained the corrected annual population averages from the coeffi cients of the random factor (Altwegg et al. 2007, Morris et al. 2011). Th e analyses applied for such corrections were LMMs for fecundity, growth and recruitment and a GLMM for survival (lme and lmer procedures, respectively, R Development Core Team 2010). Variability in vital rates was then estimated from the CV of the corrected annual values. Survival has a bino-mial distribution with an inherent limit in variance, so we estimated its relative CV instead: CV/CV max . We calculated CV max from the square root of the ratio between (1�p) and p, where p is mean survival rate (Morris and Doak 2004). For each vital rate we tested for diff erences between central and peripheral populations in variability (CV) with t tests. We also analyzed overall diff erences in variability between range positions considering all vital rates together (except for survival), by performing a LMM with position as a fi xed factor and vital rate as a random factor.
We fi nally compared density between central and periph-eral populations with a LMM. Th e position of populations was included as a fi xed factor and population as a random factor. We also tested with a linear model whether density was correlated to recruitment, using average population val-ues across years, and including position as a fi xed factor.
Results
Mean vital rates in central and peripheral populations
Plants had signifi cantly higher fecundity in central than in peripheral populations of P . coronopus (Table 2, Fig. 2). Th ere were no diff erences between range positions, however, in the average number of reproductive years per individual: between 1.12 (population F) and 1.40 (T) in central popu-lations, and between 1.14 (DH) and 1.44 (ST) in periph-eral ones. Th e analysis of lifetime fecundity confi rmed a higher total seed production in central areas (F 1,2617 � 35.67,
Figure 2. Annual averages of vital rates in central (dark bars) and peripheral (light bars) populations of Plantago coronopus ( � SE). Vital rates are (a) fecundity, measured as number of seeds per year and reproductive plant; (b) recruitment, measured as number of seedlings in a given year divided by number of reproductive plants in the previous year; (c) plant growth, measured as size in a given year divided by size in the previous year; and (d) survival, measured as percentage of surviving individuals. Notice the logarithmic scale of the vertical axis in (a) and (b).

6-EV
Density in central and peripheral populations
Peripheral populations showed signifi cantly higher densities (F 1,9 � 7.73, p � 0.021) than central populations. Density was signifi cantly correlated to recruitment (F 1 � 7.19, p � 0.028). Since the eff ect of position was no longer sig-nifi cant after including recruitment in the model (F 1 � 1.72, p � 0.226), this factor explained diff erences in density between range positions.
Discussion
Peripheral populations have long been predicted to show lower vital rates, higher demographic fl uctuations, and lower densities than central populations (Hengeveld and Haeck 1982, Brown 1984, Lawton 1993, Vucetich and Waite 2003). In our comparative analysis of P . coronopus , we found higher fecundity and a tendency for higher growth in cen-tral populations. However, northern peripheral populations showed higher recruitment, resulting in higher population density, and exhibited similar temporal variability in vital rates. Th us, our fi ndings diverge from classical predictions, in agreement with other recent studies (Sagarin and Gaines 2002, Angert 2009, Doak and Morris 2010). Diff erences in demographic performance between central and peripheral populations of this widespread herb seem to be explained by local precipitation and intraspecifi c competition. We now discuss the main results.
Mean vital rates in central and peripheral populations
Peripheral populations of P . coronopus showed a much lower fecundity than central ones. Th is result agrees with other studies reporting reduced seed production or seed quality at the species ’ range margin (Pigott and Huntley 1981, Garc í aet al. 2000, Jump and Woodward 2003), although the
p � 0.001). In contrast with fecundity, peripheral popula-tions showed a signifi cantly higher recruitment than central populations (Table 2, Fig. 2).
Central populations showed a marginally signifi cant ten-dency for higher plant growth rates than peripheral popula-tions, and there were no signifi cant diff erences in survival between positions (Table 2, Fig. 2). Populations diff ered sig-nifi cantly within range positions for all vital rates. Plant size was positively correlated with fecundity and survival (Table 2) but did not diff er between central and peripheral popula-tions (F 1,9 � 1.05, p � 0.331).
Effects of competition and environmental factors on vital rates
Plants in central populations had a signifi cantly larger resource area (F 1,8 � 30.60, p � 0.001) and lower soil organic matter content (t 9 � �2.89, p � 0.018) than in peripheral populations. Precipitation was lower on average in central locations (754 mm) than in peripheral ones (1036 mm), although not signifi cantly (F 1,9 � 1.50, p � 0.252), and vari-ability in precipitation was marginally higher in central pop-ulations (t 9 � 2.21, p � 0.055). In addition, vegetation cover was consistently higher in peripheral populations (Table 1).
Resource area was positively and signifi cantly correlated to growth (F 1 � 4.81, p � 0.030). Since the eff ect of position on growth found in previous analyses was not signifi cant after controlling for resource area (F 1 � 0.08, p � 0.784), this factor explained diff erences in growth between central and peripheral populations. Resource area was also posi-tively and signifi cantly correlated to fecundity (F 1 � 68.01, p � 0.001), but the eff ect of position on fecundity remained signifi cant after controlling for resource area (F 1 � 12.90, p � 0.001). Precipitation had no signifi cant eff ect in fecun-dity (F 1,28 � 1.18, p � 0.287) or growth (F 1,28 � 0.34, p � 0.563), but did have a signifi cant eff ect in recruitment (F 1,28 � 8.32, p � 0.007). Since the eff ect of position was not signifi cant after controlling for precipitation (F 1,28 � 2.37, p � 0.135), this environmental variable explained diff erences in recruitment between central and peripheral populations. Finally, soil organic matter had no signifi cant eff ect in mean values of fecundity (F 1 � 0.03, p � 0.879), recruitment (F 1 � 0.17, p � 0.691) or growth (F 1 � 0.06, p � 0.815). Th e eff ect of environmental variables on survival was not analyzed because central and peripheral populations did not diff er in this vital rate.
Temporal variability in vital rates
Considering vital rates independently, central populations showed on average higher temporal variability in fecundity and growth, and peripheral populations were more vari-able on average in recruitment and survival (Fig. 3), but these diff erences were not signifi cant (fecundity: t 4 � 0.71, p � 0.519; growth: t 4 � 0.96, p � 0.391; recruitment: t 4 � �1.68, p � 0.168; survival: t 4 � �1.20, p � 0.296). Central and peripheral populations showed no signifi cant diff erences in overall variability when three of the vital rates (fecundity, growth and recruitment) were analyzed together (F 1,2 � 0.28, p � 0.647).
Figure 3. Temporal variability in vital rates in central (dark bars) and peripheral (light bars) populations of Plantago coronopus . Vari-ability was calculated from a subset of three central (T, C, F) and three peripheral (DS, SG, ST) populations. Vertical axis represent average values of CV in growth, fecundity and recruitment � SE (left), and average values of relative CV in survival � SE (right). See Methods for further details on how relative CV was calculated.

7-EV
Our study showed thus important diff erences in vital rates between central and peripheral populations of P . coronopus . However, beyond the central-peripheral comparison, sig-nifi cant diff erences among populations were also detected within regions for all vital rates (Fig. 2), which highlights the interest of analyzing demographic patterns of widespread species at diff erent geographical scales. Some patterns found in vital rates across the species ’ range were linked to pre-cipitation or intraspecifi c competition. Local environmental conditions, therefore, may have a crucial role in population performance, not only when comparing diff erent parts of the distribution area, but also at lower scales. Indeed, large variation in local conditions has been found within central and peripheral regions of P . coronopus , e.g. in precipitation regime (Table 1).
Temporal variability in vital rates
Peripheral populations of P . coronopus showed a higher aver-age temporal variability in recruitment and survival than central ones, but fecundity and growth were on average more variable in central locations, and more importantly, none of these diff erences were signifi cant. Although the analyses of single vital rates were not completely reliable due to low sample sizes (six populations), the opposite tendencies in fecundity and growth with respect to recruitment and sur-vival revealed no clear patterns in temporal variability between range positions, in contrast with classical predictions. Th is was confi rmed by the overall analysis of variability, which did not show signifi cant diff erences between range positions either.
Th e lack of pattern in P . coronopus is not surprising, con-sidering the discrepancy among the few related studies car-ried out with other plant species. On the one hand, fecundity and survival were more variable in peripheral than in cen-tral populations in several annual taxa (Gerst et al. 2011), and higher fl uctuations were also reported in mortality for peripheral populations of two perennial species (Nantel and Gagnon 1999). In contrast, survival was more variable in marginal populations in the perennial Mimulus lewisii but not in its congener M . cardinalis (Angert 2009), fecundityand survival showed higher variability in the range centre of the annual Hornungia petraea (Kluth and Bruelheide 2005a), and there were no diff erences between range posi-tions in variation of population growth rates in the annual Hordeum spontaneum (Volis et al. 2004). Th us, besides the relative scarcity of studies, there seems to be a mismatch between classical predictions and the heterogeneous con-clusions provided by empirical research, which hinders the establishment of general patterns in plant performance across species ’ distributions.
Density in central and peripheral populations
Our study of P . coronopus does not support the abundant-centre model, as northern peripheral populations showed higher densities than central populations. Th e higher aver-age values of resource area in central locations indicated a sparser distribution of plants in these populations, and confi rmed the diff erences found in density. Th e widely
pattern does not seem to be general (Kluth and Bruelheide 2005a, Yakimowski and Eckert 2007). Fecundity was posi-tively correlated with size in P . coronopus , a common pat-tern in plants (Hendriks and Mulder 2008). However, we found no signifi cant diff erences in plant size between range positions. Fecundity was also negatively aff ected by intraspe-cifi c competition, attending to the signifi cant correlation between seed production and resource area (see also Waite and Hutchings 1982), and this eff ect might have been fur-ther increased in peripheral locations by a higher vegetation cover. Th us, to some extent, competition for resources seems to limit seed production in northern peripheral populations of P . coronopus , although only removal experiments would confi rm such hypothesis. However, diff erences in fecundity between central and peripheral populations seem to be also determined by factors not considered in this study, since the eff ect of position remained signifi cant after controlling for plant size and intraspecifi c competition.
In contrast to fecundity, recruitment rate was higher in peripheral populations, in agreement with the pattern reported by Samis and Eckert (2009) for another coastal plant (but see Tremblay et al. 2002, Castro et al. 2004). Recruitment was estimated in our study as the presence of new seedlings in a given year relative to the number of reproductive individuals in the previous year. Hence, this measure includes three fi tness components, i.e. fecundity, germination and early survival, which estimate overall repro-ductive success better than seed production alone. It is thus noteworthy that although fecundity was higher in central populations, overall reproductive success was higher in the periphery. Similarly, diverging patterns in seed production and germination rates have been found between central and peripheral populations of other annual and perennial spe-cies (Kluth and Bruelheide 2005a, Yakimowski and Eckert 2007). Altogether, these results highlight the necessity to consider diff erent vital rates when analyzing population performance, and particularly warn against assessing repro-ductive success from fecundity data alone. Th e lower recruit-ment in central populations of P . coronopus might respond to their occurrence in sand dunes, a harsh habitat with unstable soils where seedling establishment is extremely hazardous (Crawford 2008). In contrast, the higher and less variable precipitation in the coastal meadows of northern locations off ers more favourable conditions for recruitment in terms of water availability (Castro et al. 2004).
Survival and growth rates did not diff er between central and peripheral populations of P . coronopus . However, there was a marginal tendency in central populations to pres-ent higher growth, which seems to be correlated to a lower intraspecifi c competition in their locations. Th e few studies carried out on survival and individual growth across other plant species ’ ranges are also inconclusive: some reported reduced survival rates in peripheral populations (Carey et al. 1995), while others did not fi nd a consistent pattern (Angert 2009, Gerst et al. 2011). Regarding growth, Jump et al. (2006) reported lower values in marginal populations in Fagus sylvatica , whereas Purves (2009) found diverging results between northern and southern edges in an ample survey of trees in US, although spatial scales were not com-parable in both studies.

8-EV
variation is to carry out large-scale studies of diff erent life cycle components (Sexton et al. 2009, Gerst et al. 2011). Th e life cycle might actually be regarded as a plastic pheno-typic trait (Caswell 1983) that characterizes species in a par-ticular combination of environmental variables, and which may change across ranges. In our study, the contrasting patterns of recruitment, fecundity and growth suggest compensatory changes in vital rates across the range of P . coronopus , to adjust the life cycle of populations to their local conditions (Suryan et al. 2009, Doak and Morris 2010). Such variation in the arrangement of vital rates would have allowed this plant to successfully adapt to contrasting environments over large distribution areas.
It is diffi cult to evaluate to what extent the patterns shown by P . coronopus are common among other widespread taxa, but our results contribute to understand that 1) simplistic considerations, such as positive vs negative diagnosis of the status of populations based only on their geographical posi-tion, may fail because peripheral populations might not be located in ecologically marginal conditions; 2) assessments of population performance including the full set of vital rates are much more reliable, since low values in some rates can be counterbalanced by high values in others; and 3) the reliabil-ity of niche-models predicting future species ’ distributions under global warming could be greatly improved by consid-ering intraspecifi c variation in population performance. Th e management of peripheral populations will signifi cantly gain from studies that show the importance and arrangement of diff erent fi tness components in species, and their variability over time and across ranges.
Acknowledgements – Th is study was funded by the Spanish Ministry of Science and Innovation by means of two National Projects (CGL2006-08507; CGL2010-21642) to MBG and FPU scholar-ships to JV and RB. We thank W. F. Morris and D. Doak for helpful comments on the manuscript. We are indebted to M. P. Errea for her guidance in the analysis of Voronoi polygons, to M. Maestro for soil analyses and to A. Adsuar, A. Barcos, R. Castillo, R. Corri à , R. Forrest, A. de Frutos, E. L ó pez, J. Mart í nez, E. Mor á n, C. Niklasson, F. Ojeda, S. Palacio, I. Pardo, A. P é rez, C. P é rez, P. S á nchez, A. Taboada, M. Talavera and A. Vale for their valuable help in fi eld and laboratory work through years.
References
Altwegg, R. et al. 2007. Age-specifi c fi tness components and their temporal variation in the barn owl. – Am. Nat. 169: 47– 61.
Angert, A. L. 2009. Th e niche, limits to species ’ distributions, and spatiotemporal variation in demography across the elevation ranges of two monkeyfl owers. – Proc. Natl Acad. Sci. USA 106: 19693–19698.
Brown, J. H. 1984. On the relationship between abundance and distribution of species. – Am. Nat. 124: 255–279.
Brussard, P. F. 1984. Geographic patterns and environmental gra-dients: the central-marginal model in Drosophila revisited. – Annu. Rev. Ecol. Syst. 15: 25–64.
Carey, P. D. et al. 1995. Th e determinants of the distribution and abundance of the winter annual grass Vulpia ciliata ssp. ambigua . – J. Ecol. 83: 177–187.
Castro, J. et al. 2004. Seedling establishment of a boreal tree species ( Pinus sylvestris ) at its southernmost distribution limit: consequences of being in a marginal Mediterranean habitat. – J. Ecol. 92: 266–277.
accepted idea that species are more abundant in the centre than in the edge of their range has been indeed questioned by recent comprehensive reviews (Sagarin and Gaines 2002, Gaston 2003, Sagarin et al. 2006), and our results confi rm that the abundant-centre model can no longer be assumed without previous testing. Diff erences in vital rates between central and peripheral populations are expected to aff ect den-sity (Kluth and Bruelheide 2005b), and recruitment seems to be the most determinant factor in the case of P . coronopus , attending to its positive relationship with density. Th e higher establishment of seedlings in peripheral populations, due tohigher germination and/or early survival rates, would main-tain the higher density of individuals, compensating the lower fecundity and growth in these locations. Our result highlights the importance of the early life stages of plants for population performance in P . coronopus , as corresponds for a short-lived species (Silvertown et al. 1996, Pic ó et al. 2003).
Geographical periphery vs ecological marginality
Peripheral populations are assumed to occur at the extremes of species ’ niches, where less favourable conditions are expected. Plantago coronopus occurs in diff erent habitats in the central part of its range while it is rather restricted to coastal meadows in the northern periphery, indicating that some environmental factors are limiting its spreading northwards. However, the distinction between geographi-cal periphery and ecological marginality is crucial, as these concepts not always overlap in real populations (Soul é 1973, Grant and Antonovics 1978, Herrera and Bazaga 2008). Th e higher fecundity and growth in central populations of P . coronopus suggest more favourable conditions for the development of established plants in dunes, in part due to a positive eff ect of resource area. Th is seems to be true for at least three of the fi ve central populations (T, CA, F), which present as well larger plants than most peripheral popula-tions (Table 1). However, northern peripheral locations appear to be more suitable for seedling recruitment, due to higher precipitation. Additionally, northern populations show higher densities of established plants than central populations and similar temporal variability in vital rates, which contrasts with some characteristics ascribed to ecologically marginal populations (Soul é 1973). Plantago coronopus is indeed suc-cessfully competing with other plant species of similar life histories and resource requirements in the northern coastal meadows, while it behaves as a poor competitor in sand dunes of central areas. Th us, despite a restriction of northern pop-ulations of P. coronopus to coastal environments, our study shows that habitats may be more favourable at the range periphery, at least for some vital rates (Sexton et al. 2009), and highlights the importance of carefully distinguishing between geographical periphery and ecological marginality when fore-casting population performance (but see Gerst et al. 2011).
Final remarks
Th eoretical studies often simplify comparisons between central and peripheral populations. However, variation in population performance across species ’ ranges may be com-plex, and the best way to understand such intraspecifi c

9-EV
Jump, A. S. et al. 2006. Rapid climate change-related growth decline at the southern range edge of Fagus sylvatica . – Global Change Biol. 12: 2163–2174.
Kluth, C. and Bruelheide, H. 2005a. Eff ects of range position, inter-annual variation and density on demographic transition rates of Hornungia petraea populations. – Oecologia 145: 382–393.
Kluth, C. and Bruelheide, H. 2005b. Central and peripheral Hornungia petraea populations: patterns and dynamics. – J. Ecol. 93: 584–595.
Lavergne, S. et al. 2010. Biodiversity and climate change: integrat-ing evolutionary and ecological responses of species and com-munities. – Annu. Rev. Ecol. Evol. Syst. 41: 321–350.
Lawton, J. H. 1993. Range, population abundance and conserva-tion. – Trends Ecol. Evol. 8: 409–413.
Lennon, J. J. et al. 2002. Are Alaskan trees found in locally more favourable sites in marginal areas? – Global Ecol. Biogeogr. 11: 103– 114.
Lesica, P. and Allendorf, F. W. 1995. When are peripheral-populations valuable for conservation. – Conserv. Biol. 9: 753–760.
Morris, W. F. and Doak, D. F. 2004. Buff ering of life histories against environmental stochasticity: accounting for a spurious correlation between the variabilities of vital rates and their con-tributions to fi tness. – Am. Nat. 163: 579–590.
Morris, W. F. et al. 2011. Low demographic variability in wild pri-mate populations: fi tness impacts of variation, covariation, and serial correlation in vital rates. – Am. Nat. 177: E14–E28.
Nantel, P. and Gagnon, D. 1999. Variability in the dynamics of northern peripheral versus southern populations of two clonal plant species, Helianthus divaricatus and Rhus aromatica . – J. Ecol. 87: 748–760.
Pic ó , F. X. et al. 2003. Recruitment rates exhibit high elasticity and high temporal variation in populations of a short-lived peren-nial herb. – Oikos 103: 69 – 74.
Pigott, C. D. and Huntley, J. P. 1981. Factors controlling the dis-tribution of Tilia cordata at the northern limits of its geo-graphical range. III. Nature and causes of seed sterility. – New Phytol. 87: 817–839.
Purves, D. W. 2009. Th e demography of range boundaries versus range cores in eastern US tree species. – Proc. R. Soc. B 276: 1477–1484.
Sagarin, R. D. and Gaines, S. D. 2002. Th e ‘ abundant centre ’ distribution: to what extent is it a biogeographical rule? – Ecol. Lett. 5: 137– 147.
Sagarin, R. D. et al. 2006. Moving beyond assumptions to under-stand abundance distributions across the ranges of species. – Trends Ecol. Evol. 21: 524 – 530.
Samis, K. E. and Eckert, C. G. 2009. Ecological correlates of fi tness across the northern geographic range limit of a Pacifi c Coast dune plant. – Ecology 90: 3051–3061.
Sexton, J. P. et al. 2009. Evolution and ecology of species range limits. – Annu. Rev. Ecol. Evol. Syst. 40: 415– 436.
Silvertown, J. et al. 1996. Interpretation of elasticity matrices as an aid to the management of plant populations for conservation. – Conserv. Biol. 10: 591–597.
Soul é , M. 1973. Th e epistasis cycle: a theory of marginal popula-tions. – Annu. Rev. Ecol. Syst. 4: 165– 187.
Strong, C. W. 1966. An improved method of obtaining density from line-transect data. – Ecology 47: 311–313.
Suryan, R. M. et al. 2009. Environmental forcing on life history strategies: evidence for multi-trophic level responses at ocean basin scales. – Prog. Oceanogr. 81: 214–222.
Travis, J. M. J. and Dytham, C. 2004. A method for simulating patterns of habitat availability at static and dynamic range margins. – Oikos 104: 410– 416.
Tremblay, M. F. et al. 2002. Th e potential eff ects of sexual repro-duction and seedling recruitment on the maintenance of red
Caswell, H. 1983. Phenotypic plasticity in life-history traits: demo-graphic eff ects and evolutionary consequences. – Am. Zool. 23: 35–46.
Chater, A. O. and Cartier, D. 1976. Plantago L. – In: Tutin, T. G. et al. (eds), Flora Europaea, Vol. IV. Cambridge Univ. Press, pp. 38–44.
Crawford, R. M. M. 2008. Plants at the margin: ecological limits and climate change. – Cambridge Univ. Press.
Curnutt, J. L. et al.1996. Population variability of sparrows in space and time. – Oikos 76: 131–144.
Doak, D. and Morris, W. F. 2010. Demographic compensation and tipping points in climate-induced range shifts. – Nature 467: 959–962.
Eckert, C. G. et al. 2008. Genetic variation across species ’ geo-graphical ranges: the central-marginal hypothesis and beyond. – Mol. Ecol. 17: 1170–1188.
Frederiksen, M. et al. 2005. Inter-population variation in demographic parameters: a neglected subject? – Oikos 111: 209–214.
Garc í a, D. et al. 2000. Geographical variation in seed production, predation and abortion in Juniperus communis throughout its range in Europe. – J. Ecol. 88: 436–446.
Gaston, K. J. 2003. Th e structure and dynamics of geographic ranges. – Oxford Univ. Press.
Gaston, K. J. 2009. Geographic range limits: achieving synthesis. – Proc. R. Soc. B 276: 1395–1406.
Gerst, K. L. et al. 2011. Th e eff ect of geographic range position on demographic variability in annual plants. – J. Ecol. 99: 591–599.
Gillespie, J. H. 1977. Natural selection for variances in off spring numbers: a new evolutionary principle. – Am. Nat. 111: 1010–1014.
Gould, W. R. and Nichols, J. D. 1998. Estimation of temporal variability of survival in animal populations. – Ecology 79: 2531–2538.
Grant, M. C. and Antonovics, J. 1978. Biology of ecologically marginal populations of Anthoxanthum odoratum . I. Phenetics and dynamics. – Evolution 32: 822–838.
Hampe, A. and Petit, R. J. 2005. Conserving biodiversity under climate change: the rear edge matters. – Ecol. Lett. 8: 461– 467.
Heanes, D. L. 1984. Determination of total organic-C in soils by an improved chromic acid digestion and spectro photo-metric procedure. – Comm. Soil Sci. Plant Anal. 15: 1191–1213.
Hendriks, A. J. and Mulder, C. 2008. Scaling of off spring number and mass to plant and animal size: model and meta-analysis. – Oecologia 155: 705–716.
Hengeveld, R. and Haeck, J. 1982. Th e distribution of abundance. I. Measurements. – J. Biogeogr. 9: 303–316.
Herrera, C. M. and Bazaga, P. 2008. Adding a third dimension to the edge of a species ’ range: altitude and genetic structuring in mountainous landscapes. – Heredity 100: 275–285.
Holt, R. D. and Keitt, T. H. 2005. Species ’ borders: a unifying theme in ecology. – Oikos 108: 3–6.
Hult é n, E. and Fries, M. 1986. Atlas of north European vascular plants. North of the Tropic of Cancer. Maps 1 – 996. – Koeltz Scientifi c Books.
Joshi, J. et al. 2001. Local adaptation enhances performance of common plant species. – Ecol. Lett. 4: 536–544.
Juenger, T. and Bergelson, J. 2000. Th e evolution of compensation to herbivory in scarlet gilia, Ipomopsis aggregata : herbivore-imposed natural selection and the quantitative genetics of tol-erance. – Evolution 54: 764–777.
Jump, A. S. and Woodward, F. I. 2003. Seed production and pop-ulation density decline approaching the range-edge of Cirsium species. – New Phytol. 160: 349–358.

10-EV
Waite, S. and Hutchings, M. J. 1982. Plastic energy allocation patterns in Plantago coronopus . – Oikos 38: 333–342.
Williams, C. K. et al. 2003. Population dynamics across geograph-ical ranges: time-series analyses of three small game species. – Ecology 84: 2654–2667.
Yakimowski, S. B. and Eckert, C. G. 2007. Th reatened peripheral populations in context: geographical variation in population frequency and size and sexual reproduction in a clonal woody shrub. – Conserv. Biol. 21: 811–822.
maple ( Acer rubrum L.) populations at the northern limit of the species range. – J. Biogeogr. 29: 365–373.
Volis, S. et al. 2004. Demography and role of the seed bank in Mediterranean and desert populations of wild barley. – Basic Appl. Ecol. 5: 53–64.
Vucetich, J. A. and Waite, T. A. 2003. Spatial patterns of demog-raphy and genetic processes across the species ’ range: null hypotheses for landscape conservation genetics. – Conserv. Genet. 4: 639–645.

Chapter 2
33
Chapter 2
Variation in stochastic demography between and within central and
peripheral regions in a widespread short-lived herb
Jesús Villellas1, William F. Morris2, 3 and María B. García1
1Instituto Pirenaico de Ecología (IPE-CSIC), Apdo. 13034, 50080 Zaragoza, Spain. Fax: 0034976716019. 2Biology Department, Duke University, Box 90338, Durham, North Carolina 27708-0338 USA. 3Present
address: Department of Ecology and Genetics, Uppsala University, Norbyvägen 18D, 752 36 Uppsala, Sweden.
Ecology (in press).


Chapter 2
35
Variation in stochastic demography between and within central and
peripheral regions in a widespread short-lived herb
Jesús Villellas1, William F. Morris2, 3 and María B. García1
1Instituto Pirenaico de Ecología (IPE-CSIC), Apdo. 13034, 50080 Zaragoza, Spain. Fax: 0034976716019. 2Biology Department, Duke University, Box 90338, Durham, North Carolina 27708-0338 USA. 3Present address: Department of Ecology and Genetics, Uppsala University, Norbyvägen 18D, 752 36 Uppsala, Sweden.
Analyzing intraspecific variation in population dynamics in relation to environmental factors is crucial to understand the current and future distributions of plant species. Across ranges, peripheral populations are often expected to show lower and more temporally variable vital rates than central populations, although it remains unclear how much any differences in vital rates actually contribute to differences in population growth rates. Moreover, few demographic studies accounting for environmental stochasticity have been carried out both at continental and regional scales. In this study we calculated stochastic growth rates in five central and six northern peripheral populations of the widespread short-lived herb Plantago coronopus along the Atlantic Coast in Europe. To evaluate at two spatial scales how mean values and variability of vital rates (i.e. fecundity, recruitment, survival, growth and shrinkage) contributed to the differences in stochastic growth rates, we performed Stochastic Life Table Response Experiment analyses between and within central and peripheral regions. Additionally, we searched for correlations between vital rate contributions and local environmental conditions. Lower mean values and greater variability for some vital rates in peripheral than in central populations had an overall negative but non-significant effect on the stochastic growth rates in the periphery. Different life cycle components accounted for differences in population growth depending on spatial scale, although recruitment was the vital rate with the highest influence both between and within regions. Interestingly, the same pattern of differentiation among populations was found within central and peripheral areas: in both regions, one group of populations displayed positive contributions of growth and shrinkage and negative contributions of recruitment and survival, the opposite pattern being found in the remaining populations. These differences among populations within regions in vital rate contributions were correlated with precipitation regime, whereas at the continental scale, differences in contribution patterns were related to temperature. Altogether, our results show how populations of P. coronopus exhibit life cycle differences that may enable it to persist in locations with widely varying environmental conditions. This demographic flexibility may help to explain the success of widespread plants across large and heterogeneous ranges.
Key words: Climatic conditions, comparative demography, compensatory shifts in vital rates, core and marginal populations, intraspecific variation, latitudinal gradient, matrix projection models, multiple spatial scales, Plantago coronopus, species distribution limits, Stochastic LTRE
Introduction
Peripheral populations have been predicted to show lower densities, lower population growth rates, or higher demographic fluctuations than central populations, due to hypothetically less suitable conditions and higher isolation (Brown
1984, Lawton 1993, Vucetich and Waite 2003). Though some studies found declining performance of plant populations towards range edges (Carey et al. 1995, Nantel and Gagnon 1999, Eckhart et al. 2011), others did not (Angert 2009, Eckstein et al. 2009, García et al. 2010, Doak and Morris 2010), and recent

Publications
36
reviews have seriously challenged the validity of these widely accepted predictions (Sagarin and Gaines 2002, Gaston 2009, Sexton et al. 2009). There is actually no reason to expect that population performance will always decrease towards the periphery, as the locations where peripheral populations occur may simply be the ones where the environment is locally favorable for the species, even if such locations are less common near the range limits (Holt and Keitt 2000, Lennon et al. 2002). In addition, while some studies have assessed the means and temporal variability in vital rates and the stochastic population growth rates in central and marginal areas of species’ distributions (Angert 2009, Doak and Morris 2010, Eckhart et al. 2011), the relative contributions of differences in vital rate means vs. standard deviations to population growth rates across ranges have never been quantified.
Another set of studies has explored spatial variability in population dynamics within limited areas of species’ distributions in relation to varying environmental conditions (van Groenendael and Slim 1988, Horvitz and Schemske 1995, Jongejans and de Kroon 2005). However, few studies have examined variability both between and within distinct regions (but see Menges and Dolan 1998, Jongejans et al. 2010), even though the relative importance of different vital rates for population growth may change across spatial scales (Jongejans et al. 2010). Determining which life cycle components have a higher influence on population performance is indeed one of the best ways to analyze intraspecific demographic variation (Morris and Doak 2005). Unraveling the spatial variability of the key processes shaping population dynamics and its possible environmental drivers might help us to discern the causes of range limits (Eckhart et al. 2011), and may enable to project with greater precision the future distributions of species (Keith et al. 2008, Lavergne et al. 2010).
Life Table Response Experiments (LTRE) are very useful in this context because they allow us to evaluate how differences in vital rates contribute to differences in growth rates among populations (Caswell 2001). In addition, this analysis can detect differences in population dynamics even in situations of similar population growth rates, if positive contributions of some life cycle components offset negative contributions of other
components. Indeed, compensatory changes in vital rates have been already found among plant populations along environmental gradients (Jongejans and de Kroon 2005, Elderd and Doak 2006, Doak and Morris 2010). Two methodological advances have been incorporated into LTREs in recent studies: the consideration of underlying vital rates, and the use of stochastic rather than deterministic models (Caswell 2010, Davison et al. 2010, Jacquemyn et al. 2012). The former provides more precise assessments of population dynamics because these rates represent distinct biological processes better than projection matrix elements, which may confound several of these processes (Franco and Silvertown 2004). In addition, there is a growing recognition of the potential relevance of environmental stochasticity for the fate of populations (Tuljapurkar et al. 2003; but see Buckley et al. 2010), particularly for short-lived species (García et al. 2008, Morris et al. 2008), as temporal variability generally leads to decreased long-term population growth (Lewontin and Cohen 1969, Gillespie 1977). Stochastic LTREs (SLTRE), thus, constitute a valuable tool to examine the contributions of both the average values and the variation in underlying vital rates to the observed differences in stochastic growth rates (Davison et al. 2010), a considerable advantage with respect to deterministic approaches when analyzing strongly fluctuating vital rates. However, SLTREs have not yet been used to compare stochastic demography between and within central and peripheral areas of species’ ranges.
In this study, we analyze intraspecific demographic variation in the widespread short-lived herb Plantago coronopus, and apply SLTRE to assess the effects of differences in vital rates between and within distinct regions of its distribution. Previous studies have shown that populations of P. coronopus differ substantially in life history and demography, both at local (Waite and Hutchings 1982, Braza et al. 2010, Braza and García 2011) and continental scales (Villellas et al. 2012, Villellas and García 2012). Across the species’ latitudinal gradient, for example, central populations showed higher fecundity, whereas northern peripheral populations presented higher recruitment (Villellas et al. 2012). However, no clear pattern emerged between central and peripheral regions in temporal variability of

Chapter 2
37
vital rates, and it remains untested whether differences among populations in mean performance and demographic variability result in differences in long-term population growth rates. Even within regions, P. coronopus is exposed to a variety of environments, which may trigger demographic variation at different spatial scales. Identifying the environmental factors associated with variation in population dynamics over time and across ranges is indeed crucial for understanding plant demography (Holt and Keitt 2005, Buckley et al. 2010, Eckhart et al. 2011).
Here we present an integrative analysis of population dynamics of the widespread short-lived herb P. coronopus, using a 4-yr demographic dataset from five central and six northern peripheral populations. To our knowledge, this is the first study that performs a SLTRE at different spatial scales in a nested fashion (continental and regional), analyzing central and peripheral populations of a plant, and accounting for sampling variation in the estimation of temporal demographic variability. First, we tested whether peripheral populations had lower stochastic growth rates than central populations, and examined how differences in vital rates means and fluctuations between the center and the periphery contributed to differences in stochastic population growth. Second, we tested whether the same vital rates were responsible for demographic variation between and within regions. Third, we analyzed the relationship between variation in population dynamics and variation in environmental conditions, i.e., climate, soil fertility, and intraspecific competition.
Methods
Study species and populations
Plantago coronopus L. (Plantaginaceae) is a common, short-lived herb present from North Africa and the Iberian Peninsula to SW Asia. It also extends to North Europe in a narrow strip along the Atlantic coast and the Baltic Sea, and along the coasts of the United Kingdom (Hultén and Fries 1986). We chose the subspecies coronopus (hereafter P. coronopus), which is the most common one throughout the species’ distribution. Plants have one or a few basal rosettes, and produce spikes with wind-pollinated flowers when they reach
reproductive stage (which they sometimes do in their first year).
Plantago coronopus occurs in a variety of environmental conditions, regarding climate, vegetation cover and soil fertility. The species is present both in coastal and inland locations in the range center, where it may grow in dunes, shrublands or human-disturbed areas, and where populations present either annual or short-lived perennial life-forms (Chater and Cartier 1976). Northern populations are rather restricted to the coast, in seashore meadows and salt marshes, presenting a short-lived perennial life-form. For this work we selected 11 perennial populations along the Atlantic coast to minimize habitat differences, as our focus was on the latitudinal range rather than the coastal-to-inland axis. We monitored five central populations in sand dunes in Spain and France, and six northern peripheral populations in coastal meadows in Denmark, Sweden and Scotland (Appendix A). Central populations were Tarifa (T), Camposoto (CA), Corrubedo (C), Traba (TB) and Pen Bron (F). Northern peripheral populations were Helnaes (DH), Skallingen (DS), Glommen (SG), Torekov (ST), Aberdeen (EA) and Skye (ES). Our study did not include southern peripheral populations (i.e., in North Africa). All study populations contained thousands or tens of thousands of individuals, and appeared to be relatively stable in the long term (J. Villellas and M. B. García, personal observation). Further information of populations can be found in Villellas et al. (2012).
Data collection
We surveyed populations annually for 4 yr, yielding three annual transitions. All populations were sampled from 2007 to 2010, except for population F (period 2003-2006). However, we verified that the average and the variance of climatic variables at site F were similar in both sampling periods. In the first year, we established a number of randomly distributed plots in each population. We censused and mapped all the plants within plots each July (central populations) or August (peripheral populations), when fruits had matured but before seed dispersal. In each population census, we measured 100–400 individuals older than 1 yr that had been mapped in previous years. For each plant, we recorded the number of leaves and inflorescences, and the length of an average leaf

Publications
38
and an average inflorescence. Plant size was later estimated as number of leaves × length of an average leaf, and seed production was estimated for reproductive individuals as number of inflorescences × length of an average inflorescence × number of seeds per unit of inflorescence length (calculated with a regression equation for each population). We also mapped each year all the new seedlings within plots (hereafter “yearlings”).
We collected 10-cm deep soil cores from all populations and measured the percentage of organic matter content from the organic carbon (Heanes 1984). Meteorological data were obtained from the Spanish National Meteorological Agency (populations T and CA), MeteoGalicia (C and TB), MeteoFrance (F), Danish Meteorological Institute (DH and DS), Swedish Meteorological and Hydrological Institute (SG and ST) and Met Office (EA and ES). We used information from 10-20 years within the last four decades (depending on the availability) from the nearest meteorological station to each population (between 1 and 35 km away). We calculated mean annual temperature (ºC), mean annual precipitation (mm), and coefficient of variation (CV) in annual and monthly precipitation. The first year of this study we also estimated mean above-ground available area per individual (yearlings excluded) calculating Voronoi polygons on the scanned maps of plots (hereafter “resource area”; see also Villellas et al. 2012). We used resource area as an inverse proxy for intraspecific competition.
Projection matrices and stochastic growth rates
Individuals were classified into four stages based on age and size: one stage of yearlings (y) for plants younger than 1 yr, and three size stages (1, 2 and 3) for older plants. We used the same thresholds for size stages across populations in order to produce as even a distribution of individuals across stages as possible (see above for details on calculation of plant size, estimated from total leaf length): size 32≤ cm (stage 1), 32 < size 50≤ cm (stage 2), and size > 50 cm (stage 3). For most populations and years, sample sizes per size-based stage remained between 10 and 400 individuals, and in the case of yearlings between 25 and 1500 individuals. To construct projection matrices, we calculated 21 stage-
specific vital rates for three annual transitions and eleven populations, for a total of 33 matrices (Fig. 1; Appendix B). Vital rates were: survival (s); probability of growing to any larger size class conditional on surviving (g); probability of growing two size classes conditional on surviving and growing (k); probability of shrinking to any smaller size class conditional on surviving and not growing (r); probability of shrinking two size classes conditional on surviving and shrinking (h); probability of reproducing (p); seed production conditional on reproducing (f); and recruitment, i.e. the proportion of seeds giving rise to yearlings the following year (z). Recruitment was estimated on each plot as the number of yearlings divided by the number of seeds produced in the previous year, and then averaged across plots, as recruitment from the seed bank is negligible in this species (Waite and Hutchings 1979, R. Braza and M. B. García, unpublished data).
Raw estimates of vital rates vary annually due both to environmental variation and to sampling variation (Gould and Nichols 1988). As our goal was to assess how much true demographic variation due to environmental fluctuations contributes to population differences in growth rates, we corrected the raw vital rate estimates for sampling error with mixed models that contained only a random effect of year (cf. Altwegg et al. 2007, Morris et al. 2011). Specifically, we corrected normally distributed vital rates (seed production) using linear mixed models, and the other rates with generalized linear mixed models, assuming binomial errors (lme and lmer procedures, packages nlme and lme4, respectively; R Development Core Team 2011). This procedure produces annual vital rate estimates that are “shrunken” toward the multi-year mean value in years with low sample sizes. Accounting for sampling variation avoids overestimating the contribution of the vital rates variabilities (Gould and Nichols 1988).
Following Caswell (2001), we calculated stochastic growth rates by projecting each population 50000 yr using random draws from the set of three annual matrices, assuming identical and independent distribution. To calculate 95% confidence intervals (CI) on stochastic growth rates, we generated 5000 bootstrap replicates for each population and identified the 2.5th and 97.5th percentiles of the distribution of growth rates. To test for

Chapter 2
39
differences in stochastic growth rates between central and peripheral populations, we performed a Mann-Whitney test (wilcox.test procedure, package stats in R) because we could not assume a normal distribution.
SLTRE analyses
To evaluate the contributions of the differences among populations in vital rates to the differences in stochastic growth, we carried out SLTRE analyses (Davison et al. 2010), but based on underlying vital rates rather than matrix elements (Jacquemyn et al. 2012). We
performed SLTREs between central and peripheral regions of P. coronopus (hereafter SLTREb) and within both regions (hereafter SLTREw). In the central SLTREw, we analyzed differences among the five central populations, comparing them to a central reference population (CR); in the peripheral SLTREw, we compared the six peripheral populations to a peripheral reference population (PR); in the SLTREb, we compared CR and PR to a grand reference population (GR). To construct CR and PR annual matrices, we averaged annual vital rates across central and peripheral
Figure 1 Projection matrix (a) and life cycle (b) of Plantago coronopus, with transitions between stages of one year (t) and the next (t +1). Individuals were classified into four classes: yearlings (y) and three size classes (1, 2 and 3). Vital rates, with subindices according to classes, correspond to: survival (s); probability of growing to any larger size class conditional on surviving (g); probability of growing two size classes conditional on surviving and growing (k); probability of shrinking to any smaller size class conditional on surviving and not growing (r); probability of shrinking two size classes conditional on surviving and shrinking (h); probability of reproducing (p); seed production conditional on reproducing (f); and recruitment, i.e. the proportion of seeds giving rise to yearlings the following year (z). All life cycle transitions were recorded in this study, but only the calculation of those starting from class 2 is detailed in b).

Publications
40
populations, respectively. To construct GR annual matrices, we averaged the mean annual vital rates from CR and PR. For all the reference and study populations, we calculated means and standard deviations of all vital rates across years (Davison et al. 2010). We then computed for each SLTRE the contribution of each vital rate’s mean (Cm) and standard deviation (Csd). For each vital rate and study population, Cm was calculated as
( ) mRP
m SxxC ×−= , where xP is the vital rate’s mean in the study population, xR is the vital rate’s mean in the corresponding reference population, and Sm is the sensitivity of the reference population’s stochastic growth rate to changes in the vital rate’s mean. Similarly, Csd ‘s were calculated as ( ) sd
RPsd SxxC ×−= ,
where the x’s are now vital rate standard deviations and Ssd is the stochastic sensitivity to changes in vital rate’s standard deviation. We calculated Sm and Ssd using the perturbation method of Tuljapurkar et al. (2003) modified for vital rates (cf. Morris et al. 2006).
To facilitate interpretation we grouped the vital rate contributions into contributions of five life cycle components: fecundity ( Fe
mC and FesdC ,
which contain the sum of Cm and Csd, respectively, of vital rates f and p), growth ( Gr
mC and GrsdC , for rates g and k), shrinkage
( ShmC and Sh
sdC , for rates r and h), survival
( SumC and Su
sdC , for rate s) and recruitment
( RemC and Re
sdC , for rate z). Then, we calculated across populations the percentage contribution of means (% Cm) and standard deviations (% Csd) for each life cycle component, relative to the sum of absolute values of all contributions (Appendix C).
Relationship between population dynamics and environmental factors
To test whether populations showing demographic differences also differed in environmental conditions, we grouped them within central and peripheral areas according to the pattern of vital rate contributions (see Results). Groups C1 (T, CA and F) and C2 (C and TB) contained central populations, and groups P1 (DH, DS, ST and EA) and P2 (SG and ES) contained peripheral populations. The environmental variables analyzed were: mean annual temperature (hereafter “temperature”),
mean annual precipitation (hereafter “mean precipitation”), CV in monthly precipitation (hereafter “precipitation variability”), soil organic matter content and resource area. CV in annual precipitation was discarded due to its similarity to CV in monthly precipitation and its lower correlation with demographic differences. To evaluate how the environmental variables explained demographic differences among groups, we performed a Linear Discriminant Analysis (lda procedure, package MASS in R). We tested the significance of differences among groups regarding environmental variables with a Wilks’ lambda test (manova procedure, package stats in R).
Results
Stochastic growth rates
Populations showed large differences in stochastic growth rate within regions, ranging from 0.53 (population F) to 1.01 (C) in the central area and from 0.57 (DS) to 1.11 (ST) in the peripheral area (Fig. 2). For all populations, 95% confidence intervals of growth rates were narrower than ± 0.01. Nine of the 11 populations showed stochastic growth rate values below one. We found no significant differences in stochastic growth rates between central and peripheral populations (Mann-Whitney test; W = 15, p = 1).
Figure 2 Stochastic growth rates in central and peripheral populations of Plantago coronopus. Confidence intervals are too small to be shown (see Results). Dotted line corresponds to stochastic growth rate of one.

Chapter 2
41
SLTRE analyses
Stochastic sensitivities
For the three reference populations (GR, CR and PR), the vital rates’ Sm were on average ca. 10 times higher in absolute value than their corresponding Ssd values (Appendix D, Fig. D1), indicating that the stochastic growth rate of these populations is far more sensitive to the average than to temporal variability in performance. Sm was positive for all rates except for the shrinkage rates r2, r3 and h3. Most Ssd were instead negative, showing that demographic fluctuations had an overall detrimental effect on population growth, although some vital rates, such as py and p3, showed positive Ssd. Recruitment was the vital rate with by far the highest Sm and Ssd in absolute value in the three reference populations, followed by yearling vital rates (sy, py and gy). Differences in vital rates’ means and standard deviations between study populations and their corresponding reference population are shown in Appendix D, Table D1.
Contributions of single vital rates
In all SLTRE analyses (both between and within central and peripheral regions), Cm of vital rates was much larger than Csd in absolute value (Appendix D, Figs. D2 and D3), which indicates that temporal variability of vital rates played a much smaller role than mean values in explaining spatial variability in stochastic population growth rates. Recruitment was always the rate with the highest Cm (Appendix D, Fig. D2). In addition, yearlings showed higher Cm than other stages in survival (s) and growth rates (g, k), whereas in fecundity rates (f, p) the highest Cm corresponded either to stage 3 or to yearlings. There was less consistency among the three SLTREs regarding Csd of vital rates, although recruitment and yearling survival tended to show the highest values in all three analyses (Appendix D, Fig. D3).
Contributions of life cycle components
In the SLTREb, fecundity and recruitment showed by far the largest percentage contribution of mean values, and shrinkage the lowest (Fig. 3a). In CR, % Fe
mC was positive and
% RemC was negative, and the net contribution of
mean values was slightly positive, whereas in PR the opposite pattern was found. The net contribution of standard deviation values was positive in CR and negative in PR, recruitment making the largest contribution (Fig. 3d). The percentage contributions of the variabilities of the other life cycle components were smaller due to low sensitivities in the case of growth (Appendix D, Fig. D1), and to opposition between positive and negative contributions in survival and fecundity (results not shown).
In the SLTREw analyses, recruitment had in general the largest percentage contributions of mean values (Fig. 3b, c). Two differentiated groups of populations emerged both in the central and peripheral areas: in three central populations (T, CA and F; group C1) and four peripheral populations (DH, DS, ST and EA; group P1), % Gr
mC and % ShmC were generally
positive, and % RemC and % Su
mC were negative; the remaining two central (C and TB; group C2) and two peripheral populations (SG and ES; group P2) generally showed the opposite pattern (with a few exceptions with respect to growth or survival). Equivalent patterns of differentiation among populations in life cycle components were thus found within both regions. Survival, fecundity and recruitment showed the largest percentage contributions of variability (Fig. 3e, f).
Population dynamics and environmental factors
In the Linear Discriminant Analysis, temperature loaded most strongly on the first axis, which explained 92 % of the differences in environmental conditions among the four groups identified in Figure 3, followed by soil organic matter, precipitation variability and resource area (Fig. 4, Appendix E). The second axis explained 7 % of the spatial variation, and was mainly determined by mean precipitation and to a lesser extent by precipitation variability. Central populations (groups C1 and C2) differentiated from peripheral populations (groups P1 and P2) along the first axis, showing higher temperatures and lower soil organic matter. Groups of populations that were defined within regions on the basis of demographic performance were instead separated along the second axis: populations from groups C1 and P1 showed lower mean precipitation and higher precipitation variability than populations from

Publications
42
groups C2 and P2. Differences among groups regarding the environmental variables under study were significant (Wilks’ lambda = 0.10, F5 = 9.38, p = 0.014).
Discussion
In our study across the European latitudinal range of the widespread Plantago coronopus, we found large intraspecific variation in stochastic demography both at continental and regional scales. Despite that variation, we can formulate some general patterns. Some vital rates showed lower mean values and greater
variability in peripheral than in central populations, but led to no significant differences in stochastic growth rates between regions. Although different life cycle components accounted for differences in population dynamics depending on spatial scale, recruitment was the vital rate with the highest contribution both between and within central and peripheral regions. Our results also showed that demographic variation among populations seemed to be related with differences in temperature at the continental scale, whereas it was correlated with variation in precipitation regime within both central and peripheral areas.
Figure 3 Percentage contributions of differences in mean values (% Cm) and standard deviation values (% Csd) of vital rates of Plantago coronopus, grouped into life cycle components: survival, growth, recruitment, fecundity and shrinkage. Results from the SLTRE between central and peripheral regions (a, d), and from the SLTRE within central (b, e) and within peripheral (c, f) regions. Percentage contributions may be positive or negative, but the sum of absolute values of % Cm and % Csd of all life cycle components must be 100 for each population. In b) and c), the dashed line separates groups of populations (C1, C2, P1 and P2) with different patterns in contributions. Note the difference in scale in Y-axis between top and bottom graphics. See Methods for population acronyms.

Chapter 2
43
Figure 4 Canonical correlations of environmental variables from the Linear Discriminant Analysis in Plantago coronopus, indicating their contribution to the first and second discriminant function (arrows). Variables are mean annual temperature (tm), mean annual precipitation (pm), coefficient of variation in monthly precipitation (pmcv), soil organic matter content (som) and resource area as an inverse proxy for intraspecific competition (area). The position of populations (see Methods for population acronyms) according to their corresponding group centroids is also shown. Note the separation among population groups (C1, C2, P1, P2) between regions (left-right) and within regions (top-bottom).
Variation in population dynamics across spatial scales
We found no significant differences in stochastic growth rates between central and peripheral populations, which contrasts with classical predictions of a generalized reduction in population performance in the range periphery (Lawton 1993, Lesica and Allendorf 1995). Other recent studies have failed to find decreased growth rates towards range margins, using both deterministic (Stokes et al. 2004, Kluth and Bruelheide 2005, Eckstein et al. 2009) and stochastic approaches (Angert 2009, Doak and Morris 2010, García et al. 2010). Indeed, although multiple studies have shown reduced values in some demographic parameters at range edges, such as density or some vital rates (e.g. Carey et al. 1995, García et al. 2000, Tremblay et al. 2002), few have reported a worse overall performance in terms of population growth rates (Nantel and Gagnon 1999, Angert 2009, Eckhart et al. 2011).
Irrespective of their position, most populations in our study showed stochastic
growth rates lower than one, which deserves some attention. Deviation from equilibrium in population growth is indeed typical of short-lived plants (García et al 2008). Populations of P. coronopus can be relatively transient in space (J. Villellas and M. B. García, personal observation), such that plant patches that established and grew in a certain year may decline following a perturbation, or invasion of more competitive taxa in the following years. However, the species may compensate for such declines by spreading to nearby sites within the same locations. Thus, although permanent plots are often set up in places where plants are relatively dense, the situation can change over years for short-lived species, given the large fluctuations in local populations they commonly experience (Glazier 1986). Buckley et al. (2010) also referred to the potential problems of choosing “good sites” within populations at the beginning of demographic studies.
Numerous studies to date have analyzed temporal variability in vital rates across ranges, with contrasting results. A previous study with P. coronopus showed higher temporal

Publications
44
variability in peripheral than in central populations in some life cycle components, such as recruitment, and lower fluctuations in others, such as fecundity, but differences were not statistically significant (Villellas et al. 2012). Studies with other plant taxa showed higher temporal variability in vital rates in peripheral populations (Nantel and Gagnon 1999, Vucetich and Waite 2003, Gerst et al. 2011), in central populations (Kluth and Bruelheide 2005), or failed to find any clear pattern (Angert 2009). However, to our knowledge, this is the first study that quantifies the real effect on population growth rates of such differences across ranges, discounting as well for sampling variation to reduce the implicit overestimation of temporal variability. In P. coronopus, the overall effect of temporal variability was slightly negative for the population growth of peripheral populations, and originated almost exclusively from differences in recruitment variability. The contribution of variation in other life cycle components was negligible due to low sensitivity values or opposition between positive and negative contributions.
In all the SLTREs performed, vital rate means showed in general higher sensitivities and greater contributions to differences in population growth rates than did temporal variability, as expected (Davison et al. 2010, Jacquemyn et al. 2012). However, the net contribution of the mean values of all vital rates together was lower than that of the standard deviations in three populations in the within-region SLTREs (central TB, and peripheral DS and SG; Fig. 3). In these populations, positive and negative contributions of mean vital rates cancelled each other, whereas contributions of standard deviations did not. This result highlights the importance of considering stochasticity, and not only mean performance, when assessing demographic differences among populations (Gillespie 1977, Tuljapurkar et al. 2003, Davison et al. 2010).
Previous studies in P. coronopus had already suggested a key role of recruitment (Waite 1984, Braza and García 2011). Our analyses of sensitivities and contributions showed that, irrespective of the spatial scale of comparison, recruitment was indeed the most relevant vital rate for stochastic population growth. The importance of the early stages in the life cycle of P. coronopus was further confirmed by the high sensitivities and
contributions of vital rates (e.g. survival) of newly recruited yearlings. Similar results were found in the short-lived congener P. lanceolata (van Groenendael and Slim 1988) and in other short-lived perennials (Pico et al. 2003, García et al. 2008, Davison et al. 2010), whereas population dynamics in the longer-lived congener P. media were more influenced by survival of the oldest stages (Eriksson and Eriksson 2000).
Despite a consistently high relevance of recruitment for the population dynamics of P. coronopus, we found that the set of life cycle components contributed in distinct ways to differences in population growth rates depending on the spatial scale of analysis. At continental scale, the present work confirmed previous findings (Villellas et al. 2012) that fecundity (higher in central populations) and recruitment (higher in peripheral locations) underlie demographic differences between the core and the northern edge of the species’ range. Within central and peripheral regions, in contrast, there was a more balanced contribution of different life cycle components: recruitment showed the highest contribution, but growth, survival and fecundity were also relevant. Similarly, Jongejans et al. (2010) found in three perennial plants that, although a single vital rate was the most important for differences in deterministic population growth rates both between and within regions, the role of the remaining vital rates varied across scales. Changes in the relative importance of vital rates can also be found among nearby populations (Morris and Doak 2005), which indicates that the importance of life cycle components may vary within plant taxa even at small spatial scales.
The role of environmental conditions in life cycle variation
Differences in population dynamics across the range of P. coronopus are better understood when accounting for variation in environmental conditions. In the central-peripheral comparison, demographic differences seem to be correlated with temperature, and secondarily with other factors such as soil conditions or precipitation, although direct causal relationships are difficult to establish. Within central and peripheral areas, in contrast, demographic differences were clearly associated with precipitation regime: in both regions, populations with positive

Chapter 2
45
contributions of recruitment and survival, and negative contributions of growth and shrinkage (groups C2 and P2) showed higher and more constant precipitation, whereas populations with the opposite demographic pattern (groups C1 and P1) showed lower and more variable rainfall. These differences among populations seem to be reflected in additional demographic and morphological parameters analyzed elsewhere, as populations from wetter locations present higher densities and lower plant sizes than populations from drier sites (Villellas et al. 2012). Higher densities in wetter locations are likely the result of high recruitment. In turn, a negative effect of higher intraspecific competition on plant growth would result in lower plant sizes. Individual plant growth is indeed lower on average (and shrinkage higher) in these wetter sites.
The effects of environmental conditions on demography across distribution ranges seem to vary among taxa, and results from other studies differ from those presented here for P. coronopus. Among populations of the widespread Stipa capillata, for example, differences in plant performance are driven by climate in core areas and by soil conditions in the northwestern periphery (Wagner et al. 2011). In Silene regia, regional differences in population growth rates seem to respond in part to differences in the frequency of summer droughts, although variation in fire regime has an overall higher effect across the species’ range (Menges and Dolan 1998). In the context of global change, studies such as these that relate demography and environmental conditions at different spatial scales may become powerful tools to assess current and future population performance throughout species’ distributions (Jongejans et al. 2010).
To conclude, the large variation found in the life cycle of P. coronopus did not lead to diminished performance of any group of populations across the species’ range as measured by stochastic growth rates. Instead, compensatory changes in vital rates among populations allow life cycle adjustments to regional and local environmental conditions. Similar shifts in the role of vital rates have been also documented among populations of other plant species along environmental or geographical gradients (Elderd and Doak 2006, Doak and Morris 2010). This flexibility in the life cycle appears to be common in widespread plants, and would explain the success of these
taxa across large and environmentally heterogeneous ranges. Further research would be needed to determine whether the demographic differences we have observed across the range reflect phenotypic plasticity vs. local adaptation in response to spatially varying selection on life history traits.
Acknowledgements
We are grateful to M. Pazos for statistical assistance, to R. Braza for data of population F, to M. Maestro for soil analyses and to A. Adsuar, A. Barcos, R. Castillo, R. Corrià, J. Ehrlén, R. Forrest, A. de Frutos, E. López, J. Martínez, E. Morán, C. Niklasson, F. Ojeda, J. M. Olesen, S. Palacio, I. Pardo, A. Pérez, C. Pérez, P. Sánchez, A. Taboada, M. Talavera and A. Vale for helping in field and laboratory work. We also thank M. Franco and two anonymous reviewers for helpful comments on the manuscript. The Spanish Ministry of Science and Innovation funded this research with two National Projects (CGL2006-08507; CGL2010-21642) to M.B.G. and a FPU grant to J.V.
References
Altwegg, R., M. Schaub, and A. Roulin. 2007. Age-specific fitness components and their temporal variation in the barn owl. American Naturalist 169:47-61.
Angert, A. L. 2009. The niche, limits to species' distributions, and spatiotemporal variation in demography across the elevation ranges of two monkeyflowers. Proceedings of the National Academy of Sciences of the United States of America 106:19693-19698.
Braza, R., J. Arroyo, and M. B. García. 2010. Natural variation of fecundity components in a widespread plant with dimorphic seeds. Acta Oecologica-International Journal of Ecology 36:471-476.
Braza, R., and M. B. García. 2011. Spreading recruitment over time to cope with environmental variability. Plant Ecology 212:283-292.
Brown, J. H. 1984. On the relationship between abundance and distribution of species. American Naturalist 124:255-279.
Buckley, Y. M., S. Ramula, S. P. Blomberg, J. H. Burns, E. E. Crone, J. Ehrlén, T. M. Knight, J.-B. Pichancourt, H. Quested, and G. M. Wardle. 2010. Causes and consequences of variation in plant population growth rate: a synthesis of
Publications
46
matrix population models in a phylogenetic context. Ecology Letters 13:1182-1197.
Carey, P. D., A. R. Watkinson, and F. F. O. Gerard. 1995. The determinants of the distribution and abundance of the winter annual grass Vulpia ciliata ssp. ambigua. Journal of Ecology 83:177-187.
Caswell, H. 2001. Matrix Population Models. Construction, Analysis and Interpretation. 2nd edition. Sinauer, Sunderland, MA, USA.
Caswell, H. 2010. Life table response experiment analysis of the stochastic growth rate. Journal of Ecology 98:324-333.
Chater, A. O., and D. Cartier. 1976. Plantago L. Pages 38-44 in T. G. Tutin, V. H. Heywood, N. A. Burges, D. M. Moore, D. H. Valentine, S. M. Walters, and D. A. Webb, editors. Flora Europaea. Cambridge University Press, Cambridge.
Davison, R., H. Jacquemyn, D. Adriaens, O. Honnay, H. de Kroon, and S. Tuljapurkar. 2010. Demographic effects of extreme weather events on a short-lived calcareous grassland species: stochastic life table response experiments. Journal of Ecology 98:255-267.
Doak, D. F., and W. F. Morris. 2010. Demographic compensation and tipping points in climate-induced range shifts. Nature 467:959-962.
Eckhart, V. M., M. A. Geber, W. F. Morris, E. S. Fabio, P. Tiffin, and D. A. Moeller. 2011. The geography of demography: long-term demographic studies and species distribution models reveal a species border limited by adaptation. American Naturalist 178:S26-S43.
Eckstein, R. L., J. Danihelka, and A. Otte. 2009. Variation in life-cycle between three rare and endangered floodplain violets in two regions: implications for population viability and conservation. Biologia 64:69-80.
Elderd, B. D., and D. F. Doak. 2006. Comparing the direct and community-mediated effects of disturbance on plant population dynamics: flooding, herbivory and Mimulus guttatus. Journal of Ecology 94:656-669.
Eriksson, A., and O. Eriksson. 2000. Population dynamics of the perennial Plantago media in semi-natural grasslands. Journal of Vegetation Science 11:245-252.
Franco, M., and J. Silvertown. 2004. Comparative demography of plants based upon elasticities of vital rates. Ecology 85:531-538.
García, D., R. Zamora, J. M. Gómez, P. Jordano, and J. A. Hodar. 2000. Geographical variation in seed production, predation and abortion in Juniperus communis throughout its range in Europe. Journal of Ecology 88:436-446.
García, M. B., D. Goni, and D. Guzmán. 2010. Living at the edge: local versus positional factors in the long-term population dynamics of
an endangered orchid. Conservation Biology 24:1219-1229.
García, M. B., F. X. Pico, and J. Ehrlén. 2008. Life span correlates with population dynamics in perennial herbaceous plants. American Journal of Botany 95:258-262.
Gaston, K. J. 2009. Geographic range limits: achieving synthesis. Proceedings of the Royal Society B-Biological Sciences 276:1395-1406.
Gerst, K. L., A. L. Angert, and D. L. Venable. 2011. The effect of geographic range position on demographic variability in annual plants. Journal of Ecology 99:591-599.
Gillespie, J. H. 1977. Natural selection for variances in offspring numbers: a new evolutionary principle. American Naturalist 111:1010-1014.
Glazier, D. S. 1986. Temporal variability of abundance and the distribution of species. Oikos 47:309-314.
Gould, W. R., and J. D. Nichols. 1998. Estimation of temporal variability of survival in animal populations. Ecology 79:2531-2538.
Heanes, D. L. 1984. Determination of total organic-C in soils by an improved chromic acid digestion and spectrophotometric procedure. Communications in Soil Science and Plant Analysis 15:1191-1213.
Holt, R. D. and T. H. Keitt. 2000. Alternative causes for range limits: a metapopulation perspective. Ecology Letters 3:41-47.
Holt, R. D., and T. H. Keitt. 2005. Species' borders: a unifying theme in ecology. Oikos 108:3-6.
Horvitz, C. C., and D. W. Schemske. 1995. Spatiotemporal variation in demographic transitions of a tropical understory herb: projection matrix analysis. Ecological Monographs 65:155-192.
Hultén, E., and M. Fries. 1986. Atlas of North European vascular plants. North of the Tropic of Cancer. Maps 1-996. Koeltz Scientific Books, Konigstein.
Jacquemyn, H., R. Brys, R. Davison, S. Tuljapurkar, and E. Jongejans. 2012. Stochastic LTRE analysis of the effects of herbivory on the population dynamics of a perennial grassland herb. Oikos 121:211-218.
Jongejans, E., and H. de Kroon. 2005. Space versus time variation in the population dynamics of three co-occurring perennial herbs. Journal of Ecology 93:681-692.
Jongejans, E., L. D. Jorritsma-Wienk, U. Becker, P. Dostál, M. Mildén, and H. de Kroon. 2010. Region versus site variation in the population dynamics of three short-lived perennials. Journal of Ecology 98:279-289.
Keith, D. A., H. R. Akcakaya, W. Thuiller, G. F. Midgley, R. G. Pearson, S. J. Phillips, H. M. Regan, M. B. Araujo, and T. G. Rebelo. 2008. Predicting extinction risks under climate change: coupling stochastic population models with
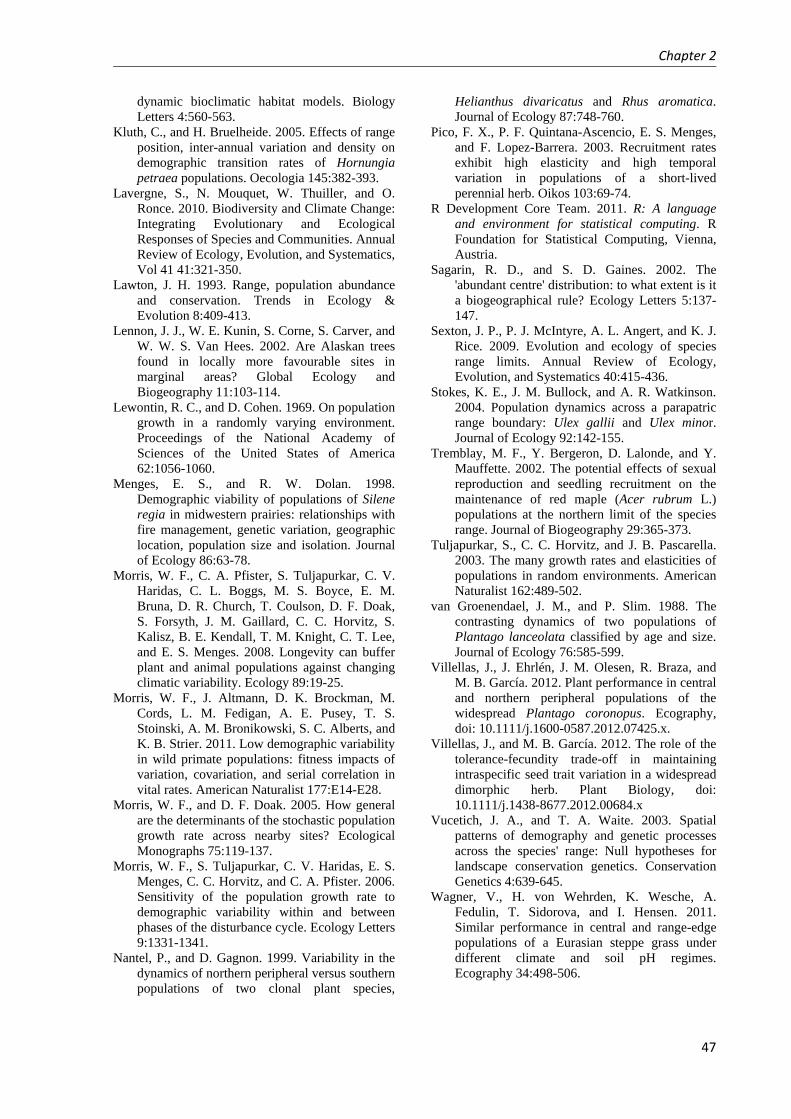
Chapter 2
47
dynamic bioclimatic habitat models. Biology Letters 4:560-563.
Kluth, C., and H. Bruelheide. 2005. Effects of range position, inter-annual variation and density on demographic transition rates of Hornungia petraea populations. Oecologia 145:382-393.
Lavergne, S., N. Mouquet, W. Thuiller, and O. Ronce. 2010. Biodiversity and Climate Change: Integrating Evolutionary and Ecological Responses of Species and Communities. Annual Review of Ecology, Evolution, and Systematics, Vol 41 41:321-350.
Lawton, J. H. 1993. Range, population abundance and conservation. Trends in Ecology & Evolution 8:409-413.
Lennon, J. J., W. E. Kunin, S. Corne, S. Carver, and W. W. S. Van Hees. 2002. Are Alaskan trees found in locally more favourable sites in marginal areas? Global Ecology and Biogeography 11:103-114.
Lewontin, R. C., and D. Cohen. 1969. On population growth in a randomly varying environment. Proceedings of the National Academy of Sciences of the United States of America 62:1056-1060.
Menges, E. S., and R. W. Dolan. 1998. Demographic viability of populations of Silene regia in midwestern prairies: relationships with fire management, genetic variation, geographic location, population size and isolation. Journal of Ecology 86:63-78.
Morris, W. F., C. A. Pfister, S. Tuljapurkar, C. V. Haridas, C. L. Boggs, M. S. Boyce, E. M. Bruna, D. R. Church, T. Coulson, D. F. Doak, S. Forsyth, J. M. Gaillard, C. C. Horvitz, S. Kalisz, B. E. Kendall, T. M. Knight, C. T. Lee, and E. S. Menges. 2008. Longevity can buffer plant and animal populations against changing climatic variability. Ecology 89:19-25.
Morris, W. F., J. Altmann, D. K. Brockman, M. Cords, L. M. Fedigan, A. E. Pusey, T. S. Stoinski, A. M. Bronikowski, S. C. Alberts, and K. B. Strier. 2011. Low demographic variability in wild primate populations: fitness impacts of variation, covariation, and serial correlation in vital rates. American Naturalist 177:E14-E28.
Morris, W. F., and D. F. Doak. 2005. How general are the determinants of the stochastic population growth rate across nearby sites? Ecological Monographs 75:119-137.
Morris, W. F., S. Tuljapurkar, C. V. Haridas, E. S. Menges, C. C. Horvitz, and C. A. Pfister. 2006. Sensitivity of the population growth rate to demographic variability within and between phases of the disturbance cycle. Ecology Letters 9:1331-1341.
Nantel, P., and D. Gagnon. 1999. Variability in the dynamics of northern peripheral versus southern populations of two clonal plant species,
Helianthus divaricatus and Rhus aromatica. Journal of Ecology 87:748-760.
Pico, F. X., P. F. Quintana-Ascencio, E. S. Menges, and F. Lopez-Barrera. 2003. Recruitment rates exhibit high elasticity and high temporal variation in populations of a short-lived perennial herb. Oikos 103:69-74.
R Development Core Team. 2011. R: A language and environment for statistical computing. R Foundation for Statistical Computing, Vienna, Austria.
Sagarin, R. D., and S. D. Gaines. 2002. The 'abundant centre' distribution: to what extent is it a biogeographical rule? Ecology Letters 5:137-147.
Sexton, J. P., P. J. McIntyre, A. L. Angert, and K. J. Rice. 2009. Evolution and ecology of species range limits. Annual Review of Ecology, Evolution, and Systematics 40:415-436.
Stokes, K. E., J. M. Bullock, and A. R. Watkinson. 2004. Population dynamics across a parapatric range boundary: Ulex gallii and Ulex minor. Journal of Ecology 92:142-155.
Tremblay, M. F., Y. Bergeron, D. Lalonde, and Y. Mauffette. 2002. The potential effects of sexual reproduction and seedling recruitment on the maintenance of red maple (Acer rubrum L.) populations at the northern limit of the species range. Journal of Biogeography 29:365-373.
Tuljapurkar, S., C. C. Horvitz, and J. B. Pascarella. 2003. The many growth rates and elasticities of populations in random environments. American Naturalist 162:489-502.
van Groenendael, J. M., and P. Slim. 1988. The contrasting dynamics of two populations of Plantago lanceolata classified by age and size. Journal of Ecology 76:585-599.
Villellas, J., J. Ehrlén, J. M. Olesen, R. Braza, and M. B. García. 2012. Plant performance in central and northern peripheral populations of the widespread Plantago coronopus. Ecography, doi: 10.1111/j.1600-0587.2012.07425.x.
Villellas, J., and M. B. García. 2012. The role of the tolerance-fecundity trade-off in maintaining intraspecific seed trait variation in a widespread dimorphic herb. Plant Biology, doi: 10.1111/j.1438-8677.2012.00684.x
Vucetich, J. A., and T. A. Waite. 2003. Spatial patterns of demography and genetic processes across the species' range: Null hypotheses for landscape conservation genetics. Conservation Genetics 4:639-645.
Wagner, V., H. von Wehrden, K. Wesche, A. Fedulin, T. Sidorova, and I. Hensen. 2011. Similar performance in central and range-edge populations of a Eurasian steppe grass under different climate and soil pH regimes. Ecography 34:498-506.

Publications
48
Waite, S. 1984. Changes in the demography of Plantago coronopus at two coastal sites. Journal of Ecology 72:809-826.
Waite, S., and M. J. Hutchings. 1979. Comparative-study of establishment of Plantago coronopus L
from seeds sown randomly and in clumps. New Phytologist 82:575-583.
Waite, S., and M. J. Hutchings. 1982. Plastic energy allocation patterns in Plantago coronopus. Oikos 38:333-342
SUPPLEMENTAL MATERIAL
Appendix A Map showing the location of populations sampled in the study.
Appendix B Vital rate mean values for each population and transition.
Appendix C Description of calculation of percentage contribution of mean and standard deviation values of life cycle components.
Appendix D Components of SLTRE: stochastic sensitivities, differences in vital rates between study and reference populations and contributions of single vital rates.
Appendix E Environmental variables in sampled populations and canonical correlations of environmental variables from the Linear Discriminant Analysis.

Chapter 2
49
APPENDIX A Map showing the location of populations sampled in the study.
FIG. A1 Location of central and northern peripheral populations of Plantago coronopus sampled in the study
(black dots; from Villellas et al. 2012). The distribution range of the species, according to Hultén and Fries
(1968), is highlighted in grey (including coastal outlines in dark grey). Central populations are Tarifa (T),
Camposoto (CA), Corrubedo (C), Traba (TB) and Pen Bron (F); peripheral populations are Helnaes (DH),
Skallingen (DS), Glommen (SG), Torekov (ST), Aberdeen (EA) and Skye (ES).

Publications
50
APPENDIX B Vital rate mean values for each population and transition. Vital rates, with subindices
according to classes (y: yearlings; 1, 2 and 3: three classes of increasing size), correspond to: survival
(s); probability of growing to any larger size class conditional on surviving (g); probability of growing
two size classes conditional on surviving and growing (k); probability of shrinking to any smaller size
class conditional on surviving and not growing (r); probability of shrinking two size classes
conditional on surviving and shrinking (h); probability of reproducing (p); seed production conditional
on reproducing (f); and recruitment, i.e. the proportion of seeds giving rise to yearlings the following
year (z). The number of decimals shown for each vital rate depends on their magnitude.

Chapter 2
51
Central populations Peripheral populations Vital rates T CA F C TB DH DS ST EA SG ES
sy 0.2290 0.2482 0.1111 0.6054 0.6435 0.1593 0.1929 0.8551 0.0739 0.8330 0.0931 gy 0.5519 0.9829 0.1982 0.1852 0.0540 0.8008 0.1192 0.6561 0.2283 0.0940 0.0949 ky 0.5871 0.8552 0.5000 0.2895 0.3055 0.6438 0.5000 0.4694 0.5172 0.2000 0.2774 fy 419.4 583.1 132.5 128.6 155.7 51.9 146.8 0.0 0.0 0.0 0.0 py 0.0735 0.7519 0.1208 0.1080 0.0734 0.4832 0.0087 0.0000 0.0000 0.0000 0.0000 z 0.0004 0.0001 0.0005 0.0043 0.0049 0.0206 0.0082 0.0229 0.0341 0.0851 0.1292 s1 0.2781 0.3125 0.1391 0.5066 0.8360 0.2413 0.4404 0.4930 0.5594 0.6702 0.6550 g1 0.5908 0.6000 0.6320 0.3145 0.1581 0.5556 0.4184 0.7649 0.1814 0.2712 0.2083 k1 0.6654 0.9591 0.6000 0.3467 0.2759 0.8089 0.4720 0.3399 0.3902 0.1683 0.1594 f1 460.1 468.1 220.3 264.0 184.9 79.1 80.0 102.9 84.0 95.4 51.1 p1 0.5167 0.1249 0.2333 0.2167 0.3879 0.0089 0.0524 0.1538 0.1210 0.2619 0.0895 s2 0.5484 0.4414 0.1238 0.6366 0.7827 0.2857 0.6386 0.6560 0.6116 0.6675 0.7372 g2 0.6274 0.9993 0.8000 0.2186 0.1360 0.3571 0.4877 0.4139 0.2212 0.0551 0.2378 r2 0.4210 0.7500 0.0000 0.4549 0.6590 0.7619 0.3846 0.3322 0.5185 0.7000 0.6125 f2 578.1 1562.0 323.6 618.6 785.0 76.6 255.1 158.0 86.2 151.7 59.2 p2 0.5265 0.0000 0.5818 0.6884 0.7801 0.1908 0.4000 0.5341 0.3614 0.6493 0.2619 s3 0.4732 0.4530 0.2323 0.6624 0.8625 0.2257 0.8435 0.6718 0.6295 0.6653 0.7358 r3 0.1467 0.0833 0.4682 0.7699 0.5394 0.1622 0.3333 0.3361 0.3907 0.8427 0.6026 h3 0.4000 0.4000 0.4167 0.4828 0.6422 0.3333 0.4287 0.3606 0.4833 0.6800 0.6383 f3 1519.1 1496.7 838.6 1310.3 2471.6 225.5 351.7 234.6 273.6 357.0 136.3
TRA
NSI
TIO
N 1
p3 0.9369 0.9007 0.8512 0.9175 0.9866 0.9286 0.6486 0.7687 0.6117 0.8382 0.2489 sy 0.5074 0.2363 0.9912 0.4879 0.4076 0.2159 0.6363 0.4725 0.0441 0.1791 0.2300 gy 0.7240 0.8515 0.6426 0.3240 0.0334 0.4701 0.6270 0.2428 0.0619 0.0340 0.1785 ky 0.6869 0.8499 0.5000 0.2895 0.3055 0.6438 0.5000 0.3169 0.5172 0.2000 0.3232 fy 286.9 560.5 132.5 316.6 346.8 270.4 146.8 0.0 0.0 0.0 0.0 py 0.3990 0.4236 0.0296 0.0162 0.0061 0.0106 0.0657 0.0000 0.0000 0.0000 0.0000 z 0.0019 0.0004 0.0005 0.0057 0.0012 0.0236 0.0040 0.0095 0.0124 0.0190 0.1108 s1 0.5574 0.3125 0.4214 0.3728 0.5739 0.2852 0.7500 0.7456 0.4154 0.6132 0.7487 g1 0.5627 0.6000 0.9933 0.6017 0.1237 0.5556 0.7672 0.4683 0.1814 0.1421 0.2083 k1 0.6443 0.5285 0.6000 0.3467 0.2759 0.6405 0.6262 0.3399 0.3902 0.1683 0.3192 f1 460.1 468.1 220.3 247.5 424.6 79.1 80.0 134.2 84.0 102.8 39.7 p1 0.7651 0.1514 0.2333 0.7078 0.6742 0.0112 0.0317 0.2316 0.1299 0.2619 0.0992 s2 0.5484 0.3293 0.4128 0.4229 0.7116 0.2857 0.7309 0.8112 0.5517 0.6100 0.8090 g2 0.6274 0.0000 0.8000 0.3096 0.0646 0.3571 0.7489 0.2969 0.2212 0.0551 0.3580 r2 0.4210 0.7500 0.0000 0.4438 0.6341 0.1111 0.3846 0.5034 0.5185 0.7000 0.6125 f2 578.1 1562.0 323.6 464.1 1071.6 76.6 193.5 180.4 115.0 153.3 62.1 p2 0.8772 0.9985 0.5818 0.9685 0.9727 0.3713 0.3764 0.5565 0.3614 0.6493 0.1615 s3 0.4732 0.1626 0.3351 0.4664 0.6970 0.5533 0.9935 0.8841 0.4773 0.5260 0.7358 r3 0.0854 0.0833 0.2283 0.7699 0.8425 0.1622 0.3333 0.6367 0.3907 0.8427 0.6026 h3 0.4000 0.4000 0.4167 0.4828 0.6422 0.3333 0.2709 0.3606 0.4994 0.6800 0.6383 f3 1519.1 3156.6 1279.9 885.5 2575.2 389.3 351.7 319.8 273.6 266.5 66.1
TRA
NSI
TIO
N 2
p3 0.9369 0.9542 0.8512 0.9175 0.9866 0.9286 0.6486 0.8357 0.2622 0.8695 0.2196 sy 0.3676 0.1917 0.2422 0.3369 0.1560 0.0874 0.0451 0.2732 0.3450 0.1547 0.3531 gy 0.7644 0.5134 0.8128 0.2388 0.0437 0.2983 0.6542 0.1369 0.0810 0.0163 0.0714 ky 0.7296 0.7396 0.5000 0.2895 0.3055 0.6438 0.5000 0.3394 0.5172 0.2000 0.2512 fy 268.9 258.6 132.5 66.2 101.4 213.5 146.8 0.0 0.0 0.0 0.0 py 0.0274 0.1769 0.0653 0.1110 0.0970 0.0247 0.0077 0.0000 0.0000 0.0000 0.0000 z 0.0022 0.0036 0.0005 0.0070 0.0010 0.0029 0.0034 0.0112 0.0035 0.0072 0.0924 s1 0.4510 0.3125 0.4697 0.3388 0.2402 0.3046 0.1006 0.4770 0.6685 0.1291 0.6658 g1 0.5965 0.6000 0.9917 0.4035 0.1012 0.5556 0.1704 0.4423 0.1814 0.0299 0.2083 k1 0.7468 0.0978 0.6000 0.3467 0.2759 0.3031 0.5491 0.3399 0.3902 0.1683 0.1548 f1 460.1 468.1 220.3 92.4 247.1 79.1 80.0 81.7 84.0 81.9 69.8 p1 0.7899 0.2177 0.2333 0.4660 0.4830 0.1025 0.0329 0.1449 0.1122 0.2619 0.0231 s2 0.5484 0.2381 0.3241 0.4129 0.2363 0.2857 0.0723 0.5158 0.7365 0.1137 0.6733 g2 0.6274 0.0000 0.8000 0.0937 0.0615 0.3571 0.7687 0.2977 0.2212 0.0551 0.2319 r2 0.4210 0.7500 0.0000 0.4406 0.9069 0.2667 0.3846 0.4894 0.5185 0.7000 0.6125 f2 578.1 1562.0 323.6 185.7 826.4 76.6 184.5 122.8 111.5 120.8 104.5 p2 0.8403 0.0000 0.5818 0.8099 0.9615 0.5957 0.2819 0.5402 0.3614 0.6493 0.0656 s3 0.4732 0.2156 0.4711 0.4446 0.3570 0.0602 0.0258 0.5197 0.7246 0.2396 0.7358 r3 0.2344 0.0833 0.2181 0.7699 0.7780 0.1622 0.3333 0.5423 0.3907 0.8427 0.6026 h3 0.4000 0.4000 0.4167 0.4828 0.6422 0.3333 0.3098 0.3606 0.4994 0.6800 0.6383 f3 1519.1 783.8 2005.6 415.6 1682.5 386.2 351.7 207.8 274.9 174.7 131.3
TRA
NSI
TIO
N 3
p3 0.9369 0.6753 0.8512 0.9175 0.9866 0.9286 0.6486 0.7816 0.5382 0.7127 0.2037

Publications
52
APPENDIX C Description of calculation of percentage contribution of mean and standard deviation
values of life cycle components.
The percentage contribution of mean values (% Cm) of each life cycle component (in this case for
fecundity) to differences in stochastic population growth rates was calculated as follows:
∑ ∑+×=
i i
isd
im
FemFe
m CCC
C 100% , (C.1)
where i corresponds to each life cycle component. Similarly, the percentage contribution of standard
deviation values for fecundity vital rates (% FesdC ) was:
∑ ∑+×=
i i
isd
im
FesdFe
sd CCC
C 100% . (C.2)
Percentage contributions may be positive or negative, but the sum of absolute values of % Cm and %
Csd of all life cycle components must be 100 for each population. Percentage contributions are an
appropriate method to summarize and compare population dynamics in Plantago coronopus since they
constitute a relative measure that can be compared across populations, and because within a given life
cycle component there were few cases in which positive and negative contributions of vital rates
cancelled one another.

Chapter 2
53
APPENDIX D Components of SLTRE: stochastic sensitivities, differences in vital rates between
study and reference populations and contributions of single vital rates.
FIG. D1 Sensitivities of stochastic growth rates to changes in mean values, Sm (a), and standard deviation values,
Ssd (b), of vital rates. Sensitivities correspond to reference populations in the three SLTRE analyses: GR (black)
for the between-region SLTRE, and CR (grey) and PR (white) for the central and the peripheral within-region
SLTRE, respectively. Vital rates, with subindices according to classes (y: yearlings; 1, 2 and 3: three classes of
increasing size), correspond to: survival (s); probability of growing to any larger size class conditional on
surviving (g); probability of growing two size classes conditional on surviving and growing (k); probability of
shrinking to any smaller size class conditional on surviving and not growing (r); probability of shrinking two
size classes conditional on surviving and shrinking (h); probability of reproducing (p); seed production
conditional on reproducing (f); and recruitment, i.e. the proportion of seeds giving rise to yearlings the following
year (z). Scale was changed for values > 2 (a) and values < -0.6 (b), as indicated by horizontal dashed lines, due
to very high values of sensitivity for the vital rate z. Note the difference in scale between a) and b).
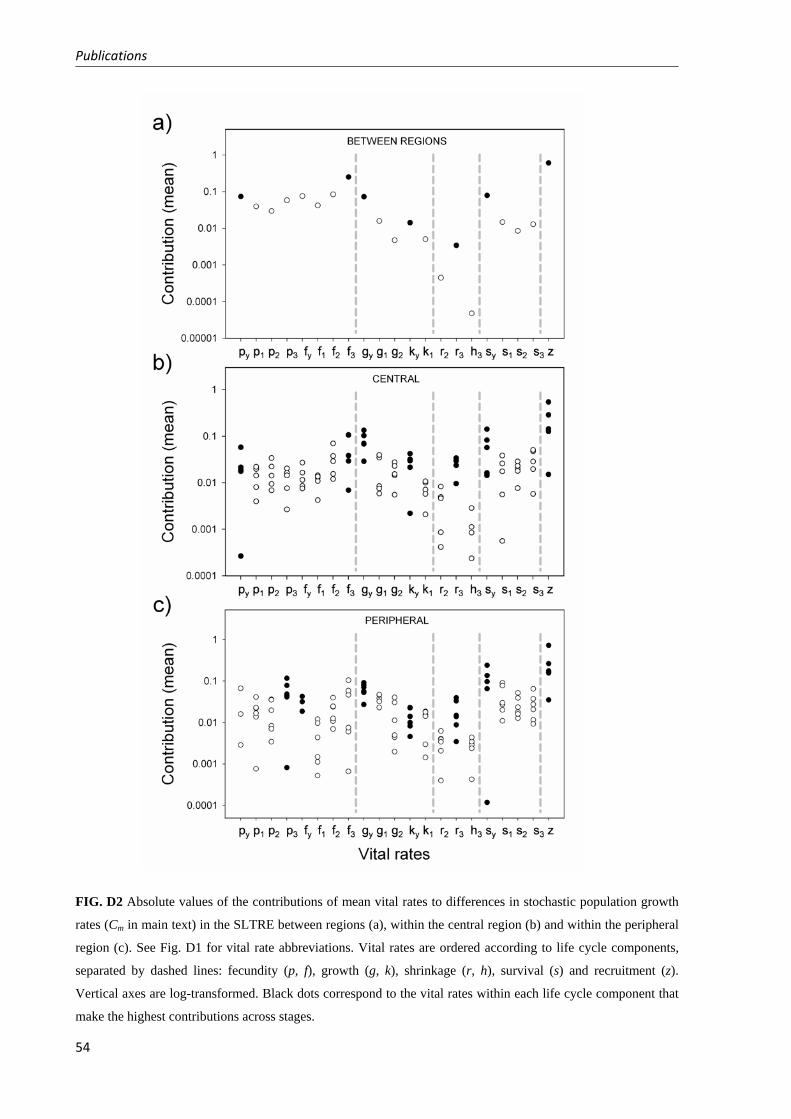
Publications
54
FIG. D2 Absolute values of the contributions of mean vital rates to differences in stochastic population growth
rates (Cm in main text) in the SLTRE between regions (a), within the central region (b) and within the peripheral
region (c). See Fig. D1 for vital rate abbreviations. Vital rates are ordered according to life cycle components,
separated by dashed lines: fecundity (p, f), growth (g, k), shrinkage (r, h), survival (s) and recruitment (z).
Vertical axes are log-transformed. Black dots correspond to the vital rates within each life cycle component that
make the highest contributions across stages.

Chapter 2
55
FIG. D3 Absolute values of the contributions of standard deviations (sd) of vital rates to differences in stochastic
population growth rates (Csd in main text) in the SLTRE between regions (a), within the central region (b) and
within the peripheral region (c). See Fig. D1 for vital rate abbreviations. Vital rates are ordered according to life
cycle components, separated by dashed lines: fecundity (p, f), growth (g, k), shrinkage (r, h), survival (s) and
recruitment (z). Vertical axes are log-transformed. Black dots correspond to the vital rates within each life cycle
component that make the highest contributions across stages. In b), Csd of h3 is zero for all populations.
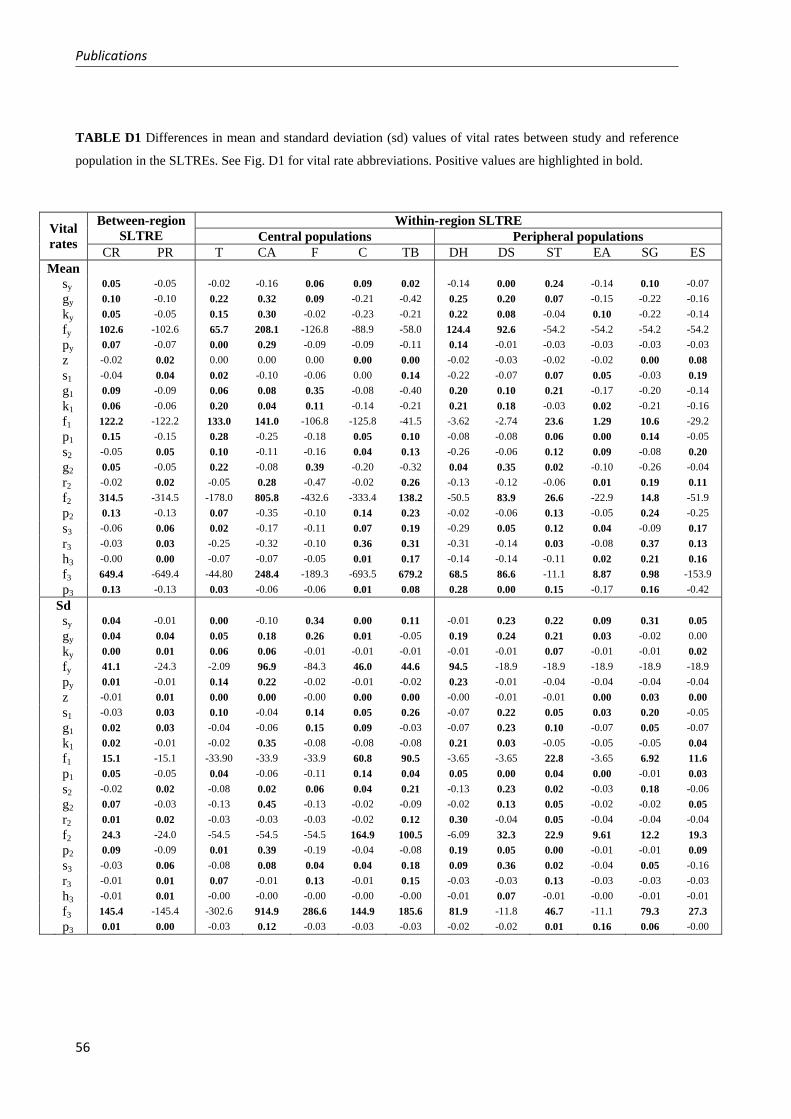
Publications
56
TABLE D1 Differences in mean and standard deviation (sd) values of vital rates between study and reference
population in the SLTREs. See Fig. D1 for vital rate abbreviations. Positive values are highlighted in bold.
Within-region SLTRE Between-region SLTRE Central populations Peripheral populations Vital
rates CR PR T CA F C TB DH DS ST EA SG ES Mean sy 0.05 -0.05 -0.02 -0.16 0.06 0.09 0.02 -0.14 0.00 0.24 -0.14 0.10 -0.07 gy 0.10 -0.10 0.22 0.32 0.09 -0.21 -0.42 0.25 0.20 0.07 -0.15 -0.22 -0.16 ky 0.05 -0.05 0.15 0.30 -0.02 -0.23 -0.21 0.22 0.08 -0.04 0.10 -0.22 -0.14 fy 102.6 -102.6 65.7 208.1 -126.8 -88.9 -58.0 124.4 92.6 -54.2 -54.2 -54.2 -54.2 py 0.07 -0.07 0.00 0.29 -0.09 -0.09 -0.11 0.14 -0.01 -0.03 -0.03 -0.03 -0.03 z -0.02 0.02 0.00 0.00 0.00 0.00 0.00 -0.02 -0.03 -0.02 -0.02 0.00 0.08 s1 -0.04 0.04 0.02 -0.10 -0.06 0.00 0.14 -0.22 -0.07 0.07 0.05 -0.03 0.19 g1 0.09 -0.09 0.06 0.08 0.35 -0.08 -0.40 0.20 0.10 0.21 -0.17 -0.20 -0.14 k1 0.06 -0.06 0.20 0.04 0.11 -0.14 -0.21 0.21 0.18 -0.03 0.02 -0.21 -0.16 f1 122.2 -122.2 133.0 141.0 -106.8 -125.8 -41.5 -3.62 -2.74 23.6 1.29 10.6 -29.2 p1 0.15 -0.15 0.28 -0.25 -0.18 0.05 0.10 -0.08 -0.08 0.06 0.00 0.14 -0.05 s2 -0.05 0.05 0.10 -0.11 -0.16 0.04 0.13 -0.26 -0.06 0.12 0.09 -0.08 0.20 g2 0.05 -0.05 0.22 -0.08 0.39 -0.20 -0.32 0.04 0.35 0.02 -0.10 -0.26 -0.04 r2 -0.02 0.02 -0.05 0.28 -0.47 -0.02 0.26 -0.13 -0.12 -0.06 0.01 0.19 0.11 f2 314.5 -314.5 -178.0 805.8 -432.6 -333.4 138.2 -50.5 83.9 26.6 -22.9 14.8 -51.9 p2 0.13 -0.13 0.07 -0.35 -0.10 0.14 0.23 -0.02 -0.06 0.13 -0.05 0.24 -0.25 s3 -0.06 0.06 0.02 -0.17 -0.11 0.07 0.19 -0.29 0.05 0.12 0.04 -0.09 0.17 r3 -0.03 0.03 -0.25 -0.32 -0.10 0.36 0.31 -0.31 -0.14 0.03 -0.08 0.37 0.13 h3 -0.00 0.00 -0.07 -0.07 -0.05 0.01 0.17 -0.14 -0.14 -0.11 0.02 0.21 0.16 f3 649.4 -649.4 -44.80 248.4 -189.3 -693.5 679.2 68.5 86.6 -11.1 8.87 0.98 -153.9 p3 0.13 -0.13 0.03 -0.06 -0.06 0.01 0.08 0.28 0.00 0.15 -0.17 0.16 -0.42
Sd sy 0.04 -0.01 0.00 -0.10 0.34 0.00 0.11 -0.01 0.23 0.22 0.09 0.31 0.05 gy 0.04 0.04 0.05 0.18 0.26 0.01 -0.05 0.19 0.24 0.21 0.03 -0.02 0.00 ky 0.00 0.01 0.06 0.06 -0.01 -0.01 -0.01 -0.01 -0.01 0.07 -0.01 -0.01 0.02 fy 41.1 -24.3 -2.09 96.9 -84.3 46.0 44.6 94.5 -18.9 -18.9 -18.9 -18.9 -18.9 py 0.01 -0.01 0.14 0.22 -0.02 -0.01 -0.02 0.23 -0.01 -0.04 -0.04 -0.04 -0.04 z -0.01 0.01 0.00 0.00 -0.00 0.00 0.00 -0.00 -0.01 -0.01 0.00 0.03 0.00 s1 -0.03 0.03 0.10 -0.04 0.14 0.05 0.26 -0.07 0.22 0.05 0.03 0.20 -0.05 g1 0.02 0.03 -0.04 -0.06 0.15 0.09 -0.03 -0.07 0.23 0.10 -0.07 0.05 -0.07 k1 0.02 -0.01 -0.02 0.35 -0.08 -0.08 -0.08 0.21 0.03 -0.05 -0.05 -0.05 0.04 f1 15.1 -15.1 -33.90 -33.9 -33.9 60.8 90.5 -3.65 -3.65 22.8 -3.65 6.92 11.6 p1 0.05 -0.05 0.04 -0.06 -0.11 0.14 0.04 0.05 0.00 0.04 0.00 -0.01 0.03 s2 -0.02 0.02 -0.08 0.02 0.06 0.04 0.21 -0.13 0.23 0.02 -0.03 0.18 -0.06 g2 0.07 -0.03 -0.13 0.45 -0.13 -0.02 -0.09 -0.02 0.13 0.05 -0.02 -0.02 0.05 r2 0.01 0.02 -0.03 -0.03 -0.03 -0.02 0.12 0.30 -0.04 0.05 -0.04 -0.04 -0.04 f2 24.3 -24.0 -54.5 -54.5 -54.5 164.9 100.5 -6.09 32.3 22.9 9.61 12.2 19.3 p2 0.09 -0.09 0.01 0.39 -0.19 -0.04 -0.08 0.19 0.05 0.00 -0.01 -0.01 0.09 s3 -0.03 0.06 -0.08 0.08 0.04 0.04 0.18 0.09 0.36 0.02 -0.04 0.05 -0.16 r3 -0.01 0.01 0.07 -0.01 0.13 -0.01 0.15 -0.03 -0.03 0.13 -0.03 -0.03 -0.03 h3 -0.01 0.01 -0.00 -0.00 -0.00 -0.00 -0.00 -0.01 0.07 -0.01 -0.00 -0.01 -0.01 f3 145.4 -145.4 -302.6 914.9 286.6 144.9 185.6 81.9 -11.8 46.7 -11.1 79.3 27.3 p3 0.01 0.00 -0.03 0.12 -0.03 -0.03 -0.03 -0.02 -0.02 0.01 0.16 0.06 -0.00
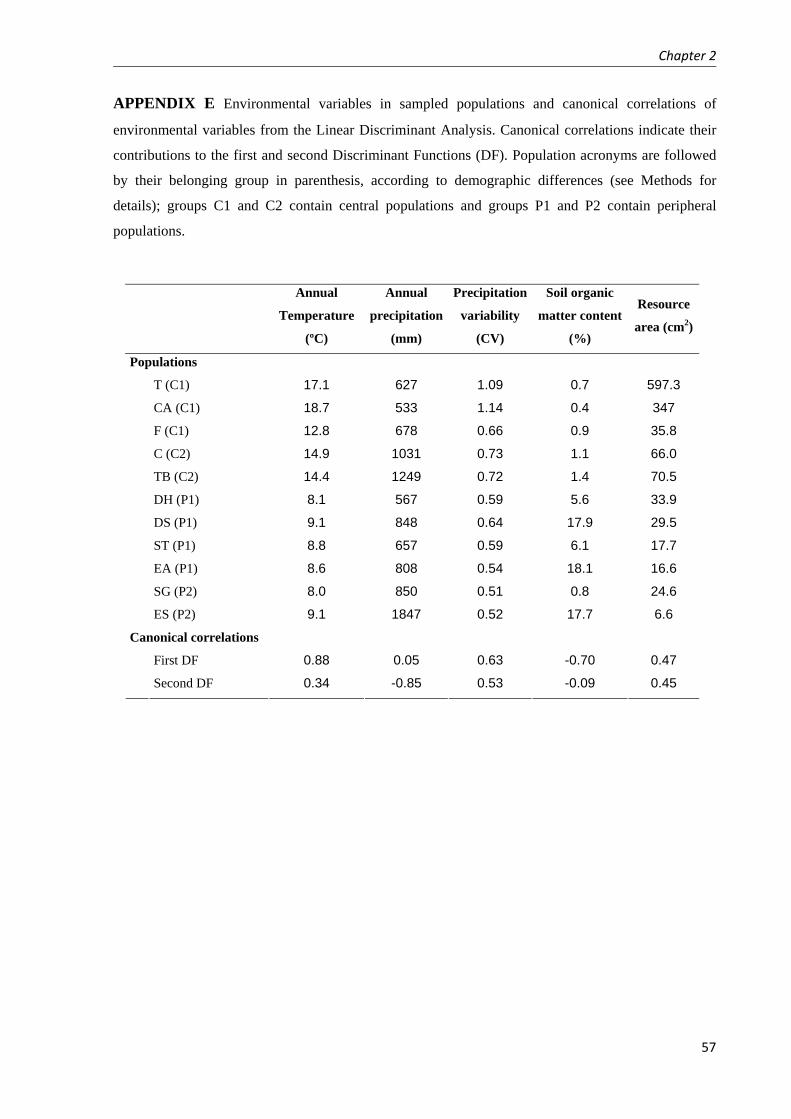
Chapter 2
57
APPENDIX E Environmental variables in sampled populations and canonical correlations of
environmental variables from the Linear Discriminant Analysis. Canonical correlations indicate their
contributions to the first and second Discriminant Functions (DF). Population acronyms are followed
by their belonging group in parenthesis, according to demographic differences (see Methods for
details); groups C1 and C2 contain central populations and groups P1 and P2 contain peripheral
populations.
Annual
Temperature
(ºC)
Annual
precipitation
(mm)
Precipitation
variability
(CV)
Soil organic
matter content
(%)
Resource
area (cm2)
Populations
T (C1) 17.1 627 1.09 0.7 597.3
CA (C1) 18.7 533 1.14 0.4 347
F (C1) 12.8 678 0.66 0.9 35.8
C (C2) 14.9 1031 0.73 1.1 66.0
TB (C2) 14.4 1249 0.72 1.4 70.5
DH (P1) 8.1 567 0.59 5.6 33.9
DS (P1) 9.1 848 0.64 17.9 29.5
ST (P1) 8.8 657 0.59 6.1 17.7
EA (P1) 8.6 808 0.54 18.1 16.6
SG (P2) 8.0 850 0.51 0.8 24.6
ES (P2) 9.1 1847 0.52 17.7 6.6
Canonical correlations
First DF 0.88 0.05 0.63 -0.70 0.47
Second DF 0.34 -0.85 0.53 -0.09 0.45


Chapter 3
59
Chapter 3
The role of the tolerance-fecundity trade-off in maintaining intraspecific
seed trait variation in a widespread dimorphic herb
Jesús Villellas and María B. García
Instituto Pirenaico de Ecología (IPE-CSIC), Apdo. 13034, 50080 Zaragoza, Spain.
Plant Biology (in press). doi: 10.1111/j.1438-8677.2012.00684.x.


RESEARCH PAPER
The role of the tolerance–fecundity trade-off in maintainingintraspecific seed trait variation in a widespread dimorphic herbJ. Villellas* & M. B. GarcıaInstituto Pirenaico de Ecologıa (IPE-CSIC), Zaragoza, Spain
Keywords
Environmental stress gradient; latitudinal
gradient; mucilage; Plantago coronopus; plant
size; seed heteromorphism; seed number and
weight; short-lived perennial.
Correspondence
J. Villellas, Instituto Pirenaico de Ecologıa
(IPE-CSIC), Apdo. 13034, 50080 Zaragoza,
Spain.
E-mail: [email protected]
Editor
F. Roux
Received: 4 April 2012; Accepted: 5 Septem-
ber 2012
doi:10.1111/j.1438-8677.2012.00684.x
ABSTRACT
Coexistence of species with different seed sizes is a long-standing issue in communityecology, and a trade-off between fecundity and stress tolerance has been proposed toexplain co-occurrence in heterogeneous environments. Here we tested an intraspecificextension of this model: whether such trade-off also explains seed trait variationamong populations of widespread plants under stress gradients. We collected seedsfrom 14 populations of Plantago coronopus along the Atlantic coast in North Africaand Europe. This herb presents seed dimorphism, producing large basal seeds with amucilaginous coat that facilitates water absorption (more stress tolerant), and smallapical seeds without coats (less stress tolerant). We analysed variation among popula-tions in number, size and mucilage production of basal and apical seeds, and searchedfor relationships between local environment and plant size. Populations under higherstress (higher temperature, lower precipitation, lower soil organic matter) had fewerseeds per fruit, higher predominance of basal relative to apical seeds, and larger basalseeds with thicker mucilaginous coats. These results strongly suggest a trade-offbetween tolerance and fecundity at the fruit level underpins variation in seed traitsamong P. coronopus populations. However, seed production per plant showed theopposite pattern to seed production per fruit, and seemed related to plant size andother life-cycle components, as an additional strategy to cope with environmental var-iation across the range. The tolerance–fecundity model may constitute, under stressgradients, a broader ecological framework to explain trait variation than the classicalseed size–number compromise, although several fecundity levels and traits should beconsidered to understand the diverse strategies of widespread plants to maximise fit-ness in each set of local conditions.
INTRODUCTION
Seed production and seed traits represent crucial componentsin plant fitness. Seed size, for example, is closely related toimportant ecological and demographic processes, such as dis-persal, germination or seedling survival (Westoby et al. 1992;Chapin et al. 1993; Coomes & Grubb 2003). Seed productionalso plays a major role in individual fitness and population per-sistence (Lloyd 1987; Westoby et al. 2002), and a trade-offbetween size and the number of seeds is expected (Smith &Fretwell 1974; Lloyd 1987). In addition, both seed size and totalseed production might show a positive relationship with plantsize (Primack 1987; Herrera 1991; Aarssen & Jordan 2001). Thepresence of mucilaginous seed coats in some plant species mayalso affect relevant seed-related processes, such as water stresstolerance, competition via allelopathy or adherence to soil par-ticles (Harper & Benton 1966; Hasegawa et al. 1992; Lu et al.2010). Many taxa present remarkable differences in seed char-acteristics among populations (e.g., McWilliams et al. 1968;McKee & Richards 1996; Mendez 1997), and quantifying thisintraspecific variation and determining its underlying causesmay be important to understand why some plants are moresuccessful than others in terms of colonisation or adaptation tonew ecological or climate scenarios (Buckley et al. 2003;Wright et al. 2006; Albert et al. 2010).
Environmental stress is a crucial factor in the ecology andevolution of plants (Grime 1977; Parsons 1991; Nevo 2001),and variation in stress levels may promote seed trait diver-gences among or within species. The hypothesis of the toler-ance–fecundity trade-off (Muller-Landau 2010; see alsoWestoby et al. 2002) has been proposed to explain the coexis-tence of plant species with different seed sizes in environmen-tally heterogeneous communities. The underlying mechanismis related to a demographic process, i.e. the differential proba-bility of recruitment at the available regeneration niches. In thisprocess, high-stress regeneration sites would be eventuallyoccupied by large-seeded species, thanks to their higher toler-ance to environmental stress. Low-stress patches, in contrast,would be occupied by species of different seed sizes and toler-ances, although small-seeded species would become dominantdue to their higher seed production relative to large-seededspecies. Because of its logic and simplicity, the mechanismunderlying the tolerance–fecundity model could be rather gen-eral, and also explain variation in seed traits across populationsof species occurring along environmental stress gradients. Inthis intraspecific extension of the model, populations in stress-ful environments would provide the seeds with additionalresources at the cost of reducing seed number. In contrast,populations in less stressful conditions could afford to reduceresource investment per seed (and thus stress tolerance) in
Plant Biology © 2012 German Botanical Society and The Royal Botanical Society of the Netherlands 1
Plant Biology ISSN 1435-8603

order to increase offspring number. These predictions rely onthe assumption that available resources for seed production areconstant across populations and do not co-vary with traitsinvolved in the trade-off (Van Noordwijk & De Jong 1986). Inaddition, despite that seed size is the most frequently studiedtrait, other seed characteristics could be considered to evaluatestress tolerance (Muller-Landau 2010), such as coat features orshape.Widespread plants occurring along environmental gradients
represent typical examples of high phenotypic variability (Joshiet al. 2001; Richards et al. 2005), and provide a good opportu-nity to analyse intraspecific variation in seed traits in relation toenvironmental conditions. Plantago coronopus is a common,short-lived perennial herb present along a strong environmentalgradient on the eastern Atlantic coast, and shows large differ-ences among populations in terms of fecundity (Braza et al.2010; Villellas et al. 2012). Additionally, this taxon presents seeddimorphism (Dowling 1933; Schat 1981), whereby fruits pro-duce both large basal seeds with a mucilaginous coat and smallapical seeds without such a coat. For individuals emerging frombasal seeds, plant performance (germination, survival and fecun-dity) is positively correlated with original seed size (Koelewijn &Van Damme 2005). Moreover, basal seeds germinate better thanapical ones, especially in dry years (Braza & Garcıa 2011), whichlikely results from higher reserves (Chapin et al. 1993; Westobyet al. 2002; Coomes & Grubb 2003) and higher water absorp-tion through the mucilaginous coat (Harper & Benton 1966;Gutterman & Shem-Tov 1997; Schat 1981).In this study, we analyse variation among populations of the
widespread herb P. coronopus in a set of seed traits, and its rela-tionship with environmental stress. Climate has a key role inplant performance at large scales (Woodward & Williams1987), and the positive relationship of seed size and mucilagewith seed performance in this species specifically suggests waterand nutrient deficits as potential sources of stress. Conse-quently, we tested the effect of environmental stress on seedtraits using: (i) water availability, estimated both from precipi-tation (see also Harper & Benton 1966; Baker 1972; Wright &Westoby 1999) and a more integrative metric of water deficitconsidering the balance between evapotranspiration and pre-cipitation (Thornthwaite 1948); (ii) temperature, which mayreduce water availability (Baker 1972) or directly affect plantmetabolic processes, as seeds require more energy to grow intoseedlings under warmer conditions (Lord et al. 1997; Murrayet al. 2004); and (iii) soil organic matter content, which can beused as an indicator of soil fertility (Reeves 1997) and may alsobe associated with soil water retention due to small particlesizes and high cation exchange capacity (Cobertera 1993).To analyse variation in fecundity and seed traits in P. coron-
opus, we sampled 14 populations along the Atlantic coast of NorthAfrica and Europe, spanning a latitudinal gradient of 4000 km.Here, we first report variability among populations in the num-ber, size and production of mucilage in basal and apical seeds.Given that P. coronopus is a perennial plant, we consider fecundityat three levels: per individual over the lifespan, per individual peryear, and per fruit. Second, we analyse if seed trait variation isassociated with soil and climate conditions, considering low wateravailability, high temperature and low organic matter content asrepresentative of stressful conditions. We also analyse if seed traitvariation is affected by plant size. Third, we test whether a trade-off between fecundity (at the three levels) and stress tolerance
promotes diversity in seed traits among populations of thisdimorphic species. In that case, we would expect populations sub-ject to higher stress to present: (i) a higher predominance of basal(more stress-tolerant) relative to apical (less stress-tolerant) seeds;(ii) larger basal seeds with higher mucilage production; and (iii) asubsequent reduction in seed production due to trade-offs inresource allocation. To strengthen the analyses of trade-offs, wetest the assumption that total resource investment in seeds is con-stant across populations and is unrelated to seed traits.
MATERIAL AND METHODS
Study species and populations
Plantago coronopus L. ssp. coronopus (Plantaginaceae) is a wide-spread, short-lived perennial herb distributed along the Medi-terranean basin, reaching northern Europe through a narrowstrip along the Atlantic coast (Fig. 1; Hulten & Fries 1986). Thesubspecies coronopus is present throughout most of the species’range and differs from other less common subspecies in mor-phology of the bracts (Chater & Cartier 1976). Our study wasrestricted to the common subspecies, and hereafter we will bereferred to as P. coronopus. It presents high variability in mor-phological characters and a life cycle that can be annual orperennial (Chater & Cartier 1976). Reproductive individualshave several spikes of wind-pollinated flowers and presentintermediate outcrossing rates, with high variation among andwithin populations (Wolff et al. 1988). Fruits are capsules thatproduce two types of seed (Dowling 1933; Schat 1981): up tofour large basal seeds and one or no small apical seeds (Fig. 2).Basal seeds further differentiate from apical seeds by the pos-session of a coat that becomes mucilaginous when moistened,
Fig. 1. Location of populations of Plantago coronopus sampled in the study
(black dots). The distribution range of the species, according to Hulten &
Fries (1986), is highlighted in grey (including coastal outlines). See Table 1
for population acronyms.
Plant Biology © 2012 German Botanical Society and The Royal Botanical Society of the Netherlands2
A tolerance–fecundity trade-off at the intraspecific level Villellas & Garcıa

which is virtually absent in the latter seed type. P. coronopus isa coloniser plant occurring in many habitats, especially sanddunes, salt marshes, coastal prairies and human-disturbedenvironments.
In this study, we analysed 14 perennial populations, span-ning almost the entire latitudinal range of the species along theeastern Atlantic coast (Table 1, Fig. 1): two populations inMorocco (Tiznit and Cap Spartel), five in Spain (Ceuta, Tarifa,Camposoto, Corrubedo and Traba), one in NW France (PenBron), two in Denmark (Helnaes and Skallingen), two in Swe-den (Glommen and Torekov) and two in Scotland (Aberdeenand Skye). All populations were located by the sea, althoughthe species’ habitat on the seashore differed along the coast:populations in Tiznit (MT), Cap Spartel (CS) and Ceuta (CT)were located on coastal cliffs; populations in Tarifa (T), Cam-posoto (CA), Corrubedo (C), Traba (TB) and Pen Bron (F)were situated on sand dunes; and populations in Helnaes
(DH), Skallingen (DS), Glommen (SG), Torekov (ST), Aber-deen (EA) and Skye (ES) were located on coastal prairies.
Environmental data
To estimate soil fertility in populations, we collected 10-cm deep soil cores and measured in the laboratory thepercentage soil organic matter content from the organiccarbon (Heanes 1984). Meteorological data were obtainedfrom several databases: http://www.allmetsat.com (MT);Direction Regional d’Hydraulique in Tetuan, Morocco (CS);Spanish National Meteorological Agency (CT, T and CA);MeteoGalicia (C and TB); MeteoFrance (F); Danish Mete-orological Institute (DH and DS); Swedish Meteorologicaland Hydrological Institute (SG and ST); and the MetOffice (EA and ES). We obtained mean monthly precipita-tion (mm), mean monthly maximum and minimum tem-peratures (°C) and mean annual temperature (°C) for 10–20 years within the last four decades (depending on avail-ability) from the nearest meteorological station to eachpopulation. We calculated total precipitation in theperiod of the growing season where highest differencesappeared among populations, i.e. from June to September(thereafter ‘summer precipitation’). We also calculatedevapotranspiration (mm) using the equation (from Harg-reaves 1985):
ET ¼ 0:00023 � RaTD0:5ðTm þ 1708Þ � d
where ET is monthly evapotranspiration, Ra is extraterrestrialradiation (calculated as a function of latitude and month of theyear; Allen et al. 1998), TD is the difference between mean
Fig. 2. Seed dimorphism in Plantago coronopus. A basal (ba) and an apical
(ap) seed after 1 h soaked in water. Basal seeds are larger than apical
seeds and possess a coat that becomes mucilaginous when moistened, as
indicated by the arrow.
Table 1. Location of Plantago coronopus populations in
the study and mean values in environmental variables:
annual temperature, summer precipitation (PS), summer
water stress index (WSIS; see Material and Methods for
details) and percentage soil organic matter (SOM).
population location coordinates
temperature
(°C) Ps (mm) WSIs SOM (%)
MT Tiznit, Morocco 29°45′ N, 09°53′ W 18.5 5 99.0 –
CS Cap Spartel,
Morocco
35°47′ N, 05°55′ W 17.7 28 19.2 –
CT Ceuta, Spain 35°54′ N, 05°21′ W 16.1 15 33.2 –
T Tarifa, Spain 36°02′ N, 05°38′ W 17.1 31 11.7 0.7
CA Camposoto,
Spain
36°25′ N, 06°13′ W 18.7 38 11.4 0.4
C Corrubedo,
Spain
42°33′ N, 09°01′ W 14.9 166 2.6 1.1
TB Traba, Spain 43°11′ N, 09°03′ W 14.7 198 2.2 1.4
F Pen Bron,
France
47°18′ N, 02°30′ W 12.8 150 2.6 0.9
DH Helnaes,
Denmark
55°08′ N, 09°59′ E 8.1 191 2.1 5.6
DS Skallingen,
Denmark
55°29′ N, 08°15′ E 9.1 313 1.2 17.9
SG Glommen,
Sweden
56°55′ N, 12°21′ E 8.0 327 1.1 0.8
ST Torekov,
Sweden
56°23′ N, 12°38′ E 8.8 286 1.3 6.1
EA Aberdeen,
Scotland
57°20′ N, 01°55′ W 8.6 250 1.3 18.1
ES Skye,
Scotland
57°30′ N, 06°26′ W 9.1 489 0.7 17.7
Plant Biology © 2012 German Botanical Society and The Royal Botanical Society of the Netherlands 3
Villellas & Garcıa A tolerance–fecundity trade-off at the intraspecific level

monthly maximum and minimum temperatures, Tm is theaverage monthly temperature, and d is the number of days ineach month. For each population, we summed ET from Juneto September to calculate summer ET, and then calculated anindex of summer water stress as the ratio between summer ETand summer precipitation.
Seed collection and measurements
We collected the spikes of 25 randomly chosen individuals ineach population in the summers of 2007 or 2008. Fruits weredissected in the laboratory to measure a set of seed-relatedtraits (Table 2). For five populations (MT, CS, CT, EA and ES)some variables were not calculated (Fig. 3). The number ofbasal and apical seeds per fruit was counted with magnifyingglasses in 10 fruits per mother plant. The number of each typeof seed per fruit and the total number of seeds per fruit (basalplus apical seeds; thereafter ‘fruit seed production’) was thenaveraged across individuals for each population. We also aver-aged across individuals the percentage of basal and apical seeds,and calculated the seed ratio from mean population values,dividing percentage of basal seeds by percentage of apicalseeds (thereafter ‘seed ratio’). As seed ratio increases, so doesthe predominance of basal seeds and thus the homogeneity inseed type.Basal and apical seed mass was estimated for each population
by weighing eight groups of 25 basal seeds and 25 apical seedsfrom 12 individuals (seeds were weighed in groups due to theirsmall size). The mucilaginous coat was measured with the aid ofmagnifying glasses in five basal seeds per plant, with 15 plantsper population. We first soaked the seeds for 1 h in Petri dishesuntil the mucilage became conspicuous (Fig. 2). We estimatedthe projected seed area and the total area that contained boththe seed and the mucilaginous coat using the ellipse formula(area = p � a � b; a and b correspond to the major and minorsemi-axes), and calculated the mucilage area by subtracting theseed area from the total area. For each population, we averagedacross seeds the percentage areas of mucilage and seed, and thencalculated from mean population percentages the ratio between
mucilage and seed area (thereafter ‘mucilage ratio’). We used arelative measure of mucilage because, in a linear regression (lmprocedure, package stats; R Development Core Team 2011),mucilage area was positively correlated to seed area (t857 = 22.6,R2 = 0.37, P < 0.001).
We estimated the total number of seeds per year (thereafter‘annual seed production’) and the size of an average of 160reproductive individuals per population and year in annualcensuses from 2007 to 2010. Each year, we recorded the num-ber of leaves and inflorescences of individuals, and the lengthof an average leaf and an average inflorescence. Plant sizewas defined as number of leaves*length of an average leaf, andannual seed production was estimated as number of inflores-cences*length of an average inflorescence*number of seeds perunit of inflorescence length (calculated with a regression equa-tion for each population). We also calculated the total seedproduction over the lifespan (thereafter ‘lifetime seed produc-tion’) for those reproductive individuals that were monitoredfor their entire lives. For further details on the estimation ofthese parameters, see Villellas et al. (2012). Annual seed pro-duction, lifetime seed production and plant size were thenaveraged for each population across individuals and years.
Finally, we estimated for each population the total mass allo-cation to seeds per fruit, per plant per year and per plant overthe lifespan (thereafter ‘fruit seed mass’, ‘annual seed mass’ and‘lifetime seed mass’, respectively) from mean values of theabove parameters: fruit seed mass = (number of basal seedsper fruit*basal seed mass) + (number of apical seeds perfruit*apical seed mass); annual seed mass = annual seed pro-duction*(fruit seed mass/fruit seed production); lifetime seedmass = lifetime seed production*(fruit seed mass/fruit seedproduction).
Analysis of seed trait variability, environmental factors andplant size
We analysed among-population variability in seed traits withthe coefficient of variation (CV) of population mean values.Since most of the traits were log-normally distributed, we also
seed trait description CV CVln
lifetime seed production Total number of seeds per
plant over the lifespan
0.74 0.77
annual seed production Total number of seeds
per plant per year
0.84 1.17
fruit seed production Total number of seeds
per fruit (basal plus
apical seeds)
0.24 0.25
lifetime seed mass Total mass of seeds per plant
over the lifespan
1.12 1.20
annual seed mass Total mass of seeds per
plant per year
1.05 1.64
fruit seed mass Total mass of seeds per fruit
(basal plus apical seeds)
0.18 0.17
seed ratio Ratio between basal and
apical seeds
0.74 0.57
basal seed mass Mass of basal seeds 0.31 0.31
apical seed mass Mass of apical seeds 0.23 0.27
mucilage ratio Amount of mucilage in basal
seeds, relative to seed size
0.23 0.22
Table 2. Description of seed traits measured in Plantag-o coronopus, and their variability among populations,
estimated with the standard coefficient of variation (CV)of population mean values, and the coefficient of varia-
tion for log-normal distributions (CVln; see Material and
Methods for details).
Plant Biology © 2012 German Botanical Society and The Royal Botanical Society of the Netherlands4
A tolerance–fecundity trade-off at the intraspecific level Villellas & Garcıa

calculated the coefficient of variation appropriate for thisdistribution, as CVln ¼
ffiffiffiffiffiffiffiffiffiffiffiffiffiffiffiffi
eðs2Þ � 1p
, where e is the base of thenatural logarithm and s is the standard deviation of the natu-ral-log transformed data (Koopmans et al. 1964).
The effects of environmental factors on seed trait variationwere tested on those traits conferring stress tolerance to plants,i.e. seed mass and mucilage (see Introduction; thereafter ‘stresstolerance traits’). Considering the particular dimorphism ofthe species, in which basal seeds are larger than apical seedsand the latter lack the mucilaginous coat, we selected the fol-lowing stress tolerance traits: seed ratio, basal seed mass andmucilage ratio (all of them log-transformed). We analysed col-linearity among environmental variables with an analysis ofvariance inflation factor (vif procedure, package car in R), anddiscarded summer water stress index from subsequent analysesbecause it showed high collinearity with summer precipitation(values much higher than 10; Kleinbaum et al. 1988) andbecause the latter provided a better fit to our data. Thus, theenvironmental predictors were mean annual temperature,summer precipitation (log-transformed) and soil fertility (log-transformed). For each stress tolerance trait, we performed lin-ear regressions with each of the three predictors, as well as mul-tiple linear regressions with all possible combinations with twoor three predictors (lm procedure, package stats in R). To findwhich model provided the best fit to our data, we first com-
pared the AIC (Akaike information criterion) values from allregression analyses. Among the combinations of predictorswith the lowest AIC values, we then checked with ANOVA if thesequential addition of predictors significantly improved theprevious simpler model (ANOVA procedure, package stats in R).For these analyses, we used the populations for which we haddata for all environmental predictors and stress tolerance traits(all except MT, CS and CT), so that AIC values were comparable.We also analysed whether plant size (log-transformed) was
correlated with seed-related traits using linear regressions,although the effect of plant size on lifetime and annual seedproduction was instead analysed with linear mixed models,including population and year as random factors (lme proce-dure, package nlme in R).
Analysis of the tolerance–fecundity trade-off
To test for a trade-off between fecundity and stress tolerance,we used estimates of seed production at three levels: lifetimeseed production, annual seed production and fruit seed pro-duction. First, we performed simple linear regressions betweeneach measure of seed production (response variables) and eachstress tolerance trait (predictors), with log-transformed vari-ables except for fruit seed production. Then we tested again therelationship between each seed production trait and each stress
(a) (b)
(c) (d)
(e) (f)Fig. 3. Population averages ( ± SE in b, d and f) of seed
traits in sampled populations of Plantago coronopus: (a)
seed ratio; (b) basal seed mass (black) and apical seed
mass (white); (c) mucilage ratio, (d) lifetime seed produc-
tion (black), annual seed production (grey) and fruit seed
production (white); (e) lifetime seed mass (black), annual
seed mass (grey) and fruit seed mass (white); and (f)
plant size. Populations are ranked from left to right by
increasing latitude. Note logarithmic scale and a break in
vertical axis in (d) and (e). For five populations (MT, CS,
CT, EA and ES) some variables were not calculated.
Plant Biology © 2012 German Botanical Society and The Royal Botanical Society of the Netherlands 5
Villellas & Garcıa A tolerance–fecundity trade-off at the intraspecific level

tolerance trait with multiple regressions, including plant size asa covariate to control for its possible effects, and examining sig-nificance of the partial regression parameters of stress tolerancetraits. Finally, to check for the assumption of constant availableresources for seeds in the tolerance–fecundity trade-off, we per-formed Pearson’s correlation analyses between lifetime, annualand fruit seed mass on the one hand, and seed productiontraits and stress tolerance traits on the other hand (cor proce-dure, package stats in R).The tolerance–fecundity trade-off was tested for each fecun-
dity level using three stress tolerance traits, which may increasethe probability of type I error. For all the analyses, we thus per-formed at each fecundity level corrections on P-values with thefalse discovery rate method (Benjamini & Hochberg 1995),appropriate for analyses with small sample sizes.
RESULTS
Seed trait variability
Seed traits exhibited large differences in among-populationvariability (Table 2): lifetime and annual seed mass, lifetimeand annual seed production, and seed ratio showed the highestvariability, whereas fruit seed mass was the least variable trait.Apical seed mass was less variable across the study area thanbasal seed mass. Both measures of variability among popula-tions (CV and CVln) showed the same pattern across traits.
Effects of environmental factors and plant size
There were notable differences among populations in tempera-ture, summer precipitation and soil fertility along the latitudi-nal gradient (Table 1). There was a gradual increase intemperature from north to south, and northern populationsgenerally had higher precipitation, with a few exceptions inboth climate parameters. Southern populations in Spain andFrance had lower soil fertility than most northern populations.Stress tolerance traits were significantly correlated to envi-
ronmental predictors, although in different ways (Table 3).The separate effect of summer precipitation was more signifi-cant than that of temperature or soil fertility on seed ratio andmucilage ratio, whereas temperature showed the highest sepa-rate effect on basal seed mass. In the case of seed ratio, thecombination of summer precipitation and temperature had thelowest AIC value, but the ANOVA indicated that it did not
explain differences among populations significantly better thansummer precipitation alone. For basal seed mass, temperatureand soil fertility together had the lowest AIC value, and pro-vided a better fit to the data than temperature alone, althoughwith marginal significance. In the case of the mucilage ratio,the combination of the three predictors had the lowest AICvalue, but it did not improve a model with summer precipita-tion and soil fertility. However, the combination of summerprecipitation and soil fertility explained differences in mucilageratio better than summer precipitation alone, although withmarginal significance. Summer precipitation negatively affectedseed ratio and mucilage ratio, but had no effect on basal seedmass. Temperature positively affected all stress tolerance traits,and the effect of soil fertility was always negative.
Plant size was significantly and positively correlated withlifetime seed production (F1,2618 = 858.4, P < 0.001), annualseed production (F1,5286 = 2317.3, P < 0.001), seed ratio(F1,9 = 7.6, R2 = 0.46, P = 0.022) and mucilage ratio(F1,9 = 14.9, R2 = 0.62, P = 0.004), and significantly and nega-tively correlated with fruit seed production (F1,9 = 6.6,R2 = 0.42, P = 0.030). In contrast, plant size had no significanteffect on lifetime seed mass (F1,7 = 2.7, R2 = 0.28, P = 0.144),annual seed mass (F1,9 = 2.3, R2 = 0.21, P = 0.162), fruit seedmass (F1,9 = 2.0, R2 = 0.18, P = 0.188), basal seed mass(F1,9 = 0.5, R2 = 0.05, P = 0.514) and apical seed mass(F1,9 = 0.1, R2 = 0.02, P = 0.713). In some of these regressions,however, Cook’s distance for population TB was larger than4/n (where n is number of observations in the regression),which might be problematic (Bollen & Jackman 1990). TBshowed, compared to other populations, high or intermediatelevels of seed production and total seed mass per individual,despite having small plant sizes (Fig. 3). We thus repeatedanalyses of the effects of plant size without data from TB: thesignificance of correlations were not affected, except betweenplant size and annual seed mass, which became significant andpositive (F1,8 = 7.5, R2 = 0.48, P = 0.025). The correlationbetween plant size and lifetime seed mass was also higher with-out TB, but not significant (F1,6 = 3.2, R2 = 0.35, P = 0.122).
Tolerance–fecundity trade-off
Southern populations showed, in general, higher seed ratios,higher basal seed mass and higher mucilage ratio than northernpopulations, whereas apical seed mass presented low variationalong the latitudinal gradient (Fig. 3a–c). Southern populations
stress tolerance
traits predictors
effects of environmental gradient
model
comparison
F R2 P AIC F P
seed ratio Ps 76.51,9 0.89 <0.001 �19.3 – –
Ps and Te 45.92,8 0.92 <0.001 �20.2 2.51,8 0.152
Ps and Te and SOM 27.63,7 0.92 <0.001 �18.6 0.21,7 0.664
basal seed mass Te 12.01,9 0.57 0.007 �18.0 – –
Te and SOM 9.82,8 0.71 0.007 �20.3 3.81,8 0.086
Te and SOM and PS 5.93,7 0.72 0.024 �18.6 0.21,7 0.674
mucilage ratio Ps 10.21,9 0.53 0.011 �24.0 – –
Ps and SOM 9.82,8 0.71 0.007 �27.4 5.01,8 0.056
PS and SOM and Te 7.53,7 0.76 0.013 �27.5 1.51,7 0.255
Table 3. Results from regression analyses between
environmental predictors (PS: summer precipitation; Te :
mean annual temperature; SOM : soil organic matter)and stress tolerance traits in Plantago coronopus. AICvalues correspond to Akaike information criterion (only
the three combinations of predictors with the lowest
AIC values are shown). Model comparisons, performed
with ANOVA, show whether the sequential addition of
predictors significantly improves the previous simpler
model. The combination of predictors that constituted
the best model for each stress tolerance trait is high-
lighted in bold. F statistics are subindexed with corre-
sponding degrees of freedom.
Plant Biology © 2012 German Botanical Society and The Royal Botanical Society of the Netherlands6
A tolerance–fecundity trade-off at the intraspecific level Villellas & Garcıa

generally had lower fruit seed production than northern popu-lations, but higher lifetime and annual seed production(Fig. 3d).
Simple regression analyses showed that lifetime seed produc-tion was positively and significantly correlated with seed ratio,and marginally significantly correlated with basal seed massand mucilage ratio, whereas in multiple regression analysesincluding plant size as a covariate, the partial correlations werenot significant for any stress tolerance trait (Fig. 4a–c,Table 4). Annual seed production was positively correlatedwith seed ratio, with marginal significance, and not signifi-cantly correlated with basal seed mass and mucilage ratio, whilenone of their partial correlations were significant in regressionanalyses including plant size (Fig. 4d–f, Table 4). Fruit seedproduction was significantly and negatively correlated withseed ratio, basal seed mass and mucilage ratio (Fig. 4g–i,Table 4); when accounting for plant size, the partial correlationwas still significant and negative for basal seed mass, and mar-ginally significant for seed ratio and mucilage ratio.
Lifetime seed mass was significantly correlated with lifetimeseed production (t7 = 9.1, r = 0.96, P < 0.001), seed ratio(t7 = 4.4, r = 0.86, P = 0.009) and basal seed mass (t7 = 3.4,
r = 0.79, P = 0.018), and correlation with mucilage ratio wasmarginally significant (t7 = 2.3, r = 0.65, P = 0.056). Annualseed mass was significantly correlated with annual seed produc-tion (t9 = 13.5, r = 0.98, P < 0.001), seed ratio (t9 = 3.0,r = 0.71, P = 0.023) and basal seed mass (t9 = 3.2, r = 0.73,P = 0.023), although it showed no correlation with mucilageratio (t9 = 1.4, r = 0.44, P = 0.181). Fruit seed mass showedno significant correlation with fruit seed production(t10 = �0.3, r = �0.09, P = 0.783), seed ratio (t10 = 0.1,r = 0.01, P = 0.977) or mucilage ratio (t10 = �0.4, r = �0.12,P = 0.977), and showed a marginally significant correlationwith basal seed mass (t10 = 2.6, r = 0.64, P = 0.076). Lifetimeand annual seed mass decreased northwards, whereas fruit seedmass showed no clear latitudinal pattern (Fig. 3e).
DISCUSSION
Plantago coronopus presents considerable variation along theAtlantic coast in Europe and North Africa in a set of seed traits,i.e. the number and size of seeds, the proportion of basal andapical seeds and the production of mucilage. Similar levels ofvariability have been found among populations of other
(a) (b) (c)
(d) (e) (f)
(g) (h) (i)
Fig. 4. a–i: Relationship between lifetime, annual and fruit seed production, on the one hand, and stress tolerance traits (seed ratio, basal seed mass and
mucilage ratio), on the other, in Plantago coronopus. Continuous lines represent linear regressions between seed production traits and stress tolerance traits
(left vertical axis), dashed lines represent partial regressions between seed production traits and stress tolerance traits after controlling for plant size (right verti-
cal axis). All variables were log-transformed except for fruit seed production. Note small differences in scale among seed production traits and among stress tol-
erance traits. R2 coefficients are accompanied by statistical significance: �P < 0.1,*P < 0.05,**P < 0.01,***P < 0.001; P-values were corrected by the false
discovery rate method.
Plant Biology © 2012 German Botanical Society and The Royal Botanical Society of the Netherlands 7
Villellas & Garcıa A tolerance–fecundity trade-off at the intraspecific level

widespread plants in some seed traits. For example, the CV forseed size similarly lies around 0.20–0.30 in the short-livedCampanula americana (calculated from Kalisz & Wardle 1994)and the long-lived Vaccinium stamineum (Yakimowski & Eck-ert 2007), and the CV for annual reproductive output (numberof seeds or fruits per plant per year) in those species is alsomore than 0.70. In this study, we tested whether the observedintraspecific variability was explained by a recent hypothesisproposed at the community level: the trade-off between stresstolerance and fecundity in heterogeneous environments (Mul-ler-Landau 2010). Our results suggest indeed that a tolerance–fecundity trade-off at the fruit level underpins, to a certainextent, variation in seed traits among populations of P. coron-opus. However, seed production shows the opposite pattern atthe individual and fruit level, which appears to be an additionalstrategy of the species to adapt to the stress gradient, asexplained below.Stress tolerance traits were strongly correlated with climatic
and soil conditions in P. coronopus. Basal seed mass was, on theone hand, enhanced by temperature, which may have increasedenergy requirements of metabolic processes (Murray et al.2004), and on the other hand, negatively affected by soilorganic matter, which is associated with fertility (Reeves 1997).Furthermore, both temperature and soil organic matter mayhave also indirectly affected basal seed mass through theireffects on water availability (Cobertera 1993). Mucilage ratiowas in turn negatively affected by summer precipitation andsoil organic matter, both associated with moisture, suggesting arole of mucilage in reducing water deficit. Finally, seed ratio,which represents the relation between basal and apical seeds,and thus incorporates both the variation in seed mass and inmucilage, was negatively affected by summer precipitation.Overall, the environmental parameters analysed in this studyrepresent some form of environmental stress (water and nutri-ent availability, energy requirements), and significantly con-tribute to explain among-population differences in one ormore stress tolerance traits. Our results agree with previousstudies that found tolerance-related seed traits, most com-monly seed size, associated with higher temperatures (Baker1972; Murray et al. 2004), lower precipitation or water avail-ability in general (Baker 1972; Wright & Westoby 1999), andlower soil fertility (Lee & Fenner 1989; Parolin 2000). There is
also abundant literature that relates seed size with seedlingcompetitive ability (e.g., Tilman 1994; Geritz et al. 1999), butthis factor seems not to explain seed trait variation in P. coron-opus, because the populations exposed to highest competition(in northern coastal meadows) had the smallest seeds.
The tolerance–fecundity model (Muller-Landau 2010)states that heterogeneous areas in terms of environmentalstress provide different regeneration niches, allowing themaintenance of species with different seed sizes within com-munities, and assumes that seed size is related to stress tol-erance. We believe that a similar mechanism underliesvariability in seed traits at the fruit level among populationsof P. coronopus, considering the large differences in climateand soil conditions among locations and the correspondingvariation in seed traits. Let us consider the stress gradientthat broadly coincides with the latitudinal gradient of thespecies, and along which fecundity (at the fruit level) andstress tolerance traits co-vary (Fig. 5). In this gradient,southern populations are subject to higher environmental
Table 4. Tolerance-fecundity trade-off: regression analyses between fecundity traits (lifetime, annual and fruit seed production) and stress tolerance traits. In
multiple regression analyses, plant size is included as a covariate and partial regression estimates (b) are shown. F statistics are subindexed with corresponding
degrees of freedom, and P-values are corrected by the false discovery rate method.
fecundity traits stress tolerance traits
simple regression
multiple regression
stress tolerance trait plant size
F R2 P b t P b t P
lifetime Seed ratio 16.61,7 0.70 0.014 0.90 2.7 0.104 0.08 0.2 0.865
Basal seed mass 3.61,7 0.34 0.099 0.97 1.7 0.210 0.72 1.7 0.423
Mucilage ratio 4.21,7 0.38 0.099 1.18 0.7 0.486 0.37 0.4 0.865
annual Seed ratio 6.41,9 0.42 0.096 1.00 1.7 0.197 0.09 0.1 0.910
Basal seed mass 4.11,9 0.31 0.109 1.49 1.8 0.197 0.78 1.3 0.537
Mucilage ratio 1.21,9 0.12 0.298 �0.21 �0.1 0.927 1.1 1.0 0.537
fruit Seed ratio 15.91,11 0.59 0.002 �1.97 �2.1 0.066 �1.00 �0.8 0.675
Basal seed mass 20.41,10 0.67 0.002 �4.10 �5.0 0.003 �2.16 �3.7 0.018
Mucilage ratio 24.71,10 0.71 0.002 �6.76 �2.5 0.059 �0.05 �0.4 0.971
Fig. 5. Model showing a trade-off between fecundity (at the fruit level) and
stress tolerance among populations of Plantago coronopus under a gradient
of environmental stress. Diagram on the right represents differences in seed
traits between the hypothetical extremes of the gradient (northern and
southern populations). Basal seeds are surrounded with a mucilaginous coat
(grey outline), which is absent in the smaller apical seeds. Note differences
between fruits in size and mucilage production of basal seeds, and in the
number of each seed morph.
Plant Biology © 2012 German Botanical Society and The Royal Botanical Society of the Netherlands8
A tolerance–fecundity trade-off at the intraspecific level Villellas & Garcıa

stress (higher temperatures, lower summer precipitation,lower soil fertility) than northern populations, which limitstheir access to two essential resources for seed and seedlingperformance, i.e. water and nutrients. In response to theseconditions, plants produce basal seeds with more internalresources to tolerate environmental stress (Chapin et al.1993; Westoby et al. 2002; Coomes & Grubb 2003), andhigher amounts of mucilage to facilitate water absorption(Harper & Benton 1986; Schat 1981; Gutterman & Shem-Tov 1997). For identical reasons, southern plants alsoincrease the seed ratio, towards more basal relative to apicalseeds. Since total resources allocated to seeds by fruits areconstant across populations, the final outcome is a reduc-tion in the total number of seeds per fruit, in consonancewith the classical trade-off between seed size and seed num-ber (Smith & Fretwell 1974; Lloyd 1988). Conversely, north-ern populations occur in less stressful conditions, andplants can thus reduce investment in seed size and muci-lage, allowing an increase in fruit seed production (Fig. 5).A decline in seed size with latitude seems to be a commonpattern within widespread plant taxa (Moles & Westoby2003). In this model, P. coronopus adjusts the coexistence ofbasal and apical seeds along the stress gradient, resulting ina higher predominance of the more tolerant seed morph inpopulations under higher stress. This is equivalent to howbig-seeded species would predominate over small-seededspecies in stressful sites within communities. Overall, ourresults strongly suggest that the mechanism proposed byMuller-Landau (2010) for the maintenance of variation inseed size among species helps to explain the variability inseed traits among populations of P. coronopus.
The tolerance–fecundity trade-off operates in P. coronopusat the fruit level but not at the individual level, as indicated bythe lack of negative correlations between lifetime and annualseed production and stress tolerance traits. Mendez (1997)also found in Arum maculatum a negative correlation betweenseed size and number only at the fruit level, whereas Devlin(1989) and Mehlman (1993) reported a trade-off at both lev-els in two perennial plants, which confirms the importance ofconsidering different levels when analysing species seed pro-duction (Primack 1987; Herrera 1991). In P. coronopus,despite higher stress tolerance of seeds in southern popula-tions, recruitment is still lower in these locations than innorthern populations (Villellas et al. 2012), highlighting thestressful conditions for germination and/or early survival ofplants in sand dunes. Thus, the higher seed production at theindividual level in southern populations would constitute anadditional strategy to compensate for a failure in recruitment(Villellas et al. 2012; see other compensatory changes in vitalrates in Doak & Morris 2010), and would explain the oppositepattern between fruit seed production and lifetime andannual seed production. Such an increase in seed productionper plant would be achieved through a larger number of fruitsrather than a larger number of seeds per fruit. The productionof many fruits with few seeds per fruit in the rather unpredict-able environments of southern locations, moreover, can beseen as a way of bet-hedging, spreading the risk of failure inrecruitment in space or time (Cohen 1966). In contrast withsouthern populations, the higher recruitment in northernpopulations, located in more humid and stable habitats,makes it unnecessary to put extra investment into total seed
production, other than increasing seed number at the fruitlevel.The compensatory increase in seed production per plant
in southern populations, made possible by higher resourceavailability for reproduction per individual, seems in partachieved through larger plant sizes, as shown by the positivecorrelations between plant size, annual seed mass andannual seed production (see also Braza et al. 2010; Villellaset al. 2012). Such an increase in total seed productionthrough larger plant sizes seems to be a common phenome-non for large-seeded relative to small-seeded species (Moleset al. 2004; Aarssen 2005). However, the process is less clearin P. coronopus over the lifespan of the plants, as plant sizewas correlated with lifetime seed production but not signifi-cantly with lifetime seed mass. Since there are no differ-ences between individuals of southern and northernpopulations in the number of reproductive years (Villellaset al. 2012), such a lack of clear patterns over the lifespanmight reflect our inability to detect the effects due to a lowsample size (there is actually a tendency for a correlation),or to additional unknown factors. Nevertheless, the absenceof trade-offs in resource allocation at the individual levelresponds to a latitudinal co-variation of annual and lifetimeseed mass with some stress tolerance traits and seed pro-duction traits, in contrast to the relative constancy of fruitseed mass across the species range.Population TB seems to be an outlier in the relationship
between plant size and seed production traits, having smallerplants than expected and/or higher seed production and totalseed mass at the individual level. The smaller plant sizes inTB are likely due to local periodic flooding with seawater(J. Villellas, personal observation), as submergence is expectedto reduce plant growth (Schat 1984; Mommer & Visser 2005).The relatively high reproductive allocation per individual ismore difficult to interpret, although Waite & Hutchings(1982) obtained similar results in coastal populations of thesame taxon in England at different levels of exposure to sea-water flooding. It could be that the resources not used forplant growth during such floods were allocated to reproduc-tion in the longer periods of emergence.To conclude, the large variation in seed traits and seed
production among populations of the widespread P. coron-opus seems to be explained by a combination of differentprocesses, depending on the level of study. At the fruitlevel, the trade-off between seed production and stress tol-erance seems to play a central role in maintaining variabil-ity among populations in traits such as seed size, mucilageproduction and the relative abundance of seed morphs.The tolerance–fecundity model may indeed help to under-stand why the production of different seed morphs withcontrasting tolerance attributes, common in plants ofstressful and unpredictable environments (Venable 1985;Imbert 2002), might vary among populations. For exam-ple, Ungar (1987) reported for the widespread dimorphicAtriplex triangularis a higher proportion of the tolerantseed morph, accompanied by a reduction in seed produc-tion per plant in populations subject to the highest salinitystress, and Yao et al. (2010) proposed a similar model forChenopodium album. From a broader perspective, the tol-erance–fecundity hypothesis might constitute a more gen-eral framework than the classical compromise between
Plant Biology © 2012 German Botanical Society and The Royal Botanical Society of the Netherlands 9
Villellas & Garcıa A tolerance–fecundity trade-off at the intraspecific level

seed size and number, at least for species occurring alonggradients in environmental stress. Rather than focusingonly on seed size, we would expect any additional invest-ment in seed tolerance in response to stress, such as muci-lage, to trade-off against fecundity, thus promotingvariability among populations. However, despite the gener-ality of model, the results found for P. coronopus at theindividual level indicate that additional factors, such asplant size or total resource availability, should be consid-ered when analysing seed traits and reproductive allocationunder stress gradients. Comprehensive studies that includethe relevant stress tolerance traits and consider differentfecundity levels will allow us to understand the diversestrategies of widespread plants to maximise fitness in eachset of local conditions.
ACKNOWLEDGEMENTS
This study was funded by the Spanish Ministry of Science andInnovation through two National Projects (CGL2006-08507;CGL2010-21642) to M.B.G. and a scholarship (FPU) to J.V.We would like to thank R. Ajbilou, J. Ehrlen and J. M. Olesenfor climate data, R. Braza and F. Ojeda for seed material fromFrance and Morocco, M. Maestro for soil analyses, M. Pazosfor valuable help in statistical analyses and S. Vicente for guid-ance in calculating evapotranspiration. We are also indebted toA. Adsuar, M. L. Dehesa, C. Perez and A. Taboada for helpwith seed measurements. Two anonymous reviewers improvedan earlier version of the manuscript.
REFERENCES
Aarssen L.W. (2005) Why don’t bigger plants have pro-
portionately bigger seeds?. Oikos, 111, 199–207.
Aarssen L.W., Jordan C.Y. (2001) Between-species
patterns of covariation in plant size, seed size
and fecundity in monocarpic herbs. Ecoscience, 8,
471–477.
Albert C.H., Thuiller W., Yoccoz N.G., Soudant A.,
Boucher F., Saccone P., Lavorel S. (2010) Intraspe-
cific functional variability: extent, structure and
sources of variation. Journal of Ecology, 98, 604–613.
Allen R.G., Pereira L.S., Raes D., Smith M. (1998) Crop
evapotranspiration: guidelines for computer crop
requirements, irrigation and drainage paper 56. FAO,
Rome, Italy.
Baker H.G. (1972) Seed weight in relation to environ-
mental conditions in California. Ecology, 53,
997–1010.
Benjamini Y., Hochberg Y. (1995) Controlling the false
discovery rate: a practical and powerful approach to
multiple testing. Journal of the Royal Statistical Soci-
ety B, 57, 289–300.
Bollen K.A., Jackman R.W.(1990) Regression diagnos-
tics: an expository treatment of outliers and influen-
tial cases. In: Fox J., Long J.S. (Eds), Modern methods
of data analysis. Sage, Newbury Park, CA, USA, pp
257–291.
Braza R., Garcıa M.B. (2011) Spreading recruitment
over time to cope with environmental variability.
Plant Ecology, 212, 283–292.
Braza R., Arroyo J., Garcıa M.B. (2010) Natural varia-
tion of fecundity components in a widespread plant
with dimorphic seeds. Acta Oecologica-International
Journal of Ecology, 36, 471–476.
Buckley Y.M., Downey P., Fowler S.V., Hill R., Mem-
mot J., Norambuena H., Pitcairn M., Shaw R.,
Sheppard A.W., Winks C., Wittenberg R., Rees M.
(2003) Are invasives bigger? A global study of seed
size variation in two invasive shrubs. Ecology, 84,
1434–1440.
Chapin F.S. III, Autumn K., Pugnaire F. (1993) Evolu-
tion of suites of traits in response to environmental
stress. American Naturalist, 142, S78–S92.
Chater A.O., Cartier D. (1976) Plantago L. In: Tutin T.
G., Heywood V.H., Burgess N.A., Moore D.H., Val-
entine D.M., Walters S.M., Webb D.A. (Eds), Flora
Europaea. Cambridge University Press, Cambridge,
UK, pp 38–44.
Cobertera E. (1993) Edafologıa aplicada. Ediciones
Catedra, Madrid, Spain.
Cohen D. (1966) Optimizing reproduction in a ran-
domly varying environment. Journal of Theoretical
Biology, 12, 119–129.
Coomes D.A., Grubb P.J. (2003) Colonization, toler-
ance, competition and seed-size variation within
functional groups. Trends in Ecology and Evolution,
18, 283–291.
Devlin B. (1989) Components of seed and pollen yield
of Lobelia cardinalis: variation and correlations.
American Journal of Botany, 76, 204–214.
Doak D.F., Morris W.F. (2010) Demographic compen-
sation and tipping points in climate-induced range
shifts. Nature, 467, 959–962.
Dowling R.E. (1933) The reproduction of Plantago cor-
onopus: an example of morphological and biological
seed dimorphism. Annals of Botany, 47, 861–872.
Geritz S.A.H., van der Meijden E., Metz J.A.J. (1999)
Evolutionary dynamics of seed size and seedling
competitive ability. Theoretical Population Biology,
55, 324–343.
Grime J.P. (1977) Evidence for the existence of three
primary strategies in plants and its relevance to eco-
logical and evolutionary theory. American Naturalist,
111, 1169–1194.
Gutterman Y., Shem-Tov S. (1997) Mucilaginous seed
coat structure of Carrichtera annua and Anastatica
hierochuntica from the Negev Desert highlands of
Israel, and its adhesion to the soil crust. Journal of
Arid Environments, 35, 695–705.
Hargreaves G.L. (1985) Defining and using reference
evapotranspiration. Journal of Irrigation and Drain-
age Engineering-ASCE, 120, 1132–1139.
Harper J.L., Benton R.A. (1966) Behaviour of seeds
in soil II The germination of seeds on the surface of
a water supplying substrate. Journal of Ecology, 54,
151–166.
Hasegawa K., Mizutani J., Kosemura S., Yamamura S.
(1992) Isolation and identification of lepidimoide, a
new allelopathic substance from mucilage of
germinated cress seeds. Plant Physiology, 100, 1059–
1061.
Heanes D.L. (1984) Determination of total organic-C
in soils by an improved chromic acid digestion and
spectrophotometric procedure. Communications in
Soil Science and Plant Analysis, 15, 1191–1213.
Herrera C.M. (1991) Dissecting factors responsible for
individual variation in plant fecundity. Ecology, 72,
1436–1448.
Hulten E., Fries M.(1986) Atlas of North European vas-
cular plants. North of the Tropic of Cancer. Maps 1–
996. Koeltz Scientific Books, Konigstein, Germany.
Imbert E. (2002) Ecological consequences and ontog-
eny of seed heteromorphism. Perspectives in Plant
Ecology, Evolution and Systematics, 5, 13–36.
Joshi J., Schmid B., Caldeira M.C., Dimitrakopoulos
P.G., Good J., Harris R., Hector A., Huss-Danell
K., Jumpponen A., Minns A., Mulder C.P.H.,
Pereira J.S., Prinz A., Scherer-Lorenzen M., Sia-
mantziouras A.-S.D., Terry A.C., Troumbis A.Y.,
Lawton J.H. (2001) Local adaptation enhances per-
formance of common plant species. Ecology Letters,
4, 536–544.
Kalisz S., Wardle G.M. (1994) Life-history variation in
Campanula americana (Campanulaceae): population
differentiation. American Journal of Botany, 81,
521–527.
Kleinbaum D.G., Kupper L.L., Muller K.E. (1988)
Applied regression analysis and other multivariables
methods. PWS Publishing Company, Boston, MA,
USA.
Koelewijn H.P., Van Damme J.M.M. (2005) Effects of
seed size, inbreeding and maternal sex on offspring
fitness in gynodioecious Plantago coronopus. Journal
of Ecology, 93, 373–383.
Koopmans L.H., Owen D.B., Rosenblatt J.I. (1964)
Confidence intervals for the coefficient of variation
for the normal and log normal distributions. Biomet-
rika, 51, 25–32.
Landau H.C. (2010) The tolerance–fecundity trade-off
and the maintenance of diversity in seed size. Pro-
ceedings of the National Academy of Sciences USA,
107, 4242–4247.
Lee W.G., Fenner M. (1989) Mineral nutrient alloca-
tion in seeds and shoots of twelve Chionochloa spe-
cies in relation to soil fertility. Journal of Ecology, 77,
704–716.
Lloyd D.G. (1987) Selection of offspring size at inde-
pendence and other size-versus-number strategies.
American Naturalist, 129, 800–817.
Lloyd D.G. (1988) A general principle for the alloca-
tion of limited resources. Evolutionary Ecology, 2,
175–187.
Lord J., Egan J., Clifford T., Jurado E., Leishman M.,
Williams D., Westoby M. (1997) Larger seeds in
tropical floras: consistent patterns independent of
growth form and dispersal mode. Journal of Biogeog-
raphy, 24, 205–211.
Lu J., Tan D., Baskin J.M., Baskin C.C. (2010) Fruit
and seed heteromorphism in the cold desert annual
ephemeral Diptychocarpus strictus (Brassicaceae) and
possible adaptive significance. Annals of Botany, 105,
999–1014.
Plant Biology © 2012 German Botanical Society and The Royal Botanical Society of the Netherlands10
A tolerance–fecundity trade-off at the intraspecific level Villellas & Garcıa

McKee J., Richards A.J. (1996) Variation in seed pro-
duction and germinability in common reed (Phrag-
mites australis) in Britain and France with respect to
climate. New Phytologist, 133, 233–243.
McWilliams E.L., Landers R.Q., Mahlsted J.P.
(1968) Variation in seed weight and germination
in populations of Amaranthus retroflexus L. Ecology,
49, 290.
Mehlman D.W. (1993) Seed size and seed packaging
variation in Baptisia lanceolata (Fabaceae). American
Journal of Botany, 80, 735–742.
Mendez M. (1997) Sources of variation in seed mass in
Arum italicum. International Journal of Plant Sci-
ences, 158, 298–305.
Moles A.T., Westoby M. (2003) Latitude, seed
predation and seed mass. Journal of Biogeography,
30, 105–128.
Moles A.T., Falster D.S., Leishman M.R., Westoby M.
(2004) Small-seeded species produce more seeds per
square metre of canopy per year, but not per
individual per lifetime. Journal of Ecology, 92, 384–
396.
Mommer L., Visser E.J.W. (2005) Underwater photo-
synthesis in flooded terrestrial plants: a matter of leaf
plasticity. Annals of Botany, 96, 581–589.
Murray B.R., Brown A.H.D., Dickman C.R., Crowther
M.S. (2004) Geographical gradients in seed mass
in relation to climate. Journal of Biogeography, 31,
379–388.
Nevo E. (2001) Evolution of genome–phenome diver-
sity under environmental stress. Proceedings of the
National Academy of Sciences USA, 98, 6233–6240.
Parolin P. (2000) Seed mass in Amazonian floodplain
forests with contrasting nutrient supplies. Journal of
Tropical Ecology, 16, 417–428.
Parsons P.A. (1991) Evolutionary rates: stress and
species boundaries. Annual Review of Ecology and
Systematics, 22, 1–18.
Primack R.B. (1987) Relationships among flowers,
fruits and seeds. Annual Review of Ecology and Sys-
tematics, 18, 409–430.
R Development Core Team (2011) R: a language and
environment for statistical computing. R Foundation
for Statistical Computing, Vienna, Austria.
Reeves D.W. (1997) The role of soil organic matter in
maintaining soil quality in continuous cropping sys-
tems. Soil & Tillage Research, 43, 131–167.
Richards C.L., Pennings S.C., Donovan L.A. (2005)
Habitat range and phenotypic variation in salt marsh
plants. Plant Ecology, 176, 263–273.
Schat H. (1981) Seed polymorphism and germination
ecology of Plantago coronopus L. Acta Oecologica-
Oecologia Plantarum, 2, 367–380.
Schat H. (1984) A comparative ecophysiological study
on the effects of waterlogging and submergence on
dune slack plants: growth, survival and mineral
nutrition in sand culture experiments. Oecologia, 62,
279–286.
Smith C.C., Fretwell S.D. (1974) The optimal balance
between size and number of offspring. American
Naturalist, 108, 499–506.
Thornthwaite C.W. (1948) An approach toward a
rational classification of climate. Geographical
Review, 38, 55–94.
Tilman D. (1994) Competition and biodiversity in spa-
tially structured habitats. Ecology, 75, 2–16.
Ungar I.A. (1987) Population ecology of halophyte
seeds. Botanical Review, 53, 301–334.
Van Noordwijk A.J., De Jong G. (1986) Acquisition
and allocation of resources: their influence on varia-
tion in life history tactics. American Naturalist, 128,
137–142.
Venable D.L. (1985) The evolutionary ecology of seed
heteromorphism. American Naturalist, 126, 577–595.
Villellas J., Ehrlen J., Olesen J.M., Braza R., Garcıa M.B.
(2012) Plant performance in central and northern
peripheral populations of the widespread Plantago
coronopus. Ecography, doi: 10.1111/j.1600-0587.2012.
07425.x.
Waite S., Hutchings M.J. (1982) Plastic energy allocation
patterns in Plantago coronopus. Oikos, 38, 333–342.
Westoby M., Jurado E., Leishman M. (1992) Compara-
tive evolutionary ecology of seed size. Trends in Ecol-
ogy and Evolution, 7, 368–372.
Westoby M., Falster D.S., Moles A.T., Vesk P.A.,
Wright I.J. (2002) Plant ecological strategies:
some leading dimensions of variation between spe-
cies. Annual Review of Ecology and Systematics, 33,
125–159.
Wolff K., Friso B., Vandamme J.M.M. (1988) Out-
crossing rates and male-sterility in natural popula-
tions of Plantago coronopus. Theoretical and Applied
Genetics, 76, 190–196.
Woodward F.I., Williams B.G. (1987) Climate and
plant distribution at global and local scales. Vegeta-
tio, 69, 189–197.
Wright I.J., Westoby M. (1999) Differences in seedling
growth behaviour among species: trait correlations
across species, and trait shifts along nutrient
compared to rainfall gradients. Journal of Ecology,
87, 85–97.
Wright J.W., Davies K.F., Lau J.A., McCall A.C.,
McKay J.K. (2006) Experimental verification of eco-
logical niche modeling in a heterogeneous environ-
ment. Ecology, 87, 2433–2439.
Yakimowski S.B., Eckert C.G. (2007) Threatened
peripheral populations in context: geographical vari-
ation in population frequency and size and sexual
reproduction in a clonal woody shrub. Conservation
Biology, 21, 811–822.
Yao S., Lan H., Zhang F. (2010) Variation of seed het-
eromorphism in Chenopodium album and the effect
of salinity stress on the descendants. Annals of Bot-
any, 105, 1015–1025.
Plant Biology © 2012 German Botanical Society and The Royal Botanical Society of the Netherlands 11
Villellas & Garcıa A tolerance–fecundity trade-off at the intraspecific level


Chapter 4
73
Chapter 4
Environmental, genetic and geographical correlates of phenotypic variation
within populations of a common herb in Europe
Jesús Villellas1, Regina Berjano2, Anass Terrab2 and María B. García1
1Instituto Pirenaico de Ecología (IPE-CSIC), Avda. Montañana 1005, Apdo. 13034, 50080 Zaragoza (Spain).
Fax: 0034976716019. 2Departamento de Biología Vegetal y Ecología, Facultad de Biología, Universidad de
Sevilla, Apdo. 1095, 41080 Sevilla (Spain)
Ecosphere (in review)


Chapter 4
75
Environmental, genetic and geographical correlates of phenotypic variation
within populations of a common herb in Europe
Jesús Villellas1, Regina Berjano2, Anass Terrab2 and María B. García1
1Instituto Pirenaico de Ecología (IPE-CSIC), Avda. Montañana 1005, Apdo. 13034, 50080 Zaragoza (Spain). Fax: 0034976716019. 2Departamento de Biología Vegetal y Ecología, Facultad de Biología, Universidad de Sevilla, Apdo. 1095, 41080 Sevilla (Spain).
Analyzing the patterns and causes of phenotypic and genetic variation within populations might help to understand life-history variability in plants, and to predict their responses to changing environmental conditions. Here we compare phenotypic variation and genetic diversity of the widespread herb Plantago coronopus across Europe, and evaluate their relationship with environmental and geographical factors. Genetic diversity was estimated in 18 populations from molecular markers with AFLP, and phenotypic variation was measured in a subset of 11 populations on six ecologically relevant traits (plant size, plant growth, fecundity, seed mass, mucilage production and ratio between two seed morphs). We also estimated variability in local environmental factors such as temperature, precipitation and intraspecific competition, and accounted for the central vs. peripheral position of populations. Phenotypic variation and genetic diversity and were not significantly correlated within populations throughout the species’ range. Phenotypic variation was positively linked to precipitation variability, whereas genetic diversity was correlated with the position of populations, which suggests that both types of variation are shaped by different processes. Precipitation regime seems to have acted as a selective agent for variation within populations in most life-history traits, whereas the species’ demographic history has probably reduced genetic diversity in northern peripheral populations with respect to central ones. The positive association found between precipitation variability and phenotypic variation also suggests that plant populations may have a higher adaptive potential in variable rather than stable environments. Our study offers an additional criterion when predicting the future distribution of species under environmental changes.
Key words: Adaptive variation, environmental fluctuations, Europe, evolutionary potential, genetic diversity, latitudinal gradient, marginal populations, phenotype, Plantago coronopus, precipitation, widespread short-lived perennial.
Introduction
The variation in life-history traits shown by plant populations constitute the basis for the evolutionary potential of species (Bradshaw 1991, Bradshaw and McNeilly 1991), and might have a critical role in the face of changing environmental conditions (Reed and Frankham 2001, Dawson et al. 2011). Numerous studies have reported indeed important effects of climate change on the ecology of plant and
animal taxa (e.g., Walther et al. 2005, Parmesan 2006), and the existence of a pool of individuals potentially pre-adapted to different environmental scenarios may be important in the near future (Volis et al. 1998, Jump and Peñuelas 2005). Thus, analyzing intraspecific variation in life-history traits and its underlying causes will help to understand the adaptation mechanisms of plants to their current environment, and predict with more precision their future performance in new ecological scenarios.

Publications
76
Intuitively, phenotypic variation should show a correlation with genetic variation. However, genetic diversity based on molecular markers, which has been indeed used to assess the status and evolutionary potential of populations (e.g., Frankham 1995, Haig 1998), has shown no consistent relationship with phenotypic variability (Butlin and Tregenza 1998, Reed and Frankham 2001). In fact, both metrics seem to be affected by different processes. Genetic diversity is usually inferred from neutral loci (Lynch et al. 1999, Holderegger et al. 2006). Thus, it will be mainly affected by the demographic history of species, through processes such as gene flow, genetic drift and founder events (Knapp and Rice 1998, Holderegger et al. 2006, Mitchell-Olds and Schmitt 2006, Lawton-Rauh 2008). For this reason, we could expect neutral genetic diversity to be correlated with the relative position of populations within species’ ranges: peripheral populations will theoretically present lower genetic variation than central ones, because gene flow and population sizes typically decrease towards range edges, and bottlenecks and founder events are thus more likely (Lesica and Allendorf 1995, Vucetich and Waite 2003). In contrast, phenotypic variation is frequently estimated on fitness-related characters, which are likely to be affected by the process of natural selection. Therefore, genetic diversity inferred from marker loci does not necessarily constitute the best predictor for variation in life-history traits (Reed and Frankham 2001).
Phenotypic variation within populations may instead show a closer relationship with environmental conditions. Climate, for example, is a major selective agent in plants at large spatial scales (Weber and Schmid 1998, Joshi et al. 2001, Etterson 2004), and variability in life-history traits could be promoted through natural selection by variation in factors such as temperature and precipitation. Environmental variability might also trigger trait variation by means of phenotypic plasticity, which has indeed a genetic basis as well (Schlichting 1986, Thompson 1991, Pigliucci 2005). Thus, phenotypic variation within populations is expected to show a positive correlation with variation in environmental conditions both through adaptive genetic variation and plasticity. Adaptive traits may also present the signal of neutral processes such as gene flow or founder events (van Tienderen et al. 2002), but
to a lesser extent (Galloway and Fenster 2000, Joshi et al. 2001). Thus, the effects of local environmental variability and the spatial position of populations should be examined together throughout a species’ distribution range, on both the genetic and phenotypic variation within populations. In this way, we can contribute to unravel the consequences of the adaptive selection and demographic history of species.
Widespread plants represent successful examples of life history adaptability to a broad range of local conditions (Baker 1974, Waldmann and Andersson 1998, Joshi et al. 2001) and provide a good opportunity to analyze phenotypic variation along large geographical and/or environmental gradients. For this reason we chose as our study case Plantago coronopus, a widespread short-lived herb in Europe, N Africa and SW Asia (Hultén and Fries 1986). This taxon presents high variability in vegetative and reproductive traits, as well as in demographic vital rates, both at regional (Waite and Hutchings 1982, Braza et al. 2010) and continental scales (Villellas et al. 2012, Villellas and García 2012, Villellas et al. in press). Furthermore, P. coronopus produces two types of seeds that differ in size and in the production of a mucilaginous coat that facilitates water absorption (Dowling 1933). Variation among populations of this taxon in traits such as plant size, seed size and mucilage production appears to be highly related to environmental factors such as precipitation, temperature and intraspecific competition (Villellas et al. 2012, Villellas and García 2012). However, it remains to be tested whether variability in environmental conditions promotes phenotypic variation within populations as well.
In this study we analyze both phenotypic variability and genetic diversity in the widespread P. coronopus. We sampled 18 populations spanning the whole latitudinal gradient of the species in Europe, for which we quantified genetic diversity by using amplified fragment length polymorphism (AFLP). Individual plants of a subset of 11 populations were intensively monitored in the field for a minimum of 4 yr, to calculate within-population variability in six key life-history traits that encompass different parts of the life cycle: plant size, annual plant growth, fecundity, seed mass, mucilage production, and ratio between seed morphs. Seed mass, ratio between seed morphs,

Chapter 4
77
and mucilage are of high ecological importance for plants (Harper and Benton 1966, Westoby et al. 1992, Imbert 2002, Villellas and García 2012), and growth and fecundity constitute key components of population dynamics for short-lived taxa like P. coronopus (Silvertown et al. 1996). The temporal variability in local climate and intraspecific competition was also estimated, and the central vs. peripheral position of populations was accounted for. We aimed to explore the pattern and causes of phenotypic and genetic variation within populations of a widespread plant in a large latitudinal gradient in Europe. Our goal was to disentangle the effects of adaptive variation in response to environmental conditions, from the influence of range position and the associated demographic history of populations.
Material and methods
Species and populations studied
Plantago coronopus L. (buck’s horn plantain, Plantaginaceae) is a widespread short-lived herb, mainly distributed around the Mediterranean Basin, although it also reaches N Europe through a strip along the Atlantic coast (Hultén and Fries 1986, Fig. 1a). We have worked with the most common subspecies Plantago coronopus ssp. coronopus, which can be distinguished from the others by the morphology of the bracts (Chater and Cartier 1976). Hereafter we will refer to it as P. coronopus. Plants have one or a few rosettes, producing several spikes with wind-pollinated flowers. Each fruit produces two types of seeds in variable number: up to four large, basal seeds, and one or no small apical seeds. Basal and apical seeds further differentiate in the timing and percentage of germination (Braza and García 2011), and only the former possess a mucilaginous coat that facilitates water absorption (Dowling 1933). Thus, basal seeds seem to be better adapted for habitats with low water or resources supply. P. coronopus shows high variability among individuals in other characters such as leaf shape and size.
Plantago coronopus is present in a wide variety of environmental conditions across its range in terms of climate, soil richness and vegetation cover. In central areas, the species is found in coastal and inland locations, in contrasting habitats like sand dunes, cliffs,
shrublands or human-disturbed areas. Northern peripheral populations, on the contrary, are rather restricted to coastal places (coast prairies, salt marshes). To analyze genetic diversity, we have chosen in this study 11 central and 7 northern peripheral populations, for a total of 18 populations in six countries, spanning the whole latitudinal and environmental gradient of the species in Europe (Fig. 1a, Table 1). Peripheral populations were located in coastal meadows, and central populations were located in a variety of habitats. For the analysis of phenotypic variability, we have used a representative subset of 5 central and 6 peripheral populations, for a total of 11 populations along the Atlantic coast (Fig. 1a, Table 1).
Variability in phenotypic traits
Eleven populations were monitored during up to 8 yr (between 2003 and 2010; Table 1) to quantify within-population variability in six life-history traits. With a several-year dataset for some traits, we can assure that our phenotypic measurements are representative of each population, and not influenced by the particular conditions of a given year. On each population, we labelled between 50 and 150 reproductive plants to measure each year the number and length of leaves, and the number and length of inflorescences. Plant size was estimated by multiplying the number of leaves and the length of an average leaf. Plant growth rate was calculated as the ratio between plant size in one year and that of the previous year. We estimated fecundity (number of seeds) from the number of inflorescences × length of an average inflorescence × number of seeds per unit of inflorescence length (calculated with a regression equation for each population). We found in a preliminary analysis that fecundity was correlated with plant size (log-transformed variables; F1,7348 = 3754, R2 = 0.34, p < 0.001; lm procedure, package stats, R Development Core Team 2011), so we calculated fecundity per unit of plant size (hereafter “fecundity”) and used it for subsequent analyses.
To evaluate variation in seed traits, the spikes of 25 individuals were collected on each population in the summers of 2007 or 2008. In the laboratory, we counted the total number of basal and apical seeds in 10 fruits per plant. We then calculated the ratio of basal and apical seeds for each individual (hereafter “seed ratio”;

Publications
78
not available in population BN) by dividing the total number of basal seeds by that of apical seeds. The production of mucilage and the size of basal seeds were measured in five seeds per individual, in an average of 15 individuals per population. We first soaked the seeds for 1 h in Petri dishes, until mucilage became conspicuous. We then measured the projected seed area, and the total area that contained both the seed and the mucilaginous coat, using the ellipse area formula. Seed mass was estimated from seed area, and mucilage production (hereafter “mucilage ratio”) was estimated by substracting the seed area from the total area, and by dividing the result by the seed area. We used a relative measure of mucilage because the area of the mucilaginous coat was positively correlated to seed mass (Villellas and García 2012). For seed mass and mucilage ratio, we
calculated for each individual the average across seeds.
For each population, we estimated phenotypic variation from the coefficient of variation (CV) among individuals in each trait: plant size, plant growth, fecundity, seed ratio, seed mass and mucilage ratio. For traits for which we had data from several years (plant size, growth and fecundity) we averaged the CV across years.
Environmental variability of populations
In the 11 populations sampled for phenotypic variation, we also estimated annually the density of P. coronopus (D) from linear transects (Strong 1966), with the equation D = Σ(1/d) × (1/T), where T is total transect length, and d is the diameter perpendicular to the transect of non-seedling individuals intercepting
Fig. 1 a) Location of central and northern peripheral populations of Plantago coronopus sampled in this study. Black circles correspond to populations sampled for genetic analyses, and white circles to populations subject both to genetic and phenotypic analyses. In grey, geographic distribution of the species, including some coastal outlines and omitting the southernmost area (simplified from Hultén and Fries 1986). b) Precipitation variability in populations (see Material and Methods for details on estimation), ranked by latitude. See Table 1 for acronyms and other information of populations.

Chapter 4
79
the transect. We collected data from 3 yr for peripheral populations and from 4 yr for central populations, and we calculated the CV in annual density as a proxy for variation in intraspecific competition.
Meteorological data were obtained for all 18 populations from several databases: Spanish National Meteorological Agency (populations T, BN, CA, AL, MA and Z), MeteoGalicia (C), MeteoFrance (F), Danish Meteorological Institute (DH and DS), Swedish Meteorological and Hydrological Institute (ST and SG), Met Office (EA and ES) and the website http://www.tutiempo.net (NA, SET, FSM and SO). We obtained annual temperature and annual and monthly precipitation from 10-20 yr within the last four decades (depending on availability) from the nearest meteorological
station to each population. Finally, we calculated for each population the CV in annual temperature and three different estimates of precipitation variability: 1) the CV in annual precipitation, used here as a measure of inter-annual variability; 2) the average of the annual Precipitation Concentration Index (PCI; Oliver 1980), which is the ratio between the summatory of the squared monthly precipitation within a year and the squared summatory of monthly precipitation, and reflects intra-annual variability; and 3) the CV of the annual PCI.
Genetic analyses
For all 18 populations, we collected leaf samples of 6-12 individuals per population (Table 1), for a total of 179 individuals. Leaves were collected in situ or from individuals grown
Table 1. Populations of Plantago coronopus sampled in this study. N corresponds to the number of individuals used for genetic analyses, Frt is the total number of AFLP fragments, Frp is the percentage of polymorphic fragments and HD is average gene diversity (± SD). For populations subject to phenotypic analyses (PA), the number of years of data collection is shown.
Genetic analyses Population Coordinates Habitat N Frt Frp HD
PA (yr)
Central T - Spain 36’02N 05’38W Sand dune 12 315 62.25 0.224 ±0.11 8 BN - Spain 36’06N 05’32W Forest gaps 12 335 70.71 0.248 ±0.13 4 CA - Spain 36’25N 06’13W Sand dune 10 285 59.22 0.211 ±0.11 4 AL - Spain 36’43N 02’11W Sandy cliff 6 239 45.77 0.200 ±0.11 - NA - Portugal 39’35N 09’04W Sand dune 12 286 56.83 0.203 ±0.10 - MA - Spain 39’46N 03’45E Sand dune 11 261 52.27 0.194 ±0.10 - Z - Spain 41’39N 0’50W Riverside 10 276 57.05 0.215 ±0.11 - C - Spain 42’33N 09’01W Sand dune 11 266 53.14 0.196 ±0.10 7 SET - France 43’24N 03’39E Lagoon rocks 12 285 59.21 0.212 ±0.11 - FSM - France 43’27N 04’52E Lagoon rocks 6 214 39.91 0.180 ±0.10 - F - France 47’18N 02’30W Sand dune 8 221 41.64 0.167 ±0.09 5
Peripheral DH - Denmark 55’08N 09’59E Coastal prairie 11 215 39.91 0.148 ±0.07 4 DS - Denmark 55’29N 08’15E Coastal prairie 11 268 48.80 0.179 ±0.09 5 SO - Sweden 56’13N 16’24E Coastal prairie 10 183 34.92 0.136 ±0.07 - ST - Sweden 56’23N 12’38E Coastal prairie 11 205 33.40 0.124 ±0.06 5 SG - Sweden 56’55N 12’21E Coastal prairie 9 205 31.88 0.120 ±0.06 7 EA - Scotland 57’20N 01’55W Coastal prairie 11 208 36.22 0.137 ±0.07 4 ES - Scotland 57’30N 06’26W Coastal prairie 6 151 27.33 0.125 ±0.07 4

Publications
80
in the greenhouse from seeds collected in populations (from different individuals separated by at least 1 m). Plant material was stored in silica gel immediately after collection.
Total genomic DNA was extracted from dry leaves using the unmodified QIAGEN® DNeasy Plant Mini Kit protocol. Quality and quantity of extracted DNA were determined electrophoretically after SYBR green staining using a ladder with known amounts of DNA as standards (HyperLadder™, Bioline). We performed an amplified fragment length polymorphism (AFLP) analysis following established protocols (Vos et al. 1995). An initial screening of selective primers, using 72 primer combinations with three and four selective nucleotides, was performed on a total of eight individuals belonging to eight different populations. The final six primer combinations for the selective PCR were (fluorescent dye in brackets): EcoRI (FAM)-ACT/MseI-CAA, EcoRI (VIC)-AGG/MseI-CTA, EcoRI (NED)-ACC/MseI-CTG, EcoRI (FAM)-ACT/MseI-CTA, EcoRI (VIC)-AAG/MseI-CAT and EcoRI (NED)-AGC/MseI-CAG. MseI primers with four selective nucleotides were chosen for the selective amplification. We replicated 35 individuals (16.6%) to exclude non-reproducible bands and to calculate the error rate according to Bonin et al. (2004). The fluorescence-labelled selective amplification products were separated by capillary gel electrophoresis at the “Genomic Unit” (Universidad Complutense, Madrid, Spain), on an automated sequencer (3730 DNA Analyzer, PE Applied Biosystems, Foster City, CA, USA) with an internal size standard (GeneScan® -500 LIZ, Applied Biosystems). Raw data were exported to GeneMarker 1.8 (SoftGenetics LLC, PA USA) for scoring of fragments. The scoring was normalized after different automatic runs with different parameters. The peaks were considered to be present when they were over a scoring fluorescence intensity threshold determined by visual inspection of the electropherograms, and they were reproducible between independent replicates. Amplified fragments from 75 to 500 base pairs were scored. The results of the scoring were exported as a presence/absence matrix.
Genetic diversity was estimated for each locus and population using the formula HD = 1-Σ(xi 2), where xi is the population frequency of each phenotype “allele” (1 or 0) at locus i (software Arlequin 3.01; Excoffier et al. 2005).
Then, HD was averaged across all loci for subsequent analyses (Lowe et al. 2004). We also estimated genetic diversity with two additional metrics calculated with FAMD software: the total number of AFLP fragments presents (Frt) and the percentage of polymorphic fragments (Frp).
Analysis of phenotypic variation, genetic diversity and correlates
Previous to the analyses of the potential drivers of phenotypic and genetic variation, we performed some preliminary analyses. To test the relationship between the various measures of genetic diversity, we performed a Pearson’s correlation test (cor procedure, package stats in R) between HD and Frt, and between HD and Frp. We also checked for collinearity among the genetic and environmental explanatory variables (HD, CV in annual density, CV in annual temperature, CV in annual precipitation, PCI and CV in PCI) with an analysis of variance inflation factor (VIF; vif procedure, package car in R). The three precipitation variables were similar and showed relatively high VIF values (10, 4.9 and 3.1), which can be problematic (Kleinbaum et al. 1988). Thus, we performed a Principal Component Analysis with the three precipitation variables (prcomp procedure, package stats in R), and the first component explained 80.5 % of the total variance. Hence we calculated from the coefficients of this first component a new variable, hereafter referred as “precipitation variability”.
We then analyzed the effect of environmental variability and genetic diversity on phenotypic variation with a Linear Mixed Model (n = 11 populations; lme procedure, package nlme in R), including HD, CV in annual density, CV in annual temperature and precipitation variability as covariates, position (central vs. peripheral) as a fixed factor and the type of phenotypic trait as a random factor. To analyze the effect of precipitation variability alone on phenotypic traits, we also performed a Linear Model for each trait (n = 11 populations; lm procedure, package stats in R). In these analyses, we corrected p-values for multiple testing with the false discovery rate method (Benjamini and Hochberg 1995; p.adjust procedure, package stats in R), which is appropriate for low sample sizes. Finally, we analyzed the factors that might affect HD with

Chapter 4
81
another Linear Model (n = 18 populations), where CV in annual temperature and precipitation variability were the covariates and position was a fixed factor (we did not include density because we only had data for 11 populations and its effect was non-significant).
Results
General patterns of phenotypic variation and genetic diversity
There were differences among phenotypic traits in the magnitude of within-population variation
(Fig. 2a), traits measured at the individual level (plant size, growth and fecundity) showing higher variation than those at the seed level (seed mass, mucilage ratio and seed ratio). The three southernmost populations (T, BN and CA) showed in general higher phenotypic variation, but there were no clear differences between central and peripheral populations.
In genetic analyses, the three AFLP primer combinations generated 796 unambiguously scorable fragments, FAM-ACT/CAA: 164, VIC-AGG/CTA: 135, NED-ACC/CTG: 78, FAM-ACT/CTA: 184, VIC-AAG/CAT: 134, NED-AGC/CAG: 101, of which all but one
Fig. 2 Phenotypic variation (a), measured with coefficient of variation (CV) in six life-history traits, and genetic diversity (b), estimated with HD, in central and peripheral populations of Plantago coronopus along the latitudinal gradient. In a), abbreviations correspond to traits: fecundity (FEC), plant growth (PGRO), plant size (PSIZE), seed mass (SMASS), mucilage ratio (MUC) and seed ratio (SRAT).

Publications
82
were polymorphic. All 273 investigated individuals had unique AFLP profiles. The error rate, based on phenotypic comparisons among the 35 replicated individuals, amounted to 2.8 %. For subsequent genetic analyses, we selected the polymorphic bands with a percentage variation lower than genotyping error, obtaining 461 polymorphic bands.
HD was highly and positively correlated to the other measures of genetic diversity, i.e., Frt (t16 = 9.52, p < 0.001, r = 0.92) and Frp (t16 = 14.29, p < 0.001, r = 0.96), which indicates that HD can be used as a reliable estimator of genetic diversity. Northern peripheral populations, located in Denmark, Sweden and Scotland, showed the lowest genetic diversity values, whereas central populations had higher values, especially in South Spain (Table 1, Fig. 2b).
Correlates of phenotypic variation and genetic diversity
Phenotypic variation was significantly correlated to precipitation variability, but density variation, temperature variability, HD and position showed no significant effects (Table 2). The effect of precipitation variability on phenotypic variation differed depending on the phenotypic variable (Fig. 3). Precipitation variability was significantly and positively correlated with variation in plant size, fecundity, growth, mucilage ratio and seed ratio, the latter showing the lowest R2 value. Variation in seed mass was not significantly affected by precipitation variability. Precipitation variability showed a gradual
decline in the latitudinal gradient, from the central to the northern peripheral populations (Fig. 1b).
The analysis of genetic diversity showed that position exerted a marginally significant effect on HD, whereas neither precipitation variability nor temperature variability had a significant effect (Table 2). When non-significant covariates were removed from the analysis, the effect of position on HD became significant (t16 = -6.41, p < 0.001).
Discussion
Understanding life-history variability in species requires the identification of the evolutionary and demographic processes operating on populations (Lynch et al. 1999, Reed and Frankham 2001, Mitchell-Olds and Schmitt 2006). In this study, we analyzed genetic and phenotypic variation within populations across the latitudinal gradient of P. coronopus in Europe, in relation with environmental and geographical factors. Our analyses showed that the simple and intuitive relationship between phenotypic variation measured on fitness-related traits, and genetic diversity inferred from neutral molecular markers, does not hold in this species. Phenotypic variation within populations was mainly shaped by precipitation variability, suggesting adaptive variation, whereas genetic diversity was correlated with the central vs. peripheral position of populations, probably in close relation with the demographic history of the species.
Table 2. Analyses of correlates of phenotypic variation and genetic diversity in Plantago coronopus. Fixed effects correspond to precipitation variability (PrVar), CV in annual density (CVdens), CV in annual temperature (CVtemp), genetic diversity (HD) and position (central vs. peripheral). The analysis of phenotypic variation includes a random effect of type of phenotypic trait. In bold, p-values that are significant (< 0.05) or marginally significant (< 0.1).
Analysis Fixed effects Coefficient t p Phenotypic variation PrVar 2.22 ± 0.72 3.1054 0.003 CVdens 0.05 ± 0.09 0.5454 0.592 CVtemp -1.46 ± 1.07 -1.3654 0.179 HD -0.21 ± 1.23 -0.1754 0.867 Position 0.20 ± 0.13 1.4954 0.142 Genetic diversity PrVar 0.21 ± 0.13 1.6314 0.126 CVtemp 0.11 ± 0.21 0.5314 0.604 Position -0.05 ± 0.02 -1.9114 0.076

Chapter 4
83
Plantago coronopus showed values of genetic diversity similar to other widespread short-lived perennials, and higher than plants with the same life form but narrower ranges (Hamrick and Godt 1996). Genetic diversity within populations was negatively correlated with peripherality, populations showing a decline in HD from the range centre in the Mediterranean region to the range edge in countries of N Europe. Changes in genetic diversity along geographical gradients are commonly associated with processes such as genetic drift, reduced gene flow and founder effects (Lesica and Allendorf 1995, Vucetich and Waite 2003), which could have eroded the genetic pool in the northern range margin of P. coronopus. Such decline in genetic diversity in peripheral populations is indeed a frequent pattern in comparative analyses across species’ ranges (see Eckert et al. 2008 for review). It is interesting to note that current northern populations of P. coronopus show higher densities than central ones (Villellas et al.
2012). Thus, the lower genetic diversity found in these populations might respond to smaller population densities in the past, and/or to isolation. Divergences between present demographic and genetic patterns have also been reported for the perennial herbs Lychnis viscaria (Lammi et al. 1999) and Cirsium heterophyllum (Jump et al. 2003), and call for caution when using information from one component of species’ biology to infer patterns in other components.
Phenotypic variation within populations was not related in P. coronopus with neutral genetic diversity. Several studies have shown a similar lack of correspondence between genetic diversity and variation in life-history traits in plants (e.g. Waldmann and Andersson 1998, McKay et al. 2001), and Reed and Frankham (2001) concluded that molecular measures of genetic diversity constituted poor predictors of adaptive genetic variability. In our study, phenotypic variation was instead highly correlated to temporal fluctuations in local
Fig. 3 Relationship between phenotypic variation in life-history traits within populations of Plantago coronopus, measured as coefficient of variation (CV) among individuals, and precipitation variability (PrVar; see Material and Methods for details on the estimation). Traits are a) plant size, b) fecundity, c) plant growth, d), seed mass e) mucilage ratio and f) seed ratio. R2 values are given for each regression analysis, and the statistical significance is represented by asterisks: * p < 0.05 (corrected by the false discovery rate method).

Publications
84
precipitation, suggesting that selective forces have promoted life-history variability within populations. This result indicates that variability in environmental parameters, such as precipitation, may be used to infer evolutionary potential within populations. Variation in environmental conditions has been similarly proposed as a useful surrogate for trait divergence among populations (Knapp and Rice 1998, Bekessy et al. 2003, Bottin et al. 2007) and also to detect areas of high species diversity (Faith 2003, Sarkar et al. 2005).
Phenotypic variation was estimated in this study in natural populations, and thus it may include both the effects of adaptive genetic variation and phenotypic plasticity. Indeed, both sources of variation seem to be present in P. coronopus: Wolff (1991a, 1991b) reported significant levels of genetic variation within populations, but also found evidences of plasticity (see also Waite and Hutchings 1982, Smekens and van Tienderen 2001). However, phenotypic plasticity itself can also be considered a trait where selection acts (Schlichting 1986, Thompson 1991, Pigliucci 2005), so we expect both genetic variation and plasticity to increase under selective forces such as environmental variability (Rice and Emery 2003, Lande 2009, Dawson et al. 2011). Doubtless, analyses of heritability with P. coronopus at the same continental scale as this study would help to quantify both phenomena separately.
Our analyses highlight the importance of precipitation in shaping life-history and demographic variability within populations of P. coronopus. This climatic variable has indeed a similarly important role in the differentiation among populations (Villellas et al. 2012, Villellas and García 2012, Villellas et al. in press). Seed-related traits in particular, whose variation across populations is mediated by a trade-off between fecundity and the resources allocated to seed tolerance to stress (Villellas and García 2012), seem to be highly sensitive to precipitation regime in this species. Seed mass was the only trait in our study that remained virtually unaffected by environmental variability. However, considering the seed dimorphism of P. coronopus, variation in average seed mass may also be regulated in practice through the ratio between big basal and small apical seeds. The correlation between precipitation and variation in plant size and growth, in turn, may take place through
different demands on resource acquisition, or indirectly through the close association between plant size and seed production (Villellas and García 2012). Overall, the differences among traits in their response to environmental variability highlight the importance of using several components of phenotypic variation, fitness-related traits usually being of more interest than purely morphological characters (Reed and Frankham 2001).
The combination of ecological, phenotypic and genetic information is crucial for analyzing the patterns and causes of trait variation within taxa, and for evaluating their future adaptive potential (Crandall et al. 2000, Bekessy et al. 2003, Narbona et al. 2010). Our study of a widespread plant at a continental scale showed that phenotypic variation within populations was neither correlated with genetic diversity inferred from molecular markers, nor with the position of populations within the species’ range. Instead, phenotypic variation was moulded by precipitation variability, suggesting that populations may have a higher adaptive potential in variable rather than stable environments. The use of environmental variability as a proxy for evolutionary potential could be considered in some conservation tools, such as niche-models predicting the future distribution of plants under environmental changes (Botkin et al. 2007), to improve the management of biodiversity.
Acknowledgements
This study was funded by the Spanish Ministry of Science and Innovation by means of National Projects to M.B.G. (CGL2006-08507; CGL2010-21642) and A.T. (CGL2009-08713), and a FPU scholarship to J.V. We are grateful to A. Adsuar, A. Barcos, R. Castillo, M.L. Dehesa, R. Corrià, R. Forrest, A. de Frutos, E. López, J. Martínez, E. Morán, C. Niklasson, F. Ojeda, S. Palacio, I. Pardo, A. Pérez, C. Pérez, P. Sánchez, A. Taboada, M. Talavera and A. Vale for their valuable help in field and laboratory work through years. We thank R. Braza, V. Simón, J. Thompson and A. Traveset for plant material for genetic analyses, R. Braza for phenotypic data from population F and BN, and M. Pazos for her assessment in statistical analyses. J. Arroyo, F.X. Picó and P. Vargas provided very helpful comments on the manuscript.

Chapter 4
85
References
Baker, H. G. 1974. The evolution of weeds. Annual Review of Ecology and Systematics 5:1-24.
Bekessy, S. A., R. A. Ennos, M. A. Burgman, A. C. Newton, and P. K. Ades. 2003. Neutral DNA markers fail to detect genetic divergence in an ecologically important trait. Biological Conservation 110:267-275.
Benjamini, Y., and Y. Hochberg. 1995. Controlling the false discovery rate: a practical and powerful approach to multiple testing. Journal of the Royal Statistical Society B 57:289-300.
Bonin, A., E. Bellemain, P. B. Eidesen, F. Pompanon, C. Brochmann, and P. Taberlet. 2004. How to track and assess genotyping errors in population genetics studies. Molecular Ecology 13:3261-3273.
Botkin, D. B., H. Saxe, M. B. Araujo, R. Betts, R. H. W. Bradshaw, T. Cedhagen, P. Chesson, T. P. Dawson, J. R. Etterson, D. P. Faith, S. Ferrier, A. Guisan, A. S. Hansen, D. W. Hilbert, C. Loehle, C. Margules, M. New, M. J. Sobel, and D. R. B. Stockwell. 2007. Forecasting the effects of global warming on biodiversity. Bioscience 57:227-236.
Bottin, L., J. Tassin, R. Nasi, and J. M. Bouvet. 2007. Molecular, quantitative and abiotic variables for the delineation of evolutionary significant units: case of sandalwood (Santalum austrocaledonicum Vieillard) in New Caledonia. Conservation Genetics 8:99-109.
Bradshaw, A. D. 1991. The Croonian Lecture, 1991 - Genostasis and the limits to evolution. Philosophical Transactions of the Royal Society of London Series B-Biological Sciences 333:289-305.
Bradshaw, A. D., and T. McNeilly. 1991. Evolutionary response to global climatic change. Annals of Botany 67:5-14.
Braza, R., J. Arroyo, and M. B. García. 2010. Natural variation of fecundity components in a widespread plant with dimorphic seeds. Acta Oecologica-International Journal of Ecology 36:471-476.
Braza, R., and M. B. García. 2011. Spreading recruitment over time to cope with environmental variability. Plant Ecology 212:283-292.
Butlin, R. K., and T. Tregenza. 1998. Levels of genetic polymorphism: marker loci versus quantitative traits. Philosophical Transactions of the Royal Society B-Biological Sciences 353:187-198.
Crandall, K. A., O. R. P. Bininda-Emonds, G. M. Mace, and R. K. Wayne. 2000. Considering evolutionary processes in conservation biology. Trends in Ecology & Evolution 15:290-295.
Chater, A. O., and D. Cartier. 1976. Plantago L. Pages 38-44 in T. G. Tutin, V. H. Heywood, N. A. Burges, D. M. Moore, D. H. Valentine, S. M. Walters, and D. A. Webb, editors. Flora Europaea. Cambridge University Press, Cambridge.
Dawson, T. P., S. T. Jackson, J. I. House, I. C. Prentice, and G. M. Mace. 2011. Beyond predictions: biodiversity conservation in a changing climate. Science 332:53-58.
Dowling, R. E. 1933. The reproduction of Plantago coronopus: an example of morphological and biological seed dimorphism. Annals of Botany 47:861-872.
Eckert, C. G., K. E. Samis, and S. C. Lougheed. 2008. Genetic variation across species' geographical ranges: the central-marginal hypothesis and beyond. Molecular Ecology 17:1170-1188.
Etterson, J. R. 2004. Evolutionary potential of Chamaecrista fasciculata in relation to climate change. 1. Clinal patterns of selection along an environmental gradient in the great plains. Evolution 58:1446-1458.
Excoffier, L., G. Laval, and S. Schneider. 2005. Arlequin (version 3.0): an integrated software package for population genetics data analysis. Evolutionary Bioinformatics 1:47-50.
Faith, D. P. 2003. Environmental diversity (ED) as surrogate information for species-level biodiversity. Ecography 26:374-379.
Frankham, R. 1995. Conservation genetics. Annual Review of Genetics 29:305-327.
Galloway, L. F., and C. B. Fenster. 2000. Population differentiation in an annual legume: local adaptation. Evolution 54:1173-1181.
Haig, S. M. 1998. Molecular contributions to conservation. Ecology 79:413-425.
Hamrick, J. L., and M. J. W. Godt. 1996. Effects of life history traits on genetic diversity in plant species. Philosophical Transactions of the Royal Society of London Series B-Biological Sciences 351:1291-1298.
Harper, J. L., and R. A. Benton. 1966. Behaviour of seeds in soil II. The germination of seeds on the surface of a water supplying substrate. Journal of Ecology 54:151-166.
Holderegger, R., U. Kamm, and F. Gugerli. 2006. Adaptive vs. neutral genetic diversity: implications for landscape genetics. Landscape Ecology 21:797-807.
Hultén, E., and M. Fries. 1986. Atlas of North European vascular plants. North of the Tropic of Cancer. Maps 1-996. Koeltz Scientific Books, Konigstein.
Imbert, E. 2002. Ecological consequences and ontogeny of seed heteromorphism. Perspectives in Plant Ecology Evolution and Systematics 5:13-36.

Publications
86
Joshi, J., B. Schmid, M. C. Caldeira, P. G. Dimitrakopoulos, J. Good, R. Harris, A. Hector, K. Huss-Danell, A. Jumpponen, A. Minns, C. P. H. Mulder, J. S. Pereira, A. Prinz, M. Scherer-Lorenzen, A. S. D. Siamantziouras, A. C. Terry, A. Y. Troumbis, and J. H. Lawton. 2001. Local adaptation enhances performance of common plant species. Ecology Letters 4:536-544.
Jump, A. S., F. I. Woodward, and T. Burke. 2003. Cirsium species show disparity in patterns of genetic variation at their range-edge, despite similar patterns of reproduction and isolation. New Phytologist 160:359-370.
Jump, A. S., and J. Peñuelas. 2005. Running to stand still: adaptation and the response of plants to rapid climate change. Ecology Letters 8:1010-1020.
Kleinbaum, D. G., L. L. Kupper, and K. E. Muller. 1988. Applied regression analysis and other multivariables methods. PWS Publishing Company, Boston.
Knapp, E. E., and K. J. Rice. 1998. Comparison of isozymes and quantitative traits for evaluating patterns of genetic variation in purple needlegrass (Nassella pulchra). Conservation Biology 12:1031-1041.
Lammi, A., P. Siikamaki, and K. Mustajarvi. 1999. Genetic diversity, population size, and fitness in central and peripheral populations of a rare plant Lychnis viscaria. Conservation Biology 13:1069-1078.
Lande, R. 2009. Adaptation to an extraordinary environment by evolution of phenotypic plasticity and genetic assimilation. Journal of Evolutionary Biology 22:1435-1446.
Lawton-Rauh, A. 2008. Demographic processes shaping genetic variation. Current Opinion in Plant Biology 11:103-109.
Lesica, P., and F. W. Allendorf. 1995. When are peripheral-populations valuable for conservation. Conservation Biology 9:753-760.
Lowe, A., S. Harris, and P. Ashton. 2004. Ecological genetics: design, analysis, and application. Blackwell, Oxford.
Lynch, M., M. Pfrender, K. Spitze, N. Lehman, J. Hicks, D. Allen, L. Latta, M. Ottene, F. Bogue, and J. Colbourne. 1999. The quantitative and molecular genetic architecture of a subdivided species. Evolution 53:100-110.
McKay, J. K., J. G. Bishop, J. Z. Lin, J. H. Richards, A. Sala, and T. Mitchell-Olds. 2001. Local adaptation across a climatic gradient despite small effective population size in the rare sapphire rockcress. Proceedings of the Royal Society of London Series B-Biological Sciences 268:1715-1721.
Mitchell-Olds, T., and J. Schmitt. 2006. Genetic mechanisms and evolutionary significance of natural variation in Arabidopsis. Nature 441:947-952.
Narbona, E., B. Guzman, J. Arroyo, and P. Vargas. 2010. Why are fruit traits of Cistus ladanifer (Cistaceae) so variable: A multi-level study across the western Mediterranean region. Perspectives in Plant Ecology Evolution and Systematics 12:305-315.
Oliver, J. E. 1980. Monthly precipitation distribution: a comparative index. Professional Geographer 32:300-309.
Parmesan, C. 2006. Ecological and evolutionary responses to recent climate change. Annual Review of Ecology Evolution and Systematics 37:637-669.
Pigliucci, M. 2005. Evolution of phenotypic plasticity: where are we going now? Trends in Ecology & Evolution 20:481-486.
R Development Core Team. 2011. R: A language and environment for statistical computing. R Foundation for Statistical Computing, Vienna, Austria.
Reed, D. H., and R. Frankham. 2001. How closely correlated are molecular and quantitative measures of genetic variation? A meta-analysis. Evolution 55:1095-1103.
Rice, K. J., and N. C. Emery. 2003. Managing microevolution: restoration in the face of global change. Frontiers in Ecology and the Environment 1:469-478.
Sarkar, S., J. Justus, T. Fuller, C. Kelley, J. Garson, and M. Mayfield. 2005. Effectiveness of environmental surrogates for the selection of conservation area networks. Conservation Biology 19:815-825.
Schlichting, C. D. 1986. The evolution of phenotypic plasticity in plants. Annual Review of Ecology and Systematics 17:667-693.
Silvertown, J., M. Franco, and E. Menges. 1996. Interpretation of elasticity matrices as an aid to the management of plant populations for conservation. Conservation Biology 10:591-597.
Smekens, M. J., and P. H. van Tienderen. 2001. Genetic variation and plasticity of Plantago coronopus under saline conditions. Acta Oecologica-International Journal of Ecology 22:187-200.
Strong, C. W. 1966. An improved method of obtaining density from line-transect data. Ecology 47:311-313.
Thompson, J. D. 1991. Phenotypic plasticity as a component of evolutionary change. Trends in Ecology & Evolution 6:246-249.
van Tienderen, P. H., A. A. de Haan, C. G. van der Linden, and B. Vosman. 2002. Biodiversity assessment using markers for ecologically important traits. Trends in Ecology & Evolution 17:577-582.
Villellas, J., J. Ehrlén, J. M. Olesen, R. Braza, and M. B. García. 2012. Plant performance in central and northern peripheral populations of

Chapter 4
87
the widespread Plantago coronopus. Ecography: doi 10.1111/j.1600-0587.2012.07425.x.
Villellas, J., and M. B. García. 2012. The role of the tolerance-fecundity trade-off in maintaining intraspecific seed trait variation in a widespread dimorphic herb. Plant Biology, doi: 10.1111/j.1438-8677.2012.00684.x.
Villellas, J., W. F. Morris, and M. B. García. in press. Variation in stochastic demography between and within central and peripheral regions in a widespread short-lived herb. Ecology.
Volis, S., S. Mendlinger, L. Olsvig-Whittaker, U. N. Safriel, and N. Orlovsky. 1998. Phenotypic variation and stress resistance in core and peripheral populations of Hordeum spontaneum. Biodiversity and Conservation 7:799-813.
Vos, P., R. Hogers, M. Bleeker, M. Reijans, T. Vandelee, M. Hornes, A. Frijters, J. Pot, J. Peleman, M. Kuiper, and M. Zabeau. 1995. AFLP: a new technique for DNA fingerprinting. Nucleic Acids Research 23:4407-4414.
Vucetich, J. A., and T. A. Waite. 2003. Spatial patterns of demography and genetic processes across the species' range: Null hypotheses for landscape conservation genetics. Conservation Genetics 4:639-645.
Waite, S., and M. J. Hutchings. 1982. Plastic energy allocation patterns in Plantago coronopus. Oikos 38:333-342.
Waldmann, P., and S. Andersson. 1998. Comparison of quantitative genetic variation and allozyme diversity within and between populations of Scabiosa canescens and S. columbaria. Heredity 81:79-86.
Walther, G. R., L. Hughes, P. Vitousek, and N. C. Stenseth. 2005. Consensus on climate change. Trends in Ecology & Evolution 20:648-649.
Weber, E., and B. Schmid. 1998. Latitudinal population differentiation in two species of Solidago (Asteraceae) introduced into Europe. American Journal of Botany 85:1110-1121.
Westoby, M., E. Jurado, and M. Leishman. 1992. Comparative evolutionary ecology of seed size. Trends in Ecology & Evolution 7:368-372.
Wolff, K. 1991a. Analysis of allozyme variability in three Plantago species and a comparison to morphological variability. Theoretical and Applied Genetics 81:119-126.
Wolff, K. 1991b. Genetic analysis of morphological variability in three Plantago species with different mating systems. Theoretical and Applied Genetics 81:111-118.


89
General discussion


General discussion
91
General discussion
In this study we have analyzed demographic, life-history and genetic variation in the
widespread herb P. coronopus through most of its latitudinal range, from data gathered over
several years of field and laboratory work. Our results agreed with classical central-marginal
hypotheses in some aspects, such as the genetic pattern, but not in others, such as density,
demographic variability, and overall population performance. In fact, environmental
conditions seemed to have a higher influence on plant performance than the position of
populations within the species’ range. Variation in demographic patterns and reproductive
traits at continental and regional scales, and both among and within populations, were indeed
closely linked to some biotic and abiotic factors, particularly precipitation regime. Overall,
our study highlights the versatility of P. coronopus in response to variation in environmental
conditions, and complements similar findings of previous research on the same taxon at
smaller spatial scales (Waite and Hutchings 1982, Waite 1984, Braza et al. 2010, Braza and
García 2011). Such life-history variability seems to be a key factor for widespread plants to
extend over large and heterogeneous ranges.
1. Factors influencing population performance across species’ ranges
Peripheral populations are traditionally predicted to show, with respect to central ones, a
worse and more variable demographic performance (Hengeveld and Haeck 1982, Brown
1984, Lawton 1993, Lesica and Allendorf 1995, Vucetich and Waite 2003), lower genetic
diversity and higher genetic differentiation from other populations (see references in Brussard
1984, Wilson et al. 1991). However, our study has provided some diverging results regarding
the central-marginal pattern. On the one hand, northern peripheral populations of P.
coronopus showed as expected lower genetic diversity with respect to central ones (see
Chapter 4), and higher genetic differentiation in the periphery (mean values of genetic
differentiation of each population with respect to the others, FST, ranged from 0.31 to 0.38 in
peripheral populations, and from 0.23 to 0.30 in central ones; unpublished results). On the
other hand, northern peripheral populations showed higher densities, and there was no
consistent geographic pattern in vital rates’ means and variabilities (see Chapter 1).
Furthermore, the differences found in vital rates led to no significant differences among
regions in the stochastic growth rate (see Chapter 2), a metric that represents general
population performance much better than individual fitness components (Caswell 2001).

General discussion
92
Thus, our study confirmed central-marginal hypotheses from a genetic perspective, but not
regarding demography. The first general conclusion is that theoretical predictions should not
be assumed without testing, and that models that fit under a certain scientific discipline should
not be indiscriminately applied to others.
The failure of widely accepted ideas in predicting the demographic performance of P.
coronopus suggests that plant populations may follow species-specific rather than
generalizable patterns throughout ranges. This view is indeed becoming increasingly patent in
the literature, as recent reviews have failed to find consistent differences between central and
peripheral populations regarding density, vital rates or demographic fluctuations (Sagarin and
Gaines 2002, Gaston 2003, 2009, Sexton et al. 2009). The idiosyncrasy in population
performance shown by P. coronopus and other plants seems to respond to particular
environmental patterns across ranges, which do not necessarily imply worse conditions
towards the periphery. Much of the theory underlying central-marginal models is based
indeed on the assumption of lower habitat suitability in range edges (Lawton 1993, Lesica and
Allendorf 1995). However, peripheral populations may occur in locally favourable patches
within a generally unsuitable matrix (Holt and Keitt 2000, Lennon et al. 2002). It is important
thus to consider not only the geographical location of populations, but also their position
within the species’ ecological niche, which includes the main environmental factors affecting
plants. In this way, we will be able to discern whether geographically marginal populations
are also ecologically marginal and vice versa (Soulé 1973, Grant and Antonovics 1978).
In relation with ecological marginality, one should also bear in mind that species’ life
cycles combine vital rates that individually may be affected by different environmental
factors, so that environmental conditions that are favourable for a certain set of vital rates may
be negative for another (Mandujano et al. 2001). This is likely the case for P. coronopus,
since the low intraspecific competition in sand dunes compared with that of coastal meadows
seems to favour growth and fecundity in central populations, whereas the higher water
availability in northern locations appears to enhance seedling recruitment (see Chapter 1).
Hence, the ecological centrality vs. marginality of populations should be evaluated by
carefully considering the consequences of environmental factors on each particular vital rate.
In the case of P. coronopus, for example, northern peripheral populations were not
ecologically marginal, at least as concerns conditions for seedling recruitment.
The effects of environmental conditions on the intraspecific variability of P. coronopus
became apparent in our study both in population and individual performance. One of the most

General discussion
93
illustrative results at the population level was the finding of the same pattern of demographic
differentiation within central and northern peripheral areas of the species’ range, in response
to environmental factors. Mean annual values and variability in precipitation seemed indeed
to determine, in the same way within both regions, how differences among populations in
vital rates contribute to differences in stochastic growth rates (see Chapter 2). This suggests
that certain demographic strategies may be inherent or characteristic of each set of
environmental conditions, independent of the geographical location of populations. This
seems indeed a common phenomenon in widespread plants, since population structure and
density of Viola elatior and V. stagnina also varied in same way as a result of management
within peripheral and core regions (Eckstein et al. 2004), and density patterns in the invasive
Centaurea melitensis showed similar responses to disturbance and precipitation in its native
and novel ranges (Moroney and Rundel 2012). In some cases, however, different factors
across the range may be responsible for within-region variation in plant performance (Wagner
et al. 2011).
Besides population-level parameters, individual life-history traits showed also a high
variation in relation with varying environmental conditions. For example, seed size, a key trait
for plant dispersal, germination and seedling survival (Westoby et al. 1992, Chapin III et al.
1993, Coomes and Grubb 2003), showed in P. coronopus considerable variation along the
environmental gradient (see Chapter 3). In fact, although seed size has been traditionally
regarded as a relatively fixed trait within species (Harper et al. 1970), there is growing
evidence for the opposite pattern (McWilliams et al. 1968, Baker 1972, Susko and Lovett-
Doust 2000, Moles and Westoby 2003), and especially in widespread short-lived taxa (Völler
et al. 2012). Regarding the partition of trait variance in P. coronopus, reproductive traits
varied more within than among populations, according to a complementary analysis of
variance (percentages of variance within and among populations were, respectively, 80% and
20% in seed production per plant, 59% and 41% in seed production per fruit, 51% and 49% in
basal seed mass, and 74% and 26% in mucilage production; unpublished results). This result
seems to be common in plant taxa (Venable and Burquez 1989, Méndez 1997, Pluess et al.
2005, Völler et al. 2012), and suggests that gene flow among populations may have
homogenized to some extent the genetic pool for those traits. In any case, as commented
above, this would have not impeded P. coronopus to adjust its phenotype to the local
conditions throughout its range.

General discussion
94
Several environmental factors have been analyzed in our study, such as temperature,
precipitation, soil richness and intraspecific competition, and all of them showed some effects
on the biology of P. coronopus. However, precipitation (as a proxy for water availability)
seemed to exert the largest influence on its intraspecific variability, both among and within
populations. This is not surprising since many studies have shown the relevance of
precipitation and water availability for plant biology (Baker 1972, O'Connor 1994, Smith et
al. 2005, Franks and Weis 2008). Following our results, we hypothesize that the main effect
of precipitation takes place through its influence on recruitment, a key process in short-lived
plants (Verkaar and Schenkeveld 1984, Picó et al. 2003, García et al. 2008). In central
populations, where water availability is scarcer or more unpredictable, the species seems to
have developed two different strategies (see Chapter 3) to increase the otherwise failing
recruitment: 1) improving the tolerance of seeds to water stress through a larger size, a thicker
mucilage coat, and a higher abundance of basal seeds, and 2) increasing the total number of
seeds per plant, through larger plant sizes that allow an increase in the number of fruits
(although the number of seeds per fruit decreases due to a trade-off with seed size). In
addition, from a demographic perspective, recruitment was highly correlated with density of
adult individuals (see Chapter 1), and constituted the most relevant vital rate for stochastic
population growth rates (see Chapter 2). Thus, precipitation regime (through its influence on
recruitment) seems to promote changes not only in individual life-history traits such as plant
size, seed size and seed production, but also in several population parameters, becoming a
major driver of variation across the range of P. coronopus.
2. Life-history variability: the key to success in widespread plants
Plantago coronopus has proved to be a highly versatile plant in various ways along the steep
environmental gradient present from North Africa and South Europe to North Europe. In the
first place, the species showed a correlation between inter-individual variation in life-history
traits and the level of environmental variability experienced by populations (see Chapter 4).
Sites with the highest precipitation variability in our study, mainly in southern Europe,
contained indeed the highest within-population variability in reproductive and vegetative
traits (fecundity, seed traits and plant growth), whereas the most stable conditions in northern
locations seemed to favour a higher uniformity in such traits among individuals.
Another mechanism of the species to cope with the environmental gradient is to reduce the
risk of failure in places with variable and unpredictable conditions, through the so-called bet-

General discussion
95
hedging strategies (Cohen 1966, Philippi and Seger 1989). Such strategies may be indeed
especially characteristic of short-lived plants (Seger and Brockman 1987, Mandák 1997). For
example, seed dimorphism, which allows plants to diversify the chances of offspring success
(Imbert 2002), is further accentuated in P. coronopus in the more unpredictable central
locations (see Chapter 3): the characteristics of apical seeds (mostly “losers” that play an
important role only under certain conditions; Braza and García 2011) remained unchanged
with respect to peripheral populations, whereas an increase in size and mucilage production
was observed in basal seeds (mostly “winners”, since population growth basically relies on
them). In addition, plants from central populations produce a larger number of fruits and
fewer seeds per fruit. Considering that fruits themselves may constitute diaspores (personal
observation), this would also help to spread seed germination in space and time, and reduce
the risk of offspring failure.
Finally, P. coronopus presented also a high versatility in the arrangement of the life
cycle. First, we found compensatory changes among vital rates, both between and within
central and peripheral areas, without implying clear increases or decreases in stochastic
population growth rates (see Chapter 2). In addition, the species varied in the timing of the
first reproductive event: plants in central populations became reproductive in their first year
relatively frequently (mean annual percentages range from 6% to 45%), whereas such
yearling reproduction was virtually absent in most peripheral populations (see Chapter 2).
These differences in age at first reproduction, a key parameter in plant life-history (Cole
1954), may be explained by the tendency for higher individual growth in central locations (see
Chapters 1, II), which would allow plants to reach earlier the threshold size for producing
seeds. Similar changes in age-specific demography have been also reported for other
widespread plants, both among (Reinartz 1984) and within populations (Roach 2003).
These findings add to previous knowledge of the variability of P. coronopus in different
biological aspects, such as the existence of annual and perennial populations (Chater and
Cartier 1976), or high variation in outcrossing rates (Wolff et al. 1988), resource allocation
(Waite and Hutchings 1982), and morphological traits (Dodds 1953). Overall, our study
suggests that P. coronopus, and perhaps other widespread plants, may achieve their large
distribution ranges through variation in several ecologically relevant traits, both among and
within populations, and through changes in demographic and life-history strategies at
different spatial scales.

General discussion
96
3. The importance of large-scale integrative analyses
Few detailed ecological studies focused on particular organisms have been carried out at large
temporal and/or spatial scales (but see Reinartz 1984, Horvitz and Schemske 1995, Menges
and Dolan 1998, Angert 2009, Doak and Morris 2010, Wagner et al. 2011). However, large-
scale approaches are very necessary to fully understand the ecology and demography of
species, and their intraspecific variability. For example, determining the intensity of temporal
fluctuations and their long-term effects on population performance is very important in places
with high environmental stochasticity, especially in a context of expected increases in climatic
variability due to global warming (Karl and Trenberth 2003, Salinger 2005). In P. coronopus,
we found indeed that the effect of variability in some vital rates had important consequences
in the stochastic growth rates of several populations (see Chapter 2), and Braza and García
(2011) highlighted the importance of measuring recruitment over several years in this species
to properly understand the role of dimorphic seeds.
Regarding spatial scales, the among-population variability can only be captured by
prospecting a large area of species’ distribution ranges. Inferring the demographic behaviour
from one or a few populations has proved indeed misleading (Frederiksen et al. 2005), and the
high variability found in P. coronopus at both continental and regional scales undoubtedly
confirms this point of view. Ideally, multiple spatial scales should be considered, as there is
evidence of intraspecific variation in plant performance at a huge range of levels, from the
global (Williams 2009) to the very local scale (Miller and Fowler 1994). The present study,
carried out at both continental and regional scales, complements previous research with P.
coronopus, which also showed life-history variability at more local scales (Waite and
Hutchings 1982, Waite 1984, Braza et al. 2010, Braza and García 2011).
Besides large spatio-temporal approaches, the results found in this study showed the
importance of analyzing different sources of information. We have already discussed the
discrepancies between demographic and genetic patterns across the distribution of P.
coronopus. In addition, environmental factors seemed to exert many times a higher influence
on plant performance than the position of populations within the range, as seen above.
Finally, several components of the life cycle responded in different ways to local
environmental conditions. Thus, in agreement with previous studies (Oostermeijer et al. 2003,
Leimu et al. 2006, Montesinos et al. 2009, Noël et al. 2010), we highlight the necessity of
integrating environmental, geographical, demographic and genetic data, and the widest

General discussion
97
possible range of traits, to fully understand intraspecific variation in plant performance. This
might be particularly useful when managing peripheral populations and analyzing their
demographic status and evolutionary potential (Bunnell et al 2004, Gapare et al. 2005).
4. What is next? Considerations for future work
The present study has focused on the northern periphery due to logistic and temporal
limitations, although other margins of the distribution range could show different patterns.
Divergences in demographic performance have been indeed found between northern and
southern boundaries in several US tree species (Purves 2009) and in the short-lived weed
Verbascum thapsus (Reinartz 1984). From a phylogeographic perspective, northern
populations may constitute since last glaciations the leading edge of many species in the
northern hemisphere (Hewitt 1999, Travis and Dytham 2004), whereas southern parts may
remain as the rear edge. Thus, an open question of our study system is whether demographic
and genetic patterns in the southern range margin of P. coronopus are similar to those in the
north. Indeed, the rear edge may also have a relevant role in the ecology and evolution of
species (Hampe and Petit 2005). On the other hand, populations at the eastern margin might
not be expected to behave so differently from central ones, since longitudinal gradients
usually imply smaller environmental changes. However, testing predictions from central-
marginal theories across the longitudinal gradient would provide a more reliable picture of
range-wide species performance.
We have not analyzed genetic differentiation among populations in depth yet, which
could help us to understand processes such as gene flow and isolation among populations
(Slatkin 1987). Such information would also allow us to test whether differences in life-
history traits among populations are more correlated to the degree of neutral genetic
differentiation or to environmental selective factors, as analyzed at the within-population
level. In addition, another interesting issue for future work would be to determine the relative
role of phenotypic plasticity and local adaptation in the observed intraspecific variation in P.
coronopus. Ecotypic differentiation has been reported indeed for some demographic and life-
history traits in the congener P. lanceolata (Van Tienderen and Van der Toorn 1991,
Shefferson and Roach 2012) and in other widespread plants (Bennington and McGraw 1995,
Joshi et al. 2001, Santamaría et al. 2003), and we have carried out some transplant
experiments that will help us to analyze this process in P. coronopus.

General discussion
98
Despite limitations, our study has shown the tremendous variability present across the
range of a widespread plant, which contrasts with the frequent view of species as uniform.
This consideration calls for including intraspecific variation in comparative analyses of
ecological and demographic traits across taxa (Frederiksen et al. 2005). In addition, it may
also improve niche-model predictions of future distribution and abundance of taxa (Pearman
et al. 2010), since unique species-specific responses to the upcoming global changes cannot
be assumed any longer.

99
Conclusions


Conclusions
101
Conclusions
1. In this thesis, we analyzed variation in demographic and life-history traits of the
widespread short-lived herb Plantago coronopus over several years and across most of its
latitudinal range, considering the effects of the central vs. peripheral position of populations,
the main environmental factors, and genetic diversity. This large-scale spatio-temporal
approach provided a representative picture of the natural variability present in the species. In
addition, the combination of different sources of information, and the analysis of a wide range
of life cycle components, allowed us to understand the patterns and causes of such
intraspecific variation, and to test the validity of some ecogeographical and genetic models.
2. Northern peripheral populations of P. coronopus showed lower fecundity and lower genetic
diversity with respect to central ones. However, northern populations had higher densities,
higher recruitment rates, and no differences in either stochastic population growth rates or
temporal variability of vital rates compared with central populations. Thus, our study
confirmed classical predictions of a lower population performance in range edges as concerns
genetic patterns, but not regarding demography. These discrepancies call for caution when
using information from one component of a species’ biology to infer patterns in other
components.
3. A similar trend of demographic differentiation among populations was found within central
and peripheral areas, in close relationship with variation in precipitation regime. These results
suggest that demographic strategies may be characteristic of certain environmental settings,
with independence of the geographical location of populations.
4. A steep environmental gradient along the latitudinal range of P. coronopus seemed also to
underlie among-population variation in reproductive traits at two different levels. At the fruit
level, we found a trade-off between the number of seeds and the allocation of resources to
increase their stress tolerance. At the individual level, variation in plant fecundity would allow
a further adjustment of the life cycle to the local environmental conditions.
5. Phenotypic variation within populations in several vegetative and reproductive traits
showed no correlation with genetic diversity, and was instead correlated with precipitation

Conclusions
102
variability, suggesting adaptive selection. Genetic diversity was related to the location of
populations within the species’ range, probably as a result of past demographic processes that
would have eroded the genetic pool in the northern periphery.
6. Precipitation emerges as the most relevant environmental factor for life-history and
demographic variation across the range of P. coronopus, mainly through its observed effect
on recruitment. Firstly, differences in recruitment success among populations appear to trigger
variation in several life-history traits, such as seed production, seed traits and plant size. In
addition, recruitment seems to have a key role in the differences in densities and stochastic
growth rates among populations.
7. Overall, environmental conditions seemed to have a higher influence in life-history and
demographic variation of P. coronopus than the central vs. peripheral position of populations.
Thus, we advocate for a clear distinction between geographical periphery and ecological
marginality in studies across species’ ranges. In addition, the marginality of populations
should be evaluated by considering the consequences of environmental factors on each
particular vital rate, as conditions in each region may be detrimental for some rates but
favorable for others.
8. Plantago coronopus is a widespread herb with a remarkable variation in ecologically
relevant traits, both among and within populations, and in demographic and life-history
patterns at different spatial scales. The species presents different mechanisms to cope with the
steep environmental gradient present from North Africa to North Europe, such as bet-hedging
strategies associated with seed production, and compensatory changes in vital rates. Such high
ecological and demographic versatility seems to be the key to success in widespread plants
over their large and heterogeneous ranges, and should be considered in niche-models
predicting the future distribution and abundance of species.

103
Resumen


Resumen
105
Resumen
1. Introducción general y objetivos del estudio
Las especies de amplia distribución han recibido tradicionalmente menor atención que las
especies raras o endémicas, a pesar de que son también relativamente poco frecuentes, y
presentan en algunos casos un claro declive en sus poblaciones. Por otra parte, las especies de
amplia distribución tienen una gran importancia ecológica, por ejemplo en la estructura y el
funcionamiento de los ecosistemas. Por tanto, el estudio de las características que permitirían
a estos organismos expandirse a lo largo de extensos rangos tiene un gran interés desde un
punto de vista tanto teórico como aplicado.
Las plantas de amplia distribución parecen tener algunas características reproductivas
típicas, como una predominancia de la reproducción sexual y una gran capacidad de
dispersión, además de mayores tasas de crecimiento poblacional en comparación con taxones
de distribución restringida. Una de las hipótesis más frecuentes para explicar el éxito de las
plantas de amplia distribución es la posesión de una gran amplitud de nicho, y por tanto de
una gran variabilidad ecológica, demográfica y de historia vital (del inglés, life history), y
posiblemente una gran variabilidad genética. Sin embargo, la literatura científica muestra
evidencias contradictorias respecto a estas generalizaciones.
Los gradientes geográficos y medioambientales son escenarios muy apropiados para
entender las características y el funcionamiento de las plantas de amplia distribución. Por una
parte, numerosos estudios han demostrado importantes efectos de la variación en el clima, las
características del suelo, o el estrés ambiental, a lo largo de gradientes espaciales, sobre
diversos atributos de las plantas. Por otra parte, las fluctuaciones temporales en estos factores
medioambientales ejercen un papel fundamental en la evolución de las life history y en la
demografía de las plantas, aunque todavía se necesitan análisis pormenorizados sobre el
efecto de la variación de las tasas vitales sobre las tasas de crecimiento poblacional.
La posición de las poblaciones dentro del rango de distribución de las especies y los
efectos de esta posición sobre el comportamiento de las mismas constituyen un objeto
recurrente de debate. Tradicionalmente se ha predicho un peor funcionamiento de las
poblaciones periféricas, ya que se asumen unas condiciones ambientales más desfavorables en
la periferia respecto a la parte central. Sin embargo, recientes revisiones han encontrado una

Resumen
106
ausencia de patrones generalizados en cuanto a comportamiento demográfico, aunque parece
haberse confirmado la hipótesis de una menor variación genética en las poblaciones
periféricas. En este contexto, la catalogación de las poblaciones como periféricas o marginales
en base a factores ecológicos y medioambientales, y no sólo geográficos, podría ser de gran
ayuda. Por último, el análisis comparativo de la magnitud y las causas de la variación
fenotípica vs. genética en las poblaciones centrales y periféricas puede ser de gran utilidad
para esclarecer procesos históricos y de adaptación en las especies de amplia distribución.
Para este estudio, hemos elegido una especie de amplio rango geográfico y corta vida:
Plantago coronopus L ssp. coronopus. Se trata de una planta herbácea presente en Europa, el
norte de África y el suroeste de Asia, en una gran diversidad de hábitats. La especie presenta
poblaciones anuales y perennes, y una gran variabilidad en características como la morfología
de las hojas, el sistema reproductivo (ginodioecia), o la tasa de autogamia. Además, P.
coronopus produce dos tipos de semillas con diferentes características morfológicas y
ecológicas. Por último, diversos estudios han encontrado que las tasas vitales de la especie se
ven afectadas por factores intrínsecos, como el tamaño de planta o la densidad de individuos,
y extrínsecos, como la disponibilidad de agua o nutrientes.
Para entender de manera integral las causas de variabilidad intraespecífica en caracteres
fenotípicos o del ciclo vital, se necesitan análisis con escalas espacio-temporales amplias. Por
ello, en este estudio examinamos la variación demográfica, genética y de historia vital en 22
poblaciones de P. coronopus a lo largo de gran parte de su rango latitudinal. Además,
llevamos a cabo una monitorización demográfica intensiva durante cuatro años en cuatro
poblaciones del centro del área de distribución de la especie, y seis poblaciones en la periferia
norte, donde recogimos datos de campo. En estas poblaciones, y en otras poblaciones
adicionales en Europa y el norte de África, también recolectamos material para los análisis
genéticos y de producción de semillas. Finalmente, aprovechamos la información de estudios
previos con P. coronopus para ampliar aún más el rango espacial y temporal del trabajo.
Como objetivos concretos de esta tesis, pretendemos 1) testar las teorías clásicas
asociadas al comportamiento de las poblaciones centrales y periféricas en cuanto a densidad,
tasas vitales y fluctuaciones temporales en las mismas, y tasas de crecimiento poblacional; 2)
analizar el efecto de las condiciones ambientales en el comportamiento general de las
poblaciones y en caracteres de relevancia ecológica como el tamaño de planta, la fecundidad y
el tamaño de las semillas; y 3) explorar las causas de la variación fenotípica y genética dentro

Resumen
107
de las poblaciones, considerando como factores las condiciones medioambientales y la
posición geográfica de las poblaciones. El objetivo global es analizar la variación demográfica
y de historia vital en P. coronopus, en relación con factores geográficos, ambientales y
genéticos, con el fin de obtener una mejor comprensión de las causas que determinan el éxito
de las especies de amplia distribución.
2. Publicaciones
Capítulo 1
Tradicionalmente se ha considerado que las poblaciones periféricas de las especies presentan
menores tasas vitales, mayores fluctuaciones demográficas y menores densidades que las
poblaciones centrales. Sin embargo, investigaciones recientes han cuestionado la generalidad
de tales patrones geográficos. Con el fin de testar estas hipótesis, monitorizamos cinco
poblaciones centrales y seis poblaciones de la periferia norte de una planta herbácea de amplia
distribución (Plantago coronopus) a lo largo de la costa atlántica europea durante 5 años.
Estimamos la densidad poblacional y calculamos los valores medios y la variabilidad
temporal de cuatro tasas vitales (supervivencia, crecimiento individual, fecundad y
reclutamiento) en centenares de plantas en parcelas permanentes dentro de cada población.
Las poblaciones centrales mostraron una mayor fecundidad, mientras que el reclutamiento fue
mayor en las poblaciones periféricas, indicando un mayor éxito reproductivo final en la
periferia. Las poblaciones centrales mostraron mayores tasas de crecimiento individual
(marginalmente significativo) que las periféricas, y no hubo diferencias entre ambas
posiciones del rango en cuanto a supervivencia. La fecundidad y el crecimiento se vieron
afectadas por la competencia intraespecífica, y el reclutamiento por la precipitación,
resultados que destacan la importancia de las condiciones ambientales locales para el
comportamiento de las poblaciones. Las poblaciones centrales y periféricas no mostraron
diferencias significativas en cuanto a la variabilidad temporal en las tasas vitales. Finalmente,
la densidad fue significativamente mayor en las localidades periféricas, en discrepancia con el
abundant-centre model (modelo del “centro abundante”). La densidad mostró una correlación
con el reclutamiento, el cual compensaría en las poblaciones periféricas la menor fecundidad
y la tendencia hacia un menor crecimiento de las plantas ya establecidas. Tales
compensaciones entre tasas vitales podrían ser comunes en taxones de amplia distribución, y
desacreditan posibles asunciones simplistas sobre el comportamiento de las poblaciones a lo

Resumen
108
largo del rango de distribución de las especies. Los análisis demográficos deberían considerar
el ciclo vital entero de las plantas, ya que el fitness de las poblaciones puede venir
determinado por ajustes entre diferentes tasas vitales. Nuestros resultados muestran también la
importancia de distinguir entre periferia geográfica y marginalidad ecológica. En un contexto
de cambios en la distribución de las especies motivados por el clima, estas consideraciones
son cruciales para la fiabilidad de los modelos de nicho y para la gestión de las poblaciones
periféricas.
Capítulo 2
Analizar la variación intraespecífica en la dinámica poblacional en relación con los factores
medioambientales es crucial para entender la distribución presente y futura de las plantas.
Dentro del área de distribución de las especies, con frecuencia se predice que las poblaciones
periféricas presentan unas menores y más variables tasas vitales que las poblaciones centrales,
aunque se suele desconocer cómo contribuyen estas tasas vitales a las diferencias registradas
en las tasas de crecimiento poblacional. Además, se han llevado a cabo pocos estudios a
escala tanto continental como regional que consideren la estocasticidad ambiental. En el
presente trabajo, calculamos la tasa de crecimiento estocástico en cinco poblaciones centrales
y seis poblaciones de la periferia norte de una especie de amplia distribución y corta vida,
Plantago coronopus, a lo largo de la costa atlántica en Europa. Para evaluar a dos escalas
espaciales (continental y regional) cómo los valores medios y la variabilidad de las tasas
vitales (fecundidad, reclutamiento, supervivencia, crecimiento y decrecimiento) contribuyeron
a las diferencias en la tasa de crecimiento poblacional estocástico, realizamos un análisis
SLTRE (del inglés, Stochastic Life Table Response Experiment) entre las regiones central y
periférica y dentro de cada una de ellas. También analizamos las correlaciones entre las
contribuciones de las tasas y las condiciones ambientales locales. Las poblaciones periféricas
mostraron unos valores menores y una mayor variabilidad en algunas tasas vitales, pero de
manera global, no se encontraron diferencias significativas en las tasas de crecimiento
poblacional estocástico entre regiones. La importancia de los diversos componentes del ciclo
vital en las diferencias en las tasas de crecimiento poblacional varió según la escala espacial
analizada, aunque el reclutamiento fue la tasa vital con mayor influencia tanto entre regiones
como dentro de ellas. Por otra parte, se encontró el mismo patrón de diferenciación
demográfica entre poblaciones dentro de las regiones central y periférica: en ambas, se
encontró un grupo de poblaciones con contribuciones positivas del crecimiento y el

Resumen
109
decrecimiento, y contribuciones negativas del reclutamiento y la supervivencia, presentando
el resto de poblaciones el patrón contrario. Por último se encontró que, dentro de cada región,
el patrón de diferenciación entre poblaciones estaba correlacionado con el régimen de
precipitación de las poblaciones, mientras que las diferencias a escala continental se
relacionaron con las diferencias en temperatura. Globalmente, nuestros resultados muestran
una notable variabilidad entre poblaciones en el ciclo vital de P. coronopus, que parece tener
un papel relevante en su persistencia en ambientes muy diferentes. Esta flexibilidad
demográfica podría explicar el éxito de algunas especies a lo largo de amplias y heterogéneas
áreas de distribución.
Capítulo 3
La coexistencia de especies con tamaños de semilla diferentes constituye un tema recurrente
de debate en ecología de comunidades, y para explicar este fenómeno en ambientes
heterogéneos se ha propuesto recientemente un compromiso (trade-off) entre fecundidad y
tolerancia al estrés. En este estudio se analiza por primera vez una extensión intraespecífica de
este modelo, con el objetivo de evaluar si dicho compromiso también permite entender la
variación interpoblacional en la producción de semillas en especies de amplia distribución
bajo gradientes de estrés. Recolectamos semillas de 14 poblaciones de P. coronopus a lo largo
de la costa atlántica en el norte de África y en Europa. Esta planta presenta dimorfismo en las
semillas, produciendo semillas basales grandes, con una cubierta mucilaginosa que facilita la
absorción de agua (semillas más tolerantes al estrés), y semillas apicales pequeñas que
carecen de dicha cubierta (semillas menos tolerantes al estrés). Analizamos la variación entre
poblaciones en cuanto a número, tamaño y producción de mucílago de las semillas basales y
apicales, e investigamos su posible relación con las condiciones ambientales locales y el
tamaño de los individuos. Las poblaciones con mayor estrés (mayor temperatura, menor
precipitación y menor materia orgánica en el suelo) produjeron menos semillas por fruto, un
mayor predominio de semillas basales respecto a apicales, y semillas basales más grandes y
con mayor producción de mucílago. Estos resultados sugieren que un trade-off entre
fecundidad y tolerancia a nivel de fruto podría explicar la variación en la producción y en las
características de las semillas entre las poblaciones de P. coronopus. Por otra parte, se
encontró que la producción total de semillas a nivel de individuo, con un patrón opuesto a la
producción a nivel de fruto, estaba más relacionada con el tamaño de planta y con otros
componentes del ciclo vital, como una estrategia adicional de la especie para adaptarse al

Resumen
110
gradiente ambiental existente a lo largo de su distribución. El modelo de la fecundad-
tolerancia podría constituir, bajo gradientes de estrés, un marco ecológico complementario al
clásico compromiso entre el número y el tamaño de semillas. Deberían considerarse, no
obstante, los diferentes niveles de fecundidad, y diferentes caracteres de las semillas, con el
fin de entender las estrategias que presentan las plantas de amplia distribución para optimizar
su fitness a lo largo de gradientes ambientales.
Capítulo 4
Analizar los patrones y las causas de la variación fenotípica y genotípica dentro de las
poblaciones puede ayudar a entender la variabilidad natural presente en las especies, y a
predecir sus respuestas a cambios en las condiciones ambientales. En este estudio
comparamos la variación fenotípica y la diversidad genética en la especie herbácea de amplia
distribución Plantago coronopus a lo largo de todo su gradiente latitudinal en Europa, en
relación con factores medioambientales y geográficos. La diversidad genética se estimó en 18
poblaciones a partir de marcadores moleculares AFLP (del inglés, Amplified Fragment Length
Polymorphism), y la variabilidad fenotípica se analizó en un subconjunto de 11 poblaciones,
en seis caracteres de relevancia ecológica (tamaño de planta, tasa de crecimiento individual,
fecundidad, tamaño de semilla, producción de mucílago y ratio entre dos tipos de semilla).
También estimamos la variabilidad local en factores ambientales como la temperatura, la
precipitación y la competencia intraespecífica, y consideramos la posición central o periférica
de las poblaciones. La variación fenotípica y la diversidad genética no presentaron una
correlación significativa dentro de poblaciones a lo largo del rango de distribución. La
variación fenotípica se correlacionó, en cambio, con la variabilidad en la precipitación, y la
diversidad genética mostró una relación significativa con la posición de las poblaciones, lo
que indica que ambos tipos de variación parecen estar modulados por procesos diferentes. El
régimen de precipitación parece haber actuado como un agente selectivo para la variación
dentro de poblaciones en la mayoría de los caracteres ecológicos, mientras que probablemente
algunos procesos demográficos históricos han reducido la diversidad genética neutral en las
poblaciones periféricas respecto a las centrales. La correlación positiva entre la variabilidad
en la precipitación y la variación fenotípica también sugiere que las poblaciones de especies
vegetales podrían desarrollar un mayor potencial adaptativo en ambientes variables respecto a
unas condiciones más estables. Nuestro estudio ofrece un criterio adicional a la hora de
predecir la futura distribución de las especies ante cambios ambientales.

Resumen
111
3. Discusión global y conclusiones
En esta tesis hemos analizado la variación en aspectos demográficos y de life-history en la
planta herbácea de amplia distribución Plantago coronopus durante varios años y a lo largo
de gran parte de su rango latitudinal, considerando los efectos de la posición central vs.
periférica de las poblaciones, los principales factores ambientales y la diversidad genética.
Esta aproximación a gran escala espacio-temporal nos ha proporcionado una buena visión de
la variación natural presente en esta especie. Además, la combinación de diferentes fuentes de
información y el análisis de un amplio rango de componentes del ciclo vital nos han permitido
entender los patrones y las causas de dicha variación y testar la validez de algunos modelos
ecogeográficos y genéticos.
Las poblaciones de la periferia norte presentaron unas menores tasas de fecundidad (ver
Capítulo 1) y una menor diversidad genética (ver Capítulo 4) que las poblaciones centrales.
Sin embargo, las poblaciones del norte presentaron una mayor densidad y mayores tasas de
reclutamiento, y no difirieron respecto a las poblaciones centrales en cuanto a tasas de
crecimiento poblacional estocástico ni en la variabilidad temporal en las tasas vitales (ver
Capítulos 1,2). Por lo tanto, nuestro estudio confirma las predicciones clásicas para las
poblaciones en la periferia desde un punto de vista genético, pero no desde una perspectiva
demográfica. Estas discrepancias muestran los riesgos de utilizar los resultados de un
componente de la biología de las especies para inferir patrones en otro componente.
Los factores medioambientales tuvieron una gran influencia en P. coronopus tanto en
caracteres individuales como en parámetros poblacionales. El tamaño de semilla, por ejemplo,
considerado tradicionalmente como un carácter poco variable dentro de las especies, mostró
una gran variabilidad entre poblaciones a lo largo del gradiente medioambiental (ver Capítulo
3). En cuanto a parámetros poblacionales, se encontró un mismo patrón de diferenciación
demográfica dentro de las regiones central y periférica, en función de las contribuciones de las
tasas vitales a las tasas de crecimiento poblacional estocástico, y en respuesta a cambios en el
régimen de precipitaciones (ver Capítulo 2). Este resultado sugiere que cada conjunto de
condiciones ambientales podría llevar asociadas ciertas estrategias demográficas.
Diversos factores medioambientales analizados, como la temperatura, la competencia
intraespecífica o la fertilidad del suelo, tuvieron efectos sobre los individuos y las poblaciones
de P. coronopus. Sin embargo, la precipitación, tanto en cuanto a valores medios como a
variabilidad, parece tener el papel más importante en la variación intraespecífica encontrada

Resumen
112
en caracteres demográficos y de historia vital. Este efecto parece manifestarse principalmente
a través de su influencia en el reclutamiento (ver Capítulo 1). Por una parte, un menor
reclutamiento en las poblaciones centrales respecto a las periféricas, debido a una falta de
disponibilidad de agua en las dunas, podría haber promovido una serie de cambios en diversos
caracteres reproductivos, como una mayor tolerancia de las semillas al estrés hídrico y una
mayor producción total de semillas para aumentar las posibilidades de germinación (ver
Capítulo 3). Por otra parte, la precipitación también podría afectar a parámetros demográficos,
ya que se encontró que el reclutamiento de nuevos individuos tenía una gran influencia en la
densidad de plantas adultas (ver Capítulo 1) y en las tasas de crecimiento poblacional
estocástico (ver Capítulo 2).
La variación fenotípica dentro de las poblaciones en diversos caracteres vegetativos y
reproductivos no mostró una correlación con la diversidad genética, y sí mostró en cambio
una correlación con la variabilidad ambiental, sugiriendo un proceso de adaptación selectiva
(ver Capítulo 4). La diversidad genética se correlacionó mejor con la posición de las
poblaciones dentro del rango de la especie, probablemente como resultado de los procesos
demográficos ocurridos en el pasado y que habrían reducido la variación genética en la
periferia.
Globalmente, por tanto, las condiciones ambientales parecen tener una mayor influencia
en la variación demográfica y de historia vital de P. coronopus que la posición de las
poblaciones dentro del rango de la especie. De hecho, parece necesario evaluar si las
poblaciones que ocupan posiciones geográficas periféricas también experimentan unas
condiciones ambientales marginales, ya que numerosos estudios, entre ellos el nuestro,
muestran que algunas especies podrían ocupar hábitats favorables incluso en las áreas
periféricas de los rangos. En cualquier caso, parece aconsejable testar empíricamente el patrón
de cada especie, y analizar para ello el efecto de las condiciones ambientales en un amplio
rango de tasas vitales, ya que las condiciones favorables para una determinada tasa vital
podrían ser perjudiciales para otra.
Plantago coronopus parece presentar una gran diversidad de mecanismos para adaptarse
al marcado gradiente medioambiental existente desde el norte de África hasta el norte de
Europa. En primer lugar, presenta un dimorfismo de semillas más acentuado en las
poblaciones centrales, de condiciones ambientales más impredecibles, con el objetivo de
incrementar las posibilidades de éxito de la descendencia, una estrategia denominada bet-

Resumen
113
hedging (del inglés, apuesta segura). En segundo lugar, la variabilidad dentro de poblaciones
en algunos caracteres vegetativos y reproductivos parece estar correlacionado con el grado de
variabilidad en las condiciones ambientales locales. En tercer lugar, P. coronopus presenta
cambios compensatorios en las diversas tasas vitales que componen su ciclo de vida
(fecundidad, crecimiento, supervivencia y reclutamiento). De manera global, nuestro estudio
sugiere que la clave del éxito de esta y otras especies de amplia distribución residiría en una
gran variabilidad intra- e inter-poblacional en diversos caracteres de relevancia ecológica, y
en cambios demográficos a diferentes escalas espaciales.
Finalmente, nuestro estudio deja una serie de campos abiertos para la investigación.
Desde un punto de vista filogeográfico, sería interesante analizar el comportamiento de las
poblaciones en otras zonas periféricas, al sur y al este del rango de distribución de P.
coronopus. Asimismo, se podría realizar un análisis más detallado de los procesos de
diferenciación genética entre poblaciones a lo largo del rango, y del papel de fenómenos como
la plasticidad fenotípica y la adaptación local a la hora de determinar la variación encontrada
en esta especie.


115
Report of the supervisor


Report of the supervisor
117
Report of the supervisor
Dr. María Begoña García, supervisor of the Doctoral Thesis presented by Jesús Villellas
Ariño, certifies that the four studies included in this work have been submitted to
international, well recognized journals by the scientific community, with peer review.
The first two chapters have been accepted in two journals that are ranked in the first
quartil (Q1) of the “Ecology” category according to the JCR published in 2011. The first one
is online since February 2012 in Ecography, which has an Impact Factor (IF) of 4.188 (5.54
in the last five years) and it is edited by the Nordic Ecological Society. This journal is
positioned as 26th of 133 listed in that category, and 4th out of 37 journals in the “Biodiversity
and conservation” category. The second paper was recently accepted by Ecology, a journal of
long tradition, published by the Ecological Society of America (ESA). It is ranked as 19th out
133 journals (Q1), with an IF of 4.85 (6.01 in the last five years). The third chapter is online
since November 2012, in this case in a journal edited by the German Ecological Society:
Plant Biology, which has an impact factor of 2.40 and is ranked as 54 of 189 journals in the
category of “Plant Biology” (Q2). The last study has bee recently submitted (currently under
review) to a quite new journal of the ESA family: Ecosphere. This online, open-access
journal started in 2010, and that is the reason it has not IF yet.
Dr. María Begoña García certifies that all the four studies presented by Jesús Villellas in
this Doctoral thesis have been leaded by him under my supervision. In this way, J. Villellas
demonstrates full capacity to develop independent and high quality research in the field of
Ecology.
Chapter 1.
Villellas, J., J. Ehrlén, J. M. Olesen, R. Braza, and M. B. García (in press). Plant
performance in central and northern peripheral populations of the widespread Plantago
coronopus. Ecography, doi: 10.1111/j.1600-0587.2012.07425.x.
Contributions: in this paper, J. Villellas carried out most of the extensive fieldwork
required across Europe for 4 years, and was the main responsible for the analysis of the data
and the writing of the paper. Coauthors participated in the experimental design (MBG),

Report of the supervisor
118
assisted occasionally with fieldwork (MBG, RB, JMO, JE) and advised with statistical
analyses and during manuscript writing (MBG, JE).
Chapter 2.
Villellas, J., W. F. Morris, and M. B. García (in press). Variation in stochastic
demography between and within central and peripheral regions in a widespread short-lived
herb. Ecology.
Contributions: J. Villellas carried out most of the extensive fieldwork necessary for this
the paper, being also the main responsible of statistical and demographic analysis and
manuscript redaction. He also participated in the design, whereas couthors helped him during
the fieldwork (MBG), data analysis (WFM), and the writing of the paper (WFM, MBG).
Chapter 3.
Villellas, J., and M. B. García (in press). The role of the tolerance-fecundity trade-off in
maintaining intraspecific seed trait variation in a widespread dimorphic herb. Plant Biology,
doi: 10.1111/j.1438-8677.2012.00684.x.
Contributions: the role of J. Villellas in this paper spanned from fieldwork and
laboratory measurements, till statistical analysis and writing. MBG participated in the design
and advised for data analysis and manuscript writing.
Chapter 4.
Villellas, J., R. Berjano, A. Terrab, and M. B. García (in review). Environmental,
genetic and geographical correlates of phenotypic variation within populations of a common
herb in Europe. Ecosphere.
Contributions: J. Villellas leaded most of the phases of this eco-genetic study. He did
fieldwork over years in most populations, participated in the genetic analysis, analysed field
data and their correlation with genetics, and wrote the paper. Coauthors helped with
experimental design (MBG), fieldwork (MBG), genetic analysis (RB, AT), and advise during
writing (MBG, AT).

Report of the supervisor
119
Besides these four papers, J. Villellas is participating in another manuscript on a related
topic of the same studied system, which will be hopefully submitted soon to an international
Journal. He will be also co-author of any potential paper using the information gathered over
years for Plantago coronopus. I finally certify that none of the coauthors has used, in any
form, the studies presented here for another Doctoral Thesis.
Zaragoza, January 2013
Mª Begoña García González
Instituto Pirenaico de Ecología (CSIC)


121
References


References
123
References
Angert, A. L. 2009. The niche, limits to species’ distributions, and spatiotemporal variation in demography across the elevation ranges of two monkeyflowers. Proceedings of the National Academy of Sciences of the United States of America 106:19693-19698.
Baker, H. G. 1972. Seed weight in relation to environmental conditions in California. Ecology 53:997-1010.
Baker, H. G. 1974. The evolution of weeds. Annual Review of Ecology and Systematics 5:1-24. Bennington, C. C., and J. B. McGraw. 1995. Natural selection and ecotypic differentiation in
Impatiens pallida. Ecological Monographs 65:303-323. Braza, R., J. Arroyo, and M. B. García. 2010. Natural variation of fecundity components in a
widespread plant with dimorphic seeds. Acta Oecologica-International Journal of Ecology 36:471-476.
Braza, R., and M. B. García. 2011. Spreading recruitment over time to cope with environmental variability. Plant Ecology 212:283-292.
Brown, J., N. J. Enright, and B. P. Miller. 2003. Seed production and germination in two rare and three common co-occurring Acacia species from south-east Australia. Austral Ecology 28:271-280.
Brown, J. H. 1984. On the relationship between abundance and distribution of species. American Naturalist 124:255-279.
Brussard, P. F. 1984. Geographic patterns and environmental gradients: the central-marginal model in Drosophila revisited. Annual Review of Ecology and Systematics 15:25-64.
Bunker, D. E., F. DeClerck, J. C. Bradford, R. K. Colwell, I. Perfecto, O. L. Phillips, M. Sankaran, and S. Naeem. 2005. Species loss and aboveground carbon storage in a tropical forest. Science 310:1029-1031.
Bunnell, F. L., R. W. Campbell, and K. A. Squires. 2004. Conservation priorities for peripheral species: the example of British Columbia. Canadian Journal of Forest Research 34:2240-2247.
Burgman, M. A. 1989. The habitat volumes of scarce and ubiquitous plants: a test of the model of environmental control. American Naturalist 133:228-239.
Byers, D. L., and T. R. Meagher. 1997. A comparison of demographic characteristics in a rare and a common species of Eupatorium. Ecological Applications 7:519-530.
Callaway, R. M., R. W. Brooker, P. Choler, Z. Kikvidze, C. J. Lortie, R. Michalet, L. Paolini, F. I. Pugnaire, B. Newingham, E. T. Aschehoug, C. Armas, D. Kikodze, and B. J. Cook. 2002. Positive interactions among alpine plants increase with stress. Nature 417:844-848.
Carey, P. D., A. R. Watkinson, and F. F. O. Gerard. 1995. The determinants of the distribution and abundance of the winter annual grass Vulpia ciliata ssp. ambigua. Journal of Ecology 83:177-187.
Caswell, H. 2001. Matrix Population Models. Construction, Analysis and Interpretation. 2nd edition. Sinauer, Sunderland, MA, USA.
Chapin III, F. S., K. Autumn, and F. Pugnaire. 1993. Evolution of suites of traits in response to environmental stress. American Naturalist 142:S78-S92.
Chater, A. O., and D. Cartier. 1976. Plantago L. Pages 38-44 in T. G. Tutin, V. H. Heywood, N. A. Burges, D. M. Moore, D. H. Valentine, S. M. Walters, and D. A. Webb, editors. Flora Europaea. Cambridge University Press, Cambridge.
Cohen, D. 1966. Optimizing reproduction in a randomly varying environment. Journal of Theoretical Biology 12:119-129.
Cole, C. T. 2003. Genetic variation in rare and common plants. Annual Review of Ecology Evolution and Systematics 34:213-237.

References
124
Cole, L. C. 1954. The population consequences of life history phenomena. Quarterly Review of Biology 29:103-137.
Coomes, D. A., and P. J. Grubb. 2003. Colonization, tolerance, competition and seed-size variation within functional groups. Trends in Ecology & Evolution 18:283-291.
Curnutt, J. L., S. L. Pimm, and B. A. Maurer. 1996. Population variability of sparrows in space and time. Oikos 76:131-144.
Cwynar, L. C., and G. M. MacDonald. 1987. Geographical variation of lodgepole pine in relation to population history. American Naturalist 129:463-469.
Davison, R., H. Jacquemyn, D. Adriaens, O. Honnay, H. de Kroon, and S. Tuljapurkar. 2010. Demographic effects of extreme weather events on a short-lived calcareous grassland species: stochastic life table response experiments. Journal of Ecology 98:255-267.
De Frenne, P., B. J. Graae, A. Kolb, A. Shevtsova, L. Baeten, J. Brunet, O. Chabrerie, S. A. O. Cousins, G. Decocq, R. Dhondt, M. Diekmann, R. Gruwez, T. Heinken, M. Hermy, M. Oster, R. Saguez, S. Stanton, W. Tack, M. Vanhellemont, and K. Verheyen. 2011. An intraspecific application of the leaf-height-seed ecology strategy scheme to forest herbs along a latitudinal gradient. Ecography 34:132-140.
Doak, D. F., and W. F. Morris. 2010. Demographic compensation and tipping points in climate-induced range shifts. Nature 467:959-962.
Dodds, J. G. 1953. Plantago coronopus L. Journal of Ecology 41:467-478. Dowling, R. E. 1933. The reproduction of Plantago coronopus: an example of morphological and
biological seed dimorphism. Annals of Botany 47:861-872. Eckert, C. G., K. E. Samis, and S. C. Lougheed. 2008. Genetic variation across species' geographical
ranges: the central-marginal hypothesis and beyond. Molecular Ecology 17:1170-1188. Eckstein, R. L., J. Danihelka, N. Holzel, and A. Otte. 2004. The effects of management and
environmental variation on population stage structure in three river-corridor violets. Acta Oecologica-International Journal of Ecology 25:83-91.
Emery, S. M., and K. L. Gross. 2007. Dominant species identity, not community evenness, regulates invasion in experimental grassland plant communities. Ecology 88:954-964.
Fiedler, P. L. 1987. Life history and population dynamics of rare and common mariposa lilies (Calochortus Pursh, Liliaceae). Journal of Ecology 75:977-995.
Franks, S. J., and A. E. Weis. 2008. A change in climate causes rapid evolution of multiple life-history traits and their interactions in an annual plant. Journal of Evolutionary Biology 21:1321-1334.
Frederiksen, M., M. P. Harris, and S. Wanless. 2005. Inter-population variation in demographic parameters: a neglected subject? Oikos 111:209-214.
Friesberg C.H., M. B. García, and B. K. Ehlers. (in press). Drought accentuates the trade-off between reproduction and growth in Plantago coronopus: implications for life history evolution. Journal of Evolutionary Biology.
Gapare, W. J., S. N. Aitken, and C. E. Ritland. 2005. Genetic diversity of core and peripheral Sitka spruce (Picea sitchensis (Bong.) Carr) populations: implications for conservation of widespread species. Biological Conservation 123:113-123.
García, D., R. Zamora, J. M. Gómez, P. Jordano, and J. A. Hodar. 2000. Geographical variation in seed production, predation and abortion in Juniperus communis throughout its range in Europe. Journal of Ecology 88:436-446.
García, M. B., F. X. Pico, and J. Ehrlén. 2008. Life span correlates with population dynamics in perennial herbaceous plants. American Journal of Botany 95:258-262.
Gaston, K. J. 2003. The structure and dynamics of geographic ranges. Oxford University Press, Oxford.

References
125
Gaston, K. J. 2009. Geographic range limits: achieving synthesis. Proceedings of the Royal Society B-Biological Sciences 276:1395-1406.
Gaston, K. J. 2010. Valuing Common Species. Science 327:154-155. Gaston, K. J. 2011. Common Ecology. Bioscience 61:354-362. Gaston, K. J., S. L. Chown, and K. L. Evans. 2008. Ecogeographical rules: elements of a synthesis.
Journal of Biogeography 35:483-500. Gaston, K. J., and R. A. Fuller. 2007. Biodiversity and extinction: losing the common and the
widespread. Progress in Physical Geography 31:213-225. Gaston, K. J., and R. A. Fuller. 2008. Commonness, population depletion and conservation biology.
Trends in Ecology & Evolution 23:14-19. Gillespie, J. H. 1977. Natural selection for variances in offspring numbers: a new evolutionary
principle. American Naturalist 111:1010-1014. Gitzendanner, M. A., and P. S. Soltis. 2000. Patterns of genetic variation in rare and widespread plant
congeners. American Journal of Botany 87:783-792. Grant, M. C., and J. Antonovics. 1978. Biology of ecologically marginal populations of Anthoxanthum
odoratum. I. Phenetics and dynamics. Evolution 32:822-838. Grime, J. P. 1977. Evidence for the existence of three primary strategies in plants and its relevance to
ecological and evolutionary theory. American Naturalist 111:1169-1194. Gutterman, Y., and S. ShemTov. 1996. Structure and function of the mucilaginous seed coats of
Plantago coronopus inhabiting the Negev Desert of Israel. Israel Journal of Plant Sciences 44:125-133.
Hampe, A., and R. J. Petit. 2005. Conserving biodiversity under climate change: the rear edge matters. Ecology Letters 8:461-467.
Hamrick, J. L., H. M. Blanton, and K. J. Hamrick. 1989. Genetic structure of geographically marginal populations of ponderosa pine. American Journal of Botany 76:1559-1568.
Hamrick, J. L., and M. J. W. Godt. 1996. Effects of life history traits on genetic diversity in plant species. Philosophical Transactions of the Royal Society of London Series B-Biological Sciences 351:1291-1298.
Harper, J. L., and R. A. Benton. 1966. Behaviour of seeds in soil II. The germination of seeds on the surface of a water supplying substrate. Journal of Ecology 54:151-166.
Harper, J. L., P. H. Lovell, and K. G. Moore. 1970. The shapes and sizes of seeds. Annual Review of Ecology and Systematics 1:327-356.
Hasegawa, K., J. Mizutani, S. Kosemura, and S. Yamamura. 1992. Isolation and identification of lepidimoide, a new allelopathic substance from mucilage of germinated cress seeds. Plant Physiology 100:1059-1061.
Hegde, S. G., and N. C. Ellstrand. 1999. Life history differences between rare and common flowering plant species of California and the British Isles. International Journal of Plant Sciences 160:1083-1091.
Hengeveld, R., and J. Haeck. 1982. The distribution of abundance .1. Measurements. Journal of Biogeography 9:303-316.
Herlihy, C. R., and C. G. Eckert. 2005. Evolution of self-fertilization at geographical range margins? A comparison of demographic, floral, and mating system variables in central vs. peripheral populations of Aquilegia canadensis (Ranunculaceae). American Journal of Botany 92:744-751.
Hester, M. W., I. A. Mendelssohn, and K. L. McKee. 1998. Intraspecific variation in salt tolerance and morphology in Panicum hemitomon and Spartina alterniflora (Poaceae). International Journal of Plant Sciences 159:127-138.
Hewitt, G. M. 1999. Post-glacial re-colonization of European biota. Biological Journal of the Linnean Society 68:87-112.

References
126
Holderegger, R., U. Kamm, and F. Gugerli. 2006. Adaptive vs. neutral genetic diversity: implications for landscape genetics. Landscape Ecology 21:797-807.
Holt, R. D., and T. H. Keitt. 2000. Alternative causes for range limits: a metapopulation perspective. Ecology Letters 3:41-47.
Horvitz, C. C., and D. W. Schemske. 1995. Spatiotemporal variation in demographic transitions of a tropical understory herb: projection matrix analysis. Ecological Monographs 65:155-192.
Hultén, E., and M. Fries. 1986. Atlas of North European vascular plants. North of the Tropic of Cancer. Maps 1-996. Koeltz Scientific Books, Konigstein.
Hutchings, M. J., and S. Waite. 1985. Cohort behaviour and environmental determination of life histories within a natural population of Plantago coronopus L. Pages 171–184 in J. Haeck and J. W. Woldendorp, editors. Structure and functioning of plant populations II. Phenotypic and genotypic variation in plant populations. North-Holland Publishing, Amsterdam.
Imbert, E. 2002. Ecological consequences and ontogeny of seed heteromorphism. Perspectives in Plant Ecology Evolution and Systematics 5:13-36.
Jaccard, P. 1912. The distribution of the flora in the alpine zone. New Phytologist 11:37-50. Jetz, W., and C. Rahbek. 2002. Geographic range size and determinants of avian species richness.
Science 297:1548-1551. Johnson, M. P., and S. A. Cook. 1968. Clutch size in buttercups. American Naturalist 102:405-&. Joshi, J., B. Schmid, M. C. Caldeira, P. G. Dimitrakopoulos, J. Good, R. Harris, A. Hector, K. Huss-
Danell, A. Jumpponen, A. Minns, C. P. H. Mulder, J. S. Pereira, A. Prinz, M. Scherer-Lorenzen, A. S. D. Siamantziouras, A. C. Terry, A. Y. Troumbis, and J. H. Lawton. 2001. Local adaptation enhances performance of common plant species. Ecology Letters 4:536-544.
Jump, A. S., and F. I. Woodward. 2003. Seed production and population density decline approaching the range-edge of Cirsium species. New Phytologist 160:349-358.
Karl, T. R., and K. E. Trenberth. 2003. Modern global climate change. Science 302:1719-1723. Kelly, C. K. 1996. Identifying plant functional types using floristic data bases: ecological correlates of
plant range size. Journal of Vegetation Science 7:417-424. Kluth, C., and H. Bruelheide. 2005a. Central and peripheral Hornungia petraea populations: patterns
and dynamics. Journal of Ecology 93:584-595. Kluth, C., and H. Bruelheide. 2005b. Effects of range position, inter-annual variation and density on
demographic transition rates of Hornungia petraea populations. Oecologia 145:382-393. Köckemann, B., H. Buschmann, and C. Leuschner. 2009. The relationships between abundance, range
size and niche breadth in Central European tree species. Journal of Biogeography 36:854-864. Koelewijn, H. P. 1996. Sexual differences in reproductive characters in gynodioecious Plantago
coronopus. Oikos 75:443-452. Koelewijn, H. P. 2004a. Sibling competition, size variation and frequency-dependent outcrossing
advantage in Plantago coronopus. Evolutionary Ecology 18:51-74. Koelewijn, H. P. 2004b. Rapid change in relative growth rate between the vegetative and reproductive
stage of the life cycle in Plantago coronopus. New Phytologist 163:67-76. Koelewijn, H. P., and J. M. M. Van Damme. 2005. Effects of seed size, inbreeding and maternal sex
on offspring fitness in gynodioecious Plantago coronopus. Journal of Ecology 93:373-383. Koenig, W. D., J. M. H. Knops, J. L. Dickinson, and B. Zuckerberg. 2009. Latitudinal decrease in
acorn size in bur oak (Quercus macrocarpa) is due to environmental constraints, not avian dispersal. Botany-Botanique 87:349-356.
Kolb, A., F. Barsch, and M. Diekmann. 2006. Determinants of local abundance and range size in forest vascular plants. Global Ecology and Biogeography 15:237-247.
Kolb, A., and M. Diekmann. 2005. Effects of life-history traits on responses of plant species to forest fragmentation. Conservation Biology 19:929-938.

References
127
Kuittinen, H., A. Mattila, and O. Savolainen. 1997. Genetic variation at marker loci and in quantitative traits in natural populations of Arabidopsis thaliana. Heredity 79:144-152.
Kuiper, P. J. C., and M. Bos. 1992. Plantago: A multidisciplinary study. Springer-Verlag, Berlin. Kunin, W. E., and K. J. Gaston. 1993. The biology of rarity: patterns, causes and consequences.
Trends in Ecology & Evolution 8:298-301. Lammi, A., P. Siikamaki, and K. Mustajarvi. 1999. Genetic diversity, population size, and fitness in
central and peripheral populations of a rare plant Lychnis viscaria. Conservation Biology 13:1069-1078.
Lavergne, S., J. D. Thompson, E. Garnier, and M. Debussche. 2004. The biology and ecology of narrow endemic and widespread plants: a comparative study of trait variation in 20 congeneric pairs. Oikos 107:505-518.
Lawton, J. H. 1993. Range, population abundance and conservation. Trends in Ecology & Evolution 8:409-413.
Lawton-Rauh, A. 2008. Demographic processes shaping genetic variation. Current Opinion in Plant Biology 11:103-109.
Leimu, R., P. Mutikainen, J. Koricheva, and M. Fischer. 2006. How general are positive relationships between plant population size, fitness and genetic variation? Journal of Ecology 94:942-952.
Lennon, J. J., P. Koleff, J. J. D. Greenwood, and K. J. Gaston. 2004. Contribution of rarity and commonness to patterns of species richness. Ecology Letters 7:81-87.
Lennon, J. J., W. E. Kunin, S. Corne, S. Carver, and W. W. S. Van Hees. 2002. Are Alaskan trees found in locally more favourable sites in marginal areas? Global Ecology and Biogeography 11:103-114.
Lesica, P., and F. W. Allendorf. 1995. When are peripheral-populations valuable for conservation. Conservation Biology 9:753-760.
Lewontin, R. C., and D. Cohen. 1969. On population growth in a randomly varying environment. Proceedings of the National Academy of Sciences of the United States of America 62:1056-&.
Loreti, J., and M. Oesterheld. 1996. Intraspecific variation in the resistance to flooding and drought in populations of Paspalum dilatatum from different topographic positions. Oecologia 108:279-284.
Lu, J., D. Tan, J. M. Baskin, and C. C. Baskin. 2010. Fruit and seed heteromorphism in the cold desert annual ephemeral Diptychocarpus strictus (Brassicaceae) and possible adaptive significance. Annals of Botany 105:999-1014.
Luciani, E., A. Cristaudo, and D. Arico. 2001. Germination ecology of three Plantago L. (Plantaginaceae) species living in a saline environment. Plant Biosystems 135:213-221.
Lynch, M., M. Pfrender, K. Spitze, N. Lehman, J. Hicks, D. Allen, L. Latta, M. Ottene, F. Bogue, and J. Colbourne. 1999. The quantitative and molecular genetic architecture of a subdivided species. Evolution 53:100-110.
Mandák, B. 1997. Seed heteromorphism and the life cycle of plants: a literature review. Preslia 69:129-159.
Mandujano, M. C., C. Montana, M. Franco, J. Golubov, and A. Flores-Martinez. 2001. Integration of demographic annual variability in a clonal desert cactus. Ecology 82:344-359.
Margules, C., and M. B. Usher. 1981. Criteria used in assessing wildlife conservation potential: a review. Biological Conservation 21:79-109.
McWilliams, E. L., R. Q. Landers, and J. P. Mahlsted. 1968. Variation in seed weight and germination in populations of Amaranthus retroflexus L. Ecology 49:290-&.
Méndez, M. 1997. Sources of variation in seed mass in Arum italicum. International Journal of Plant Sciences 158:298-305.

References
128
Menges, E. S., and R. W. Dolan. 1998. Demographic viability of populations of Silene regia in midwestern prairies: relationships with fire management, genetic variation, geographic location, population size and isolation. Journal of Ecology 86:63-78.
Miller, R. E., and N. L. Fowler. 1994. Life history variation and local adaptation within two populations of Bouteloua rigidiseta (Texas grama). Journal of Ecology 82:855-864.
Mitchell-Olds, T., and J. Schmitt. 2006. Genetic mechanisms and evolutionary significance of natural variation in Arabidopsis. Nature 441:947-952.
Moles, A. T., and M. Westoby. 2003. Latitude, seed predation and seed mass. Journal of Biogeography 30:105-128.
Montesinos, A., S. J. Tonsor, C. Alonso-Blanco, and F. X. Picó. 2009. Demographic and genetic patterns of variation among populations of Arabidopsis thaliana from contrasting native environments. Plos One 4.
Moroney, J. R., and P. W. Rundel. 2012. Abundance and dispersion of the invasive Mediterranean annual, Centaurea melitensis in its native and non-native ranges. Biological Invasions. doi: 10.1007/s10530-012-0302-1.
Münzbergová, Z. 2005. Determinants of species rarity: population growth rates of species sharing the same habitat. American Journal of Botany 92:1987-1994.
Murray, B. R., A. H. D. Brown, C. R. Dickman, and M. S. Crowther. 2004. Geographical gradients in seed mass in relation to climate. Journal of Biogeography 31:379-388.
Murray, B. R., P. H. Thrall, A. M. Gill, and A. B. Nicotra. 2002. How plant life-history and ecological traits relate to species rarity and commonness at varying spatial scales. Austral Ecology 27:291-310.
Nakazato, T., M. Bogonovich, and L. C. Moyle. 2008. Environmental factors predict adaptive phenotypic differentiation within and between two wild andean tomatoes. Evolution 62:774-792.
Nevo, E. 2001. Evolution of genome-phenome diversity under environmental stress. Proceedings of the National Academy of Sciences of the United States of America 98:6233-6240.
Noël, F., S. Maurice, A. Mignot, S. Glémin, D. Carbonell, F. Justy, I. Guyot, I. Olivieri, and C. Petit. 2010. Interaction of climate, demography and genetics: a ten-year study of Brassica insularis, a narrow endemic Mediterranean species. Conservation Genetics 11:509-526.
O'Connor, T. G. 1994. Composition and population responses of an African savanna grassland to rainfall and grazing. Journal of Applied Ecology 31:155-171.
Odum, E. P. 1985. Trends expected in stressed ecosystems. Bioscience 35:419-422. Onyekwelu, S. S. C. 1972. Vegetation of dune slacks at Newborough Warren. III. Plantago
coronopus. Journal of Ecology 60:907-915. Oostermeijer, J. G. B., S. H. Luijten, and J. C. M. den Nijs. 2003. Integrating demographic and genetic
approaches in plant conservation. Biological Conservation 113:389-398. Pajunen, A. M. 2009. Environmental and biotic determinants of growth and height of arctic willow
shrubs along a latitudinal gradient. Arctic Antarctic and Alpine Research 41:478-485. Pearman, P. B., M. D'Amen, C. H. Graham, W. Thuiller, and N. E. Zimmermann. 2010. Within-taxon
niche structure: niche conservatism, divergence and predicted effects of climate change. Ecography 33:990-1003.
Pearman, P. B., and D. Weber. 2007. Common species determine richness patterns in biodiversity indicator taxa. Biological Conservation 138:109-119.
Pedrol, J. 2009. Plantago L. Pages 4-38 in C. Benedí, E. Rico, J. Güemes, and A. Herrero, editors. Flora iberica. Vol. XIII. Real Jardín Botánico, CSIC, Madrid.
Philippi, T., and J. Seger. 1989. Hedging one's evolutionary bets, revisited. Trends in Ecology & Evolution 4:41-44.

References
129
Picó, F. X., P. F. Quintana-Ascencio, E. S. Menges, and F. Lopez-Barrera. 2003. Recruitment rates exhibit high elasticity and high temporal variation in populations of a short-lived perennial herb. Oikos 103:69-74.
Pluess, A. R., W. Schutz, and J. Stocklin. 2005. Seed weight increases with altitude in the Swiss Alps between related species but not among populations of individual species. Oecologia 144:55-61.
Polley, H. W., B. J. Wilsey, and J. D. Derner. 2007. Dominant species constrain effects of species diversity on temporal variability in biomass production of tallgrass prairie. Oikos 116:2044-2052.
Preston, F. W. 1948. The commonnes, and rarity, of species. Ecology 29:254-283. Primack, R. B. 1980. Phenotypic variation of rare and widespread species of Plantago. Rhodora
82:87-95. Purves, D. W. 2009. The demography of range boundaries versus range cores in eastern US tree
species. Proceedings of the Royal Society B-Biological Sciences 276:1477-1484. Reinartz, J. A. 1984. Life history variation of common mullein (Verbascum thapsus). I. Latitudinal
differences in population dynamics and timing of reproduction. Journal of Ecology 72:897-912. Ribeiro, K. T., and G. W. Fernandes. 2000. Patterns of abundance of a narrow endemic species in a
tropical and infertile montane habitat. Plant Ecology 147:205-218. Roach, D. A. 2003. Age-specific demography in Plantago: Variation among cohorts in a natural plant
population. Ecology 84:749-756. Sagarin, R. D., and S. D. Gaines. 2002. The 'abundant centre' distribution: to what extent is it a
biogeographical rule? Ecology Letters 5:137-147. Sagarin, R. D., and S. D. Gaines. 2006. Recent studies improve understanding of population dynamics
across species ranges. Oikos 115:386-388. Salinger, M. 2005. Climate variability and change: Past, present and future - An overview. Climatic
Change 70:9-29. Samis, K. E., and C. G. Eckert. 2009. Ecological correlates of fitness across the northern geographic
range limit of a Pacific Coast dune plant. Ecology 90:3051-3061. Santamaría, L., J. Figuerola, J. J. Pilon, M. Mjelde, A. J. Green, T. De Boer, R. A. King, and R. J.
Gornall. 2003. Plant performance across latitude: The role of plasticity and local adaptation in an aquatic plant. Ecology 84:2454-2461.
Scarano, F. R., H. M. Duarte, G. Rocas, S. M. B. Barreto, E. F. Amado, F. Reinert, T. Wendt, A. Mantovani, H. R. P. Lima, and C. F. Barros. 2002. Acclimation or stress symptom? An integrated study of intraspecific variation in the clonal plant Aechmea bromeliifolia, a widespread CAM tank-bromeliad. Botanical Journal of the Linnean Society 140:391-401.
Schat, H. 1981. Seed polymorphism and germination ecology of Plantago coronopus L. Acta Oecologica-Oecologia Plantarum 2:367-380.
Schat, H., and M. Scholten. 1985. Comparative population ecology of dune slack species: the relation between population stability and germination behavior in brackish environments. Vegetatio 61:189-195.
Schimpf, D. J. 1977. Seed weight of Amaranthus retroflexus in relation to moisture and length of growing season. Ecology 58:450-453.
Seger, J., and H. J. Brockmann. 1987. What is bet-hedging? Oxford Surveys in Evolutionary Biology 4:182-211.
Sexton, J. P., P. J. McIntyre, A. L. Angert, and K. J. Rice. 2009. Evolution and ecology of species range limits. Annual Review of Ecology, Evolution, and Systematics 40:415-436.
Shefferson, R. P., and D. A. Roach. 2012. The triple helix of Plantago lanceolata: genetics and the environment interact to determine population dynamics. Ecology 93:793-802.

References
130
Shumaker, K. M., and G. R. Babble. 1980. Patterns of allozymic similarity in ecologically central and marginal populations of Hordeum jubatum in Utah. Evolution 34:110-116.
Simon, M. F., and J. D. Hay. 2003. Comparison of a common and rare species of Mimosa (Mimosaceae) in Central Brazil. Austral Ecology 28:315-326.
Slatkin, M. 1987. Gene flow and the geographic structure of natural populations. Science 236:787-792.
Smekens, M. J., and P. H. van Tienderen. 2001. Genetic variation and plasticity of Plantago coronopus under saline conditions. Acta Oecologica-International Journal of Ecology 22:187-200.
Smith, M., H. Caswell, and P. Mettler-Cherry. 2005. Stochastic flood and precipitation regimes and the population dynamics of a threatened floodplain plant. Ecological Applications 15:1036-1052.
Smith, M. D., and A. K. Knapp. 2003. Dominant species maintain ecosystem function with non-random species loss. Ecology Letters 6:509-517.
Solan, M., B. J. Cardinale, A. L. Downing, K. A. M. Engelhardt, J. L. Ruesink, and D. S. Srivastava. 2004. Extinction and ecosystem function in the marine benthos. Science 306:1177-1180.
Soulé, M. 1973. The epistasis cycle: a theory of marginal populations. Annual Review of Ecology and Systematics 4:165-187.
Stearns, S. C. 1976. Life-history tactics: a review of the ideas. The Quarterly Review of Biology 51:3-47.
Stohlgren, T. J., P. Pysek, J. Kartesz, M. Nishino, A. Pauchard, M. Winter, J. Pino, D. M. Richardson, J. R. U. Wilson, B. R. Murray, M. L. Phillips, L. Ming-yang, L. Celesti-Grapow, and X. Font. 2011. Widespread plant species: natives versus aliens in our changing world. Biological Invasions 13:1931-1944.
Susko, D. J., and L. Lovett-Doust. 2000. Patterns of seed mass variation and their effects on seedling traits in Alliaria petiolata (Brassicaceae). American Journal of Botany 87:56-66.
Thompson, K., and R. M. Ceriani. 2003. No relationship between range size and germination niche width in the UK herbaceous flora. Functional Ecology 17:335-339.
Thompson, K., J. G. Hodgson, and K. J. Gaston. 1998. Abundance-range size relationships in the herbaceous flora of central England. Journal of Ecology 86:439-448.
Tigerstedt, P. M. 1973. Studies on isoenzyme variation in marginal and central populations of Picea abies. Hereditas 75:47-59.
Travis, J. M. J., and C. Dytham. 2004. A method for simulating patterns of habitat availability at static and dynamic range margins. Oikos 104:410-416.
Tremblay, M. F., Y. Bergeron, D. Lalonde, and Y. Mauffette. 2002. The potential effects of sexual reproduction and seedling recruitment on the maintenance of red maple (Acer rubrum L.) populations at the northern limit of the species range. Journal of Biogeography 29:365-373.
Treseder, K. K., and P. M. Vitousek. 2001. Potential ecosystem-level effects of genetic variation among populations of Metrosideros polymorpha from a soil fertility gradient in Hawaii. Oecologia 126:266-275.
Tuljapurkar, S., C. C. Horvitz, and J. B. Pascarella. 2003. The many growth rates and elasticities of populations in random environments. American Naturalist 162:489-502.
Van Tienderen, P. H., and J. Van der Toorn. 1991. Genetic differentiation between populations of Plantago lanceolata .1. Local adaptation in 3 contrasting habitats. Journal of Ecology 79:27-42.
Venable, D. L., and A. Burquez. 1989. Quantitative genetics of size, shape, life-history, and fruit characteristics of the seed-heteromorphic composite Heterosperma pinnatum. I. Variation within and among populations. Evolution 43:113-124.
Verkaar, H. J., and A. J. Schenkeveld. 1984. On the ecology of short-lived forbs in chalk grasslands: life-history characteristics. New Phytologist 98:659-672.

References
131
Völler, E., H. Auge, D. Prati, M. Fischer, A. Hemp, and O. Bossdorf. 2012. Geographical and land-use effects on seed-mass variation in common grassland plants. Basic and Applied Ecology 13:395-404.
Vucetich, J. A., and T. A. Waite. 2003. Spatial patterns of demography and genetic processes across the species' range: Null hypotheses for landscape conservation genetics. Conservation Genetics 4:639-645.
Wagner, V., H. von Wehrden, K. Wesche, A. Fedulin, T. Sidorova, and I. Hensen. 2011. Similar performance in central and range-edge populations of a Eurasian steppe grass under different climate and soil pH regimes. Ecography 34:498-506.
Waite, S. 1984. Changes in the demography of Plantago coronopus at two coastal sites. Journal of Ecology 72:809-826.
Waite, S., and M. J. Hutchings. 1978. Effects of sowing density, salinity and substrate upon germination of seeds of Plantago coronopus L. New Phytologist 81:341-348.
Waite, S., and M. J. Hutchings. 1979. Comparative-study of establishment of Plantago coronopus L from seeds sown randomly and in clumps. New Phytologist 82:575-583.
Waite, S., and M. J. Hutchings. 1982. Plastic energy allocation patterns in Plantago coronopus. Oikos 38:333-342.
Walck, J. L., J. M. Baskin, and C. C. Baskin. 2001. Why is Solidago shortii narrowly endemic and S. altissima geographically widespread? A comprehensive comparative study of biological traits. Journal of Biogeography 28:1221-1237.
Westoby, M., E. Jurado, and M. Leishman. 1992. Comparative evolutionary ecology of seed size. Trends in Ecology & Evolution 7:368-372.
Wilson, J. B., R. H. Yin, A. F. Mark, and A. D. Q. Agnew. 1991. A test of the low marginal variance (LMV) theory, in Leptospermum scoparium (Myrtaceae). Evolution 45:780-784.
Williams, J. L. 2009. Flowering life-history strategies differ between the native and introduced ranges of a monocarpic perennial. American Naturalist 174:660-672.
Winn, A. A., and K. L. Gross. 1993. Latitudinal variation in seed weight and flower number in Prunella vulgaris. Oecologia 93:55-62.
Wolff, K., B. Friso, and J. M. M. Vandamme. 1988. Outcrossing rates and male-sterility in natural populations of Plantago coronopus. Theoretical and Applied Genetics 76:190-196.
Woodell, S. R. J. 1985. Salinity and seed germination patterns in coastal plants. Vegetatio 61:223-229. Yakimowski, S. B., and C. G. Eckert. 2008. Populations do not become less genetically diverse or
more differentiated towards the northern limit of the geographical range in clonal Vaccinium stamineum (Ericaceae). New Phytologist 180:534-544.
Yang, X., W. Zhang, M. Dong, I. Boubriak, and Z. Huang. 2011. The achene mucilage hydrated in desert dew assists seed cells in maintaining DNA integrity: adaptive strategy of desert plant Artemisia sphaerocephala. PLOS ONE 6:e24346. doi:10.1371/journal.pone.0024346.


133
Appendices


Appendices
135
Appendix 1 General view of central populations of Plantago coronopus monitored for demographic
analyses: a) T (Tarifa, Spain); b) CA (Camposoto, Spain); c) C (Corrubedo, Spain); d) TB (Traba,
Spain); e) F (Pen Bron, France); f) BN (Bosque Niebla, Spain; only analyzed in chapter 4).

Appendices
136
Appendix 2 General view of northern peripheral populations of Plantago coronopus monitored for
demographic analyses: a) DH (Helnaes, Denmark); b) DS (Skallingen, Denmark); c) SG (Glommen,
Sweden); d) ST (Torekov, Sweden); e) EA (Aberdeen, Scotland); f) ES (Skye, Scotland).

Appendices
137
Appendix 3 Phenotypic variability among vegetative individuals of central (a, b, c) and northern
peripheral (d, e, f) populations of Plantago coronopus: a) CA (Camposoto, Spain; plant with several
rosettes); b) C (Corrubedo, Spain); c) TB (Traba, Spain); d) DH (Helnaes, Denmark); e) SG
(Glommen, Sweden); f) ES (Skye, Scotland). Use the scales for comparing plant size among
photographs.

Appendices
138
Appendix 4 Phenotypic variability among reproductive individuals of central (a, b, c) and northern
peripheral (d, e, f) populations of Plantago coronopus: a) T (Tarifa, Spain); b) CA (Camposoto, Spain;
plant with several rosettes); c) TB (Traba, Spain); d) SG (Glommen, Sweden); e) ST (Torekov,
Sweden); f) EA (Aberdeen, Scotland). Use the scales for comparing plant and inflorescence size
among photographs.

Appendices
139
Appendix 5 Methodology for this study: a) Plot of 1 m2 used for demographic monitoring in Tarifa,
Spain; b) Plot of 0.25 m2 used for demographic monitoring in Helnaes, Denmark; c) Linear transect
used for calculating population density in Aberdeen, Scotland; d) Soil sample taken from Traba,
Spain; e) Material used in the laboratory to handle seeds; f) Placental tissue separating two big basal
seeds and one small apical seed of P. coronopus in the same fruit; g) Leaves stored in silica gel for
genetic analyses; h) Eppendorf tubes with leaf material after being shaken for DNA extraction.