Demographic Analysis of the Fort Mojave Indian Tribe Using ...
81
Demographic Analysis of the Fort Mojave Indian Tribe Using 2010 Census and 2010 American Community Survey Estimates Completed for: Grants & Contract Office Fort Mojave 500 Merriman Street Needles, CA 92363 Completed by: Arizona Rural Policy Institute Center for Business Outreach W.A. Franke College of Business Northern Arizona University
Transcript of Demographic Analysis of the Fort Mojave Indian Tribe Using ...

Demographic Analysis of the
Fort Mojave Indian Tribe Using 2010 Census and 2010 American Community Survey Estimates
Completed for: Grants & Contract Office
Fort Mojave 500 Merriman Street
Needles, CA 92363
Completed by: Arizona Rural Policy Institute Center for Business Outreach
W.A. Franke College of Business Northern Arizona University

2
This report was prepared by the Arizona Rural Policy Institute, Northern Arizona University, partially
funded under an award from the Economic Development Administration, U.S. Department of Commerce. The statements, findings, conclusions, and recommendations are those of the authors and do not
necessarily reflect the views of the Economic Development Administration or the U.S. Department of Commerce.
The Arizona Rural Policy Institute also receives support from the City of Flagstaff, Coconino County, and
the Office of the President, Northern Arizona University

1
Table of Contents
Table of Contents ............................................................................................................................ 1
List of Tables ................................................................................................................................... 2
List of Figures .................................................................................................................................. 3
Fort Mojave Indian Tribe ................................................................................................................ 4
Demographic Analysis ..................................................................................................................... 4
Introduction .................................................................................................................................... 4
Population ....................................................................................................................................... 5
Gender ............................................................................................................................................ 6
Age .................................................................................................................................................. 6
Population Under 18 Years ........................................................................................................... 9
Median Age ................................................................................................................................... 11
Race ............................................................................................................................................... 14
Ethnicity ........................................................................................................................................ 15
Households ................................................................................................................................... 16
Children Under 18 Years of Age Living with Grandparent ............................................................ 25
Presence of Multi-generational Households ................................................................................ 27
Household Income ........................................................................................................................ 28
Supplemental Income ................................................................................................................... 30
Other Income ................................................................................................................................ 32
Poverty .......................................................................................................................................... 33
Children in Poverty........................................................................................................................ 35
Households in Poverty .................................................................................................................. 36
Households Receiving Supplemental Nutrition Assistance Program (SNAP) ............................... 38
Fertility .......................................................................................................................................... 39
APPENDIX A: .................................................................................................................................. 41
FORT MOJAVE INDIAN TRIBE CENSUS 2010 ................................................................................. 41
APPENDIX B:FORT MOJAVE INDIAN TRIBE AMERICAN COMMUNITY SURVEY 2010, 5-YEAR ESTIMATES .................................................................................................................................... 54 APPENDIX C: FORT MOJAVE INDIAN TRIBE AMERICAN COMMUNITY SURVEY 2010, 5-YEAR MARGIN OF ERROR ESTIMATES .................................................................................................. 544

2
List of Tables Table 1. Total Population & Trends ................................................................................................ 5
Table 2. Gender Ratios .................................................................................................................... 6
Table 3. Age Groups by 5 Year Cohorts .......................................................................................... 7
Table 4. Single year age by gender for those under 18 years of age ............................................ 10
Table 5. Demographic Profile Fort Mojave Indian Tribe, Census 2010 ..................................... 12
Table 5. Demographic Profile Fort Mojave Indian Tribe…continued ........................................ 13
Table 6. Race ................................................................................................................................. 14
Table 7. Ethnicity ........................................................................................................................... 15
Table 8. Household Structure ....................................................................................................... 17
Table 9. Household Structure ....................................................................................................... 20
Table 10. Household by Type of Household Structure ................................................................. 22
Table 10. Household by Type of Household Structure….continued ............................................. 23
Table 11. Children under 18 years of age living with a grandparent householder ...................... 25
Table 12. Household Income (In 2010 Inflation-Adjusted Dollars) .............................................. 28
Table 13. Household Income And Benefits (In 2010 Inflation-Adjusted Dollars) ......................... 31
Table 14. Other Income Measures (In 2010 Inflation-Adjusted Dollars) ...................................... 32
Table 15 Poverty Status over the Last 12 Months ........................................................................ 33
Table 16. Poverty Status over the Last 12 Months - Children in Poverty ..................................... 35
Table 17. Households Within Poverty Rates ................................................................................. 36
Table 18. Households Receiving SNAP Assistance ........................................................................ 38
Table 19. Fertility .......................................................................................................................... 39

3
List of Figures Figure 1. Percent Population Change 2000 to 2010 Arizona, Mohave County & Fort Mojave .... 5
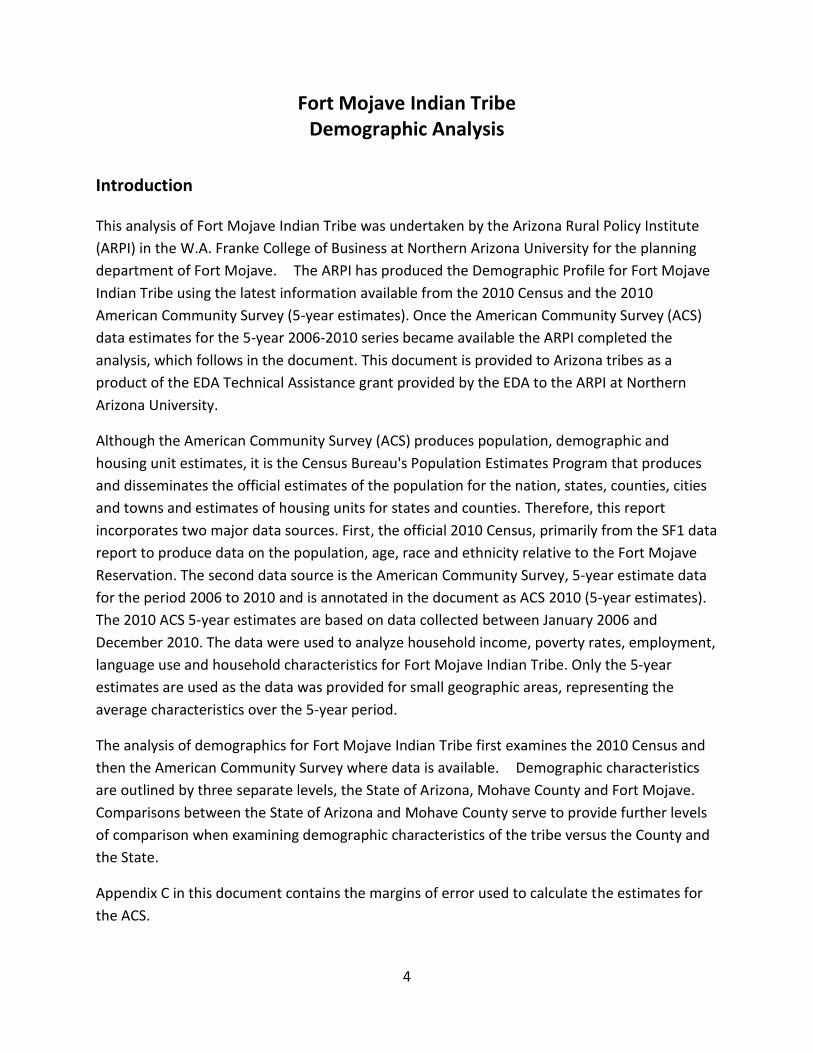
Figure 2. Age Cohorts for Arizona, Mohave County & Fort Mojave 2010................................... 8
Figure 3. Population Pyramid - Fort Mojave 2010 ...................................................................... 9
Figure 4. Median Age in Years 2010 ............................................................................................. 11
Figure 5. Ethnicity ......................................................................................................................... 15
Figure 6. Average Household and Family Size .............................................................................. 18
Figure 7. Household Relationships ............................................................................................... 19
Figure 8. Household Structure ...................................................................................................... 21
Figure 9. Households headed by single mothers .......................................................................... 24
Figure 10. Percentage of children under 18 living with a grandparent householder .................. 26
Figure 11. Presence of multigenerational households ................................................................. 27
Figure 12. Percentage of household income by range ................................................................. 29
Figure 13. Supplemental Income .................................................................................................. 30
Figure 14. Persons in Poverty by Age ........................................................................................... 34
Figure 15. Households by Poverty Ratios ..................................................................................... 37
Figure 16. Birth Rates Per 1000 Women ...................................................................................... 40
4
Fort Mojave Indian Tribe Demographic Analysis
Introduction This analysis of Fort Mojave Indian Tribe was undertaken by the Arizona Rural Policy Institute
(ARPI) in the W.A. Franke College of Business at Northern Arizona University for the planning
department of Fort Mojave. The ARPI has produced the Demographic Profile for Fort Mojave
Indian Tribe using the latest information available from the 2010 Census and the 2010
American Community Survey (5-year estimates). Once the American Community Survey (ACS)
data estimates for the 5-year 2006-2010 series became available the ARPI completed the
analysis, which follows in the document. This document is provided to Arizona tribes as a
product of the EDA Technical Assistance grant provided by the EDA to the ARPI at Northern
Arizona University.
Although the American Community Survey (ACS) produces population, demographic and
housing unit estimates, it is the Census Bureau's Population Estimates Program that produces
and disseminates the official estimates of the population for the nation, states, counties, cities
and towns and estimates of housing units for states and counties. Therefore, this report
incorporates two major data sources. First, the official 2010 Census, primarily from the SF1 data
report to produce data on the population, age, race and ethnicity relative to the Fort Mojave
Reservation. The second data source is the American Community Survey, 5-year estimate data
for the period 2006 to 2010 and is annotated in the document as ACS 2010 (5-year estimates).
The 2010 ACS 5-year estimates are based on data collected between January 2006 and
December 2010. The data were used to analyze household income, poverty rates, employment,
language use and household characteristics for Fort Mojave Indian Tribe. Only the 5-year
estimates are used as the data was provided for small geographic areas, representing the
average characteristics over the 5-year period.
The analysis of demographics for Fort Mojave Indian Tribe first examines the 2010 Census and
then the American Community Survey where data is available. Demographic characteristics
are outlined by three separate levels, the State of Arizona, Mohave County and Fort Mojave.
Comparisons between the State of Arizona and Mohave County serve to provide further levels
of comparison when examining demographic characteristics of the tribe versus the County and
the State.
Appendix C in this document contains the margins of error used to calculate the estimates for
the ACS.

5
Population The population of the Fort Mojave Indian Tribe decreased slightly (-3.7%) in 2010 when
compared to 2000. This decrease indicates that there are 39 fewer tribal members in 2010 than
in 2000. This decrease in tribal members, however, may not truly reflect the actual change in
the tribal populations between the census periods. The SF1 census is considered the official
count, and accounts for only the population within the exterior boundaries of the tribal lands or
nation. Both the State (24.6%) and the County (29.1%) grew significantly between the last
census in 2000 and 2010. The rate of population growth is higher in the County (29.1%) than
the State (24.6%).
Table 1. Total Population & Trends
Total Population and Trends
Arizona
Mohave County
Fort
Mojave
Total Population 2000 5,130,632 155,032 1,043
Total Population 2010 6,392,017 200,186 1,004
Change in Population 2000-2010 24.6% 29.1% -3.7%
Source: Census 2000, 2010 SF1
Figure 1. Percent Population Change 2000 to 2010 Arizona, Mohave County & the Fort Mojave Indian Tribe
24.6%
29.1%
-3.7%
Arizona Mohave County Fort Mojave
Percent Population Change 2000-2010 (source: Census SF1 2000 & 2010)

6
Gender There are more females (53.4%) than males (46.4%) within Fort Mojave Indian Tribe. The
gender ratios in Fort Mojave are lower for males in either the State (49.7%) or the County
(50.0%). Females (53.4%) comprise a larger proportion of the population among Fort Mojave
tribal members than in either the State (50.3%) or the County (50.0%).
Table 2. Gender Ratios
Arizona
Mohave County
Fort
Mojave
Males 3,175,823 100,078 468
Females 3,216,194 100,108 536
Source: Census 2000, 2010 SF1
Age No age group dominates the age structure of the Fort Mojave Indian Tribe, which is in contract
to some other Arizona tribes which tend to be more heavily weighted towards younger tribal
members. The under-18 year population accounts for 27.4 percent of all tribal members,
representing a similar proportion of tribal members as the State (25.5%) and Mohave County
(20.6%). The fact that more than one-fourth of the tribe is younger than 18 years of age
carries with it some fairly important policy implications. The large portion of younger tribal
members influences the provision of health and educational services as well as poverty and
workforce issues as well.
On the other hand, the tribe has one-fourth (23.1%) of members who are 65 years or older. This
age group, of those who have retired and are out of the workforce, accounts for a larger
portion of tribal members than most other Arizona tribes. The 65-plus age group appears in a
higher proportion than the state (13.8%) and at a similar level to the county (23.5%). The age
profile of the Fort Mojave Indian Tribe is somewhat different to other Arizona tribes with its
larger older population and smaller youth population. Finally, those age 18 to 64 years account
for 49.5 percent of the tribal members, which is lower than the State (60.7%) and the County
(56.1%). The large number of tribal young persons and elderly population will have an effect
on the development of the tribal workforce in the future. See Table 3, and Figure 1.

7
Table 3. Age Groups by 5 Year Cohorts
Age by Five Year Cohorts Arizona Mohave County
Fort Mojave
Under 5 years 455,715 8,945 71
5 to 9 years 453,680 11,251 86
10 to 14 years 448,664 11,655 77
15 to 17 years 270,955 7,354 41
18 and 19 years 190,627 4,355 27
20 years 93,756 1,954 16
21 years 89,342 1,794 11
22 to 24 years 259,486 5,540 40
25 to 29 years 439,998 9,329 45
30 to 34 years 416,695 8,948 54
35 to 39 years 415,693 9,437 46
40 to 44 years 406,801 10,673 38
45 to 49 years 427,022 13,552 60
50 to 54 years 415,524 15,172 49
55 to 59 years 375,268 15,002 53
60 and 61 years 144,092 6,419 17
62 to 64 years 206,868 10,088 41
65 and 66 years 119,102 6,286 22
67 to 69 years 163,764 9,272 52
70 to 74 years 215,026 12,751 69
75 to 79 years 162,261 8,783 38
80 to 84 years 118,278 5,648 33
85 years and over 103,400 3,918 18
Total 6,392,017 198,126 1,004
Source: Census 2010 SF1
8
Figure 2. Age Cohorts for Arizona, Mohave County & Fort Mojave Indian Tribe 2010
25.5%
60.7%
13.8%
20.6%
56.1%
23.3% 27.4%
49.5%
23.1%
<18 Year 18 to 64 Year 65+ Year
Age groupings percentage <18, 18 to 64 and 65+ as percent of total population
(Source: 2010, SF1)
Arizona Mohave County Fort Mojave
9
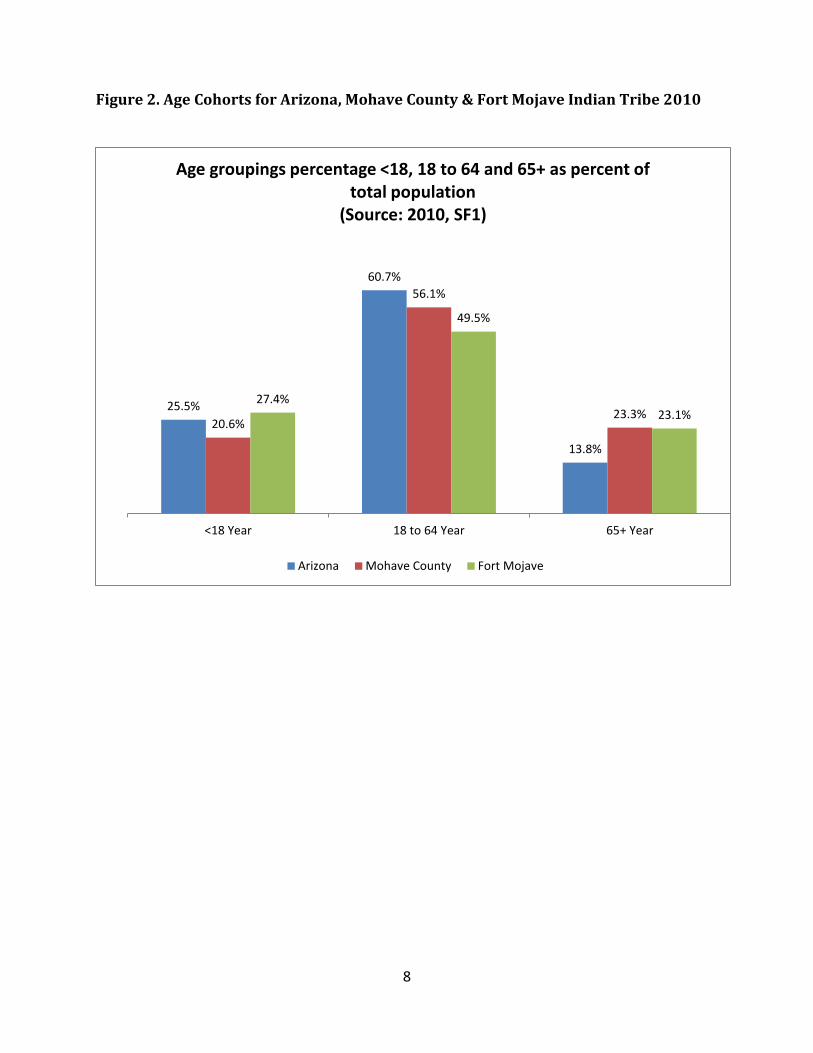
A population pyramid, also called an age structure diagram, is a graphical illustration that shows
the distribution of various age groups in a population (typically that of a country or region of
the world), which forms the shape of a pyramid when the population is growing.
The population pyramid below (Figure 3) illustrates the difference between males and females
for the 5-year age cohorts. The under-18 age cohorts are symmetrical indicating that there are
a somewhat even number of males and females. The population between 20 and 21 years of
age represent a small part of the distribution. At the top of the age pyramid there are slightly
more females than males. This is also a demographic reality as women tend to live longer
than men. The age pyramid provides an illustrated snapshot of the age structure of the tribal
members at the time of the 2010 census.
Figure 3. Population Pyramid - Fort Mojave Indian Tribe 2010
-5.0% -4.0% -3.0% -2.0% -1.0% 0.0% 1.0% 2.0% 3.0% 4.0% 5.0% 6.0%
Under 5 years
10 to 14 years
18 and 19 years
21 years
25 to 29 years
35 to 39 years
45 to 49 years
55 to 59 years
62 to 64 years
67 to 69 years
75 to 79 years
85 years and over
Population Pyramid - the Fort Mojave Indian Tribe
(Source: 2010, SF1)
Female: Male:
10
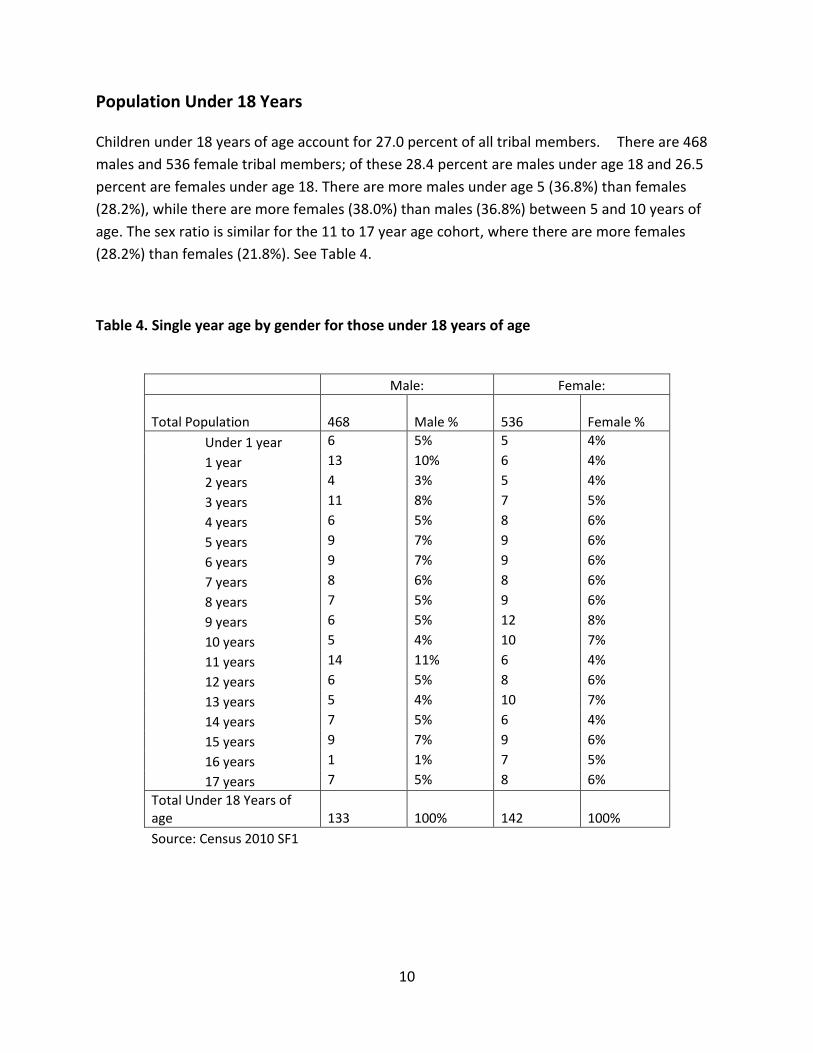
Population Under 18 Years Children under 18 years of age account for 27.0 percent of all tribal members. There are 468
males and 536 female tribal members; of these 28.4 percent are males under age 18 and 26.5
percent are females under age 18. There are more males under age 5 (36.8%) than females
(28.2%), while there are more females (38.0%) than males (36.8%) between 5 and 10 years of
age. The sex ratio is similar for the 11 to 17 year age cohort, where there are more females
(28.2%) than females (21.8%). See Table 4.
Table 4. Single year age by gender for those under 18 years of age
Male: Female:
Total Population 468
Male %
536
Female %
Under 1 year 6 5% 5 4%
1 year 13 10% 6 4%
2 years 4 3% 5 4%
3 years 11 8% 7 5%
4 years 6 5% 8 6%
5 years 9 7% 9 6%
6 years 9 7% 9 6%
7 years 8 6% 8 6%
8 years 7 5% 9 6%
9 years 6 5% 12 8%
10 years 5 4% 10 7%
11 years 14 11% 6 4%
12 years 6 5% 8 6%
13 years 5 4% 10 7%
14 years 7 5% 6 4%
15 years 9 7% 9 6%
16 years 1 1% 7 5%
17 years 7 5% 8 6%
Total Under 18 Years of age
133
100%
142
100%
Source: Census 2010 SF1
11
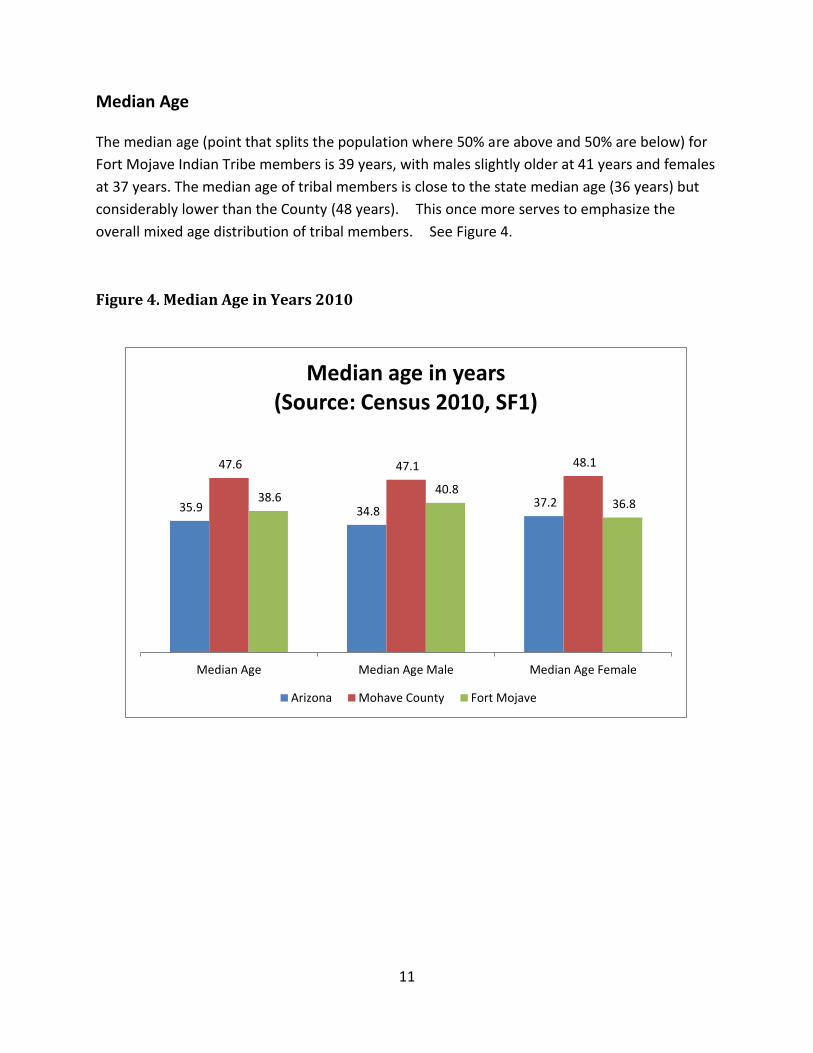
Median Age The median age (point that splits the population where 50% are above and 50% are below) for
Fort Mojave Indian Tribe members is 39 years, with males slightly older at 41 years and females
at 37 years. The median age of tribal members is close to the state median age (36 years) but
considerably lower than the County (48 years). This once more serves to emphasize the
overall mixed age distribution of tribal members. See Figure 4.
Figure 4. Median Age in Years 2010
35.9 34.8 37.2
47.6 47.1 48.1
38.6 40.8
36.8
Median Age Median Age Male Median Age Female
Median age in years (Source: Census 2010, SF1)
Arizona Mohave County Fort Mojave

12
Table 5. Demographic Profile Fort Mojave Indian Tribe, Census 2010
Arizona
Mohave County
Fort Mojave
Total Population 2000 5,130,632 155,032 1,043
Total Population 2010 6,392,017 200,186 1,004
Change in Population 2000-2010 24.6% 29.1% -3.7%
Males 3,175,823 100,078 468
Females 3,216,194 100,108 536
Population Density persons per square mile 56 15 28
Land Area Square Miles 113594.1 13,461 36.84
Males 49.7% 50.0% 46.6%
Females 50.3% 50.0% 53.4%
5-Year Age Cohorts
Arizona
Mohave County
Fort Mojave
Under 5 years 455,715 11,005 71
5 to 9 years 453,680 11,251 86
10 to 14 years 448,664 11,655 77
15 to 17 years 270,955 7,354 41
18 and 19 years 190,627 4,355 27
20 years 93,756 1,954 16
21 years 89,342 1,794 11
22 to 24 years 259,486 5,540 40
25 to 29 years 439,998 9,329 45
30 to 34 years 416,695 8,948 54
35 to 39 years 415,693 9,437 46
40 to 44 years 406,801 10,673 38
45 to 49 years 427,022 13,552 60
50 to 54 years 415,524 15,172 49
55 to 59 years 375,268 15,002 53
60 and 61 years 144,092 6,419 17
62 to 64 years 206,868 10,088 41
65 and 66 years 119,102 6,286 22
67 to 69 years 163,764 9,272 52
70 to 74 years 215,026 12,751 69
75 to 79 years 162,261 8,783 38
80 to 84 years 118,278 5,648 33
85 years and over 103,400 3,918 18

13
Table 5. Demographic Profile Fort Mojave …continued
Arizona Mohave County Fort Mojave
Median Age 36 48 39
Median Age Male 35 47 41
Median Age Female 37 48 37
Age Group Demographics
Age 0 to 17 1,488,718 39,379 237
18 to 24 Years 407,035 10,894 39
25 to 44 Years 887,709 28,091 41
45 to 64 Years 1,096,092 51,442 109
62 Years and Over 1,088,699 56,746 273
65 Years and Over 729,845 42,775 190
18 & Over 4,763,003 158,921 729
Male 18 & Over 2,343,919 79,163 335
Female 18 & Over 2,419,084 79,758 394
21 & Over 4,478,620 152,612 686
15 to 19 Years 461,582 11,709 68
Males 65 & Over 401,695 23,119 109
Females 65 & Over 480,136 23,539 123
Source: Census 2010 SF1
14
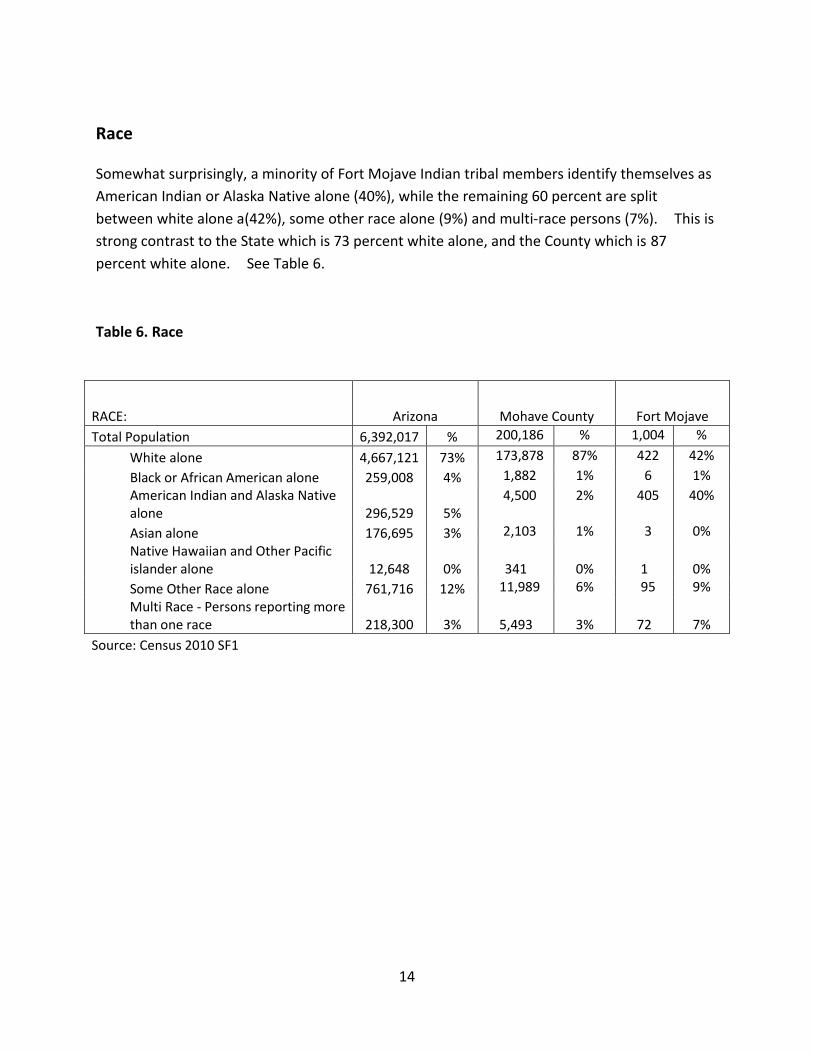
Race Somewhat surprisingly, a minority of Fort Mojave Indian tribal members identify themselves as
American Indian or Alaska Native alone (40%), while the remaining 60 percent are split
between white alone a(42%), some other race alone (9%) and multi-race persons (7%). This is
strong contrast to the State which is 73 percent white alone, and the County which is 87
percent white alone. See Table 6.
Table 6. Race
RACE: Arizona Mohave County Fort Mojave
Total Population 6,392,017 % 200,186 % 1,004 %
White alone 4,667,121 73% 173,878 87% 422 42%
Black or African American alone 259,008 4% 1,882 1% 6 1%
American Indian and Alaska Native alone 296,529 5%
4,500 2% 405 40%
Asian alone 176,695 3% 2,103 1% 3 0%
Native Hawaiian and Other Pacific islander alone 12,648 0%
341
0%
1
0%
Some Other Race alone 761,716 12% 11,989 6% 95 9%
Multi Race - Persons reporting more than one race 218,300 3%
5,493
3%
72
7%
Source: Census 2010 SF1

15
Ethnicity In terms of ethnicity, one-fourth (25.2%) of Fort Mojave Indian tribal members identify
themselves as Hispanic or Latino. This is higher than the surrounding County where more than
one-tenth (14.8%) identify themselves as Hispanic or Latino but lower than the State where
29.6 percent identify themselves as Hispanic or Latino. See Table 7 and Figure 5.
Table 7. Ethnicity
HISPANIC OR LATINO ORIGIN: Arizona Mohave County Fort Mojave
Total Population 6,392,017 %
200,186
1,004
Not Hispanic or Latino: 4,496,868 70.4% 170,617 85.2% 751 74.8%
Hispanic or Latino: 1,895,149 29.6% 29,569 14.8% 253 25.2%
Source: Census 2010 SF1
Figure 5. Ethnicity
70.4%
29.6%
85.2%
14.8%
74.8%
25.2%
Not Hispanic or Latino: Hispanic or Latino:
Ethnicity - Hispanic and Non-Hispanic (Source: Census SF1 2010)
Arizona Mohave County Fort Mojave
16
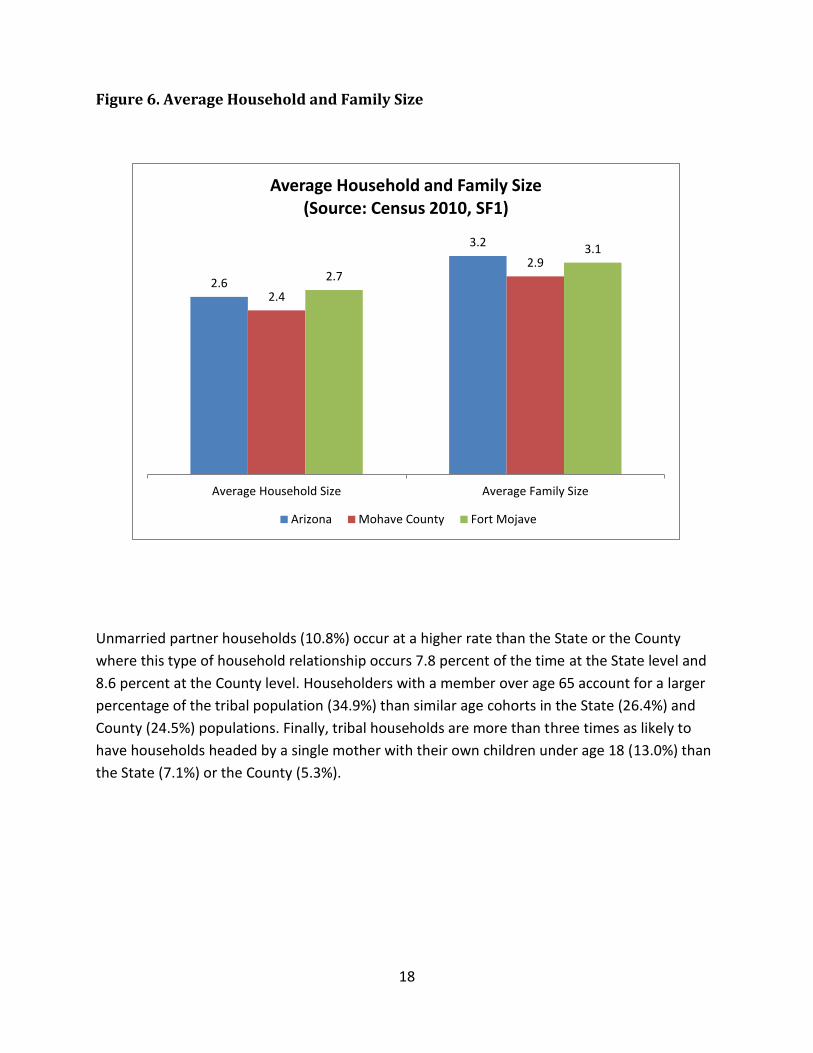
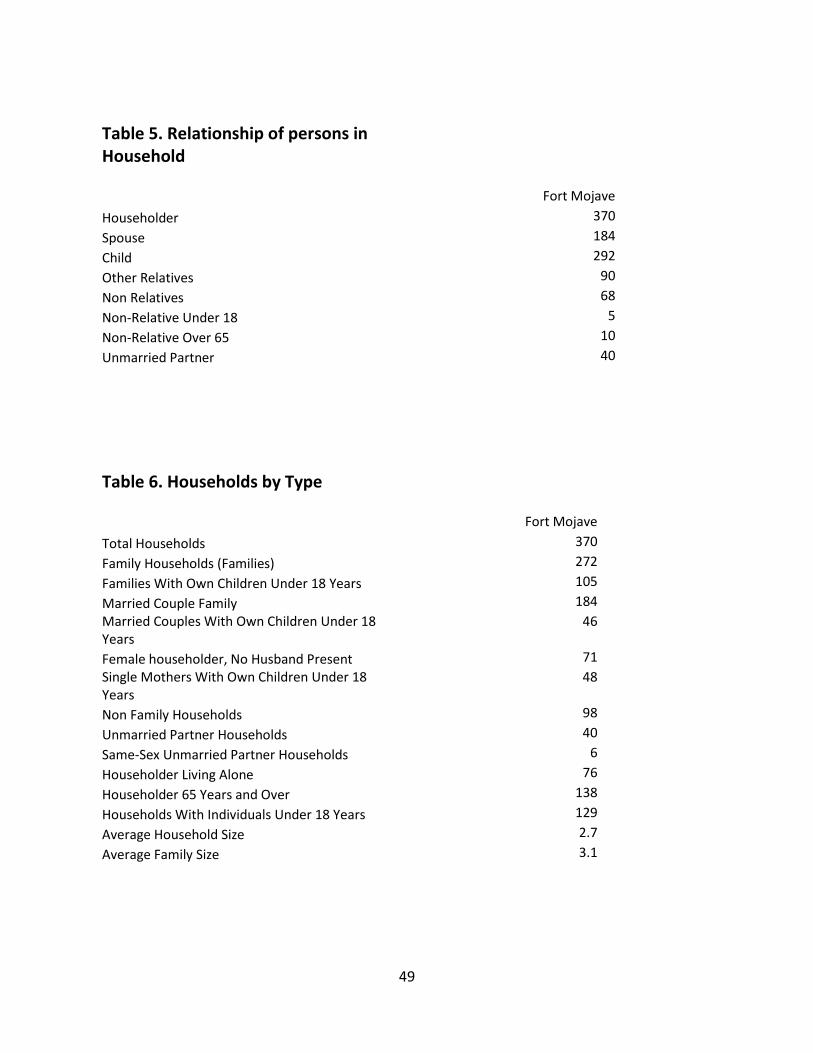
Households In 2010, there were 370 households in the Fort Mojave Indian Tribe, with an average household
size of 2.7 persons and an average family size of 3.1 persons as well. The average household
size of 2.6 persons is lower than the State average (3.0 persons) and larger than the County
average (2.7 persons). The average family size for tribal members (3.1 persons) is slightly larger
than the State (3.0 persons) and the County, where the average is 2.9 persons. See Figure 6.
A “household” is a person or group of people who occupy a housing unit. The “householder” is
a person in whose name the housing unit is owned, being bought, or rented. A “family
household” consists of a householder and one or more people living together in the same
household who are related to the householder by birth, marriage, or adoption — it may also
include people unrelated to the householder. If the householder is married and living with
his/her spouse, then the household is designated a “married-couple household.” The remaining
types of family households not maintained by a married couple are designated by the sex of the
householder. A “nonfamily household” consists of a person living alone or a householder who
shares the home with nonrelatives only; for example, with roommates or an unmarried partner.
Family households (73.5%) predominate in the Fort Mojave Indian Tribe where traditional
married couple families (49.7%) are similar to the State (48.1%) or the County (49.5%).
Households headed by a single mother (19.1%) occur at twice the rate of the State and the
County. More than two-thirds (68.9%) of all households are either married couple families
(49.7%) or households headed by single mothers (19.2%). Other household structures include
non-family households (26.5%) and unmarried partner households (10.8%). See Table 8 and
Figure 7.

17
Table 8. Household Structure
Arizona Mohave County Fort Mojave
Total Households 2,380,990 % 82,539 370
Family Households (Families) 1,576,520 66.2% 54,036 65.5% 272 73.5%
With Own Children Under 18 Years 465,120 19.5% 17,131 20.8% 105 28.4%
Married Couple Family 1,146,036 48.1% 40,832 49.5% 184 49.7%
With Own Children Under 18 Years 465,120 19.5% 10,358 12.5% 46 12.4%
Female householder, No Husband Present
296,313 12.4%
8,584
10.4%
71
19.2%
With own children under 18 years (single mothers) 169,397 7.1%
4,404
5.3%
48
13.0%
Non Family Households 804,470 33.8% 28,503 34.5% 98 26.5%
Unmarried Partner Households 186,080 7.8% 7,139 8.6% 40 10.8%
Same-Sex Unmarried Partner Households 20,948 0.9% 576 0.7% 6 1.6%
Householder Living Alone 621,008 26.1% 22,048 26.7% 76 20.5%
Households With Individuals Under 18 Years 800,348 33.6%
30,070
36.4%
138
37.3%
Households With Individuals 65 Years and Over 628,997 26.4%
20,234
24.5%
129
34.9%
Average Household Size 3.0
2.4 2.7
Average Family Size 3.0
2.9 3.1
Source: Census 2010 SF1
18
Figure 6. Average Household and Family Size
Unmarried partner households (10.8%) occur at a higher rate than the State or the County
where this type of household relationship occurs 7.8 percent of the time at the State level and
8.6 percent at the County level. Householders with a member over age 65 account for a larger
percentage of the tribal population (34.9%) than similar age cohorts in the State (26.4%) and
County (24.5%) populations. Finally, tribal households are more than three times as likely to
have households headed by a single mother with their own children under age 18 (13.0%) than
the State (7.1%) or the County (5.3%).
2.6
3.2
2.4
2.9 2.7
3.1
Average Household Size Average Family Size
Average Household and Family Size (Source: Census 2010, SF1)
Arizona Mohave County Fort Mojave

19
Figure 7. Household Relationships
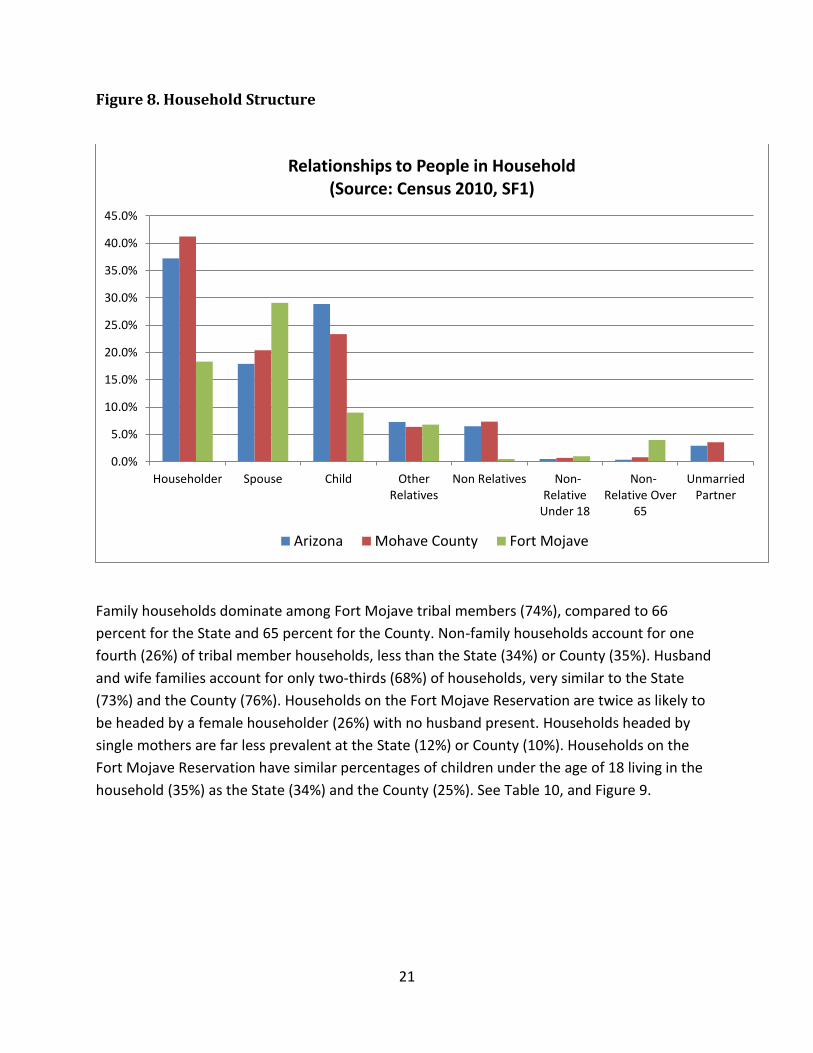
In terms of household characteristics 39.6 percent of all households are headed by a
householder, similar to the State (37.2%) and the lower than the County (41.2%). Spouse
headed households comprise a minority of Fort Mojave tribal households (18.3%) greater than
the State (17.9%) and lower than the County (20.4%). Children comprise almost one-third of all
households (29.1%), greater than the State (28.9%) or the County (23.3%). See, Table 9 and
Figure 8.
0.0%
10.0%
20.0%
30.0%
40.0%
50.0%
60.0%
Married CoupleFamily
Married Couplekids <18 years
Femalehouseholder
Single mothersown children <18
Households Withkids < 18
HouseholdsIndividuals 65+
Years
Household Relationships 2010 (source: Census SF1 2010)
Arizona Mohave County Fort Mojave

20
Table 9. Household Structure
Relationships to People in the Household Arizona Mohave County Fort Mojave
Householder 2,380,990 37.2% 82,539 41.2% 370 36.9%
Spouse 1,146,036 17.9% 40,832 20.4% 184 18.3%
Child 1,845,458 28.9% 46,725 23.3% 292 29.1%
Other Relatives 464,896 7.3% 12,782 6.4% 90 9.0%
Non Relatives 415,253 6.5% 14,679 7.3% 68 6.8%
Non-Relative Under 18 32,217 0.5% 1,401 0.7% 5 0.5%
Non-Relative Over 65 23,198 0.4% 1,639 0.8% 10 1.0%
Unmarried Partner 186,080 2.9% 7,139 3.6% 40 4.0%
Source: Census 2010 SF1
21
Figure 8. Household Structure
Family households dominate among Fort Mojave tribal members (74%), compared to 66
percent for the State and 65 percent for the County. Non-family households account for one
fourth (26%) of tribal member households, less than the State (34%) or County (35%). Husband
and wife families account for only two-thirds (68%) of households, very similar to the State
(73%) and the County (76%). Households on the Fort Mojave Reservation are twice as likely to
be headed by a female householder (26%) with no husband present. Households headed by
single mothers are far less prevalent at the State (12%) or County (10%). Households on the
Fort Mojave Reservation have similar percentages of children under the age of 18 living in the
household (35%) as the State (34%) and the County (25%). See Table 10, and Figure 9.
0.0%
5.0%
10.0%
15.0%
20.0%
25.0%
30.0%
35.0%
40.0%
45.0%
Householder Spouse Child OtherRelatives
Non Relatives Non-Relative
Under 18
Non-Relative Over
65
UnmarriedPartner
Relationships to People in Household (Source: Census 2010, SF1)
Arizona Mohave County Fort Mojave
22
Table 10. Household by Type of Household Structure
Arizona Mohave County Fort Mojave
Total Population 6,392,017 200,186 1,004
Under 18 years 1,624,111 25% 41,210 21% 275 27%
18 years and over 4,628,522 72% 156,347 78% 729 73%
Average Household Size 2.6 2.4 3
Children Under 18 years 0.7 0.5 1
Total Households 2,380,990 82,539 370
Family households: 1,576,520 66% 54,036 65% 272 74%
Husband-wife family 1,146,036 73% 40,832 76% 184 68%
Other family: 430,484 27% 13,204 24% 88 32%
Male householder, no wife present 134,171 6% 4,620 6% 17 6%
Female householder, no husband present
296,313
12%
8,584
10%
71
26%
Nonfamily households 804,470 34% 28,503 35% 98 26%
Householder living alone 621,008 77% 22,048 77% 76 78%
Householder not living alone 183,462 23% 6,455 23% 22 22%
Households By Presence Of People Under 18 Years total:
2,380,990
82,539
370
Households With Individuals Under 18 Years 800,348 34% 20,234 25% 129 35%
Family households: 791,326 19,832 129
Husband-wife family: 504,055 63% 11,634 57% 57 44%
Under 6 years only 114,439 23% 2,332 20% 7 12%
Under 6 years and 6 to 17 years 135,778 27% 2,886 25% 15 26%
6 to 17 years only 253,838 50% 6,416 55% 35 61%
Other family: 287,271 12% 8,198 10% 72 19%
Male householder, no wife present: 85,119 30% 2,804 34% 13 18%
Under 6 years only 22,353 8% 744 9% 7 10%
Under 6 years and 6 to 17 years 18,947 7% 555 7% 2 3%
6 to 17 years only 43,819 15% 1,505 18% 4 6%
Female householder, no husband present: 202,152 70% 5,394 66% 59 82%
Under 6 years only 41,608 21% 1,199 22% 12 20%
Under 6 years and 6 to 17 years 48,367 24% 1,149 21% 20 34%
6 to 17 years only 112,177 55% 3,046 56% 27 46%
23
Table 10. Household by Type of Household Structure….continued
Arizona
Mohave County
Fort Mojave
Nonfamily households: 9,022 402 0
Male householder: 6,642 74% 74% 317 0
Under 6 years only 1,465 22% 22% 61 0
Under 6 years and 6 to 17 years 720 11% 11% 36 0
6 to 17 years only 4,457 67% 67% 220 0
Female householder: 2,380 26% 26% 85 0
Under 6 years only 546 23% 23% 14 0
Under 6 years and 6 to 17 years 218 9% 9% 5 0
6 to 17 years only 1,616 68% 68% 66 0
Households with no people under 18 years: 1,580,642 62,305 241
Family households: 785,194 50% 50% 34,204 143 59%
Husband-wife family 641,981 82% 82% 29,198 127 89%
Other family: 143,213 18% 18% 5,006 16 11%
Male householder, no wife present 49,052 34% 34% 1,816 4 25%
Female householder, no husband present 94,161 66% 66% 3,190 12 75%
Nonfamily households: 795,448 50% 50% 28,101 98 41%
Male householder 388,487 49% 49% 14,585 52 53%
Female householder 406,961 51% 51% 13,516 46 47%
Source: Census 2010 SF1

24
Figure 9. Households headed by single mothers
12.4%
10.4%
26.1%
Arizona Mohave County Fort Mojave
Households headed by single mothers (Source: Census 2010, SF1)

25
Children Under 18 Years of Age Living with Grandparent Children under age 18 living with grandparents on the Fort Mojave Indian Tribe (2.4%) occur at
roughly the same rate as the State (2.3%) and the County (2.1%). There are few differences
between the proportions of children by age living with grandparents; the only exception is that
twice as many children 5 years of age live with their grandparents (12.5%) than do so at the
State or County levels. See Table11 and Figure 10.
Table 11. Children under 18 years of age living with a grandparent householder
Arizona Mohave County Fort Mojave
Total population under 18 living with Grandparents 146,732 2.3%
4,164
2.1%
24
2.4%
Under 3 years 42,493 29.0% 1,072 25.7% 2 8.3%
3 and 4 years 22,270 15.2% 575 13.8% 4 16.7%
5 years 9,390 6.4% 248 6.0% 3 12.5%
6 to 11 years 43,309 29.5% 1,266 30.4% 7 29.2%
12 to 17 years 29,270 19.9% 1,003 24.1% 8 33.3%
Source: Census 2010 SF1

26
Figure 10. Percentage of children under 18 living with a grandparent householder
2.3%
2.1%
2.4%
Arizona Mohave County Fort Mojave
Children under 18 years of age living with Grandparent Householder

27
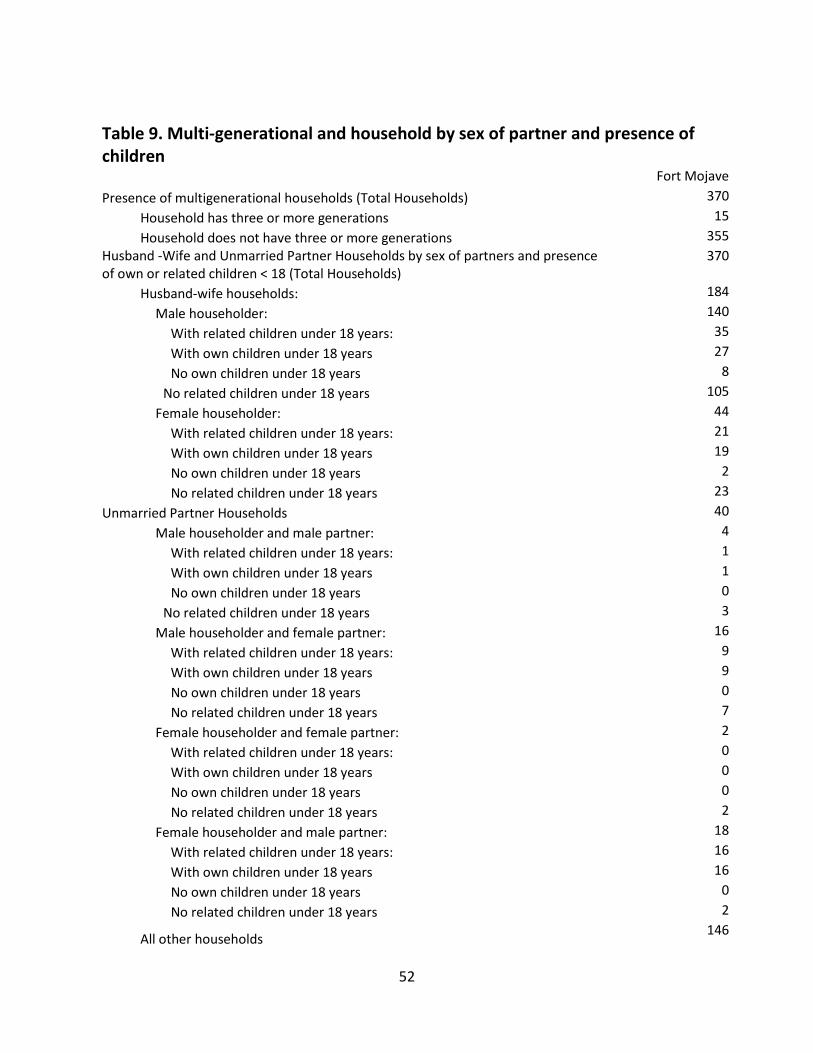
Presence of Multi-generational Households Households on the Fort Mojave Indian Tribe are about as likely to be multi-generational (4.1%),
as in the State (4.9%) or the County (3.7%). The Census defines multi-generational families as
family households consisting of more than two generations, such as a householder living with
his/her children and grandchildren. Multi-generational family households may be more likely to
reside in areas where new immigrants live with their relatives, in areas where housing
shortages or high costs force families to double up their living arrangements, or in areas that
have relatively high rates of out-of-wedlock childbearing. See Figure 11.
Figure 11. Presence of multi-generational households
4.9%
3.7% 4.1%
Arizona Mohave County Fort Mojave
Presence of multigenerational households (Source: Census 2010, SF1)

28
Household Income
The median household income for members of the Fort Mojave Indian Tribe is $33,424, less
than both the County ($39,785) and the State ($50,448), thus tribal members are more likely to
have lower household incomes than either the State or the County. In fact households are
more likely to have incomes of less the $20,000 (24%) than are residents of the State (17%) or
the County (21%). Tribal members are also more likely (34%) to have household incomes
between $20,000 and $40,000 than the State (22%) and the County (29%). Correspondingly,
one fifth (21.7%) of tribal households have incomes over $60,000, compared to the State (42%)
and the County (29%). See Table 12, and Figure 12.
Table 12. Household Income (In 2010 Inflation-Adjusted Dollars)
Household Income (In 2010 Inflation-Adjusted Dollars)
Arizona Mohave County Fort Mojave
Total Households 2,326,468
80,361 331
Less than $10,000 163,071 7.0% 5,986 7.4% 18 5.4%
$10,000 to $14,999 119,317 5.1% 5,748 7.2% 14 4.2%
$15,000 to $19,999 119,054 5.1% 5,278 6.6% 47 14.2%
$20,000 to $24,999 132,708 5.7% 5,737 7.1% 37 11.2%
$25,000 to $29,999 129,795 5.6% 6,350 7.9% 37 11.2%
$30,000 to $34,999 133,236 5.7% 5,672 7.1% 27 8.2%
$35,000 to $39,999 124,658 5.4% 5,627 7.0% 10 3.0%
$40,000 to $44,999 124,736 5.4% 5,269 6.6% 25 7.6%
$45,000 to $49,999 106,265 4.6% 4,167 5.2% 14 4.2%
$50,000 to $59,999 197,879 8.5% 7,339 9.1% 30 9.1%
$60,000 to $74,999 248,566 10.7% 7,989 9.9% 33 10.0%
$75,000 to $99,999 286,189 12.3% 7,486 9.3% 23 6.9%
$100,000 to $124,999 176,826 7.6% 3,408 4.2% 13 3.9%
$125,000 to $149,999 98,457 4.2% 1,616 2.0% - 0.0%
$150,000 to $199,999 85,914 3.7% 1,314 1.6% 1 0.3%
$200,000 or more 79,797 3.4% 1,375 1.7% 2 0.6%
Source: ACS 2010, 5-Year Estimates

29
Figure 12. Percentage of household income by range
17%
22%
19%
42%
21%
29%
21%
29%
24%
34%
21% 22%
<$20,000 $20,000 to $40,000 $40,000 to $60,000 $60,000+
Household Income (2010 Inflation Adjusted Dollars) (Source: ACS 2010)
Arizona Mohave County Fort Mojave
30
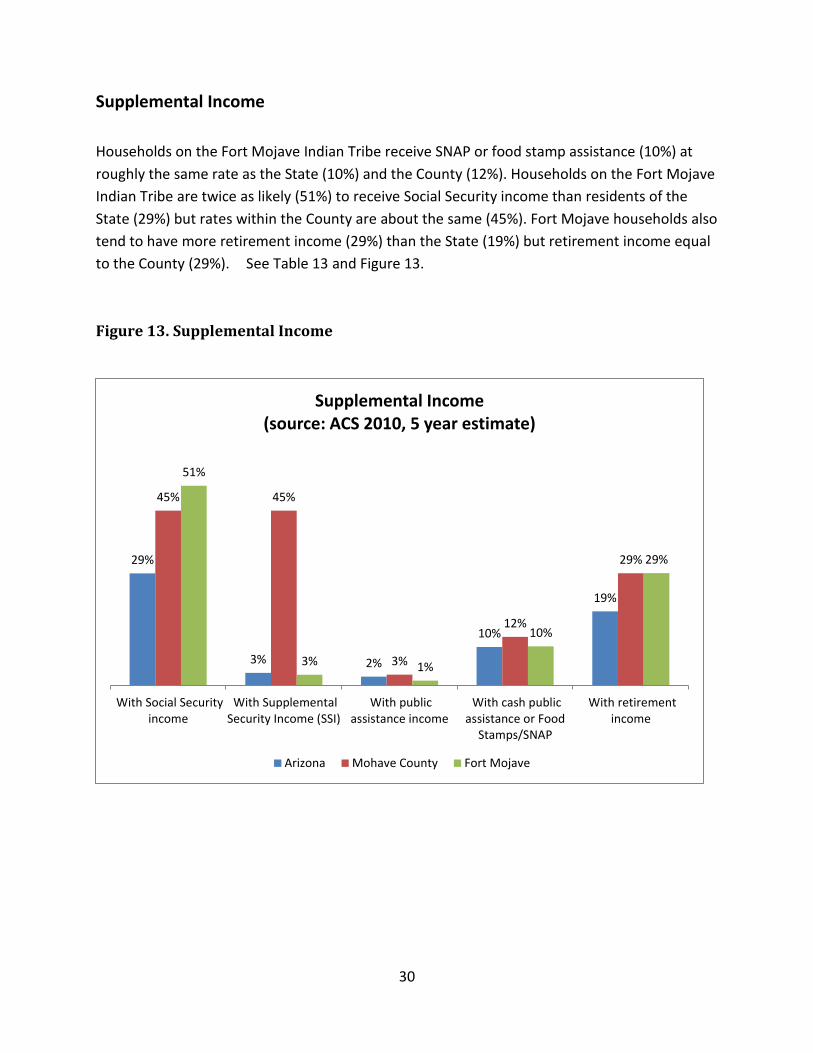
Supplemental Income
Households on the Fort Mojave Indian Tribe receive SNAP or food stamp assistance (10%) at
roughly the same rate as the State (10%) and the County (12%). Households on the Fort Mojave
Indian Tribe are twice as likely (51%) to receive Social Security income than residents of the
State (29%) but rates within the County are about the same (45%). Fort Mojave households also
tend to have more retirement income (29%) than the State (19%) but retirement income equal
to the County (29%). See Table 13 and Figure 13.
Figure 13. Supplemental Income
29%
3% 2%
10%
19%
45% 45%
3%
12%
29%
51%
3% 1%
10%
29%
With Social Securityincome
With SupplementalSecurity Income (SSI)
With publicassistance income
With cash publicassistance or Food
Stamps/SNAP
With retirementincome
Supplemental Income (source: ACS 2010, 5 year estimate)
Arizona Mohave County Fort Mojave

31
Table 13. Household Income and Benefits (In 2010 Inflation-Adjusted Dollars)
Arizona Mohave County Fort Mojave
Total: Household Income 2,326,468 80,361 331
Less than $10,000 163,071 5,986 18
$10,000 to $14,999 119,317 5,748 14
$15,000 to $19,999 119,054 5,278 47
$20,000 to $24,999 132,708 5,737 37
$25,000 to $29,999 129,795 6,350 37
$30,000 to $34,999 133,236 5,672 27
$35,000 to $39,999 124,658 5,627 10
$40,000 to $44,999 124,736 5,269 25
$45,000 to $49,999 106,265 4,167 14
$50,000 to $59,999 197,879 7,339 30
$60,000 to $74,999 248,566 7,989 33
$75,000 to $99,999 286,189 7,486 23
$100,000 to $124,999 176,826 3,408 13
$125,000 to $149,999 98,457 1,616 -
$150,000 to $199,999 85,914 1,314 1
$200,000 or more 79,797 1,375 2
Median household income in the past 12 months (in 2010 inflation-adjusted dollars) $50,448
$39,785
$33,424
Households with earnings 1820138 53,643 232
Households with Social Security income 665979 35,896 169
Households with Supplemental Security Income (SSI) 74011 3,857 9
Households with public assistance income 51253 2,196 4
Households with cash public assistance or Food Stamps/SNAP 228441
9,965
33
Households with retirement income 439525 23,036 95
Aggregate Social Security income in the past 12 months (in 2010 inflation-adjusted dollars)
$10,000,000,000 $596,778,900 $7,593,400
Aggregate Supplemental Security Income (SSI) in the past 12 months
$640,755,700 $33,635,500 $2,890,100
Aggregate public assistance income in the past 12 months (in 2010 inflation-adjusted dollars)
$166,913,400 $7,739,600 $149,000
Aggregate retirement income in the past 12 months (in 2010 inflation-adjusted dollars)
$10,000,000,000 $493,817,200 $41,500
Mean Household Income $67,436 $51,979 $44,880
Mean Household Earnings $52,921 $33,281 $22,941
Mean Household Social Security Income $16,258 $16,625 $17,101
Mean Household retirement Income $22,890 $21,437 $16,405
Mean Household Cash Public Assistance Income $3,257 $3,524 $229
Source: ACS 2010, 5-Year Estimates

32
Other Income Per capita Income on the Fort Mojave Indian Tribe ($15,706) is less than the per capita income
for Mohave County ($21,523) or the State ($25,680). Correspondingly, the median earnings for
workers ($20,500) are lower than the County ($22,472) and the State ($29,573). See Table 14.
Table 14. Other Income Measures (In 2010 Inflation-Adjusted Dollars)
Arizona
Mohave County
Fort Mojave
Per capita income $25,680 $21,523 $15,706
Median nonfamily income $33,003 $25,714 $28,194
All Male Full Time Workers 1,119,787 27,907 68
All Female Full Time Workers 785,955 20,754 109
Median earnings for workers $29,573 $22,472 $20,500
Median earnings for male full-time, year-round workers $44,021
$36,222
$26,875
Median earnings for female full-time, year-round workers $35,675
$28,060
$25,045
Source: ACS 2010, 5 Year Estimates
33
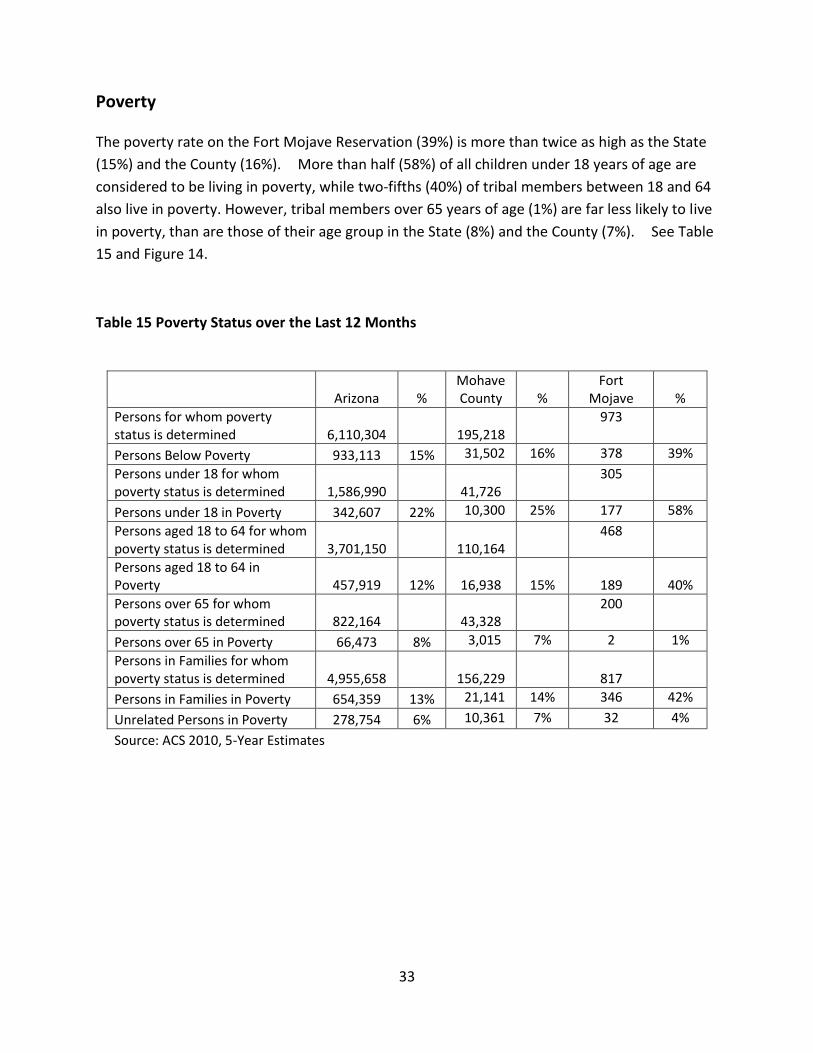
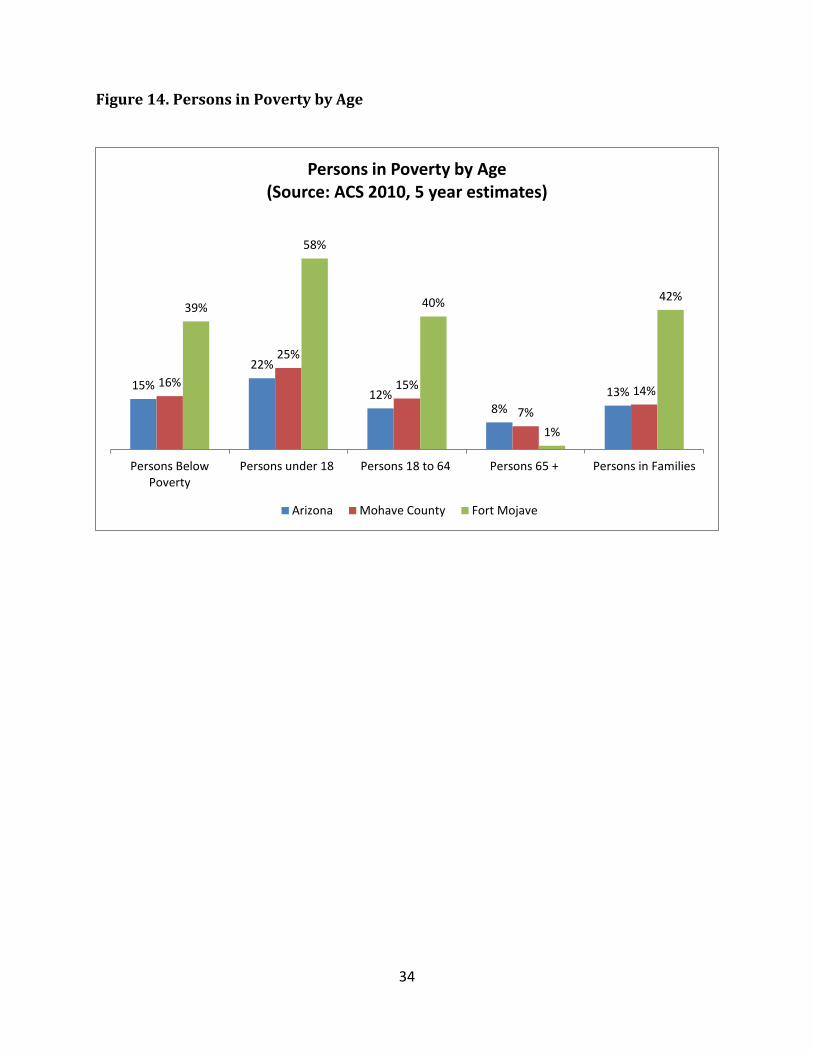
Poverty The poverty rate on the Fort Mojave Reservation (39%) is more than twice as high as the State
(15%) and the County (16%). More than half (58%) of all children under 18 years of age are
considered to be living in poverty, while two-fifths (40%) of tribal members between 18 and 64
also live in poverty. However, tribal members over 65 years of age (1%) are far less likely to live
in poverty, than are those of their age group in the State (8%) and the County (7%). See Table
15 and Figure 14.
Table 15 Poverty Status over the Last 12 Months
Arizona %
Mohave County %
Fort Mojave %
Persons for whom poverty status is determined 6,110,304
195,218
973
Persons Below Poverty 933,113 15% 31,502 16% 378 39%
Persons under 18 for whom poverty status is determined 1,586,990
41,726
305
Persons under 18 in Poverty 342,607 22% 10,300 25% 177 58%
Persons aged 18 to 64 for whom poverty status is determined 3,701,150
110,164
468
Persons aged 18 to 64 in Poverty 457,919 12%
16,938
15%
189
40%
Persons over 65 for whom poverty status is determined 822,164
43,328
200
Persons over 65 in Poverty 66,473 8% 3,015 7% 2 1%
Persons in Families for whom poverty status is determined 4,955,658
156,229
817
Persons in Families in Poverty 654,359 13% 21,141 14% 346 42%
Unrelated Persons in Poverty 278,754 6% 10,361 7% 32 4%
Source: ACS 2010, 5-Year Estimates
34
Figure 14. Persons in Poverty by Age
15%
22%
12% 8%
13% 16%
25%
15%
7%
14%
39%
58%
40%
1%
42%
Persons BelowPoverty
Persons under 18 Persons 18 to 64 Persons 65 + Persons in Families
Persons in Poverty by Age (Source: ACS 2010, 5 year estimates)
Arizona Mohave County Fort Mojave

35
Children in Poverty The poverty rates for children under 18 years of age are twice as high for the tribe (39%) than
for the State (15%) or the County (16%). The highest poverty rates for tribal members are
recorded for those children between 6 and 17 years of age, where 34 percent of these
school-aged children live below the poverty level. See Table 16.
Table 16. Poverty Status over the Last 12 Months - Children in Poverty
Arizona
Mohave County
Fort Mojave
Persons for whom poverty status is determined 6,110,304
195,218
973
Persons with income below poverty level: 933,113 15% 31,502 16% 378 39%
Children under 5 in households with income below poverty level 65,753
7%
1,772
6%
30
8%
Children 5 in households with income below poverty level 27,895
3%
1,025
3%
23
6%
Children between the ages of 6 and 17 with income below poverty level 210,090
23%
6,415
20%
127
34%
Source: ACS 2010, 5-Year Estimates

36
Households in Poverty The Census Bureau uses a set of money income thresholds that vary by family size and
composition to determine who is poor. If a family’s income is less than a family’s threshold,
then that family and every individual in it, is considered poor. Further the ratio of income to
poverty can be used to measure the degree or depth of poverty. The ratio of income to poverty
compares a person’s income with their poverty threshold, and expresses the comparison as a
fraction. For example, a poverty ratio of 1.0 (income at 100% of poverty level) means a person
is living right at the poverty line; a ratio of 0.5 (income at 50% of poverty level) would mean
that a person is living in a household making only half the income designated as the poverty
threshold. The Census Bureau describes those with family incomes below one half of their
poverty threshold as being “severely poor.” People with incomes at or above their threshold
but below 125 percent of their threshold are classified as “near poor.”
More than one-third of all households (39%) on the Fort Mojave Indian Tribe have a poverty
ratio of between .5 and .99 or what the Census classes as “severely poor,” a rate that is twice
that of the State rate (15%) or the County (16%). A further 10 percent of tribal member are
classified as “near poor” with poverty ratios between 1.00 and 1.24, lower than State (5%) or
County (7%) rate. The data indicates that 39 percent of households are stuck in the severely
poor poverty rate, while the remaining 51 percent of tribal households are found above the
poverty line. See Table 17 and Figure 15.
Table 17. Households Within Poverty Rates
Arizona Mohave County Fort Mojave
Total: Households 6,110,304
195,218 973
Under .50 433,779 7% 13,620 7% 143 15%
.50 to .99 499,334 8% 17,882 9% 235 24%
1.00 to 1.24 304,062 5% 12,581 6% 96 10%
1.25 to 1.49 309,124 5% 11,941 6% 47 5%
1.50 to 1.84 418,445 7% 15,349 8% 36 4%
1.85 to 1.99 173,042 3% 6,263 3% 25 3%
2.00 and over 3,972,518 65% 117,582 60% 391 40%
Source: ACS 2010, 5-Year Estimates

37
Figure 15. Households by Poverty Ratios
7% 8% 5%
80%
7% 9% 6%
77%
15%
24%
10%
51%
Severly Poor (Under .50) On Poverty Line (1.0) Near Poor (1.0 to 1.24) Not Poor (1.25 to 2.00 andover)
Household by Poverty Rates (Source: ACS 2010, 5 year estimates)
Arizona Mohave County Fort Mojave

38
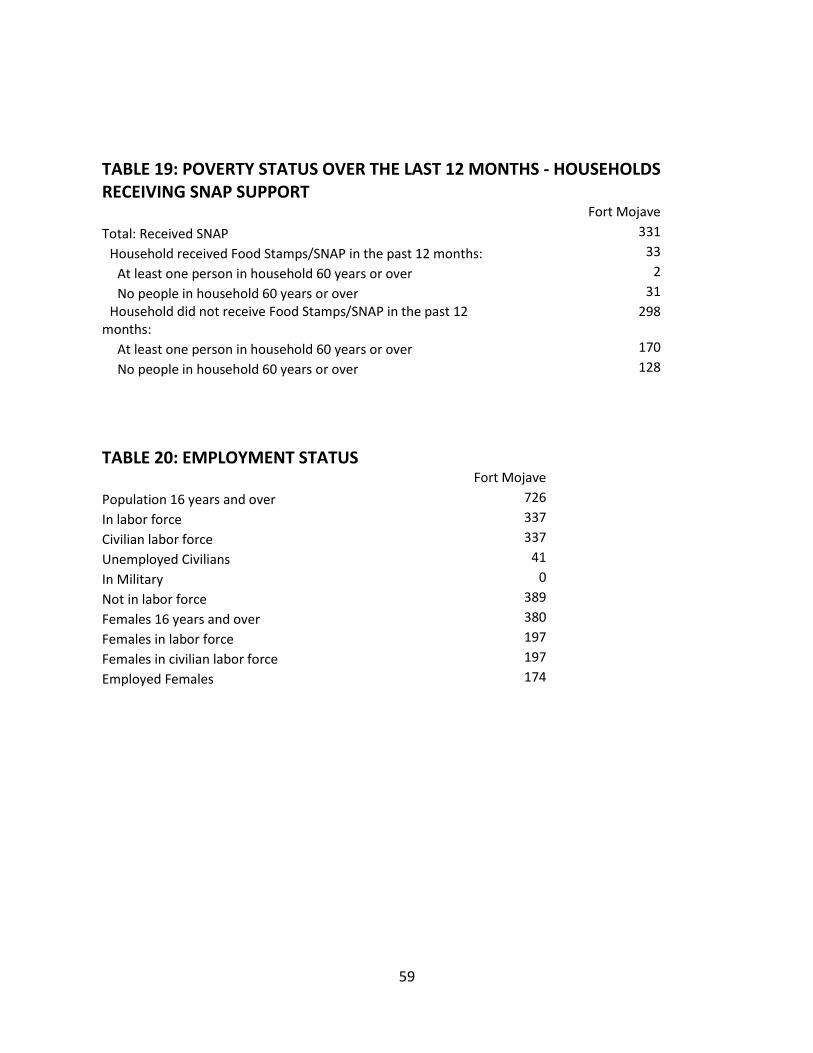
Households Receiving Supplemental Nutrition Assistance Program (SNAP) One in 10 households (10.0%) on the Fort Mojave Indian Tribe receive Supplemental Nutrition Assistance Program (SNAP) assistance. This rate is similar to that of the State (9.1%) and the County (11.6%). See Table 18.
Table 18. Households Receiving SNAP Assistance
Arizona
Mohave County Fort Mojave
Total Households 2,326,468 80,361 331
Household received Food Stamps/SNAP in the past 12 months: 212,791
9,333 33
At least one person in household 60 years or over 46,099 2,347 2
No people in household 60 years or over 166,692 6,986 31
Household did not receive Food Stamps/SNAP in the past 12 months: 2,113,677
71,028 298
At least one person in household 60 years or over 736,174 36,804 170
No people in household 60 years or over 1,377,503 34,224 128
Source: ACS 2010, 5-Year Estimates

39
Fertility The birth rate for women between the ages of 15 and 50 years is lower for the Fort Mojave Indian Tribe (4%) than for the State (6%) or the County (6%). The proportion of unmarried women giving birth in the Fort Mojave Indian Tribe (0%) is lower than the State (5%) and the County (4%). See Table 19 and Figure 16.
Table 19. Fertility
Arizona
Mohave County
Fort Mojave
Women 15 to 50 years old 1,509,650 38,255 235
Unmarried Women 15 to 50 years old 781,186 19,143 145
Women 15 to 50 years old who had a birth in the past 12 months 93,740
2,204
9
Unmarried women who gave birth 33,462 945 0
Women 15 to 19 years of age 218,696 5,771 58
Women 20 to 34 years of age 624,571 13,318 89
Women 35 to 50 years of age 666,383 19,166 88
Births Per 1,000 unmarried women 43 49 0
Births Per 1,000 women 15 to 50 years old 62 58 38
Births Per 1,000 women 15 to 19 years old 37 41 103
Births Per 1,000 women 20 to 34 years old 112 123 34
Births Per 1,000 women 35 to 50 years old 24 17 0

40
Figure 16. Birth Rates per 1000 Women
These data provide a snapshot in time for the Fort Mojave Indian Tribe, primarily the status of the population at the time of the 2010 Census, and the American Community Survey estimates for the period 2006 to 2010.
0
20
40
60
80
100
120
140
Unmarried women Women 15 to 50years old
Women 15 to 19years old
Women 20 to 34years old
Women 35 to 50years old
Births per 1000 Women (Source: ACS 2010, 5 year estimates)
Arizona Mohave County Fort Mojave

41
APPENDIX A: FORT MOJAVE INDIAN TRIBE CENSUS 2010

42
Table 1: Total Population and Trends
Fort Mojave
Population 2000 1,043
Total Population 1,004
Males 468
Females 536
Population Density (persons per square mile) 28
Total Area Square Miles 36.8

43
Table 2. Age 5 Year Age Cohorts Fort Mojave
Under 5 years 71
5 to 9 years 86
10 to 14 years 77
15 to 17 years 41
18 and 19 years 27
20 years 16
21 years 11
22 to 24 years 40
25 to 29 years 45
30 to 34 years 54
35 to 39 years 46
40 to 44 years 38
45 to 49 years 60
50 to 54 years 49
55 to 59 years 53
60 and 61 years 17
62 to 64 years 41
65 and 66 years 22
67 to 69 years 52
70 to 74 years 69
75 to 79 years 38
80 to 84 years 33
85 years and over 18
Median Age 38.6
Median Age - Male 40.8
Median Age - Female 36.8
Age 0 to 17 237
18 to 24 Years 39
25 to 44 Years 41
45 to 64 Years 109
62 Years and Over 273
65 Years and Over 190
18 & Over 729
Male 18 & Over 335
Female 18 & Over/ 394
21 & Over 686
15 to 19 Years 68
Male 65 & Over 109
Female 65 & Over 123

44
Males Age 17 and Under
Fort Mojave
Male: 468
Under 1 year 6
1 year 13
2 years 4
3 years 11
4 years 6
5 years 9
6 years 9
7 years 8
8 years 7
9 years 6
10 years 5
11 years 14
12 years 6
13 years 5
14 years 7
15 years 9
16 years 1
17 years 7

45
Females Age 17 and Under
Fort Mojave
Female: 536
Under 1 year 5
1 year 6
2 years 5
3 years 7
4 years 8
5 years 9
6 years 9
7 years 8
8 years 9
9 years 12
10 years 10
11 years 6
12 years 8
13 years 10
14 years 6
15 years 9
16 years 7
17 years 8

46
Fort Mojave
Males 468
Under 5 years 40
5 to 9 years 39
10 to 14 years 37
15 to 17 years 17
18 and 19 years 14
20 years 5
21 years 5
22 to 24 years 16
25 to 29 years 14
30 to 34 years 22
35 to 39 years 22
40 to 44 years 18
45 to 49 years 33
50 to 54 years 28
55 to 59 years 24
60 and 61 years 7
62 to 64 years 18
65 and 66 years 10
67 to 69 years 25
70 to 74 years 29
75 to 79 years 21
80 to 84 years 17
85 years and over 7
47
Fort Mojave
Females 536
Under 5 years 31
5 to 9 years 47
10 to 14 years 40
15 to 17 years 24
18 and 19 years 13
20 years 11
21 years 6
22 to 24 years 24
25 to 29 years 31
30 to 34 years 32
35 to 39 years 24
40 to 44 years 20
45 to 49 years 27
50 to 54 years 21
55 to 59 years 29
60 and 61 years 10
62 to 64 years 23
65 and 66 years 12
67 to 69 years 27
70 to 74 years 40
75 to 79 years 17
80 to 84 years 16
85 years and over 11

48
TABLE 3. RACE
Fort Mojave
Total Population 1004
White 422
Black or African American 6
American Indian or Alaskan Native 405
Asian 3
Hawaiian and Other Pacific Islander 1
Some Other Race 95
Multi Race - Persons reporting more than one race
72
Hispanic or Latino of any race 253
Not Hispanic or Latino 751
Table 4. Hispanic or Latino and Race
Fort Mojave
Hispanic or Latino of any race 253
Mexican 217
Puerto Rican 3
Cuban 0
Other Hispanic or Latino 473
Not Hispanic or Latino 751
49
Table 5. Relationship of persons in Household
Fort Mojave
Householder 370
Spouse 184
Child 292
Other Relatives 90
Non Relatives 68
Non-Relative Under 18 5
Non-Relative Over 65 10
Unmarried Partner 40
Table 6. Households by Type
Fort Mojave
Total Households 370
Family Households (Families) 272
Families With Own Children Under 18 Years 105
Married Couple Family 184
Married Couples With Own Children Under 18 Years
46
Female householder, No Husband Present 71
Single Mothers With Own Children Under 18 Years
48
Non Family Households 98
Unmarried Partner Households 40
Same-Sex Unmarried Partner Households 6
Householder Living Alone 76
Householder 65 Years and Over 138
Households With Individuals Under 18 Years 129
Average Household Size 2.7
Average Family Size 3.1

50
Table 7. Household by Type of Household Structure
Fort Mojave
Total Population 1004
Under 18 years 275
18 years and over 729
Average Household Size 2.7
Under 18 years 0.7
Household Type Total: 370
Family households: 272
Husband-wife family 184
Other family: 88
Male householder, no wife present 17
Female householder, no husband present 71
Nonfamily households 98
Householder living alone 76
Householder not living alone 22
Households By Presence Of People Under 18 Years By Household Type By Age Of People Under 18 Years Total:
370
Households With Individuals Under 18 Years 129
Family households: 129
Husband-wife family: 57
Under 6 years only 7
Under 6 years and 6 to 17 years 15
6 to 17 years only 35
Other family: 72
Male householder, no wife present: 13
Under 6 years only 7
Under 6 years and 6 to 17 years 2
6 to 17 years only 4
Female householder, no husband present: 59
Under 6 years only 12
Under 6 years and 6 to 17 years 20
6 to 17 years only 27
Nonfamily households: 0
Male householder: 0
Under 6 years only 0
Under 6 years and 6 to 17 years 0
6 to 17 years only 0
Female householder: 0
Under 6 years only 0
Under 6 years and 6 to 17 years 0

51
6 to 17 years only 0
Households with no people under 18 years: 241
Family households: 143
Husband-wife family 127
Other family: 16
Male householder, no wife present 4
Female householder, no husband present 12
Nonfamily households: 98
Male householder 52
Female householder 46
Table 8. Children under 18 years of age living with Grandparent
Fort Mojave
Children under 18 years of age living with grandparent Householder 24
Under 3 years 2
3 and 4 years 4
5 years 3
6 to 11 years 7
12 to 17 years 8
52
Table 9. Multi-generational and household by sex of partner and presence of children
Fort Mojave
Presence of multigenerational households (Total Households) 370
Household has three or more generations 15
Household does not have three or more generations 355
Husband -Wife and Unmarried Partner Households by sex of partners and presence of own or related children < 18 (Total Households)
370
Husband-wife households: 184
Male householder: 140
With related children under 18 years: 35
With own children under 18 years 27
No own children under 18 years 8
No related children under 18 years 105
Female householder: 44
With related children under 18 years: 21
With own children under 18 years 19
No own children under 18 years 2
No related children under 18 years 23
Unmarried Partner Households 40
Male householder and male partner: 4
With related children under 18 years: 1
With own children under 18 years 1
No own children under 18 years 0
No related children under 18 years 3
Male householder and female partner: 16
With related children under 18 years: 9
With own children under 18 years 9
No own children under 18 years 0
No related children under 18 years 7
Female householder and female partner: 2
With related children under 18 years: 0
With own children under 18 years 0
No own children under 18 years 0
No related children under 18 years 2
Female householder and male partner: 18
With related children under 18 years: 16
With own children under 18 years 16
No own children under 18 years 0
No related children under 18 years 2
All other households 146

53
TABLE 10. GROUP QUARTERS
Fort Mojave
Population in Group Quarters 0
Institutionalized Population 0
Population in Correctional Institutions 0
Population in Nursing Homes 0
Population in Other Institutions 0
Non-institutionalized Group Quarters Population 0
College Dormitories (Includes college quarters off campus)
0
Military Quarters 0
Other Non-Institutionalized Group Quarters Population 0
TABLE 11. HOUSING OCCUPANCY AND TENURE
Fort Mojave
Total Housing Units 434
Occupied Housing Units 370
Owner Occupied 202
Renter Occupied 168
Vacant Housing Units 64
Vacant for Rent 10
Vacant for Sale 7
Vacant for Seasonal, Recreation or Occasional Use 27
Total Owner Units Including Units for Sale 209
Population in Rented Units 569
Average Size of Owner-Occupied Units 2.1
Average Size of Renter-Occupied Units 3.4

54
APPENDIX B: FORT MOJAVE INDIAN TRIBE
AMERICAN COMMUNITY SURVEY 2010, 5-YEAR ESTIMATES

55
TABLE 12: HOUSEHOLD INCOME AND BENEFITS (IN 2010 INFLATION-ADJUSTED DOLLARS)
Fort Mojave
Total: Household Income 331
Less than $10,000 18
$10,000 to $14,999 14
$15,000 to $19,999 47
$20,000 to $24,999 37
$25,000 to $29,999 37
$30,000 to $34,999 27
$35,000 to $39,999 10
$40,000 to $44,999 25
$45,000 to $49,999 14
$50,000 to $59,999 30
$60,000 to $74,999 33
$75,000 to $99,999 23
$100,000 to $124,999 13
$125,000 to $149,999 0
$150,000 to $199,999 1
$200,000 or more 2
Median household income in the past 12 months (in 2010 inflation-adjusted dollars)
$33,424
With earnings 232
With Social Security income 169
With Supplemental Security Income (SSI) 9
With public assistance income 4
With cash public assistance or Food Stamps/SNAP 33
With retirement income 95
Aggregate earnings in the past 12 months (in 2010 inflation-adjusted dollars)
$7,593,400
Aggregate Social Security income in the past 12 months (in 2010 inflation-adjusted dollars)
$2,890,100
Aggregate Supplemental Security Income (SSI) in the past 12 months (in 2010 inflation-adjusted dollars)
$149,000
Aggregate public assistance income in the past 12 months (in 2010 inflation-adjusted dollars)
$41,500
Aggregate retirement income in the past 12 months (in 2010 inflation-adjusted dollars)
$1,558,500
Mean Household Income $44,880
Mean Household Earnings $22,941
Mean Household Social Security Income $17,101
Mean Household retirement Income $16,405
Mean Household Cash Public Assistance Income $10,375

56
TABLE 13: FAMILY INCOME AND BENEFITS (IN 2010 INFLATION-ADJUSTED DOLLARS)
Fort Mojave
Family Households 234
Less than $10,000 18
$10,000 to $14,999 8
$15,000 to $24,999 53
$25,000 to $34,999 43
$35,000 to $49,999 39
$50,000 to $74,999 46
$75,000 to $99,999 23
$100,000 to $149,999 1
$150,000 to $199,999 1
$200,000 or more 2
Median family income $34,375
Mean family income $46,253
TABLE 14: OTHER INCOME MEASURES (IN 2010 INFLATION-ADJUSTED DOLLARS)
Fort Mojave
Per capita income $15,706
Median nonfamily income $28,194
All Male Full Time Workers 68
All Female Full Time Workers 109
Median earnings for workers $20,500
Median earnings for male full-time, year-round workers
$26,875
Median earnings for female full-time, year-round workers
$25,045

57
TABLE 15: POVERTY STATUS OVER THE LAST 12 MONTHS - HOUSEHOLDS WITHIN POVERT RATES
Fort Mojave
Total: Households
973
Under .50 143
.50 to .99 235
1.00 to 1.24 96
1.25 to 1.49 47
1.50 to 1.84 36
1.85 to 1.99 25
2.00 and over 391
TABLE 16: POVERTY STATUS OVER THE LAST 12 MONTHS
Fort Mojave
Persons for whom poverty status is determined 973
Persons Below Poverty 378
Persons under 18 for whom poverty status is determined 305
Persons under 18 in Poverty 177
Persons aged 18 to 64 for whom poverty status is determined
468
Persons aged 18 to 64 in Poverty 189
Persons over 65 for whom poverty status is determined 200
Persons over 65 in Poverty 2
Persons in Families for whom poverty status is determined 817
Persons in Families in Poverty 346
Unrelated Persons in Poverty 32

58
TABLE 17: POVERTY STATUS OVER THE LAST 12 MONTHS - CHILDREN IN POVERTY
Fort Mojave
Total: Persons for whom poverty status is determined 973
Persons with income in the past 12 months below poverty level: 378
Children under 5 years of age in households with income in the past 12 months below poverty level
30
Children 5 years of age in households with income in the past 12 months below poverty level
23
Children between the ages of 6 and 17 in households with income in the past 12 months below poverty level
127
Persons 65 years or older in households with income in the past 12 months below poverty level
198
TABLE 18: POVERTY STATUS OVER THE LAST 12 MONTHS - HOUSEHOLDS WITHIN POVERTY RATES
Fort Mojave
Total: Households 973
Under .50 143
.50 to .99 235
1.00 to 1.24 96
1.25 to 1.49 47
1.50 to 1.84 36
1.85 to 1.99 25
2.00 and over 391
59
TABLE 19: POVERTY STATUS OVER THE LAST 12 MONTHS - HOUSEHOLDS RECEIVING SNAP SUPPORT
Fort Mojave
Total: Received SNAP 331
Household received Food Stamps/SNAP in the past 12 months: 33
At least one person in household 60 years or over 2
No people in household 60 years or over 31
Household did not receive Food Stamps/SNAP in the past 12 months:
298
At least one person in household 60 years or over 170
No people in household 60 years or over 128
TABLE 20: EMPLOYMENT STATUS
Fort Mojave
Population 16 years and over 726
In labor force 337
Civilian labor force 337
Unemployed Civilians 41
In Military 0
Not in labor force 389
Females 16 years and over 380
Females in labor force 197
Females in civilian labor force 197
Employed Females 174

60
TABLE 21: EMPLOYMENT STATUS
Fort Mojave
Total Workforce 296
Total: Workers 16 years and over 270
Male: 122
Female: 174
Private for-profit wage and salary workers 181
Self-employed in own incorporated businesses 8
Private not-for-profit wage and salary workers 45
Local government workers 45
Federal government workers 10
Self-employed in own not incorporated business workers
6
Unpaid family workers 0
TABLE 22: WORKERS BY INDUSTRY
Fort Mojave
Agriculture, forestry, fishing and hunting, and mining 13
Construction 10
Manufacturing 1
Wholesale trade 0
Retail trade 16
Transportation and warehousing, and utilities 12
Information 0
Finance and insurance, and real estate and rental and leasing 8
Professional, scientific, management, and administrative 6
Educational services, and health care, and social assistance 86
Arts, entertainment, and recreation, and accommodation, and food services
115
Other services, except public administration 5
Public administration 24

61
TABLE 23: CLASS OF WORKER
Fort Mojave
Employed Civilians 296
Private wage and salary workers 226
Government workers 64
Self-employed workers in own not incorporated business
6
Unpaid family workers 0
TABLE 24: MARITAL STATUS
Fort Mojave
15 years and over 742
Never married 241
Now married, except separated 361
Separated 18
Widowed 52
Divorced, and not currently married 70
TABLE 25: FERTILITY Universe women 15 to 50 who gave birth in the past 12 months
Fort Mojave
Women 15 to 50 years old 235
Unmarried Women 15 to 50 years old 145
Women 15 to 50 years old who had a birth in the past 12 months
9
Unmarried women who gave birth 0
Women 15 to 19 years of age 58
Women 20 to 34 years of age 89
Women 35 to 50 years of age 88
Births Per 1,000 unmarried women 0
Births Per 1,000 women 15 to 50 years old 38
Births Per 1,000 women 15 to 19 years old 103
Births Per 1,000 women 20 to 34 years old 34
Births Per 1,000 women 35 to 50 years old 0
62
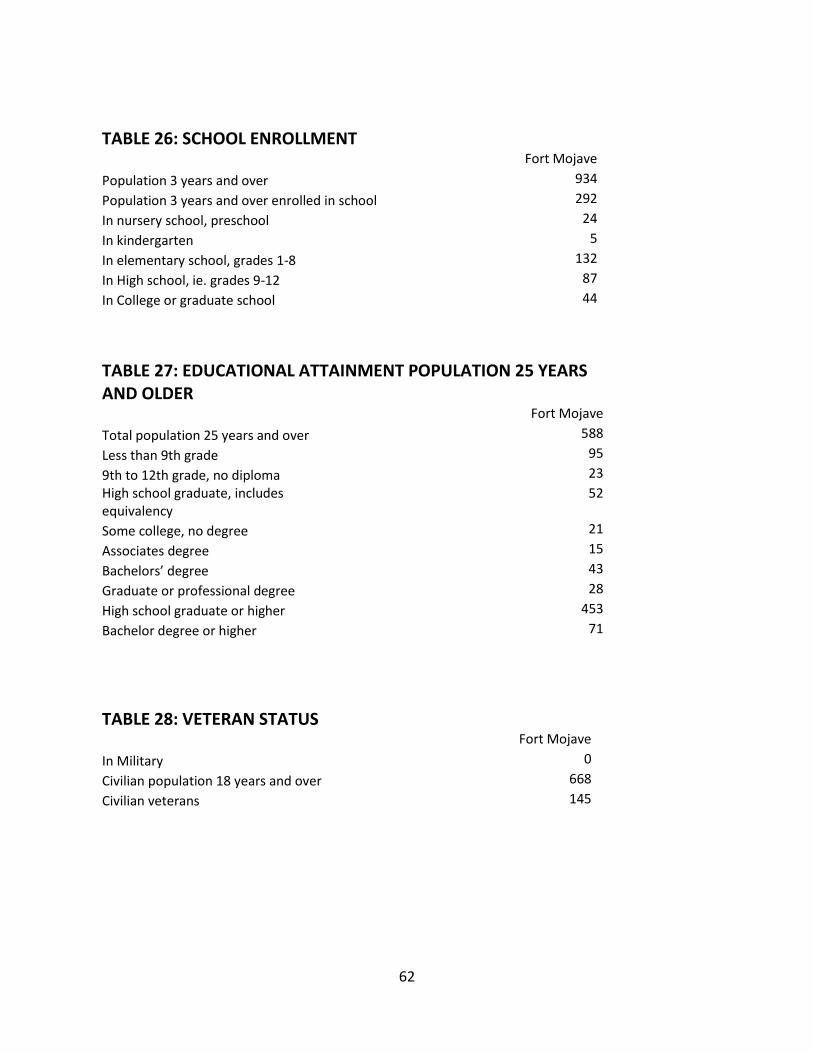
TABLE 26: SCHOOL ENROLLMENT
Fort Mojave
Population 3 years and over 934
Population 3 years and over enrolled in school 292
In nursery school, preschool 24
In kindergarten 5
In elementary school, grades 1-8 132
In High school, ie. grades 9-12 87
In College or graduate school 44
TABLE 27: EDUCATIONAL ATTAINMENT POPULATION 25 YEARS AND OLDER
Fort Mojave
Total population 25 years and over 588
Less than 9th grade 95
9th to 12th grade, no diploma 23
High school graduate, includes equivalency
52
Some college, no degree 21
Associates degree 15
Bachelors’ degree 43
Graduate or professional degree 28
High school graduate or higher 453
Bachelor degree or higher 71
TABLE 28: VETERAN STATUS
Fort Mojave
In Military 0
Civilian population 18 years and over 668
Civilian veterans 145

63
TABLE 29: RESIDENCE 1 YEAR AGO
Fort Mojave
Population 1 year and over 969
Same house 777
Different house in the U.S 156
Same county, different house 68
Different county 149
Different county, Same state 0
Different state 88
Lived Abroad 1 year ago 0
TABLE 30: LANGUAGE SPOKEN AT HOME
Fort Mojave
5 years and over 925
English only 735
Language other than English 190
Speaks English less than very well 68
Speak Spanish 142
Speaks English less than very well 65

64
APPENDIX C:
FORT MOJAVE INDIAN TRIBE AMERICAN COMMUNITY SURVEY 2010, 5-YEAR ESTIMATES
MARGIN OF ERROR ESTIMATES
65
ACS Margin of Error Estimates The ACS estimates are based on data from a sample of housing units and people in the population, not the full populations. For this reason, ACS estimates have a degree of uncertainty associated with them, called sampling error. In general, the larger the sample, the smaller the level of sampling error. The ACS calculates standard errors for each estimate produced and publishes the 90 percent confidence level margins of error (the Census Bureau standard). You can be 90 percent confident that the interval within the margin of error from the estimate includes the true value. Users can add and subtract the margin of error value from the estimate to find the top and bottom of the range within which the ACS is 90 percent confident in their estimate lies.
Understanding margin of error A term you will often come across in survey research is "within the margin of error." Most people hear the term frequently during election season when results from polls are reported. Many surveys and polls collect data from a representative sample of a population to make determinations about a larger population. Results would be somewhat different each time the survey is administered to a different representative sample. The margin of error accounts for these differences by calculating an upper and lower boundary the true result would likely fall between if every member of population was surveyed. For example, in the case of the Fort Mojave Indian Tribe the ACS has established that there are 577 households represented on the Fort Mojave Indian Tribe. The survey also indicates that there are 444 family households (families) with a margin of error of plus or minus (±) 7.2 percent and 76.9 percent of the respondents responding indicated that they were in fact family households. The margin of error tells us that if the same survey were administered to the Fort Mojave Indian Tribe members again, it is highly probable that the percent of "family household" responses would be between 69.7 percent and 84.1 percent, or 76.9 percent ± 7.2 percent.

66
Subject Fort Mojave Reservation and Off-Reservation Trust Land, AZ--CA--NV
Estimate Estimate Margin
of Error
Percent Percent Margin of
Error
HOUSEHOLDS BY TYPE
Total households 577 +/-78 577 (X)
Family households (families) 444 +/-75 76.9% +/-7.2
With own children under
18 years
96 +/-36 16.6% +/-5.6
Married-couple family 316 +/-67 54.8% +/-9.0
With own children under
18 years
41 +/-22 7.1% +/-3.7
Male householder, no wife
present, family
25 +/-21 4.3% +/-3.7
With own children under
18 years
9 +/-12 1.6% +/-2.0
Female householder, no
husband present, family
103 +/-40 17.9% +/-6.3
With own children under
18 years
46 +/-27 8.0% +/-4.5
Nonfamily households 133 +/-44 23.1% +/-7.2
Householder living alone 101 +/-37 17.5% +/-6.0
65 years and over 53 +/-23 9.2% +/-4.1
Households with one or more
people under 18 years
156 +/-51 27.0% +/-7.2
Households with one or more
people 65 years and over
265 +/-56 45.9% +/-7.8
Average household size 2.69 +/-0.31 (X) (X)
Average family size 3.03 +/-0.35 (X) (X)
RELATIONSHIP
Population in households 1,555 +/-286 1,555 (X)
Householder 577 +/-78 37.1% +/-4.2
Spouse 324 +/-67 20.8% +/-3.7
Child 340 +/-122 21.9% +/-5.9
Other relatives 239 +/-124 15.4% +/-6.4
Nonrelatives 75 +/-47 4.8% +/-2.9
Unmarried partner 36 +/-27 2.3% +/-1.7
MARITAL STATUS
Males 15 years and over 617 +/-106 617 (X)
Never married 176 +/-67 28.5% +/-8.1
Now married, except
separated
335 +/-69 54.3% +/-9.4
Separated 0 +/-119 0.0% +/-5.1
Widowed 29 +/-21 4.7% +/-3.3
Divorced 77 +/-36 12.5% +/-5.6
Females 15 years and over 660 +/-125 660 (X)

67
Never married 178 +/-69 27.0% +/-7.0
Now married, except
separated
334 +/-73 50.6% +/-7.8
Separated 18 +/-19 2.7% +/-2.8
Widowed 93 +/-36 14.1% +/-5.6
Divorced 37 +/-23 5.6% +/-3.4
FERTILITY
Number of women 15 to 50
years old who had a birth in the
past 12 months
21 +/-19 21 (X)
Unmarried women (widowed,
divorced, and never married)
9 +/-14 42.9% +/-53.7
Per 1,000 unmarried women 45 +/-72 (X) (X)
Per 1,000 women 15 to 50
years old
67 +/-57 (X) (X)
Per 1,000 women 15 to 19
years old
88 +/-123 (X) (X)
Per 1,000 women 20 to 34
years old
86 +/-105 (X) (X)
Per 1,000 women 35 to 50
years old
28 +/-51 (X) (X)
GRANDPARENTS
Number of grandparents
living with own grandchildren
under 18 years
89 +/-62 89 (X)
Responsible for grandchildren 59 +/-58 66.3% +/-27.3
Years responsible for
grandchildren
Less than 1 year 17 +/-22 19.1% +/-24.0
1 or 2 years 0 +/-119 0.0% +/-29.7
3 or 4 years 3 +/-9 3.4% +/-11.4
5 or more years 39 +/-51 43.8% +/-35.7
Number of grandparents
responsible for own
grandchildren under 18 years
59 +/-58 59 (X)
Who are female 39 +/-32 66.1% +/-18.6
Who are married 53 +/-57 89.8% +/-24.3
SCHOOL ENROLLMENT
Population 3 years and over
enrolled in school
335 +/-125 335 (X)
Nursery school, preschool 26 +/-27 7.8% +/-8.1
Kindergarten 8 +/-9 2.4% +/-2.8
Elementary school (grades
1-8)
143 +/-84 42.7% +/-17.1
High school (grades 9-12) 105 +/-65 31.3% +/-12.9
College or graduate school 53 +/-29 15.8% +/-8.8
EDUCATIONAL
ATTAINMENT
Population 25 years and
over
1,078 +/-149 1,078 (X)

68
Less than 9th grade 34 +/-20 3.2% +/-1.8
9th to 12th grade, no diploma 153 +/-52 14.2% +/-4.4
High school graduate
(includes equivalency)
383 +/-80 35.5% +/-5.6
Some college, no degree 282 +/-63 26.2% +/-5.4
Associate's degree 45 +/-24 4.2% +/-2.3
Bachelor's degree 72 +/-30 6.7% +/-2.8
Graduate or professional
degree
109 +/-67 10.1% +/-5.8
Percent high school graduate
or higher
(X) (X) 82.7% +/-4.4
Percent bachelor's degree or
higher
(X) (X) 16.8% +/-6.3
VETERAN STATUS
Civilian population 18 years
and over
1,185 +/-177 1,185 (X)
Civilian veterans 253 +/-54 21.4% +/-4.2
DISABILITY STATUS OF
THE CIVILIAN
NONINSTITUTIONALIZED
POPULATION
Total Civilian
Noninstitutionalized Population
(X) (X) (X) (X)
With a disability (X) (X) (X) (X)
Under 18 years (X) (X) (X) (X)
With a disability (X) (X) (X) (X)
18 to 64 years (X) (X) (X) (X)
With a disability (X) (X) (X) (X)
65 years and over (X) (X) (X) (X)
With a disability (X) (X) (X) (X)
RESIDENCE 1 YEAR AGO
Population 1 year and over 1,526 +/-278 1,526 (X)
Same house 1,280 +/-244 83.9% +/-6.7
Different house in the U.S. 210 +/-102 13.8% +/-6.1
Same county 81 +/-72 5.3% +/-4.5
Different county 129 +/-71 8.5% +/-4.5
Same state 3 +/-5 0.2% +/-0.3
Different state 126 +/-71 8.3% +/-4.5
Abroad 36 +/-47 2.4% +/-3.0
PLACE OF BIRTH
Total population 1,555 +/-286 1,555 (X)
Native 1,422 +/-265 91.4% +/-4.4
Born in United States 1,413 +/-264 90.9% +/-4.5
State of residence 506 +/-209 32.5% +/-9.2
Different state 907 +/-135 58.3% +/-8.5
Born in Puerto Rico, U.S. 9 +/-11 0.6% +/-0.7

69
Island areas, or born abroad to
American parent(s)
Foreign born 133 +/-74 8.6% +/-4.4
U.S. CITIZENSHIP STATUS
Foreign-born population 133 +/-74 133 (X)
Naturalized U.S. citizen 58 +/-34 43.6% +/-20.5
Not a U.S. citizen 75 +/-56 56.4% +/-20.5
YEAR OF ENTRY
Population born outside the
United States
142 +/-77 142 (X)
Native 9 +/-11 9 (X)
Entered 2000 or later 0 +/-119 0.0% +/-98.9
Entered before 2000 9 +/-11 100.0% +/-98.9
Foreign born 133 +/-74 133 (X)
Entered 2000 or later 49 +/-48 36.8% +/-27.6
Entered before 2000 84 +/-53 63.2% +/-27.6
WORLD REGION OF BIRTH
OF FOREIGN BORN
Foreign-born population,
excluding population born at sea
133 +/-74 133 (X)
Europe 30 +/-43 22.6% +/-26.0
Asia 51 +/-35 38.3% +/-23.7
Africa 2 +/-3 1.5% +/-2.6
Oceania 0 +/-119 0.0% +/-21.5
Latin America 48 +/-46 36.1% +/-26.9
Northern America 2 +/-4 1.5% +/-2.8
LANGUAGE SPOKEN AT
HOME
Population 5 years and over 1,474 +/-265 1,474 (X)
English only 1,208 +/-200 82.0% +/-5.3
Language other than English 266 +/-105 18.0% +/-5.3
Speak English less than
"very well"
87 +/-61 5.9% +/-3.9
Spanish 160 +/-88 10.9% +/-4.8
Speak English less than
"very well"
65 +/-58 4.4% +/-3.8
Other Indo-European
languages
22 +/-24 1.5% +/-1.6
Speak English less than
"very well"
0 +/-119 0.0% +/-2.2
Asian and Pacific Islander
languages
37 +/-26 2.5% +/-1.8
Speak English less than
"very well"
15 +/-14 1.0% +/-1.0
Other languages 47 +/-39 3.2% +/-2.6
Speak English less than
"very well"
7 +/-10 0.5% +/-0.7
ANCESTRY
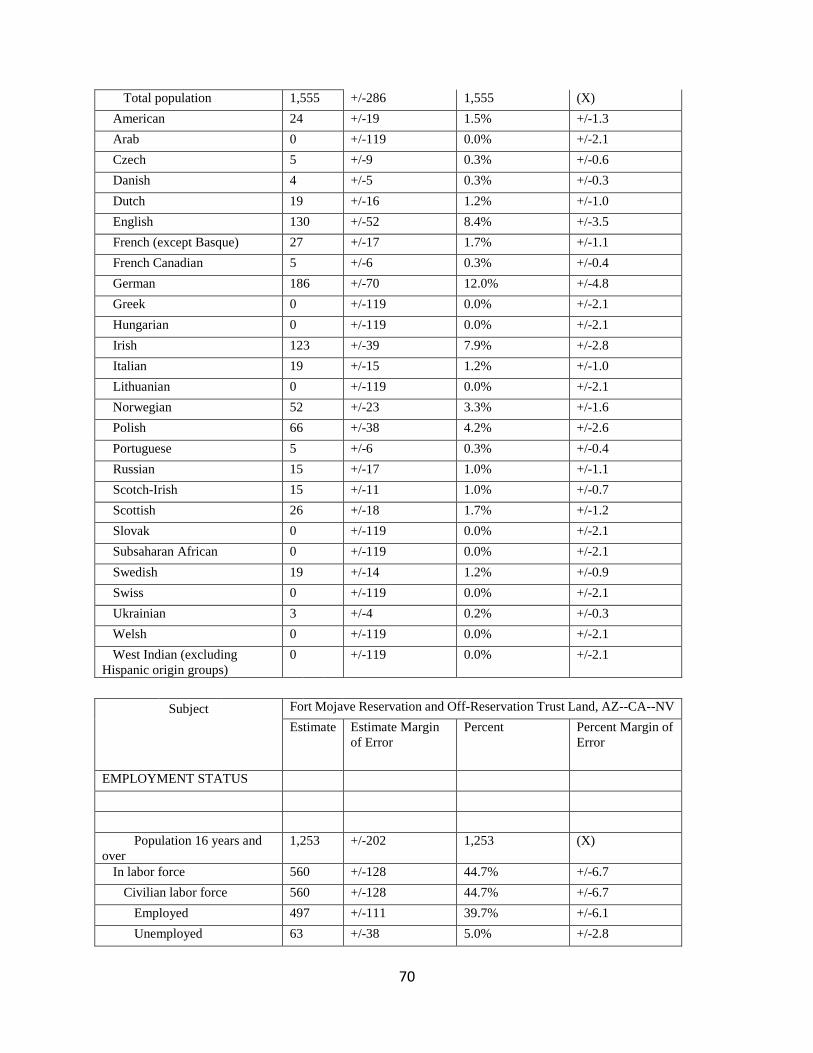
70
Total population 1,555 +/-286 1,555 (X)
American 24 +/-19 1.5% +/-1.3
Arab 0 +/-119 0.0% +/-2.1
Czech 5 +/-9 0.3% +/-0.6
Danish 4 +/-5 0.3% +/-0.3
Dutch 19 +/-16 1.2% +/-1.0
English 130 +/-52 8.4% +/-3.5
French (except Basque) 27 +/-17 1.7% +/-1.1
French Canadian 5 +/-6 0.3% +/-0.4
German 186 +/-70 12.0% +/-4.8
Greek 0 +/-119 0.0% +/-2.1
Hungarian 0 +/-119 0.0% +/-2.1
Irish 123 +/-39 7.9% +/-2.8
Italian 19 +/-15 1.2% +/-1.0
Lithuanian 0 +/-119 0.0% +/-2.1
Norwegian 52 +/-23 3.3% +/-1.6
Polish 66 +/-38 4.2% +/-2.6
Portuguese 5 +/-6 0.3% +/-0.4
Russian 15 +/-17 1.0% +/-1.1
Scotch-Irish 15 +/-11 1.0% +/-0.7
Scottish 26 +/-18 1.7% +/-1.2
Slovak 0 +/-119 0.0% +/-2.1
Subsaharan African 0 +/-119 0.0% +/-2.1
Swedish 19 +/-14 1.2% +/-0.9
Swiss 0 +/-119 0.0% +/-2.1
Ukrainian 3 +/-4 0.2% +/-0.3
Welsh 0 +/-119 0.0% +/-2.1
West Indian (excluding
Hispanic origin groups)
0 +/-119 0.0% +/-2.1
Subject Fort Mojave Reservation and Off-Reservation Trust Land, AZ--CA--NV
Estimate Estimate Margin
of Error
Percent Percent Margin of
Error
EMPLOYMENT STATUS
Population 16 years and
over
1,253 +/-202 1,253 (X)
In labor force 560 +/-128 44.7% +/-6.7
Civilian labor force 560 +/-128 44.7% +/-6.7
Employed 497 +/-111 39.7% +/-6.1
Unemployed 63 +/-38 5.0% +/-2.8

71
Armed Forces 0 +/-119 0.0% +/-2.6
Not in labor force 693 +/-135 55.3% +/-6.7
Civilian labor force 560 +/-128 560 (X)
Percent Unemployed (X) (X) 11.3% +/-5.7
Females 16 years and over 656 +/-123 656 (X)
In labor force 304 +/-89 46.3% +/-9.1
Civilian labor force 304 +/-89 46.3% +/-9.1
Employed 278 +/-80 42.4% +/-8.4
Own children under 6 years 105 +/-55 105 (X)
All parents in family in labor
force
62 +/-40 59.0% +/-25.5
Own children 6 to 17 years 172 +/-81 172 (X)
All parents in family in labor
force
145 +/-77 84.3% +/-13.6
COMMUTING TO WORK
Workers 16 years and over 465 +/-103 465 (X)
Car, truck, or van -- drove
alone
322 +/-88 69.2% +/-9.4
Car, truck, or van -- carpooled 91 +/-40 19.6% +/-8.6
Public transportation
(excluding taxicab)
3 +/-6 0.6% +/-1.2
Walked 25 +/-20 5.4% +/-4.1
Other means 24 +/-27 5.2% +/-5.7
Worked at home 0 +/-119 0.0% +/-6.7
Mean travel time to work
(minutes)
16.4 +/-3.2 (X) (X)
OCCUPATION
Civilian employed
population 16 years and over
497 +/-111 497 (X)
Management, business,
science, and arts occupations
159 +/-52 32.0% +/-8.6
Service occupations 109 +/-52 21.9% +/-8.1
Sales and office occupations 115 +/-43 23.1% +/-6.7
Natural resources,
construction, and maintenance
occupations
53 +/-30 10.7% +/-6.1
Production, transportation,
and material moving
occupations
61 +/-35 12.3% +/-6.7
INDUSTRY
Civilian employed
population 16 years and over
497 +/-111 497 (X)
Agriculture, forestry, fishing
and hunting, and mining
13 +/-14 2.6% +/-2.8
Construction 27 +/-21 5.4% +/-4.3
Manufacturing 13 +/-20 2.6% +/-4.0
Wholesale trade 0 +/-119 0.0% +/-6.3
Retail trade 23 +/-17 4.6% +/-3.4

72
Transportation and
warehousing, and utilities
30 +/-22 6.0% +/-4.1
Information 2 +/-6 0.4% +/-1.2
Finance and insurance, and
real estate and rental and leasing
20 +/-22 4.0% +/-4.3
Professional, scientific, and
management, and administrative
and waste management services
29 +/-22 5.8% +/-4.3
Educational services, and
health care and social assistance
116 +/-55 23.3% +/-9.1
Arts, entertainment, and
recreation, and accommodation
and food services
171 +/-60 34.4% +/-8.9
Other services, except public
administration
5 +/-6 1.0% +/-1.2
Public administration 48 +/-29 9.7% +/-5.5
CLASS OF WORKER
Civilian employed
population 16 years and over
497 +/-111 497 (X)
Private wage and salary
workers
378 +/-89 76.1% +/-6.6
Government workers 107 +/-44 21.5% +/-6.9
Self-employed in own not
incorporated business workers
12 +/-10 2.4% +/-2.0
Unpaid family workers 0 +/-119 0.0% +/-6.3
INCOME AND BENEFITS (IN
2010 INFLATION-ADJUSTED
DOLLARS)
Total households 577 +/-78 577 (X)
Less than $10,000 38 +/-20 6.6% +/-3.5
$10,000 to $14,999 19 +/-18 3.3% +/-3.2
$15,000 to $24,999 118 +/-36 20.5% +/-5.3
$25,000 to $34,999 92 +/-38 15.9% +/-6.2
$35,000 to $49,999 58 +/-26 10.1% +/-4.3
$50,000 to $74,999 125 +/-45 21.7% +/-7.1
$75,000 to $99,999 40 +/-21 6.9% +/-3.6
$100,000 to $149,999 58 +/-28 10.1% +/-5.0
$150,000 to $199,999 22 +/-23 3.8% +/-3.9
$200,000 or more 7 +/-7 1.2% +/-1.3
Median household income
(dollars)
42,396 +/-9,555 (X) (X)
Mean household income
(dollars)
56,738 +/-8,943 (X) (X)
With earnings 381 +/-73 66.0% +/-7.7
Mean earnings (dollars) 42,272 +/-8,480 (X) (X)
With Social Security 319 +/-60 55.3% +/-7.5
Mean Social Security
income (dollars)
17,931 +/-2,266 (X) (X)
With retirement income 177 +/-44 30.7% +/-6.5
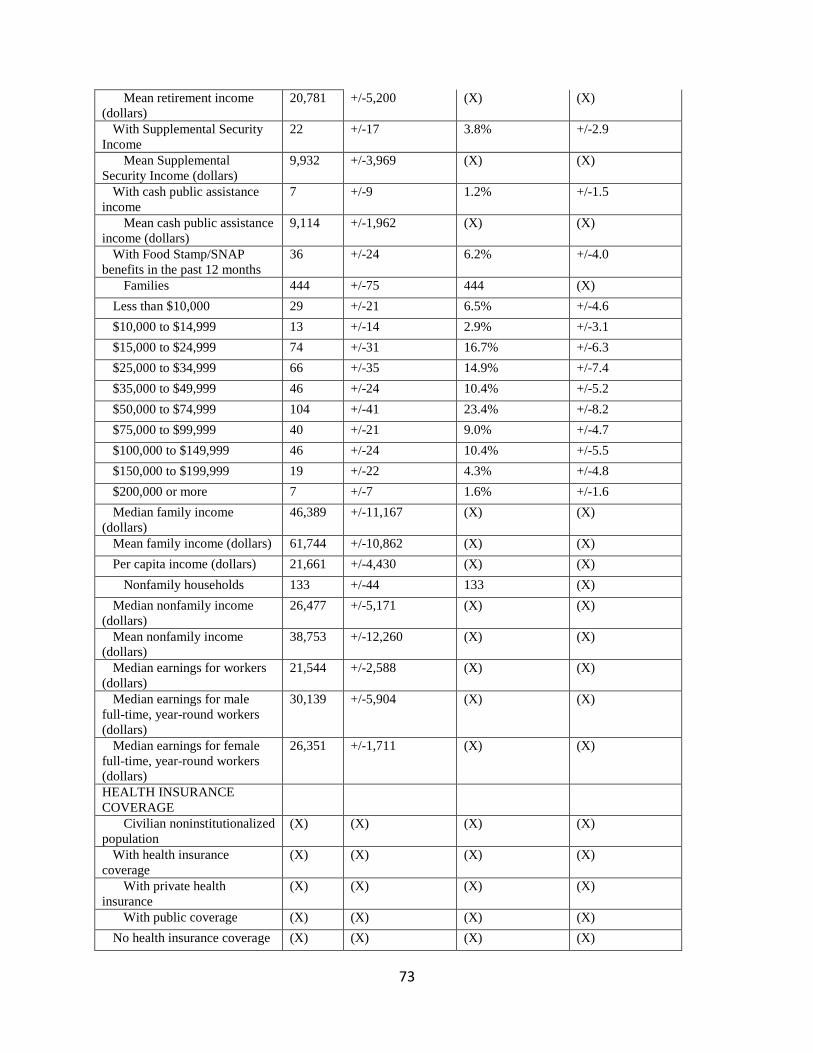
73
Mean retirement income
(dollars)
20,781 +/-5,200 (X) (X)
With Supplemental Security
Income
22 +/-17 3.8% +/-2.9
Mean Supplemental
Security Income (dollars)
9,932 +/-3,969 (X) (X)
With cash public assistance
income
7 +/-9 1.2% +/-1.5
Mean cash public assistance
income (dollars)
9,114 +/-1,962 (X) (X)
With Food Stamp/SNAP
benefits in the past 12 months
36 +/-24 6.2% +/-4.0
Families 444 +/-75 444 (X)
Less than $10,000 29 +/-21 6.5% +/-4.6
$10,000 to $14,999 13 +/-14 2.9% +/-3.1
$15,000 to $24,999 74 +/-31 16.7% +/-6.3
$25,000 to $34,999 66 +/-35 14.9% +/-7.4
$35,000 to $49,999 46 +/-24 10.4% +/-5.2
$50,000 to $74,999 104 +/-41 23.4% +/-8.2
$75,000 to $99,999 40 +/-21 9.0% +/-4.7
$100,000 to $149,999 46 +/-24 10.4% +/-5.5
$150,000 to $199,999 19 +/-22 4.3% +/-4.8
$200,000 or more 7 +/-7 1.6% +/-1.6
Median family income
(dollars)
46,389 +/-11,167 (X) (X)
Mean family income (dollars) 61,744 +/-10,862 (X) (X)
Per capita income (dollars) 21,661 +/-4,430 (X) (X)
Nonfamily households 133 +/-44 133 (X)
Median nonfamily income
(dollars)
26,477 +/-5,171 (X) (X)
Mean nonfamily income
(dollars)
38,753 +/-12,260 (X) (X)
Median earnings for workers
(dollars)
21,544 +/-2,588 (X) (X)
Median earnings for male
full-time, year-round workers
(dollars)
30,139 +/-5,904 (X) (X)
Median earnings for female
full-time, year-round workers
(dollars)
26,351 +/-1,711 (X) (X)
HEALTH INSURANCE
COVERAGE
Civilian noninstitutionalized
population
(X) (X) (X) (X)
With health insurance
coverage
(X) (X) (X) (X)
With private health
insurance
(X) (X) (X) (X)
With public coverage (X) (X) (X) (X)
No health insurance coverage (X) (X) (X) (X)

74
Civilian noninstitutionalized
population under 18 years
(X) (X) (X) (X)
No health insurance coverage (X) (X) (X) (X)
Civilian noninstitutionalized
population 18 to 64 years
(X) (X) (X) (X)
In labor force: (X) (X) (X) (X)
Employed: (X) (X) (X) (X)
With health insurance
coverage
(X) (X) (X) (X)
With private health
insurance
(X) (X) (X) (X)
With public coverage (X) (X) (X) (X)
No health insurance
coverage
(X) (X) (X) (X)
Unemployed: (X) (X) (X) (X)
With health insurance
coverage
(X) (X) (X) (X)
With private health
insurance
(X) (X) (X) (X)
With public coverage (X) (X) (X) (X)
No health insurance
coverage
(X) (X) (X) (X)
Not in labor force: (X) (X) (X) (X)
With health insurance
coverage
(X) (X) (X) (X)
With private health
insurance
(X) (X) (X) (X)
With public coverage (X) (X) (X) (X)
No health insurance
coverage
(X) (X) (X) (X)
PERCENTAGE OF FAMILIES
AND PEOPLE WHOSE
INCOME IN THE PAST 12
MONTHS IS BELOW THE
POVERTY LEVEL
All families (X) (X) 18.0% +/-8.5
With related children under
18 years
(X) (X) 43.4% +/-18.3
With related children
under 5 years only
(X) (X) 48.0% +/-47.1
Married couple families (X) (X) 13.6% +/-9.7
With related children under
18 years
(X) (X) 50.7% +/-25.2
With related children
under 5 years only
(X) (X) 62.5% +/-62.5
Families with female
householder, no husband present
(X) (X) 32.0% +/-18.1
With related children under
18 years
(X) (X) 36.6% +/-25.4
With related children
under 5 years only
(X) (X) 41.2% +/-58.3
All people (X) (X) 28.6% +/-10.7
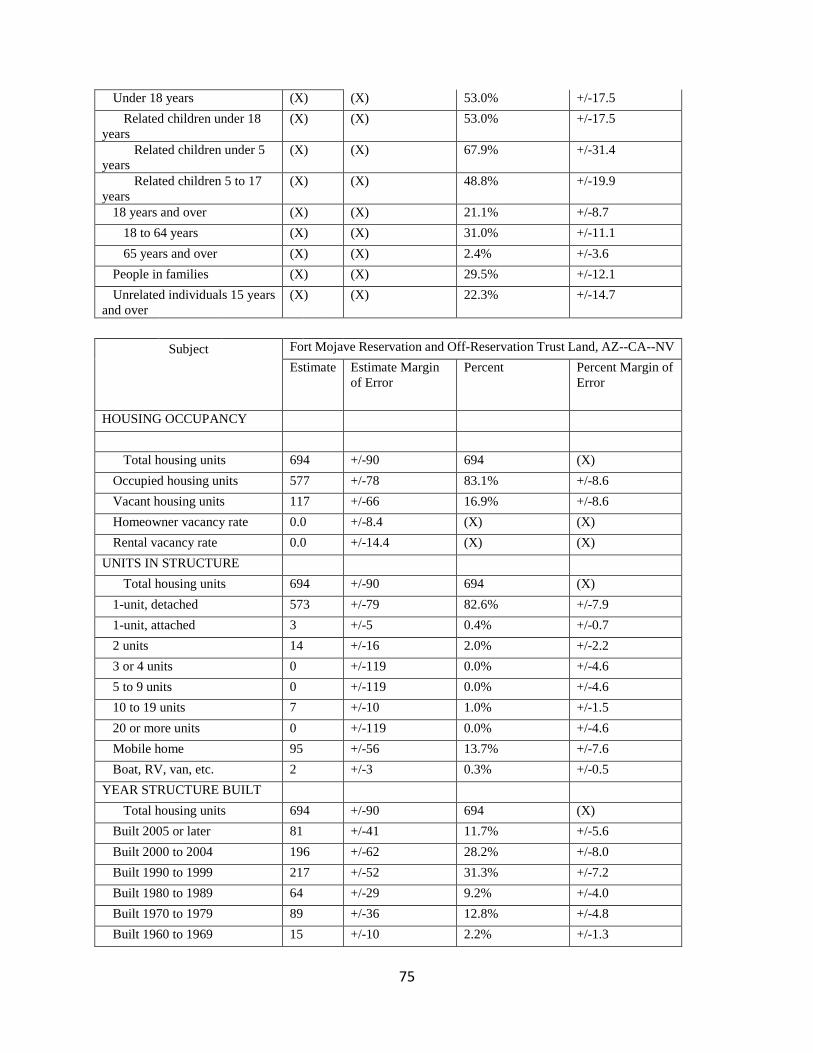
75
Under 18 years (X) (X) 53.0% +/-17.5
Related children under 18
years
(X) (X) 53.0% +/-17.5
Related children under 5
years
(X) (X) 67.9% +/-31.4
Related children 5 to 17
years
(X) (X) 48.8% +/-19.9
18 years and over (X) (X) 21.1% +/-8.7
18 to 64 years (X) (X) 31.0% +/-11.1
65 years and over (X) (X) 2.4% +/-3.6
People in families (X) (X) 29.5% +/-12.1
Unrelated individuals 15 years
and over
(X) (X) 22.3% +/-14.7
Subject Fort Mojave Reservation and Off-Reservation Trust Land, AZ--CA--NV
Estimate Estimate Margin
of Error
Percent Percent Margin of
Error
HOUSING OCCUPANCY
Total housing units 694 +/-90 694 (X)
Occupied housing units 577 +/-78 83.1% +/-8.6
Vacant housing units 117 +/-66 16.9% +/-8.6
Homeowner vacancy rate 0.0 +/-8.4 (X) (X)
Rental vacancy rate 0.0 +/-14.4 (X) (X)
UNITS IN STRUCTURE
Total housing units 694 +/-90 694 (X)
1-unit, detached 573 +/-79 82.6% +/-7.9
1-unit, attached 3 +/-5 0.4% +/-0.7
2 units 14 +/-16 2.0% +/-2.2
3 or 4 units 0 +/-119 0.0% +/-4.6
5 to 9 units 0 +/-119 0.0% +/-4.6
10 to 19 units 7 +/-10 1.0% +/-1.5
20 or more units 0 +/-119 0.0% +/-4.6
Mobile home 95 +/-56 13.7% +/-7.6
Boat, RV, van, etc. 2 +/-3 0.3% +/-0.5
YEAR STRUCTURE BUILT
Total housing units 694 +/-90 694 (X)
Built 2005 or later 81 +/-41 11.7% +/-5.6
Built 2000 to 2004 196 +/-62 28.2% +/-8.0
Built 1990 to 1999 217 +/-52 31.3% +/-7.2
Built 1980 to 1989 64 +/-29 9.2% +/-4.0
Built 1970 to 1979 89 +/-36 12.8% +/-4.8
Built 1960 to 1969 15 +/-10 2.2% +/-1.3
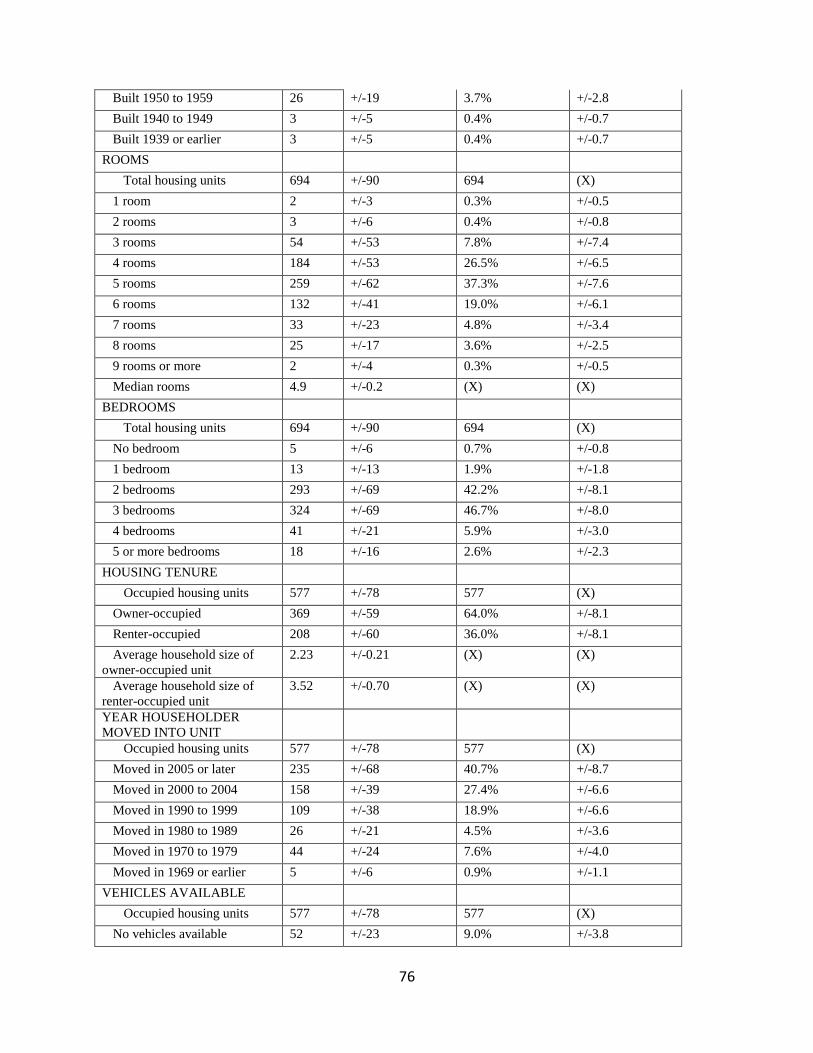
76
Built 1950 to 1959 26 +/-19 3.7% +/-2.8
Built 1940 to 1949 3 +/-5 0.4% +/-0.7
Built 1939 or earlier 3 +/-5 0.4% +/-0.7
ROOMS
Total housing units 694 +/-90 694 (X)
1 room 2 +/-3 0.3% +/-0.5
2 rooms 3 +/-6 0.4% +/-0.8
3 rooms 54 +/-53 7.8% +/-7.4
4 rooms 184 +/-53 26.5% +/-6.5
5 rooms 259 +/-62 37.3% +/-7.6
6 rooms 132 +/-41 19.0% +/-6.1
7 rooms 33 +/-23 4.8% +/-3.4
8 rooms 25 +/-17 3.6% +/-2.5
9 rooms or more 2 +/-4 0.3% +/-0.5
Median rooms 4.9 +/-0.2 (X) (X)
BEDROOMS
Total housing units 694 +/-90 694 (X)
No bedroom 5 +/-6 0.7% +/-0.8
1 bedroom 13 +/-13 1.9% +/-1.8
2 bedrooms 293 +/-69 42.2% +/-8.1
3 bedrooms 324 +/-69 46.7% +/-8.0
4 bedrooms 41 +/-21 5.9% +/-3.0
5 or more bedrooms 18 +/-16 2.6% +/-2.3
HOUSING TENURE
Occupied housing units 577 +/-78 577 (X)
Owner-occupied 369 +/-59 64.0% +/-8.1
Renter-occupied 208 +/-60 36.0% +/-8.1
Average household size of
owner-occupied unit
2.23 +/-0.21 (X) (X)
Average household size of
renter-occupied unit
3.52 +/-0.70 (X) (X)
YEAR HOUSEHOLDER
MOVED INTO UNIT
Occupied housing units 577 +/-78 577 (X)
Moved in 2005 or later 235 +/-68 40.7% +/-8.7
Moved in 2000 to 2004 158 +/-39 27.4% +/-6.6
Moved in 1990 to 1999 109 +/-38 18.9% +/-6.6
Moved in 1980 to 1989 26 +/-21 4.5% +/-3.6
Moved in 1970 to 1979 44 +/-24 7.6% +/-4.0
Moved in 1969 or earlier 5 +/-6 0.9% +/-1.1
VEHICLES AVAILABLE
Occupied housing units 577 +/-78 577 (X)
No vehicles available 52 +/-23 9.0% +/-3.8

77
1 vehicle available 247 +/-51 42.8% +/-6.6
2 vehicles available 213 +/-52 36.9% +/-7.8
3 or more vehicles available 65 +/-33 11.3% +/-5.5
HOUSE HEATING FUEL
Occupied housing units 577 +/-78 577 (X)
Utility gas 229 +/-54 39.7% +/-7.7
Bottled, tank, or LP gas 13 +/-10 2.3% +/-1.8
Electricity 326 +/-63 56.5% +/-7.7
Fuel oil, kerosene, etc. 0 +/-119 0.0% +/-5.5
Coal or coke 0 +/-119 0.0% +/-5.5
Wood 3 +/-6 0.5% +/-1.0
Solar energy 0 +/-119 0.0% +/-5.5
Other fuel 0 +/-119 0.0% +/-5.5
No fuel used 6 +/-7 1.0% +/-1.2
SELECTED
CHARACTERISTICS
Occupied housing units 577 +/-78 577 (X)
Lacking complete plumbing
facilities
8 +/-8 1.4% +/-1.3
Lacking complete kitchen
facilities
5 +/-6 0.9% +/-1.1
No telephone service available 30 +/-19 5.2% +/-3.2
OCCUPANTS PER ROOM
Occupied housing units 577 +/-78 577 (X)
1.00 or less 535 +/-74 92.7% +/-5.8
1.01 to 1.50 31 +/-29 5.4% +/-4.9
1.51 or more 11 +/-14 1.9% +/-2.4
VALUE
Owner-occupied units 369 +/-59 369 (X)
Less than $50,000 9 +/-7 2.4% +/-2.0
$50,000 to $99,999 35 +/-16 9.5% +/-4.5
$100,000 to $149,999 61 +/-24 16.5% +/-6.2
$150,000 to $199,999 84 +/-29 22.8% +/-7.3
$200,000 to $299,999 69 +/-30 18.7% +/-7.0
$300,000 to $499,999 100 +/-38 27.1% +/-9.0
$500,000 to $999,999 11 +/-11 3.0% +/-3.0
$1,000,000 or more 0 +/-119 0.0% +/-8.4
Median (dollars) 197,300 +/-23,917 (X) (X)
MORTGAGE STATUS
Owner-occupied units 369 +/-59 369 (X)
Housing units with a mortgage 167 +/-46 45.3% +/-9.8
Housing units without a
mortgage
202 +/-47 54.7% +/-9.8
SELECTED MONTHLY

78
OWNER COSTS (SMOC)
Housing units with a
mortgage
167 +/-46 167 (X)
Less than $300 0 +/-119 0.0% +/-17.6
$300 to $499 6 +/-7 3.6% +/-4.2
$500 to $699 14 +/-11 8.4% +/-6.4
$700 to $999 36 +/-19 21.6% +/-11.3
$1,000 to $1,499 59 +/-28 35.3% +/-14.4
$1,500 to $1,999 35 +/-23 21.0% +/-11.7
$2,000 or more 17 +/-22 10.2% +/-12.2
Median (dollars) 1,181 +/-137 (X) (X)
Housing units without a
mortgage
202 +/-47 202 (X)
Less than $100 21 +/-16 10.4% +/-7.8
$100 to $199 14 +/-11 6.9% +/-5.4
$200 to $299 38 +/-19 18.8% +/-8.9
$300 to $399 73 +/-36 36.1% +/-14.0
$400 or more 56 +/-27 27.7% +/-12.3
Median (dollars) 339 +/-26 (X) (X)
SELECTED MONTHLY
OWNER COSTS AS A
PERCENTAGE OF
HOUSEHOLD INCOME
(SMOCAPI)
Housing units with a
mortgage (excluding units
where SMOCAPI cannot be
computed)
167 +/-46 167 (X)
Less than 20.0 percent 91 +/-37 54.5% +/-12.5
20.0 to 24.9 percent 21 +/-13 12.6% +/-8.2
25.0 to 29.9 percent 18 +/-15 10.8% +/-8.9
30.0 to 34.9 percent 11 +/-15 6.6% +/-8.3
35.0 percent or more 26 +/-15 15.6% +/-8.8
Not computed 0 +/-119 (X) (X)
Housing unit without a
mortgage (excluding units
where SMOCAPI cannot be
computed)
194 +/-46 194 (X)
Less than 10.0 percent 89 +/-40 45.9% +/-14.8
10.0 to 14.9 percent 36 +/-17 18.6% +/-8.6
15.0 to 19.9 percent 19 +/-15 9.8% +/-7.7
20.0 to 24.9 percent 19 +/-16 9.8% +/-8.0
25.0 to 29.9 percent 23 +/-16 11.9% +/-7.6
30.0 to 34.9 percent 2 +/-3 1.0% +/-1.7
35.0 percent or more 6 +/-7 3.1% +/-3.8
Not computed 8 +/-11 (X) (X)
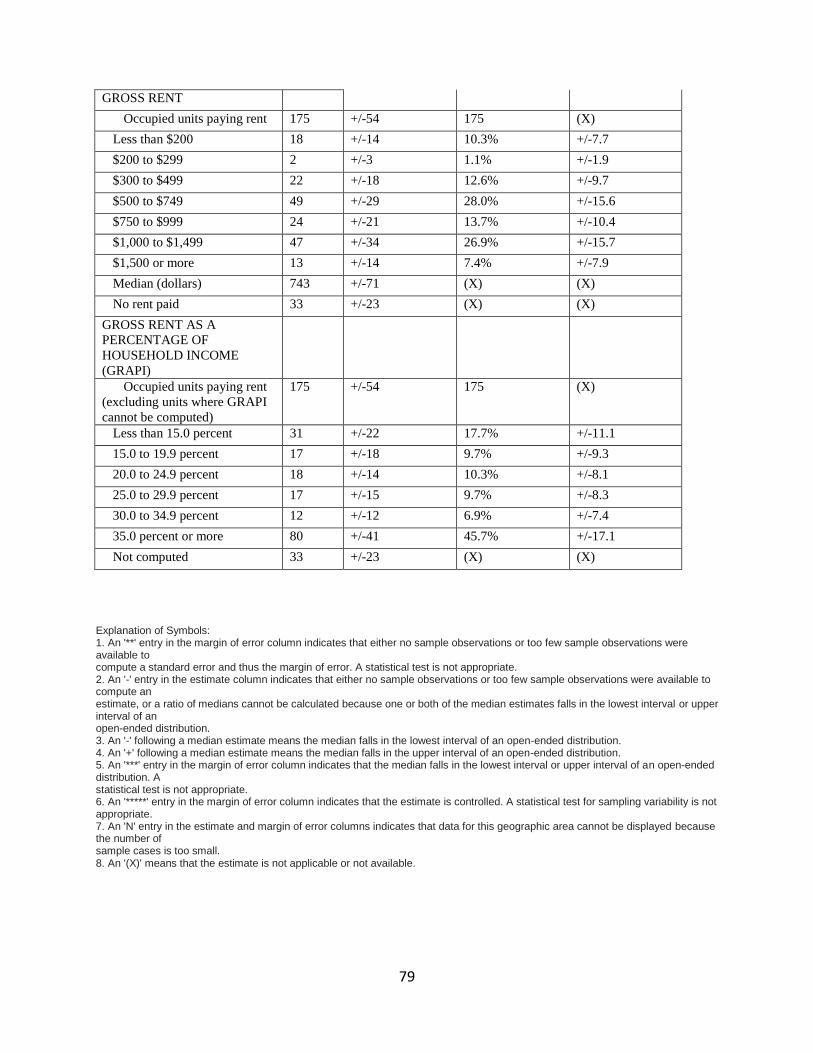
79
GROSS RENT
Occupied units paying rent 175 +/-54 175 (X)
Less than $200 18 +/-14 10.3% +/-7.7
$200 to $299 2 +/-3 1.1% +/-1.9
$300 to $499 22 +/-18 12.6% +/-9.7
$500 to $749 49 +/-29 28.0% +/-15.6
$750 to $999 24 +/-21 13.7% +/-10.4
$1,000 to $1,499 47 +/-34 26.9% +/-15.7
$1,500 or more 13 +/-14 7.4% +/-7.9
Median (dollars) 743 +/-71 (X) (X)
No rent paid 33 +/-23 (X) (X)
GROSS RENT AS A
PERCENTAGE OF
HOUSEHOLD INCOME
(GRAPI)
Occupied units paying rent
(excluding units where GRAPI
cannot be computed)
175 +/-54 175 (X)
Less than 15.0 percent 31 +/-22 17.7% +/-11.1
15.0 to 19.9 percent 17 +/-18 9.7% +/-9.3
20.0 to 24.9 percent 18 +/-14 10.3% +/-8.1
25.0 to 29.9 percent 17 +/-15 9.7% +/-8.3
30.0 to 34.9 percent 12 +/-12 6.9% +/-7.4
35.0 percent or more 80 +/-41 45.7% +/-17.1
Not computed 33 +/-23 (X) (X)
Explanation of Symbols: 1. An '**' entry in the margin of error column indicates that either no sample observations or too few sample observations were available to compute a standard error and thus the margin of error. A statistical test is not appropriate. 2. An '-' entry in the estimate column indicates that either no sample observations or too few sample observations were available to compute an estimate, or a ratio of medians cannot be calculated because one or both of the median estimates falls in the lowest interval or upper interval of an open-ended distribution. 3. An '-' following a median estimate means the median falls in the lowest interval of an open-ended distribution. 4. An '+' following a median estimate means the median falls in the upper interval of an open-ended distribution. 5. An '***' entry in the margin of error column indicates that the median falls in the lowest interval or upper interval of an open-ended distribution. A statistical test is not appropriate. 6. An '*****' entry in the margin of error column indicates that the estimate is controlled. A statistical test for sampling variability is not appropriate. 7. An 'N' entry in the estimate and margin of error columns indicates that data for this geographic area cannot be displayed because the number of sample cases is too small. 8. An '(X)' means that the estimate is not applicable or not available.