Democratizing Data Science by Bill Howe
56
Democratizing Data-Intensive Science Bill Howe Associate Director, eScience Institute Affiliate Associate Professor Computer Science & Engineering
-
Upload
infinit-innovationsnetvaerket-for-it -
Category
Technology
-
view
88 -
download
0
Transcript of Democratizing Data Science by Bill Howe

Democratizing Data-Intensive Science
Bill HoweAssociate Director, eScience Institute
Affiliate Associate Professor Computer Science & Engineering

Today
• The UW eScience Institute• Three Observations about Data-Intensive Science
6/23/2015 Bill Howe, UW 2/57

The Fourth Paradigm
1. Empirical + experimental2. Theoretical3. Computational4. Data-Intensive
Jim Gray

“All across our campus, the process of discovery will increasingly rely on researchers’ ability to extract knowledge from vast amounts of data… In order to remain at the forefront, UW must be a leader in advancing these techniques and technologies, and in making [them] accessible to researchers in the broadest imaginable range of fields.”
2005-2008
In other words:• Data-intensive science will be ubiquitous• It’s about intellectual infrastructure and software infrastructure,
not only computational infrastructure
http://escience.washington.edu

A 5-year, US $37.8 million cross-institutional collaboration to create a data science environment
5
2014
6/23/2015 Bill Howe, UW 6
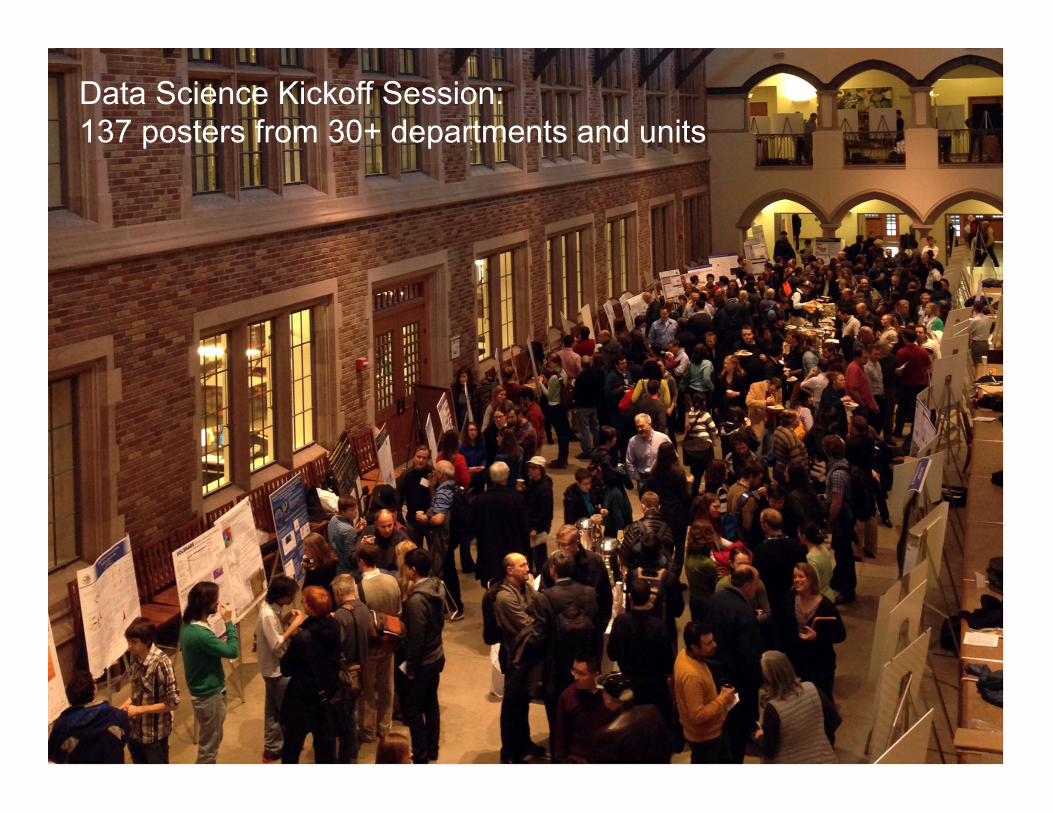
Data Science Kickoff Session:137 posters from 30+ departments and units

Establish a virtuous cycle
• 6 working groups, each with • 3-6 faculty from each institution

UW Data Science Education Efforts
6/23/2015 Bill Howe, UW 8
Students Non-StudentsCS/Informatics Non-Major professionals researchersundergrads grads undergrads grads
UWEO Data Science CertificateMOOC Intro to Data ScienceIGERT: Big Data PhD TrackNew CS CoursesBootcamps and workshopsIntro to Data ProgrammingData Science MastersIncubator: hands-on training

Key Activity: Democratize Access to Big Data and Big Data Infrastructure
• SQLShare: High Variety Database-as-a-Service for science
• Myria: Scalable Analytics-as-a-Service, Federated Big Data Environ.
• Other projects in visualization, scalable graph algorithms, bibliometrics

An observation about data-intensive science…
We (CS people) design systems for “people like us”
To a first approximation, no one in science is using state of the art data systems
We should study technology delivery with the same rigor as technology development
6/23/2015 Bill Howe, UW 10/57

A Typical Data Science Workflow
6/23/2015 Bill Howe, UW 11
1) Preparing to run a model
2) Running the model
3) Interpreting the results
Gathering, cleaning, integrating, restructuring, transforming, loading, filtering, deleting, combining, merging, verifying, extracting, shaping, massaging
“80% of the work”-- Aaron Kimball
“The other 80% of the work”

Where do you store your data?
src: Conversations with Research Leaders (2008)
src: Faculty Technology Survey (2011)
5%6%
12%27%
41%66%
87%
0% 20% 40% 60% 80% 100%
OtherDepartment-managed data center
External (non-UW) data centerServer managed by research group
Department-managed serverExternal device (hard drive, thumb drive)
My computer
Lewis et al 2011
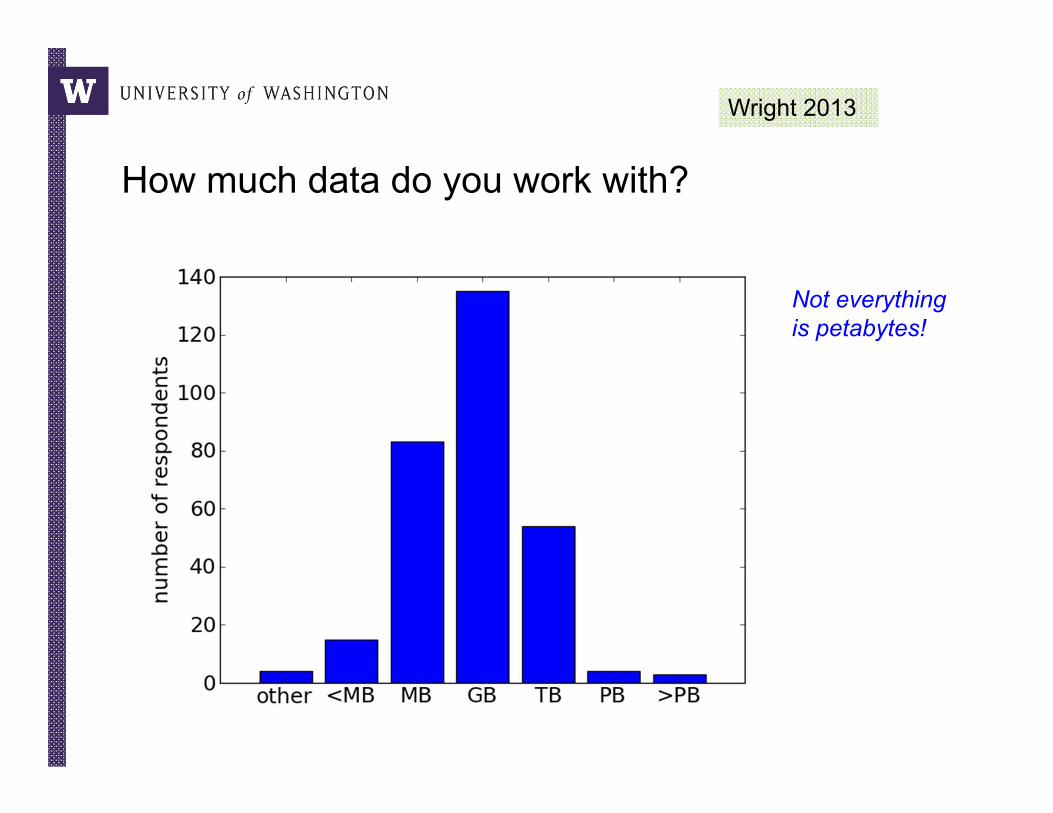
How much data do you work with?
Wright 2013
Not everything is petabytes!
How much time do you spend “handling data” as opposed to “doing science”?
Mode answer: “90%”
6/23/2015 Bill Howe, UW 14

6/23/2015 Bill Howe, UW
Simple Example
###query length COG hit #1 e-value #1 identity #1 score #1 hit length #1 description #1chr_4[480001-580000].287 4500chr_4[560001-660000].1 3556chr_9[400001-500000].503 4211 COG4547 2.00E-04 19 44.6 620 Cobalamin biosynthesis proteinchr_9[320001-420000].548 2833 COG5406 2.00E-04 38 43.9 1001 Nucleosome binding factor SPNchr_27[320001-404298].20 3991 COG4547 5.00E-05 18 46.2 620 Cobalamin biosynthesis proteinchr_26[320001-420000].378 3963 COG5099 5.00E-05 17 46.2 777 RNA-binding protein of the Puf chr_26[400001-441226].196 2949 COG5099 2.00E-04 17 43.9 777 RNA-binding protein of the Puf chr_24[160001-260000].65 3542chr_5[720001-820000].339 3141 COG5099 4.00E-09 20 59.3 777 RNA-binding protein of the Puf chr_9[160001-260000].243 3002 COG5077 1.00E-25 26 114 1089 Ubiquitin carboxyl-terminal hydchr_12[720001-820000].86 2895 COG5032 2.00E-09 30 60.5 2105 Phosphatidylinositol kinase andchr_12[800001-900000].109 1463 COG5032 1.00E-09 30 60.1 2105 Phosphatidylinositol kinase andchr_11[1-100000].70 2886chr_11[80001-180000].100 1523
ANNOTATIONSUMMARY-COMBINEDORFANNOTATION16_Phaeo_genome
id query hit e_value identity_ score query_start query_end hit_start hit_end hit_length1 FHJ7DRN01A0TND.1 COG0414 1.00E-08 28 51 1 74 180 257 2852 FHJ7DRN01A1AD2.2 COG0092 3.00E-20 47 89.9 6 85 41 120 2333 FHJ7DRN01A2HWZ.4 COG3889 0.0006 26 35.8 9 94 758 845 872
…2853 FHJ7DRN02HXTBY.5 COG5077 7.00E-09 37 52.3 3 77 313 388 10892854 FHJ7DRN02HZO4J.2 COG0444 2.00E-31 67 127 1 73 135 207 316
…3566 FHJ7DRN02FUJW3.1 COG5032 1.00E-09 32 54.7 1 75 1965 2038 2105
…
COGAnnotation_coastal_sample.txt
15
Where does the time go? (1)
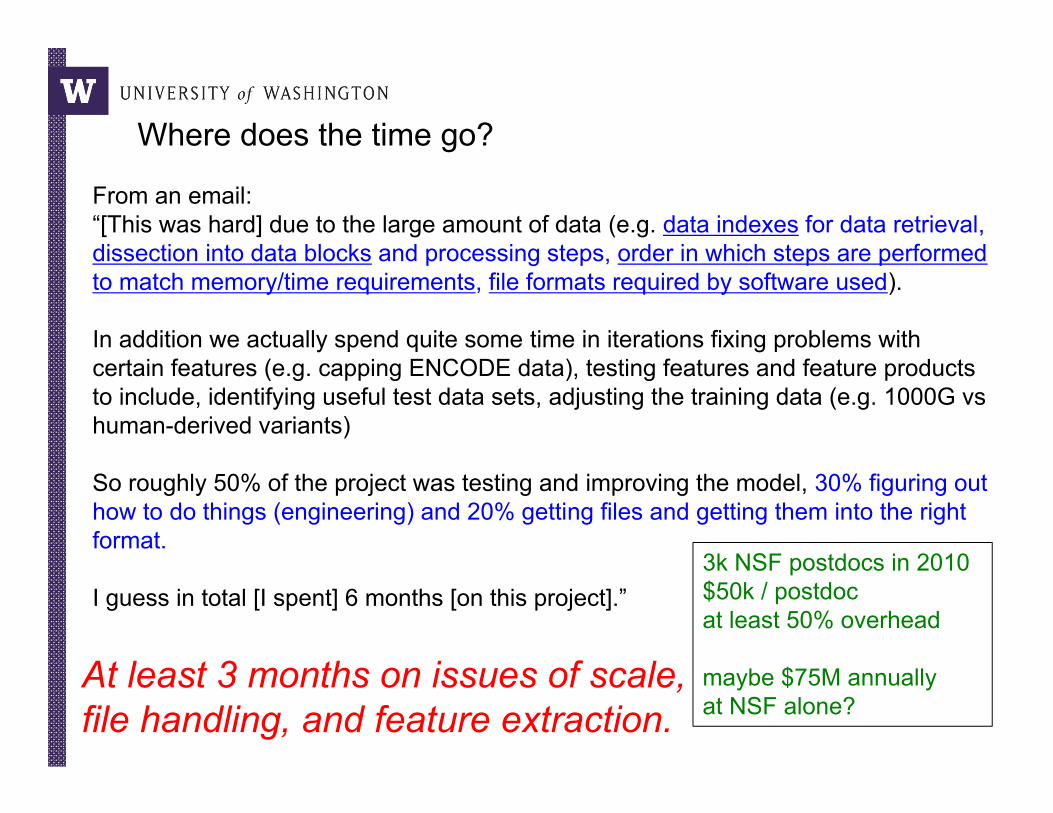
From an email:“[This was hard] due to the large amount of data (e.g. data indexes for data retrieval, dissection into data blocks and processing steps, order in which steps are performed to match memory/time requirements, file formats required by software used).
In addition we actually spend quite some time in iterations fixing problems with certain features (e.g. capping ENCODE data), testing features and feature products to include, identifying useful test data sets, adjusting the training data (e.g. 1000G vs human-derived variants)
So roughly 50% of the project was testing and improving the model, 30% figuring out how to do things (engineering) and 20% getting files and getting them into the right format.
I guess in total [I spent] 6 months [on this project].”
At least 3 months on issues of scale, file handling, and feature extraction.
Martin Kircher, Genome SciencesWhy?
3k NSF postdocs in 2010$50k / postdocat least 50% overhead
maybe $75M annually at NSF alone?
Where does the time go?
What we’re seeing…
• Researchers artifically scale down the problem to fit their tools and skills
• …or they become dependent on an engineer to get any work done
• …or researchers morph into engineers
• A better approach: – Raise the level of abstraction– Hide complexity without sacrificing performance– Provide powerful tools; don’t oversimplify
6/23/2015 Bill Howe, UW 17/57

Why is database under-used?
• Not a perfect fit – it’s hard to design a “permanent” database for a fast-moving research target– A schema/ontology/standard is some shared consensus about a
model of the world– Does not exist at the frontier of research, by definition!
• Relatively few queries per dataset – no opportunity to amortize the cost of installation, design, and loading
• No evidence for conventional explanations– scientific data is non-relational– scientists won’t learn SQL
6/23/2015 18

6/23/2015 Bill Howe, UW 19
“As each need is satisfied, the next higher level in the hierarchy dominates conscious functioning.”
-- Maslow 43
Maslow’s Needs Hierarchy

A “Needs Hierarchy” of Science Data Management
storage
sharing
6/23/2015 Bill Howe, UW 20
semantic integration
query
analytics
“As each need is satisfied, the next higher level in the hierarchy dominates conscious functioning.”
-- Maslow 43

QUERY-AS-A-SERVICE
21
2010 - present

1) Upload data “as is”Cloud-hosted, secure; no need to install or design a database; no pre-defined schema; schema inference; some itegration
2) Write QueriesRight in your browser, writing views on top of views on top of views ...
SELECT hit, COUNT(*) FROM tigrfam_surface GROUP BY hit ORDER BY cnt DESC
3) Share the results Make them public, tag them, share with specific colleagues –anyone with access can query
http://sqlshare.escience.washington.edu

Key features
• Relaxed Schemas– No CREATE TABLE statements– Infer a best-effort schema on upload; upload should always succeed– Mismatches in number of columns, unnamed columns, mixed-type
columns are all tolerated• Views as first-class citizens
– Everything is a “dataset”: No distinction between views and tables– Views created as side-effects of saving queries– Cleaning, integration,
• Full SQL– Nested queries, window functions, theta joins, etc.
• SaaS– In-browser analytics– REST API, custom clients
6/23/2015 Bill Howe, UW 23/57

6/23/2015 Bill Howe, UW 24
http://sqlshare.escience.washington.edu

SELECT x.strain, x.chr, x.region as snp_region, x.start_bp as snp_start_bp, x.end_bp as snp_end_bp, w.start_bp as nc_start_bp, w.end_bp as nc_end_bp, w.category as nc_category, CASE WHEN (x.start_bp >= w.start_bp AND x.end_bp <= w.end_bp)
THEN x.end_bp - x.start_bp + 1WHEN (x.start_bp <= w.start_bp AND w.start_bp <= x.end_bp)THEN x.end_bp - w.start_bp + 1WHEN (x.start_bp <= w.end_bp AND w.end_bp <= x.end_bp)THEN w.end_bp - x.start_bp + 1
END AS len_overlap
FROM [[email protected]].[hotspots_deserts.tab] xINNER JOIN [[email protected]].[table_noncoding_positions.tab] wON x.chr = w.chrWHERE (x.start_bp >= w.start_bp AND x.end_bp <= w.end_bp)OR (x.start_bp <= w.start_bp AND w.start_bp <= x.end_bp)OR (x.start_bp <= w.end_bp AND w.end_bp <= x.end_bp)ORDER BY x.strain, x.chr ASC, x.start_bp ASC
Non-programmers can write very complex queries (rather than relying on staff programmers)Example: Computing the overlaps of two sets of blast results
We see thousands of queries written by non-programmers
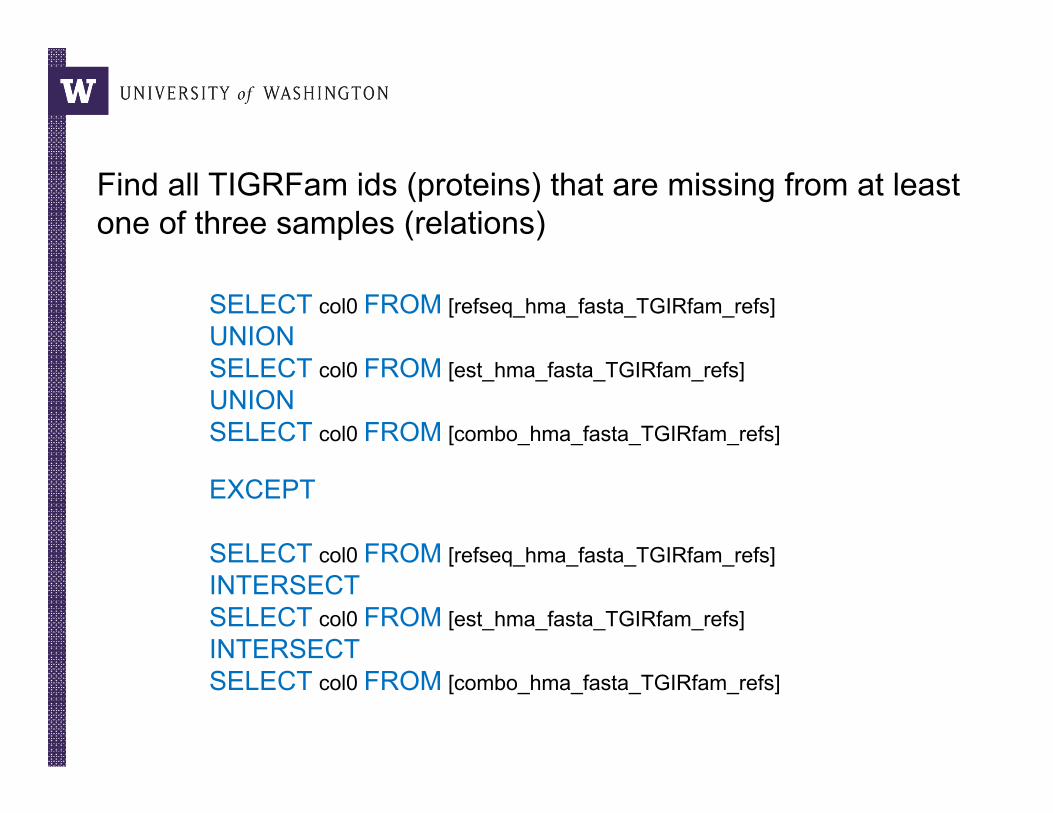
Find all TIGRFam ids (proteins) that are missing from at least one of three samples (relations)
SELECT col0 FROM [refseq_hma_fasta_TGIRfam_refs]UNIONSELECT col0 FROM [est_hma_fasta_TGIRfam_refs]UNIONSELECT col0 FROM [combo_hma_fasta_TGIRfam_refs]
EXCEPT
SELECT col0 FROM [refseq_hma_fasta_TGIRfam_refs]INTERSECTSELECT col0 FROM [est_hma_fasta_TGIRfam_refs]INTERSECTSELECT col0 FROM [combo_hma_fasta_TGIRfam_refs]

Howe, et al., CISE 2013

Steven Roberts
SQL as a lab notebook:http://bit.ly/16Xj2JP
Calculate #methylated CGs
Calculate #all CGs
Calculatemethylation ratio
Link methylationwith gene description
GFF of methylated
CG locations
GFF of all genes
GFF of all CG locations
Gene descriptions
Join
Reorder columns
Count Count
JoinJoin
Reorder columns
Reorder columns
Compute
Trim
Excel
Join Join
misstep: joinw/ wrong fill
Calculate #methylated
CGs
Calculate #all CGs
GFF of methylated
CG locations
GFF of all genes
GFF of all CG locations
Gene descriptions
Calculate methylation ratio
and link with gene description
Popular service for Bioinformatics Workflows

Halperin, Howe, et al. SSDBM 2013

6/23/2015 Bill Howe, UW 30/57
100-1000 queries, 10-100 tables
roughly equal number of tables and queries
Few tables, 20-60 queries

6/23/2015 Bill Howe, UW 31/57
A SQL “learner”

“Data Processor” User Archetype
1000 queries
queries
tables
Feb 2013
250 tables
Mar 2014

“Analyzer” Archetype900 queries 45 tables
Mar 2011 Mar 2014
queries
tables

Another observation about data-intensive science
There is no one-size-fits-all solution
We need to make it easy to use multiple systems transparently
6/23/2015 Bill Howe, UW 34/57

• SIGMOD 2009: Vertica 100x < Hadoop (Grep, Aggregation, Join)• VLDB 2010: HaLoop ~100x < Hadoop (PageRank, ShortestPath)• SIGMOD 2010: Pregel (no comparisons)• HotCloud 2010: Spark ~100x < Hadoop (logistic regression, ALS)• ICDE 2011: SystemML ~100x < Hadoop• ICDE 2011: Asterix ~100x < Hadoop (K-Means)• VLDB 2012: Graphlab ~100x < Hadoop, GraphLab 5x > Pregel, Graphlab ~
MPI (Recommendation/ALS, CoSeq/GMM, NER)• NSDI 2012: Spark 20x < Hadoop (logistic regression, PageRank)• VLDB 2012: Asterix (no comparisons)• SIGMOD 2013: Cumulon 5x < SystemML• VLDB 2013: Giraph ~ GraphLab (Connected Components)• SIGMOD 2014: SimSQL vs. Spark vs. GraphLab vs. Giraph (GMM,
bayesian regression, HMM, LDA, imputation)• VLDB 2014: epiC ~ Impala, epiC ~ Shark, epiC 2x < Hadoop (Grep, Sort,
TPC-H Q3, PageRank)
Lots of work on raising the level of abstraction for big data without sacrifcing performance…

Pregel (Malewicz)
Hadoop 2008
2009
2010
2011
2012
2013
2014
HaLoop (Bu)
Spark (Zakaria)
Vertica Vertica (Pavlo)
~100x faster
SystemML SystemML (Ghoting)
Hyracks (Borkar)
GraphLab (Low)
faster
Cumulon (Huang)
comparable or inconclusive
Giraph (Tian)
Dremel (Melnik)
SimSQL (Cai)
epiC (Jiang)
Impala (Cloudera)
Shark (Xin)
HIVE (Thusoo)
“The good old days”


• …to facilitate experiments to determine who performs well at what
• …to insulate users from heterogeneity in data models, platforms, algorithmic details
• …to allow multiple systems to co-exist and be used optimally in production
38
We need big data middleware

Three components:
• MyriaWeb: Analytics-as-a-service: Editor, profiler, data catalog, logging, all from your browser
• RACO: Optimizing middleware for big data systems –write once, run anywhere: Hadoop, Spark, MyriaX, straight C, RDBMS, PGAS, MPI, …
• MyriaExec: An iterative big data execution engine. Complex analytics at scale, with the DNA of a database system
39
Big Data Middleware;Analytics-as-a-Service
http://myria.cs.washington.edu

40
SparkSerial C++PGAS/HP
CMyriaX RDBMS
SQLDatalogMyriaL SPARQL
Compiler Compiler Compiler Compiler Compiler
Hadoop
Compiler
multiple languages
multiple big data systems
multiple GUIs/apps

Compiling the Myria algebra to bare metal PGAS programs
RADISH
ICDE 15
Brandon Myers

6/23/2015 Bill Howe, UW 42/57
1% selection microbenchmark, 20GB
Avoid long code paths
6/23/2015 Bill Howe, UW 43/57
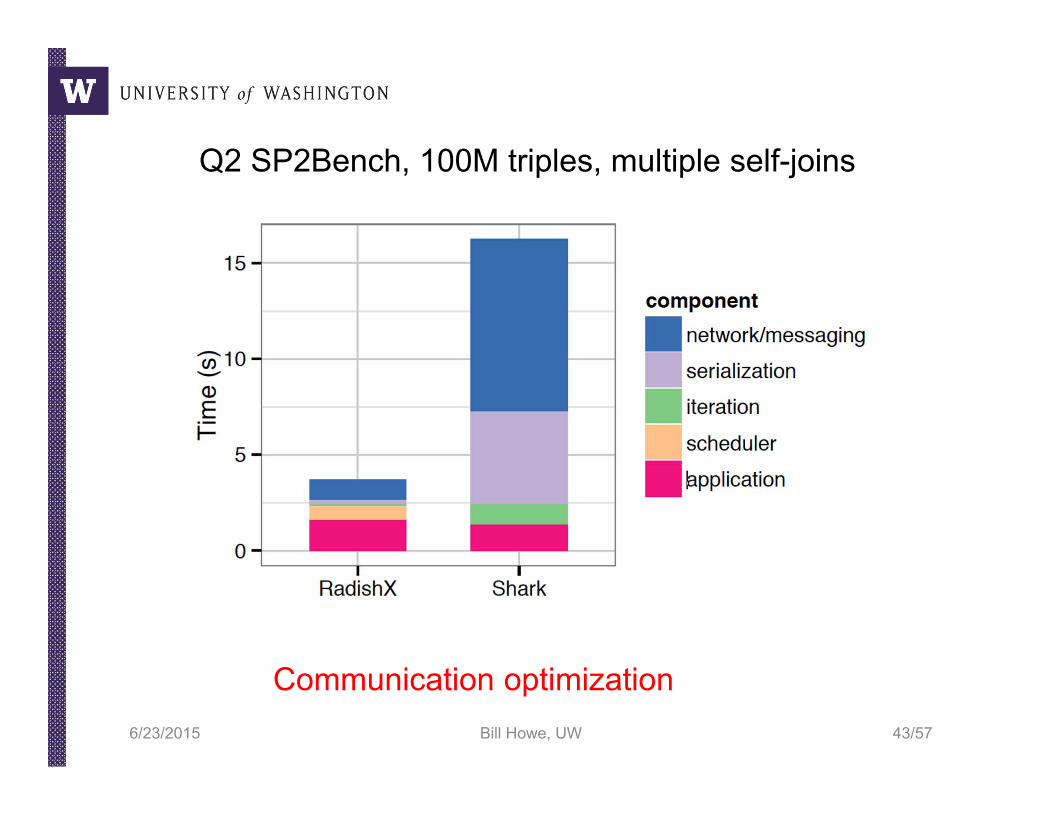
Q2 SP2Bench, 100M triples, multiple self-joins
Communication optimization

Graph Patterns
44
• SP2Bench, 100 million triples• Queries compiled to a PGAS C++ language layer, then
compiled again by a low-level PGAS compiler• One of Myria’s supported back ends• Comparison with Shark/Spark, which itself has been shown to
be 100X faster than Hadoop-based systems• …plus PageRank, Naïve Bayes, and more
RADISH
ICDE 15

Performance / Productivity gap
Productivity
Hand-coded
Query

Third observation about data-intensive science
Attention span, not cycles, is the limited resource
6/23/2015 Bill Howe, UW 46/57

Time
Amou
nt o
f dat
a in
the
wor
ld
Time
Proc
essi
ng p
ower
What is the rate-limiting step in data understanding?
Processing power: Moore’s Law
Amount of data in the world

Proc
essin
g pow
er
Time
What is the rate-limiting step in data understanding?
Processing power: Moore’s Law
Human cognitive capacity
Idea adapted from “Less is More” by Bill Buxton (2001)
Amount of data in the world
slide src: Cecilia Aragon, UW HCDE

Science Productivity
Computational performance
monthsweeksdayshoursminutessecondsmilliseconds
HPC
Systems
Databases
feasibility threshold
interactivity threshold
Only two performance thresholds matter

Lowering barrier to entry

Exposiing Performance IssuesDominik Moritz
EuroSys 15

Exposing Performance IssuesDominik Moritz
EuroSys 15
Sou
rce
wor
ker
Destination worker

Kanit "Ham" Wongsuphasawat
Voyager: Visualization Recommendation
InfoVis 15

Seung-Hee BaeScalable Graph Clustering
Version 1Parallelize Best-known Serial Algorithm
ICDM 2013 Version 2Free 30% improvement for any algorithm
TKDD 2014 SC 2015 Version 3Distributed approx. algorithm, 1.5B edges

Viziometrics: Analysis of Visualization in the Scientific Literature
Proportion of non-quantitative figures in paper
Paper impact, grouped into 5% percentiles
Poshen Lee

http://escience.washington.edu
http://myria.cs.washington.edu
http://uwescience.github.io/sqlshare/