Democratic Institutions and Collective Actionmh2245/papers1/FHW_2012.pdfDemocratic Institutions and...
48
Democratic Institutions and Collective Action Capacity: Results from a Field Experiment in Post-Conflict Liberia James D. Fearon * Macartan Humphreys † Jeremy M. Weinstein ‡ December 2011 Abstract In the aftermath of Liberia’s civil war, international development organizations intro- duced development aid projects in heavily affected areas with the goal of strengthening the ability of communities to solve collective action problems. The targeted communities were randomly selected by public lottery, providing a rare opportunity to assess the effects of external interventions on social organization. Five months after the intervention was completed, we used a community-wide public good game as a behavioral measure of a community’s collective action capacity. Surprisingly—given the common view that local social and political institutions are highly robust and resistant to third-party efforts to change them—we find that treatment led to communities performing significantly better in the public goods game. We use evidence from surveys of the game players to try to understand the mechanisms by which the intervention affected contributions. Although our conclusions here are more tentative, the evidence suggests that the treatment resulted in greater mobilization and information-sharing efforts which may have produced more coordination around socially desirable outcomes. However, we also find that the effects of the intervention can only be seen when the public goods game is played by mixed-gender groups; when the collective action problem is presented to women-only groups there are high levels of cooperation independent of treatment status. * Stanford University. We thank the International Rescue Committee (IRC) for their partnership in un- dertaking this study; Jodi Nelson and Liz McBride played a key role in designing the instruments while IRC field staff, both in Monrovia and Lofa County, provided support on the ground. We are particularly grateful to Nicholai Lidow and Gwendolyn Taylor for leading the game and follow-up survey data collection teams in the field, and to Andrea Abel, Jessica Gottlieb, and Amanda Robinson for their fieldwork on the public goods games. We thank the National Ex-Combatant Peace-building Initiative for their research support in Liberia, in particular K. Johnson Borh and Morlee Zawoo, and Brian Coyne for work on data checking. We acknowledge the support of a number of funders that made this study possible. DFID provided the bulk of funding for the panel survey as part of its initial grant to IRC. The Center for Global Development provided some additional funding for the second wave survey. AUSAID, through a grant to the Center for Global Development, provided the resources to implement the behavioral protocol for the measurement of social cohesion. The Center for Democracy, Development, and the Rule of Law provided funding for field work expenses and the International Growth Center provided support for final data compilation and analysis. † Columbia University ‡ Stanford University
-
Upload
duongthuan -
Category
Documents
-
view
220 -
download
0
Transcript of Democratic Institutions and Collective Actionmh2245/papers1/FHW_2012.pdfDemocratic Institutions and...

Democratic Institutions and Collective Action Capacity:
Results from a Field Experiment in Post-Conflict Liberia
James D. Fearon∗ Macartan Humphreys† Jeremy M. Weinstein‡
December 2011
Abstract
In the aftermath of Liberia’s civil war, international development organizations intro-duced development aid projects in heavily affected areas with the goal of strengtheningthe ability of communities to solve collective action problems. The targeted communitieswere randomly selected by public lottery, providing a rare opportunity to assess the effectsof external interventions on social organization. Five months after the intervention wascompleted, we used a community-wide public good game as a behavioral measure of acommunity’s collective action capacity. Surprisingly—given the common view that localsocial and political institutions are highly robust and resistant to third-party efforts tochange them—we find that treatment led to communities performing significantly betterin the public goods game. We use evidence from surveys of the game players to try tounderstand the mechanisms by which the intervention affected contributions. Althoughour conclusions here are more tentative, the evidence suggests that the treatment resultedin greater mobilization and information-sharing efforts which may have produced morecoordination around socially desirable outcomes. However, we also find that the effects ofthe intervention can only be seen when the public goods game is played by mixed-gendergroups; when the collective action problem is presented to women-only groups there arehigh levels of cooperation independent of treatment status.
∗Stanford University. We thank the International Rescue Committee (IRC) for their partnership in un-dertaking this study; Jodi Nelson and Liz McBride played a key role in designing the instruments while IRCfield staff, both in Monrovia and Lofa County, provided support on the ground. We are particularly gratefulto Nicholai Lidow and Gwendolyn Taylor for leading the game and follow-up survey data collection teams inthe field, and to Andrea Abel, Jessica Gottlieb, and Amanda Robinson for their fieldwork on the public goodsgames. We thank the National Ex-Combatant Peace-building Initiative for their research support in Liberia, inparticular K. Johnson Borh and Morlee Zawoo, and Brian Coyne for work on data checking. We acknowledgethe support of a number of funders that made this study possible. DFID provided the bulk of funding for thepanel survey as part of its initial grant to IRC. The Center for Global Development provided some additionalfunding for the second wave survey. AUSAID, through a grant to the Center for Global Development, providedthe resources to implement the behavioral protocol for the measurement of social cohesion. The Center forDemocracy, Development, and the Rule of Law provided funding for field work expenses and the InternationalGrowth Center provided support for final data compilation and analysis.†Columbia University‡Stanford University
1 Introduction
Communities often confront the difficult task of inducing individuals to act in ways that may
run counter to self-interest. The ability of political units to generate and sustain cooper-
ation is part of what distinguishes successful states from those that fail, communities with
high-levels of service provision from those that lack essential services, societies with well-
functioning democratic institutions from those that underperform, and political groups that
achieve power and influence from those that find themselves stuck on the sidelines. Impor-
tantly, prior research suggests that cooperative behavior is a relatively fixed characteristic of
a political unit – reflective of demographic, economic, and political factors that are difficult
to change – and thus is unlikely to respond to short-term interventions.
Given the centrality of a community’s collective action capacity to a wide variety of conse-
quential outcomes, aid agencies have increasingly embraced a programming model known as
“Community Driven Development” (CDD), or “Community Driven Reconstruction” (CDR)
when applied in post-conflict settings. In CDD programs, the delivery of development funds is
combined with efforts to build local governance capabilities, typically by having project staff
organize elections to Community Development Councils (CDCs) that select specific projects in
a public process, and then help to implement and maintain them. Donor agencies believe that
greater community involvement will make projects more successful in terms of their impact
on material welfare. But they often often focus more on the idea that the institution-building
component of CDD will improve local governance and the capacity of communities for collec-
tive action to provide and manage public goods. In particular, CDD projects are designed to
promote more democratic institutions and practices in communities where, donors presume,
traditional political structures are more autocratic and the possibilities for cooperation more
limited.
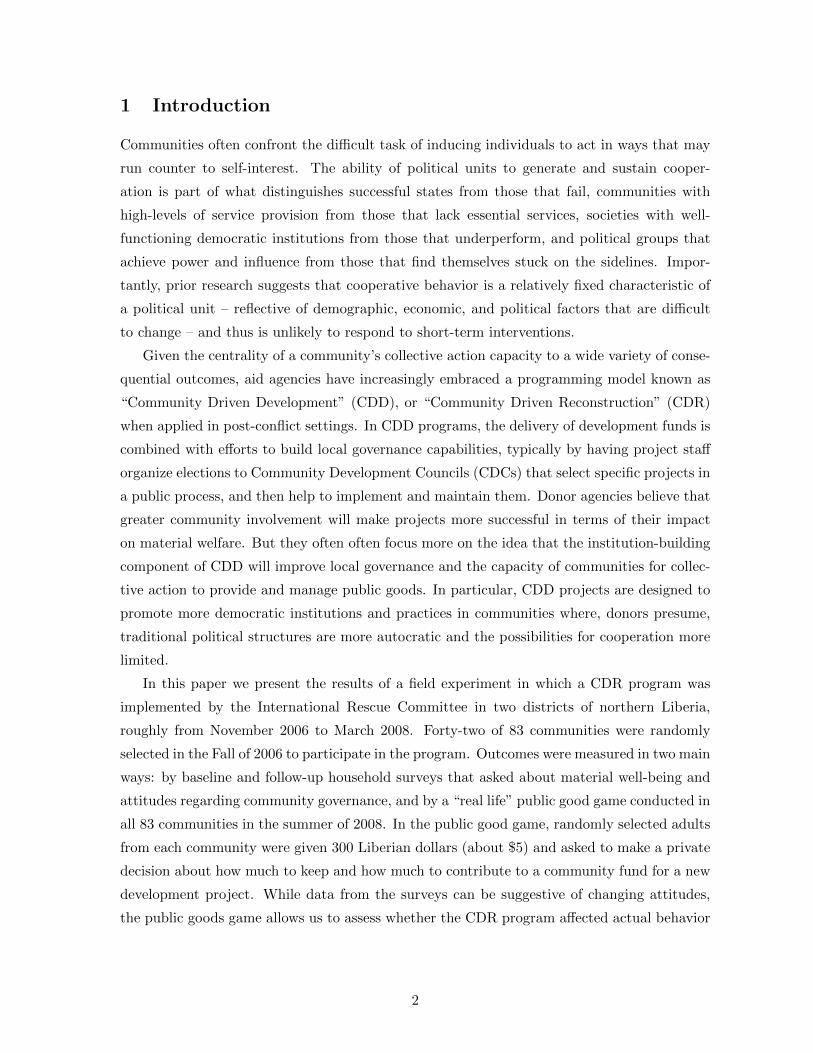
In this paper we present the results of a field experiment in which a CDR program was
implemented by the International Rescue Committee in two districts of northern Liberia,
roughly from November 2006 to March 2008. Forty-two of 83 communities were randomly
selected in the Fall of 2006 to participate in the program. Outcomes were measured in two main
ways: by baseline and follow-up household surveys that asked about material well-being and
attitudes regarding community governance, and by a “real life” public good game conducted in
all 83 communities in the summer of 2008. In the public good game, randomly selected adults
from each community were given 300 Liberian dollars (about $5) and asked to make a private
decision about how much to keep and how much to contribute to a community fund for a new
development project. While data from the surveys can be suggestive of changing attitudes,
the public goods game allows us to assess whether the CDR program affected actual behavior
2

in response to a community-wide collective action problem. We exploit the CDR intervention
in an effort to assess whether patterns of social cooperation are actually responsive to the
introduction of new governance institutions, even when underlying demographic, economic,
and political factors remain unchanged.
Relative to control communities, we observe several significant changes in the collective
action capacity of treatment communities. Across a variety of survey-based measures, individ-
uals in treatment communities report an increased sense of political and social efficacy, greater
faith in local leaders and the value of democratic processes, and higher levels of community
activity. Using our behavioral measures, we find that communities that received the CDR
program contributed significantly more in the public goods game, collecting on average 82.1%
of the total possible payout versus 75.8% in control communities. At the individual level, the
average impact of exposure to the CDR program is approximately equivalent to the average
impact of increasing the rate of return on a contribution from 100% to 400%. Forty two
communities that were randomly assigned to have 12 men and 12 women playing the game
rather than all women – a cross-cutting “gender composition” treatment discussed below. The
CDR impact, we find, is concentrated entirely in these mixed group, for these, CDR raised
average contributions from 67 to 82% of the total possible. Given the short duration of the
treatment and the common belief that local social and political institutions are highly robust
and resistant to third-party efforts to change them, this positive impact is surprising.1 In
addition, it is worth highlighting that, contrary to common beliefs about poor, post-conflict
countries, we find evidence of high levels of social capital and behavioral evidence of a strong
capacity for organizing and providing public goods in almost all of the sample communities,
both treatment and control. For example, the average community received about 79% of the
total possible payout in the public goods game, far higher than one might have anticipated
given the rationale for donor-funded governance interventions.
We also use evidence from surveys of the game players to explore the mechanisms by which
the CDR program increased community contributions in the public goods game. Although
our findings here are more tentative, the evidence suggests that local leaders in CDR-treated
communities engaged in greater mobilization and information-sharing efforts in the week be-
tween the initial community meeting that explained the game, and the play of the game itself.
The main effect of the CDR program may have been to increase the number of community
members with leadership and organizing experience relevant to solving a similar community-
wide collective action problem. There is also some evidence that CDR-treated communities
1Our prior expectation was that we would find no difference in aggregate contributions across treat-ment and control groups, but we thought we might find differences in the process by which communitiesmobilized and organized to play the game. These differences are discussed in section 6.
3

used more democratic processes to select community representatives and projects.
Subject to the usual (and significant) caveats concerning external validity, the results
of this study speak to several larger debates and questions. First, at the level of policy,
although the World Bank alone currently spends about $2 billion per year on CDD and CDR
programs,2 to date there have been almost no experimental assessments of the effectiveness of
this development approach.3 Our design does not afford a direct comparison between CDR and
a more traditional, “top down” model of delivering aid, since our control communities received
no CDR project, rather than a differently designed intervention. But it is still encouraging
that we find evidence of both attitudinal and behavioral changes in the directions intended
by advocates of community-driven development. Whether the positive changes are worth the
cost of the project is harder to assess given that the objective is improved governance and
stronger institutions as opposed to improvement of some specific service.
Second, our research design provides a rare opportunity to use random assignment to try
to identify the causal impact of political institutions on public good provision and cooperation
in a community. Many economists and political scientists believe that “good institutions” and
“good governance” are critical determinants of economic growth, but estimating institutional
(or policy) effects empirically is difficult because economies and political institutions normally
co-evolve. The most compelling attempts try to use variation in institutions that is traceable to
a historical accident or contingency very long ago, and thus cannot itself be caused by other
more recent determinants of economic growth (Acemoglu, Johnson, and Robinson, 2001).
These efforts are subject to the usual concerns about instruments, such as whether there are
other paths by which presumed determinants of institutional variation centuries ago might
be correlated with outcomes today, and whether institutional variation due to the historical
accident has the same causal impact as variation due to policy interventions or other more
proximate causes.
The focus on very long-run persistence in institutions also raises the question of whether
anything can be done about institutions even if they matter. Since the end of the Cold War,
Western-led political and military interventions in a long list of countries have attempted to
transfer “good institutions” that would favor democracy, political stability, and growth. For-
eign aid for economic development has also stressed efforts to change policies and institutions,
both locally and nationally. For good reasons, skepticism about the prospects for success is
common.
Random assignment of a CDR program involving elections gives us an opportunity to more
2World Bank CDD website ( http://go.worldbank.org/3RB76M9CU0); consulted August 24, 2011.3The main exceptions are Beath, Christia, and Enikolopov (2009) and Casey, Glennerster, and
Miguel (2011); see below.
4

cleanly estimate the impact of the introduction of a new, formally democratic institution at
a local level. While we do not know if the effects we observed will persist, the positive short-
run impact on contributions to a public good that we find is striking in light of the common
view that local political and social institutions are robust and imperturbable. The simple
mechanism of experience organizing to decide on and implement a public good in the CDR
project helping “elites” do the same when they were later faced with a similar problem could
plausibly work in other efforts to build more democratic local institutions.
The most closely related work is the randomized evaluation of a similar CDR program in
Sierra Leone by Casey, Glennerster, and Miguel (2011). Their results are practically the reverse
of ours. They find a significant positive impact of the program on measures of material welfare,
but no effect on community decision-making processes or collective action capacity. Related
work in Indonesia by Barron, Humphreys, Paler, and Weinstein (2009) using a regression
discontinuity approach also finds effects on economic productivity but little impact on social
outcomes. A partial explanation for the different findings may be that both the Sierra Leone
and Indonesian CDR programs resulted in many projects aimed at economic production. In
Sierra Leone 57% were focused on agriculture, livestock, fishing, or small business development;
in Indonesia almost all funding was distributed as private cash transfers. By contrast, income-
generating projects were disallowed in the Liberia CDR program that we studied.
Other studies have looked at the effects of varying institutional design and decision-making
procedures within a CDD or CDR program. Beath, Christia, and Enikolopov (2009) randomly
assigned different procedures for electing CDCs and choosing projects in a large-scale CDR
effort in Afghanistan. They find that womens’ preferences are not represented under any of
their procedural configurations, and that elite capture is more likely when elections are “at
large” and projects are selected by a consultation process rather than by secret ballot referenda.
Similarly, Olken (2009) randomly assigns choice of projects in an Indonesian CDD initiative to
plebiscites or representative-based meetings. He finds little impact on the projects chosen, but
much greater satisfaction with them and reported willingness to contribute in the communities
that chose by plebiscite. These two studies suggest that direct democracy may have some
advantages as a method of project selection. Though the comparison is not exact and our
measures on this dimension are relatively weak, we find no evidence that CDR associated with
greater satisfaction with project selection in our community public goods game. We do find,
however, some evidence of a positive effect on use of democratic procedures.
Another experimental literature asks whether providing information to constituents of
various public services improves political accountability and service provision, typically finding
that it does (Bjorkman and Svensson, 2009; Chong, De La O, Karlan, and Wantchekon, 2010;
5

Ferraz and Finan, 2008; Pande, 2011, for a review). The focus of CDR and CDD programs is
on building new local-level institutions, although in the process information is conveyed about
how democracy is supposed to work. We find some indication that the CDR program studied
here increased expressed trust in community leaders, although this does not appear to be the
pathway by which CDR increased community contributions in the public goods game.
In section 2, we provide background on the setting of the CDR program in Liberia, and
then describe the intervention, the experimental assignment, and the general effects of the
program. Section 3 describes in detail the community-wide public goods game implemented
in all 83 treatment and control communities six to seven months after the completion of the
CDR intervention. It also presents the main effects of exposure to CDR, and for two additional
experimental manipulations we introduced into the game concerning the gender composition
of the game players and the interest rate individual players faced on their contribution.
Section 4 turns to the problem of discerning the mechanism(s) by which the CDR program
increased collective action capacity, beginning with a model of the decision problem faced by
game players and by community elites considering how much to mobilize in preparation for
play of the game. The model yields a set of hypotheses about how exposure to the CDR
intervention might have had an effect. Sections 5 and 6 consider these hypotheses using
our evidence from surveys of the game players, community representatives, and chiefs. The
conclusion spells out implications for researchers and policy makers.
2 A CDR Program in Northern Liberia
Brutal and inept rule by Sergeant Samuel K. Doe in the 1980s had, by the end of the decade,
attracted a variety of armed challengers for power in Liberia, the most successful of whom was
Charles Taylor. Taylor’s National Patriotic Front of Liberia (NPFL) fought the government,
a rival rebel group (ULIMO), and international intervention forces (ECOMOG) until a peace
agreement brought him to power by elections in 1996. Something of a peace then prevailed
until new rebel groups, and chiefly the Liberians United for Reconciliation and Democracy
(LURD; in some ways a successor to ULIMO), began trying to unseat Taylor in 1999. With the
help of international pressure, they succeeded in 2003. A major United Nations peacekeeping
operation (UNMIL) and election of Ellen Sirleaf Johnson as president, followed. UNMIL is
still in the country though its numbers are much diminished. In 2006, the United Kingdom’s
Department for International Development (DFID) funded a $1.6 million project by the In-
ternational Rescue Committee (IRC) for a CDR project in two districts of northern Liberia,
Voinjama and Zorzor, which border on Guinea.
6

2.1 The program
The IRC project sought to support CDR programs in 42 “communities,” where “communities”
were to be constructed as groupings of a relatively large “hub village” (which in practice ranged
from roughly 30 to 600 households) and smaller neighboring “satellite” villages (usually small
clusters of households).4 The authors participated with the IRC in the identification of a set
of 83 potential communities, and in designing public lotteries held in September 2006 to select
42 to receive an IRC CDR program.
Voinjama and Zorzor districts were hard hit by the war, due in large part to several episodes
when control of the area shifted between Taylor’s NPFL and the rebel groups ULIMO and
LURD. People of the majority ethnic group in the two districts, the Loma, mainly supported
Taylor and the NPFL; members of the largest minority, the Mandingo mainly supported, or
at least were identified with, ULIMO and LURD. Based on our household surveys, Voinjama
district is about 59% Loma and 30% Mandingo; in Zorzor the proportions are 92% and 4%.
Most communities, however, are relatively ethnically homogenous; for example, about 50 of
the 83 communities are 90% or more from one group, and in only 16 is there a minority
population of at least 15%.
Our baseline data record information on almost 6,000 household members living in the
region in 1989. Of these, over 4% are reported to have died directly from war related violence
and a further 6% suffered injury or maiming. 5% took active part in the fighting, with three
fifths of these reporting that they were abducted. A similar share (4.9%) of approximately
1500 subjects we interviewed in our follow-up survey self-reported as ex-combatants. The most
widespread impact, however, was one that could bear on communities’ ability to cooperate
(Richards, 2005): 85% of these individuals were displaced during the conflict and many were
displaced multiple times, often to refugee camps in Guinea.
The IRC’s CDR program adapts for a post-conflict context the Community Driven De-
velopment model that is now widely supported by the World Bank and other donors for aid
programs aimed at poverty reduction. The goals are to “improve material welfare, build in-
stitutions and promote community cohesion ... [and to facilitate] the creation of sustainable
community (governance) structures and communities participating within those structures
through a system responsive to community rights and needs – paying particular attention to
4In the region these settlements are generally called towns, not villages. The size and number ofthe CDR communities was determined in part by funder requirements on the number of people to beserved by the project, in part by the logistical capacity of IRC in northern Liberia, and in part bydistribution of villages and people in these two districts. In practice, our impression is that the IRCprojects focused on the hub villages (and town quarters), which are natural communities in the sensethat they have a traditional authority structure.
7

the most vulnerable and those most impacted by war (women, youth, excombatants and vul-
nerables).”5 One premise of the aid project is that poverty, “lack of democratic governance”
at the grass-roots level, and marginalization of vulnerable subpopulations are causes of vio-
lent conflict. Another is that past conflict increases tensions and distrust within and between
communities, so creating a need for projects that will promote reconciliation.
The IRC’s CDR program in Liberia had the following core components. After the commu-
nities were identified and the treatment set selected in September 2006, the IRC undertook
initial activities to explain the program to local communities, including meetings with chiefs
and elders to solicit their cooperation on an advisory board. In each community, the IRC then
oversaw the election of community development councils (CDCs), with 5 to 15 representatives
(the average was 9). All adults in the community were eligible to vote, and the IRC staff
encouraged though did not require the CDC to include female members (in practice, all com-
munities had at least one and in the median case, one-third of members were women). CDCs
were then empowered to oversee a community-wide process to select and implement a “quick
impact” project (median value of $2,700), followed by a larger development project (median
value of $12,000). Communities were also encouraged to consider using part of the total block
grant (median value of about $13,000) for a “marginalized project” intended to address needs
of vulnerable groups, although in practice these projects, when undertaken, were similar to
the quick-impact and larger projects.
All three types of projects tended to involve construction of community facilities, such as
community meeting houses, guest houses and latrines for important visitors, school rooms, and
wells. The IRC staff helped to conduct a needs assessment with the CDC and in community
meetings, but, subject to a few constraints, the “community driven” philosophy deliberately
leaves project selection to the community.6 For all projects, communities were supposed to
supply labor or in-kind contributions worth 10% of project value. IRC staff also assisted
the CDCs with project design and tendering bids from local contractors. CDCs managed the
implementation process and continue to have responsibility for project maintenance over time.
By March 2008, construction had been completed on 55 of 131 projects in all 42 treatment
communities, and had at least begun on almost all of them.7 Delays were ascribed mainly to
an initial overestimation of the capacity of the local construction sector, and perhaps also to
to what may have been an unusual level of IRC staff turnover.
5This is from the IRC’s final proposal to DFID for the project.6Projects must be for community-wide rather than private or narrowly targeted benefit, and it seems
that purchase of capital equipment for income-generating projects (such as a rice mill) was also notallowed in this case.
7Note that some communities, particularly the larger ones, which received larger block grants,pursued multiple projects.
8

2.2 Treatment Assignment and Covariate Balance
In September 2006, IRC staff randomly assigned collections of villages to treatment. The
method used was block randomization, with 21 of 40 clusters of villages selected with equal
probability in Zorzor and 21 of 43 communities selected with equal probability in Voinjama.
Selection was implemented by IRC staff by drawing lots during public lotteries with partic-
ipants from the community clusters. Reports from the IRC suggest that representatives of
communities were in general positive about the process of random allocation on the grounds
that it seemed both transparent and fair relative to the standard approach of selection by
NGOs and government officials.
In March and April 2006, before the community boundaries were decided, we implemented
a baseline household survey of 1,702 households in the two districts. Of these, 1,606 lived in
communities ultimately assigned to treatment or control status. The baseline data allow us
to assess whether the treatment and control communities are similar on various dimensions
such as material well being, conflict experience, ethnic composition, as well as a large set of
indicators of attitudes about governance.
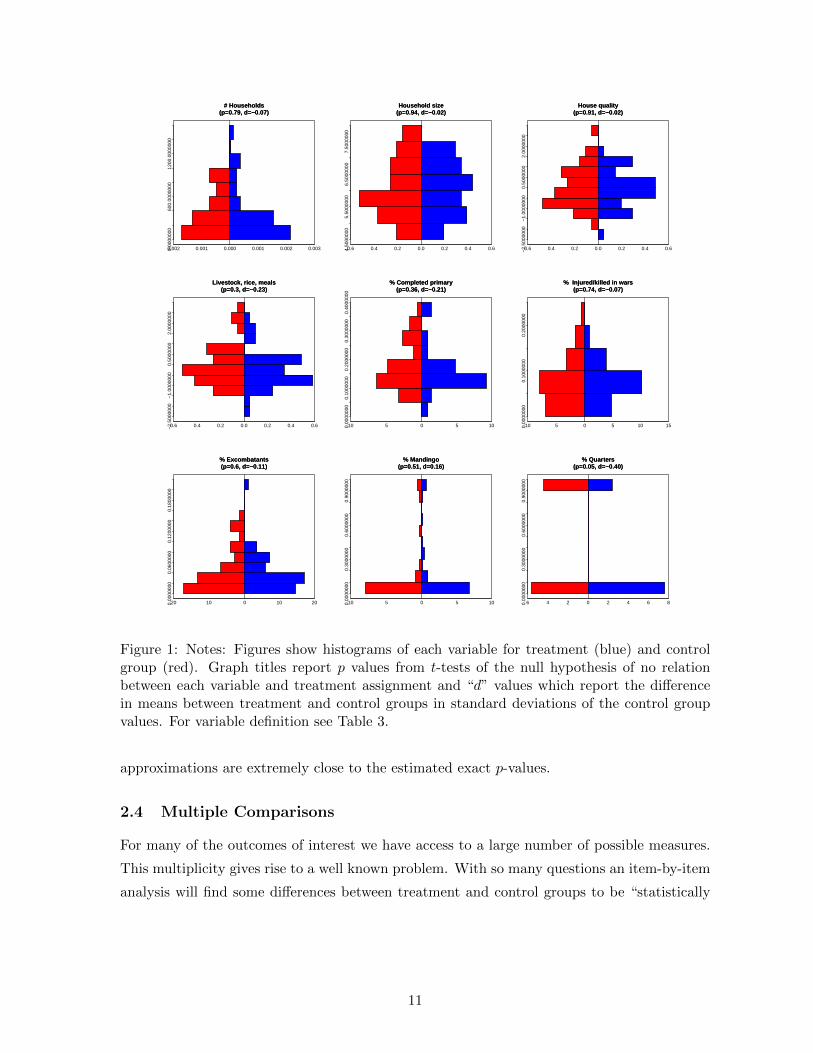
Figure 1 shows the distribution in treatment and control communities of a core set of
variables that are plausibly associated with collective action capacity: basic population data
(number of households, persons per household), a set of three wealth indicators (two compos-
ite measures of material wellbeing and percent with primary school education), exposure to
conflict (percent household members injured or killed in conflict since 1989 and share that are
former combatants), a measure of ethnic heterogeneity (percent Mandingo), and a measure
of rurality (percent of communities that are “quarters” of a larger town). With one excep-
tion, balance is very good; our many attitudinal indicators show excellent balance as well.
An F -test for the hypothesis that these variables are jointly uncorrelated with treatment has
an associated p value of 0.56 indicating that we cannot reject the null hypothesis that the
randomization was faithfully implemented by IRC field agents.
The variable for which balance is poor is “quarters.” Twenty-eight communities in the
five largest towns, are classed as quarters — an administrative level within a town that has a
chief or sub-chief, and more or less well-delimited boundaries. Chance allocated 10 quarters
to CDR treatment and 18 to control, a somewhat skewed distribution. This difference corre-
sponds to a 0.40 standard deviation difference between treatment and control group values. In
the public goods game discussed below, we found that the quarters generated markedly lower
contributions, an outcome consistent with other observations suggesting that these communi-
ties were less well organized on average than more rural communities. There is disagreement
on the merits of trying to “control” for variables on which there is imbalance of this form.
9

Introducing controls does not reduce bias since bias does not depend on the realization of the
randomization. Moreover, it may introduce bias if controls are selected using a ‘conservative’
approach in which controls are introduced precisely because they lead to smaller estimated
effect sizes or larger standard errors. Introducing controls may improve efficiency, although
the efficiency rationale for introducing controls is weakened, not strengthened, by the failure
of a balance test (Mutz and Pemantle, 2011). Nevertheless, many researchers view invariance
of estimated effects to the introduction of controls as evidence of robustness. For this reason,
in most analyses we report results with and without a control for “quarters” although we
emphasize that our preferred specification, the unconditional estimate of treatment effects,
provides an unbiased estimate.
2.3 Estimation of Effects
Unless otherwise noted, we report estimates of the average treatment effect. These estimates
take account of the blocked randomization by using district as strata; in addition, strata are
used to account for other treatment arms where relevant and, where noted, to account for
‘quarters’ as a potential confound. These estimates and their associated standard errors are
calculated as follows:
τATE =∑S∈S
nSn
(1
nS1
∑S∩T
yi −1
nS0
∑S∩C
yi
)(1)
σATE =
√√√√∑S∈S
(nSn
)2(σ2S1
nS1+σ2S0
nS0
)(2)
where yi is the observed outcome of interest in unit i; S is a set of strata with typical element S;
T and C are the collections of units in treatment and control; n and and nS denote the number
of all units and units in stratum S respectively; nS1 and nS0 denote the number of treated
and untreated units in stratum S; and σ2Sj is the estimated variance of potential outcomes
under treatment condition j in stratum S. All analyses of CDR effects use the community
as the unit of analysis since this was the level of treatment assignment (or in the analysis of
heterogeneous effects, subsets of community responses are analyzed); in our analysis of the
behavioral game, we also analyze a composition treatment at the level of communities and
interest rate effects at the level of individual players.
Exact p values are estimated using randomization inference and taking account of the
structure of blocking in the randomization scheme. In general, results for the average treatment
effect, or a t-test on the difference of means without matching, yield similar results. Asymptotic
10
# Households(p=0.79, d=−0.07)
# Households(p=0.79, d=−0.07)
0.002 0.001 0.000 0.001 0.002 0.0030.00
0000
060
0.00
0000
012
00.0
0000
00
Household size(p=0.94, d=−0.02)Household size
(p=0.94, d=−0.02)
0.6 0.4 0.2 0.0 0.2 0.4 0.64.50
0000
05.
5000
000
6.50
0000
07.
5000
000
House quality(p=0.91, d=−0.02)
House quality(p=0.91, d=−0.02)
0.6 0.4 0.2 0.0 0.2 0.4 0.6−2.
5000
000
−1.
0000
000
0.50
0000
02.
0000
000
Livestock, rice, meals(p=0.3, d=−0.23)
Livestock, rice, meals(p=0.3, d=−0.23)
0.6 0.4 0.2 0.0 0.2 0.4 0.6−2.
5000
000
−1.
0000
000
0.50
0000
02.
0000
000
% Completed primary(p=0.36, d=−0.21)
% Completed primary(p=0.36, d=−0.21)
10 5 0 5 100.00
0000
00.
1000
000
0.20
0000
00.
3000
000
0.40
0000
0
% Injured/killed in wars(p=0.74, d=−0.07)
% Injured/killed in wars(p=0.74, d=−0.07)
10 5 0 5 10 150.00
0000
00.
1000
000
0.20
0000
0
% Excombatants(p=0.6, d=−0.11)% Excombatants(p=0.6, d=−0.11)
20 10 0 10 200.00
0000
00.
0600
000
0.12
0000
00.
1800
000
% Mandingo(p=0.51, d=0.16)
% Mandingo(p=0.51, d=0.16)
10 5 0 5 100.00
0000
00.
3000
000
0.60
0000
00.
9000
000
% Quarters(p=0.05, d=−0.40)
% Quarters(p=0.05, d=−0.40)
6 4 2 0 2 4 6 80.00
0000
00.
3000
000
0.60
0000
00.
9000
000
Figure 1: Notes: Figures show histograms of each variable for treatment (blue) and controlgroup (red). Graph titles report p values from t-tests of the null hypothesis of no relationbetween each variable and treatment assignment and “d” values which report the differencein means between treatment and control groups in standard deviations of the control groupvalues. For variable definition see Table 3.
approximations are extremely close to the estimated exact p-values.
2.4 Multiple Comparisons
For many of the outcomes of interest we have access to a large number of possible measures.
This multiplicity gives rise to a well known problem. With so many questions an item-by-item
analysis will find some differences between treatment and control groups to be “statistically
11
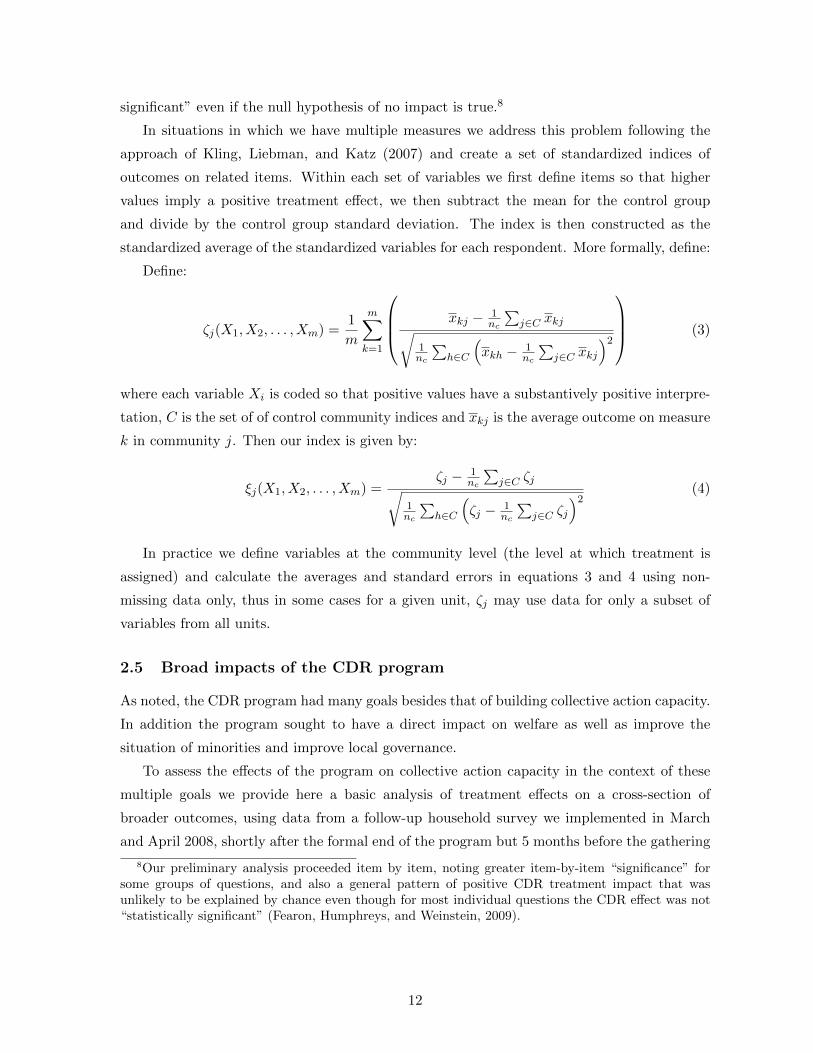
significant” even if the null hypothesis of no impact is true.8
In situations in which we have multiple measures we address this problem following the
approach of Kling, Liebman, and Katz (2007) and create a set of standardized indices of
outcomes on related items. Within each set of variables we first define items so that higher
values imply a positive treatment effect, we then subtract the mean for the control group
and divide by the control group standard deviation. The index is then constructed as the
standardized average of the standardized variables for each respondent. More formally, define:
Define:
ζj(X1, X2, . . . , Xm) =1
m
m∑k=1
xkj − 1nc
∑j∈C xkj√
1nc
∑h∈C
(xkh − 1
nc
∑j∈C xkj
)2
(3)
where each variable Xi is coded so that positive values have a substantively positive interpre-
tation, C is the set of of control community indices and xkj is the average outcome on measure
k in community j. Then our index is given by:
ξj(X1, X2, . . . , Xm) =ζj − 1
nc
∑j∈C ζj√
1nc
∑h∈C
(ζj − 1
nc
∑j∈C ζj
)2(4)
In practice we define variables at the community level (the level at which treatment is
assigned) and calculate the averages and standard errors in equations 3 and 4 using non-
missing data only, thus in some cases for a given unit, ζj may use data for only a subset of
variables from all units.
2.5 Broad impacts of the CDR program
As noted, the CDR program had many goals besides that of building collective action capacity.
In addition the program sought to have a direct impact on welfare as well as improve the
situation of minorities and improve local governance.
To assess the effects of the program on collective action capacity in the context of these
multiple goals we provide here a basic analysis of treatment effects on a cross-section of
broader outcomes, using data from a follow-up household survey we implemented in March
and April 2008, shortly after the formal end of the program but 5 months before the gathering
8Our preliminary analysis proceeded item by item, noting greater item-by-item “significance” forsome groups of questions, and also a general pattern of positive CDR treatment impact that wasunlikely to be explained by chance even though for most individual questions the CDR effect was not“statistically significant” (Fearon, Humphreys, and Weinstein, 2009).
12

of our measures of collective action capacity. The endline survey gathered data on 1,382 of
1,606 study area households interviewed in 2006 (we also added 166 new households to ensure
a minimum of ten surveys per community). Similar to the baseline, this survey collected
data on material welfare, public services, social capital, attitudes about local governance and
marginalized groups, and participation in community affairs.
The survey comprised 141 questions, most with multiple parts, so we have 514 response
variables excluding the “roster” data on socio-demographic characteristics of household mem-
bers. For the purposes of this paper, we focus our analysis on the subset of questions related
to community governance and collective action, and group questions in sets that correspond
to CDR program objectives (see Appendix A for the questions and groupings). In particu-
lar, we explore the impact of the CDR intervention on faith in local leaders and the value of
democratic processes, the degree of political and social efficacy, attitudes toward marginal-
ized groups, and the extent of community activity. The CDR program is hypothesized to
strengthen collective action capacity in part by changing attitudes about the value of open
and democratic processes and the importance of inclusiveness, and changing beliefs about the
extent to which individuals can make a difference in community affairs.
The first seven rows of Figure 2 summarize results for indices of attitudes related to
community governance practices. We see strong evidence of a positive CDR impact, with
estimated effects on average about 20% of a standard deviation and statistical significance for
all categories except the questions about women’s political rights (which nevertheless border
on significance at conventional levels). “Democracy” questions tap respondents’ attitudes
about the value of democratic process for community decision-making. For example, should
community members or chiefs have the most influence over scenarios involving a land dispute
and use of development funds; should town members question or “respect” authority; should
leaders favor their family or ethnic group; should community leaders be elected? “Efficacy”
covers whether the respondent feels he/she has influence or capacity to influence community
decisions, whether they feel free to express their views, and whether they are generally satisfied
with the way community decisions are made. “Participation” includes reports on community
initiatives and willingness to work together, individual participation in community meetings
and contacts with various authorities, frequency of community meetings, and intention to
vote and work with a political party. “Inclusion of ex-combatants” combines questions about
attitudes towards ex-combatants, their treatment in community meetings and perceptions of
their willingness to work for the community. “Inclusion of migrants” uses the same questions
but for “returnees” and “new migrants.” “Trust in leaders” includes direct questions about how
“trustworthy” are leaders in this town compared to other towns, what share of development
13

funds they would likely keep for private use, whether making complaints to leaders is likely to
have any good effect, and whether they “do better” out of community meetings.
The last two rows of Figure 2 display results for indices of social capital (membership in or-
ganizations and clubs) and the degree of conflict within the community (reports of “divisions”
and/or violence along the lines of income, gender, age, migrant status, religion, ethnicity,
and education, and reports of crime or fighting). Again we find evidence of positive effects
although estimates are weakened when we condition on quarter. (The more urban quarters
had more reports of conflict, social divisions, and crime, and were somewhat underrepresented
in the treatment set.)
These results are suggestive of striking social impacts in line with the expectations of the
program; although in the context of a program designed specifically to affect these outcomes
there is cause for concern that the results reflect a desire of respondents to reflect the values
of international donors. These concerns motivate the use of behavioral measures, described in
the next section.
A final point about the survey results is worth emphasizing: the focus on estimating CDR
impact should not lead us to miss the fact that respondents in both treatment and control
communities generally reported high levels of social capital, trust in community leaders in-
cluding chiefs, sense of individual and community efficacy, participation in community efforts,
support for democratic procedures, and tolerance and acceptance of ex-combatants and new
migrants. CDD and CDR programs attempt to foster these beliefs and capacities in commu-
nities presumed to suffer from their absence. At a higher level of generality, some theories of
economic development argue that low levels of trust and volunteer community organizations
are important barriers to growth in poor countries. These survey data from two war-ravaged
districts in northern Liberia are at odds with these assumptions.9Large majorities of respon-
dents reported attending a community meeting in the last six months and speaking or making
a suggestion in a meeting. Many also reported having raised an issue with the town chief
(about 46%). Asked if divisions or disputes along the lines of wealth, gender, age, migrant
status, religion, ethnicity, or education hindered cooperation in the community, on average
around 80% or more of respondents said “not at all” rather than “somewhat” or “very much.”
3 Main Results
The analysis presented in the last section on broad outcomes of the CDR program followed a
relatively standard approach of using survey evidence to assess collective action capacity and
9To give just one example, over 90% of respondents reported belonging to at least one community or socialorganization, and over 50% said they belonged to at least three.
14

Average treatment effects (endline survey measures)
●
●
0 0.2−0.2 0.4−0.4
●
●
0 0.2−0.2 0.4−0.4
●
●
0 0.2−0.2 0.4−0.4
●
●
0 0.2−0.2 0.4−0.4
●
●
0 0.2−0.2 0.4−0.4
●
●
0 0.2−0.2 0.4−0.4
●
●
0 0.2−0.2 0.4−0.4
●
●
0 0.2−0.2 0.4−0.4
●
●
0 0.2−0.2 0.4−0.4
●
●
0 0.2−0.2 0.4−0.4
●
●
0 0.2−0.2 0.4−0.4
●
●
0 0.2−0.2 0.4−0.4
●
●
0 0.2−0.2 0.4−0.4
Social Capital
Reduced tensions
Trust in leaders
Inclusion of migrants
Inclusion of excombatants
Women's rights
Participation
Efficacy
Democracy
All material
House quality
Assets
Food
ATE (p=0.02)
ATE|Q (p=0.12)
ATE (p=0.03)
ATE|Q (p=0.17)
ATE (p=0.00)
ATE|Q (p=0.02)
ATE (p=0.01)
ATE|Q (p=0.03)
ATE (p=0.02)
ATE|Q (p=0.04)
ATE (p=0.10)
ATE|Q (p=0.20)
ATE (p=0.01)
ATE|Q (p=0.03)
ATE (p=0.01)
ATE|Q (p=0.04)
ATE (p=0.07)
ATE|Q (p=0.04)
ATE (p=0.56)
ATE|Q (p=0.69)
ATE (p=0.29)
ATE|Q (p=0.91)
ATE (p=0.78)
ATE|Q (p=0.25)
ATE (p=0.86)
ATE|Q (p=0.73)
Figure 2: Figure shows unadjusted average treatment effects (ATE) and average treatmenteffects with covariate adjustment for quarter (ATE|Q). Lines are 95% and ticks are at 90%confidence intervals. See Table 3 (Appendix) for variable definitions and summary statistics.
15
institutional performance. For the measurement of collective action outcomes, however, we
were particularly concerned that CDR could lead to a change in reported responses without
changing capacity or inclination for collective action. For example, the NGO’s intervention
might influence people’s understanding of what they are “supposed to say” but not their
willingness or ability to act and coordinate in line with those expressed beliefs.
For this reason, we designed a public goods game with the goal of observing whether
communities exposed to the CDR program were in fact more effective at acting collectively.
The game involved the following steps. An advance team visited each of the 83 hub towns
and gained consent for a community meeting to describe an opportunity for the community
to receive new funds for development. One week later, we ran a meeting in which community
members were told that they could receive up to $420 to spend on a development project.10
Receipt of funds would depend on whether the community completed a form indicating how the
funds would be spent and the names of three community representatives to receive and handle
the funds. The specific amount received would depend on how much money a random sample
of 24 people contributed to the project in a community-wide public goods game. One week
after that, a team returned to the village, collected the form, sampled 24 households, played
the game, and publicly announced and provided the total payout to the village. Between these
two visits, the community had time to select their community representatives and potential
projects, and to spread information about the game and how it should be played. On game
day, detailed surveys were completed with all 24 game players (after they made their private
contribution decisions), the three community representatives, and the village chief.
3.1 Game Description
The public goods game itself was straightforward: 24 randomly selected adults (from randomly
selected households) were given three 100LD notes, worth in total about $5 US or close to a
week’s wages. They then chose, in private, how much to contribute to the community and
how much to keep for themselves. It had been explained in the community meeting that half
of the players would have their contributions multiplied by two, while the others would be
multiplied by five, corresponding to interest rates of 100% and 400%. Thus each community
had the opportunity to earn up to 25,200 LD. For this “interest rate treatment,” players were
randomly assigned to the high and low rate conditions (with blocking on gender and location);
10The initial community meeting and the game itself were administered by a Liberian NGO – NationalExcombatant Peacebuilding Initiative – working with a team of Stanford graduate students under ouroversight. NEPI members did not know that we were studying the effects of the IRC CDR program,and our graduate students typically did not themselves know which villages were treatment and control(although in some cases signs advertised IRC projects).
16

players knew their interest rate when choosing how much to contribute.11
3.2 Gender Composition Treatment
In addition, we ran a cross-cutting experimental treatment: in half of the communities all 24
game players were women, while in the other half, we selected 12 men and 12 women players.
The gender composition assignment was implemented using a matched pair design in which
units were matched based on estimated population size. This ‘gender composition’ treatment
related only to the makeup of the players for the public goods game, and not necessarily the
set of beneficiaries of the potential development project. This was explained to communities
via the verbal instructions delivered at each community meeting in which it was made clear
that, regardless of the gender of the game players, in all communities both women and men
could participate in meetings to decide on projects, serve as community representatives, and
be beneficiaries of the project itself.12
Table 1 gives the overall distribution of treatments and reports the number of communities
and treatments in each condition.
3.3 Implementation of Games
Eighty-two communities successfully completed the behavioral game.13 The average payout
to villages was 20,020LD, or 79.4% of the total possible, with a standard deviation of 13.3%.
Among individuals, fully two-thirds contributed the maximum amount (300LD), with the rest
almost evenly divided over giving 200 (10%), 100 (12%), or 0 (11%). The average contribution
was about 235LD, which is 78.3% of 300.14 In lab experiments, contributions in the first play of
analogous public goods games are typically around 50% of individual endowments (Ledyard,
1995). Arguably, then, these rural Liberian communities managed an impressive level of
11In the community meetings, our presenters stressed that the contribution decision was up to thegame player and that there could be good reasons for an individual to keep the money for private use.It was evident, however, that attendees immediately grasped the conflict between private and socialgood.
12We added the gender treatment because it was simple to implement and could allow us to speakto donor and academic interest in the question of how women’s involvement in community decision-making affects outcomes; we also expected, as noted above, that we would find no CDR treatmenteffect. We did not have the statistical power to have a third set of communities where all game playerswere men. Because our focus in this paper is on CDR, we do not provide a full analysis of the gendercomposition treatment.
13Play was halted prematurely in one community after a player changed her mind about her contribu-tion decision and a public scene developed when she and her sister made this known. The communitywas later given an approximately average payout to avoid hard feelings.
14A handful of players disobeyed instructions and put amounts other than 0, 100, 200, or 300 intothe envelope. We use their actual contributions in the individual-level analyses that follow.
17

Table 1: Distribution of treatments
CDR Intervention Total Communities
Gender composition Control Treatment (Participants)
Mixed groups 20 22 42 (1008)
Women only 21 20 41 (984)
Total communities 41 (982) 42 (1008) 83 (1992)
(Participants)
Notes: In mixed groups 12 men and 12 women were selected asgame players; in ‘women only’ communities, all 24 were women. Inall communities, 12 players were randomly assigned to have a highinterest rate and 12 to low. In areas with mixed groups half the menand half the women were assigned to each interest rate condition.The CDR assignment was blocked on district. The women gendercomposition assignment was blocked using a matched pair designwith matching on village size.
cooperation.15
3.4 Main Effects from Behavioral Measures
The focus of our analysis here is on the effect of the CDR treatment on contributions by
players. The central outcome of interest is the degree to which communities were able to act
collectively, as reflected in individual decisions about how much to contribute for a project
to be managed by three community representatives. We provide only summary results of
the effects of the gender composition and interest rate variations, but use them throughout
the analysis as strata and to examine heterogeneous effects. With all treatments randomly
assigned across villages (or individuals), the behavioral game allows us to measure the causal
effect of the CDR program on actual behavior and also to see how that impact varies with
gender composition of the players and the interest rates accruing to individual contributions.
Since the main intervention was administered at the community level, we run our core analysis
using a community level outcome – the average contribution by players in a community.
We emphasize that our research design does not isolate the impact of introducing new
democratic institutions per se. Instead, we are in a position to identify the overall effect of
receiving CDR funds for public goods provision coupled with the creation and use of partic-
ipatory, democratic institutions for selection and implementation of community projects. To
try to assess the effect of the institutional aspects of the CDR program on collective action
15Lab experiments usually involve smaller stakes (relative to wealth and income) and smaller groups,both of which favor contributions relative to our case. On the other hand, our game involved actualcommunities that had a week to mobilize and exhort people to contribute if chosen to play.
18
capacity, we have to consider other information, a task we undertake below.
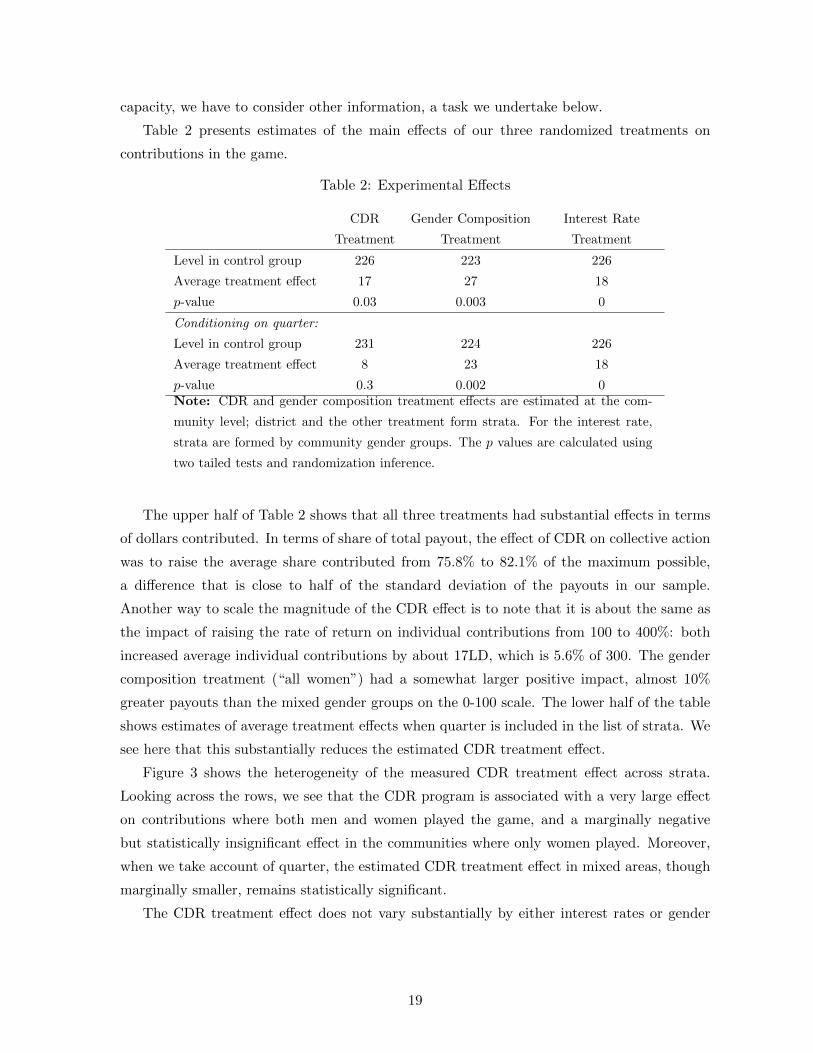
Table 2 presents estimates of the main effects of our three randomized treatments on
contributions in the game.
Table 2: Experimental Effects
CDR Gender Composition Interest Rate
Treatment Treatment Treatment
Level in control group 226 223 226
Average treatment effect 17 27 18
p-value 0.03 0.003 0
Conditioning on quarter:
Level in control group 231 224 226
Average treatment effect 8 23 18
p-value 0.3 0.002 0Note: CDR and gender composition treatment effects are estimated at the com-
munity level; district and the other treatment form strata. For the interest rate,
strata are formed by community gender groups. The p values are calculated using
two tailed tests and randomization inference.
The upper half of Table 2 shows that all three treatments had substantial effects in terms
of dollars contributed. In terms of share of total payout, the effect of CDR on collective action
was to raise the average share contributed from 75.8% to 82.1% of the maximum possible,
a difference that is close to half of the standard deviation of the payouts in our sample.
Another way to scale the magnitude of the CDR effect is to note that it is about the same as
the impact of raising the rate of return on individual contributions from 100 to 400%: both
increased average individual contributions by about 17LD, which is 5.6% of 300. The gender
composition treatment (“all women”) had a somewhat larger positive impact, almost 10%
greater payouts than the mixed gender groups on the 0-100 scale. The lower half of the table
shows estimates of average treatment effects when quarter is included in the list of strata. We
see here that this substantially reduces the estimated CDR treatment effect.
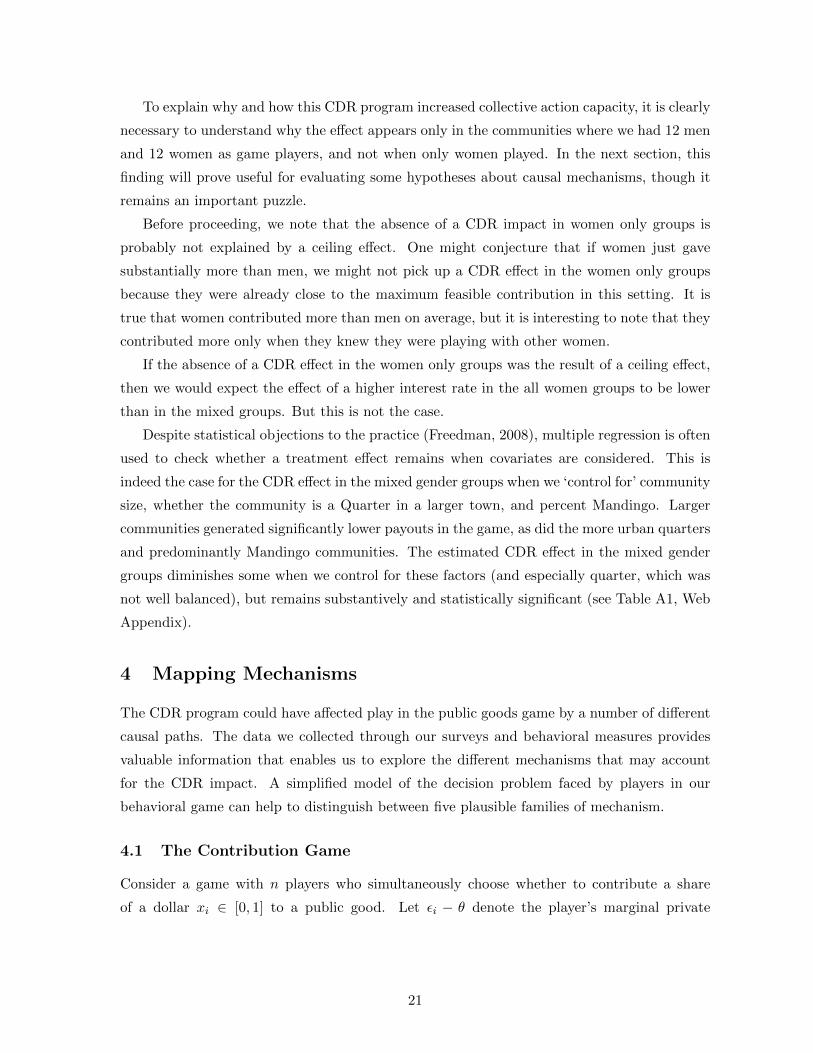
Figure 3 shows the heterogeneity of the measured CDR treatment effect across strata.
Looking across the rows, we see that the CDR program is associated with a very large effect
on contributions where both men and women played the game, and a marginally negative
but statistically insignificant effect in the communities where only women played. Moreover,
when we take account of quarter, the estimated CDR treatment effect in mixed areas, though
marginally smaller, remains statistically significant.
The CDR treatment effect does not vary substantially by either interest rates or gender
19

of the game player. That is, although the treatment effect is stronger in mixed gender groups
than in women only groups, this is not because CDR affected men’s contributions but not
women’s in the mixed groups. Interest rate effects are strong in both the mixed and women
only groups but surprisingly are found among women only. Male players ignore the interest
rate in both treatment and control conditions. Importantly, and a point we return to below,
we see little evidence of an interaction between the interest rate and the CDR treatment: it is
not the case that experiencing the CDR program increased game player’s sensitivity to higher
interest rates, for example.
CDR effect by gender composition, interest rate, and player gender
p=0.60●
0 60−60 30−30
p=0.00●
0 60−60 30−30
p=0.16●
0 60−60 30−30
p=0.03●
0 60−60 30−30 0 60−60 30−30
p=0.00●
0 60−60 30−30 0 60−60 30−30
p=0.02●
0 60−60 30−30
p=0.21●
0 60−60 30−30
p=0.00●
0 60−60 30−30
Women only
Mixed
High interest/Women Low interest/Women High interest/Men Low interest/Men All
CDR effect by gender composition, interest rate, and player gender|Quarter
p=0.52●
0 60−60 30−30
p=0.03●
0 60−60 30−30
p=0.10●
0 60−60 30−30
p=0.24●
0 60−60 30−30 0 60−60 30−30
p=0.02●
0 60−60 30−30 0 60−60 30−30
p=0.15●
0 60−60 30−30
p=0.14●
0 60−60 30−30
p=0.01●
0 60−60 30−30
Women only
Mixed
High interest/Women Low interest/Women High interest/Men Low interest/Men All
High interest effect by CDR status, gender composition, and player gender
p=0.03●
0 60−60 30−30
p=0.12●
0 60−60 30−30
p=0.00●
0 60−60 30−30
p=0.08●
0 60−60 30−30 0 60−60 30−30
p=0.62●
0 60−60 30−30 0 60−60 30−30
p=0.46●
0 60−60 30−30
p=0.00●
0 60−60 30−30
p=0.08●
0 60−60 30−30
Women only
Mixed
CDR /Women Control / Women CDR /Men Control / Men All
Figure 3: Heterogeneous effects. Each panel shows estimated treatment effects for six disjointstrata as well as overall effects for women only and mixed groups. Top rows show estimatedeffects, with 95% confidence intervals, for participants in mixed groups; bottom rows showeffects in women only areas (in which there are no male participants). Columns furtherdisaggregate by other treatment conditions and gender of participant. p-values are generatedusing randomization inference.
20
To explain why and how this CDR program increased collective action capacity, it is clearly
necessary to understand why the effect appears only in the communities where we had 12 men
and 12 women as game players, and not when only women played. In the next section, this
finding will prove useful for evaluating some hypotheses about causal mechanisms, though it
remains an important puzzle.
Before proceeding, we note that the absence of a CDR impact in women only groups is
probably not explained by a ceiling effect. One might conjecture that if women just gave
substantially more than men, we might not pick up a CDR effect in the women only groups
because they were already close to the maximum feasible contribution in this setting. It is
true that women contributed more than men on average, but it is interesting to note that they
contributed more only when they knew they were playing with other women.
If the absence of a CDR effect in the women only groups was the result of a ceiling effect,
then we would expect the effect of a higher interest rate in the all women groups to be lower
than in the mixed groups. But this is not the case.
Despite statistical objections to the practice (Freedman, 2008), multiple regression is often
used to check whether a treatment effect remains when covariates are considered. This is
indeed the case for the CDR effect in the mixed gender groups when we ‘control for’ community
size, whether the community is a Quarter in a larger town, and percent Mandingo. Larger
communities generated significantly lower payouts in the game, as did the more urban quarters
and predominantly Mandingo communities. The estimated CDR effect in the mixed gender
groups diminishes some when we control for these factors (and especially quarter, which was
not well balanced), but remains substantively and statistically significant (see Table A1, Web
Appendix).
4 Mapping Mechanisms
The CDR program could have affected play in the public goods game by a number of different
causal paths. The data we collected through our surveys and behavioral measures provides
valuable information that enables us to explore the different mechanisms that may account
for the CDR impact. A simplified model of the decision problem faced by players in our
behavioral game can help to distinguish between five plausible families of mechanism.
4.1 The Contribution Game
Consider a game with n players who simultaneously choose whether to contribute a share
of a dollar xi ∈ [0, 1] to a public good. Let εi − θ denote the player’s marginal private
21

cost of contribution to the public good; the common term, θ, which may be positive or
negative, captures community average net benefits to the act of contribution. The idiosyncratic
component εi, distributed according to cumulative density F on some interval of R, describes
individual deviations from the average. Then let i’s preferences be represented by:
ui(x) = (1 + β)µ
(∑−i
rjxj + rixi
)− (εi − θ)xi
where µ ∈ R captures the rate of transformation of public investments into public goods
(measured in units of the value of own consumption of the public good), and β captures
social preferences, given here by the extent to which i values the public good beyond own-
consumption. Player specific interest rates are given by ri.16
In this simple environment, individuals contribute the full amount, xi = 1, if (1+β)µri+θ >
εi and contribute nothing otherwise. Define φ(r) = (1 + β)µr + θ. With half the population
facing interest rates r and half interest rates r and interest rates distributed independent of
types, the expected value of the public good contributions, π, is
π =n
2(rF (φ(r)) + rF ((φ(r)))
A number of features of the model are worth noting. First if participants saw zero value
to the public investments (µ = 0) – for example due to expected theft of all funds by leaders
– then the decision to contribute would depend on the sign of εi− θ only, reflecting a focus on
the direct costs and benefits of contribution rather than the effects arising through the public
good.
Second, there is an observable difference between effects that work through considerations
that apply to the contribution decision by itself, εi − θ, and effects that work through the
impact of a contribution on the public good, µ or β. If an action increases µ or β then we
expect the effect of this action to be magnified by the interest rate. This is not so for actions
that affect θ, however, since the effect of θ is independent of the interest rate.
Third, although developed for a linear public goods technology, similar logic holds if citi-
zens perceive diminishing marginal returns to spending on the public good, although in this
case players may optimally choose a contribution that is in between all and nothing. In the
unique Bayes-Nash equilibrium of such a game, players with lower values of εi contribute
more (conditional on their interest rate). Alternatively, suppose that players perceive in-
creasing marginal returns from contributions to the public good, or view the marginal cost
16Or more precisely ri denotes the multiplier which is equal to one plus the interest rate.
22

of contributing as decreasing in the number of others who contribute (say, because people
feel discomfort for deviating from what most others are doing). Then multiple equilibria can
arise, with players contributing all or nothing but in larger or smaller sets depending on the
equilibrium. In this case outcomes depend on whether and how communities coordinate on
one or another equilibrium.17
4.2 Mobilization
Below we discuss ways in which exposure to the CDR program could affect the key parameters
from this model, β, µ and θ. Of special interest, however, is the role that mobilization
activity by leaders might play in determining these values. Recall that an initial meeting was
held for each community at which attendees learned that any 24 adults might be selected
to play the game a week later. This allowed time to spread information about the game, to
encourage people to contribute if chosen, and perhaps to hold meetings to choose projects
and representatives.18 Mobilization could increase the average motivation to contribute. But
at the same time, community elites might condition mobilization effort on their expectations
about the benefit from doing so.
Assume for simplicity that F is uniform and let π(γ) denote the expected contributions
to the public good for parameter vector γ = (β, µ, θ), which we take to be an element of a
convex and compact parameter space Γ. Note that π is weakly increasing in each element of
γ. To represent investments in mobilization, say that there exists a baseline (no mobilization)
value of the parameters, γ, and that leaders can choose parameter vector γ ≥ γ to maximize:
u(γ) = π(γ)− c(γ, α|γ)
Here c() denotes a smooth convex cost function that is increasing in each element of γ; α
denotes organizational capacity and we assume that marginal costs of organizing are decreasing
in capacity in the sense that the cross partial cγα is negative.19
In this case there is a unique solution to this problem, γ∗ (existence is guaranteed by
the Weierstrass theorem; uniqueness follows from the concavity of the utility function). The
17For example if n = 2, εi ∼ U [0, 1] and ui = 34 (xi + x−i)
2 − (1 + εi)xi, then there is an equilibriumin which all contribute zero, and another where players with ε > .5 contribute the full amount, andothers contribute 0, and another where all contribute all.
18Attendance varied at the initial community meeting, averaging perhaps one quarter of the adultpopulation of the hub community.
19Note we rule out the possibility that leaders mobilize to reduce contributions to the public good.Note also that defining the objective function as increasing in contributions in this way does not implythat the elite are necessarily public-spirited. They could, for example, value contributions precisely sothat they can subsequently appropriate them for themselves.
23

(positive) incremental expected contributions attributable to mobilization is given by:
∆(α, γ) ≡ π(γ∗(α, γ))− π(γ)
We have then that a drop in the costs of mobilization, α, weakly increases total contributions,
but may do so through changes in any of the parameters affecting individual preferences over
the contribution decision.20
4.3 Model Implications
The model highlights four major families of mechanism that may affect play in the basic
contribution game, corresponding to factors that affect the parameters µ, β, θ, and ability
to coordinate. The CDR program might have increased contributions in the public goods
game by directly affecting community members’ values for these parameters and coordination
ability, or indirectly by increasing community leaders’ mobilization efforts in the week before
play of the game. We consider the immediate, or individual-level pathways first, and then
discuss the possible impact of mobilization efforts on these pathways.
4.3.1 The economic value of the public good
The CDR program could have increased or decreased individuals’ value for their own con-
sumption of the public good as it is produced by contributions. This is captured by µ in the
model. Though the term is not exact, we will refer to these as mechanisms that affect the
economic value of the realized public good. Examples include factors that affect how much an
individual values having a new meeting house, for example, relative to cash, and also factors
that affect how much of the money raised is actually spent on the project.
We highlight two such ways that CDR could affect the economic value of public invest-
ments.
1.1 Project selection effects: If more democratic methods were used to select projects for our
game in CDR communities, this may increase individuals’ satisfaction with the planned
projects.
1.2 Trust in leaders: The experience of the CDR program might have increased trust that
money contributed to the project would actually be delivered and properly spent by
community leaders.
20From the implicit function theorem, γ∗α = −cγα/cγγ > 0.
24
4.3.2 The social value of the public good
Second is the extent to which individuals place value on the social benefits of the public
investments, captured in the model by β. In this case, CDR works by increasing the weight
individuals place on community welfare.
2.1 CDR may increase the social value of the public good by increasing members’ sense of
obligation to the community, experience with the benefits of public goods, or reconcili-
ation that increased the value members put on other community members’ welfare;
4.3.3 Costs and benefits of contributing per se
Third are mechanisms that work by affecting community members’ value for contributing
independent of the actual value of the public good produced. These are captured by θ in the
model.
3.1 Income effects: If the CDR program significantly increased incomes in the community,
this could lower game players’ value for cash versus public projects.
3.2 Sanctioning effects: The CDR program may increase cooperation by increasing individ-
uals’ expectation that they might be sanctioned for failing to contribute.
3.3 Social (NGO) desirability effects: Experience with the CDR project could have increased
the weight community members put on taking actions that please NGOs.21
3.4 Legitimacy effects from participation: If CDR increased the use of participatory proce-
dures in community decision-making, this could lower individuals’ costs of contributing
independent of value for the project and trust in leaders, by increasing the perceived
legitimacy of the action.
4.3.4 The ability to coordinate
Finally, the experience of the CDR program could have improved or, in principle, worsened,
the community’s ability to coordinate on a high contribution equilibrium in a situation where
there are multiple equilibria. As noted above, multiple equilibria arise only if community
members perceive sufficiently increasing returns to public goods contributions (for instance if
21In the community meetings to explain the game, people very quickly saw that the decision problemasked them to choose between personal and community welfare. Some commented along the lines of“they are testing us,” with the idea being that “good performance” would be to show how community-minded their community was. Conceivably, the desire to please a foreign NGO in the hope of futurebenefits could have been increased by experience with the CDR program.
25

they value what they get from raising $400 more than twice as much as what they get from
raising $200) or if individuals value contributing more when others contribute (for instance, if
they feel discomfort for failing to match what others are doing). On the positive side, the CDR
experience might have increased social ties or the propensity to discuss community affairs in
such a way that information about how others would act in the game diffused more rapidly.
Alternatively, if the program created rival sources of power or influence to the traditional
structure, this could have made coordination more difficult.
4 CDR may affect the ability of communities to coordinate on socially desirable outcomes.
4.3.5 Mobilization capacity
CDR might have affected individuals’ calculations directly, or indirectly by increasing the
motivation or efficacy with which community leaders organized in the week prior to the play
of the game. CDR can affect community leader motivations to mobilize by altering their own
values for θ, µ, or β; this could have increased or decreased the effort they spent trying to
influence these parameters in the community.22 In the case of graft (affecting µ), note that
there can be offsetting effects: higher expectation of graft can reduce individuals’ incentive to
contribute, but increase elites’ incentive to mobilize to induce more contributions. It may also
affect incentives to mobilize by altering default levels of community contributions.
The CDR program could also have lowered the costs to leaders of mobilizing for collective
action problems of this form. CDR may have increased the number of community mem-
bers with experience cooperating to run elections, select projects, mobilize contributions, and
spread information about the program. Faced with a similar task, people, networks, and prac-
tices used in the CDR program could be reactivated, and “learning by doing” might have made
them more efficient than in communities that had not had the experience of CDR. These gains
in efficiency may in turn have allowed for more successful action through any of the channels
listed above.
5 The experience of the CDR program might increase the community’s ability to organize
and mobilize for a collective action problem.
5 Evidence on Mechanisms
Identifying the mechanisms through which an intervention operates is in general a difficult
task (Green, Ha, and Bullock, 2010; Imai, Keele, and Tingley, 2010). Our design provides
22This would correspond to lower or higher cost of mobilizing in the model (α), which are implicitlyrelative to the mobilizers’ value for contributions produced.
26
exogenous variation in the application of the CDR program, but not on intermediary variables
that can themselves affect levels of cohesion. Nevertheless, ancillary data from our surveys
provides preliminary evidence that can be used to assess the extent to which these mechanisms
are plausibly in operation. In particular, we provide evidence on the effects of the CDR
treatment on an array of intermediary variables. We also provide a set of correlations between
these intermediary variables and the main outcome of interest, contributions in the public
goods game. We emphasize, however, that while the former relationships are identified, the
latter are not and the analyses in this section should be considered only as suggestive of
possible mechanisms.
5.1 Economic Value of the Public Good
We begin by examining mechanisms that work by altering the value to game players of the
public good. We can see from Table 2 that the interest rate applied to investments has a very
strong effect on contributions. This suggests that the economic value of the investments was
an important consideration, at least for women (see Figure 3). Recall however that following
the logic of our model, if the effect of CDR works through this value then we would expect a
positive interaction between CDR and the interest rate – especially in mixed groups where the
positive effects of CDR are concentrated. That is, if CDR worked by increasing individuals’
value for public goods, then facing a higher interest rate should induce greater contributions
from people in CDR than in control communities. From Figure 3, we see weak evidence of
such an interaction – in mixed gender groups, the treatment effect is moderately stronger for
high interest players; the difference, however, is not statistically significant, suggesting that
this family of mechanisms may not be important. We now examine more closely two specific
members of this family.
5.1.1 Project selection
It is important to note that how project funding was to be used was itself a choice variable
for communities. If CDR-treated communities used more democratic procedures to select
community representatives and projects, then this might have increased players’ value for the
project and thus the marginal value of their contributions.
27

Effects of CDR Treatment on Intermediate Variables
●
●
0 1−1 0.5−0.5
●
●
0 1−1 0.5−0.5
●
●
0 1−1 0.5−0.5
●
●
0 1−1 0.5−0.5
●
●
0 1−1 0.5−0.5
●
●
0 1−1 0.5−0.5
●
●
0 1−1 0.5−0.5
●
●
0 1−1 0.5−0.5
●
●
0 1−1 0.5−0.5
●
●
0 1−1 0.5−0.5
●
●
0 1−1 0.5−0.5
●
●
0 1−1 0.5−0.5
●
●
0 1−1 0.5−0.5
●
●
0 1−1 0.5−0.5
●
●
0 1−1 0.5−0.5
●
●
0 1−1 0.5−0.5
●
●
0 1−1 0.5−0.5
●
●
0 1−1 0.5−0.5
●
●
0 1−1 0.5−0.5
●
●
0 1−1 0.5−0.5
●
●
0 1−1 0.5−0.5
Women only
Mixed
All
ττ|Quarter
ττ|Quarter
ττ|Quarter
Satisfaction with Projects
Trust in leaders No Anonymity Social Desirability
Participation Expectations Accuracy
Economic Value Contribution Value Coordination
Relation between Intermediate Variables and Contributions (Non Experimental)
●
●
0 30−30 15−15
●
●
0 30−30 15−15
●
●
0 30−30 15−15
●
●
0 30−30 15−15
●
●
0 30−30 15−15
●
●
0 30−30 15−15
●
●
0 30−30 15−15
●
●
0 30−30 15−15
●
●
0 30−30 15−15
●
●
0 30−30 15−15
●
●
0 30−30 15−15
●
●
0 30−30 15−15
●
●
0 30−30 15−15
●
●
0 30−30 15−15
●
●
0 30−30 15−15
●
●
0 30−30 15−15
●
●
0 30−30 15−15
●
●
0 30−30 15−15
●
●
0 30−30 15−15
●
●
0 30−30 15−15
●
●
0 30−30 15−15
Women only
Mixed
All
bb|CDR
bb|CDR
bb|CDR
Satisfaction with Projects
Trust in leaders No Anonymity Social Desirability
Participation Expectations Accuracy
Economic Value Contribution Value Coordination
Figure 4: Upper panel shows the effects of CDR on various intermediary variables; lower panel shows the relation (regressioncoefficients) between these intermediary variables and outcomes. Note that while estimates in the upper panel are identified due torandomization, those in the lower panel are not. See Table 3 for variable definitions and summary statistics.
28

In the surveys of game players, community representatives, and chiefs, we asked a number
of questions about the procedures used to select community representatives and the projects.
We also asked a smaller set of questions about game player satisfaction with the planned
projects and the process of selecting them.
Although it does appear that greater satisfaction with planned projects is associated with
higher rates of contribution, the first column of Figure 4 shows little evidence that satisfac-
tion with the projects or process was greater in the CDR communities, whether or not one
conditions on the gender treatment.
5.1.2 Trust in leaders
If CDR had the effect of reducing the scope for graft – for example, by rendering leaders more
accountable to citizens – then game players could be more confident that their contributions
would indeed be used for the production of public goods. We find, however, little or no evidence
that the CDR effect is working through such a mechanism. As seen in Figure 3, there is no
relationship between the CDR treatment and the level of trust in community leaders. Further,
consistent with the model’s implication of offsetting effects regarding graft, average trust in
leaders in a community is unrelated to average contributions. In mixed gender groups, we see
no correlation at all; in women-only groups, the relationship is marginally negative.23
The lack of a relationship between the CDR treatment and the trust of game players in
leaders is somewhat in tension with our results from the May/June 2008 follow up survey,
where we found a positive CDR effect (Figure 2). It could be that the effect was transient,
or that the later measure is noisier because game players exaggerated their trust in leaders
out of concern that if they expressed low levels of trust, we might be less likely to provide the
funds. It is also true that our questions in the post-game survey asked about trust in both the
community representatives and “community leaders” rather than just “community leaders.”
Curiously, if we look at how average contributions vary with trust in leaders as measured in
the follow-up survey, we find a strong positive association in the mixed gender groups, but no
association at all (or very slightly negative) in the all-women groups. It is probably not that
men cared about the trustworthiness of leaders while women did not: Using the post-game
survey measure of trust and looking at individual contributions, we find that both men and
women who express greater trust in leaders give significantly more in the game (though it is
23Interestingly, at the individual level (within communities) individuals who express greater trustin leaders contribute much more (not shown), despite there being no relationship at the communitylevel. This ‘micro-macro’ disconnect could arise if leaders favor those connected with them. Then theremay be low levels of trust overall but those that are well connected report relatively high trust andcontribute more.
29
true that men’s giving was somewhat more sensitive to higher levels of trust than women’s).
It is something of a puzzle, then, why greater trust in the women-only CDR communities (as
measured in the follow-up survey) does not translate into higher payouts in these communities
versus the women-only, no CDR communities. At a minimum, this suggests to us that a CDR
effect on trust in leaders is not the primary mechanism behind our results. Either the trust
effect of CDR was very short-lived, or it persisted, but did not lead to higher contributions in
the communities where only women played the public goods game.
5.2 Social Value for the Public Good
There is also little evidence that the effect of CDR worked by increasing the weight individuals
put on benefits to the community. As with private values, social values mechanisms imply an
interaction between CDR treatment and the effect of interest rates, which we do not observe.
There is other evidence against this mechanism as well.
First, note that if the CDR program’s impact worked primarily through an increase in
civic-mindedness in treated communities – or even an impact that was stronger for one gender
than the other – then we would not expect to observe the effect only in the mixed groups, and
for both genders in the mixed groups, contrary to the patterns seen in Figure 3.
Second, a number of our game-player survey questions might be thought to more directly
tap civic mindedness, and also whether there were fewer differences and conflicts among com-
munity members. We asked if the respondent thought that any of the following divisions made
it hard for people in the community to work together: income, gender, religion, ethnicity, ed-
ucation, old versus young, and new migrants versus long-term residents. Even more so than
in the follow-up survey, game players in CDR communities did not report significantly lower
differences on these dimensions.
We also asked if the respondent had voted in the last presidential election, spoken to
the chief or attended a community meeting in the last six months, and was a member of a
credit association, a religious association, or a committee to support community development.
Despite some of these being mechanically related to having had a CDR program – for instance,
CDR programs imply community meetings and possibly more reasons to speak to the chief
– game players in CDR communities were only marginally more likely to respond positively,
with the differences not significant. Nor are there systematic differences when we condition
on gender treatment (mixed versus all women players).
30

5.3 Costs and Benefits of Contributing Per Se
We identified four channels through which CDR may have altered the perceived value of
participation for any level of public good provided.
5.3.1 Income effects
The most obvious channel is that by increasing income, the CDR program produced a decline
in the marginal value of cash. The fact that in general wealthier participants contributed more
(see Fearon, Humphreys, and Weinstein (2009) ) is consistent with this logic. However, we find
little evidence that the CDR program had a positive impact on material well-being, making
it unlikely that higher contributions in the public goods game are the result of an income
effect. Specifically, we use data from the follow-up survey to generate composite indicators for
questions on access to food and livestock, minor household assets, and the quality of household
dwellings. None show any consistent or significant CDR treatment effects, whether or not we
condition on quarter. Further, if contributions increased for this reason, we would expect
greater contributions in both the mixed and all-women communities, which is again not what
we observe.
5.3.2 Fear of sanctioning
Second, many accounts of collective action suggest that a key mechanism through which
communities foster cooperation is by threatening to sanction non-compliers. In principle,
CDR may have increased the ability of communities to sanction – for example by affecting the
flow of information about the actions of community members, or their willingness to do so –
by establishing norms of cooperation. It is also possible that CDR could weaken the capacity
to sanction, for example by weakening traditional authority structures.
We asked game players whether they thought others would find out what they contributed
and whether this concern affected their contribution decision. A perception that others could
learn of one’s decision is a precondition for the sanctioning mechanisms to work (Habyarimana,
Humphreys, Posner, and Weinstein, 2007). Although we went to considerable lengths to
ensure that players would know that only they knew what they put in the envelope, players
nonetheless entertained diverse beliefs about the probability that their actions could become
known. These concerns may have been well founded if, for example, village elites are able to
force public admissions of behavior after the fact. About one in six of our respondents reported
such fears to us. Moreover, these reports are clustered at the community level; village fixed
effects account for about 17% of the variance in responses to this question. The lower panel
31
in Figure 4 suggests that fears of loss of anonymity are associated with higher contributions,
particularly in the mixed gender groups. However as seen in the upper panel, the estimated
effect of CDR on perception of lack of anonymity, though pointing towards a positive impact
in the mixed groups, is not distinguishable from zero. Thus while fear of sanctioning may
matter for contribution rates, we do not see evidence of a CDR effect on these fears.
5.3.3 Social desirability bias
A third way in which CDR may have affected the direct value of contributing (independent of
the public good produced) is through the signal value of contributions to external development
agencies. Communities could have surmised that we were assessing community-spiritedness
and that better performers might be rewarded by future projects. Conceivably, experience
with the CDR program could have made such beliefs more likely, or have increased the value
communities put on good relations with NGOs.
In the follow-up survey, we asked respondents about twelve actions they might take “to try
to change the situation . . . if you had concerns about how things were going in your village.”
Two of the actions offered were “appeal to local NGOs for assistance” and “appeal to the
international community for assistance,” with possible responses being that this would “make
things worse,” “make no difference,” “help a little,” or “help a lot.” We also asked each
respondent to select from the list of actions the ones they thought would be most effective and
second most effective. These questions allow us to create a measure of trust in NGOs and “the
international community.” Our composite index, comprises questions about whether appeals
to national or international NGOs would help and whether this action would be either most
or second-most effective.
The fifth column of Figure 4 shows that there is no significant CDR treatment effect on
this measure. Indeed, in mixed areas, conditioning on quarter, the relationship is negative
and close to significant at the 90% level. If we disaggregate the measures by questions about
NGOs and “the international community” we find that in CDR communities, slightly greater
percentages say they think appeals to NGOs may be helpful and among the most effective ac-
tions, but the differences are not close to significant. For the questions about the international
community, CDR treatment associates with lower trust, though the differences are again in-
significant. Finally, we note that these measures of trust in non-governmental organizations
do not correlate with contribution decisions at the village level.
Thus, experiencing the CDR program did not increase community members’ beliefs that
NGOs or “the international community” would be able to “make things better” if one had
“concerns about how things are going” in one’s village. Since respondents certainly associated
32

our public goods game with NGOs and the international community, this is evidence against
the hypothesis that CDR increased contributions in the game by increasing community mem-
bers’ desire to please, or belief in the efficacy of, foreign NGOs. It should also be noted that
this mechanism cannot account for the existence of a CDR treatment effect in the mixed
gender but not the all women groups.
5.3.4 Participatory Decision Making
A fourth possible channel is that by promoting participation in collective decision making,
CDR raised the value of contributing to joint projects, for any level of public good actually
provided. Three recent studies support a logic of this form. In lab experiments, Dal Bo,
Foster, and Putterman (2010) find that use of democratic procedures independently increased
the effect of a given policy on cooperation in a public goods game (that is, use of elections
themselves increased cooperation, rather than only via the policy chosen). Hamman, Weber,
and Woon (2011) find that electoral delegation to a leader increased contributions despite
moral hazard temptations facing the leader and Baldassarri and Grossman (2011), deploying
lab experiments in rural Uganda, that participation in elections to select third-party enforcers
increased contributions to public goods without direct effects on the characteristics of leaders.
The fifth column in Figure 4 provides evidence broadly supportive of this channel. CDR
has a large positive effect on use of participatory approaches as measured by an index that
includes responses on whether the selection of leaders was by election, the selection of projects
was done by voting, as well as four other questions on popular participation in decision making.
The effect exists, moreover, only for communities in which the game was played by both men
and women; there is no evidence of a CDR effect on more democratic procedures in areas
where the game was played by women alone. Finally, there is a strong correlation between
participatory procedures and meeting participation and contributions at the community level.
The evidence from the first column that participants were not more supportive of projects
(particularly in the mixed areas) suggests that the effect of participation is not due to its
bringing about more desired projects.
We note, however, that while these results are consistent with a legitimacy channel, other
interpretations are also possible, including the possibility that collective meetings indicate
greater mobilization efforts and/or provided a setting for strategy coordination.
5.4 Coordination
Under some conditions, contribution to a public good can take the form of a coordination
dilemma in which some participants want to contribute if and only if others also contribute.
33

This can arise if the benefits to the public good exhibit increasing returns or if individuals
have preferences consistent with ‘strong reciprocity’ (Bowles and Gintis, 2004). Under such
conditions, two communities that are identical with respect to the three families of mechanisms
described above may fare differently depending on their ability to coordinate. There are two
distinct ways in which CDR could affect the logic of coordination. First, it may generate the
kind of preferences that turn public goods problems of this form into a coordination game,
rather than a prisoners’ dilemma. Second, CDR could make coordination on good outcomes
easier (for example by aligning expectations).
Regarding the first possibility, we asked game players what they thought other players
were likely to do; their answers allow us to look at the correlation between their beliefs about
others’ behavior and their own actions. Figure 5 shows the estimated marginal effect of
higher reported beliefs about others’ actions on one’s own contribution decision. The effects
are estimated using ordinary least squares and controlling for village fixed effects, so that
not only are features such as quarter accounted for, but also the ‘truth’ about village level
contributions. Thus the results reflect the effects of having unusually high or unusually low
beliefs about the actions of others. Two patterns stand out. First, in general there is a strong
positive relationship, which is consistent with coordination preferences. Second, the size of the
correlation is similar in treatment and control communities overall, although among women
players, CDR is associated with a higher correlation between one’s own actions and beliefs
about others’ actions (the difference between the effects in treatment and control areas for
women is significant at the 90% level). This might be construed as weak evidence in favor
of the proposition that CDR increased coordination preferences in this subgroup; however, it
does little to explain variation in contributions since as seen in Table 3, the marginal effect of
CDR is not in fact greater for women.
There is more support for the second possibility – that CDR facilitated coordination on
higher contributions in a situation with multiple equilibria. We constructed indicators of each
player’s beliefs about the contributions of other players as well as indicator of the accuracy of
those beliefs. From the final two columns of Figure 4, we see that in CDR areas players do
indeed expect that other players will contribute more. This effect is concentrated entirely in
communities where the game was played by both men and women, although it is weakened
when we account for quarter. Expectations are also associated with actual contributions at
the village level, suggesting that players do have reasonable knowledge regarding the likely
play of their peers on which they could condition their strategy if they wanted to; moreover,
this relationship remains reasonably strong after accounting for quarters.
Thus, on coordination, we find that in communities exposed to CDR, individuals expect
34

others to contribute more (and are more likely to be correct in their expectations). Moreover,
in general, players that expect others to contribute more also contribute more themselves
(Figure 5). The first pattern is stronger in the mixed gender condition but not the second,
suggesting that the game may have had a coordination component in all areas, but CDR
treatment played a role in improving coordination in mixed areas only. While stronger than
other evidence we have surveyed so far, it is important to emphasize that this evidence too is
speculative and that the relationship between expectations and behavior is not identified.
Relation between player's contribution and player's expectation of others' contributions (Non Experimental)
0 30−30 15−15
●
●
0 30−30 15−15
●
●
0 30−30 15−15
●
●
0 30−30 15−15
●
●
0 30−30 15−15
●
●
0 30−30 15−15
●
●
0 30−30 15−15
●
●
0 30−30 15−15
●
●
0 30−30 15−15
Women only
Mixed
All
Treatment (CDR)
Control
Treatment (CDR)
Control
Treatment (CDR)
Control
Men Women All
Figure 5: Regression estimates for player’s beliefs about other’s average contribution (scaled to1 sd in control communities). Dependent variable is player’s contribution in Liberian Dollars.Sample broken into 8 disjoint strata according to gender of respondent, CDR treatment status,and gender treatment status. All estimates account for village-level fixed effects. For variabledefinitions see Table 3.
5.5 Mobilization
We have examined a set of mechanisms through which CDR may have altered behavior in the
public goods game. Broadly, the evidence is negative on the mechanisms by which CDR might
have directly affected community members’ economic and social value of the public good. It
is mixed on mechanisms by which CDR might have affected individuals’ costs and benefits of
contributing per se, with some positive evidence that CDR increased the perceived legitimacy
of the community effort. There is also evidence consistent with CDR improving communities’
ability to coordinate expectations about how to play the game.
Any of these mechanisms could have been affected directly by CDR or indirectly through
mobilization efforts in the week between our first visit and the play of the game.
CDR could have increased the capacity for collective action by giving communities and
35
their leaders experience with a similar problem. As in the CDR program, communities were
being asked to select a project, choose a set of representatives, and, if they wished, to mobilize
community members to contribute to a public good (recall that the CDR program involved
community contributions of labor). In principle, the CDR experience might have created or
added to a cadre of leaders with experience organizing and mobilizing community participa-
tion, and so better able or more likely to coordinate to spread to information about the game
to all potential players.
To assess whether CDR improved collective action capacity by strengthening the ability
of communities to mobilize cooperation, we asked the game players questions about whether
community meetings had been held to select community representatives and to choose the
projects, about their personal attendance and overall attendance at these meetings, and about
whether they had personally been contacted and urged to stay home on game day, to contribute
if asked to play, or given information about the projects and the game. We also asked a range
of questions that tapped their knowledge of the exercise: Had they heard of the planned
project selected by the community? If meetings were held, did they know who organized them
and how many people attended? Did they know the names of the community representatives
and what projects were chosen? In the chief and community representative surveys, we asked
leaders whether they had organized community meetings about the game and projects, and
whether they had contacted individuals about staying home and how they should play the
game.
Figure 6 summarizes the results regarding the impact of CDR on these measures of mo-
bilization activity and game-player knowledge. In communities where both men and women
were selected to play the game, CDR treatment is associated with significantly greater reports
of community meetings, game-player knowledge, game-player reports of contact by elites, and
elites’ reports of contact with potential players. Among the three sets of respondents, CDR
impact on the community representative reports of contact effort are positive but not statis-
tically significant. For the game player reports, these effects in the mixed groups weaken in
terms of statistical significance when we block on quarter status, though the estimated ATEs
remain positive and non-trivial in substantive terms. Elite reports on contact activity remain
strong and significantly positive even when controlling for quarter.
By contrast, in communities where only women participated in the game, there is no
evidence that exposure to CDR is associated with more community meetings, game player
knowledge, or contact efforts. Thus, we have a mechanism that mirrors the pattern observed
with contributions: A positive impact of CDR in mixed gender groups, and zero effect in the
communities where only women could play the game.
36
These same patterns hold at the individual level, when we compare women in the mixed
groups to women in the all women groups on their responses to the questions about community
meetings, knowledge of the game and projects, and contact experience. We find generally
strong positive effects of CDR treatment on women in the mixed groups, but no effects at
all for women in the all women groups (including controlling for quarter). CDR is associated
with evidence of significantly greater mobilization efforts of women (and men) in communities
where both genders had to play the game, but not for women in the all women groups.
Mobilization effects can also be observed in the choice of leadership. Recall that commu-
nities were asked to select a set of representatives to receive and manage the funds for the
public goods project.
The final columns in Figure 6 shows the effect of CDR on survey responses to questions
about the prior leadership activity of these community representatives. According to the game
players, the CDR treatment is associated with significantly more experienced representatives
where the game was played by a mixed gender group, but no significant difference in experience
where only women were permitted to play the game.24 The differences may in part stem from
the use communities made of structures put in place by the CDR program. We asked the
community representatives directly “were you a member of a donor-sponsored community
development council?” Since the CDR program created CDCs, we might expect to find a
positive effect and indeed we do: about 68% say Yes in the CDR communities, versus 46%
in the control communities, a strongly significant difference that remains just as large and
statistically significant when we condition on quarter. However, when we distinguish between
mixed and all women groups, we find that the effect is larger in mixed, while smaller and
statistically insignificant (though positive) in the all women groups (final column, Table 6.
Finally, we also see from the lower panel that more “mobilized” communities give more in
the public goods game; this is true both for the mixed gender and all women groups suggesting
that mobilization may matter everywhere, even if the CDR program only affected the extent
of mobilization in communities where both men and women played the game.
24Similar patterns hold if we examine the representatives’ own accounts of leadership experience,but not if we use reports by the chiefs. The pattern is not explained by the gender composition ofcommunity representatives. The all women groups did have a somewhat higher frequency of women ascommunity representatives (59% versus 48% in the mixed groups), but the pattern persists when wecondition on gender of the representatives.
37
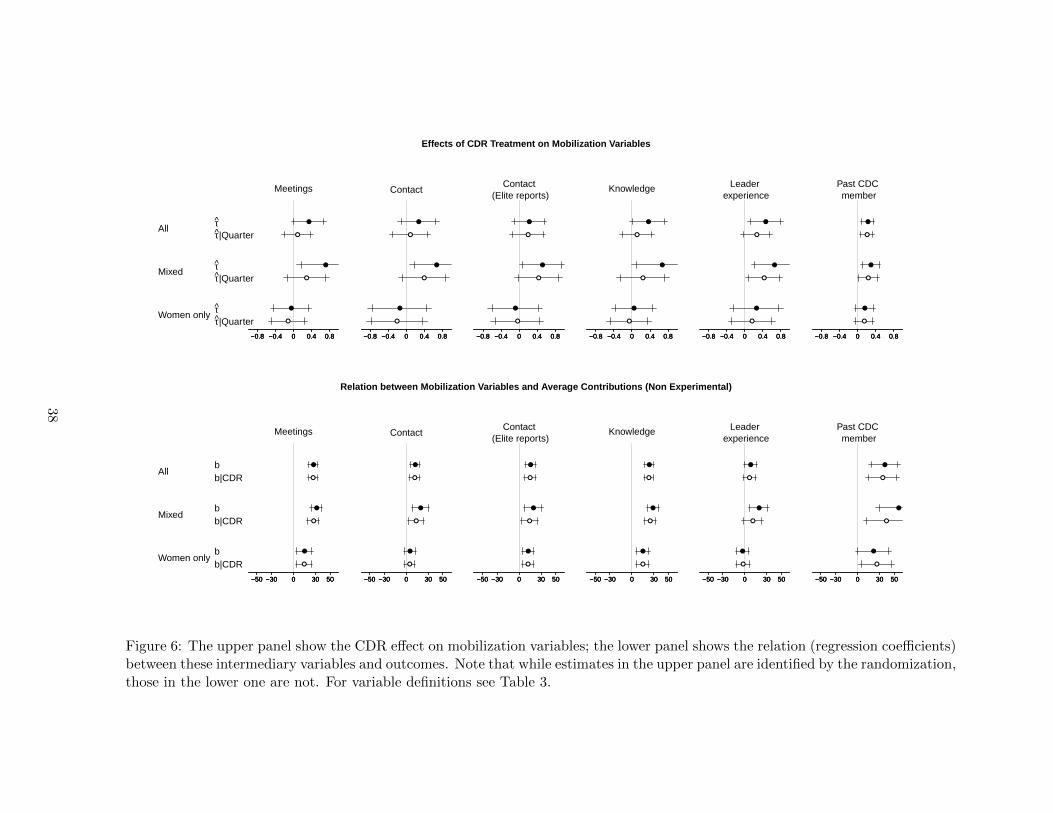
Effects of CDR Treatment on Mobilization Variables
●
●
0 0.4−0.4 0.8−0.8
●
●
0 0.4−0.4 0.8−0.8
●
●
0 0.4−0.4 0.8−0.8
●
●
0 0.4−0.4 0.8−0.8
●
●
0 0.4−0.4 0.8−0.8
●
●
0 0.4−0.4 0.8−0.8
●
●
0 0.4−0.4 0.8−0.8
●
●
0 0.4−0.4 0.8−0.8
●
●
0 0.4−0.4 0.8−0.8
●
●
0 0.4−0.4 0.8−0.8
●
●
0 0.4−0.4 0.8−0.8
●
●
0 0.4−0.4 0.8−0.8
●
●
0 0.4−0.4 0.8−0.8
●
●
0 0.4−0.4 0.8−0.8
●
●
0 0.4−0.4 0.8−0.8
●
●
0 0.4−0.4 0.8−0.8
●
●
0 0.4−0.4 0.8−0.8
●
●
0 0.4−0.4 0.8−0.8
Women only
Mixed
All
ττ|Quarter
ττ|Quarter
ττ|Quarter
Meetings ContactContact
(Elite reports)Knowledge Leader
experiencePast CDC member
Relation between Mobilization Variables and Average Contributions (Non Experimental)
●
●
0 50−50 30−30
●
●
0 50−50 30−30
●
●
0 50−50 30−30
●
●
0 50−50 30−30
●
●
0 50−50 30−30
●
●
0 50−50 30−30
●
●
0 50−50 30−30
●
●
0 50−50 30−30
●
●
0 50−50 30−30
●
●
0 50−50 30−30
●
●
0 50−50 30−30
●
●
0 50−50 30−30
●
●
0 50−50 30−30
●
●
0 50−50 30−30
●
●
0 50−50 30−30
●
●
0 50−50 30−30
●
●
0 50−50 30−30
●
●
0 50−50 30−30
Women only
Mixed
All
bb|CDR
bb|CDR
bb|CDR
Meetings ContactContact
(Elite reports)Knowledge Leader
experiencePast CDC member
Figure 6: The upper panel show the CDR effect on mobilization variables; the lower panel shows the relation (regression coefficients)between these intermediary variables and outcomes. Note that while estimates in the upper panel are identified by the randomization,those in the lower one are not. For variable definitions see Table 3.
38

Differences between Women only and Mixed areas among CDR communities on Mobilization Variables
●
●
0 0.7−0.7 0.35−0.35
●
●
0 0.7−0.7 0.35−0.35
●
●
0 0.7−0.7 0.35−0.35
●
●
0 0.7−0.7 0.35−0.35
●
●
0 0.7−0.7 0.35−0.35
●
●
0 0.7−0.7 0.35−0.35
Past CDC member
Leader experience
Knowledge
Contact (Elite reports)
Contact
Meetings
ττ|Quarter
ττ|Quarter
ττ|Quarter
ττ|Quarter
ττ|Quarter
ττ|Quarter
Figure 7: Comparison of intermediary outcomes between women-only and mixed gender CDRareas for mobilization measures. For variable definitions see Table 3.
6 Why Did CDR Increase Contributions in Mixed Groups
Only?
The evidence on the impact of the CDR program is striking, but the results suggest het-
erogeneous effects. Exposure to CDR increased collective action capacity as measured by a
public goods game, but only in those communities where 12 men and 12 women were ran-
domly selected to play the game. In those communities where the behavioral game involved
only women, there is no evidence that the CDR program had an impact on the ability of
communities to solve collective action problems. Likewise, there is a powerful effect of having
only women play the public goods game, but one that depends on CDR treatment status.
Contributions are higher in women-only groups, but only in communities that did not receive
the CDR program.
Examination of Figures 4 and 6 suggest that key ‘second-stage’ relationships work simi-
larly in communities, regardless of the gender composition of game players. For example, the
relationship between most measures of mobilization and contributions is similar across areas,
and the relationship between expectations (and accuracy of expectations) and contributions
39
is also similar. However, in the first stage where we examine the impact of CDR on interme-
diary variables, communities exhibit different patterns of behavior depending on the gender
composition of game players. The CDR program is powerfully associated with patterns of
mobilization in areas where both men and women played the game, but has no impact on
mobilization where only women had to make contribution decisions (Figure 6, upper panel).
Similarly, exposure to CDR is related to measures of the expected contribution and accuracy
of prediction in mixed gender areas but not in women-only areas.
The results on mobilization, in particular, plausibly account for higher contribution levels
in CDR-treated communities, where both men and women played the game. CDR increased
mobilization in mixed areas but not in women only areas. This does not mean however that as
a result of CDR there were greater mobilization efforts in the mixed gender CDR areas than in
the women only CDR areas. As shown in Figure 7, conditional on CDR, levels of mobilization
do not differ systematically depending on the gender composition of game players. Among
communities that received the CDR treatment, local leaders invested in mobilization activities
at about the same level, regardless of who was expected to participate in the game.
A possible explanation for the difference is that communities drew on different people
and networks for mobilization in the mixed versus the women-only communities. Where
communities understood that a random sample of community members would participate in
the game, their task was to generate high levels of contribution from both men and women in
order to maximize the funds available for a community project. In women-only areas, leaders
knew that the funds available to the community would depend only on the actions of a random
sample of women. Thus, the impact of the CDR program may have been to develop mixed-
gender structures (CDCs) and prior experience with community-wide mobilization that were
relevant for solving the collective action problem presented to mixed gender groups. However,
where only women were involved in the public goods game, alternative networks – including
well-established women’s organizations, such as secret societies – could be used to generate
high levels of contribution. In these cases, the structures and experiences generated by CDR
simply may not have been relevant given the nature of the collective action problem they
confronted.
What little evidence we have that bears directly on this hypothesis is mixed. We asked
the community representatives both if they had been a leader of a “woman’s action group”
and if they had previously been a chief, which in the case of female community representatives
would most likely have been “lady chief.”25 On the one hand, in the all women groups, female
community representatives are twice as likely to report having been a lady chief – 19% versus
25In general, women do not serve as chiefs of communities, but all these communities have otherformal positions, including “lady chief.”
40

8% in the mixed groups (p = .13). But the difference goes the other way for female community
representatives who said they were leaders of a “woman’s action group” (38% in all women
versus 60% in mixed, p = .03).
So while the data suggests that alternative organizational structures were employed to
mobilize cooperation in communities exposed to different gender composition treatments, we
have not identified what these structures are.
7 Conclusions
A field experiment in which villages in northern Liberia were randomly assigned to receive
international development assistance provides evidence that the introduction of new local-
level democratic institutions can alter patterns of social cooperation in a way that persists
after the program’s conclusion. Villages exposed to the development program exhibit higher
subsequent levels of social cooperation than those in the control group, as measured through
a series of survey based indicators and in behavior in a community-wide public goods game.
The estimated effect in the public goods game is of a similar magnitude to the effect of
a quadrupling of interest rates. These results suggest that changes in community capacity
for collective action can take place over a short period of time; can be the product of outside
intervention; and can develop without fundamental changes either to the structure of economic
relations or to more macro-level political processes. Random assignment of communities to
treatment provides confidence in the causal nature of the relationship and the use of behavioral
outcome measures reinforces our sense that the effects are real.
Unexpectedly, however, we found strong heterogeneity in the measured effect of the CDR
program. For collective action problems that were to be solved by mixed gender groups, we
found CDR very large effects; for problems to be solved by women only groups, the estimated
effects were zero or negative.
Understanding the mechanism(s) underlying this relationship is more difficult and our re-
sults are more speculative. Nevertheless, they suggest that the effect of the introduction of
elected community development councils does not stem from them increasing public satisfac-
tion with the projects chosen or greater trust that leaders will not abscond with community
finances. Nor is there evidence that CDR increased the weight that community members put
on community welfare. The evidence also does not support the possibility that CDR reduced
the perceived costs or benefits of contributing either by raising the prospects of sanctioning
for failure to contribute, by increasing the expected gains from signaling community cohe-
sion to NGOs, or by reducing the marginal utility of income. There is some evidence that
the CDR program resulted in greater use of electoral and participatory processes for project
41
selection and it is possible that, even though the content of the projects seemed unaffected
by this, increased legitimacy surrounding the community projects increased the benefits from
contributing. There is also evidence that coordination dynamics were at work — individuals
in (mixed gender) treated areas were more likely to know how others would play and correctly
expected higher contributions. Moreover, individuals who thought others would contribute
highly contributed more themselves.
We also find relatively strong evidence that experiencing the CDR program strength-
ened community mobilization capacity which suggests that the effect of CDR worked through
greater mobilization efforts. In the mixed-gender communities, CDR areas in general had lead-
ers with greater experience who ran more meetings, communicated more with village members,
and imparted greater understanding of the process. All of these features are associated with
greater levels of contributions. They are all features, moreover, that may have provided a
level of common knowledge that could facilitate the operation of the coordination dynamics
described above.
In sum, the explanation that we think makes the best sense of the data is a simple one.
Communities saw the collective action problem as a kind of coordination problem and the
CDR program provided experience in organization that helped them to solve it. The problem
we gave communities was similar in some basic respects to that faced by the communities that
had gone through the CDR program. Where communities knew that both men and women
could be selected to play the game, prior CDR treatment was associated with greater and
more effective mobilization by more experienced leaders. This suggests that prior experience
with organizing for cooperative tasks through deliberately mixed-gender CDC committees and
community-wide processes may have created human resources that could be drawn upon to
resolve coordination dilemmas, at least for mixed gender groups.
Under this interpretation, the finding of sharply different CDR treatment effects in the
mixed versus women-only groups has important implications for understanding when CDR
programs are effective. When we introduced the gender variation to the behavioral games, we
conceived of it as a cross-cutting manipulation distinct from the CDR treatment. However, it
can also be thought of as providing two ways of measuring the impact of the CDR program.
In effect, we have one measurement of the effect of the CDR program on collective action
problems facing mixed gender groups, and one for problems facing women-only groups. We
found evidence that CDR improves collective action capacity for the former but not the latter.
Although this finding emerged as an artifact of design variations in our behavioral game,
it may have broader significance, including for donor agencies. It highlights that what might
matter is not how decisions are being made, but who is making them—a feature that we did
42
not allow communities to determine for themselves when we took our measurements. Insofar
as collective action problems need to be addressed by broad cross sections of a community, the
exposure to inclusive decision making of the form promoted by external actors may have large
effects. However existing structures of authority are often organized around single-gender or
other more narrowly constituted groups. Our results suggest that effects may be much more
modest, or absent, if these structures are deployed when groups face collective action problems.
References
Acemoglu, D., S. Johnson, and J. A. Robinson (2001): “The Colonial Origins of Com-
parative Development: An Empirical Investigation,” American Economic Review, 91(5),
1369–1401.
Baldassarri, D., and G. Grossman (2011): “Centralized sanctioning and legitimate au-
thority promote cooperation in humans,” Proceedings of the National Academy of Sciences,
108(27), 11023–11027.
Barron, P., M. Humphreys, L. Paler, and J. Weinstein (2009): “Community based
Reintegration in Aceh,” Indonesian Social Development Papers.
Beath, A., F. Christia, and R. Enikolopov (2009): “Elite Capture of Local Institutions:
Evidence from a Field Experiment in Afghanistan,” Unpublished ms., Harvard University,
MIT.
Bjorkman, M., and J. Svensson (2009): “Power to the People: Evidence from a Random-
ized Field Experiment on Community-Based Monitoring in Uganda,” Quarterly Journal of
Economics, 124(2), 735–69.
Bowles, S., and H. Gintis (2004): “The evolution of strong reciprocity: cooperation in
heterogeneous populations,” Theoretical Population Biology, 65(1), 17–28.
Casey, K., R. Glennerster, and E. Miguel (2011): “Reshaping Institutions: Evidence
on External Aid and Local Collective Action,” Draft, 26 April 2011; Brown University,
JPAL, and U.C. Berkeley.
Chong, A., A. L. De La O, D. Karlan, and L. Wantchekon (2010): “Information
Dissemination and Local Governments Electoral Returns,Evidence from a Field Experiment
in Mexico,” Unpublished ms., Yale University.
43

Dal Bo, P., A. Foster, and L. Putterman (2010): “Institutions and Behavior: Ex-
perimental Evidence on the Effects of Democracy,” American Economic Review, 100(5),
2205–2229.
Fearon, J. D., M. Humphreys, and J. M. Weinstein (2009): “Development Assistance,
Institution Building, and Social Cohesion after Civil War: Evidence from a Field Experiment
in Liberia,” Unpublished manuscript.
Ferraz, C., and F. Finan (2008): “Exposing Corrupt Politicians: The Effects of Brazil’s
Publicly Released Audits on Electoral Outcomes,” Quarterly Journal of Economics, 123(2),
703–45.
Freedman, D. A. (2008): “On Regression Adjustments to Experiments with Several Treat-
ments,” Annals of Applied Statistics, 2, 176–96.
Green, D. P., S. E. Ha, and J. G. Bullock (2010): “Enough Already about Black
Box Experiments: Studying Mediation Is More Difficult than Most Scholars Suppose,” The
ANNALS of the American Academy of Political and Social Science, 628(1), 200–208.
Habyarimana, J., M. Humphreys, D. Posner, and J. Weinstein (2007): “Why Does
Ethnic Diversity Undermine Public Goods Provision?,” American Political Science Review,
101(4), 709–725.
Hamman, J., R. A. Weber, and J. Woon (2011): “An Experimental Investigation of
Electoral Delegation and the Provision of Public Goods,” American Journal of Political
Science, forthcoming.
Imai, K., L. Keele, and D. Tingley (2010): “A General Approach to Causal Mediation
Analysis,” Psychological Methods, 15, 309–334.
Kling, J. R., J. B. Liebman, and L. F. Katz (2007): “Experimental Analysis of Neigh-
borhood Effects,” Econometrica, 75(1), 83–119.
Ledyard, J. O. (1995): “Public Goods: A Survey of Experimental Research,” in The Hand-
book of Experimental Economics, ed. by J. H. Kagel, and A. E. Roth, pp. 111–94. Princeton
University Press, Princeton, NJ.
Mutz, D., and R. Pemantle (2011): “The Perils of Randomization Checks in the Analysis
of Experiments,” Draft, 2011; U Penn.
Olken, B. I. (2009): “Direct Democracy and Local Public Goods: Evidence from a Field
Experiment in Indonesia,” Unpublished ms., MIT.
44

Pande, R. (2011): “Can Informed Voters Enforce Better Governance? Experiments in Low
Income Democracies,” Annual Review of Economics, forthcoming.
Richards, P. (2005): “Community Cohesion in Liberia,” Social Development Paper, 21.
45
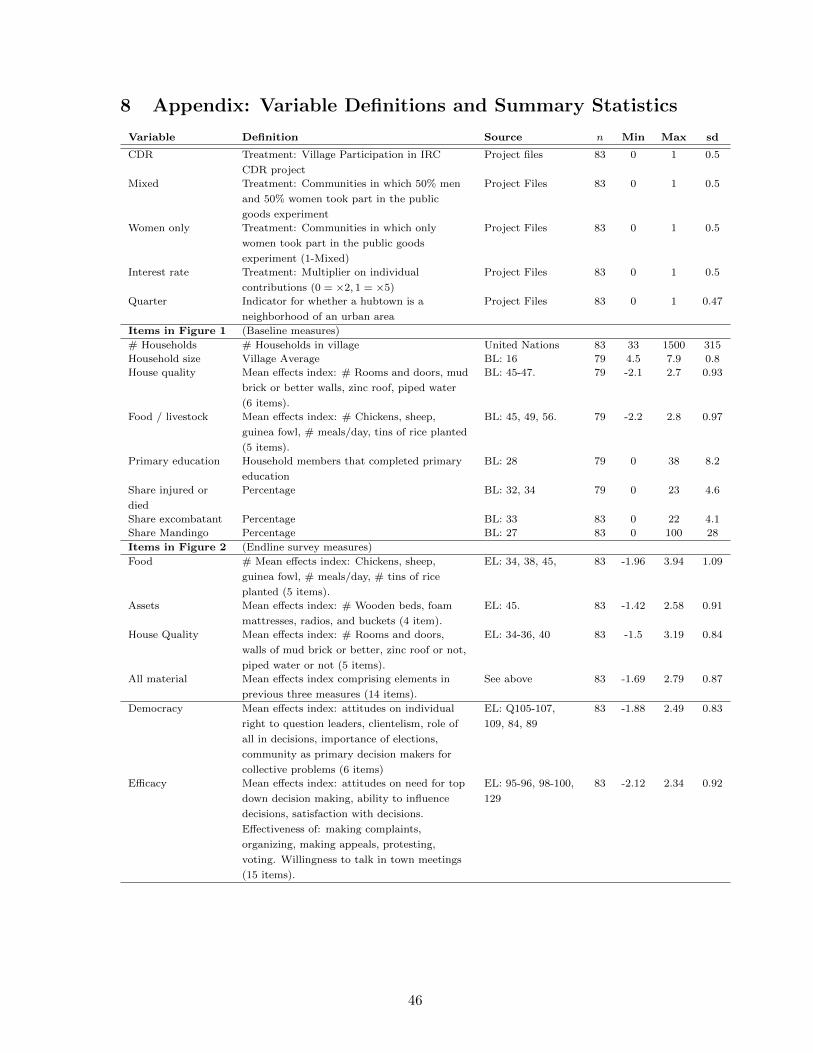
8 Appendix: Variable Definitions and Summary Statistics
Variable Definition Source n Min Max sd
CDR Treatment: Village Participation in IRC
CDR project
Project files 83 0 1 0.5
Mixed Treatment: Communities in which 50% men
and 50% women took part in the public
goods experiment
Project Files 83 0 1 0.5
Women only Treatment: Communities in which only
women took part in the public goods
experiment (1-Mixed)
Project Files 83 0 1 0.5
Interest rate Treatment: Multiplier on individual
contributions (0 = ×2, 1 = ×5)
Project Files 83 0 1 0.5
Quarter Indicator for whether a hubtown is a
neighborhood of an urban area
Project Files 83 0 1 0.47
Items in Figure 1 (Baseline measures)
# Households # Households in village United Nations 83 33 1500 315
Household size Village Average BL: 16 79 4.5 7.9 0.8
House quality Mean effects index: # Rooms and doors, mud
brick or better walls, zinc roof, piped water
(6 items).
BL: 45-47. 79 -2.1 2.7 0.93
Food / livestock Mean effects index: # Chickens, sheep,
guinea fowl, # meals/day, tins of rice planted
(5 items).
BL: 45, 49, 56. 79 -2.2 2.8 0.97
Primary education Household members that completed primary
education
BL: 28 79 0 38 8.2
Share injured or
died
Percentage BL: 32, 34 79 0 23 4.6
Share excombatant Percentage BL: 33 83 0 22 4.1
Share Mandingo Percentage BL: 27 83 0 100 28
Items in Figure 2 (Endline survey measures)
Food # Mean effects index: Chickens, sheep,
guinea fowl, # meals/day, # tins of rice
planted (5 items).
EL: 34, 38, 45, 83 -1.96 3.94 1.09
Assets Mean effects index: # Wooden beds, foam
mattresses, radios, and buckets (4 item).
EL: 45. 83 -1.42 2.58 0.91
House Quality Mean effects index: # Rooms and doors,
walls of mud brick or better, zinc roof or not,
piped water or not (5 items).
EL: 34-36, 40 83 -1.5 3.19 0.84
All material Mean effects index comprising elements in
previous three measures (14 items).
See above 83 -1.69 2.79 0.87
Democracy Mean effects index: attitudes on individual
right to question leaders, clientelism, role of
all in decisions, importance of elections,
community as primary decision makers for
collective problems (6 items)
EL: Q105-107,
109, 84, 89
83 -1.88 2.49 0.83
Efficacy Mean effects index: attitudes on need for top
down decision making, ability to influence
decisions, satisfaction with decisions.
Effectiveness of: making complaints,
organizing, making appeals, protesting,
voting. Willingness to talk in town meetings
(15 items).
EL: 95-96, 98-100,
129
83 -2.12 2.34 0.92
46
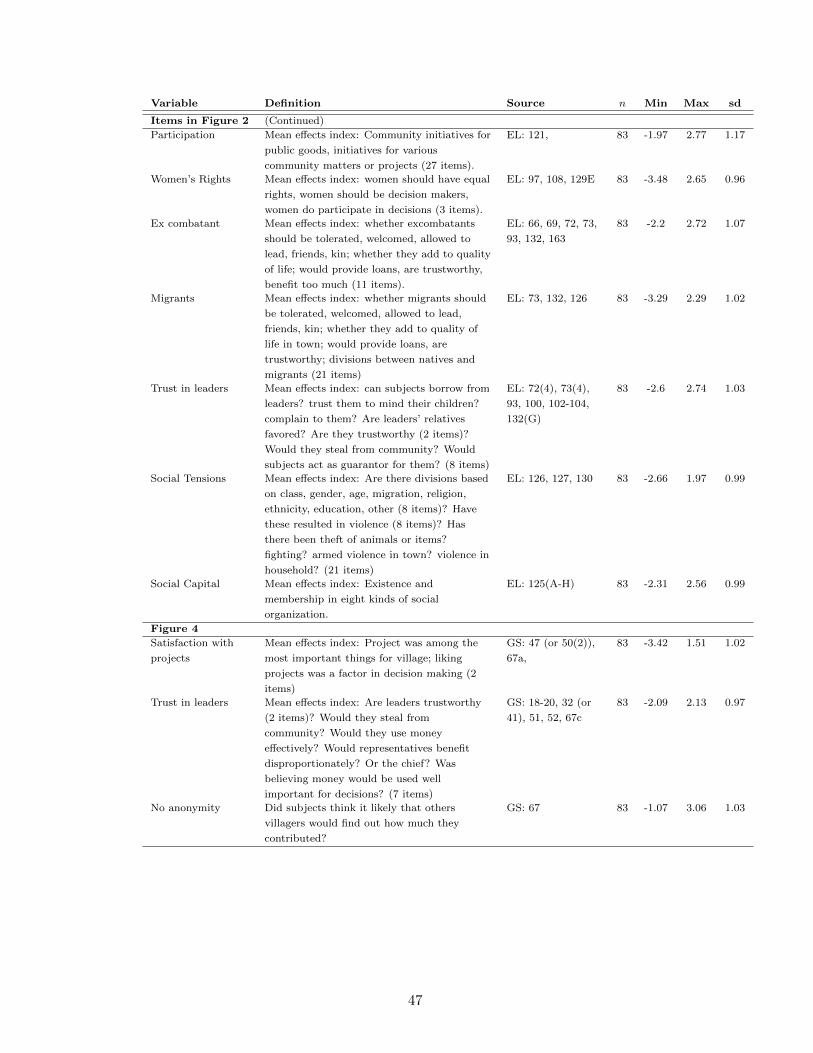
Variable Definition Source n Min Max sd
Items in Figure 2 (Continued)
Participation Mean effects index: Community initiatives for
public goods, initiatives for various
community matters or projects (27 items).
EL: 121, 83 -1.97 2.77 1.17
Women’s Rights Mean effects index: women should have equal
rights, women should be decision makers,
women do participate in decisions (3 items).
EL: 97, 108, 129E 83 -3.48 2.65 0.96
Ex combatant Mean effects index: whether excombatants
should be tolerated, welcomed, allowed to
lead, friends, kin; whether they add to quality
of life; would provide loans, are trustworthy,
benefit too much (11 items).
EL: 66, 69, 72, 73,
93, 132, 163
83 -2.2 2.72 1.07
Migrants Mean effects index: whether migrants should
be tolerated, welcomed, allowed to lead,
friends, kin; whether they add to quality of
life in town; would provide loans, are
trustworthy; divisions between natives and
migrants (21 items)
EL: 73, 132, 126 83 -3.29 2.29 1.02
Trust in leaders Mean effects index: can subjects borrow from
leaders? trust them to mind their children?
complain to them? Are leaders’ relatives
favored? Are they trustworthy (2 items)?
Would they steal from community? Would
subjects act as guarantor for them? (8 items)
EL: 72(4), 73(4),
93, 100, 102-104,
132(G)
83 -2.6 2.74 1.03
Social Tensions Mean effects index: Are there divisions based
on class, gender, age, migration, religion,
ethnicity, education, other (8 items)? Have
these resulted in violence (8 items)? Has
there been theft of animals or items?
fighting? armed violence in town? violence in
household? (21 items)
EL: 126, 127, 130 83 -2.66 1.97 0.99
Social Capital Mean effects index: Existence and
membership in eight kinds of social
organization.
EL: 125(A-H) 83 -2.31 2.56 0.99
Figure 4
Satisfaction with
projects
Mean effects index: Project was among the
most important things for village; liking
projects was a factor in decision making (2
items)
GS: 47 (or 50(2)),
67a,
83 -3.42 1.51 1.02
Trust in leaders Mean effects index: Are leaders trustworthy
(2 items)? Would they steal from
community? Would they use money
effectively? Would representatives benefit
disproportionately? Or the chief? Was
believing money would be used well
important for decisions? (7 items)
GS: 18-20, 32 (or
41), 51, 52, 67c
83 -2.09 2.13 0.97
No anonymity Did subjects think it likely that others
villagers would find out how much they
contributed?
GS: 67 83 -1.07 3.06 1.03
47

Variable Definition Source n Min Max sd
Figure 4 ContinuedSocial Desirability Mean effects index: Index on whether
individuals would appeal first to local orinternational community for assistance?likely effectiveness of the appeal? (4 items)
EL: 100 83 -2.54 2.12 0.87
Participation Index Mean effects index: were there communitymeetings to discuss game? who organizedthem? were community representativeselected? were meetings public? was therecompetition for positions? did some say thatthey preferred different representatives? areCommunity Representatives relatives of thechief? was the process of selecting projectsconsidered important for decisions? (8 items)
GS: 25, 27, 33-36,37 (or 39), 67b
83 -2.17 2.28 0.97
Expectations Mean effects index: Of the other players, howmany contributed all? how many nothing?what did most do?
GS: 58–59 83 -3.5 1.32 0.88
Accuracy ofexpectations
Mean effects index: Squared deviationbetween expected and actual numbercontributing 300, squared deviation betweenexpected and actual number contributingnothing.
GS: 58–59 83 -2.97 1.43 0.89
Figure 6Meetings Mean effects index: Existence and
participation in community meetings (5items)
GS: 24–26, 28, 54 83 -1.98 1.99 0.89
Contact Mean effects index: Were game playerscontacted about the game, or the project?were they asked to stay home? urged tocontribute?
GS: 55, 56, 57, 66 82 -0.8 1.4 0.5
Contact (EliteReports)
Mean effects index: Did elites contactpopulation to discuss the game to discuss theproject? Encourage people to spread theword? did they tell them to stay home? urgethem to contribute? (3 items)
CR: 64(1), 65, 66,67
83 -2.22 1.33 0.93
Knowledge Mean effects index: Do players know whatthe project is? do they know who organizedthe meetings? how many attended? who thecommunity representatives are? what theprojects are? (5 items)
GS: 22, 27-9, 42 83 -1.72 2.46 0.98
Leader Experience Mean effects index: Have communityrepresentatives played a leadership role in thecommunity before?(2 items)
GS: 31, 40 83 1.61 5.52 0.89
Past CDC member What share of community reps were formerCDC leaders?
CR: 34 75 0 1 0.37
Table 3: Table of Variables used in text. Baseline survey (BL) (http://tinyurl.com/fhw2011hhbls), Endline survey (EL) (http://tinyurl.com/fhw2011hhel ), Postgame sur-vey (GS) (http://tinyurl.com/fhw2011gs), Community representative (CR) survey (http://tinyurl.com/fhw2011cr), Chief Game survey (CG) (http://tinyurl.com/fhw2011cg)
48