
DEMANDS FOR LOCAL AND ORGANIC PRODUCE: A BRIEF REVIEW … · DEMANDS FOR LOCAL AND ORGANIC PRODUCE:...
58
Institute for Public Policy and Business Research University of Kansas 607 Blake Hall Lawrence, Kansas 66045 DEMANDS FOR LOCAL AND ORGANIC PRODUCE: A BRIEF REVIEW OF THE LITERATURE Prepared by Brian Harris, Research Economist with David Burress, Research Economist Sharon Eicher, Graduate Research Assistant A Report of the Kaw Valley Project for Environmentally Identified Products David Burress, Research Economist Principal Investigator and Series Editor Steven Maynard-Moody Director, IPPBR April, 2000 Report No. 254A
-
Upload
truongcong -
Category
Documents
-
view
222 -
download
2
Transcript of DEMANDS FOR LOCAL AND ORGANIC PRODUCE: A BRIEF REVIEW … · DEMANDS FOR LOCAL AND ORGANIC PRODUCE:...

Institute for Public Policy and Business ResearchUniversity of Kansas
607 Blake HallLawrence, Kansas 66045
DEMANDS FOR LOCAL AND ORGANIC PRODUCE:A BRIEF REVIEW OF THE LITERATURE
Prepared by
Brian Harris, Research Economist
with
David Burress, Research EconomistSharon Eicher, Graduate Research Assistant
A Report of the Kaw Valley Project for Environmentally Identified Products
David Burress, Research EconomistPrincipal Investigator and Series Editor
Steven Maynard-MoodyDirector, IPPBR
April, 2000 Report No. 254A

EIP Review Institute for Public Policy and Business Research Page 1
ABSTRACT
Environmentally Identified Products ( EIPs) refers to food products that are described as organicor sustainable, or were grown using Integrated Pest Management (IPM), or in other respects areviewed as having a relatively less negative impact on the environment than directly competingproducts. This paper reviews articles investigating the characteristics and preferences of consumersof, and demand for, EIPs in the US. Findings are reported on demographic variables, psychographicvariables, willingness to pay, and consumer behavior, both for EIP consumers and non-EIPconsumers. Many of the variables such as income and family size that are usually important fordetermining food demands, do not appear important in determining demand for EIPs. Moreover, thenature of the variables that actually do determine demands for EIPs are poorly understood. Very littleresearch has been done on demands for locally-grown produce. Consumers generally have a favorableattitude towards organic produce, and information and availability are the most important barriers toconsumption.

EIP Review Institute for Public Policy and Business Research Page 2
TABLE OF CONTENTS
Abstract . . . . . . . . . . . . . . . . . . . . . . . . . . . . . . . . . . . . . . . . . . . . . . . . . . . . . . . . . . . . . . . . . . . . . . . . . . . . . . . 1
List of Tables . . . . . . . . . . . . . . . . . . . . . . . . . . . . . . . . . . . . . . . . . . . . . . . . . . . . . . . . . . . . . . . . . . . . . . . . . . 3
Acknowledgments . . . . . . . . . . . . . . . . . . . . . . . . . . . . . . . . . . . . . . . . . . . . . . . . . . . . . . . . . . . . . . . . . . . . . . . 4
Executive Summary . . . . . . . . . . . . . . . . . . . . . . . . . . . . . . . . . . . . . . . . . . . . . . . . . . . . . . . . . . . . . . . . . . . . . 5
Chapter 1: Introduction . . . . . . . . . . . . . . . . . . . . . . . . . . . . . . . . . . . . . . . . . . . . . . . . . . . . . . . . . . . . . . . . . . 7
Chapter 2: Conventional Economic Variables . . . . . . . . . . . . . . . . . . . . . . . . . . . . . . . . . . . . . . . . . . . . . . . 8
Chapter 3: Sensory Variables . . . . . . . . . . . . . . . . . . . . . . . . . . . . . . . . . . . . . . . . . . . . . . . . . . . . . . . . . . . 12
Chapter 4: Demographic Variables . . . . . . . . . . . . . . . . . . . . . . . . . . . . . . . . . . . . . . . . . . . . . . . . . . . . . . . 15
Chapter 5: Psychographic Variables . . . . . . . . . . . . . . . . . . . . . . . . . . . . . . . . . . . . . . . . . . . . . . . . . . . . . . 18
Chapter 6: Behavioral Correlates of EIP Consumers . . . . . . . . . . . . . . . . . . . . . . . . . . . . . . . . . . . . . . . . 21
Chapter 7: Marketing and Consumption Barriers . . . . . . . . . . . . . . . . . . . . . . . . . . . . . . . . . . . . . . . . . . 23
Chapter 8: Conclusion . . . . . . . . . . . . . . . . . . . . . . . . . . . . . . . . . . . . . . . . . . . . . . . . . . . . . . . . . . . . . . . . . 25
Appendix 1: Summary of Findings . . . . . . . . . . . . . . . . . . . . . . . . . . . . . . . . . . . . . . . . . . . . . . . . . . . . . . . . 27
Appendix 2: Notes on Reviewed Studies . . . . . . . . . . . . . . . . . . . . . . . . . . . . . . . . . . . . . . . . . . . . . . . . . . . 44
References . . . . . . . . . . . . . . . . . . . . . . . . . . . . . . . . . . . . . . . . . . . . . . . . . . . . . . . . . . . . . . . . . . . . . . . . . . . . 52
Index . . . . . . . . . . . . . . . . . . . . . . . . . . . . . . . . . . . . . . . . . . . . . . . . . . . . . . . . . . . . . . . . . . . . . . . . . . . . . . . . 55

EIP Review Institute for Public Policy and Business Research Page 3
LIST OF TABLES
Table 1.1: Demographic Variables . . . . . . . . . . . . . . . . . . . . . . . . . . . . . . . . . . . . . . . . . . . . . . . . . . . . . . . . 27
Table 1.2: Psychographic Variables . . . . . . . . . . . . . . . . . . . . . . . . . . . . . . . . . . . . . . . . . . . . . . . . . . . . . . . 31
Table 1.3: Behavioral Variables . . . . . . . . . . . . . . . . . . . . . . . . . . . . . . . . . . . . . . . . . . . . . . . . . . . . . . . . . . 34
Table 1.4: Consumer Attitudes Toward Organic produce . . . . . . . . . . . . . . . . . . . . . . . . . . . . . . . . . . . . . 35
Table 1.5: Price and Price-Related Characteristics . . . . . . . . . . . . . . . . . . . . . . . . . . . . . . . . . . . . . . . . . . 39
Table 1.6: Other Factors Influencing the Purchase of EIPs . . . . . . . . . . . . . . . . . . . . . . . . . . . . . . . . . . . . 42

EIP Review Institute for Public Policy and Business Research Page 4
ACKNOWLEDGMENTS
This research was funded by the Fund For Rural America program of the US Department ofAgriculture and by the Institute for Public Policy and Business Research at the University of Kansas(IPPBR). The lead author of this report was Brian Harris, a Research Economist at IPPBR. He wasassisted by David Burress, a Research Economist, and Sharon Eicher, a Graduate Research Assistantat IPPBR.
This report is one of a series of reports on EIPs (Environmentally Identified Products) in the KawValley of Kansas. David Burress is Principal Investigator for the project and edited this report.Helpful editorial comments were received from Thelma Helyar.
The views and findings presented in this report are those of the authors and do not necessarilyreflect views of the U.S. Department of Agriculture, the Institute for Public Policy and BusinessResearch, or the University of Kansas.

EIP Review Institute for Public Policy and Business Research Page 5
EXECUTIVE SUMMARY
C This study reviews literature on consumer demand for local produce, organic produce, and otherEnvironmentally Identified Products (EIPs).
Consumer behavior
C Sociodemographic characteristics that affect purchases of organic produce include gender,education, income, age, and race. However, the effects tend to be small.
C With the exception of price, traditional economic or demand-theoretic variables such as income,family size, total food expenditure, and expenditures on produce do not seem very important forpredicting demand for EIP produce.
C The most typical EIP purchaser is young, white, female, single, and professional.
C Females are more likely to purchase organic produce than males.
C Higher education has a negative effect on purchases of organic produce.
C Income has a negative effect on purchases of organic produce.
C Consumers say they are more likely to buy blemished produce if they know it is organic.
C There have been very few studies of the demand for locally-produced foods in the US. However,local foods tend to viewed positively by consumers.
Consumer motivation
C Many consumers express concerns about chemicals used in food production and feel that societyshould have more control over food production and processing.
C EIP consumers are more concerned about pesticides and environmental issues than the generalpopulation.
C Many consumers perceive no differences in taste between conventionally-grown produce andorganic produce. However, a minority of consumers believe that organic produce tastes better.
C Freshness is the most important reported sensory factor in selecting fresh produce.

EIP Review Institute for Public Policy and Business Research Page 6
C As income increases, so does consumer confidence in the food system.. Also, as age increases,so do positive feelings about the food system.
C A hypothesis explaining why increased education and income have a negative effect on purchasesof organic produce is that those with more education and more income have better access toinformation which leads them to have a higher level of confidence in the food system.
Marketing implications
C Mainstream consumers have a generally positive view of organic produce.
C Retail produce managers are not as enthusiastic about organic produce as are consumers, whichmay be a factor limiting supply.
C Lack of information about organic produce and limited availability seem to be the biggest limitingfactors to EIP consumption.
C Consumers want more information about how the food they purchase has been treated.
C Labels indicating which foods have been organically grown are needed.
C Higher costs and higher prices associated with organic produce have had a negative effect ondemand.

EIP Review Institute for Public Policy and Business Research Page 7
1. INTRODUCTION
Environmentally Identified Products ( EIPs) are defined as food and other products which have beenproduced in such a way that their growth, processing, or distribution has a reduced environmentalimpact compared to conventionally-grown, processed, and distributed products. EIPs may alsoinclude products that, independently of their impact on the external environment, are believed to havea healthier impact on the “internal environment” of the body than conventionally-produced products.Some examples of EIPs include organically grown and processed foods, locally-grown and processedfoods, foods grown using integrated pest management (IPM), and grass fed beef. In this report wewill focus on food products only, omitting other EIPs such as organic cotton clothing, natural healthand beauty products, herbal remedies, etc.
This literature review seeks to answer the following questions: Who are EIP consumers? What arethe characteristics and preferences of these consumers? How accurate are perceptions about EIPconsumers? What is important to consumers when making food purchasing decisions? What aremainstream consumers’ thoughts about EIPs? How much of a premium are consumers willing to payfor EIPs? Comparing across studies we attempt to answer these questions and to indicate whichvariables should be included in models of demand for EIPs.
A previous review (Beharrell & MacFie, 1991) surveyed international literature on consumer beliefsand attitudes toward food quality and acceptability of organic farming. A major finding was thatinterest in consumption of organic produce decreases sharply when price premium is above 20% andincreases sharply when price premium is below 20%. Our review finds similar results for recentliterature, mainly from the US, while covering a broader set of issues.
The literature review is divided into six main sections, which discuss:
ó The conventional economic variables of price and incomeó Sensory variables such as freshness, taste, cosmetic appearanceó Demographic variables such as education, gender, race, and occupational classó Psychographic variables which characterize an individual’s beliefs, concerns, and world viewó Behavioral correlates of EIP consumers such as environmental activismó Marketing issues such as dissemination of information, labeling, and delivery of EIPs to market.
We conclude by summarizing key findings and discussing opportunities for improved marketing ofEIPs. A detailed analysis of findings for each variable is given in Appendix 1. Appendix 2 containsnotes on the individual studies under review.

EIP Review Institute for Public Policy and Business Research Page 8
2. CONVENTIONAL ECONOMIC VARIABLES
Economic theory categorizes four fundamental factors which affect demand for a commodity asincome, price, quality of the commodity, and differences in tastes and preferences. Quality, however,refers not only to the innate characteristics of goods, but also to the perceptions consumers haveabout goods, which are examples of psychographic variables. Family size or household size is oftenincluded as a separate variable because it affects the amount of income available per person. Thissection considers effects on demand for EIPs that depend strictly on income, price, and householdsize. Later sections consider the dependence of demand on psychographic variables, as well as otherfactors that are related to, or may help predict, tastes and preferences. We will also consider somevariables, such as availability, that are more in the nature of constraints that may prevent consumerpurchases from reaching equilibrium with income, prices, and preferences.
Income effects
Contrary to the usual economic theory of demand, income does not seem to contribute importantinformation in predicting who is likely to purchase EIPs. Since EIPs often cost more thanconventionally-grown foods, one might expect that consumers with higher incomes would be morelikely to purchase them. However, most studies found that income did not differentiate purchasersof EIPs from non-purchasers. Jolly & Dhesi (1989) and Jolly (1991) found that income was notimportant in explaining differences in food purchasing behavior between buyers and non-buyers oforganic poultry and produce. Ott (1990) found that income was not important in explaining shoppers’willingness to pay for Certified Pesticide-Residue-Free (CPRF) produce, and Buzby & Skees (1994)found income had no effect on respondents’ willingness to pay for reductions in pesticide exposure.
Goldman & Clancy (1991) found the elasticity of income to be zero for purchasers of organicproduce. Park and Lohr (1996) found that the effect of income on organic carrot demand was zero.Govindasamy & Italia (1997a) found an income effect for purchases of produce in general, but theydid not find any income effect for purchases of organic produce specifically.
Two studies which did find that income was significant were van Ravenswaay and Hoehn (1991a)and Park and Lohr (1996). Van Ravenswaay and Hoehn (1991a) found a slightly positive incomeelasticity for pesticide residue-free (PRF) apples of .00042, while Park and Lohr (1996) found theeffect of income on demand for organic broccoli and lettuce to be large, positive, and significant.
With the exception of the van Ravensway and Hoehn and the Park and Lohr articles, most studiesdo not seem to support the notion that purchasers of EIPs have higher incomes than non-purchasers.However, high income is nevertheless perceived to be a common characteristic of purchasers oforganic produce. Estes et al. (1994) asked purchasers of organic produce how they would

1 Most studies found that willingness to pay a positive price premium for organic or pesticide-freeproduce was greater than 50 percent. The Hartman Group’s findings were the single exception. They found only13 percent of the population was willing to pay a premium.
2 An earlier study (Ott, 1990) found that 57 percent would pay 5 percent more; ten percent would payten percent more; 33 percent are unwilling to pay any premium for CPRF produce.
EIP Review Institute for Public Policy and Business Research Page 9
characterize other purchasers of organic produce and found that purchasers ranked high disposableincome as the second most-typical characteristic of organic produce consumers.
Besides the apparent lack of importance of income, other intermediate demand variables such as totalhousehold food expenditures seem to add little predictive information. Goldman and Clancy (1991)looked at the relationship between total food expenditures and purchases of organic produce. Iforganic produce constitute a fixed share of food expenditures, then they should increase with foodexpenditures. On the other hand, one might hypothesize that since EIPs tend to be more expensivethan conventionally-produced foods, consumption of EIPs would fall as total household foodexpenditures rise. However, Goldman and Clancy found no relationship between total foodexpenditures and purchases of organic produce.
Consumer price effects
Organic produce consumption is quite sensitive to price. However, quantity demanded depends moreon the price differential with respect to conventional foods than on absolute price. Estes et al.(1994) found that price is ranked by organic produce consumers as the primary reason for not buyingmore organic produce. Both organic and non-organic produce consumers view organic produce asexpensive, but only non-buyers view it as too expensive (Tregear et al., 1994).
Closely tied to the issue of price is the concept of willingness to pay. Willingness to pay refers to themaximum price a consumer would be willing to pay for a particular item. It is commonly measuredusing self-reports from the consumer rather than actual market data; therefore it is generally viewedas less reliable than price response data. On the other hand, willingness to pay data are more availablethan direct price response data.
Consumers who say they are willing to pay more for organic produce than conventional producerange from 49 percent of the population (Harris Poll, 1989) to 81 percent (Weaver et al., 1992), andas many as 83 percent of the American public claim to be willing to pay more for foods grown withfewer chemicals (Morris et al., 1993).1 Weaver et al (1992) found that one quarter of the populationwould pay up to 5 percent more for pesticide-free produce; 31 percent would pay up to 10 percentmore; and 26 percent would pay up to 15 percent more.2 It seems that the majority of consumers saythey are willing to pay more for organic produce. The quantity consumers are willing to purchasefalls as the price premium increases.
3 Price elasticity of demand is a measure of the responsiveness of demand to a change in a good’s price.Elastic demand means that the quantity demanded of a good will fall by more than 1% in response to a 1%increase in the good’s price, ceteris paribus. Conversely, a 1% decrease in the good’s price will cause thequantity demanded to increase by more than 1%.
EIP Review Institute for Public Policy and Business Research Page 10
The degree of willingness to pay varies from product to product and from study to study. Jolly et al(1989) found a willingness to pay premium for apples, peaches, broccoli, and carrots of 30-40¢ perlb.
Buzby & Skees (1994) found the range on willingness to pay for organic grapefruit of 15-69¢ per lb.During the Alar scare (van Ravenswaay & Hoehn, 1990), willingness to pay to avoid Alar (bysubstituting from conventionally-grown to organic apples) was 12¢ per lb. Organic baby foodcommands a premium of 21¢ per jar (Harris, 1997). The amount consumers will pay to avoidchemicals varies widely both in terms of percentages and in monetary values.
Market price effects
A major hindrance to selling organic produce may be that, because organic produce at present tendto have a high wholesale cost differential with respect to conventional produce, retailers tend to keepprofit margins low in order to make organic prices attractive when compared to conventionalproduce. Consequently, they may be unwilling to stock large quantities of organic produce. Producemanagers generally believe that organic produce are too expensive. Morgan et al (1990) found thatnon-organic produce sellers who are interested in organic produce cite price as the main barrier toselling organic produce.
Morgan et al (1990) argues that organic produce should be marketed as premium products and thatretailers are not taking advantage of the premium nature of organic produce in order to keep priceshigh. Morgan et al. finds that 76.6 percent of organic produce sellers use the same or lower markupon organic produce as they do for non-organic produce. Only 23.4 percent use a higher markup onorganic produce.
However, part of the reason the majority of retailers use the same or lower markup for organicproduce is that demand for organic vegetables has been found to be significantly price-elastic.3 Whenwholesale costs for broccoli, carrots, and lettuce decrease by 1 percent, demand increases by 1.7, 2.4,and 1.2 percent, respectively (Park & Lohr, 1996). Or, stated conversely, as organic prices rise,quantity demanded falls at an increasingly faster rate, making it difficult to keep prices high.
The organic market is fragmented, as supplies are short in some areas and not in others. For thisreason, Franco (1989) found broccoli premiums as high as 100 percent.

EIP Review Institute for Public Policy and Business Research Page 11
Household size effects
Household size can be correlated with total food expenditures because the larger the household themore food required to feed the household. Because EIPs are relatively expensive one might expectconsumption of EIPs to fall (either absolutely, or as a share of food expenditures) as household sizerises. Two studies confirmed this hypothesis. Jolly (1991) found that two person households with ahousehold income in excess of $30,000 had the highest willingness to pay for organic produce.Willingness to pay decreased as household size increased. A survey by the Food Marketing Institute(1997) found that single-person households were more concerned about the availability of organicproduce than multiple-person households. However, Jolly & Dhesi (1989) found the effect ofhousehold size on demand for organic poultry to be zero.

4 Waugh (1928) did the first hedonic study of produce. (A “hedonic” regression model is one whichplaces separate dollar values on various attributes of a commodity.) He found that size, appearance, and colorwere the most important attributes in conventional produce. In Weaver et al (1992), flavor was the mostimportant tomato attribute.
EIP Review Institute for Public Policy and Business Research Page 12
3. SENSORY VARIABLES
When shoppers compare organic produce with conventionally-grown produce what sensoryperceptions matter most? How does the organic item look, smell, and taste, compared to a non-organic fruit or vegetable?4 How does sensory appeal affect willingness to pay for the organic fooditem? How much do considerations of freshness and keeping qualities of organic produce versusconventional produce influence purchasing decisions?
Chemicals used to minimize insect damage and fungi cannot be used on organic fruits and vegetables,so organic fruits and vegetables may not always appear as perfect as a conventionally-grown andtreated product (While comparably appearing organic foods are technically feasible, they are costlyto produce.) How much do consumers care about differences in appearance? Are organic producereally less cosmetically perfect? If consumers care, will knowledge that cosmetic defects are a resultof lack of chemical sprays offset any reduction in demand due to cosmetic defects?
When investigating opinions which influence the purchase of organic produce, it is not only the end-consumer who must be considered but also the wholesaler and the supermarket produce manager.A strong concern among produce managers and a likely obstacle to increasing organic produceavailability is the perception by retail produce managers that organic produce is generally lowerquality than conventional produce (Jolly & Norris, 1991; Lin et al., 1986; Morgan et al., 1990).However, this perception is changing. In a 1989 survey, 67 percent of produce managers ratedorganic produce as worse than conventionally-grown produce. In 1991, this percentage fell to 50percent (Jolly & Norris, 1991). Estes et al (1994) found organic produce managers indicate that theydesire the highest quality produce available, irrespective of price. While consumers do not seem toview organic produce as inferior in terms of taste, freshness, or nutritional value, half of producemanagers view organic produce as inferior to conventional produce for these quality characteristics.
Appearance
Some studies show that consumers have a strong resistance to blemishes. Ott (1990) found that sixty-two percent of consumers would be unwilling to accept any decrease in appearance quality whenpurchasing organic produce, and 88 percent would be unwilling to accept insect-damage on pesticide-residue-free produce. There is a clear relationship between willingness to accept blemishes andorganic purchasing behavior (Goldman & Clancy, 1991). Eighteen percent of shoppers who areconcerned about pesticides would be willing to buy blemished produce whereas only 6 percent of

5 Van Ravenswaay & Hoehn (1991b) show that 11.9 percent of respondents were willing to accept pest-damaged apples as long as no pesticides were used. This contradicts Ott (1990). Bunn (1990) has similar resultsas van Ravenswaay & Hoehn for organic orange demand.
6 In an ordered Logit Model regression of importance on preference indicator, the t-value for organicpeoduce’sappearance was -1.787.
EIP Review Institute for Public Policy and Business Research Page 13
shoppers who are unconcerned about pesticides would be willing to buy blemished produce. (Ott,1990) However, when it is made known that the blemished produce is "organic," consumers are morelikely buy blemished organic produce.5
Other studies show the negative effect on consumer demand of blemished produce is only slight(Goldman & Clancy, 1991; Sparling and McKenzie, 1992; Estes et al., 1994; Tregear et al., 1994).A previous review of literature (Beharrell & MacFiem,1991) found that people estimate a food’squality by appearance. As one grower states, "people shop with their eyes." The degree to whichblemishes cause people, who would otherwise buy organic produce to choose not to, is ambiguous,but it is important that EIPs be as visually appealing as possible or people are less likely to buy them.
Produce managers who did not handle organic produce rated appearance as a limiting factor muchhigher than those who handled organic produce. Lin et al. (1986) shows that the more organic orpesticide-free produce is preferred, the less appearance is important.6
Jolly & Norris (1991) found that eleven out of twelve supermarket chains surveyed rated organicproduce appearance as worse than non-organic produce and believed that their customers held thesame view. Attitudes by produce wholesalers and retailers may hinder organic produce's availabilityin conventional food stores.
Anecdotal evidence indicates that, while the appearance of organic produce was inferior toconventional produce in the 1980's, the quality of what is for sale now has improved greatly. In onestudy, Conklin et al. (1991) actually found that organic apples had fewer defects than non-organicapples. In comparing carrots, potatoes, and romaine lettuce produce managers reported the numberof defects in organic produce to be higher than in conventional produce, but the number ofobservations of defects in organic produce and conventional produce were statistically different fromzero for carrots only. Produce managers' concerns about organic quality may not reflect the qualityof the goods now supplied, but rather their earlier impressions.
Ott (1990) looked at the relationship between consumers’ tolerance for cosmetic defects in organicproduce and demographic variables. He found that those who were college-educated or had a higherincome, were more willing to accept cosmetic defects.

7 39/331 responses indicated this view. This is 12 percent. (Estes et al., 1994)
EIP Review Institute for Public Policy and Business Research Page 14
Taste
Taste (meaning flavor, as opposed to preferences in general) is another basic attribute of EIPs thataffects food purchasing decisions. Jolly & Dhesi (1989), Jolly & Norris (1991), and Sparling et al.(1992) found consumers perceived no difference in taste between conventionally-grown and organicproduce. Morgan et al. (1990), Estes et al. (1994), and The Packer (1996) found that consumersbelieved that organic produce tastes better than conventional produce. Sparling et al. (1992) foundthat non-organic produce consumers do not view organic produce as tasting better than conventionalproduce, but organic produce consumers do believe organic produce taste better than conventional.Estes et al. (1994) found that survey respondents cite “better taste” as the primary reason for buyingorganic produce. In only one reviewed study did consumers rate the taste of conventionally-grownproduce as superior to organic produce. Consumers seem to prefer organic produce’s taste or do nothave taste preferences at all.
Freshness and shelf life
Freshness is another factor that influences consumers’ produce decisions. Consumers rate in-storefreshness as the same between conventional and organic produce (Sparling et al., 1992). Retailproduce buyers say organic produce tend to have a shorter shelf life than conventional produce andthat this characteristic decreases consumers' demand for organic produce. However, the frequencyof this response was very weak.7 Estes et al. (1994) found that the third most frequently mentionedreason for purchasing organic produce is freshness. The Packer (1996) found that 17 percent oforganic produce consumers cite increased freshness as a major reason for purchasing organicproduce.
A characteristic related to freshness is shelf life, i.e., how long organic fruit and vegetables will keep.Jolly & Norris (1991) and Morgan et al. (1990) find the majority of produce managers rate organicpeoduce’skeeping qualities as worse than that of conventionally-grown produce. Sparling et al.(1992) finds that consumers see no difference in the keeping quality of organic produce versusconventional produce. Other consumers cited organic peoduce’slonger shelf life as a reason forpurchasing organic produce (Morgan et al. 1990). There seems to be no consensus regarding organicpeoduce’skeeping qualities as compared to the keeping qualities of conventionally-grown produce.

EIP Review Institute for Public Policy and Business Research Page 15
4. DEMOGRAPHIC VARIABLES
Demographic variables often are used as a proxy for tastes and preferences. This assumes thatindividuals who belong to the same demographic group have similar tastes and preferences. However,in the case of EIP consumers, several traditionally important demographic variables such as educationand age seem to add little information in predicting who is likely to purchase EIPs. Importantdemographic variables that do affect EIP demand include occupational class, gender, marital status,community size, and race.
The typical organic produce consumer is single, white, young, female, and professional. However,there is substantial variation among the demographic variable findings, and demographic variablesalone do not appear to be enough to describe organic produce consumers very well. It is interestingthat the more traditional variables used in demand models such as income and education seemrelatively unimportant in modeling demand for EIPs. In order to accurately identify EIP consumerswe will need to consider other types of variables such as psychographic variables which includelifestyle, values, and self image, which will be considered in following chapters.
Occupation
The importance of occupational class was confirmed by Jolly & Dhesi (1989) and Jolly (1991). Bothstudies found that buyers of organic poultry and organic produce tend to belong to white-collaroccupational classes.
Race
Race was also found to be important. Ott (1990) found that whites were willing to pay higher pricesfor Certified Pesticide-Residue-Free produce than were non-whites. Misra et al. (1991) found thatwhites were less price elastic in their produce purchases than non-whites. This means that as produceprices increased, the quantity of produce purchased by whites declined more slowly than the quantityof produce purchased by non-whites. Since EIPs usually cost more than conventional produce, thisfinding implies that whites would be more inclined to purchase EIPs than non-whites. However,Buzby & Skees (1994) found no relationship between willingness to pay for reduced exposure topesticides and race.
Even though current purchasers of organic produce may tend to be white, non-whites are just aswilling to pay for reductions in pesticide exposure. There may be differences in perceptions amongraces about the level risk from exposure to pesticides from conventional produce. There may also bedifferences among races in the level of awareness or availability of pesticide-residue-free produce.

EIP Review Institute for Public Policy and Business Research Page 16
Gender
Purchasers of EIPs tend to be women. This may be explained by the fact that women tend to be theprimary food shoppers of a household and may be more aware of food issues. Estes et al. (1994)found that being female was the second-most common characteristic among purchasers of organicproduce. Govindasamy & Italia (1997b) found that women both knew more about integrated pestmanagement (IPM) and were willing to pay more for organic produce. Jolly (1991) found that womenwere willing to pay more for organic produce than men. Similarly, Buzby & Skees (1994) found thatwomen were willing to pay more for reductions in pesticide exposure than were men.
Marital status
While women have a higher willingness to pay for organic produce than men, both single men andsingle women have a higher willingness to pay for EIPs than married men and women. Jolly (1991)found that while all consumers expressed a positive willingness to pay for organic produce, singleconsumers were willing to pay more for organic produce than married consumers.
Community size
Community size is a variable one might expect to be an important factor in determining one’s demandfor EIPs if it is true that urban consumers have more opportunities to buy EIPs than rural consumers,or if urban consumers have more “sophisticated” tastes. However, the studies under review found thatconsumers from smaller communities were more likely to purchase organic produce than consumersfrom larger communities. Jolly & Dhesi (1989) found the average community size for buyers oforganic poultry in California to be 37,268, compared to 45,659 for non-buyers. Jolly (1991) foundthe average community size for buyers of organic produce was 39,400, compared to 44,500 fornon-buyers.
Education
Another commonly-held assumption about EIP consumers is that college-educated consumers aremore likely to purchase EIPs than non-college-educated. However, the studies reviewed for thispaper found no relationship between level of education and purchases of organic produce. Jolly &Dhesi (1989) and Jolly (1991) found that level of education did not explain differences in buyingbehavior between buyers and non-buyers of organic poultry and organic produce. Misra et al. (1991)found the effect of education to be negative when organic produce cost more than conventionalproduce (i.e., as the level of education rose among consumers, purchases of organic produce wentdown). Similarly, Buzby & Skees (1994) found that willingness to pay for reductions in pesticideexposure decreased as level of education increased.

EIP Review Institute for Public Policy and Business Research Page 17
The exception to these results was Jolly (1991) who found that among those who purchase organicproduce, those with university degrees were willing to pay the most for organic produce. This doesnot mean that those with less education do not purchase organic produce. It means that among thosewho purchase organic produce, those with more education (and perhaps higher incomes) are willingto pay more for organic produce than those who have less education (and perhaps lower incomes).
Age
Research results tend to show a negative relationship between age and purchases of EIPs. VanRavenswaay and Hoehn (1991b) found that age had a negative effect on demand for pesticideresidue-free apples (i.e., older consumers demanded fewer pesticide-residue-free apples). Similarly,Buzby & Skees (1994) found that younger consumers were willing to pay more for reductions inpesticide exposure than older consumers. A survey conducted by the Food Marketing Institute foundthat older consumers were less concerned with the availability of organic produce at their grocerystore than younger consumers (Food Marketing Institute, 1997). However, Jolly (1991) found nocorrelation between age and purchases of organic produce.

EIP Review Institute for Public Policy and Business Research Page 18
5. PSYCHOGRAPHIC VARIABLES
Psychographic variables are variables which characterize an individual’s beliefs and concerns. In thecontext of EIPs, psychographic variables are attitudes and opinions about issues associated with EIPs.All psychographic variables reviewed were important and positively influenced consumers' purchasesof organic produce.
Pesticides and consumers’ health concerns
Consumers’ concern for pesticides has been addressed by a number of studies. Generally, consumersof EIPs are concerned with exposure to pesticides and the effect of pesticides on their health and thehealth of the environment. All studies reviewed found consumers’ concern for pesticides to beimportant and influential in the purchases of organic produce.
Morris et al. (1993) found that more Americans are concerned with the effects of pesticides on theirhealth than are concerned about the effects of secondhand smoke, air pollution, food poisoning, orhormones in meat and milk. Purchasers of organic produce had a greater concern for pesticideresidues than did non-buyers (Jolly & Dhesi, 1989; Jolly, 1991). Similarly, organic produceconsumers rated protection from pesticide residues in food the second most important reason forsupporting organic agriculture out of a list of seven commonly-cited reasons for supporting organicagriculture.(Goldman & Clancy, 1991)
It is known that consumers of organic produce often purchase organic foods to avoid consumingpesticide residues. Ninety-one percent of organic produce purchasers have concerns about the healtheffects of pesticides used in production of conventional produce (Morris et al., 1993). Sachs et al.(1987) find that the number of people with concerns about consuming pesticides used onconventional produce is increasing.
Consumers who held negative perceptions about pesticides had an increased likelihood of purchasingorganic produce and an increased willingness to pay for organic produce. Ott (1990) found 50percent of shoppers were “concerned about pesticides” and were willing to pay more for CPRF(Certified Pesticide-Residue-Free) produce versus 33 percent who were unconcerned. Jolly & Norris(1991) found that eight out of twelve respondents ranked organic produce as better than conventionalproduce because of fewer chemical residues.
Fifty-two percent of consumers said they are "very concerned" or "extremely concerned" aboutpesticide residues when selecting produce (Cook, 1992). A large majority of Americans (84%) wantthe federal government to encourage farmers to reduce their application of chemicals (Morris et al.,1993), and one of the actions supported in a poll conducted by the Public Voice for Food and HealthPolicy was a reduction in subsidies to farmers who use agricultural chemicals. Ott (1990) found that

EIP Review Institute for Public Policy and Business Research Page 19
67 percent of those surveyed were concerned enough about pesticides that they were willing to paya premium for CPRF produce. CPRF is viewed by consumers as making food safer.
Bruhn et al. (1992) found that 15 percent of consumers who had concerns about pesticides actuallypurchased organic produce. Similarly, The Packer (1996) reported that twelve percent of buyersbought organic produce for their lack of chemicals. Sparling et al. (1992) observed 30 percent ofpurchasers of organic produce cited concern for pesticide residues as their main reason for makingthese purchases. In the same study, 21 percent of purchasers of organic produce cited concern forhealth as their main reason for doing so, which could also mean they had concerns about pesticideresidues.
Food scares related to pesticides used on conventional agricultural products have in the pasttemporarily increased demand for certain organic foods. A widely-cited case is the Alar scareregarding the safety of eating apples treated with the pesticide Alar. Studies done by van Ravenswaayand Hoehn (1990) captured the effects of the Environmental Protection Agency’s warning about thepossible health hazards of eating apples which had been treated with Alar. Their research showed thatthis announcement had a significant negative effect on the demand for conventionally-grown applesand increased the demand for organic apples. However, Park and Lohr (1996) show that a food scarewhich causes an increase in the demand for specific organic fruits or vegetables does not necessarilycause an increase in the demand for other organic fruits or vegetables. This seems to imply thatdespite consumers concerns about pesticides, consumers have a high level of trust in the overall safetyof the food system.
Closely related to consumers’ concern for pesticides is their concern for health and the food they buy.Concern for health was found to be important by all studies reviewed, except Jolly & Dhesi (1989).Sparling et al. (1992) found that 21 percent of purchasers of organic produce cited concern for healthas their main reason for doing so, and 54 percent of UK organic produce consumers bought organicproduce out of concern for health (Tregear et al., 1994). The Packer (1996) reported that 16 percentof purchasers of organic produce say they chose organic produce for health reasons.
Organic produce consumers may be thought of as having a general concern for how their food istreated. A study by Jolly et al. (1989) looked at consumers’ concern for artificial coloring, additives,preservatives, and irradiation. Differences were found between purchasers and non-purchasers ofEIPs in their levels of concern for these food treatments. The authors found that buyers of organicproduce have a statistically significant higher level of concern for artificial coloring, additives andpreservatives, and irradiation, than non-buyers. Jolly (1991) also found that buyers of organic poultryhad a statistically significant higher level of concern for all three treatments, as well. People who buyorganic produce seem to be people who are concerned about how their food is treated.

EIP Review Institute for Public Policy and Business Research Page 20
Health concerns by and for suppliers
If organic produce consumers are concerned about the effect of pesticides on their own health andthe health of the environment, one might hypothesize that they might also be concerned for the healthof farm workers who apply pesticides. Tests of this idea produced mild support. In a survey oforganic produce consumers, Goldman & Clancy (1991) found that protection of farm workers rankedfourth on a list of seven commonly-cited reasons for supporting organic agriculture. Another studyby Sparling et al. (1992) found only 3 percent of organic produce consumers purchase organicproduce mainly out of concern for farm workers.
Those who handle produce in their work cite concern for health as a reason to sell organic produce.Morgan et al. (1990) finds lower health risk is cited by organic produce handlers as the primaryreason to sell organic produce. Morgan et al. (1990) found 75.8 percent of organic produce sellersand 39.4 percent of non-organic produce sellers rank “lower health risk” as one of the top-threereasons to sell organic produce. Organic peoduce’sperceived lower health risks as a result of lowerpesticide exposures is a strong motivator for handling organic produce. This attitude by handlerscould be a positive factor to help increase consumers’ access to organic produce.
Environmental concerns
Environmental concern is a strong motivating factor for consumers who purchase organic produce.Goldman & Clancy (1991) report that when organic produce consumers were asked to list theirreasons for purchasing organic produce, environmental concerns accounted for four of the top sevenmost commonly-cited reasons for supporting organic agriculture. Sparling et al. (1992) reports thateleven percent of organic produce purchasers do so mainly out of concern for the environment. Esteset al. (1994) found environmental concern was the fourth most often mentioned reason organicproduce consumers said they purchased organic produce.
Most organic produce sellers report that customers believe that organic produce is better for theenvironment than conventional produce. Morgan et al. (1990) found that 61.3 percent of organicproduce sellers and 52.1 percent of non-organic produce sellers rank “better for the environment” asone of the top-three reasons to sell organic produce. Jolly & Norris (1991) found that 5 out of 12organic produce managers rank organic produce as better for the environment than conventionalproduce. Another 5 out of 12 produce managers say organic produce and conventional produce areequally good for the environment. None of the produce managers interviewed believed that organicproduce was worse for the environment than conventional produce. Most consumers and producecarriers believe that organic products are good for the environment whether or not they actuallyparticipate in the organic market.
Concern for the environment did not prove useful, however, in differentiating buyers and non-buyersof organic produce in one British study. Tregear et al. (1994) found that over 90 percent of both

EIP Review Institute for Public Policy and Business Research Page 21
purchasers and non-purchasers of organic produce were concerned about the environment. Of thosepurchasing organic produce, only nine percent cited concern for the environment as their main reasonfor doing so.
Nutritional concerns
If produce is grown in healthy soil, the produce should contain sufficient vitamins and minerals. Thereis no scientific reason to believe that organic fruit and vegetables absorb more vitamins and mineralsthan those exposed to chemicals (i.e., organic foods are not necessarily more nutritious thanconventional vegetables, and vice versa). However, most studies find that respondents believe organicproduce is more nutritious than conventional produce. Sparling et al. (1992) found most consumersview nutritional benefits of the two types of produce as the same, although 9 percent of retail producebuyers cite organic produce being "more nutritious" as the main reason they believe consumerspurchase organic produce. Other studies such as Jolly & Dhesi (1989), Morgan et al. (1990) andEstes et al. (1994) found that both purchasers of organic produce and non-purchasers of organicproduce as well as retail produce buyers believed that organic produce was more nutritious thanconventional produce. The perception that organic produce is at least as nutritious, if not more so,than conventionally-grown produce seems to be widely held.

8 It is interesting to note that while environmental activism is falling, demand for organic foods has beengrowing rapidly (Food Marketing Institute , 1995; Sachs et al., 1987).
EIP Review Institute for Public Policy and Business Research Page 22
6. BEHAVIORAL CORRELATES OF EIP CONSUMERS
Consumption of EIPs may often be part of a life-style that emphasizes proactivity and personal action,with reference both to one’s own well being, and also the well-being of others.
Tregear et al. (1994) found that 75 percent of people who buy organic produce said they participatedin environmental activities compared to 43 percent of those who did not buy organic produce.Tregear et al. (1994) also found that store produce managers typified organic food buyers as"environmental advocates."
On issues of food avoidance, Tregear et al. (1994) found no correlation between purchases of organicproduce and avoidance of specific foods on ethical grounds (such as avoiding purchasing grapesgrown in ways that might harm migrant farm workers). Seven percent of both organic and non-organic shoppers avoided foods for various ethical reasons. It seems that while "ethical consumers"are not necessarily EIP consumers, environmentally-minded consumers are often EIP consumers.8
Responses to pesticide fears are varied: 29.8 percent of consumers grow their own fruit andvegetables (which also reflects a demand for local produce); 23 percent avoid imported produce; 11percent buy pesticide-free produce; and 10.7 percent buy organic produce (van Ravenswaay &Hoehn, 1991a). Other studies show that 43 percent of consumers changed their buying habits to avoidpesticides and 86 percent look for food at the supermarket that is grown with fewer chemicals. Whenresponding to pesticide fears, 41 percent buy more organic produce; 22 percent buy less produce; 28percent avoid produce receiving media attention; and 5 percent grow their own vegetables (Weaveret al., 1992). If pesticide fears are increasing (Sachs et al., 1987) then organic produce demand willalso increase.

EIP Review Institute for Public Policy and Business Research Page 23
7. MARKETING AND CONSUMPTION BARRIERS
Dissemination of information about organic products, labeling, and delivery to market are all aspectsof marketing. The organic produce market is under-developed in these areas. In effect, the marketfor EIPs is in disequilibrium, because of extrinsic limits on information or availability.
Information effects
Information motivates organic produce demand. After the EPA Alar report there was a stampede fororganic food. Other food safety scares that the media makes public have immediate effects ondemand. Zellner & Degner (1989) found that in Des Moines, Iowa, where regional information wasavailable, willingness to pay was higher than in other cities without this information. Morris et al.(1993) found that when respondents were given Food and Drug Administration (FDA) and EPAfindings on pesticide residues on food, over 90 percent of Americans supported dramatic reductionsin agrochemical use, and 85 percent would favor politicians who promote stricter laws for pesticideuse. Not only has it been shown that consumers will, at least temporarily, switch from conventionally-grown to organically-grown foods when the government publishes information regardingagrochemical threats, but they also want action by their politicians.
Do people who spend more time making food purchasing decisions by reading food advertisementsbuy more organic produce? Govindasamy & Italia (1997b) find that reading food advertisements andreading food safety articles are inversely related. Those who read food advertisements are notconcerned with food safety. Those who primarily read food safety articles are more concerned aboutrisk and are more willing to pay a premium for organic produce, than those who read primarily foodadvertisements.
People want more disclosure and better access to information. Eighty-six percent of those surveyedwant to know the amount of chemicals used on their food (Morris et al., 1993). A large majoritywould like signs in supermarkets to state chemical use for each produce item and would like labelinglaws requiring agrochemical disclosure.
Information gaps include not only uncertainty about the amount of chemicals used on food but alsothe validity to organic claims. Produce marketers and consumers both realize that the lack ofinformation about organic produce is a deterrent to its demand. Weaver et al. (1992) show that ofthose who have not changed their buying habits due to pesticide concerns, 22 percent say lack ofinformation is the cause. Buyers rank lack of information as the second reason why consumers do notpurchase more organic produce. Information gaps hinder consumer demand for organic produce.

EIP Review Institute for Public Policy and Business Research Page 24
The role of labeling
Labeling is a specific technology for imparting information. Credible labeling generally requires somedegree of government intervention.
The USDA is in the process of reviewing standards for uniform labeling. Currently many differentagencies with different criteria support organic labels. Some organic goods carry no labels, whichconfuses produce consumers and buyers. The majority of Americans want tough labeling lawscovering pesticide and chemical use on food (Morris et al., 1993). Seventy-five percent of producemanagers find the lack of standards and grading a problem in carrying organic produce, which ranksthird among their list of problems in carrying organic produce (Jolly & Norris, 1991, and Morgan etal., 1990). Nearly all consumers want labeling for pesticide use (Buzby & Skees, 1994). VanRavenswaay & Hoehn (1991a) found that labels concerning pesticide testing on apples raised demandby 6.12 or 11.7 lb. per family, depending on what type of label the apples had. Accurate labeling alsotranslated into more willingness to pay. Consumers want information on the products they arepurchasing. Both consumers and produce managers want better consistency. Consumer informationand labeling should improve when the U.S. Department of Agriculture (USDA) begins its certificationprogram.
Availability effects
Perhaps the biggest hindrance to increasing market share for organic produce is lack of availability.Organic goods are simply not widely available in stores. Yet, 84 percent of respondents say theyprefer organic produce when it is available (Huang, 1991), and 81 percent of organic producehandlers agree organic produce is under supplied (Morgan et al., 1990). Other studies echo thissentiment (The Packer, 1996 ; Jolly & Norris, 1991;, Morgan et al., 1990; Sparling et al., 1992). A1996 survey by the Food Marketing Institute showed that 70 percent of those surveyed shopped ata store that sells organic produce but felt supplies were limited (Food Marketing Institute, 1997).

EIP Review Institute for Public Policy and Business Research Page 25
8. CONCLUSION
Mainstream consumers tend to have a generally-positive view of organic produce. However, producebuyers and produce managers tend to view organic produce more negatively than consumers. Thisview may contribute to the problem of availability since these are the people responsible for bringingorganic produce to the retail marketplace.
Price generally has a negative effect on quantity of organic produce demanded. Most stores do notcharge a higher mark-up for organic produce; rather, the premium most often comes from theproducer or wholesaler. By definition, those currently purchasing organic produce are willing to paythis premium. While most shoppers are willing to pay more for organic produce, demand quicklydecreases as the price premium for organic produce increases. (As low as 10 percent may be thethreshold price premium.) Certification of produce as pesticide-residue-free or organic seems to raisewillingness to pay for organically grown produce.
So who are consumers of EIPs? Results from these studies indicate the demographic traits of organicbuyers are quite interesting and are perhaps different from what one might expect. One might expectthat those with higher incomes and more affluent lifestyles, who could devote more resources tobuying the best quality products, would be prime organic shoppers. One might expect that those whowere better educated would be more likely to have strong health and environmental concerns and todemand more organic produce. One might expect that families with children would demand moreproduce grown in “healthier” ways. Survey evidence strongly suggest that these ideas are wrong.Income and education are not necessarily related to organic produce demand in the U.S. market.These studies suggest that single, professional, white females are one group of organic shoppers.Also, people who hold strong health or environmental concerns are likely to be organic shoppers.Organic produce consumers are represented across income and educational levels.
Purchasing of organic produce is closely related to health and environmental concerns, leading to theidea that values and personal interests play a role in making one an organic shopper.
Major obstacles to the organic market appear to be:
C Availability: most people shop in only one market, a supermarket. Supermarkets may carry someorganic produce, but usually not a wide variety of organic produce.
C Higher grower prices than conventional produce: higher grower prices for organic producedecreases consumer demand and stores’ interest in stocking organic produce.
C Lack of uniform labeling and certification: this problem is now being addressed at the federallevel.

EIP Review Institute for Public Policy and Business Research Page 26
C Attitudes of produce handlers that do not correspond to shoppers’ views: this situation is afunction of information and experience and should improve with uniform labeling movement andwider availability of organic produce.
People say that they are willing to buy organic produce, even at a higher price. Broadening the marketand introducing economies of scale into production, thereby lowering costs to produce, will reduceprice. More than price, a broad market base is needed. People report that their supermarkets carrysome organic produce, but how much of a choice are they given when choosing produce? Most storesdo not have distribution channels for organic and local produce comparable to those that exist forconventional produce, and most people cannot purchase organic produce unless they shop at aspecialty or health food store.

EIP Review Institute for Public Policy and Business Research Page 27
APPENDIX 1: Summary of Findings
Table 1.1Demographic Variables
Key:+ = Positive effect on purchases of organic produce - = Negative effect on purchases of organic produce0 = No effect on purchases of organic produce
EducationJolly & Dhesi(1989)
0 Level of education not significant as an explanatory variable toexplain differences in buying behavior between buyers andnon-buyers of organic poultry.
Misra et al. (1991) - College-educated consumers were more price-elastic.
Jolly (1991) 0 Level of education not significant as an explanatory variable toexplain differences in buying behavior between buyers andnon-buyers of organic produce.
Jolly (1991) + Those with college and graduate degrees are willing to pay themost for organic produce. There is no trend with education orincome of percentage who are willing to pay a positivepremium for organic produce.
Buzby & Skees(1994)
- Willingness to pay for reductions in pesticide exposure levelsdecreased as education increased.
OccupationJolly & Dhesi(1989)
+ Buyers of organic poultry belong to more white-collaroccupational classes than non-buyers do.
Jolly (1991) + Buyers of organic produce are more likely to be in service orwhite-collar occupations. (Possible explanation: theseindividuals may be less under the influence of primaryconsumer reference groups and thus more free to be innovativeconsumers.)
Jolly (1991) 0 Blue-collar workers are willing to pay 39.1% more for organicproduce; white-color workers are willing to pay 38.6% morefor organic produce.
IncomeJolly & Dhesi(1989)
- Average incomes of buyers of organic poultry are lower thanthat of non-buyers by $4000 per year (suggesting thatlifestyles, values and concerns may have key roles to play inthe organic food purchasing decision). (statistically significantat the .01 level).

EIP Review Institute for Public Policy and Business Research Page 28
Ott (1990) 0 Not significant in explaining shoppers’ willingness to paymore for CPRF produce.
Goldman &Clancy (1991)
0 Income elasticity found to be zero among buyers of organicproduce.
Jolly (1991) 0 Level of household income not significant as an explanatoryvariable to explain differences in buying behavior betweenbuyers and non-buyers of organic produce.
Jolly (1991) + Willingness to pay for organic produce increases with income.
Jolly (1991) 0 Trend between age and WTP were completely unpredictable.Under 40-year-olds were most willing to pay for organicproduce when income was between $30-49K. Those between40-59 years, were most willing to pay for organic producewhen incomes were less than $30,000. Those over 60, seemedwilling to pay more for organic produce when income wasover $50,000, but low and high incomes tied for over-70's.
van Ravenswaay &Hoehn (1991b)
+ .00042 income elasticity. Statistically different from zero at95% for pesticide-free apples. In the regressions, income'sabsolute value of its coefficient was the smallest, but wassignificant. All were +.
Buzby & Skees(1994)
0 Income had no apparent effect on whether respondents wouldpay more for increased reductions in pesticide exposure.
Estes et al. (1994) + Buyers ranked high disposable income as 2nd (tied withwomen) on the list of characteristics typical of the mainconsumers of organic produce. Being young professional,ranked 4th after environmental advocate, high disposableincome, and women.
Park & Lohr(1996)
+ Effect of income on organic broccoli and lettuce demand wasrelatively large, positive and significant.
Park & Lohr(1996)
0 Effect of income on organic carrot demand was notsignificant.
Age (Older)Jolly & Dhesi(1989)
0 Mean age for buyers of organic poultry is 40 vs. 46 for non-buyers (statistically significant at the .01 level)
Jolly (1991) 0 The mean age of buyers was 40.9 vs. 48.6 for non-buyers.Jolly (1991) 0 Those willing to pay the most were those in their 40's. There
is no age trend (it bounced back and forth between cohorts).Misra et al. (1991) + Those over-60 were less price-elastic than those 36-60.van Ravenswaay &Hoehn (1991a)
- All models had a negative coefficient for age.
Buzby & Skees(1994)
- Younger respondents were willing to pay more than olderrespondents for reductions in pesticide exposure.
Estes et al. (1994) + Weaker characteristic of the main consumer of organicproduce when characterized by buyers.
Food MarketingInstitute (1997)
- 22% of respondents said that availability of organic produce instores was "very important." This concern decreased with age.46% said it is "very important" to sell "green" goods.

EIP Review Institute for Public Policy and Business Research Page 29
Total food expendituresGoldman &Clancy (1991)
0 Organic buyers’ purchases of organic produce were not relatedto total food expenditures.
Larger-Sized CommunityJolly & Dhesi(1989)
- Average community size of buyers of organic poultry was37,268 vs. 45,659 for non-buyers (statistically significant atthe .01 level).
Jolly (1991) - The mean size of community for buyers was 39,400 vs. 44,500for non-buyers (statistically significant at the .01 level).
Jolly (1991) - The more rural the community the more people are willing topay for organic produce.
Larger-Sized HouseholdJolly & Dhesi(1989)
0 Household size was not important as an explanatory variablebetween buyers and non-buyers of organic poultry.
Jolly (1991) - Willingness to pay for organic produce differs with income.Two-person household have the highest willingness to paywhen income is more than $30,000. Single households havethe highest for less than $30K income.
Buzby & Skees(1994)
0 Household size had no apparent effect on whether respondentswould pay more for increased reductions in pesticide exposure.
Food MarketingInstitute (1997)
- Single-person households were more concerned about theavailability of organic produce than multiple-personhouseholds.
Race (White)Ott (1990) + 69% of whites versus 54% of non-whites were willing to pay
higher prices for CPRF produce. Non-whites averaged lessfamily income than whites, but income was not significant inexplaining shoppers’ willingness to pay more.
Misra et al. (1991) + Whites were less price elastic than non-whites.Buzby & Skees(1994)
0 Race had no apparent effect on whether respondents wouldpay more for increased reductions in pesticide exposure.
Gender (Female)Jolly (1991) + Women are more willing to pay for organic produce than men.Buzby & Skees(1994)
+ Female respondents would pay more than male respondentsfor increased reductions in pesticide exposure.
Estes et al. (1994) + From a list of possible characteristics of the main consumersof organic produce, being a woman tied 2nd with highdisposable income (both followed being an environmentaladvocate).
EIP Review Institute for Public Policy and Business Research Page 30
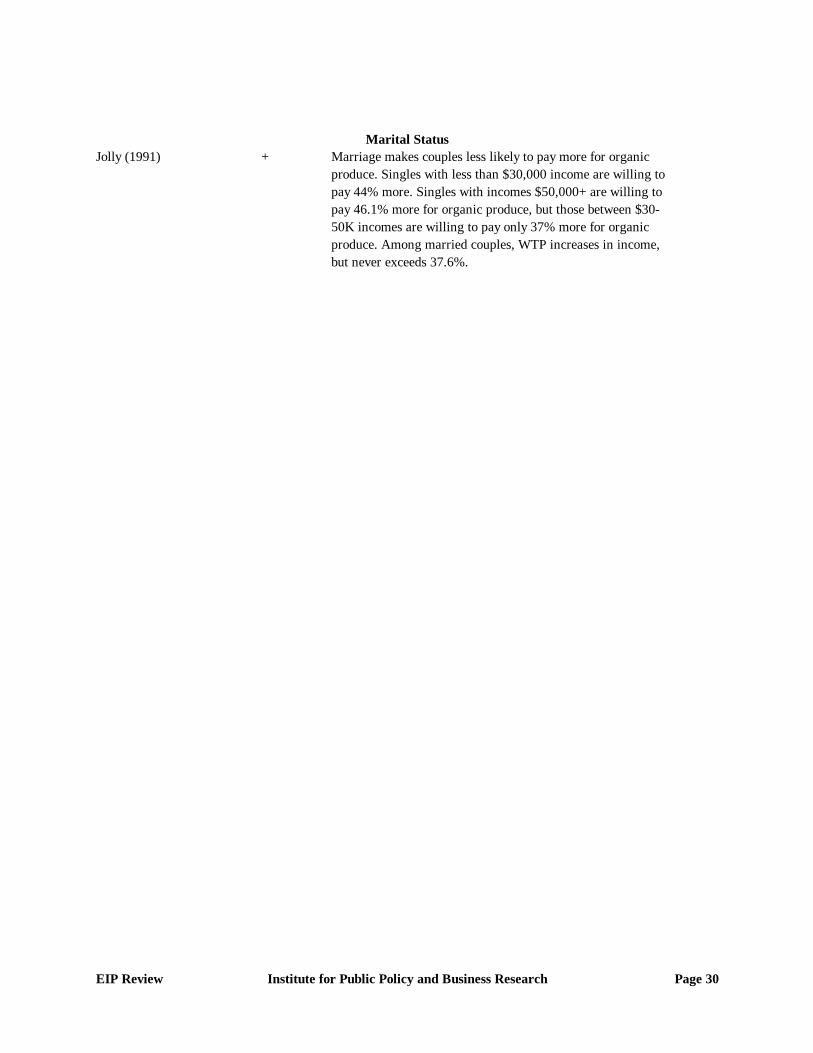
Marital StatusJolly (1991) + Marriage makes couples less likely to pay more for organic
produce. Singles with less than $30,000 income are willing topay 44% more. Singles with incomes $50,000+ are willing topay 46.1% more for organic produce, but those between $30-50K incomes are willing to pay only 37% more for organicproduce. Among married couples, WTP increases in income,but never exceeds 37.6%.

EIP Review Institute for Public Policy and Business Research Page 31
Table 1.2Psychographic Variables
Concern for pesticide residuesJolly & Dhesi(1989)
+ Buyers of organic produce have a higher concern for pesticideresidues than non-buyers.
Ott (1990) + 79% of shoppers who were “concerned” about pesticides werewilling to pay more for CPRF produce vs. 52% who were“unconcerned.”
Goldman &Clancy (1991)
+ Shoppers at a New York state organic food co-op rated“protection of consumers from pesticide residues in food”second out of a list of seven commonly-cited reasons forsupporting organic agriculture (rated 2.3 on a scale of 1 (leastimportant) to 4 (most important)).
Jolly (1991) + Buyers rated “concern for pesticide residues” 4.37 vs. non-buyers’ 3.92 on a scale of 1(not concerned) to 5 (veryconcerned); significant difference at the .01 level.
Jolly & Norris(1991)
+ 8 out of 12 respondents ranked organic produce as better thanconventional produce for chemical residues.
Bruhn et al.(1992)
15% of consumers with pesticide concerns actually purchasedorganic produce.
Sparling et al.(1992)
+ 30% of purchasers of organic produce cited concern forpesticide residues as their main reason for doing so. This wasthe most often-cited reason among purchasers for purchasingorganic produce. The second most often-cited reason wasconcern for health (21%), which could possibly be capturingadditional concern for residues.
The Packer (1996) + 12% of buyers bought organic produce for its lack ofchemicals.
Sachs et al. (1987) (p.99)“Pesticides may be perceived as having a negative impact on the environment and human health at some time inthe future, but theory also has a specific utility: the ability to promote the short-term welfare of humans. Pesticideshave been credited with keeping food prices low and the food supply abundant and dependable. They haveeradicated some insect pests and insect-borne diseases and are responsible for the high degree of visual perfectionin fruits and vegetables that consumers have come to expect in the supermarkets. It may be that concerns for healthand the environment, although real, are tempered by the perceived benefits of pesticides.”
Concern for artificial coloringJolly et al. (1989) + Buyers of organic produce had a statistically significant higher
level of concern for artificial coloring than non-buyers(significant at the .01 level).
Jolly (1991) + Buyers of organic poultry had a statistically significant higherlevel of concern for artificial coloring than non-buyers(significant at the .01 level).

EIP Review Institute for Public Policy and Business Research Page 32
Concern for additives and preservativesJolly et al. (1989) + Buyers of organic produce had a statistically significant higher
level of concern for additives and preservatives than non-buyers (significant at the .01 level).
Jolly (1991) + Buyers of organic poultry had a statistically significant higherlevel of concern for additives and preservatives than non-buyers (significant at the .01 level).
Concern for irradiation Jolly et al. (1989) + Buyers of organic produce had a statistically significant higher
level of concern for irradiation than non-buyers (significant atthe .01 level).
Jolly (1991) + Buyers of organic poultry had a statistically significant higherlevel of concern for irradiation than non-buyers (significant atthe .01 level).
Concern for environmentGoldman &Clancy (1991)
+ On a scale of 1 (least important) to 4 (most important),shoppers at a New York state organic food co-op includedconcerns for the environment as 4 items in a list of the top 7most often-cited reasons for supporting organic agriculture:Rank Score1st 3.0 Protection of wildlife and water supplies from pesticide
contamination. 2nd 2.3 Protection of drinking water supplies from fertilizer
contamination.4th 2.2 Conservation of non-renewable natural resources.6th 2.0 Preservation of the balance of nature on the farm.
Jolly & Norris(1991)
+ 7 out of 12 organic produce managers ranked organic produceas environmentally better than conventional produce, 5 out of12 said they were about the same.
Jolly & Norris(1991)
+ 10 out of 12 organic produce sellers said that customers feltorganic produce were environmentally better thanconventional produce.
Morgan et al.(1990)
+ 61.3% of organic produce sellers and 52.1% of non-organicproduce sellers rank better for the environment as one of "topthree reasons to sell organic produce."
Sparling et al.(1992)
+ 11% of organic produce purchasers indicated concern forenvironment as their main reason for purchasing organicproduce. This was the third most often-cited reason for doingso.
Tregear et al.(1994)
0 Concern for environment did not prove useful indifferentiating between buyers and non-buyers of organicproduce as over 90 percent of both groups were concernedabout the environment.
Tregear et al.(1994)
0 Only 9% of those buying organic produce indicated concernfor the environment as a reason for doing so.

EIP Review Institute for Public Policy and Business Research Page 33
Concern for health of farm workersGoldman &Clancy (1991)
+ On a scale of 1 (least important) to 4 (most important),shoppers at a New York state organic food co-op rated 7 often-cited reasons for supporting organic agriculture:Rank Score4th 2.2 Protection of farm workers from pesticide exposure.
Sparling et al.(1992)
0 Only 3% of organic produce purchasers indicated concern forthe health of farm workers as their main reason for purchasingorganic produce.
Concern for personal healthJolly & Dhesi(1989)
0 No significant difference between buyers and non-buyers oforganic produce.
Morgan et al.(1990)
+ Lower health risk was cited by handlers of organic produce asthe #1 reason for selling organic produce.
Morgan et al.(1990)
+ 75.8% (#1) of organic produce sellers and 39.4% (#3) of non-organic produce sellers rank lowers health risk as one of "topthree reasons to sell organic produce."
Sparling et al.(1992)
+ 21% of organic produce purchasers indicated concern forhealth as their main reason for purchasing organic produce.
Tregear et al.(1994)
+ 65% of UK consumers who buy organic do so out of concernfor health.
The Packer (1996) + 16% say they chose organic produce for health reasons.van Ravenswaay &Hoehn (1990)
+ Willingness to pay for Alar-free apples increased withpeople’s concern about Alar. The EPA Alar announcementdummy variable had a significant and negative effect ondemand for conventional apples.

EIP Review Institute for Public Policy and Business Research Page 34
Table 1.3Behavioral Variables
Take action on environmental issuesEstes et al. (1994) + 4th reason given by buyers for why shoppers want organic
produce (followed taste, nutrition, and freshness).Estes et al. (1994) + Buyers said the most typical organic produce consumer was
the environmental advocate.Tregear et al.(1994)
+ 75% of buyers of organic produce vs. 43 percent of non-buyersundertook activities out of concern for “green issues.”
Avoid/Purchase specific food purchases on ethical groundsTregear et al.(1994)
0 Only 7% of buyers and non-buyers alike avoided specific foodpurchases on ethical grounds.
Avoid/Purchase specific food purchases on health groundsvan Ravenswaay &Hoehn (1990)
+ The EPA Alar announcement dummy variable had asignificant and negative effect on demand for conventionalapples.
Conklin et al.(1991)
+ About half of all respondents reported altering their foodpurchasing habits because of food safety concerns: 8% saidthey avoided conventionally-grown produce and 8% reducedproduce purchases, 4% bought pesticide-free produce.
Morgan et al.(1990)
+ 53.2% (#3) of organic produce sellers and 66.2% (#1) of non-organic produce sellers rank Customers want OrganicProduce as one of the "top three reasons to sell organicproduce."
van Ravenswaay &
Hoehn (1991b)+ To avoid pesticide residues, 29.8% of respondents grow their
own produce; 23% avoid imported produce; 11.1% buy foodtested for pesticide residues; 10.7% buy organic food.
Bruhn et al.(1992)
+ Of consumers who volunteered pesticide concerns (48%), 15%changed their purchasing behavior by buying organic producevs. 2% who did not volunteer pesticide concerns.
Weaver et al.(1992)
+ 43% changed their purchasing behavior due to pesticideconcerns. 41% now buy more organic; 22% buy less produce;28% buy produce cited in the media; 5% grow their ownproduce.
Estes et al. (1994) + 5th reason that buyers give for why shoppers buy organicproduce (follows taste, nutrition, freshness, andenvironmentalism).
Tregear et al.(1994)
0 Approximately 60 percent of both purchasers and non-purchasers of organic produce avoided specific food purchaseson health grounds.
The Packer (1996) + 16% say they chose organic produce for health reasons.Park & Lohr(1996)
0 The NutriClean program and the Alar scare had small andinsignificant coefficients for demand for organic carrots,broccoli, and lettuce.

EIP Review Institute for Public Policy and Business Research Page 35
Table 1.4Consumer Attitudes Toward Organic produce
Acceptance of insect damage and cosmetic defectsLin et al. (1986) - Scale is from 0-3.5 to indicate degree of limitation of factor on
organic and PRF markets:Handlers gave a rating of slightly more than 1.5.Nonhandlers rated appearance as a limiting factor with 2.5.In ordered Logit Model regression of importance onpreference indicator, appearance’s t-value is -1.787, i.e., factoris less important as organic/PRF produce is more preferred.
Bunn (1990) 0 Respondents were less likely to purchase oranges that wereblemished unless the blemishes were due to lack of pesticideuse.
Ott (1990) - 61.5% of respondents were unwilling to accept any decline incosmetic quality when purchasing CPRF produce.
Ott (1990) - 88.4% of respondents were unwilling to accept insect damageon CPRF produce.
Goldman &Clancy (1991)
0 Effect of blemishes on buyers’ purchases of organic producenegative, but only slight. Clear positive relationship betweenacceptance of insect damage and surface blemishes andpurchases of organic produce.
Jolly & Norris(1991)
- 11 out of 12 chains which carry organic produce rate theirappearance as worse than conventional produce. Perceivedcustomer attitudes is the same.
van Ravenswaay &
Hoehn (1991b)- 11.9% of respondents were willing to accept pest-damaged
apples as long as there were no pesticide residues.
Sparling et al.(1992)
0 Only 3 percent of non-buyers of organic produce citedappearance as a reason for not buying organic produce.
Sparling et al.(1992)
0 About half of all respondents rated appearance of organic andconventional produce the same.
Estes et al. (1994) + A lesser reason (ranked 6th) given by buyers for why shopperswant organic produce.
Estes et al. (1994) - Weakest reason given by buyers for why shoppers do not buymore organic produce. Frequency = 29 out of 331.
Estes et al. (1994) - Weakest reason among all reasons given by buyers for whyconsumers do not buy more organic produce.
Tregear et al.(1994)
0 3 percent of U.K. respondents cited appearance as a reason fornot purchasing organic produce.
Acceptance of insect damage and cosmetic defectsEducation
Ott (1990) + College-educated more willing to accept cosmetic defects andinsect damage than non-college-educated.
IncomeOtt (1990) + As income level rose, respondents’ willingness to accept
cosmetic defects increased.

EIP Review Institute for Public Policy and Business Research Page 36
Gender (Female)Ott (1990) - 48% of men vs. 34% of women were willing to accept
cosmetic defects when purchasing organic produce.Concern for pesticides
Ott (1990) + 18% of shoppers who expressed “concern” for pesticide usewere willing to accept insect damage on CPRF produce vs. 6%who were unconcerned.
TasteJolly & Dhesi(1989)
0 No significant difference in ranking of the importance offlavor when selecting produce between buyers and non-buyersof organic produce.
Morgan et al.(1990)
+ Better taste was given as one of the top three reasons to sellorganic produce by about 10% of handlers and non-handlersof organic produce.
Jolly & Norris(1991)
0 11 out of 12 organic produce managers thought organicproduce and conventional produce were about the same forflavor.
Morgan et al.(1990)
+ #8 & #9 reason for experienced and inexperienced organicproduce sellers, respectively to sell organic produce: tastesbetter.
Sparling et al.(1992)
+ Taste was the third most often-cited reason for buying organicproduce by purchasers of organic produce (17 %).
Sparling et al.(1992)
0 About half of all respondents rated the flavor of organic andconventional produce the same.
Estes et al. (1994) + #1 reason given by buyers for why shoppers want organicproduce.
The Packer (1996) + 15% of those purchasing organic produce cited taste as areason.
FreshnessSparling et al.(1992)
0 About half of all respondents rated the in-store freshness oforganic and conventional produce the same.
Estes et al. (1994) + #3 reason that buyers gave for why their customers wantorganic produce. (This was #1 reason buyers want localproduce.)
Estes et al. (1994) - Shorter shelf life was a weak reason given by buyers for whyconsumers do not buy more organic produce. Frequency was39 out of 331.
The Packer (1996) + 17% of those purchasing organic produce cited freshness as areason.
Keeping qualitiesJolly & Norris(1991)
- 9 out of 12 organic produce managers rated shelf life as worsethan conventional produce's.
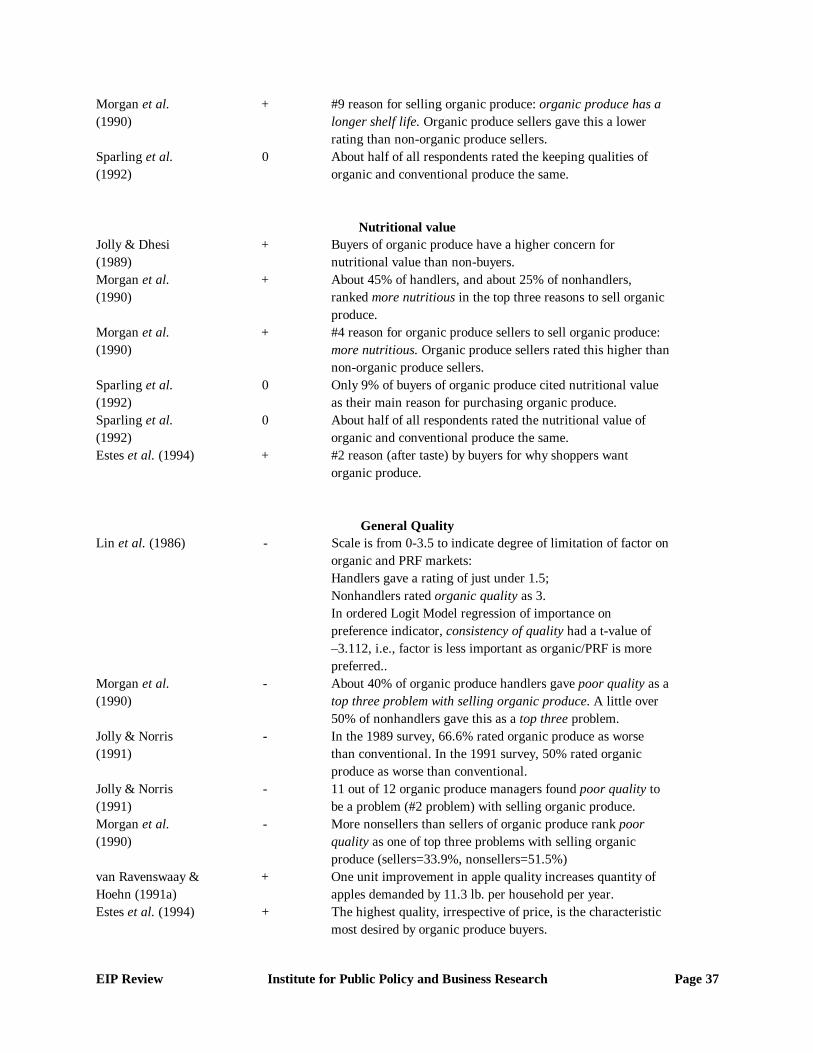
EIP Review Institute for Public Policy and Business Research Page 37
Morgan et al.(1990)
+ #9 reason for selling organic produce: organic produce has alonger shelf life. Organic produce sellers gave this a lowerrating than non-organic produce sellers.
Sparling et al.(1992)
0 About half of all respondents rated the keeping qualities oforganic and conventional produce the same.
Nutritional valueJolly & Dhesi(1989)
+ Buyers of organic produce have a higher concern fornutritional value than non-buyers.
Morgan et al.(1990)
+ About 45% of handlers, and about 25% of nonhandlers,ranked more nutritious in the top three reasons to sell organicproduce.
Morgan et al.(1990)
+ #4 reason for organic produce sellers to sell organic produce:more nutritious. Organic produce sellers rated this higher thannon-organic produce sellers.
Sparling et al.(1992)
0 Only 9% of buyers of organic produce cited nutritional valueas their main reason for purchasing organic produce.
Sparling et al.(1992)
0 About half of all respondents rated the nutritional value oforganic and conventional produce the same.
Estes et al. (1994) + #2 reason (after taste) by buyers for why shoppers wantorganic produce.
General QualityLin et al. (1986) - Scale is from 0-3.5 to indicate degree of limitation of factor on
organic and PRF markets:Handlers gave a rating of just under 1.5;Nonhandlers rated organic quality as 3.In ordered Logit Model regression of importance onpreference indicator, consistency of quality had a t-value of–3.112, i.e., factor is less important as organic/PRF is morepreferred..
Morgan et al.(1990)
- About 40% of organic produce handlers gave poor quality as atop three problem with selling organic produce. A little over50% of nonhandlers gave this as a top three problem.
Jolly & Norris(1991)
- In the 1989 survey, 66.6% rated organic produce as worsethan conventional. In the 1991 survey, 50% rated organicproduce as worse than conventional.
Jolly & Norris(1991)
- 11 out of 12 organic produce managers found poor quality tobe a problem (#2 problem) with selling organic produce.
Morgan et al.(1990)
- More nonsellers than sellers of organic produce rank poorquality as one of top three problems with selling organicproduce (sellers=33.9%, nonsellers=51.5%)
van Ravenswaay &Hoehn (1991a)
+ One unit improvement in apple quality increases quantity ofapples demanded by 11.3 lb. per household per year.
Estes et al. (1994) + The highest quality, irrespective of price, is the characteristicmost desired by organic produce buyers.
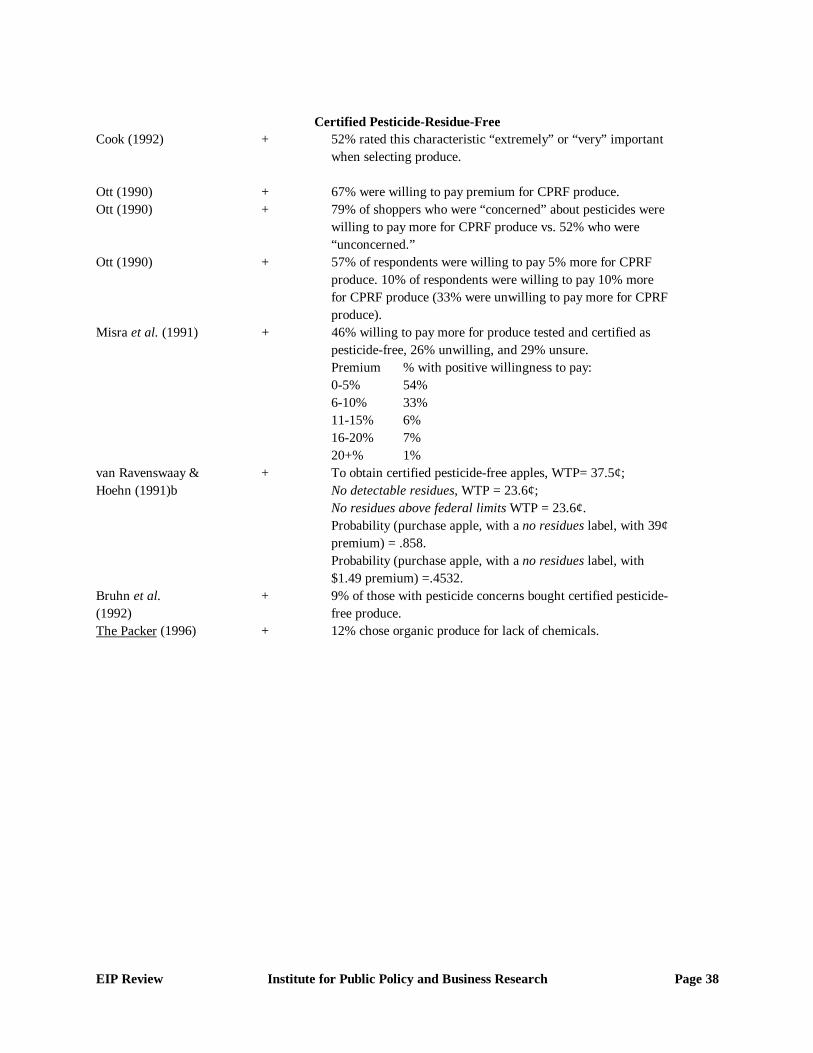
EIP Review Institute for Public Policy and Business Research Page 38
Certified Pesticide-Residue-FreeCook (1992) + 52% rated this characteristic “extremely” or “very” important
when selecting produce.
Ott (1990) + 67% were willing to pay premium for CPRF produce.Ott (1990) + 79% of shoppers who were “concerned” about pesticides were
willing to pay more for CPRF produce vs. 52% who were“unconcerned.”
Ott (1990) + 57% of respondents were willing to pay 5% more for CPRFproduce. 10% of respondents were willing to pay 10% morefor CPRF produce (33% were unwilling to pay more for CPRFproduce).
Misra et al. (1991) + 46% willing to pay more for produce tested and certified aspesticide-free, 26% unwilling, and 29% unsure.Premium % with positive willingness to pay:0-5% 54%6-10% 33%11-15% 6%16-20% 7%20+% 1%
van Ravenswaay &Hoehn (1991)b
+ To obtain certified pesticide-free apples, WTP= 37.5¢; No detectable residues, WTP = 23.6¢; No residues above federal limits WTP = 23.6¢.Probability (purchase apple, with a no residues label, with 39¢premium) = .858.Probability (purchase apple, with a no residues label, with$1.49 premium) =.4532.
Bruhn et al.(1992)
+ 9% of those with pesticide concerns bought certified pesticide-free produce.
The Packer (1996) + 12% chose organic produce for lack of chemicals.

EIP Review Institute for Public Policy and Business Research Page 39
Table 1.5Price and Price-Related Characteristics
PriceJolly & Norris(1991)
- 9 out of 12 thought that high prices were a problem withcarrying organic produce. (#3 ranked in top three problemswith carrying organic produce.)
Morgan et al.(1990)
+ 76.6% of organic produce sellers use same/lower markup fororganic produce: 53.2%=same, 23.4%=lower markup. Only23.4% use higher markup.
Morgan et al.(1990)
- Non-organic, but interested, sellers of organic produce rankedtoo expensive as the #1 problem with selling organic produce.
Morgan et al.(1990)
+ 80.6% of organic produce sellers and 72.7% of non-organicproduce sellers ranked too expensive as one of top threeproblems with selling organic.
Sparling et al.(1992)
- Price was the second most often-cited reason for not buyingorganic produce among non-buyers (34%).
Estes et al. (1994) - Higher price ranked 1st among buyers’ reasons why consumersdo not buy more organic produce.
Tregear et al.(1994)
- Both buyers and non-buyers of organic produce perceivedorganic produce as being expensive. Among non-buyers oforganic produce, price was cited most often as the reason fornot purchasing organic produce.32% of those who do not buy organic produce have a priceconcern.
The Packer (1996) - The second mentioned reason for not purchasing organicproduce was price (28%). 46% of all respondents say they seekgood prices when choosing produce.
Govindasamy &Italia (1997a)
0 Dummy variable for those who frequently purchase organicproduce was not useful in predicting which consumers aresensitive to price.
Price Elasticity of DemandGood Elasticity
Park & Lohr(1996)
Broccoli 1.7% increase when wholesale cost drops 1%.
Park & Lohr(1996)
Carrot 2.4% increase when wholesale cost drops 1%.
Park & Lohr(1996)
Carrot 1.2% when wholesale cost drops 1%.
Park & Lohr(1996)
Carrot 0.4% increase when margin between organic and conventionalwholesale price increases 1%.
Park & Lohr(1996)
Broccoli 0.2% increase when margin between organic and conventionalwholesale price increases 1%.
Park & Lohr(1996)
Carrot 0.8% decrease, when conventional farm price increases.

EIP Review Institute for Public Policy and Business Research Page 40
Park & Lohr(1996)
Broccoli 0.3% decrease, when conventional farm price increases.
Park & Lohr(1996)
Lettuce 0.2% decrease, when conventional farm price increases.
Willingness to payJolly et al. (1989) WTP for organic produce: Apples, peaches, broccoli, and
carrots: 30¢ per lb.; Chicken: 80¢ per lb.; Pork, beef, eggs:90¢ per lb.
Morgan et al.(1990)
On average, experienced organic produce handlers thoughtcustomers would pay about 30% more – non-handlers thoughtabout 20% more.
Ott (1990) 57% of respondents were willing to pay 5% more for CPRFproduce. 10% of respondents were willing to pay 10% morefor CPRF produce. (33% were unwilling to pay more forCPRF produce.)
Ott (1990) 69% of whites versus 54% of non-whites were willing to payhigher prices for CPRF produce. Non-whites averaged lessfamily income than whites, but income was not significant inexplaining shoppers' willingness to pay more.
Ott (1990) 79% of shoppers who were “concerned” about pesticides werewilling to pay more for CPRF produce vs. 52% who were“unconcerned.”
Ott (1990) 67% were willing to pay a premium for CPRF produce.Ott (1990) 79% of shoppers who were “concerned” about pesticides were
willing to pay more for CPRF produce vs. 52% who were“unconcerned.”
van Ravenswaay &Hoehn (1990)
WTP to avoid Alar = $1.26 per capita, or $.12/lb.
Conklin et al.(1991)
Organic characteristic is the primary determinant of price paidfor produce. Willing to pay premium for organic.
Jolly (1991) Those with college and graduate degrees are willing to pay themost for organic produce, more than those less educated.There is no trend with education, income, and WTP.
Jolly (1991) WTP is higher among women than men; higher amongsmaller households; higher in income; higher the less urbanthe location.
Misra et al. (1991) As concern for pesticide residue increases, so does willingnessto pay.
Morgan et al.(1990)
+ Cite: Harris Poll (1989) 49% of Americans would pay morefor organic produce.
Morgan et al.(1990)
+ Cite: Franco (1989) Premiums on organic broccoli frequentlyexceeded 100%. Market is fragmented (premia are notconsistent).
Weaver et al.(1992)
81 % of respondents had a positive WTP for pesticide-freeproduce:25% up to 5% more;31% up to 10% more;

EIP Review Institute for Public Policy and Business Research Page 41
26% up to 15% more.Buzby & Skees(1994)
Consumers were willing to pay an average of 15 to 69 centsabove the 50-cent purchase price for grapefruit for a lower riskof exposure to pesticide residues.
Buzby & Skees(1994)
Younger respondents were willing to pay more for increasedreductions in pesticide exposure than older respondents.
Buzby & Skees(1994)
Less highly educated respondents were willing to pay more forincreased reductions in pesticide exposure than more educatedrespondents.
Buzby & Skees(1994)
Income, race, and household size had no apparent effect onwhether respondents would pay more for increased reductionsin pesticide exposure.
Buzby & Skees(1994)
Female respondents were willing to pay more for increasedreductions in pesticide exposure than male respondents.
The HartmanGroup (1996)
13% of the population is willing to pay a premium for organicfoods.
Harris (1997) Average WTP premium for organic baby food is $.21/jar.

EIP Review Institute for Public Policy and Business Research Page 42
Table 1.6Other Factors Influencing the Purchase of EIPs
InformationZellner & Degner(1989)
+ Exposure to info (Des Moines dummy) increased all models’WTP.
Weaver et al.(1992)
- Lack of info given (22%) for why habits haven’t changed dueto pesticide concerns.
Estes et al. (1994) - Lack of information ranked 2nd among buyers reasons for whyconsumers do not buy more organic produce.
Goldman & Clancy (1991)
“A greater consumer understanding of the costs and benefits of food production systems might increase markets fororganic produce because educated consumers tend to make food choices that not only enhance their own health butalso contribute to the protection of natural resources.”
The Hartman Group (1996)
“Given consumers’ limited knowledge about environmental issues, it is difficult for them to make the linkagebetween various farming techniques and a personal benefit.”
LabelingJolly & Norris(1991)
- 9 out of 12 organic produce managers found a lack ofstandards/grading as a problem in carrying organic produce.(Ranked as #3 among top three problems.)
Morgan et al.(1990)
- More organic produce sellers ranked this as one of top threeproblems with selling organic (50% vs. 33.3% for handlers).
van Ravenswaay &Hoehn (1991a)
+ Labels indicating that apples met federal standards forpesticide residues increased quantity demanded by 11.7 lbs.per household. Label indicating no detectable residues furtherincreased quantity demanded by 6.12 lb. per householdAve. premium per lb. for apples with labels indicatingcompliance with federal standards for residues was 23.6¢/lb.WTP premium for apples certified pesticide-free was 37.5¢/lb.@ 79¢/lb. for apples:Prob(purchase no label apple)=.59; Prob(fed label)=.69;Prob(no pesticide)=.74.@$1.49/lb for apples:Prob(purchase no label apple)=.30; Prob(fed label)=.40;Prob(no pesticide)=.45.
Buzby & Skees(1994)
+ 90% of respondents felt that all produce should be clearlylabeled with information on pesticide use.
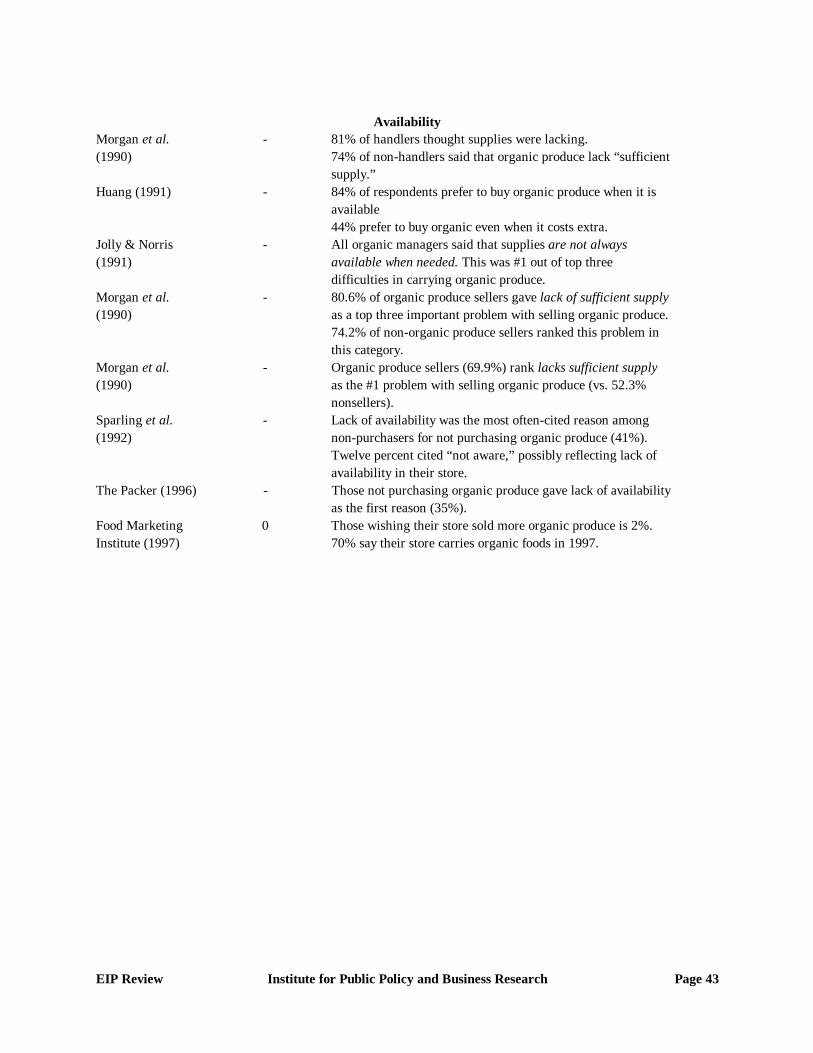
EIP Review Institute for Public Policy and Business Research Page 43
AvailabilityMorgan et al.(1990)
- 81% of handlers thought supplies were lacking.74% of non-handlers said that organic produce lack “sufficientsupply.”
Huang (1991) - 84% of respondents prefer to buy organic produce when it isavailable44% prefer to buy organic even when it costs extra.
Jolly & Norris(1991)
- All organic managers said that supplies are not alwaysavailable when needed. This was #1 out of top threedifficulties in carrying organic produce.
Morgan et al.(1990)
- 80.6% of organic produce sellers gave lack of sufficient supplyas a top three important problem with selling organic produce.74.2% of non-organic produce sellers ranked this problem inthis category.
Morgan et al.(1990)
- Organic produce sellers (69.9%) rank lacks sufficient supplyas the #1 problem with selling organic produce (vs. 52.3%nonsellers).
Sparling et al.(1992)
- Lack of availability was the most often-cited reason amongnon-purchasers for not purchasing organic produce (41%).Twelve percent cited “not aware,” possibly reflecting lack ofavailability in their store.
The Packer (1996) - Those not purchasing organic produce gave lack of availabilityas the first reason (35%).
Food MarketingInstitute (1997)
0 Those wishing their store sold more organic produce is 2%.70% say their store carries organic foods in 1997.

EIP Review Institute for Public Policy and Business Research Page 44
APPENDIX 2: Notes on Reviewed Studies
Basker (1992)
Samples of organically and conventionally-grown fruits and vegetables were compared using tastepanels of consumers. There were 32-66 assessors per variety. There was a total of 460 assessmentsof 29 samples for a total of 1600 responses. Responses were then tested for significance and thosethat were significant were used to predict hedonically people’s preferences. The study took place inIsrael and all produce was locally-produced.
Bruhn et al. (1992)
479 interviews were conducted in 14 cities in CA. The markets were selected randomly.
Bunn (1990)
229 shoppers in northern and southern CA were surveyed at 12 stores. Respondents evaluatedphotographs of oranges with varying degrees of cosmetic imperfection. Respondents were askedwillingness to buy with and without information about pesticide residues.
Buzby and Skees (1994)
A national telephone survey was followed by a mail questionnaire of 3,228 primary food purchaserswho purchased fresh grapefruit for their households in the past year. The telephone survey providedthe initial sample with a response rate of 65 percent. Or the 2,197 who were willing to participate inthe follow-up mail questionnaire, 1,671 responded for a response rate of 76 percent. Respondentswere similar in profile to the U.S. population in income, race, and education, but there were morewomen than men (which was expected because women are more likely to be the primary foodshoppers).
Byrne et al. (1994)
A mail survey of 9,000 randomly-selected households was conducted on the Delmarva Peninsula(Delaware, Eastern Shore of Maryland, and two counties in Virginia). The response rate was 10.9%.Individual demographic variables were not significant in determining whether the individual wouldbe concerned about pesticide residues, but psychographic classification was significant. Consumerswho were concerned to very concerned about pesticide residues were 37% more likely to shop at asupermarket with higher-priced pesticide-residue-free produce. Consumers who rated price to beimportant in their food purchasing decision were 15% less likely to shop at a supermarket with higherpriced pesticide-residue-free produce. People who rated healthfulness as important to very important

EIP Review Institute for Public Policy and Business Research Page 45
in their food purchasing decisions were 17% more likely to shop at a supermarket with higher pricedpesticide-residue-free produce. Flavor and freshness were not significant factors in determining thelikelihood of shopping at a supermarket with higher priced pesticide-residue-free produce. Over 23%of the sample consumers had probabilities less than 50% of shopping at supermarkets offering higher-priced produce.
Conklin et al. (1991)
The authors surveyed AZ retail outlets for 12 weeks in 1991.
Conklin (1993)
This study used the same data as above, but a full 18 weeks of data were used. Eight types of produce were studied: tomato, potato, sweet pepper, carrot, leaf and iceberg lettuce,and apples and grapes (these six vegetables represent 90% of fresh vegetable consumption). Five stores were surveyed: chain supermarkets, a specialty grocer, and a local co-op. Three out offive stores carried organic produce, giving 90 nonorganic observations and 54 organic observations.
Cook (1992)
Consumer focus groups conducted in 1990 in Davis, CA, Sacramento, CA, Berkeley, CA, Chicago,IL, Washington, D.C., and Bangor, ME were used to collect consumer data on factors indicated byconsumers as influencing produce purchases. No information was given as to the size of focus groupsor how the participants were selected.
Estes et al. (1994)
Thirteen North Carolina supermarket operations and three organic wholesalers were interviewed.Respondents were asked to evaluate aspects of the market and to provide suggestions for ways thatgrowers could improve the market.
Food Marketing Institute (1995)
2,204 telephone interviews were conducted in 1995. Two survey versions were used.
Food Marketing Institute (1997)
2,029 telephone interviews were conducted in 1997. Two survey versions were used.

EIP Review Institute for Public Policy and Business Research Page 46
Goldman & Clancy (1991)
A 1988 survey of shoppers was conducted at a food cooperative in New York state. The survey wasgiven to shoppers as they checked out, and they were asked to return the survey by mail in a pre-addressed, stamped envelope. Three hundred fifty shoppers responded for a response rate of 87.5percent. Organically-grown produce at this co-op was from 25 percent to over 100 percent moreexpensive than conventionally-grown produce. Cooperative shoppers differ from the generalpopulation in that they prefer nutrient-dense foods and are more interested in the political aspects offood production. Questions about the importance of general appearance (size, shape, color, andfreshness) in the purchase of fresh fruits and vegetables were included in the survey but did not forma reliable scale. Produce appearance may affect organic produce purchases to some extent, but theinfluence does not seem to be large for most consumers. Acceptance of insects and surface blemisheson produce was very positively related to organic produce purchases, and a clear relationship wasseen between specific attributes of produce appearance and respondents’ stated willingness topurchase residue-free produce. A greater consumer understanding of the costs and benefits of foodproduction systems might increase markets for organic produce because educated consumers tendto make food choices that not only enhance their own health but also contribute to the protection ofnatural resources.
Huang (1991)
This article provides a general overview of how people view food risk.
Jolly & Dhesi (1989)
A four-wave mailing received 54% response -- 946 completed responses. The study sought to definedifferences between buyers and non-buyers of organic produce. Jolly & Dhesi found no strongeconomic, attitudinal, or demographic differences between the groups.
Jolly et al. (1989)
A mailing survey produced 1769 completed questionnaires (54% response rate). The data used forthis paper covers Sept-Oct, 1989. Attitudes towards organic produce and pesticides were queried.
Jolly (1991)
A mail survey of 1950 randomly-selected California households was conducted in Marin, Sacramento,and San Diego counties in September and October 1987. Fifty-four percent of the 1769 deliverablequestionnaires were completed and returned. No statistically significant monotonic trend differencesover time were detected, indicating non-responder bias was not a significant issue.

EIP Review Institute for Public Policy and Business Research Page 47
Jolly & Norris (1991)
In Fall, 1989 and Winter, 1991 surveys were sent to chain, retail outlets in California. Produce andmarketing managers were surveyed to learn of their perceptions and their customers’ perceptions oforganic produce. Of 37 chains surveyed, 16 returned usable survey forms (50% response rate.)Sixteen respondents represent 1405 stores.
Lane & Bruhn (1992)
The authors argue that consumers are concerned with finding the item at the store, prices of the item,prices of substitutes, prices of complements, attributes of the product (quality, size, freshness, howlong it will last, and the perceived safety of the food). Consumers will not change their behaviortoward purchasing conventional produce out of concern for food safety unless their level of cognitivedissonance is great enough to induce them to change. People will justify their habits either bydebunking the negative evidence, playing down the importance of the issue, overemphasizing otherkinds of dangers to life, or seek out social support. People also use denial and rationalization(dissonance) to cope with risk. This explains why even though consumers report a high level ofconcern for food safety, there is usually a low level of change in purchasing behavior in response tofood safety issues. Consumers accept the relative safety of conventionally-grown produce.
Lin et al. (1986)
Three SMSA’s (DC, Baltimore, & Richmond) were used. Thirty firms were used and both conjointand opinion surveys were completed. Tomato buyers were surveyed and then separated into twogroups: 16 who bought organic produce and 14 who did not. Respondents were asked to list 17constraints on the organic market, which fell into 4 categories: produce characteristics; supply costs;demand; operational logistics. As the buyers’ preference for organic tomatoes increased, theimportance of shelf life, discard rate, quality consistency, and appearance, as constraints on theorganic market, decreased. Logit model estimated the importance of a factor for preference oforganic over conventional produce. Conjoint analysis noted differences between buyers and non-buyers of organic produce. The conjoint analysis included 480 observations (16 ratings from 30respondents).
Misra et al. (1991)
The authors’ Georgia data includes surveys from 1989 of 389 households (67% response rate). Ofthese 168 had no blank answers on their survey forms and were used in regression models. Thissurvey found demographic statistics for price-premium elasticity: Whites are less elastic than non-whites. Those 60+ years of age are less elastic than those 36-60 years of age. College-educated aremore elastic.

EIP Review Institute for Public Policy and Business Research Page 48
Morgan et al. (1990)
This 1989 survey of New Jersey wholesalers and retailers of produce looked at both those who didand did not carry organic produce. A mail survey of 552 firms was conducted in NJ, whererespondents were asked to give experience in selling organic produce. A total of 201 usable responseswere received. Sixty-four respondents had handled organic produce, and 137 had not handled organicproduce. Only those interested in handling organic produce were included in the analysis of the groupof handlers who had not sold organic produce previously.
Produce type % premium of organic wholesale over LA terminal market price:Beans, Kentucky 62Beets 18Bok choy 65Broccoli 49Cabbage 37Carrots 88Cauliflower 104Celery 34Corn 125Cucumbers 55Eggplant, Globe 183Kale 158Lettuce, Iceberg 36Onion, yellow 97Peppers, Green Bell 89Potato, Russet (70-80 ct) 36Radish 9Squash, Zucchini 176Tomato, assorted 84
Morgan et al. (1990)
Authors break down reasons to sell organic by type of retail outlet. Organic-selling supermarkets,natural food stores, and wholesalers all give Expands Selection as the #1 reason. Organic-selling farmmarkets gave #1 reason as Better for the Environment. Conventional supermarkets gave #1 reasonas Expands Selection; conventional natural food stores and processors said, Customer Demand;conventional wholesalers said, Better for Environment; conventional farms said Competitive Tool.

EIP Review Institute for Public Policy and Business Research Page 49
Ott (1990)
Shoppers were interviewed from nine different supermarkets in Atlanta in areas with varying levelsof family income and education as they approached store entrances, with 315 respondents.
The Packer (1990)
Sixty percent of survey respondents reported that they had made no noticeable changes in theirpurchasing patterns despite high levels of concerns about residues, but 24 percent had, in fact,changed their purchasing patterns to reflect those concerns.
Park & Lohr (1996)
A mailing in Fall, 1989 received a 54% response rate from 1769 questionnaires sent out. Those ofnon-European descent (nonwhite) and younger population were under-represented, while womenwere over-represented. The authors estimated an econometric model of supply and demand ofbroccoli, carrots, and romaine. The objective was to ascertain whether it is demand or supplyvariables more at play in the organic produce market. The data came from the Organic Market Newsand Information Service (OMNIS) and the USDA. Supply variables considered were conventionalfarm price, seasonal effects, and weather. Demand effects (by wholesalers) included wholesale cost,NutriClean Program, personal income, Alar episode, and wholesale price margin. NutriClean and Alarwere not found significant for any product. For carrots and broccoli only demand factors weresignificant. Both supply and demand affect romaine. (So increasing wholesale demand would increaseequilibrium output for all three and increasing supply would increase romaine’s equilibrium output.)
Retail World (1994)
Twenty-two store attributes were ranked by shoppers: 99% of respondents desire quality produce.In saying why shoppers switched stores, 39% wanted lower prices, 25% wanted variety, 5% wantedbetter quality produce.
Sachs et al. (1987)
Bealer and Willits in 1968 documented public concerns about pesticides using a phone survey ofPennsylvanians. Sachs et al. duplicated the survey with a similar population using the same questionsin 1984. 605 people responsible for doing the food shopping for the house were interviewed.Attitudes had changed considerably. The greatest concern in both periods was for wildlife. The 1984sample was as concerned for safety of farmers and consumers as it was for the welfare of wildlife.

EIP Review Institute for Public Policy and Business Research Page 50
Tregear et al. (1994)
A nationwide mail survey was conducted with 150 randomly-selected supermarkets and 112randomly-selected wholefood shops throughout the UK which were known to carry organic food.The response rate was 53 percent from supermarkets and 67 percent from wholefood shops. Anadditional telephone survey of 242 randomly-selected people in the Edinburgh and Lothian districtwas conducted with a response rate of 63 percent.
van Ravenswaay & Hoehn (1990)
Demand was estimated for fresh apples for the NYC-Newark SMSA from 1980-89 Regressionanalysis done with the usual demographic variables and also price of substitute and dummies forarticles in the press on Alar.
van Ravenswaay & Hoehn 91-13 (1991a)
Contingent valuation WTP was estimated for reduced pesticide residues. Respondents were askedusing pictures of apples, with varying degrees of cosmetic damage, the quantity they would by atdifferent prices. A Tobit model was used. The data set used was the same as in van Ravenswaay &Hoehn (1991).
van Ravenswaay & Hoehn 91-18 (1991b)
A 2,200 household sample was purchased from Survey Samples, Inc. Mail surveys were sent to thesehouseholds and 906 were returned – 48% response rate. 681 questionnaires were used. The studylooked at willingness to pay for Certified Pesticide-Residue-Free apples.
Waugh (1928)
First hedonic approach to vegetable characteristics. Examined tomatoes, hot house cucumbers, andasparagus. Used sales lots for each to estimate characteristics explaining price received by growersas a way of explaining market value of attributes for consumers.
Weaver et al. (1992)
Face-to-face surveys were conducted at three retail outlets in State College, PA during November1990. Five hundred sixty interviews were completed.

EIP Review Institute for Public Policy and Business Research Page 51
Zellner & Degner (1989)
This study looked at demand for chicken and people’s willingness to pay for "safe" chicken that hasbeen made safe, not through organic techniques. Surveys were conducted by telephone in Spokane,Orlando, Des Moines, and Tucson in 1988. Five hundred eighty six surveys were completed. Threeforms of a questionnaire were used. Respondents were asked to evaluate chicken that had been madesafer through cleaner facilities, or chemical washing, or irradiation. Respondents were assured thateach process was safe and quality would be unaffected. Results showed that neither chemical norirradiation were acceptable unless prices were reduced. Consumers are willing to pay to reduce healthrisk through cleaner facilities and more care in processing.

EIP Review Institute for Public Policy and Business Research Page 52
REFERENCES
Beharrell, B.; and J.H. MacFie. 1991. Consumer Attitudes to Organic Foods. British Food Journal93(2), pp. 25-30.
Bruhn, Christine; Katherine Diaz-Knauf; Nancy Feldman; Jan Harwood; Genevieve Ho; ErnestineIvans; Laurel Kubin; Cathi Lamp; Mary Marshall; Susan Osaki; Gwendolyn Stanford; YvonneSteinbring; Isela Valdez; Eunice Williamsonn; and Evelyn Wunderlich. 1992. Consumer FoodSafety Concerns and Interest in Pesticide-Related Information. Journal of Food Safety. 12, pp.253-262.
Bunn, D.; L. Lynch; and R. Sommer. 1990. Consumer Acceptance of Cosmetically ImperfectProduce. The Journal of Consumer Affairs. Winter 1990. v. 24 (2). pp. 268-279.
Buzby, Jean C.; and Jerry R. Skees. 1994. Consumers Want reduced Exposure to Pesticides on Food.Food Review. 17(2)(May-August), pp. 19-26.
Byrne, Patrick J.; J. Richard Bacon; and Ulrich C. Toensmeyer. 1994. Pesticide residue concerns andshopping location likelihood. Agribusiness. 10(6), pp. 491-501.
Conklin, Neilson C.; Gary D. Thompson; and Lyle D. Riggs. 1991. Price Differentials for OrganicProduce. Tucson, AZ: University of Arizona Department of Agricultural Economics WorkingPaper #70 (July).
Cook, Roberta L. 1992. Consumer Demand for Food Safety-Oriented Marketing Labels: Implicationsfor Sustainable Agriculture. San Jose, CA: Proceedings from the California Weed Conference.
Estes, Edmund A.; José E. Herrera; and Marjorie Bender. 1994. Organic Produce Sales Within NorthCarolina: A Survey of Buyer Options. North Carolina State University Department ofAgricultural and Resource Economics ARE Report #11 (November).
Food Marketing Institute. 1995. Trends 95, Trends in the United States: Consumer Attitudes & theSupermarket 1995. Washington DC: Food Marketing Institute.
Food Marketing Institute. 1997. Trends 97, Trends in the United States: Consumer Attitudes & theSupermarket 1997. Washington DC: Food Marketing Institute.
Franco, Jacques. 1989. An Analysis of the California Market for Organically Grown Produce.American Journal of Alternative Agriculture. Vol. 4, No. 1.
Goldman, Barbara J.; and Katherine L. Clancy. 1991. A Survey of Organic Produce Purchases andRelated Attitudes of Food Cooperative Shoppers. American. Journal of Alternative Agriculture.6(2), pp. 89-95.
Govindasamy, Ramu; and John Italia. 1997a. Predicting the Influence of Demographic Characteristicson the Willingness to pay for Fresh Fruits and Vegetables: A Logistic Approach, Journal of FoodProducts Marketing, 4(4), pp. 25-38.
Govindasamy, Ramu; and John Italia. 1997b. Consumer Response to Integrated Pest Managementand Organic Agriculture: An Econometric Analysis, November, Report No. P-02137-2-97. StateUniversity of New Jersey - Rutgers Working Paper.
Harris, J. Michael. 1997. Consumers Pay a Premium for Organic Baby Foods. Food Prices. (May-August), pp. 13-16.
Harris Poll. 1989. Organic Gardening. Rodale Press. March 1989.

EIP Review Institute for Public Policy and Business Research Page 53
The Hartman Group. 1996. The Hartman Report, Food and the Environment: A Consumer’sPerspective. Bellevue, WA: The Hartman Group.
Huang, Chung L. 1991. Organic Foods Attract Customers for the Wrong Reasons. Choices. 6(3),pp. 18-21.
Jolly, Desmond A.; and Jagjit Dhesi. 1989. Psychographic, Demographic, and Economic FactorsAssociated with Organic Poultry Consumption. Papers of the Western Region HomeManagement Family Economics Educators Annual Conference. 29, pp. 57-60.
Jolly, Desmond A.; Howard G. Schutz; Katherine V. Diaz-Knouf; and Jagjeet Johal. 1989. OrganicFoods: Consumer Attitudes and Use. Food Technology. November, pp. 60-66.
Jolly, Desmond A. 1991. Determinants of Organic Horticultural Products Consumption Based on aSample of California Consumers. Acta Horticulturae. 295, pp. 141-148.
Jolly, Desmond A.; and Kim Norris. 1991. Marketing Prospects for Organic and Pesticide-FreeProduce. American Journal of Alternative Agriculture. Vol. 6, No. 4.
Lane, Silvia; and Christine M. Bruhn. 1992. Organic Foods: Their Demand Will Remain Low.Choices. First Quarter, p. 3.
Lin, B.H.; S. Payson; and J. Wertz. 1986. Opinions of Professional Buyers toward Organic Produce:A Case Study of Mid-Atlantic Market for Fresh Tomatoes. Agribusiness 12(1), pp. 89-97.
Misra, Sukant K.; Chung L. Huang; and Stephen L. Ott. 1991. Consumer Willingness to pay forPesticide-free Fresh Produce. Western Journal of Agricultural Economics. 16(2), pp. 218-227.
Morgan, J.; B. Barbour; and C. Greene. 1990. Expanding the Organic Product Niche: Issues andObstacles. Vegetables and Specialities Situation and Outlook Yearbook. Economic ResearchService, USDA. TVS-252.
Morris, P. M.; A. Resenfeld; and M. Bellinger. 1993. What Americans Think About Agrichemicals. A Nationwide Survey on Health, the Environment and Public Policy. Results ofa poll commissioned by Public Voice for Food and Health Policy. 32 pp.
Ott, Stephen L. 1990. Supermarket Shoppers Pesticide Concerns and Willingness to PurchaseCertified Pesticide-Residue-Free Fresh Produce. Agribusiness. 6(6), pp. 593-602.
The Packer. 1990. Fresh Trends 1990. Overland Park, KS: Vance Publishing Corporation.The Packer. 1996. Fresh Trends 1996. Overland Park, KS: Vance Publishing Corporation.Park, Timothy A.; and Luanne Lohr. 1996. Supply and Demand Factors for Organic Produce,
American Journal of Agricultural Economics. 78(August), pp. 647-655.Retail World. 1994. How US Consumers View the Supermarket: Good Points and Bad. Report on
the Food Marketing Institute Convention. May 23-27, pp. 6-7.Sachs, Carolyn; Dorothy Blair; and Carolyn Richter. 1987. Consumer Pesticide Concerns: A 1965
and 1984 Comparison. Journal of Consumer Affairs. 21(1)(Summer), pp. 96-107.Sparling, Ed; Karen Wilken; and John McKenzie. 1992. Marketing Fresh Organic Produce in
Colorado Supermarkets. Final Report to the Colorado Department of Agriculture and USDAFederal State Marketing Improvement Program. Fort Collins; CO. Colorado State UniversityDepartment of Agricultural and Resource Economics. March 16.
Tregear, A.; J.B. Dent; and M.J. McGregor. 1994. The Demand for Organically-Grown Produce.British Food Journal. 96(4), pp. 21-25.

EIP Review Institute for Public Policy and Business Research Page 54
van Ravenswaay, Eileen; and John P. Hoehn. 1990. The Impact of Health Risk on Food Demand: ACase Study of Alar and Apples. East Lansing, MI. Michigan State University Department ofAgricultural Economics Staff Paper #90-31 (June).
van Ravenswaay, Eileen; and John P. Hoehn. 1991a. Contingent Valuation and Food Safety: TheCase of Pesticide Residues in Food. East Lansing, MI. Michigan State University Department ofAgricultural Economics Staff Paper #91-13.
van Ravenswaay, Eileen; and John P. Hoehn. 1991b. Consumer Willingness to pay for ReducingPesticide Residues in Food: Results of a Nationwide Survey. East Lansing, MI. Michigan StateUniversity Department of Agricultural Economics Staff Paper #91-18 (March).
Waugh, Frederick 1928. Quality Factors Influencing Vegetable Prices. Journal of Farm Economics.10(1), pp. 185-196.
Weaver, Robert D.; David J. Evans; and A.E. Luloff. 1992. Pesticide Use in Tomato Production:Consumer Concerns and Willingness to pay. Agribusiness. 8(2) (March), pp. 131-142.
Zellner, James A.; and Robert L. Degner. 1989. Consumer Willingness to pay for Food Safety.Nashville, TN. Presented to the 1989 Southern Agricultural Economics Association Meeting.February.

EIP Review Institute for Public Policy and Business Research Page 55
INDEX
advertisements . . . . . . . . . . . . . . . . . . . . . . . . . . . . . . . . . . . . . . . . . . . . . . . . . . . . . . . . . . . . . 23age . . . . . . . . . . . . . . . . . . . . . . . . . . . . . . . . . . . . . . . . . . . . . . . . . . . . . . . . 5, 6, 15, 17, 28, 47agricultural chemicals . . . . . . . . . . . . . . . . . . . . . . . . . . . . . . . . . . . . . . . . . . . . . . . . . . . . 18, 19agricultural economics . . . . . . . . . . . . . . . . . . . . . . . . . . . . . . . . . . . . . . . . . . . . . . . . . . . . 52-54Alar . . . . . . . . . . . . . . . . . . . . . . . . . . . . . . . . . . . . . . . . . . . . . 10, 19, 23, 33, 34, 40, 49, 50, 54appearance . . . . . . . . . . . . . . . . . . . . . . . . . . . . . . . . . . . . . . . . . . . . . . . . . 7, 12, 13, 35, 46, 47availability . . . . . . . . . . . . . . . . . . . . . . . . . . . . . . . . . . . 1, 6, 8, 11-13, 15, 17, 23-26, 28, 29, 43barriers to consumption . . . . . . . . . . . . . . . . . . . . . . . . . . . . . . . . . . . . . . . . . . . . . . . . . . 1, 2, 23Beharrell, B. . . . . . . . . . . . . . . . . . . . . . . . . . . . . . . . . . . . . . . . . . . . . . . . . . . . . . . . . . 7, 13, 52Bruhn . . . . . . . . . . . . . . . . . . . . . . . . . . . . . . . . . . . . . . . . . . . . . . 19, 31, 34, 38, 44, 47, 52, 53Bruhn, Christine . . . . . . . . . . . . . . . . . . . . . . . . . . . . . . . . . . . . . . . . . . . . . . . . . . . . . . . . . . . 52Burress, David . . . . . . . . . . . . . . . . . . . . . . . . . . . . . . . . . . . . . . . . . . . . . . . . . . . . . . . . . . . . 1, 4Buzby, Jean C. . . . . . . . . . . . . . . . . . . . . . . . . . . . . . . . . . 8, 10, 15-17, 24, 27-29, 41, 42, 44, 52Byrne, Patrick J. . . . . . . . . . . . . . . . . . . . . . . . . . . . . . . . . . . . . . . . . . . . . . . . . . . . . . . . . 44, 52certification . . . . . . . . . . . . . . . . . . . . . . . . . . . . . . . . . . . . . . . . . . . . . . . . . . . . . . . . . . . . 24, 25certified pesticide-residue-free (CPRF) . . . . . . 8, 9, 15, 18, 19, 28, 29, 31, 35, 36, 38, 40, 50, 53community size . . . . . . . . . . . . . . . . . . . . . . . . . . . . . . . . . . . . . . . . . . . . . . . . . . . . . . 15, 16, 29Conklin, Neilson C. . . . . . . . . . . . . . . . . . . . . . . . . . . . . . . . . . . . . . . . . . . . . . 13, 34, 40, 45, 52conventional . . . . . . . . . . . . . . . . . . . . . . . . 2, 7-10, 12-16, 18-21, 25, 26, 31-37, 39, 40, 47-49conventional economic variables . . . . . . . . . . . . . . . . . . . . . . . . . . . . . . . . . . . . . . . . . . . . 2, 7, 8conventional produce . . . . . . . . . . . . . . . . . . . 9, 10, 12-16, 18, 20, 21, 25, 26, 31, 32, 35-37, 47conventionally . . . . . . . . . . . . . . . . . . . . . . . . . . . . . . . 5, 7-10, 12, 14, 19, 21, 23, 34, 44, 46, 47Cook, Roberta L. . . . . . . . . . . . . . . . . . . . . . . . . . . . . . . . . . . . . . . . . . . . . . . . . . . 18, 38, 45, 52correlates of organic produce consumption, behavioral . . . . . . . . . . . . . . . . . . . . . . . . . . 2, 7, 22cosmetic defects . . . . . . . . . . . . . . . . . . . . . . . . . . . . . . . . . . . . . . . . . . . . . . . . . . 12, 13, 35, 36demographic variables . . . . . . . . . . . . . . . . . . . . . . . 1-3, 7, 13, 15, 25, 27, 44, 46, 47, 50, 52, 53education . . . . . . . . . . . . . . . . . . . . . . . . . . . . . . . . . . . . . . . . . . . . 5-7, 15-17, 25, 27, 40, 44, 49Eicher, Sharon . . . . . . . . . . . . . . . . . . . . . . . . . . . . . . . . . . . . . . . . . . . . . . . . . . . . . . . . . . . . 1, 4environment . . . . . . . . . . . . . . . . . . . . . . . . . . . . . . . . . . . . . . . . . 1, 7, 18, 20, 21, 31, 32, 48, 53environmentalism . . . . . . . . . . . . . . . . . . . . . . . . . . . . . . . . . . . . . . . . . . . . . . . . . . . . . . . . . . . 34Estes, Edmund A. . . . . . . . . . . . . . . . . . . . 8, 9, 12-14, 16, 20, 21, 28, 29, 34-37, 39, 42, 45, 52family . . . . . . . . . . . . . . . . . . . . . . . . . . . . . . . . . . . . . . . . . . . . . . . . . 1, 5, 8, 24, 29, 40, 49, 53family size . . . . . . . . . . . . . . . . . . . . . . . . . . . . . . . . . . . . . . . . . . . . . . . . . . . . . . . . . . . . . 1, 5, 8farmers . . . . . . . . . . . . . . . . . . . . . . . . . . . . . . . . . . . . . . . . . . . . . . . . . . . . . . . . . . . . . . . 18, 49food avoidance . . . . . . . . . . . . . . . . . . . . . . . . . . . . . . . . . . . . . . . . . . . . . . . . . . . . . . . . . . . . 22food expenditures . . . . . . . . . . . . . . . . . . . . . . . . . . . . . . . . . . . . . . . . . . . . . . . . . . . 5, 9, 11, 29Food Marketing Institute . . . . . . . . . . . . . . . . . . . . . . . . . . 11, 17, 22, 24, 28, 29, 43, 45, 52, 53food scares . . . . . . . . . . . . . . . . . . . . . . . . . . . . . . . . . . . . . . . . . . . . . . . . . . . . . . . . . . . . . . . 19Franco, Jacques . . . . . . . . . . . . . . . . . . . . . . . . . . . . . . . . . . . . . . . . . . . . . . . . . . . . . . 10, 40, 52

EIP Review Institute for Public Policy and Business Research Page 56
freshness . . . . . . . . . . . . . . . . . . . . . . . . . . . . . . . . . . . . . . . . . . . . . . 5, 7, 12, 14, 34, 36, 45-47gender . . . . . . . . . . . . . . . . . . . . . . . . . . . . . . . . . . . . . . . . . . . . . . . . . . . . . . 5, 7, 15, 16, 29, 36Goldman, Barbara J. . . . . . . . . . . . . . . . . . . . . . . . 8, 9, 12, 13, 18, 20, 28, 31-33, 35, 42, 46, 52Govindasamy, Ramu . . . . . . . . . . . . . . . . . . . . . . . . . . . . . . . . . . . . . . . . . . . . . 8, 16, 23, 39, 52Harris, Brian . . . . . . . . . . . . . . . . . . . . . . . . . . . . . . . . . . . . . . . . . . . . . . . . . . . . . . . . . . . . . 1, 4Harris, J. Michael . . . . . . . . . . . . . . . . . . . . . . . . . . . . . . . . . . . . . . . . . . . . . . 9, 10, 40, 41, 52health . . . . . . . . . . . . . . . . . . . . . . . . . . . . . . . . . 7, 18-20, 25, 26, 31, 33, 34, 42, 46, 51, 53, 54health risks . . . . . . . . . . . . . . . . . . . . . . . . . . . . . . . . . . . . . . . . . . . . . . . . . . . . . . . . . . . . . . . 20hedonic regression models . . . . . . . . . . . . . . . . . . . . . . . . . . . . . . . . . . . . . . . . . . . . . . . . . 12, 50household income . . . . . . . . . . . . . . . . . . . . . . . . . . . . . . . . . . . . . . . . . . . . . . . . . . . . . . . 11, 28household size . . . . . . . . . . . . . . . . . . . . . . . . . . . . . . . . . . . . . . . . . . . . . . . . . . . . . 8, 11, 29, 41Huang, Chung L. . . . . . . . . . . . . . . . . . . . . . . . . . . . . . . . . . . . . . . . . . . . . . . . . . . 24, 43, 46, 53income . . . . . . . . . . . . . . . . . . . . . . . . . . . . . . . . 1, 5-9, 11, 13, 15, 25, 27-30, 35, 40, 41, 44, 49income elasticity . . . . . . . . . . . . . . . . . . . . . . . . . . . . . . . . . . . . . . . . . . . . . . . . . . . . . . . . . 8, 28information . . . . . . . . . . . . . . . . . . . . . . . . . . . . . . . . . . 1, 6-9, 15, 23, 24, 26, 42, 44, 45, 49, 52Jolly, Desmond A. . . . . . . . . . . . . . . . . . . . . . . . . . 8, 10-21, 24, 27-33, 35-37, 40, 43, 46, 47, 53Lane, Silvia . . . . . . . . . . . . . . . . . . . . . . . . . . . . . . . . . . . . . . . . . . . . . . . . . . . . . . . . . . . . 47, 53Lin, B. H. . . . . . . . . . . . . . . . . . . . . . . . . . . . . . . . . . . . . . . . . . . . . . . . . . . . . 12, 13, 37, 47, 53locally grown produce . . . . . . . . . . . . . . . . . . . . . . . . . . . . . . . . . . . . . . . . . . . . . . . . . 1, 5, 7, 44Lohr, Luanne . . . . . . . . . . . . . . . . . . . . . . . . . . . . . . . . . . . . . . . 8, 10, 19, 28, 34, 39, 40, 49, 53marketing . . . . . . . . . . . . . . . . . . . . . . . . . . . . . 2, 6, 7, 11, 17, 22-24, 28, 29, 43, 45, 47, 52, 53Misra, Sukant K. . . . . . . . . . . . . . . . . . . . . . . . . . . . . . . . . . . . . . . 15, 16, 27-29, 38, 40, 47, 53Morgan, J. . . . . . . . . . . . . . . . . . . . . 10, 12, 14, 20, 21, 24, 32-34, 36, 37, 39, 40, 42, 43, 48, 53Morris. P. . . . . . . . . . . . . . . . . . . . . . . . . . . . . . . . . . . . . . . . . . . . . . . . . . . . . . 9, 18, 23, 24, 53nutrition . . . . . . . . . . . . . . . . . . . . . . . . . . . . . . . . . . . . . . . . . . . . . . . . . . . . . . . . . . . . . . . . . 34occupational class . . . . . . . . . . . . . . . . . . . . . . . . . . . . . . . . . . . . . . . . . . . . . . . . . . . . . . . . 7, 15Ott, Stephen L. . . . . . . . . . . . . . . . . . . . . . 8, 9, 12, 13, 15, 18, 28, 29, 31, 35, 36, 38, 40, 49, 53Park, Timothy A. . . . . . . . . . . . . . . . . . . . . . . . . . . . . . . . . . . . . 8, 10, 19, 28, 34, 39, 40, 49, 53pesticides . . . . . . . . . 5, 8, 9, 12, 13, 15-20, 22-25, 27-29, 31-36, 38, 40-42, 44-46, 49, 50, 52-54pesticide-residue-free . . . . . . . . . . . . . . . . . . . . . . . . . . . . . . 8, 12, 15, 17, 18, 25, 44, 45, 50, 53price . . . . . . . . . . . . . . . . . . . . . . . . . . . . . . . 3, 5, 7-10, 12, 15, 25-29, 37, 39-41, 44, 47-50, 52price elasticity . . . . . . . . . . . . . . . . . . . . . . . . . . . . . . . . . . . . . . . . . . . . . . . . . . . . . . . . . . 10, 39proactivity . . . . . . . . . . . . . . . . . . . . . . . . . . . . . . . . . . . . . . . . . . . . . . . . . . . . . . . . . . . . . . . . 22produce buyers . . . . . . . . . . . . . . . . . . . 8, 9, 14-16, 18-25, 27-29, 31-37, 39, 42, 46, 47, 52, 53produce handlers . . . . . . . . . . . . . . . . . . . . . . . . . . . . . . . . . 20, 24, 26, 33, 35-37, 40, 42, 43, 48produce managers . . . . . . . . . . . . . . . . . . . . . . . . . . . 6, 10, 12-14, 20, 22, 24, 25, 32, 36, 37, 42psychographic variables . . . . . . . . . . . . . . . . . . . . . . . . . . . . . . . . . . 1-3, 7, 8, 15, 18, 31, 44, 53quality . . . . . . . . . . . . . . . . . . . . . . . . . . . . . . . . . . . . . . . . 7, 8, 12-14, 25, 35, 37, 47, 49, 51, 54race . . . . . . . . . . . . . . . . . . . . . . . . . . . . . . . . . . . . . . . . . . . . . . . . . . . . . . . . 5, 7, 15, 29, 41, 44Retail World . . . . . . . . . . . . . . . . . . . . . . . . . . . . . . . . . . . . . . . . . . . . . . . . . . . . . . . . . . . 49, 53retailers . . . . . . . . . . . . . . . . . . . . . . . . . . . . . . . . . . . . . . . . . . . . . . . . . . . . . . . . . . . . 10, 13, 48

EIP Review Institute for Public Policy and Business Research Page 57
Sachs, Carolyn . . . . . . . . . . . . . . . . . . . . . . . . . . . . . . . . . . . . . . . . . . . . . . . . . 18, 22, 31, 49, 53sensory variables . . . . . . . . . . . . . . . . . . . . . . . . . . . . . . . . . . . . . . . . . . . . . . . . . . . . . 2, 5, 7, 12shelf life . . . . . . . . . . . . . . . . . . . . . . . . . . . . . . . . . . . . . . . . . . . . . . . . . . . . . . . . . 14, 36, 37, 47Sparling, Ed . . . . . . . . . . . . . . . . . . . . . . . . . . . . . . . 13, 14, 19-21, 24, 31-33, 35-37, 39, 43, 53standards . . . . . . . . . . . . . . . . . . . . . . . . . . . . . . . . . . . . . . . . . . . . . . . . . . . . . . . . . . . . . . 24, 42taste (flavor) . . . . . . . . . . . . . . . . . . . . . . . . . . . . . . . . . . . . . . . . . . . 5, 7, 12, 14, 34, 36, 37, 44tastes (preferences) . . . . . . . . . . . . . . . . . . . . . . . . . . . . . . . . . . . . . . . . . . . . . . . 5, 8, 14-16, 36The Hartman Group . . . . . . . . . . . . . . . . . . . . . . . . . . . . . . . . . . . . . . . . . . . . . . . . . . 41, 42, 53The Packer . . . . . . . . . . . . . . . . . . . . . . . . . . . . . . 14, 19, 24, 31, 33, 34, 36, 38, 39, 43, 49, 53total household food expenditures . . . . . . . . . . . . . . . . . . . . . . . . . . . . . . . . . . . . . . . . . . . . . . . 9Tregear, A. . . . . . . . . . . . . . . . . . . . . . . . . . . . . . . . . . . . . . . 9, 13, 19, 20, 22, 32-35, 39, 50, 53van Ravenswaay, Eileen . . . . . . . . . . . 8, 10, 13, 17, 19, 22, 24, 28, 33-35, 37, 38, 40, 42, 50, 54Waugh, Frederick . . . . . . . . . . . . . . . . . . . . . . . . . . . . . . . . . . . . . . . . . . . . . . . . . . . . 12, 50, 54Weaver, Robert D . . . . . . . . . . . . . . . . . . . . . . . . . . . . . . . . . . . 9, 12, 22, 23, 34, 40, 42, 50, 54willingness to pay . . . . . . . . . . . . . . . . . . . . 1, 8-12, 15, 16, 18, 23-25, 27-29, 33, 38, 40, 50-54Zellner, James A. . . . . . . . . . . . . . . . . . . . . . . . . . . . . . . . . . . . . . . . . . . . . . . . . . . . . . 23, 51, 54

![Corrosion Mechanisms under Organic Coatingspublications.lib.chalmers.se/records/fulltext/148450.pdf · Corrosion Mechanisms under Organic Coatings ... [1,2]. The demands are not only](https://static.fdocuments.net/doc/165x107/5ad567857f8b9aff228d0ae5/corrosion-mechanisms-under-organic-mechanisms-under-organic-coatings-12.jpg)


