Is Impulse Buying Significant? Impact of Packaging and Shelf Positioning in Impulse Buying of FMCGs
DEMAND PLANNING ON SUPPLY CHAIN PERFORMANCE: A CASE
STUDY OF FMCGs IN KENYA
BY
HUMPHREY MURIGI AWANGA
UNITED STATES INTERNATIONAL UNIVERSITY-AFRICA
SPRING 2018

DEMAND PLANNING ON SUPPLY CHAIN PERFORMANCE: A CASE
STUDY OF FMCGs IN KENYA
BY
HUMPHREY MURIGI AWANGA
A Research Project Report submitted to Chandaria School of Business in
Partial fulfillment of the requirement for the Degree of Master in Business
Administration (MBA)
UNITED STATES INTERNATIONAL UNIVERSITY-AFRICA
SPRING 2018
ii
STUDENT’S DECLARATION
I, the undersigned declare that this is my original work and has not been submitted to any other
college, institution or university other than the United States International University- Africa
in Nairobi for academic credit.
Signed: __________________________________ Date: ________________________
Humphrey Murigi Awanga (ID: 650188)
This project has been presented for examination with my approval as the appointed supervisor
Signed: __________________________________ Date: _______________________
Professor Paul Katuse
Signed: ____________________________________Date: _______________________
Dean, School of Business

iii
ABSTRACT
The general objective of the study was to find out the contribution of demand planning towards
improving supply chain performance. Specifically, the study sought to achieve the following
specific objectives; To find out the role of forecasting towards inventory optimization; To find
out the role of supplier partnering towards inventory optimization; To find out the role of
demand planning towards Supply Chain cost reduction.
The researcher adopted descriptive and explanatory research designs. The target population for
this study was Fast Moving Consumer Goods located within Nairobi and Kiambu County. The
researcher adopted a stratified sampling technique.The target sample size for this study was 80
individuals holding positions in the target organisations.Primary data was aided by a research
assistant using a structured questionnaire.After Data collection,data was first coded into the
Statistical Package for the Social Sciences. Both descriptive statistical techniques and
inferential techniques were demployed for analysis. Inferences were drawn using correlation
and data was presented in tables, pie and bar charts.
From the findings the study found out that majority of the respondents indicated that supply
chains in their organizations perform forecasting and of the respondents who indicated that
their organizations’ supply chain perform forecasting majority indicated the forecasting
duration between 6-12 months. Concerning supplier collaboration, the findings found that
partnering among supply chain players enhanced the reliability of their supply chain by
ensuring that suppliers remained in stock of the required items. To enhance this reliability, the
supply chain partners need to continuously engage in early supplier involvement and
Collaborative Planning Forecasting and Replenishment activities. Further, the study found out
that Electronic data interchange, Collaborative Planning Forecasting and Replenishment, Early
Supplier Involvement and Supplier development influenced the reliability of the supply chain
to a large extent.
In terms of demand planning, the study found out that demand planning plays a critical role in
the reduction of the overall costs of a supply chain by enabling better visibility of supply chain
costs, reducing mismatch of processes along the supply chain and reducing uncertainties along
the supply chain.

iv
To improve supply chain performance, organizations need to incorporate forecasting to reduce
inventory holding and enhance inventory optimization and should incorporate Sales Inventory
and Operations Planning to enhance accuracy in forecasts and inventory holding. Concerning
supplier collaboration, organizations should pursue partnering and early supplier involvement
to increase supply chain reliability. In addition, organizations should participate in
Collaborative Planning and Forecasting, Supplier development and Electronic Data
Interchange to further enhance the reliability of their supply chains. Finally, to reduce and
improve visibility of supply chain costs, organizations should embrace demand planning from
which they are likely to also reduce mismatch of processes and clear uncertainties along the
supply chain. Another study which considers the economic background of respondents should
be carried out to corroborate the results of this study.
The study concludes that supply chains in their organizations perform forecasting and that
forecasting leads to a reduction in inventory holding in the organizations; that there is a direct
link between inventory forecasting and inventory; that Sales Inventory and Operations
Planning accurately guides the inventory quantities to carry at a given time and that Sales
Inventory and that Operations Planning improves the accuracy of forecasts generated.
The study recommends forecasting in inventory since forecasting is the epicenter of all Supply
Chain Management activities which triggers all other activities both within and outside the
organization. Forecasting is the key driving factor in planning and decision making in SCM as
well as enterprise level and that companies that companies that perform exceptionally well rely
on true numerical value of forecasting to make decisions in capacity building, resource
allocation, expansion, process scheduling among others.

v
ACKNOWLEDGEMENTS
Professor Paul Katuse has been the ideal supervisor. His advice, insightful criticism and patient
encouragement have aided the writing of this project in numerous ways.

vi
DEDICATION
This Project is dedicated to my parents as gratitude for the opportunity of an education from
the best institutions and support throughout my life.

vii
LIST OF ABBREVIATIONS
MRP I - Materials Requirement Planning.
MRP II- Manufacturing Resources Planning
DDMRP- Demand Driven Materials Requirement Planning.
ERP - Enterprise Resource Planning.
S&OP - Sales Inventory and Operations Planning.
SKU - Stock-Keeping Unit.
MTO - Made To Stock.
ATO - Assemble To Order.
JIT - Just In Time.
SCM - Supply Chain Management.
FMCG - Fast Moving Consumer Goods.
BT - British Telecom.
OOS - Out of Stock.
OEM - Original Equipment Manufacturer.
DFID - Department For International Development.
CPFR - Collaborative Planning Forecasting and Replenishment
IO - Inventory Optimization.
P&G - Proctor and Gamble.
viii
LIST OF FIGURES
Figure 2. 1: Illustrating the Bull Whip Effect (Demand Driven Institute, 2011) ...................... 9
Figure 2. 2: Components of DDMRP (Demand Driven Institute, 2011) ................................ 11
Figure 2. 3: Common Inventory Strategy (Demand Driven Institute, 2011) .......................... 20
Figure 2. 4: Multi Echelon Inventory Optimization (Demand Driven Institute, 2011) .......... 21
Figure 4. 1: Gender of Respondents ....................................................................................... 29
Figure 4. 2: Age Group of Respondents. ................................................................................ 29
Figure 4. 3: Marital Status of Respondents ............................................................................. 30
Figure 4. 4: Level of Education of Respondents ..................................................................... 30
Figure 4. 5: Category of Products Respondents deal in .......................................................... 31
Figure 4. 6: Level of Respondents’ Supply Chain Experience ............................................... 32
Figure 4. 7: Position respondents hold in Employment .......................................................... 32
Figure 4. 8: Whether organizations’ supply chain perform forecasting. ................................ 33
Figure 4. 9: Duration of forecasting period ............................................................................ 34
ix
LIST OF TABLES
Table 3. 1: Sample Size Distribution .......................................................................................25
Table 4. 1: Respondents Extent of agreement with statements related to Forecasting ............35
Table 4. 2: Respondents Extent of agreement with statements related to Supplier
collaboration ............................................................................................................................36
Table 4. 3: Respondents view on the Extent to which supply chain partnering factors
influence reliability of Supply Chains .....................................................................................37
Table 4. 4: Respondents Extent of agreement with statements related to Demand Planning ..38
Table 4. 5: Respondents view on the Extent to which demand planning factors influence
Supply Chain costs ...................................................................................................................39
Table 4. 6: Respondents view on the Extent to which Forecasting, Supplier collaboration and
demand planning factors influence Supply Chain performance ..............................................40
Table 4. 7: Correlation of Supply Chain Performance and Forecasting, Supplier
Collaboration and Demand Planning Factors. .........................................................................41

x
TABLE OF CONTENTS
STUDENT’S DECLARATION ............................................................................................. ii
ABSTRACT ............................................................................................................................ iii
ACKNOWLEDGEMENTS ................................................................................................... v
DEDICATION ........................................................................................................................ vi
LIST OF ABBREVIATIONS .............................................................................................. vii
LIST OF FIGURES ............................................................................................................. viii
LIST OF TABLES ................................................................................................................. ix
CHAPTER ONE ..................................................................................................................... 1
1.0 INTRODUCTION ........................................................................................................ 1
1.1 Background of the Study ............................................................................................... 1
1.2 Problem Statement ......................................................................................................... 4
1.3 General Objective .......................................................................................................... 5
1.4 Specific Objectives ........................................................................................................ 5
1.5 Significance of the Study ............................................................................................... 5
1.6 Scope of the Study ......................................................................................................... 6
1.7 Definition of Terms ........................................................................................................ 6
1.8 Chapter Summary .......................................................................................................... 7
CHAPTER TWO .................................................................................................................... 8
2.0 LITERATURE REVIEW ........................................................................................... 8
2.1 Introduction .................................................................................................................... 8
2.2 Forecasting on Inventory Optimization ......................................................................... 8
2.3 Supplier Partnering and Collaborating ......................................................................... 13
2.4 Demand Planning on Supply Chain Cost Reduction ................................................... 18
2.5 Chapter Summary ........................................................................................................ 23
CHAPTER THREE .............................................................................................................. 24
3.0 RESEARCH METHODOLOGY ............................................................................. 24
3.1 Introduction .................................................................................................................. 24
3.2 Research Design ........................................................................................................... 24
3.3 Population and Sampling Design ................................................................................. 24
3.3.1 Population ................................................................................................................. 24

xi
3.3.2 Sampling Design ...................................................................................................... 25
3.3.2.1 Sampling Frame ....................................................................................................... 25
3.3.2.2 Sampling Technique ................................................................................................. 25
3.3.2.3 Sample Size ............................................................................................................... 25
3.4 Research Procedure ...................................................................................................... 26
3.5 Data Collection ............................................................................................................ 26
3.6 Data Analysis ............................................................................................................... 26
3.7 Chapter Summary ........................................................................................................ 27
CHAPTER FOUR ................................................................................................................. 28
4.0 RESULTS AND FINDINGS ..................................................................................... 28
4.1 Introduction .................................................................................................................. 28
4.2 General Information ..................................................................................................... 28
4.3 Forecasting on inventory optimization ........................................................................ 33
4.4 Supplier Collaboration on Inventory Optimization ..................................................... 35
4.5 Demand Planning on Supply Chain Cost reduction .................................................... 37
4.6 Chapter Summary ........................................................................................................ 42
CHAPTER FIVE .................................................................................................................. 43
5.0 DISCUSSION, CONCLUSIONS AND RECOMMENDATIONS ........................ 43
5.1 Introduction .................................................................................................................. 43
5.2 Summary of the Study ................................................................................................. 43
5.3 Discussion of Findings ................................................................................................. 44
5.4 Conclusions .................................................................................................................. 48
5.5 Recommendations ........................................................................................................ 49
REFERENCES ...................................................................................................................... 52
Appendix I: Questionnaire ................................................................................................... 58

1
CHAPTER ONE
1.0 INTRODUCTION
1.1 Background of the Study
According to Chopra and Meindl (2001) a Supply Chain involves the flows between and
among stages with a motive to connecting the source to the end consumer. In the simplest
terms, a Supply Chain is the sequence of processes involved in the movement of a product or
service from production end to the consumer end.
Pfeffer, Jeffrey and Salancik (2003) allude that supply chain performance is described by its
effectiveness and efficiency. From a resource dependence perspective efficiency is defined as
an internal standard of performance. This is related to whether an organizations’ processes are
optimizing the various resources at disposal whether financial, technological, human or
physical. When a supply chain is efficient, this means that it can deliver products to the
consumer end at the lowest cost.
Effectiveness on the other hand is an external standard of fit to various demands. This is better
described as how well the supply chain can meet the needs and requirements of the various
stakeholders concerned with its activities. These stakeholders may include customers,
suppliers, partners and the shareholders. In assessing whether the supply chain is effective,
customers will be checking to see whether they received the right product at expected time,
Shareholders will be interested in assessing whether they got the expected returns from their
investment while vendors and partners will be looking to see how well the chain is able to
provide solutions to their problems.
Therefore, in its broadest sense, supply chain efficiency and effectiveness is the measure of the
supply chain getting the right product to the right place at the right time and at the least cost.
Ericson (2004) suggests that the analysis of efficiency and effectiveness involves the meaning,
the use and the relations between efficiency and effectiveness. Therefore, to assess the
performance of a supply chain, efficiency and effectiveness ought to be looked at an
independent perspective and at an interdependent perspective. Ericson (2004) provides a three-
step analytical framework for this; first, efficiency and effectiveness are described as two
independent constructs, i.e. as a dualism, second, efficiency and effectiveness are described as

2
two interrelated constructs, i.e. as a duality and finally he proposes an analytic of the constructs
beyond the duality applied to a supply chain. This framework therefore implies that efficiency
and effectiveness cannot be purely independent in a supply chain with bias on processes.
Hertz (2001) lobbies for the supply chain to be a part of a network that supplies a specific
product from raw material to final customer – it is a whole commercial chain embedded in the
network, therefore the goal of an organization has to be set in relation to the networks’ needs.
By extension therefore, organizational efficiency is an insufficient evaluation and so is
effectiveness in one relationship. Strategies involving collaboration between players and
integration of smaller chains rely greatly on factors that individual organisations’ do not have
control since they do not have direct ownership of them. This in turn will have implications on
measurement and definition of goals in a network context especially where efficiency and
effectiveness are objectives. The supply chain therefore must always endeavor to minimize
stock outs and at the same time ensure that end cost throughout the chain is kept at the
minimum.
Sheldon (2014) describes demand planning as a process done to help the organizations
understand profit potential by indirectly setting the stage for capacity, financing, and
stakeholder confidence. The implementation of the demand planning enables the supply chain
players to determine the closest possible forecast to the planning cycle and estimate with
confidence the volume of production, inventory and sources, capacity distribution among
products to maximize the profits of the whole company.
Demand planning represents a set of methodologies and information technologies for the use
of demand forecasts in the process of planning. It aims at accelerating the flow of raw materials
and services beginning with the suppliers through converting raw materials to products in the
company and to their distribution to their end users.
Johnson (2009) notes that these forecasts create a basis for planning company processes and
enables managers to plan future needs and consequently make rational decisions.
Therefore, the main driver for efficient and effective supply chain is the sharing of a mutual
forecast. Gros and Grosova (2004) insist that Supply Chain Managers require higher stability
of customer needs, exact demand forecasts and estimation of the sales promotion actions.
3
With the increasing complexity of product offerings and marketing strategies which are
worsened by shortened product life cycles, supply chains require more accuracy, flexibility,
and consistency in determining inventory requirements.
Bowersox, Closs and Cooper (2002) suggest that demand planning can provide such
capabilities by developing the forecasts that drives anticipatory supply chain processes. These
forecasts are the projections of seasonal demand that determine production and inventory
requirements. Each projected quantity might include some portion of future requirements
placed in anticipation of customer demand along with some portion of forecasted demand
based on history. Simply, the demand planning process integrates historically based forecasts
with other information regarding events that could influence future sales activity such as
promotions, price changes, and new product introductions to obtain the best possible integrated
summary of requirements. The combined requirements must reflect a plan that is consistent
with the chains projections.
Monczka (2002) defines Supplier Partnering as the process by which supply chain partners
adopt a high level of purposeful cooperation to maintain a trading relationship over time. The
relationship is bilateral; both parties have the power to shape its nature and future direction
over time. Mutual commitment to the future and a balanced power relationship are essential to
the process. To maintain pace with current worlds’ increased competition, supply chain
partners are becoming more dependent on one another and creating long-term relationships.
This is mainly for best commercial advantage as they as the supply chain partners can build
flexibility, which contributes to the supply chain’s effectiveness. Supplier collaborating also
encourages supplier development, which improves the supplier’s performance and capabilities
in one or more of the following areas: cost, quality, delivery, time-to-market, technology,
environmental responsibility, managerial capability and financial viability (Krause, Handfield
and Tyler, 2007)
This study therefore tries to establish how demand planning as a concept can be incorporated
in supply chain operations and its effect towards achieving supply chain efficiency and
effectiveness hence overall performance.

4
1.2 Problem Statement
Ray, Basak, Fatema, and Seddiqe (2016) suggest that supply chains face serious performance
challenges in both out of stock situations as well as increased overall supply chain costs. This
challenge is attributable to the problem of managing the demand of today’s customers as well
as the dynamics of the supply chains which hinder good visibility all through the supply chain.
This raises issues of supply chain efficiency and effectiveness. In the resource dependence
theory by Pfeffer et al. (2003) concluded that organizations can be both efficient and effective,
neither efficient nor effective, effective but not efficient, or efficient but not effective.
Therefore, if a supply chain is neither efficient nor effective, it is likely to have high costs and
poor inventory optimization; where it is effective but not efficient, it is likely to meet
stakeholder expectations but at high costs and where its efficient but not effective, it is likely
not to meet stakeholder expectations but minimize costs.
While there is an increase of scholarly materials and reports on improving supply chain
performance through demand planning, the little research done so far report inconclusive
results. For instance, while Moser, Isaksson, and Seifert ( 2017) argued that organizations
could improve their supply chains’ performance through demand planning, Reuben, John, and
Dittmann (2007) reported that even the best supply chain planning can be undermined and
supply chain performance hence determined by other factors.
Caffrey (2014) concludes that with enhanced forecasting and demand planning processes,
supply chain partners can effectively improve their supply chains’ performance by building
more responsive and flexible supply chains and avoid stock outs, unutilized plant capacities as
well as eliminate waste all of which reduce their supply chains performance. Cecere (2014)
suggests that while many companies believe supply chain efficiency and supply chain
effectiveness to be the same, the most efficient supply chain is not necessarily always effective.
The foregoing studies were conducted in a predominantly western context without
consideration of differences yet organizations exist within an environmental context.
Therefore, it is not clear whether the same demand planning factors influence a similar FMCGs
supply chains in a developing environment such as Kenya where economic factors such as
supply chain costs and unreliability are still relatively high. This study was therefore relevant
to on-going debate related to improving supply chain effectiveness and efficiency.

5
1.3 General Objective
The general objective of the study was to find out the contribution of demand planning
towards improving supply chain performance.
1.4 Specific Objectives
The study sought to achieve the following specific objectives.
1.4.1. To find out the role of forecasting on inventory optimization.
1.4.2. To find out the role of supplier collaboration on inventory optimization.
1.4.3. To find out the role of demand planning on Supply Chain cost reduction.
1.5 Significance of the Study
1.5.1 Supply Chain Practitioners
Purchasers, Logisticians and other employees working along the Supply Chain in which their
employer plays a part would be interested in understanding how demand planning can improve
the performance of their supply chain as well as enlighten them on the ripple effect of their
actions on the wider supply chain.
1.5.2 Suppliers and Buyers
Supplying and buying organizations such as FMCGs, providers of raw materials and the
distributors of the finished products would learn how to optimize their supply chain through
supply chain partnering, forecasting as well as information sharing.
1.5.3 Supply Chain Consultants and Advisers
Supply chain consultants will be better informed in advising their clients on whether demand
planning and associated activities would be beneficial in their clients’ models as well as what
changes would be necessary to effectively implement it to achieve the most advantage.
1.5.4 Production Professionals
Production technocrats would learn the benefits of incorporating demand planning and factor
the activities, timelines and recommendations from both downward and upward members of

6
the supply chain in scheduling their production cycles which in effect will lead to an efficient
and effective supply chain.
1.5.5 Chief Executives of Organizations
Organizations’ leadership under influence of positive effects of demand planning could factor
it in their strategic plan in pursuit of cost leadership, differentiation or focus strategies and
implement the concept in their organizations using it as a pillar of supply chain success and by
extension the organizations’ success.
1.5.6 Supply chain Trainers, Students and Future Researchers
Supply chain lecturers and trainers could disseminate this to their students who would then
apply the skills at work scenarios to improve the performance of the supply chains they will
participate. Future researchers may as well have this study as a base for their research activities.
1.6 Scope of the Study
The research study focused on FMCGs in Nairobi County in Kenya. Nairobi City is the capital
city of Kenya and is home to the majority of FMCGs with presence in Kenya. It is the leading
destination of FMCGs pursuing presence in Eastern Africa. (Muhatia, 2017)
1.7 Definition of Terms
1.7.1 Supply Chain
Is a series of integrated organizations that share information and coordinate physical execution
to ensure a smooth, integrated flow of goods, services and information through the pipeline
(Coyle, Langley, Novack, and Gibson, 2013).
1.7.2 Supply Chain Management
The act of optimizing supply chain activities along the supply chains (Janvier and Mbang,
2012)

7
1.7.3 Sales and Operations Planning
A cross-functional process aimed at aligning the commercial processes of sales and marketing
with the operational processes of supply (Cecere, 2015).
1.7.4 Fast Moving Consumer Goods
Also referred to as Consumer-Packaged Goods (CPG) are products that are sold quickly and
at relatively low cost (Malhotra, 2014).
1.8 Chapter Summary
This chapter has presented the study background and stated the problem. Further, it has put
forward the objectives which it will aim to achieve and considered the significance of the study
to the various stakeholders. Subsequently, it has provided the scope and the operational terms
that will be adopted.
The next chapter reviews previous literature available on the study. Chapter three describes the
methodology that will guide the study.

8
CHAPTER TWO
2.0 LITERATURE REVIEW
2.1 Introduction
This chapter reviews relevant scholarly articles and literature on achievement of Supply Chain
efforts contributions majorly being forecasting, supplier partnerships and other key aspects of
demand forecasting. This chapter examines the position occupied supply chain efficiency in
Strategic Supply Chain Management and the implications towards achievement of the Supply
Chain goals.
2.2 Forecasting on Inventory Optimization
In their study, Albarune and Habib (2015) observe that forecasting is the epicenter of all Supply
Chain Management activities which triggers all other activities both within and outside the
organization. Albarune and Habib (2015) conclude that forecasting is the key driving factor in
planning and decision making in SCM as well as enterprise level and that companies that
companies that perform exceptionally well rely on true numerical value of forecasting to make
decisions in capacity building, resource allocation, expansion, process scheduling among
others.
2.2.1 Demand and Supply Forecasting
Slack, Chambers and Johnston (2010) define Demand forecasting as the investigation of an
organisations’ demand for an SKU to include current and future demand. They further define
Supply forecasting as the collection of data about current producers and suppliers and
technological and external trends that are likely to affect supply.
2.2.2 Bull Whip Effect
Wilmjakob (2014), observes that Bull Whip Effect describes the increasing variability of
demand in a supply chain and is usually observed at the interfaces between the partners during
the transition of demand, and is caused by separate determination of demand. This leads to
tremendous inefficiencies.

9
Brent (2014), indicates that Bull Whip effect is easily experienced where in looking at firms
further back in the supply chain, inventory swings in larger and larger waves in response to
customer demand with the largest wave of the whip hitting the supplier of raw materials. Due
to this effect, supply-chain players have opted to build and maintain inventory buffers or safety
stock to cover for such swings in orders.
Simply said, the Bullwhip effect occurs due to demand variability increases as orders move up
the supply chain away from the retail customer, and small changes in consumer demand can
result in large variations in orders placed upstream.
Figure 2. 1: Illustrating the Bull Whip Effect (Demand Driven Institute, 2011)
In above illustration, a consumer places an order for actual demand of 8 units, the retailer is
likely to place an order of 10 units with the distributor, adding on 2 units to ensure they do not
run out of stock. The supplier then orders 20 units from the manufacturer. In the end, the
manufacturer makes 40 units to ensure economy of scale in production. The result of this is
that 40 units will have been produced to a demand of 8 units.
Priscilla (2011), contributed that the Bullwhip effect caused by miscommunication among
Supply Chain nodes effect led to excessive inventory due to information mistranslation from
downstream market and huge volume push-up from upstream.
Chad (2015), suggests that decoupling breaks the direct connection between these
dependencies in the supply chain and disconnects the events happening on one side from the
0 5 10 15 20 25 30 35 40 45
Consumer Order
Retailer Order
Distributor Order
Manufacturer Production
Bull Whip Effect
Order Quantities

10
events happening on the other side. This decoupling further delineates the boundaries of at
least two independently planned and managed horizons.
2.2.3 Sales Inventory and Operations Planning
Brian (2011), explains SI&OP as an integrated business management process that enables
organizations to develop a supply and demand plan that helps the organization to better
understand its products and services demand in the market. Further, this process helps these
organizations balance supply and demand and reduce OOS of its SKUs.
Vinder and Karin (2013), identifies five key steps of a successful and effective SI&OP as:
Conducting a Portfolio review; the organization should seek first to identify the products to
introduce or discontinue in the market, determine when to introduce or discontinue them and
identify whether there are any issues with the mature products in the portfolio. Secondly,
organizations should synchronize forecast and Financial Outlook; the organization will then
consolidate insights from commercial, marketing and customer service personnel in
establishing with market forecasts for the period in plan to boost forecast accuracy. Thirdly,
synchronize supply and capacity; the organization will then develop a time-phased inventory;
production and distribution alternatives to meet demand scenarios formulated by the forecasts
and derive financial implications. As a fourth step, organizations should then develop a Sales
Inventory and Operations Plan; The organization will then prepare an aligned sales, inventory,
and production plan. At this stage, the organization will go ahead and identify issues and risks
for which mitigating measures will be defined and strategies escalated. Lastly, the organization
conducts an Executive Sales Inventory and Operations Meeting; the SI&OP team will then
present their plan to the organizations’ executives for the review and completion of the sales
and Production plans after which integration into tactical planning and execution systems is
done.
2.2.4 Demand Driven Materials Requirement Planning (DDMRP)
DDMRP is a method to model, plan and manage supply chains to protect and promote the flow
of relevant information and materials (Demand Driven Institute, 2011). Orlicky (1975),
pioneered MRP I being a time phased priority-planning technique that sought to determine
material requirements and schedule supply to meet demand across all products and parts in the

11
several parts of operations. Over time, as Supply chain challenges evolved and complexities
increased, Supply chains evolved from relying solely on MRP I to MRP II. For the supply
chain to be demand driven, it must not only have a sense of changing customer demands but
must also adapt planning and production while pulling from supplier all in real time (Demand
Driven Institute, 2011).
Ptack and Smith (2011), explains DDMRP as a technique comprising five components:
Demand Driven Materials Requirement Planning
Strategic
Inventory
Positioning
Buffer
Profiles
& Levels
Dynamic
Adjustment
Demand
Driven
Planning
Visible and
Collaborati
ve
Execution
Position
Protect
Pull
Figure 2. 2: Components of DDMRP (Demand Driven Institute, 2011)
Strategic inventory Positioning; Firms should first examine from their own internal point of
view the place inventory occupies to protect it from the complexities and dynamics of the
environment. This will vary from firm to firm and from time to time.
Buffer Profiles and Level; for each SKU, a firm should establish buffer levels considering the
variation across SKU for lead times, variability and inherent SKU characteristics.
Dynamic Adjustments; As time lapses, conditions such as new markets and changing demand
patterns should be recognized and reflected by reviewing the set buffer levels to have levels
that reflect the current market status of each SKU.
Demand Driven Planning; By taking advantage of a combination of demand driven approaches
and computational power of todays’ hardware and software, the firms can be able to develop
1 2
3
4
5
12
relevant approaches and tools for the current world and a routine system that facilitates better
and quicker decision making and implementation both at planning and execution levels.
Highly Visible and Collaborative Execution; DDMRP enables synchronization of changes that
occur within the execution horizon and speeds the proliferation of relevant information and
priorities throughout the supply chain.
Carr (2017) notes that at the 2017 Supply Chain Insights Global Summit in Lake Oconee, GA
Brian Dooley the Head of Supply Chain Planning for British Telecom describes BT as having
a complex Supply Chain. BT relied heavily on forecasting to determine manufacture quantities
in its production plants and inventory levels to hold in their warehouses. Eventually, their
forecasting accuracy by SKU stunk and they frequently got into overstock or OOS. This led
them to take a chance on DDMRP which led to tremendous results characterized by strong
improvement in ROCE, reduced inventory levels, improved service levels increased
opportunities for increased revenue due to non-wastage on capacity.
Pepe (2016), noted that DDMRP at Michelin Tyres ensured 100% customer level, established
a direct link between their plant and the Customer Service Department, improved quality and
stock levels ultimately alleviated possible fluctuations in demand.
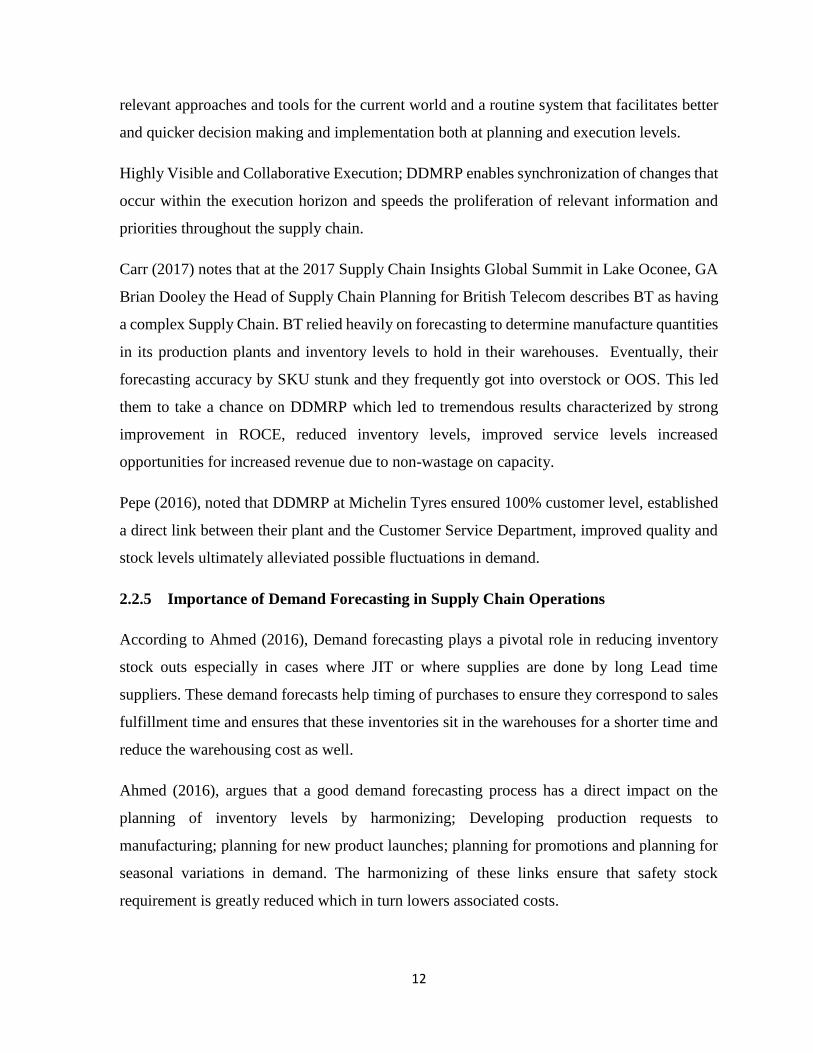
2.2.5 Importance of Demand Forecasting in Supply Chain Operations
According to Ahmed (2016), Demand forecasting plays a pivotal role in reducing inventory
stock outs especially in cases where JIT or where supplies are done by long Lead time
suppliers. These demand forecasts help timing of purchases to ensure they correspond to sales
fulfillment time and ensures that these inventories sit in the warehouses for a shorter time and
reduce the warehousing cost as well.
Ahmed (2016), argues that a good demand forecasting process has a direct impact on the
planning of inventory levels by harmonizing; Developing production requests to
manufacturing; planning for new product launches; planning for promotions and planning for
seasonal variations in demand. The harmonizing of these links ensure that safety stock
requirement is greatly reduced which in turn lowers associated costs.

13
Slack, Chambers and Johnston (2010) suggest that Demand planning helps schedule
production more effectively. Through effective Sales Inventory and Operations Planning
(S&IOP), an organization can understand the planning balance between supply and demand.
Ahmed (2016) suggests that to keep customers satisfied, organizations will need to provide
them with the product in question when they want it. Since forecasting helps organizations
predict demand, the organization can fulfill the customer orders as and when they arise with
short lead time and on time. Zuyderduyn (2011), concludes that for both MTO and ATO to be
effective, the organizations ERP must be able to monitor individual production orders to meet
customers’ demand of which this capability is reliant on strong statistical capabilities to support
the sales forecasting process.
2.3 Supplier Partnering and Collaborating
Monczka, Trent and Handfield (2005) define supplier collaborating as a process by which
partners adopt a high level of purposeful cooperation to maintain a trading relationship over
some period. The resultant relationship is bilateral with involved parties having the power to
shape its nature and future direction over time. Mutual commitment to the future and a balanced
power relationship are key aspects to the process. Despite collaborative relationships being
prone to conflict, parties include mechanisms for managing conflict built into the relationship.
Partnership Sourcing limited observes that in cases where suppliers and buyers develop close
and long-term relationships; that the two works together as partners, the aim is to secure the
best possible commercial advantage. The principle in application is that teamwork is better
than combat. For the Supply chain players to ensure that they serve the end customer best, then
they must work together to attain a win-win result. Partnership sourcing is effective because
involved parties have an interest in each other’s success.
Marino and Donati (2015), Noted that with the reliance on an increasingly lean supply chain,
manufacturers and suppliers needed to consider whether in an age of global platforms, systems
and standards, it is appropriate for them to work in an arm's length relationship model as has
been traditionally. In a majority of the current world supply chain, the percentage of the
products created by your suppliers is considerably high especially with the emergence of
original equipment manufacturing and outsourcing. Therefore, managing your supply chain is

14
critical. Suppliers have become critically important to the success of the final product. Both
supplier and buying organization should therefore collaborate and the focus should be on
working harmoniously to reduce the instances of recalls and ensuring there is a proper process
in existence to deal with them if they occur.
2.3.1 Early Supplier Involvement
Weele (2010) defines ESI as form of vertical collaboration between supply chain partners in
which the buying organization involves the selling organization at an early stage of the product
development process. He developed a conceptual framework for the implementation of ESI
and proposed it had four main components comprising of; Design, Procurement, Suppliers and
Manufacturing. With each component having its respective action steps. Design should be
concerned with conceptualizing the product, reviewing sales forecasts, conducting value
analysis of parts, defining quality targets product performance range. Procurement may be
involved in make/buy decisions, price negotiation and determining safety stock levels. The
supplier’s component is involved improving quality controls at the supplier's premises,
determining delivery standards and goals and research and development investment. Finally,
manufacturing' requires defining and discussing manufacturing product, determining
throughput costs, evaluating set-up times, and setting production efficiency goals.
The steps to a successful ESI are summarized as; Generating an idea, Conceptualizing and
designing the product, analyzing make-buy decisions, Negotiating price, terms and conditions,
Negotiating lead-times and inventory levels, Determining delivery standards and goals,
Determining Research &Development investment, Defining and discussing manufacturing
process and Determining manufacturing metrics.
Johnsen (2009) suggests that supplier selection processes are a critical success factor for Early
Supplier Involvement. Suppliers of parts that represent a high value and complexity should be
involved early. These suppliers ought to be selected and evaluated according to their innovative
capability and complementarity. In addition, there is a need for supplier relationship
development and adaptation through a long-term process of integration between buying
organizations and their suppliers. This development could include shared training, mutual trust,
commitment, risk and reward sharing, agreed performance targets and measures, and supplier

15
representation on the customer's product development team. These relationship-specific factors
frequently underestimated by managers, have also been identified as critical success factors.
Weele (2010), adds that the top management commitment and internal cross-functional
coordination of collaborating parties are very important. The ability to manage supplier
relationships is pegged on developing the ability to manage internal cross-functional
relationships. Internal buying organizations processes need to be developed to ensure that
suppliers are selected and evaluated on the right criteria and that ongoing trust and commitment
supplier relationships can evolve.
Juliana and Larsen (2006) notes that a number of organisations’ have through Early Supplier
Involvement managed to reduce product development cost, reduced lead-times and achieved
faster time-to-market, thereby achieving improved performance of their supply chain.
Veloso and Fixson (2001) observed that their suppliers Bosch and ITT-Teves developed The
Antilock Braking System (ABS) for Ford and GM in 1984. With time, other suppliers to car
manufacturers got involved in developing this initially expensive product. Because of this
competition the share of cars with ABS increased from 1% in the 1980s to almost 100% in the
2000s
Degun (2014), notes that John Belza the DFID commercial adviser in Afghanistan asked
suppliers to his department not to think that the suppliers should just provide items merely
because that is what the buying organization has asked for, rather, they should think whether
it is going to work and if it is the best. If they have a better idea, then the suppliers should move
forward and present it. The buying organization will not want a supply that is not going to
work either way.
2.3.2 Supplier Development
Fillard, Frahm, and Mercer (2011) observes that supplier development is a bilateral effort by
both the buyer and supplier organizations to jointly improve the supplier’s performance and
capabilities in areas such as cost, quality, delivery, time-to-market, technology, environmental
responsibility, and managerial capability, and financial viability. Simply put, supplier
development is any activity a buyer undertakes to improve a suppliers’ performance and

16
capabilities in the short or long term. Due to dynamic pressures in the business environment
mainly competition, many organizations have begun to understand the importance of
integrating suppliers into their networks and transforming this into a competitive advantage.
Handfield, Scannell, and Vincent (2000) notes that as firms result to outsourcing non-core
operations, to concentrate on core operations, they have increasingly expected the suppliers to
deliver innovative and quality products on time and at a competitive cost. Where the supplier
is unable to meeting these expectations, the buyer would; produce the outsourced product in
house, shift to a more capable supplier or assist improve the existing supplier’s capabilities. In
order to improve the suppliers’ capabilities and performance the buyer may; assess suppliers’
operations, provide incentives to improve performance, trigger competition between suppliers
and work directly with suppliers, either through training or other activities.
Handfield et al. (2000) confirms that supplier development can be challenging, as both firms
may be required to commit finances, capital, and personnel resources to the relationship, share
timely and sensitive information and to create an effective way of measuring performance. On
the other hand, they affirm that supplier development can be an effective strategy in the
development of an integrated supply chain. As outsourcing penetrates the supply chain,
suppliers are having a greater impact on the quality, cost, technology, and delivery of a buying
company’s own products and services, and subsequently its profitability. This direct effect of
supplier performance on a buying organisations’ bottom line indicates the importance of
optimizing supply-chain performance. They propose that continuous long-term improvement
of supplier performance can be achieved by identifying where value is created in the supply
chain, positioning the buyer strategically in line with value creation and implementing an
integrated supply-chain management strategy to maximize internal and external capabilities
throughout the supply chain.
Webb (2017) argues that the current market place is increasingly dynamic requiring businesses
to change faster. Further, he insists that these innovations often come from suppliers. Hence,
organizations can generate competitive advantage manifested in new products, a new
streamlined process or the implementation of a new standard by developing suppliers. He
identifies three levers of supplier development including communication, training and on-site
assistance. By providing training either through remote training or class room based training,

17
the suppliers are equipped with better knowledge and triggered to be innovative as well as
fostering collaboration. Similarly, on-site assistance can assist in quicker implementation of
new capabilities through installation of new technologies or new management practice
implementation. In some instances, it can offer faster time-to-market than sourcing from a
new supplier. Where the buying organization possesses the expertise, the supplier can save
significant management consultancy costs, which are savings that can be in-turn passed on to
the buying organization. Buying organisations’ on-site staff can also ensure that all
developments are closely aligned to their company policies and standards.
2.3.3 Collaborative Planning Forecasting and Replenishment
CPFR is a business practice, which combines the intelligence of multiple trading partners in
the planning and fulfilment of customer demand (Voluntary Interindustry Commerce
Standards , 2004). It is instrumental in linking best practice in sales and marketing such as
category management to supply chain planning and execution processes to increase availability
while at the same time reducing inventory, transportation and logistics costs. CPFR is a widely
known practice used to create synergy between multiple trading partners
Bozarth and Handfield (2016), indicates that CPFR plays a great role in reducing inventory
and achieving efficiency in transport and logistics planning through aligning and sharing sales,
and marketing best practices. It can also incorporate promotions and change trends in demand
while forecasting sales, deal with high inventories to guarantee product availability or address
the lack of coordination between supplier, retailer and/or other functions such as marketing,
finance procurement and logistics.
Bozarth & Handfield (2016), identifies the core elements of CPFR as: Efficient assortment;
this insists on rationalizing the product offerings to improve supply chain performance.
Efficient product introductions; argues that new products should be introduced in response to
determined customer needs and after consideration of the impact on supply chain performance.
Efficient promotions; prices should be kept as stable as possible and the supply chain impact
of promotions should be considered. Efficient replenishment; involves streamlining the
physical and information flows that link producers to the consumer with a focus to cut costs
and increase value.

18
Tan (2008) identifies four activities in collaboration to improve the performance of an
organization as: Strategy and planning; involves drawing up rules for governing the
collaborative relationships putting in place the mix, placement and plans for the products.
Demand and supply management project; involves discussing issues relating to customer
demands, orders, consignments and shipping requirements. Execution place; here the orders
are produced, shipments delivered and received and the products are racked on the shelves of
a retailing outlet, sales are recorded, transactions and payments are closed. Analysis monitor;
involves compiling results, producing and adjusting key performance statistics according to
the insights and shared with the team.
Mendes (2011) suggests that CPFR does not require substantial investments, thus allowing
smaller companies to acquire its benefits much more easily. In addition, CPFR can be made
measurable with the use of IT but overall it does not require technology to function as a process.
CPFR also allows companies to exploit the knowledge of their suppliers and customers to make
better forecasts. Superdrug ran a CPFR initiative with Johnson & Johnson and experienced
13% reduced stock on the collaborated product lines. The forecast accuracy for Superdrug
increased by 21% and the warehouse availability - by 1.6%. The lines that were subject to
CPFR saw Present Stock On Hand levels reduced by 23% compared to the product lines that
were not exposed to CPFR which increased by 11.8% (Yossi, 2005).
2.4 Demand Planning on Supply Chain Cost Reduction
Supply chain costs in most of cases represent a considerable percentage of the sales price of a
good or service. Across the main industries, supply chain costs accounted for 6%-10% of the
sales (Benchmarking Success, 2016). Cost savings flow directly to the bottom line and hence
a target on supply chain cost reduction would result in a company’s bottom line improvement.
2.4.1 Supply Chain Costs
Rob (2016) identifies the three fundamental areas of supply chain cost reduction as:
Transaction costs; these are costs incurred each time an order is raised or an order is secured
from a buying organization. When the activities of issuing and managing invoices, organizing
deliveries, responding to customer queries and checking progress all add to the overall cost.
Following a workflow, such as the arrival of an order through to the delivery and invoicing, is

19
one way to estimate these costs, although inefficiencies in the workflow may still be hiding
more expenses. Some of the cost of transactions comes from overly complicated processes,
and some of it comes from poor information sharing due to a reluctance to collaborate.
Consequently, technology such as e-commerce platforms can solve some of the problems, but
other parts of cost reduction may only happen if human beings work better together.
Mismatched processes; In an overall process, such as order supplies and production of finished
goods, several different processes may exist, such as the supplier’s own process to deliver, the
reception and racking process within the buyer’s organization, and so on. In the event that the
end of one process does not match with the beginning of the next one, interruption and
duplication of work may arise, both of which increase costs. For example, if a supplier’s
product codes or pallet sizes do not match those used by the enterprise, products will have to
be recoded and reorganized. In the consumer-packaged goods sector, this problem is big
enough to have prompted the use of collaborative planning, forecasting and replenishment
(CPFR) between manufacturers and retailers. Uncertainty; when the uncertainty is in product
demand and supply, most organizations opt to pile up inventory in their warehouses. This can
affect both suppliers that do not know which orders they will receive and resellers and end-
customers that stockpile because of doubt about the suppliers’ ability to supply when need
arises. These buffer stocks can grow at each point of the supply chain, from raw materials,
work in progress, finished goods and to regional distribution center holdings. Holding
inventory costs finances in several ways Inventory costs to hold as well as to manage, it
consumes working capital and blocks possible income from that capital. It indirectly increases
the risk of having to write off obsolete stock.
Moore (2017) finds that an operations and supply chain strategy is a key saving opportunity
beginning with analyzing the service needs of your customers and implementing a demand-
planning strategy then developing product movement protocols based on customer
segmentation. The more streamlined your operations are, the more efficient a business will
likely be.
Clive & Cox (2011) point out that the main objective for all supply chains is to provide end
customers with what they require, when they want it and that management plays a central role
in every supply chain’s need to satisfy its clients. They further point that inventory policies
20
drive two types of costs classifieds as Period inventory costs and working capital requirements.
They enlist Routine Demand Forecasting as a key strategy for organizations seeking to reduce
their supply chain costs arguing that using manually edited, arithmetic or stochastic forecasting
models to reduce forecast error will reduce overstock, backorders, and the need for lateral or
reverse logistics, holding inventory levels closest to only that which is required to support the
desired customer service level. Editing history to eliminate non-recurring promotions and to
compensate for out-of-stock situations is key. This will in the end lead to a reduction in supply
chain costs throughout the supply chain. Organizations should consolidate records in a
centralized database to avoid issues of the loss and scattering. This will enable them plan future
promotions and other one-time events that can be best forecast from extensive data on similar
events from the past holding. Extending the data format to include not just SKU, retailer, date
and lift, but also relative degree of advertising, duration, price reduction, number of locations,
or other factors, makes the information more useful for the future.
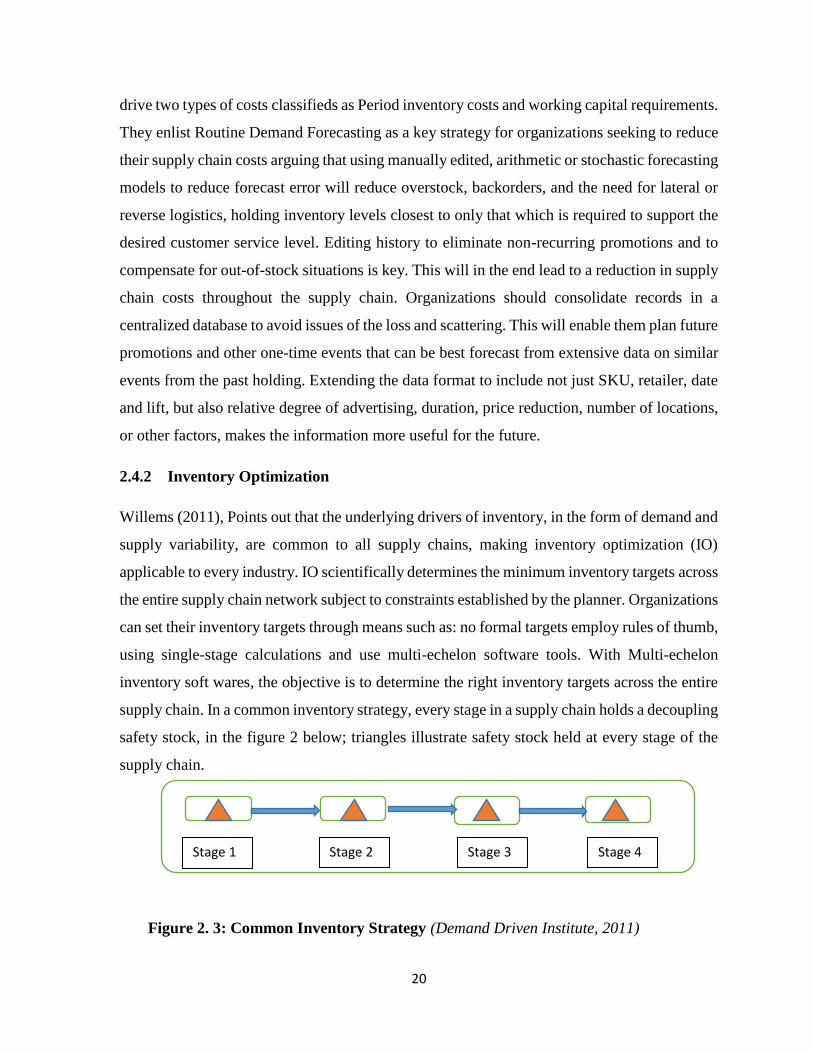
2.4.2 Inventory Optimization
Willems (2011), Points out that the underlying drivers of inventory, in the form of demand and
supply variability, are common to all supply chains, making inventory optimization (IO)
applicable to every industry. IO scientifically determines the minimum inventory targets across
the entire supply chain network subject to constraints established by the planner. Organizations
can set their inventory targets through means such as: no formal targets employ rules of thumb,
using single-stage calculations and use multi-echelon software tools. With Multi-echelon
inventory soft wares, the objective is to determine the right inventory targets across the entire
supply chain. In a common inventory strategy, every stage in a supply chain holds a decoupling
safety stock, in the figure 2 below; triangles illustrate safety stock held at every stage of the
supply chain.
Figure 2. 3: Common Inventory Strategy (Demand Driven Institute, 2011)
Stage 1 Stage 2 Stage 3 Stage 4

21
Overtime, with the common inventory strategy, each stage tends to grow its inventories, which
results in a suboptimal overall inventory strategy from a cost perspective because it does not
pool across locations. Instead, each location covers its own lead-time.
With Multi-Echelon strategy, IO can be achieved through a suggestion that inventory for
several stages can be pooled in one stage as per below figure:
Figure 2. 4: Multi Echelon Inventory Optimization (Demand Driven Institute, 2011)
In this scenario, a decoupling safety stock at Stage 2 covers the lead times of Stages 1 and 2
while Stage 4 covers Stages 3 and 4. This is an example of what could be the optimal safety
stock policy where, through IO, the right amount of inventory can be placed at separate
locations to reduce working capital and ensure service levels
Farasyn et al. (2011) concluded that by integrating the inventory optimization tools with the
people in P&G’s horizontal planning networks, P&G has defined an inventory management
process that has significantly reduced its total inventory investment. This began with single-
stage inventory models designed and implemented in spreadsheets that planners could use
directly. These spreadsheet tools drove 60 percent of P&G’s business. For more complex
supply chain networks, multi-echelon inventory models have replaced the single-stage models,
producing additional average inventory reductions of 7 percent. These multi-echelon models
now drive 30 percent of P&G’s business.
Muddassir (2016) concludes that when companies adopt supplier partnership model and link
their processes much closer with suppliers they achieve reduction in quality costs, better
possibilities of applying the JIT in procurement philosophy and the necessity of having
committed suppliers.
Stage 1 Stage 2 Stage 3 Stage 4

22
2.4.3 Supply Chain Network design
O'Byrne (2011) concludes that organizations can keep costs low and reliability up by designing
their supply chain network to minimize product handling. By looking at the shape of the
physical supply chain network as being determined by two ends; Customers and suppliers, with
customer base and the product provided to them on one end and the location of suppliers on
the other dictate where stock to service your customers is held. The more unreliable the
network because of suppliers being farther away the more stock needs to be held in the network
to ensure service continuity.
But that’s something you want to avoid, because one of the most important requirements for
an efficient and cost-effective distribution network is to minimize product handling. Each
“touch” between the point of supply and the customer incurs cost and increases the risk of error
and damage. Inadequate network design can lead to excessive handling, too many stock
locations, and poor utilization of your distribution centers. The results are high distribution
costs and poor customer service.
2.4.3 Supply Chain Uncertainties
Butcher (2011) concludes that the greatest uncertainty is in supply chain functions like
planning, sourcing, sales, customer service and transportation as they are highly dependent on
historical data and forecasts. This results in added cost, Increased inventory levels, longer lead-
times; and reducing speed to market.
Lia , De Sousa, and Claro (2012) conclude that supply chain uncertainties could be managed
through effective integration of the various functionalities with the primary objective of supply
chain planning. This is concerned with the coordination and integration of key supply chain
activities undertaken by an enterprise, from the procurement of raw materials to the distribution
of the final products to the customer. The decision-making process in these activities is highly
complex and interacting networks can be isolated according to the time horizons considered.

23
2.5 Chapter Summary
This chapter reviews literature on the various concepts in demand planning; these include
Demand Driven Materials requirement planning, forecasting and Sales Inventory and
Operations planning which lead to an improvement of supply chain performance.
The chapter also focuses on previous writings on contribution of Supply chain collaboration
and demand planning towards lowering supply chain costs and improving supply chains’
service levels, which enhance supply chain efficiency and effectiveness.

24
CHAPTER THREE
3.0 RESEARCH METHODOLOGY
3.1 Introduction
The general objective of this study was to find out whether and the contribution of demand
planning on supply chain efficiency. This chapter provides the master plan that the researcher
will use to conduct the study. It describes the research design, the population, the sampling
design, the data collection method, research procedures and data analysis methods.
3.2 Research Design
Kumar (2011) defines research design as the blueprint for the collection, measurement and
analysis of data. It sets out the specific details of the objectives of the study and explains how
the researcher will achieve the objectives of the study. The researcher adopted descriptive and
explanatory research designs. Descriptive research design is one that seeks to portray an
accurate representation of persons, events or situations while an explanatory research design
is one that establishes a causal relationship between variables. (Saunders, Lewis, and Thornhill,
2009). The dependent variable in this study is supply chain performance defined by Supply
chain costs reduction and improved customer service while the independent variable is demand
planning defined by supply chain forecasting and partnering.
3.3 Population and Sampling Design
3.3.1 Population
According to Cooper and Schindler (2010) a population is the total collection of elements
about which the researcher wishes to make some inferences. It is a collection of all the units of
concern that the researcher intends to conduct a study on within a specific problem space.
The target population for this study was employees holding Supply Chain positions in the 80
Fast Moving Consumer Goods organisations located within Nairobi County.

25
3.3.2 Sampling Design
3.3.2.1 Sampling Frame
Defines a sampling frame as whatever is being used to identify the elements in each sampling
unit. Saunders, Lewis, and Thornhill (2009) note that it is a complete list of all cases in the
population from which the sample was drawn. It could be anything as long as it exhausts the
whole population. For this study, the sampling frame was Fast Moving Consumer Goods
companies in Kenya.
3.3.2.2 Sampling Technique
The researcher adopted a stratified samping technique. Denscombe (2014) defines stratified
sampling as one as one in which every member of the population has an equal chance of being
selected in relation to their proportion within the sub category or strata. In this study, the Fast
Moving Consumer Goods was sub categorised into Alcohol, Baby Care, Food and Beverage,
House hold care and Personal care categories from which respondents will be drawn from Top
Team Management, Senior Management Level, Mid Junior level, Junior Level and Entry
Level.
3.3.2.3 Sample Size
A sample is the section of part which represents the whole population (Denscombe, 2014). The
target sample size for this study was 80 individuals holding positions in the target
organisations.
Table 3. 1: Sample Size Distribution
Management Level Population % of Population
Sample Size
% of Sample Size
Top Management Team 80 6 5 6
Senior Management Team 80 40 32 40
Mid Junior Level 160 11 17 21
Junior Level 160 8 13 16
Entry Level 320 4 13 16
Total 80 100

26
3.4 Research Procedure
The researcher first conducted a pilot test of the questionnaire on a small sample of seven
employees from the target sample, but which was not included in the analysis. The purpose of
pilot testing was to reveal any items in the questionnaire that are ambiguous or unclear to the
respondents in order to ammend them to be clear. The pilot study enabled the researcher to get
familiar with administering the instrument. According to Denscombe (2014) an administered
questionnaire includes those questionnaires that are delivered either by hand and collected or
those that are mailed to the respondent electronically by use of an e-mail or post office. The
researcher sought authorization from the respective organisations to collect data from its
employees. The data collection exercise took t four weeks.
3.5 Data Collection
Primary data was collected. According to Blaikie (2003) primary data is ‘new’ data generated
by a researcher responsible for the design of the study, the collection, analysis and reporting
of the data. A structured questionnaire was used for the purpose of data collection. Saunders,
Lewis and Thornhill (2009) define a questionnaire as a general term including all data
collection techniques in which each person is asked to answer the same set of questions in a
predetermined order. The questionnaire comprises of both closed questions and open ended
questions. The questionnaire is divided into three sections according to the research objectives.
The first section asks questions regarding the role of forecasting towards inventory
optimization; The second questions seek responses on the role of supplier collaboration
towards inventory optimization while the last section has questions seeking to find out the role
of demand planning towards supply chain cost reduction.
3.6 Data Analysis
Data was first be coded into the Statistical Package for the Social Sciences. Both descriptive
statistical techniques and inferential techniques were employed for analysis. Descriptive
statistics entailed the determination of the mean and standard deviations as and where
necessary (Saunders, Lewis, and Thornhill, 2009). For inferential analysis, the researcher
computed Spearman’s Rho Coefficient Correlation. The findings was then presented in tables.

27
3.7 Chapter Summary
This chapter has described the methodology of the study. It has explained the research design,
population and sample size. Further, the data collection procedures and the data analysis
methods to be used have also been described.

28
CHAPTER FOUR
4.0 RESULTS AND FINDINGS
4.1 Introduction
The general objective of the study was to determine the contribution of demand planning on
improving Supply chain performance of FMCGs in Kenya. In this chapter, the findings are
analyzed and presented according to the specific objectives. The first section presents the
analysis of demographic characteristics of supply chain players in the FMCGs in Kenya. The
second section analyzes the role of forecasting in improving Supply chain performance of
FMCGs in Kenya and the third section analyzes the contribution of supply chain collaboration
towards improving supply chain performance of FMCGs in Kenya. Finally, the finding
concerning the contribution of demand planning to improving Supply chain performance in
FMCGs in Kenya is presented. A summary of the major findings is also provided at the end of
the chapter. Seventy one out of 80 questionnaires that were administered were successfully
filled and returned giving an 88% response rate which was sufficient for the study.
4.2 General Information
This section presents a descriptive analysis of general information from the respondents such
as gender, age group, marital status, level of education, product category, level of supply chain
experience and the position held in employment.
4.2.1 Gender of Respondents
The distribution of respondents by gender is shown in Figure 4.1. Fifty five percent (55%) of
the respondents were male whereas forty five percent (45%) were females.

29
Figure 4. 1: Gender of Respondents
4.2.2 Age Group
Concerning age group, majority of the respondents representing 54% of the respondents aged
over 30 years, 41% of the respondents were aged between 25 to 30 years and the rest totaling
5% were below 25 years old. This is shown in Figure 4.2.
Figure 4. 2 Age Group of Respondents.
55%
45%
Gender of Respondents
Male Female
5%
41%
54%
0%
10%
20%
30%
40%
50%
60%
Below 25 Years 25-30 Years Over 30 Years
Age Group of Respondents

30
4.2.3 Marital Status
In terms of marital status, 69% of the respondents were married, 20% were single whereas the
other 11% had other statuses besides married and single. Therefore, the respondents were also
fairly represented in terms of marital status.
Figure 4. 3: Marital Status of Respondents
4.2.4 Level of Education of Respondents
Respondents were asked to indicate their levels of education. Figure 4.4 shows that 55% of the
respondents were Bachelors graduate, followed by 39% who were Masters graduates and 6%
who were Doctorate graduates.
Figure 4. 4: Level of Education of Respondents
20%
69%
11%
0%
10%
20%
30%
40%
50%
60%
70%
80%
Single Married Other
Marital Status of Respondents
6%
39%
55%
0%
10%
20%
30%
40%
50%
60%
Doctorate Graduate Masters Graduate Bachelors Graduate
Level of Education of Respondents

31
4.2.5 Category of Products respondents deal in.
Respondents were asked to identify the category of products their organizations deal in. Figure
4.5 shows that 24% of the respondents work in household care products supply chains, 20% of
the respondents in food and beverage excluding alcohol supply chains, 17% of the respondents
in both baby care and personal care supply chains, 11% in alcoholic drinks supply chains and
another 11% in other FMCG supply chains.
Figure 4. 5:Category of Products Respondents deal in
4.2.6 Level of Supply Chain Experience in years
Respondents were asked to indicate their level of supply chain experience in years. Figure 4.6
shows that 35% representing most of the respondents had between 5 to 10 years of experience,
followed by 23% with 10 to 15 years and 16% having between 15 to 20 years of supply chain
experience. Those respondents with more than 20 years of experience comprised 20% of the
respondents while respondents with less than 5 years’ experience were 6%. Therefore, majority
of the respondents had more than 5 years of supply chain experience.
11%
17%
20%
24%
17%
11%
0%
5%
10%
15%
20%
25%
30%
Alcohol Baby Care Food andBeverage
House hold care Personal Care Other
Products dealt with

32
Figure 4. 6: Level of Respondents’ Supply Chain Experience
4.2.7 Position respondents hold in Employment
The study sought to establish the position which respondents hold in employment. Figure 4.7
shows that 42% of the respondents hold positions in the Senior Management Level, 28% in the
Mid junior level while 18% hold positions in the junior level. Finally, 6% of the respondents
are in the top management level and the rest comprising 6% are in the entry level.
Figure 4. 7: Position respondents hold in Employment
6%
35%
23%
16%
20%
0%
5%
10%
15%
20%
25%
30%
35%
40%
Below 5 years 5 – 10 years 10 – 15 years 15 – 20 years Over 20 years
Level of Supply Chain Experience in years
6%
42%
28%
18%
6%
0%
5%
10%
15%
20%
25%
30%
35%
40%
45%
Top Management SeniorManagement Level
Mid- Junior Level Junior Level Entry Level
Position respondents hold in Employment

33
4.3 Forecasting on inventory optimization
This section sought to determine the role of forecasting in improving supply chain
performance.
Whether organizations’ supply chains perform forecasting
Respondents were asked to indicate whether their organizations supply chain perform
forecasting. Figure 4.8 shows that a majority 83% of the respondents indicated that supply
chains in their organizations perform forecasting.
Figure 4. 8: Whether organizations’ supply chain perform forecasting.
Duration of the forecasting period
Of the respondents who indicated that their organizations’ supply chain performs forecasting,
the study sought to find out the duration of the forecasting period. Figure 4.9 shows that a
majority , 62% had forecasting period of between 6 to 12 months, 17% longer than 12 months
forecasting period, 14 % a forecasting period of 2 to 5 months and 7% a forecasting period of
less than one month.
83%
17%
Whether Organizations supply chains perform forecasting
Yes No
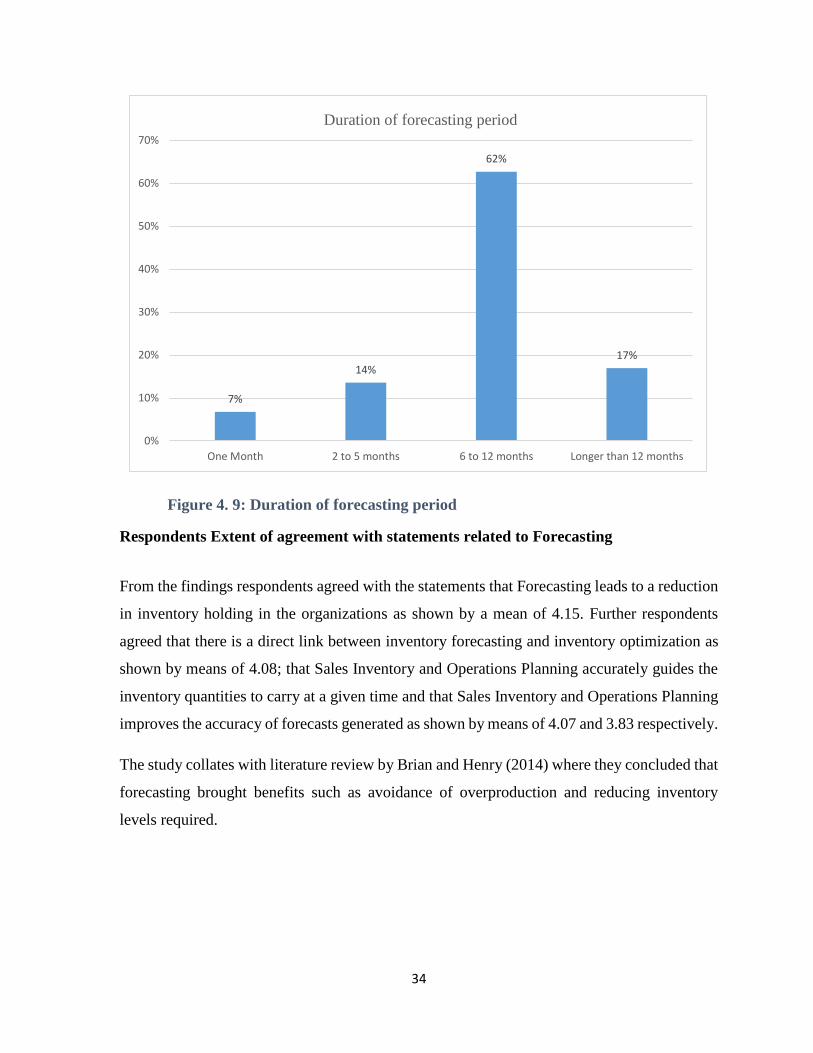
34
Figure 4. 9: Duration of forecasting period
Respondents Extent of agreement with statements related to Forecasting
From the findings respondents agreed with the statements that Forecasting leads to a reduction
in inventory holding in the organizations as shown by a mean of 4.15. Further respondents
agreed that there is a direct link between inventory forecasting and inventory optimization as
shown by means of 4.08; that Sales Inventory and Operations Planning accurately guides the
inventory quantities to carry at a given time and that Sales Inventory and Operations Planning
improves the accuracy of forecasts generated as shown by means of 4.07 and 3.83 respectively.
The study collates with literature review by Brian and Henry (2014) where they concluded that
forecasting brought benefits such as avoidance of overproduction and reducing inventory
levels required.
7%
14%
62%
17%
0%
10%
20%
30%
40%
50%
60%
70%
One Month 2 to 5 months 6 to 12 months Longer than 12 months
Duration of forecasting period
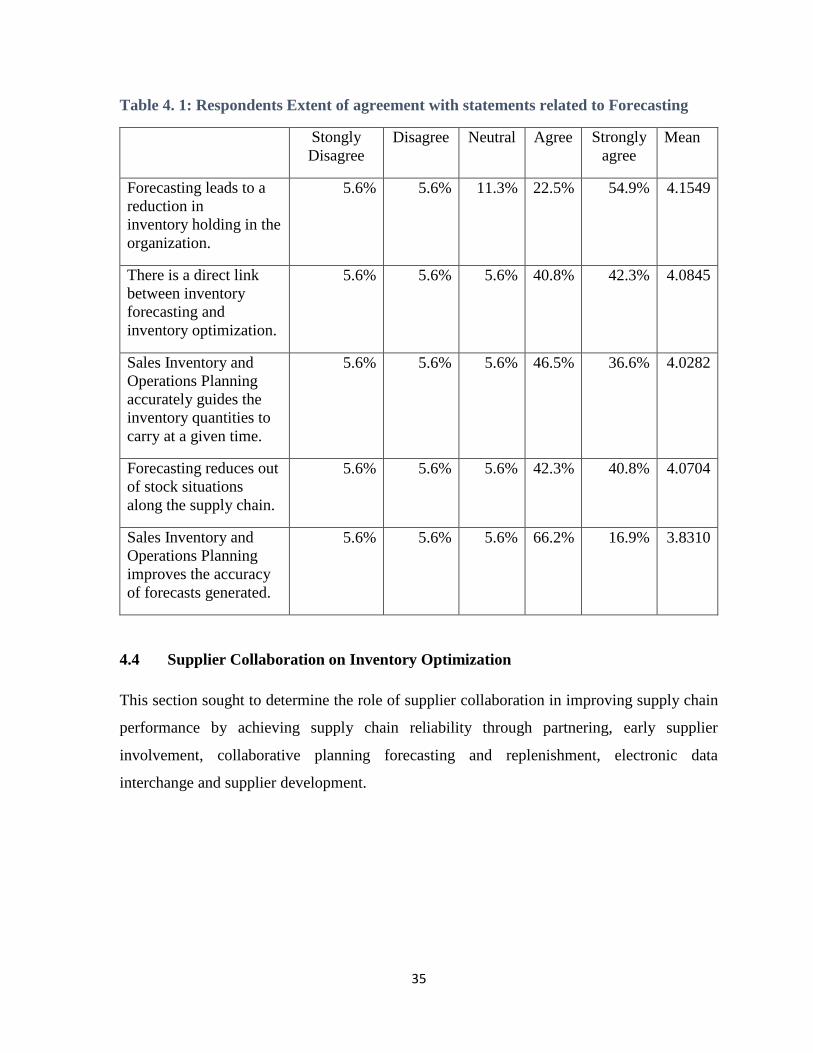
35
Table 4. 1: Respondents Extent of agreement with statements related to Forecasting
Stongly
Disagree
Disagree Neutral Agree Strongly
agree
Mean
Forecasting leads to a
reduction in
inventory holding in the
organization.
5.6% 5.6% 11.3% 22.5% 54.9% 4.1549
There is a direct link
between inventory
forecasting and
inventory optimization.
5.6% 5.6% 5.6% 40.8% 42.3% 4.0845
Sales Inventory and
Operations Planning
accurately guides the
inventory quantities to
carry at a given time.
5.6% 5.6% 5.6% 46.5% 36.6% 4.0282
Forecasting reduces out
of stock situations
along the supply chain.
5.6% 5.6% 5.6% 42.3% 40.8% 4.0704
Sales Inventory and
Operations Planning
improves the accuracy
of forecasts generated.
5.6% 5.6% 5.6% 66.2% 16.9% 3.8310
4.4 Supplier Collaboration on Inventory Optimization
This section sought to determine the role of supplier collaboration in improving supply chain
performance by achieving supply chain reliability through partnering, early supplier
involvement, collaborative planning forecasting and replenishment, electronic data
interchange and supplier development.

36
Respondents Extent of agreement with statements related to Supplier collaboration
From the findings respondents agreed with the statements that supplier partnering leads to
increases supply chain reliability as shown by a mean of 4.27. The respondents also agreed
that Early Supplier Involvement increases supply chain reliability as shown by means of 4.06
and further agreed that Collaborative Planning Forecasting and Replenishment ensures
suppliers remain in stock as shown by a mean of 4.08.
This aligns with Slone, Dittmann, and Mentzer (2010) conclusion that Supply Chain
Collaboration benefits include but are not limited to improved efficiency and effectiveness in
helping all the supply chain players meet their customer demands, grow markets, and increase
competitive market share.
Table 4. 2: Respondents Extent of agreement with statements related to Supplier
collaboration
Statement Stongly
Disagree
Disagree Neutral Agree Strongly
agree
Mean
Supply chain partnering
increases supply chain reliability
5.6% 5.6% 5.6% 22.5% 60.6% 4.2676
Early Supplier Involvement
increases supply chain reliability
5.6% 5.6% 5.6% 43.7% 39.4% 4.0563
Collaborative Planning
Forecasting and Replenishment
ensures suppliers remain in stock
5.6% 5.6% 5.6% 40.8% 42.3% 4.0845
Respondents view on the Extent to which supply chain partnering factors influence
reliability of Supply Chains
The findings indicate that respondents view that Electronic Data Interchange influences supply
chain reliability to a large extent as shown by a mean of 3.41. The respondents also viewed
Early Supplier Involvement as a factor that influences supply chain reliability to a large extent
as shown by a mean of 3.28. Further, respondents indicated that Supplier Development and

37
Collaborative Planning Forecasting and Replenishment influence the reliability of supply
chains as suggested by a means of 3.25 and 3.40 respectively.
Table 4. 3: Respondents view on the Extent to which supply chain partnering factors
influence reliability of Supply Chains
No
effect
Little
extent
Large
extent
Very
large
extent
Mean
Electronic Data Interchange 5.6% 0.0% 42.3% 52.1% 3.4085
Early Supplier Involvement 5.6% 0.0% 54.9% 39.4% 3.2817
Supplier Development 5.6% 0.0% 57.7% 36.6% 3.2535
Collaborative Planning Forecasting and
Replenishment
5.6% 0.0% 42.3% 52.1% 3.4085
4.5 Demand Planning on Supply Chain Cost reduction
This section sought to determine the contribution of demand planning in improving supply
chain performance by reducing and enabling better visibility supply chain costs as well as
reducing mismatch of processes and uncertainties along the supply chain. It further sought
respondents view on the extent to which; Sales Inventory and Operations Planning; Forecast
Review; Market intelligence and information sharing; Materials Requirement Planning and
Supply chain integration influence supply chain costs in their organizations. Finally, this
section also sought the respondents ranking by importance of Forecasting, Sales Inventory and
Operations planning, Supplier Collaboration, Supply Chain integration and Supplier
Development.
Respondents Extent of agreement with statements related to Demand Planning
From the findings respondents agreed with the statements that demand planning is critical in
reduction of supply chain costs as shown by a mean of 4.13. Further respondents agreed that
demand planning enables better visibility of supply chain costs optimization as shown by
means of 4.00; that demand planning reduces mismatch of processes along the supply chain

38
and that demand planning reduces uncertainties along the supply chain as shown by means of
4.18 and 4.01 respectively.
The study collates with literature review by Moser, Isaksson and Seifer (2018) conclusion that
good demand planning enhances profitability through avoidance of unnecessary costs.
Table 4. 4: Respondents Extent of agreement with statements related to Demand
Planning
Stongly
Disagree
Disagree Neutral Agree Strongly
agree
Mean
Demand planning is a critical in
reduction of supply chain costs
5.6% 5.6% 5.6% 36.6% 46.5% 4.1268
Demand planning enables better
visibility of supply chain costs
5.6% 5.6% 5.6% 49.3% 33.8% 4.0000
Demand planning reduces
mismatch of processes along the
supply chain.
5.6% 5.6% 5.6% 31.0% 52.1% 4.1831
Demand Planning reduces
uncertainties along the supply
chain
5.6% 5.6% 5.6% 47.9% 35.2% 4.0141
Respondents view on the Extent to which demand planning factors influence Supply
Chain costs
The findings indicate that respondents view that Sales Inventory and Operations Planning
influences supply chain costs to a large extent as shown by a mean of 3.32. The respondents
also viewed Forecast Reviews as a factor that influences supply chain costs to a large extent as
shown by a mean of 3.25. Further, respondents indicated that; Market intelligence and
information sharing; Materials Requirement Planning; Supply chain integration influence
supply chain costs as suggested by a means of 3.36, 3.48 and 3.41 respectively.

39
Table 4. 5: Respondents view on the Extent to which demand planning factors influence
Supply Chain costs
No
effect
Little
extent
Large
extent
Very
large
extent
Mean
Sales Inventory and Operations
Planning
11.3% 0.0% 33.8% 54.9% 3.3239
Forecast Review 5.6% 0.0% 57.7% 36.6% 3.2535
Market intelligence and information
sharing
5.6% 0.0% 46.5% 47.9% 3.3662
Materials Requirement Planning 5.6% 0.0% 35.2% 59.2% 3.4789
Supply chain integration 5.6% 0.0% 42.3% 52.1% 3.4085
4.3.4 Supply Chain Performance
This section sought to determine the contribution of forecasting, supplier collaboration and
demand planning on Supply chain performance.
Respondents view on the Extent to which Forecasting, Supplier collaboration and
demand planning factors influence Supply Chain performance
The findings indicate that respondents view that forecasting influences supply chain stock
holding to a large extent as shown by a mean of 4.03. The respondents also viewed supplier
collaboration as a factor that influences supply chain costs to a large extent as shown by a mean
of 4.08. Further, respondents indicated that; demand planning and optimal stock holding
influence supply chain costs as suggested by a means of 3.92 and 4.14 respectively.
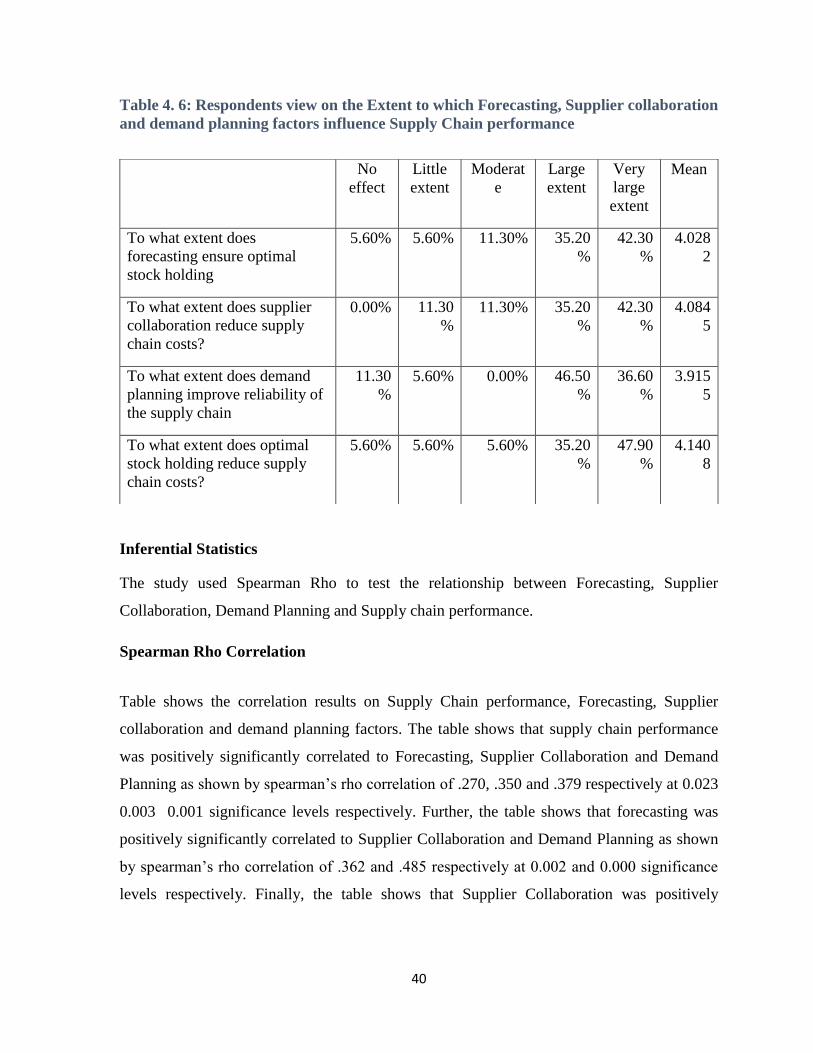
40
Table 4. 6: Respondents view on the Extent to which Forecasting, Supplier collaboration
and demand planning factors influence Supply Chain performance
Inferential Statistics
The study used Spearman Rho to test the relationship between Forecasting, Supplier
Collaboration, Demand Planning and Supply chain performance.
Spearman Rho Correlation
Table shows the correlation results on Supply Chain performance, Forecasting, Supplier
collaboration and demand planning factors. The table shows that supply chain performance
was positively significantly correlated to Forecasting, Supplier Collaboration and Demand
Planning as shown by spearman’s rho correlation of .270, .350 and .379 respectively at 0.023
0.003 0.001 significance levels respectively. Further, the table shows that forecasting was
positively significantly correlated to Supplier Collaboration and Demand Planning as shown
by spearman’s rho correlation of .362 and .485 respectively at 0.002 and 0.000 significance
levels respectively. Finally, the table shows that Supplier Collaboration was positively
No
effect
Little
extent
Moderat
e
Large
extent
Very
large
extent
Mean
To what extent does
forecasting ensure optimal
stock holding
5.60% 5.60% 11.30% 35.20
%
42.30
%
4.028
2
To what extent does supplier
collaboration reduce supply
chain costs?
0.00% 11.30
%
11.30% 35.20
%
42.30
%
4.084
5
To what extent does demand
planning improve reliability of
the supply chain
11.30
%
5.60% 0.00% 46.50
%
36.60
%
3.915
5
To what extent does optimal
stock holding reduce supply
chain costs?
5.60% 5.60% 5.60% 35.20
%
47.90
%
4.140
8

41
significantly correlated to Demand Planning as shown by spearman’s rho correlation of .358
at 0.002 significance level.
Table 4. 7: Correlation of Supply Chain Performance and Forecasting, Supplier
Collaboration and Demand Planning Factors.
Correlations
Supply
Chain
Perfomance
Forecasting Supplier
Collaboration
Demand
Planning
Spearman's
rho
Supply Chain
Perfomance
Correlation
Coefficient
1.000 .270* .350** .379**
Sig. (2-
tailed)
0.023 0.003 0.001
N 71 71 71 71
Forecasting Correlation
Coefficient
.270* 1.000 .362** .485**
Sig. (2-
tailed)
0.023 0.002 0.000
N 71 71 71 71
Supplier
Collaboration
Correlation
Coefficient
.350** .362** 1.000 .358**
Sig. (2-
tailed)
0.003 0.002 0.002
N 71 71 71 71
Demand
Planning
Correlation
Coefficient
.379** .485** .358** 1.000
Sig. (2-
tailed)
0.001 0.000 0.002
N 71 71 71 71
*. Correlation is significant at the 0.05 level (2-tailed).
**. Correlation is significant at the 0.01 level (2-tailed).

42
4.6 Chapter Summary
The chapter has presented the step by step findings on the study variables which includes
forecasting, supplier collaboration, demand planning supply chain performance. The chapter
showed the details output of the descriptive statistics as well inferential statistics attached to
the study variables.

43
CHAPTER FIVE
5.0 DISCUSSION, CONCLUSIONS AND RECOMMENDATIONS
5.1 Introduction
The previous chapter analyzed the findings of the study. In this chapter, the researcher
discusses the overall findings in line with the theoretical framework with the aim of answering
the research questions as well as the research purpose. The chapter also presents conclusions
and recommendations from the current study and recommends future possible studies.
5.2 Summary of the Study
The general objective of the study was to find out the contribution of demand planning towards
improving supply chain performance. Specifically, the study sought to achieve the following
specific objectives; To find out the role of forecasting towards inventory optimization; To find
out the role of supplier partnering towards inventory optimization; To find out the role of
demand planning towards Supply Chain cost reduction.
The researcher adopted descriptive and explanatory research designs. The target population for
this study was Fast Moving Consumer Goods organizations located within Nairobi and
Kiambu County. The researcher adopted a stratified sampling technique. The target sample
size for this study was 80 individuals holding positions in the target organizations. A structured
questionnaire was used for data collection. Both descriptive statistical techniques and
inferential techniques were employed for analysis. Inferences were drawn using correlation
and data was presented in tables, pie and bar charts.
In terms of forecasting, the findings showed that most of the FMCGs conducted forecasting in
their supply chains with a majority having the forecasting period longer than 6 months. There
was a significant positive correlation between forecasting and supply chain performance.
Further, the study found that forecasting led to the reduction in inventory holding in the
organization as well as reduced out of stock situations. The study also found that sales
inventory and operations planning improves the accuracy of forecasts generated and guides the
inventory quantities to carry at a given time.
44
Concerning supplier collaboration, the study found that there was a significant positive
correlation between supplier collaboration and supply chain performance, forecasting and
demand planning. Also, the study found that supply chain collaboration increases supply chain
reliability and ensures suppliers remain in stock.
In terms of demand planning, the study found that supply chain performance was positively
significantly correlated to Forecasting, Supplier Collaboration and Demand Planning. From
the study, demand planning reduces supply chain costs, enables better visibility of costs, clears
mismatch of processes along the chain and reduces uncertainties along the supply chain.
5.3 Discussion of Findings
5.3.1 Forecasting on Inventory Optimization
From the findings the study found out that majority of the organizations perform forecasting
in their supply chains. This is confirmed by most of the respondents having indicated that
supply chains in their organizations perform forecasting and of the respondents who indicated
that their organizations’ supply chain perform forecasting again a majority indicated the
forecasting duration between 6-12 months.
Further, the findings from this study showed that forecasting leads to a reduction in inventory
holding in the organizations. This is confirmed in most of the respondents having agreed that
forecasting in their organizations has led to the quantities held in the supply chain by SKU in
the portfolio. This was expected as forecasting leads to a better knowledge of future stock
requirements hence supplier chain players do not need to hold excess inventory. This finding
was consistent with Fritsch (2015) recommendation that forecasting can support organization’s
strategic goals of ordering enough to meet ongoing customer demand while not carrying too
much extra inventory to keep costs under control.
Also, the study found out that that there is a direct link between inventory forecasting and
inventory optimization. This is confirmed by most of the respondents having agreed that
inventory forecasting in their organizations supply chains has led to the inventory optimization
along the supply chain inventory points. This indicates that organizations can hold just enough
as customers’ need and do not go out of stock. This finding correlate to Kot, Grondys, and
45
Szopa (2011) conclusion that inventory forecasting and optimization are directly correlated
with inventory forecasting enhancing inventory optimization.
Also, the study found out that forecasting reduces out of stock situations along the supply
chain. This was demonstrated by most respondents agreeing that forecasting reduces the
number and intensity of cases of stock outs in the supply chain. This finding collates with
Ahmed ( 2016) recommendation that organizations need to realize the importance of inventory
forecasting, even if they are working in JIT System or with long lead time suppliers as it
enables them to arrange raw materials in anticipation of actual customer orders hence
minimizing out of stock instances.
The study revealed that Sales Inventory and Operations Planning accurately guides the
inventory quantities to carry at a given time as depicted by most of the respondents who agreed
that in their organisations, SI&OP provided a base as to what inventory levels to hold by SKU.
This is aligned with Fritsch (2015) findings that SI&OP enables management to establish the
desired levels of customer service, inventory levels, and production plans which guides the
organization toward managing their business proactively towards optimal performance.
From the study, Sales Inventory and that Operations Planning improves the accuracy of
forecasts generated as depicted by most of the respondent’s agreement. This is aligned to
Kaipia, Holmstrom, Småros, and Rajala (2017) conclusion that SI&OP improves the accuracy
of forecasts by incorporating information from many sources.
The study findings collate with literature review by Brian and Henry (2014) where they
concluded that forecasting brought benefits such as avoidance of overproduction and reducing
inventory levels required.
5.3.2 Supplier Collaboration on Inventory Optimization
From the findings the study found out that almost all of the respondents agreed that supplier
partnering leads to increases supply chain reliability. This is in line with Faertes (2015)
conclusion that partnering with the other players in the supply chain guarded against
compromise of security of supply such as infrastructure related failures, crisis scenarios,
financial and scarcity issues, which could be addressed and treated and contingency plan
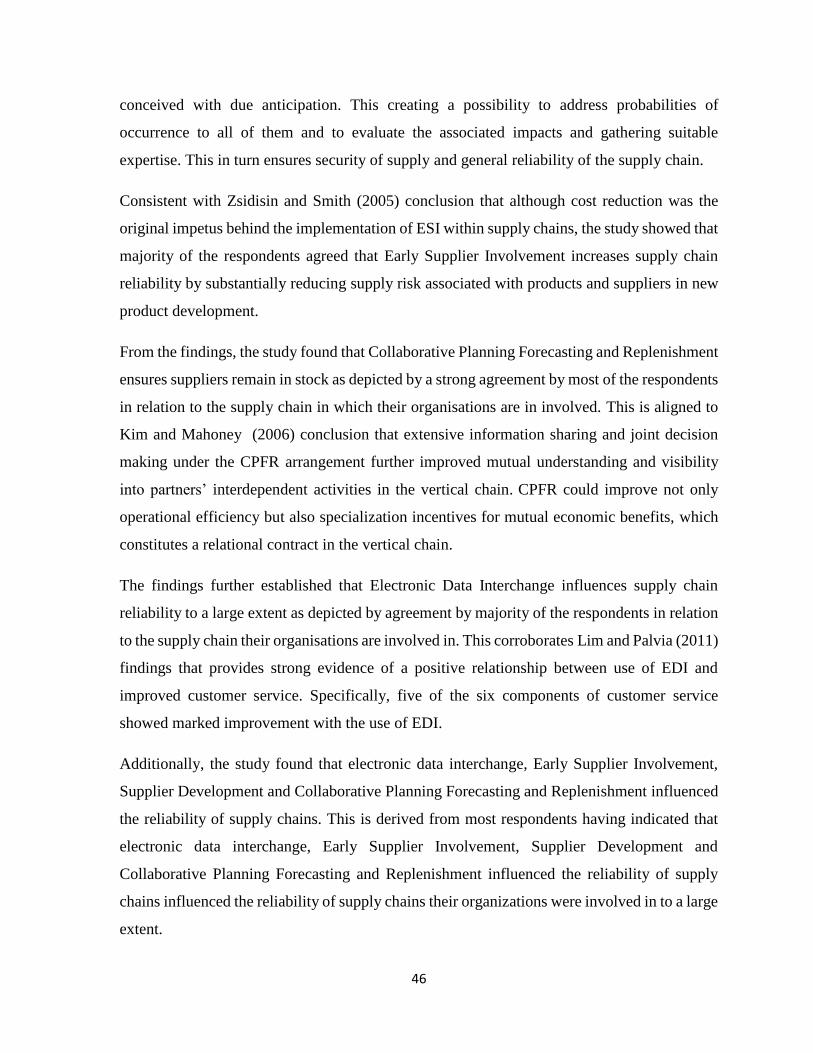
46
conceived with due anticipation. This creating a possibility to address probabilities of
occurrence to all of them and to evaluate the associated impacts and gathering suitable
expertise. This in turn ensures security of supply and general reliability of the supply chain.
Consistent with Zsidisin and Smith (2005) conclusion that although cost reduction was the
original impetus behind the implementation of ESI within supply chains, the study showed that
majority of the respondents agreed that Early Supplier Involvement increases supply chain
reliability by substantially reducing supply risk associated with products and suppliers in new
product development.
From the findings, the study found that Collaborative Planning Forecasting and Replenishment
ensures suppliers remain in stock as depicted by a strong agreement by most of the respondents
in relation to the supply chain in which their organisations are in involved. This is aligned to
Kim and Mahoney (2006) conclusion that extensive information sharing and joint decision
making under the CPFR arrangement further improved mutual understanding and visibility
into partners’ interdependent activities in the vertical chain. CPFR could improve not only
operational efficiency but also specialization incentives for mutual economic benefits, which
constitutes a relational contract in the vertical chain.
The findings further established that Electronic Data Interchange influences supply chain
reliability to a large extent as depicted by agreement by majority of the respondents in relation
to the supply chain their organisations are involved in. This corroborates Lim and Palvia (2011)
findings that provides strong evidence of a positive relationship between use of EDI and
improved customer service. Specifically, five of the six components of customer service
showed marked improvement with the use of EDI.
Additionally, the study found that electronic data interchange, Early Supplier Involvement,
Supplier Development and Collaborative Planning Forecasting and Replenishment influenced
the reliability of supply chains. This is derived from most respondents having indicated that
electronic data interchange, Early Supplier Involvement, Supplier Development and
Collaborative Planning Forecasting and Replenishment influenced the reliability of supply
chains influenced the reliability of supply chains their organizations were involved in to a large
extent.
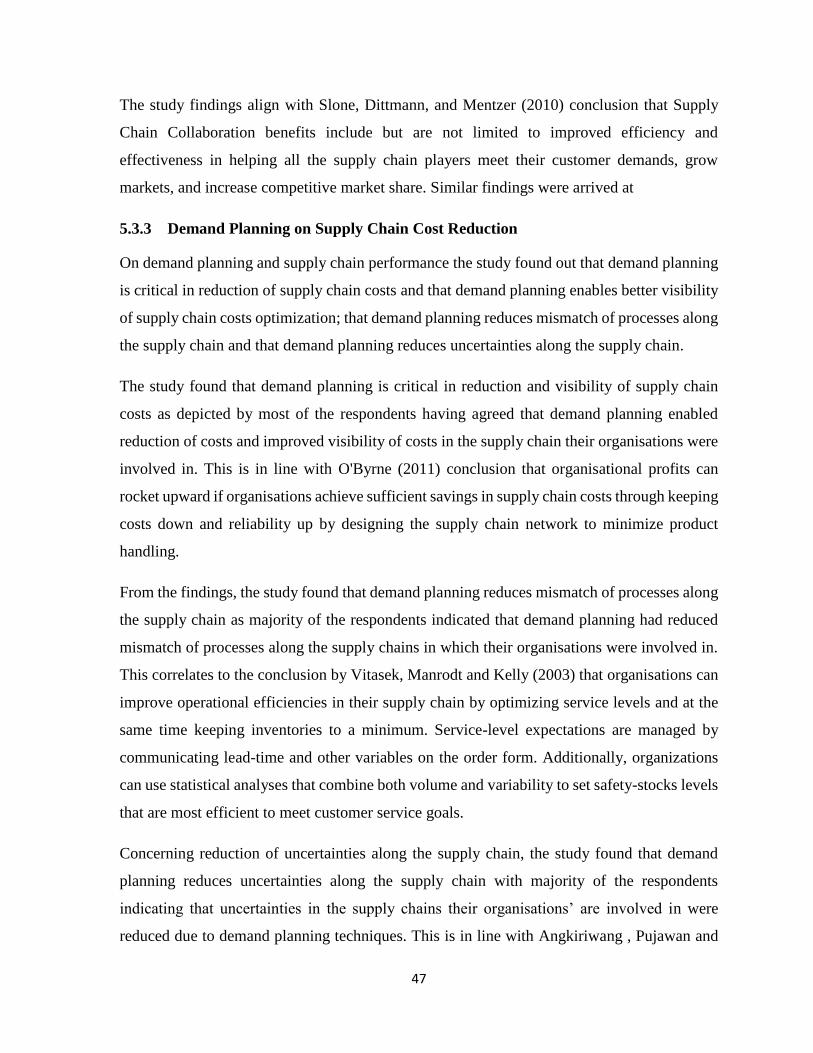
47
The study findings align with Slone, Dittmann, and Mentzer (2010) conclusion that Supply
Chain Collaboration benefits include but are not limited to improved efficiency and
effectiveness in helping all the supply chain players meet their customer demands, grow
markets, and increase competitive market share. Similar findings were arrived at
5.3.3 Demand Planning on Supply Chain Cost Reduction
On demand planning and supply chain performance the study found out that demand planning
is critical in reduction of supply chain costs and that demand planning enables better visibility
of supply chain costs optimization; that demand planning reduces mismatch of processes along
the supply chain and that demand planning reduces uncertainties along the supply chain.
The study found that demand planning is critical in reduction and visibility of supply chain
costs as depicted by most of the respondents having agreed that demand planning enabled
reduction of costs and improved visibility of costs in the supply chain their organisations were
involved in. This is in line with O'Byrne (2011) conclusion that organisational profits can
rocket upward if organisations achieve sufficient savings in supply chain costs through keeping
costs down and reliability up by designing the supply chain network to minimize product
handling.
From the findings, the study found that demand planning reduces mismatch of processes along
the supply chain as majority of the respondents indicated that demand planning had reduced
mismatch of processes along the supply chains in which their organisations were involved in.
This correlates to the conclusion by Vitasek, Manrodt and Kelly (2003) that organisations can
improve operational efficiencies in their supply chain by optimizing service levels and at the
same time keeping inventories to a minimum. Service-level expectations are managed by
communicating lead-time and other variables on the order form. Additionally, organizations
can use statistical analyses that combine both volume and variability to set safety-stocks levels
that are most efficient to meet customer service goals.
Concerning reduction of uncertainties along the supply chain, the study found that demand
planning reduces uncertainties along the supply chain with majority of the respondents
indicating that uncertainties in the supply chains their organisations’ are involved in were
reduced due to demand planning techniques. This is in line with Angkiriwang , Pujawan and

48
Santosa (2013) conclusion that the proactive nature of supply chain flexibility through safety
stock holding, capacity buffer, supplier backups and safety lead times can allow organizations
to redefine market uncertainties or influence what customers have come to expect from a
particular industry. These will enable organizations to achieve higher service levels, efficient
resource utilization and responsiveness.
The findings also indicated that Sales Inventory and Operations Planning influences supply
chain costs to a large extent. Forecast Reviews as a factor that influences supply chain costs
to a large extent and that Market intelligence and information sharing, Materials Requirement
Planning and Supply chain integration influence supply chain costs
The study findings collate with literature review by Moser, Isaksson and Seifer (2018)
conclusion that good demand planning enhances profitability through avoidance of
unnecessary costs.
5.4 Conclusions
5.4.1 Forecasting on Inventory Optimization
Forecasting in supply chains leads to a reduction in inventory holding at the specific inventory
holding locations in a supply chain by ensuring that overstocks are kept low at any time.
Forecasting also ensures that out of stock situations are kept to the minimum to count and
reduces the length of out of stock period. There is a direct link between inventory forecasting
and inventory optimization with forecasting leading to lean inventory holding across the
organization. Therefore, customer orders are met when placed and supply chain inventory
holding costs are kept low. Sales Inventory and Operations planning accurately guides the
inventory quantities to carry at a given time and improves the accuracy of forecasts generated
as SI&OP gathers information and guiding data from many sources resulting in close to
accurate forecasts.
5.4.2 Supplier Collaboration on Inventory Optimization
Supply chain collaboration leads to inventory optimization as partnering among the supply
chain players increases supply chain reliability through prevention against compromise of
security of supply such as infrastructure related failures, crisis scenarios, financial and scarcity

49
issues and ensuring anticipation of issues likely to arise. Further Early Supplier involvement
increases the reliability of supply chains through reduction of supply risk associated with
products and suppliers in new product development. The study concludes that supplier
partnering leads to increased supply chain reliability and that Early Supplier Involvement
increases supply chain reliability and that Collaborative Planning Forecasting and
Replenishment ensures suppliers remain in stock. The study further concludes that Electronic
Data Interchange influences supply chain reliability to a large extent and that Early Supplier
Involvement as a factor that influences supply chain reliability.
5.4.3 Demand Planning on Supply Chain Performance
On demand planning and supply chain performance the study concludes that demand planning
is critical in reduction of supply chain costs and that demand planning enables better visibility
of supply chain costs optimization; that demand planning reduces mismatch of processes along
the supply chain and that ddemand pplanning reduces uncertainties along the supply chain.
Additionally, the study concludes that Sales Inventory and Operations Planning influences
supply chain costs to a large extent. Forecast Reviews as a factor that influences supply chain
costs to a large extent and that Market intelligence and information sharing, Materials
Requirement Planning and Supply chain integration influence supply chain costs
Finally, on the correlation between supply chain performance and the studied variable, the
study concludes that the supply chain performance is positively significantly correlated to
Forecasting, Supplier Collaboration and Demand Planning as shown by spearman’s rho
correlation as reported by positively and significant correlation coefficients.
5.5 Recommendations
5.5.1 Recommendations for Improvement
5.5.1 Forecasting on Inventory Optimization
The study recommends forecasting in inventory since forecasting is the epicenter of all Supply
Chain Management activities which triggers all other activities both within and outside the
organization. Forecasting is the key driving factor in planning and decision making in SCM as
well as enterprise level and that companies that companies that perform exceptionally well rely

50
on true numerical value of forecasting to make decisions in capacity building, resource
allocation, expansion, process scheduling among others.
5.5.2 Supplier Collaboration on Inventory Optimization
The study further recommends operations and supply chain strategy which is a key saving
opportunity beginning with analyzing the service needs of customers and implementing a
demand-planning strategy then developing product movement protocols based on customer
segmentation. The more streamlined operations are, the more efficient a business will likely
be.
5.5.3 Demand Planning on Supply Chain Performance
Finally, the study recommends enlist Routine Demand Forecasting as a key strategy for
organizations seeking to reduce their supply chain costs since using manually edited, arithmetic
or stochastic forecasting models to reduce forecast error will reduce overstock, backorders, and
the need for lateral or reverse logistics, holding inventory levels closest to only that which is
required to support the desired customer service level. Editing history to eliminate non-
recurring promotions and to compensate for out-of-stock situations is key.
5.5.2 Recommendation for Further Studies
Like all other studies, this study was not without its limitations. One of the key limitations to
the study was about its scope, which was limited to FMCGs in Kiambu and Nairobi counties.
This is likely to invite a bias in representing the FMCGs in Kenya because those included in
the sample arguably had established and improved supply chain structures, a factor which
itself, has an influence on performance. Another study which considers the supply chain
structure and learning in supply chains should be carried out to corroborate the results of this
study.
In retrospect, the study also had other methodological drawbacks such as its sample size,
which, although representative of the target population, may not accurately represent the entire
population of the FMCGs in Kenya. In addition, other organizations to which supply chain
performance is critical were not represented, thus, it became difficult to make comparisons.
Therefore, while this study is sufficient as far as the case study and the objectives were

51
concerned, a future study which addresses these methodological gaps is necessary to validate,
or otherwise, the outcomes of this study.

52
REFERENCES
Ahmed, M. (2016). Seven reasons why you need to forecast in supply chain. Supply Chain
Digital.
Albarune, A. R., & Habib, M. (2015). A Study of Forecasting Practices in Supply Chain
Management. International Journey of Supply Chain Management, 55-56.
Angkiriwang , R., Pujawan, N., & Santosa, B. (2013). Managing uncertainty through supply
chain flexibility: reactive vs. proactive approaches. Production and Manufacturing
Research Journal.
Benchmarking Success. (2016, April 28). Supply Chain Performance. Retrieved from
Benchmarking Success: https://www.benchmarkingsuccess.com
Blaikie, N. W. (2003). Analyzing Quantitative Data;From Description to Explanation.
California: SAGE Publications Ltd.
Bowersox, D. J., Closs, D. J., & Cooper, B. M. (2002). Supply Chain Logistics Management.
New York: McGrawHill.
Bozarth, C. B., & Handfield, . R. (2016). Introduction to Operations and Supply Chain
Management. Essex: Pearson Eduction Limited.
Brent, M. (2014, April 15). Entrepreneur. Retrieved from Entrepreneur:
https://www.entrepreneur.com
Brian, B. (2011). The Planning Process for Sales Inventory Operations. Business Planning
and Strategy, 10.
Brian, M., & Henry, C. (2014). Demand Forecasting: The Key to Better Supply-Chain
Performance. The Boston Consulting Group.
Butcher, D. (2011). How to Deal with Uncertainty in the Supply Chain. Thomas Industry
Update.
Caffrey, B. M. (2014). Demand Forecasting: The Key to Better Supply Chain Performance.
bcg.perspectives, 1-4.
Carr, K. (September 25, 2017). 26 Minutes to Understanding How Demand Driven Planning
is Revolutionary. Manufacturing Works.
Cecere, L. (2014). The Most Efficient Supply Chain Is Not the Most Effective. Forbes.
53
Cecere, L. (2015). Logistics & Transportation. Why Is Sales and Operations Plannning So
Hard?, 1-2.
Chad, S. (2015). Unlocking the Secret to Demand Driven Materials Requirement Planning .
The Power of Decoupling, 6-8.
Chopra, S., & Meindl, P. (2001). Supply Chain Management;Strategy, Planning and
Operation. New Jersey: Prentice Hall.
Clive, P. A., & Cox, R. (2011, August 1). 25 Ways to Lower Inventory Costs. Supply chain
Management Reveiw.
Cooper, D., & Schindler, P. (2010). Business Research Methods. New York: McGraw-Hill
Education.
Coyle, J. J., Langley, C. J., Novack, R. A., & Gibson, a. . (2013). Supply Chain Management:
A Logistics Perspective. Mason OH: South Western / Cengage Learning .
Degun, G. (2014). Prepare for more pre-market engagement, DFID tells suppliers. Supply
Management.
Demand Driven Institute. (2011). Demand Driven Institute. Retrieved from Demand Driven
Institute: https://www.demanddriveninstitute.com/dictionary
Denscombe, M. (2014). The Good Research Guide. London : McGraw-Hill Education (UK.
Elena Ciancimino, S. C. (2012). On the Bullwhip Avoidance Phase: The Synchronised
Supply Chain. European Journal of Operational Research, 60-61.
Ericson, M. (2004). Strategic change : dualism, duality, and beyond. Copenhagen:
Copenhagen Business School Press.
Faertes, D. (2015). Reliability of Supply Chains and Business Continuity. ScienceDirect.
Farasyn, I., Humair, S., Kahn, J. I., Neale, J. J., Rosen, O., Ruark, J., . . . Willems, S. P.
(2011). Inventory Optimization at Procter & Gamble:Achieving Real Benefits
Through User Adoption of Inventory Tools. Interfaces Vol. 41(1), 66-78.
Fillard, B., Frahm, S., & Amy Mercer, a. K. (2011, January 24). Definition: Developing
Collaborative Supplier Partnerships. Supply Chain Management Professional
Newsletter.
Fritsch, D. (2015). 5 Inventory Reduction Strategies for a More Profitable 2016. easystock
Blog.

54
Gros, I., & Grosova, S. (2004). Demand Chain Management-New Approach for Logistics
and Marketing Collaboration. The International Journal of Transport & Logistics, 14-
15.
Handfield, Scannell, R., & Vincent, a. T. (2000, January 15). Avoid the Pitfalls in Supplier
Development. MIT Sloan Management Review.
Hau, L. (2002, January 31). Managing a supply chain is becoming a bit like rocket science.
The Economist, p. 1.
Hertz, S. (2001). Dynamics of alliances in highly integrated supply chain networks.
International Journal of Logistics, 4 (2), 237-256.
Janvier, J., & Mbang, A. (2012). A New Introduction to Supply Chains and Supply.
International Business Research Vol 5 (1), 195.
Joakim, W. (2014). On decoupling points and decoupling zones. Production and
Manufacturing Research, 167-215.
Johnsen, T. (2009). Supplier involvement in new product development and innovation:
Taking stock and looking to the future. Journal of Purchasing and Supply
Management,Vol.15(3), 187-197.
Johnson, R. (2009). Sales Planning During an Economic Crisis. Supply House Times 52(5),
86-90.
Juliana, H. M., & Skjott-Larsen, T. (2006). Platform management: Implication for new
product development and supply chain management. European Business Review,
Vol.18(3),, 214-230.
Kaipia, R., Holmstrom, J., Småros, J., & Rajala, R. (2017). Information sharing for sales and
operations planning: Contextualized solutions and mechanisms. Journal of
Operations Management.
Kim, S. M., & Mahoney , J. T. (2006). Collaborative Planning, Forecasting, and
Replenishment (CPFR) as a Relational Contract: An Incomplete Contracting
Perspective. International Journal of Logistics.
Kot, Grondys, & Szopa. (2011, March). THEORY OF INVENTORY MANAGEMENT
BASED ON DEMAND. POLISH JOURNAL OF MANAGEMENT STUDIES.
Krause, D. R., Handfield, R. B., & Tyler, B. B. (2007). The relationships between supplier
development, commitment, social capital accumulation and performance
improvement. Journal of Operations Management 25 (2), 528-545.

55
Kumar, R. (2011). Research Methodoloy: A Step-by-Step guide for beginners. New Delhi:
SAGE Publications India Pvt Ltd.
Lia , O., de Sousa , J., & Claro, J. (2012). Dealing with uncertainty in modern supply chains:.
Supply Chain Strategy.
Lim, D., & Palvia, P. (2011). EDI in strategic supply chain: impact on customer service.
International Journal of Information Management.
Malhotra, S. (2014). A Study on Marketing Fast Moving Consumer Goods (FMCG).
Intenational Journal of Innovative Research and Development Vol 3 (1), 1-2.
Marino, & Donati. (2015, July 12). Partner with suppliers to cut supply chain risks, expert
advises. SUPPLY MANAGEMENT.
Mendes, P. (2011). Demand Driven Supply Chain. A Structural and Practical Roadmap to
Increase Profitability. Springer.
Monczka, R., Trent, R., & Handfield, R. (2005). Purchasing and Supply Chain Management.
Stamford: Thomson international 3rd edition.
Mondon, C. (2016). Missing Links. 32 Haviland Street, Suite 3,South Norwalk: Industrial
Press, Inc.
Moore, C. (2017, January 17). 6 Simple Strategies to Decrease Supply Chain Costs. Business
2 Community.
Moser, P., Isaksson, O., & Seifer, R. (2018). How process industries can improve supply
chain performance. Supply Chain Quarterly .
Moser, P., Isaksson, O., & Seifert, R. (2017). How process industries can improve supply
chain performance. Supply Chain Strategy.
Muddassir, A. (2016, July 16). Retrieved from Muddassirism:
http://muddassirism.com/supplier-partnership-vs-traditional-view/
Muhatia. (2017, April 18). BIZNEWS. Retrieved from BIZNEWS:
http://biznews.co.ke/2017/04/18/nairobi-ranks-as-leading-destinations-for-fortune-
500-companies-establishing-international-headquarters/
O'Byrne, R. (2011). 7 ways everyone can cut supply chain costs. Supply Chain Strategy.
Orlicky, J. (1975). Material Requirements Planning: The New Way of Life in Production and
Inventory Management. McGraw-Hill.
Pepe, V. (2016, July 11). Interempresas. Logistics Warehousing and Transportation, p. 3.
56
Pfeffer, Jeffrey and Gerald R. Salancik. (2003). The external control of organizations :The
external control of organizations: a. Stanford: Stanford Business Books.
Priscilla, Y. C. (2011). Fashion retailing in China: An examination of its development and
issues. Hong Kong: Emerald Group Publishing Limited.
Ptack, C., & Smith, C. (2011). Orlicky's Materials Requirement PLanning. McGraw Hill.
Ray, S. K., Basak, A., Fatema, K., & Seddiqe, M. M. (2016). Study on Supply Chain
Management of Industries in FMCG. Global Journal of Researches in Engineering.
Reuben, S., John, M., & Dittmann, P. (2007). Are You the Weakest Link in Your Company’s
Supply Chain? Harvard Business Review.
Rob, O. (2016). Reducing Supply Chain Costs. Logistics Bureau.
Saunders, M., Lewis, P., & Thornhill, A. (2009). Research Methods for Business Students.
Edinburgh: Pearson Education Limited.
Sheldon, D. H. (2014). World Class Sales And Operations Planning : A Guide To Successful
Implementation And Robust Execution. Alexandria: J.Ross Publishing.
Slack, N., Chambers, S., & Johnston, R. (2010). Operations Management. Essex: Pearson
Education Limited.
Slone, R., Dittmann, J. P., & Mentzer, J. T. (2010). The New Supply Chain Agenda: The 5
Steps That Drive Real Value. Cambridge: Harvard Business Press.
Tan. (2008). Supply Chain Collaboration. New Solutions Needed for Mass Collaboration.,
60-78.
Veloso, F., & Fixson, S. (2001). Make-buy decisions in the auto industry: New perspectives
on the role of the supplier as an innovator. Technological Forecasting and Social
Change,Vol.67(2/3), 239-257.
Vinder, S., & Karin, B. (2013). The Practical Approach to SI&OP. Logility Planning
Optimized, 5-12.
Vitasek, K. L., Manrodt, K. B., & Kelly, M. (2003). Solving the Supply-Demand Mismatch.
S UPPLY C HAIN M ANAGEMENT REVIEW, 58-64.
Voluntary Interindustry Commerce Standards . (2004, May 2004). Collaborative
Planning,Forecasting and Replenishment. Retrieved from GS1:
https://www.gs1us.org

57
Webb, J. (2017, April 27). What Is Supplier Development? Three Levers To Get The Most
From The Supply Base. Forbes.
Weele, A. V. (2010). Purchasing and Supply Chain Management: Analysis, Strategy,
Planning and Practice. Andover: Cengage Learning.
Willems, S. P. (2011, March 19). How Inventory Optimization Opens Pathways to
Profitability. Supply Chain Management Reveiw.
Wilmjakob, H. (2014). The Bullwhip Effect in Expanded Supply Chains and the Concept of
Cumulative Quantities. In B. Thorsten, & W. K. Ringle, Innovative Methods in
Logistics and Supply Chain Management (pp. 515-527). Berlin: epubli GmbH.
Yossi, S. (2005, Auust 22). A Demand for Steady Supply. Financial Times.
Zsidisin, G., & Smith, M. (2005). Managing Supply Risk with Early Supplier Involvement:
A Case Study and Research Propositions. The Journal of Supply Chain Management:
A Global Review of Purchasing and Supply.
Zuyderduyn, J. (2011, January 22). Make-to-order vs make-to-stock: implications for your
ERP system. Retrieved from Software Shortlist.Com:
http://www.softwareshortlist.com
58
Appendix I: Questionnaire
Dear Respondent,
This is an academic research on the “Demand Planning on Supply Chain Performance”.
Fast Moving Consumer Goods organizations have been used as the case study. You have been
selected to participate in this research in your capacity as an employee in a target
organization. This questionnaire is made up of four short sections that should take only a few
moments of your time. Kindly fill in your responses by ticking in the appropriate box or writing
your answers on the spaces provided.
Thank you.
For any further clarification, please feel free to contact:
Humphrey Murigi Awanga,
The Principal Investigator
United States International University
Phone 0716 732 828
SECTION A: PERSONAL FACTORS
1. Gender:
Male
Female
2. What is your age group?
Below 25 years
25 – 30 years
Over 30 years
3. Marital Status?
Single
Married
Other (Please specify) __________________________________

59
4. What is your level of education?
Doctorate Graduate
Masters Graduate
Bachelors Graduate
A-Levels
O- Levels
Primary School
5. Which products does your organization deal with?
Alcohol
Baby Care
Food and Beverage
House hold care
Personal Care
Other Specify______________________________________
6. What is your level of supply chain experience in years?
Below 5 years
5 – 10 years
10 – 15 years
15 – 20 years
Over 20 years
7. What position do you hold in employment?
Top Management
Senior Management
Level
Mid- Junior Level
Junior Level
Entry Level
60
SECTION B: FORECASTING
In the following statements, please tick against the answer that closely reflects your
opinion:
8. Does your organisations’ supply chain perform inventory forecasting?
Yes No
If the answer to the above is yes, how long is the forecasting period?
Less than one month One Month 2 to 5 months 6 to 12 months
Longer than 12 months
In the following statements, please tick against the answer which closely reflects your
opinion
Str
on
gly
agre
e
Agre
e
Neu
t
ral
Dis
a
gre
e
Str
on
gly
dis
ag
ree
9. Forecasting leads to a reduction in
inventory holding in the organization.
10. There is a direct link between inventory
forecasting and inventory optimization.
11. Sales Inventory and Operations Planning
accurately guides the inventory quantities
to carry at a given time.
12. Forecasting reduces out of stock situations
along the supply chain.
13. Sales Inventory and Operations Planning
improves the accuracy of forecasts
generated.
14. If you would change one thing about Forecasting at you workplace, what would it be?
_______________________________________________________________
__

61
SECTION C: SUPPLIER COLLABORATION
In the following statements, please tick against the answer which closely reflects your
opinion:
Str
ongly
agre
e
Agre
e
Neu
tral
Dis
agre
e Str
ongly
dis
agre
e
15. Supply chain partnering increases
supply chain reliability
16. Early Supplier Involvement
increases supply chain reliability
17. Collaborative Planning
Forecasting and Replenishment
ensures suppliers remain in stock
To what extent do the following Supply Chain Partnering factors influence reliability of the
supply chain your organization is involved in?
Ver
y
larg
e
exte
nt
Lar
ge
exte
nt
Lit
tle
exte
nt
No e
ffec
t
18. Electronic Data Interchange
19. Early Supplier Involvement
20. Supplier Development
21. Collaborative Planning
Forecasting and
Replenishment
22. If there were one thing you could change about the way supply chain collaboration is
managed at your workplace, what would it be? ________________________________

62
Explain___________________________________________________________
__________________________________________________________________
____________
23. Any other comments or suggestions?
__________________________________________________________________
__________________________________________________________________
__________________________________________________________________
SECTION D: DEMAND PLANNING
In the following statements, please tick against the answer that closely reflects your
opinion:
S
tron
gly
agre
e
Agre
e
Neu
tr
al
Dis
ag
ree
Str
on
gly
dis
agr
ee
24. Demand planning is a critical in
reduction of supply chain costs
25. Demand planning enables better
visibility of supply chain costs
26. Demand planning reduces
mismatch of processes along the
supply chain.
27. Demand Planning reduces
uncertainties along the supply
chain

63
To what extent do the following demand planning factors influence supply chain cost reduction
in the organization you work for?
Ver
y
larg
e
exte
nt
Lar
ge
exte
nt
Lit
tle
exte
nt
No e
ffec
t
28. Sales Inventory and
Operations Planning
29. Forecast Review
30. Market intelligence and
information sharing
31. Materials Requirement
Planning
32. Supply chain integration
33. Please rank the following demand planning factors by order of importance to you:
Forecasting _________
Sales Inventory and
Operations planning _________
Supplier Collaboration _________
Supply Chain integration_________
Supplier Development _________
34. If there was one thing you could change about demand planning at your workplace,
what would it be?
__________________________________________________________________
Explain?
__________________________________________________________________
_______________________________________________
64
35. Any other comments or suggestions?
__________________________________________________________________
__________________________________________________________________
SECTION E: SUPPLY CHAIN PERFORMANCE
In the following statements, please tick against the answer that closely reflects your
opinion:
Str
ongly
agre
e
Agre
e
Neu
tral
Dis
agre
e
Str
ongly
dis
agre
e
36. Demand planning is a critical in
reduction of supply chain costs
37. Demand planning enables better
visibility of supply chain costs
38. Demand planning reduces
mismatch of processes along the
supply chain.
39. Demand Planning reduces
uncertainties along the supply
chain
*** Thank you for your time and cooperation ***