Demand Analysis and Business Model Report - Kent Demand... · 2 Final Demand Analysis and Business...
44
Kent Lorry Parks Feasibility Study Demand Analysis and Business Model Report 28 February 2014
Transcript of Demand Analysis and Business Model Report - Kent Demand... · 2 Final Demand Analysis and Business...

Kent Lorry Parks Feasibility StudyDemand Analysis and Business Model Report28 February 2014

Within this commission AECOM is not giving investment advice. The truck park assessments asset out in this report are based on a series of assumptions as set out in the report and associatedtechnical notes and as agreed between AECOM and Kent County Council. The outcome ofassessments are directly driven by the assumptions and the data used for the assessments andsubject to uncertainty. Whilst the uncertainty of the assessments can be the subject of a riskanalysis, the remit of this work does not include undertaking of risk analysis.
Prepared by: ............................. Checked by: .............................................Johan Els Jonpaul SimpsonPrincipal Consultant Project Manager - Transportation
Approved by: ............................John HixRegional Director
Rev No Comments Checked by Approvedby
Date
1 Draft Final Report JH 15 Oct 20132 Final Demand Analysis and Business Model Report JH 28 Feb 2014
9th & 10th Floors, Sunley House, 4 Bedford Park, CR0 2APTelephone: 020 8639 3500 Website: http://www.aecom.com
Job No 60305766 Reference Date Created 28 Feb 2014
This document has been prepared by AECOM Limited for the sole use of our client (the “Client”) and in accordance withgenerally accepted consultancy principles, the budget for fees and the terms of reference agreed between AECOM Limited andthe Client. Any information provided by third parties and referred to herein has not been checked or verified by AECOM Limited,unless otherwise expressly stated in the document. No third party may rely upon this document without the prior and expresswritten agreement of AECOM Limited.

1 Introduction................................................................................................................................................................ 2
2 Parking Choice Behaviour ......................................................................................................................................... 5
3 Potential Ownership Models for Truck Parking ....................................................................................................... 15
4 Demand Forecasting ................................................................................................................................................ 19
5 Financial Modelling .................................................................................................................................................. 26
6 Modelling Outcomes ................................................................................................................................................ 33
Table of Contents

Introduction

AECOM Demand Analysis and Business Model Report 2
1.1 Introduction
In this report we provide a short recap on the locations identified as potential sites for truck parking as detailed in the demandand analysis business model. Section 2 gives an updated view on international freight drivers’ parking choice behaviourincluding the possible impact of the proposed UK HGV levy. Section 3 provides a brief commentary on risks and benefits of thevarious ‘ownership’ models for KCC and this will be further informed by the outcomes of the financial analysis. Our demandforecasting methodology, assumptions and outcomes are laid out in Section 4. Section 5 explains our adopted approach to thefinancial modelling of the selected sites and outcomes are detailed in Section 6. Finally in Section 6 we draw conclusions on thepossible selection of a preferred single site.
1.2 Proposed Suitable SitesAECOM went through an iterative process to arrive at a list of shortlisted sites that will be most suitable for lorry parks in Kent.The process started by developing a list of sites that were identified from previous studies.
The next stage of the process was to have confidential discussions with the Local Authorities within Kent County Council and theHighways Agency regarding the list of sites.
In conjunction with KCC the study team developed a set of detailed assessment criteria which captured all relevant aspects ofdecision making to assess the list of sites to determine the most suitable sites for lorry park development. The criteria againstwhich each site was assessed are grouped into five areas:
Transport
Site Characteristics
National and International Environmental Considerations
Local Environmental Considerations
Planning Considerations
All sites under consideration were visited in person by the consultant, in order to assess each site’s physical characteristics. Thisallowed access to the sites to be assessed, along with aspects such as the site’s shape and topography, and the character of theenvironment around the sites.
1.3 Shortlisted SitesThe table below shows the short listed sites identified by the site assessment process as most suitable for lorry parkdevelopment within Kent. The list of sites is in the order of ranking.
SiteID
Name/Description
SizeHa
Capacity(Trucks) Located
On
NearestTrunkRoad/Junction Grid Ref
Authority/District LAT LONG
A2/M2 Corridor
57White CliffsBusiness Park 1
3 234 A2 A2/A256 TR313443 Dover 51.15125 1.30541
21
A2/Coxhill Road,Shepherdswell(east)
24 1,872 A2 A2 TR249469 Dover 51.17708 1.21624
20
A2/Coxhill Road,Shepherdswell(west)
4 312 A2 A2 TR247469 Dover 51.17716 1.21338
1 Introduction

AECOM Demand Analysis and Business Model Report 3
SiteID
Name/Description
SizeHa
Capacity(Trucks) Located
On
NearestTrunkRoad/Junction Grid Ref
Authority/District LAT LONG
M20/A20 Corridor
8
Westenhanger(site behind STOP24)
6 468 M20 J11 M20 TR136369 Shepway 51.09162 1.04890
56Lympne IndustrialEstate
2 156 M20 B2067 TR112359 Shepway 51.08319 1.01395
6
Site adjacent toAshford Int'l TruckStop
11 858 A2070 J10 M20 TR033397 Ashford 51.12051 0.90360
12
East of Stanford(site opposite M20from STOP 24)
16 1,248 B2068 J11 M20 TR133375 Shepway 51.09712 1.04498
5
Site Adjacent toMaidstone MSA,Hollingbourne
11 858 M20 J8 M20 TQ828551 Maidstone 51.26574 0.61885
Table 1.1 - Short-listed Sites
1.4 Report StructureThe structure of the remaining sections of the report is as follows:
Chapter 2 – Parking Choice Behaviour
This chapter examine the various aspects of why freight drivers choose to park in Kent and the factors that influence their parkingpreference.
Chapter 3 – Potential Ownership Models for Truck Parking
This chapter provides a short overview of the different types of ‘ownership’ models that might be deployed for truck parkingfacilities.
Chapter 4 – Demand Forecasting
This chapter sets out the methodology on how the project team has forecasted the level of demand for truck parking between2014 and 2060.
Chapter 5 – Financial Modelling
This chapter gives a description of the financial model developed for the financial analys.
Chapter 6 – Modelling Outcomes
This chapter sets out the results of the financial model runs for the various sites.

Parking Choice Behaviour

AECOM Demand Analysis and Business Model Report 5
2.1 IntroductionIn this section we examine the various aspects of why freight drivers choose to park in Kent and the factors that influence theirparking preferences. A reasonable amount of primary data has been gathered over recent years on this matter and we seek toidentify any major shifts that will influence trends going forwards, including the forthcoming HGV Levy.
2.2 Reasons for Stopping in KentThe reasons why international freight drivers have a tendancy to take an overnight rest in Kent were explored in the workundertaken for KCC by AECOM in 20051. Almost half of the drivers stated that the main reason they parked overnight in Kentwas to do with running out of Drivers’ Hours (Figure 2.1). This went up to 65% of Central European Drivers. At the time concernsover immigrants getting into vehicles in France, while the vehicle was parked was the number one reason for 20% of drivers.
Figure 2.1 - Reasons for Stopping in Kent
Whilst such concerns about stowaways have subsided, the behavioural trait of making the Channel crossing then taking a breakdoes not seem to have subsided and there has been no change in Drivers’ Hours legislation to indicate that simply running out ofdriving time wouldn’t still be a significant reason for stopping in Kent today. Indeed there is evidence from the current providers oftruck parking in Kent that some operators will in-fact create their European distribution schedules to specifically factor inovernight rests at a particular truck park.
An interesting trait does seem to have developed in recent years and that is the apparent increasing demand for weekendparking, principally by eastern European hauliers. The split between UK, European and eastern European lorries is set out inTable 2.1.
1 Kent Overnight Lorry Parking Study, July 2005, AECOM
2 Parking Choice Behaviour
49%
10%
20%
5% 5%
5%2% 2%
2%
Run out of Driving Time
Not Stopping in Kent
Only MSA in Kent
Close to Destination
Location
Close/on route
Concerns over Illegal imigrants invehiclesSecurity
Waiting for ferry/ train

AECOM Demand Analysis and Business Model Report 6
Days Split
Monday to Thursday 60% European
20% Eastern European
20% British
Friday to Sunday 60% Eastern European
20% European
20% British
Table 2.1 – Split between UK, European and Eastern European Lorries per day of week (reported by a truckstop in Kent,2013)
From the table it is clear that during the week the majority of HGVs are Europeans and over weekends they are EasternEuropeans. It is not entirely clear the reasoning behind this activity but the ongoing opening of the haulage market, includingcabotage, to the EU-12 member states (Bulgaria, Cyprus, Czech Republic, Estonia, Hungary, Latvia, Lithuania, Malta, Poland,Romania, Slovakia, Slovenia) and their continued increase in the share of international markets (see Figure 2.2) means there arelikely to be more trucks from these destinations ‘camped out’ across European destinations who spend little or no time in theirhome country.
Figure 2.2 shows who is responsible for which international flows. In the biggest market, between EU-15 Member States, themajority of work is conducted by EU-15 hauliers, however in each of the other markets EU-12 hauliers conduct the majority of thework. This is due to a range of factors including those relating to lower operating costs.
Figure 2.2 – Role of EU-12 Member States in International Movements - % of Tonne Kilometres (2011)2
2 AECOM analysis of Eurostat, [road_go_ia_tc], 2013, Eurostat

AECOM Demand Analysis and Business Model Report 7
2.3 Routing BehaviourThe majority of international freight drivers make the cross Channel trip on a regular basis – 94% on a monthly or more regularbasis according to AECOM’s survey undertaken for the HA in 2006. Their routing, certainly in terms of planning and way-findingto and from the Channel ports tends to be knowledge based.
Routes tend to be planned in advance, but drivers show flexibility in their routing behaviour once underway – in particular driverswill use the M2/A2 route and the ‘cross’ routes of the A249, A229 and A260 to avoid accidents, road works and general trafficcongestion. Many say that their main source of traffic information is radio travel news bulletins.
Where a truck operator has a choice between using a ferry and Eurotunnel, just under a half do not make the final selection untiltheir journey is underway.
Not unsurprisingly, Eurotunnel traffic uses the M20 route. For Dover, around 60% of the freight traffic makes use of theM25/M26/M20/A20 route south of London. Around 20% uses the M25/M20/A20 route via the Dartford crossing. Around 15% oftraffic uses the M25/A2/M2/A2 route via the Dartford Crossing.
There is evidence that some drivers will seek to avoid the Dartford toll charge and route M25 south.
Drivers will actively select M2/A2 because of the greater availability of road-side rest locations and services.
From this evidence base, it is concluded that international freight drivers will continue to show flexibility in their choice of routes toand from the Channel Ports.
2.4 The UK HGV Levy and its Possible Impact on Overnight Truck ParkingAs of April 2014, lorries seeking to use roads in the UK will need to pay a time based charge related to the weight of the vehicle.It is hoped that this will go some way to equalising the costs of operation between EU- and UK-based operators, for whilst thecharge will be applied to all drivers, regardless of nationality, the UK government plans to reduce Vehicle Excise Duty (VED) bythe same amount, thus making the new charge broadly cost neutral for UK operators. This charge will essentially be equal to theEuropean vignettes or toll systems which charge all lorry drivers, whilst the UK’s system was based mostly on VED and fuel duty,which foreign truck companies were able to avoid paying.
The charged is based on the length of time that the lorry will be in the UK and its weight, with charges for the heaviest vehicles(of around 40,000kg) being equivalent to £10 a day or £1,000 for the year (the corresponding lightest charges are £1.70 and £85– with gradations in between based on weight). There are also options for weekly and monthly passes, which will be offered at adiscount to the price of the equivalent daily permits.
As to how this will impact on the use of Kent Lorry Parks, this need to be assessed in two separate contexts; the direct financialimpact of the levy and how long foreign-based vehicles spend in the UK.
2.4.1 Consultation and research undertaken by the AECOM project teamThe following were directly consulted on the potential impacts on truck parking of the proposed levy:
Freight Transport Association (FTA)
Road Haulage Association (RHA)
French Road Haulage Association (FNTR)
French Ministry of Transport (International Affairs Department)
UK Department for Transport (HGV Levy and Charging section)
Interestingly FTA reported that it had ‘heard’ but could not substantiate that parking would increase around Calais as driverswould wish to avoid paying the levy for what would effectively be ‘downtime’. None of the other consultees could substantiate

AECOM Demand Analysis and Business Model Report 8
this possibility and were not aware of the issue. A search on Google France and of the French newspaper ‘Voix du Nord’ has notrevealed any further information either.
The Department for Transport contact reported that foreign operators were likely to consolidate the number of vehicles used forUK/International haulage to reduce overall payments but that this would not impact on overall trips.
2.4.2 UK Department for Transport Consultation Exercise on the HGV Levy3
The following provides an analysis of the UK Department for Transport Consultation on the levy that was conducted betweenJanuary and April 2012 and published in October 2012.
Cost Impacts
Essentially this comes down to a question of how price-sensitive hauliers are. The Government, in its own consultation on theintroduction of the Levy, set out to find this information, asking two questions, with selected responses appearing below:
Question 6: The Government is not aware of any specific evidence on the price sensitivity of transport by foreign-registered HGVs in the UK, or whether there are markets which are particularly price sensitive. Do you have anyinformation on this issue?
“In general the haulage industry operates a business model of high volumes and low margins to achieve profitability. This doesmake the industry price sensitive, particularly to rising input costs including fuel and staffing costs”.
The Government’s response: The consultation elicited many views suggesting that charging would have an impact, butquantifying the impact remains a challenge.
Question 7: If you are a road transport operator licensed elsewhere in the EU or a customer of such an operator, howmight the HGV user charge affect your business (please justify by evidence where possible)?
“£10 per day will not affect foreign hauliers or anyone else”
“Many of our contracts contain provisions that allow ‘legislative costs’ to be recharged to the customer who will decide whether topass on costs to the end-user”
“The cost of the proposed road tax would be absorbed without any effect on the customer as it would be less than 0.5% of thefreight cost”
The Government’s response: Again, the consultation elicited views suggesting that charging could have some impact, butquantification is difficult.
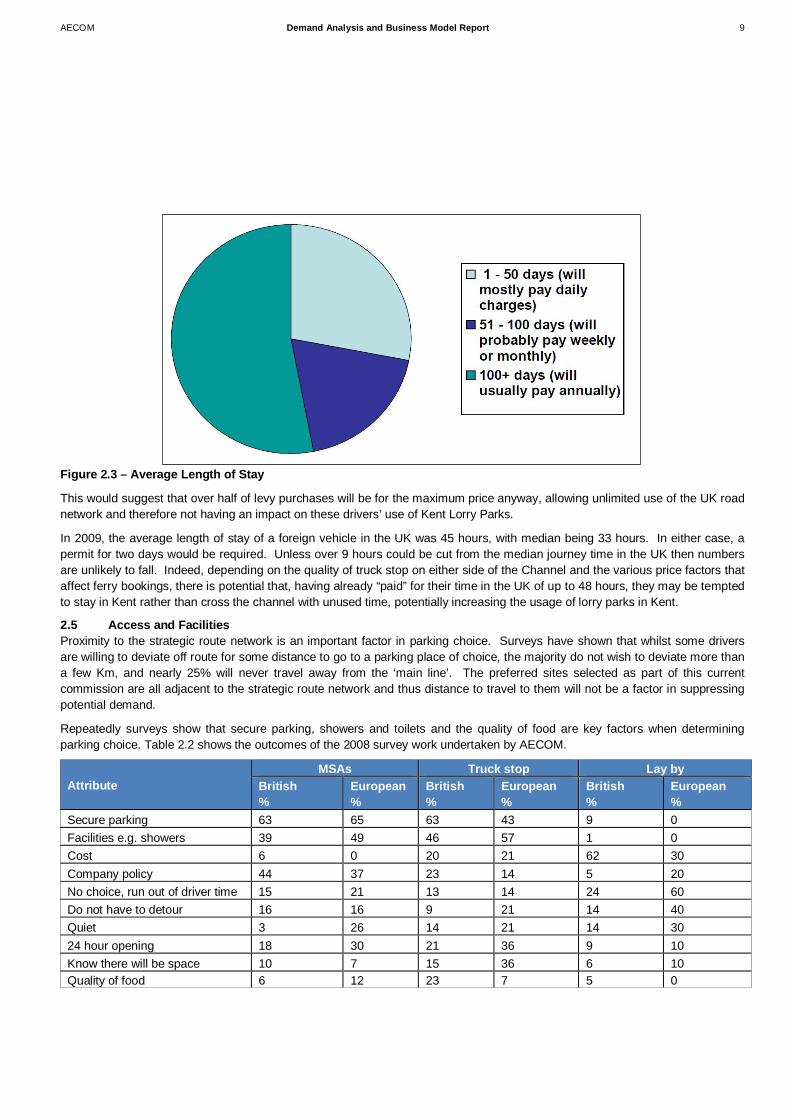
Average Length of Stay
Furthermore, the Government fully expects the majority of permits sold to be for periods of longer than one day:
3 https://www.gov.uk/government/consultations/charging-heavy-goods-vehicles-consultation
AECOM Demand Analysis and Business Model Report 9
Figure 2.3 – Average Length of Stay
This would suggest that over half of levy purchases will be for the maximum price anyway, allowing unlimited use of the UK roadnetwork and therefore not having an impact on these drivers’ use of Kent Lorry Parks.
In 2009, the average length of stay of a foreign vehicle in the UK was 45 hours, with median being 33 hours. In either case, apermit for two days would be required. Unless over 9 hours could be cut from the median journey time in the UK then numbersare unlikely to fall. Indeed, depending on the quality of truck stop on either side of the Channel and the various price factors thataffect ferry bookings, there is potential that, having already “paid” for their time in the UK of up to 48 hours, they may be temptedto stay in Kent rather than cross the channel with unused time, potentially increasing the usage of lorry parks in Kent.
2.5 Access and FacilitiesProximity to the strategic route network is an important factor in parking choice. Surveys have shown that whilst some driversare willing to deviate off route for some distance to go to a parking place of choice, the majority do not wish to deviate more thana few Km, and nearly 25% will never travel away from the ‘main line’. The preferred sites selected as part of this currentcommission are all adjacent to the strategic route network and thus distance to travel to them will not be a factor in suppressingpotential demand.
Repeatedly surveys show that secure parking, showers and toilets and the quality of food are key factors when determiningparking choice. Table 2.2 shows the outcomes of the 2008 survey work undertaken by AECOM.
AttributeMSAs Truck stop Lay by
British%
European%
British%
European%
British%
European%
Secure parking 63 65 63 43 9 0Facilities e.g. showers 39 49 46 57 1 0Cost 6 0 20 21 62 30Company policy 44 37 23 14 5 20No choice, run out of driver time 15 21 13 14 24 60Do not have to detour 16 16 9 21 14 40Quiet 3 26 14 21 14 3024 hour opening 18 30 21 36 9 10Know there will be space 10 7 15 36 6 10Quality of food 6 12 23 7 5 0
AECOM Demand Analysis and Business Model Report 10
AttributeMSAs Truck stop Lay by
British%
European%
British%
European%
British%
European%
Beds 2 0 1 0 0 0Base 62 43 94 14 78 10
Table 2.2 - Parking Attributes
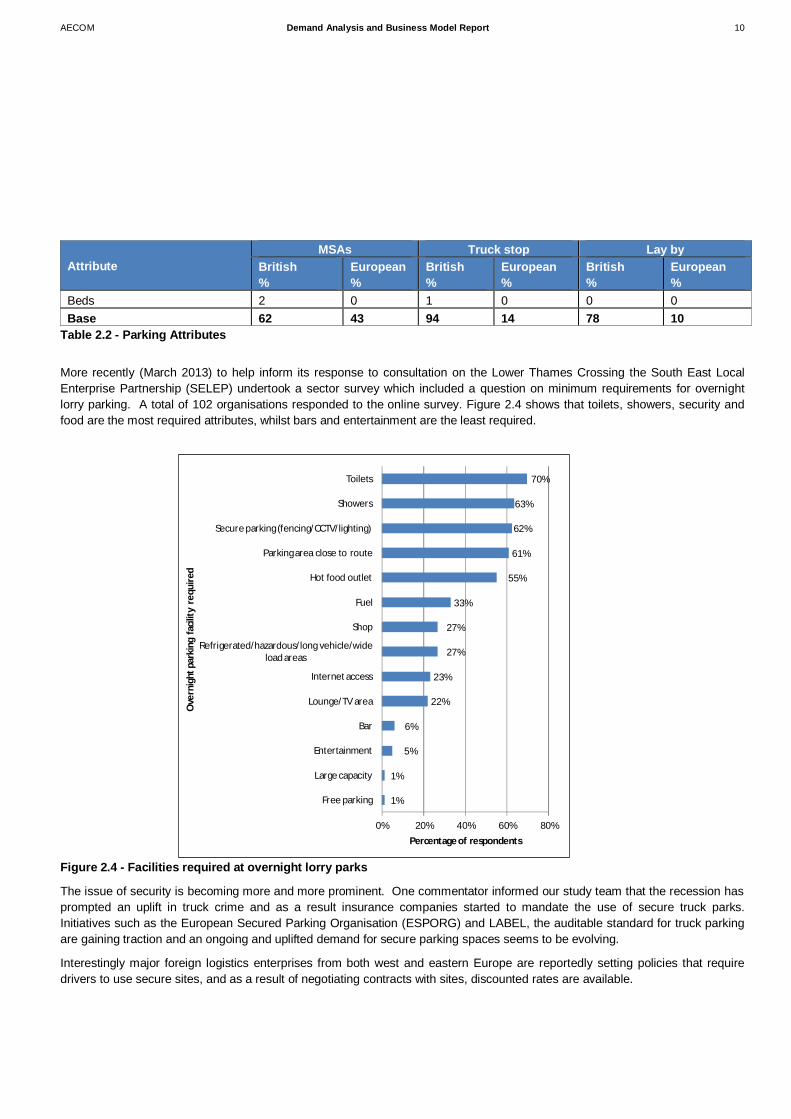
More recently (March 2013) to help inform its response to consultation on the Lower Thames Crossing the South East LocalEnterprise Partnership (SELEP) undertook a sector survey which included a question on minimum requirements for overnightlorry parking. A total of 102 organisations responded to the online survey. Figure 2.4 shows that toilets, showers, security andfood are the most required attributes, whilst bars and entertainment are the least required.
Figure 2.4 - Facilities required at overnight lorry parks
The issue of security is becoming more and more prominent. One commentator informed our study team that the recession hasprompted an uplift in truck crime and as a result insurance companies started to mandate the use of secure truck parks.Initiatives such as the European Secured Parking Organisation (ESPORG) and LABEL, the auditable standard for truck parkingare gaining traction and an ongoing and uplifted demand for secure parking spaces seems to be evolving.
Interestingly major foreign logistics enterprises from both west and eastern Europe are reportedly setting policies that requiredrivers to use secure sites, and as a result of negotiating contracts with sites, discounted rates are available.
1%
1%
5%
6%
22%
23%
27%
27%
33%
55%
61%
62%
63%
70%
0% 20% 40% 60% 80%
Free parking
Large capacity
Entertainment
Bar
Lounge/TV area
Internet access
Refrigerated/hazardous/long vehicle/wideload areas
Shop
Fuel
Hot food outlet
Parking area close to route
Secure parking (fencing/CCTV/lighting)
Showers
Toilets
Percentage of respondents
Ove
rnig
htpa
rkin
gfa
cility
requ
ired
AECOM Demand Analysis and Business Model Report 11
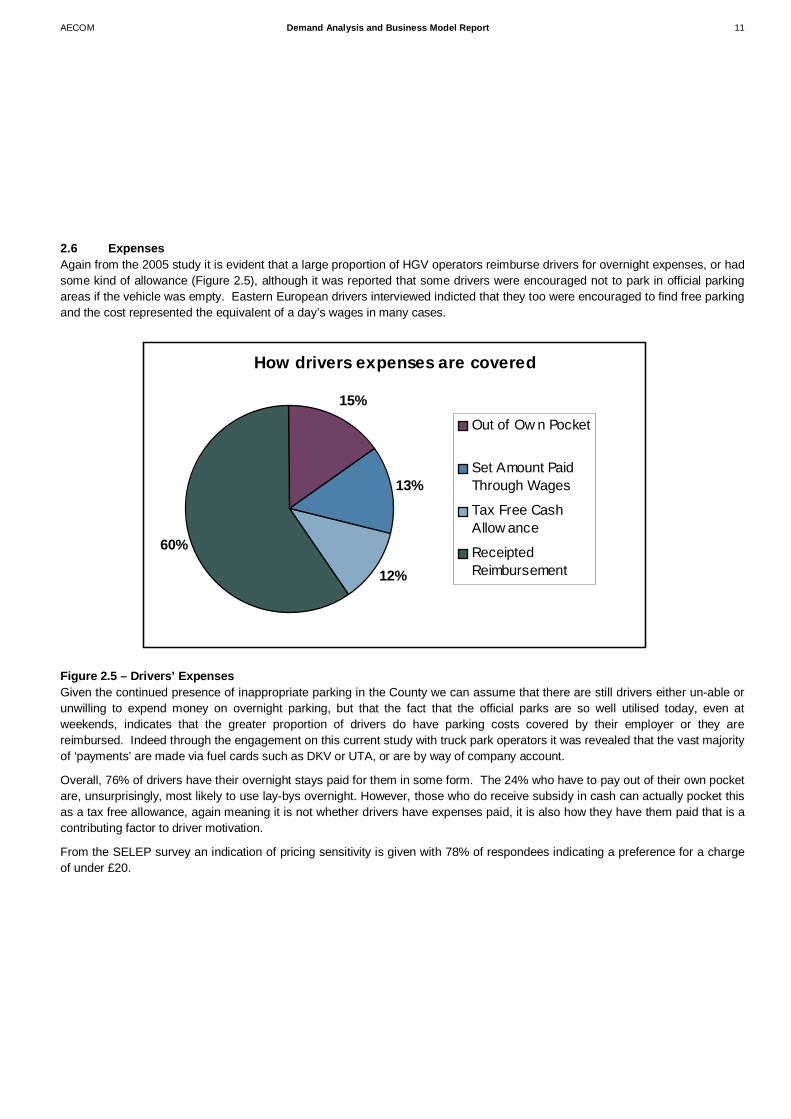
2.6 ExpensesAgain from the 2005 study it is evident that a large proportion of HGV operators reimburse drivers for overnight expenses, or hadsome kind of allowance (Figure 2.5), although it was reported that some drivers were encouraged not to park in official parkingareas if the vehicle was empty. Eastern European drivers interviewed indicted that they too were encouraged to find free parkingand the cost represented the equivalent of a day’s wages in many cases.
Figure 2.5 – Drivers’ ExpensesGiven the continued presence of inappropriate parking in the County we can assume that there are still drivers either un-able orunwilling to expend money on overnight parking, but that the fact that the official parks are so well utilised today, even atweekends, indicates that the greater proportion of drivers do have parking costs covered by their employer or they arereimbursed. Indeed through the engagement on this current study with truck park operators it was revealed that the vast majorityof ‘payments’ are made via fuel cards such as DKV or UTA, or are by way of company account.
Overall, 76% of drivers have their overnight stays paid for them in some form. The 24% who have to pay out of their own pocketare, unsurprisingly, most likely to use lay-bys overnight. However, those who do receive subsidy in cash can actually pocket thisas a tax free allowance, again meaning it is not whether drivers have expenses paid, it is also how they have them paid that is acontributing factor to driver motivation.
From the SELEP survey an indication of pricing sensitivity is given with 78% of respondees indicating a preference for a chargeof under £20.
How drivers expenses are covered
15%
13%
12%
60%
Out of Ow n Pocket
Set Amount PaidThrough Wages
Tax Free CashAllow ance
ReceiptedReimbursement

AECOM Demand Analysis and Business Model Report 12
Figure 2.6 – Stated Acceptable Payment for Overnight Lorry Parking
Recent dialogue with the Kent Police Commercial Vehicle Unit revealed that they felt there is a need to make parking a sensibleprice so drivers can afford it and that if there were more facilities for parking more parking restrictions could be invoked to deterinappropriate parking. For Bulgarians, Latvians, Lithuanians, Romanians and Turkish the pricing point for overnight parking isbetween £5 and £10 according to the Police.
2.7 SummaryFrom our discussions with truck parking providers in Kent it is clear that demand for good quality parking is outstripping supply,with trucks regularly being turned away (for example around 18 a night from Stop 24 and up to 15 from Ashford). There may ofcourse be an element of double counting here, but we deduce there is a proportion of freight traffic that is willing to pay forparking provision but can’t obtain it, or in other words ‘suppressed demand’.
Whilst initiatives such as ESPORG and the general ‘tightening’ of insurer controls do seem to be increasingly influential, andmore logistics companies negotiate contracts for parking provision, the Police report the need for enforcement action to tackleon-going inappropriate parking and it seems certain that high levels of inappropriate parking will be a common feature well intothe future.
Pricing policy will clearly be influential in the ability of KCC to impact on the volume of trucks using proper parking facilities. £20seems to be an important pricing point, with the Police suggesting a figure of around £5 - £10 being attractive to those hauliersleast willing to pay. However, our demand forecasts suggest that with the ongoing increase in international freight traffic, whilstsuppressed demand for parking may be catered for, there would need to be a huge uplift in parking provision to cope with alltruck parking.
The general tone of responses to the DfT consultation on the HGV levy is that whilst it won’t discourage foreign owned hauliersfrom operating in the UK, it should go some way towards rebalancing the discrepancy in costs between UK and European-basedoperations. Extrapolating from this, therefore, it could be argued that the industry does not expect there to be a significantchange in the amount of haulage or the routes taken by foreign trucks, pointing towards a negligible influence on the number offoreign lorry drivers staying at Kent lorry parks. Overall then, our analysis would broadly suggest that there will be little impact onthe usage of lorry parks, but Her Majesty’s Government themselves find this a difficult area to quantify.
Recent surveys have confirmed that drivers want good basic facilities that are secure. Stop 24 may provide a good securitymodel and whilst it does not meet LABEL’s top security standard, with its secure fencing, CCTV and key-coded ANPR barrier
Under £5, 2%
Under £10,25%
Under £15,18%Under £20,
35%
Under £25,13%
Under £30, 7%

AECOM Demand Analysis and Business Model Report 13
system it offers a satisfactory level of security. The increase in the volume of weekend parking, particularly from EU-15 haulierslooks to be an emerging trend, that will further enhance the business case for paid for parking.
Whilst rather subjective in nature we have attempted to reflect these factors of driver parking behaviour, willingness and ability topay in our demand forecasting – in particular a pricing point of under £20, the desire for good facilities and security, and a highlevel of demand, including weekend parking. Ultimately though, levels of enforcement will be a key driver of paid-for parkingdemand.

Potential Ownership Models forTruck Parking

AECOM Demand Analysis and Business Model Report 15
3.1 IntroductionThis section provides a short overview of the different types of ‘ownership’ models that might be deployed for truck parkingfacilities. We understand also that KCC are seeking to secure LEP Funding and Public Works Loan Board financing. Fourpossible operational models have been suggested by KCC. Under these scenarios KCC builds the lorry park and therevenue/financial risk can be retained by KCC or transferred in part or wholly to a private developer/operator.
Operating Model Operate the lorry park Revenue owner Financial risk owner
A Outsourced: fixed cost contract andoperator’s profit not linked withrevenue
KCC 100% KCC
B An agreement is made with a privatesector to run and maintain the siteand collect revenue over a certainperiod of time
Any financial risk/profit is sharedequally between KCC and a privatesector. KCC owns the site.
Up to 50% KCC
C An agreement is made with a privatesector to run, maintain and beresponsible for renewal of the site andto collect revenue over a longerperiod of time
Any financial risk would be taken byprivate sector and a certain proportionof the profit would be shared with KCC
0% KCC
D KCC sells a lorry park to a privatesector and gets all investment plusrepayments back from the privatesector
Private sector owns the site with noinvolvement from KCC
0% KCC
Table 3.1 – Operating models
These options will impact the eventual ownership/operational model and will need to be further investigated following theconclusion of the financial modelling being undertaken on the five selected sites. AECOM does not seek to provide specificrecommendations with this regard and a quantitative risk analysis could be undertaken to understand sensitivities in cost andrevenue and the impact on commercial viability in more detailed follow-on work if appropriate.
Pending this outcome the following provides the basic characteristics and associated benefits and risks of each model inoperational terms of the three standard models for the provision of overnight truck parking. These are:
Local Authority Built and Operated
Local Authority Built and Operated by Private Company
Private Developer Built and Operated
Importantly, a complete network of truck park and driver rest facilities need not simply adopt one model, but instead the networkcan be made up of a combination of the operation models. For example, KCC could build and operate truck parks at keystrategic locations and then create a standard that other private developers need to adhere to if they wish to provide additionalprovision on the strategic road network.
3 Potential Ownership Models forTruck Parking
AECOM Demand Analysis and Business Model Report 16
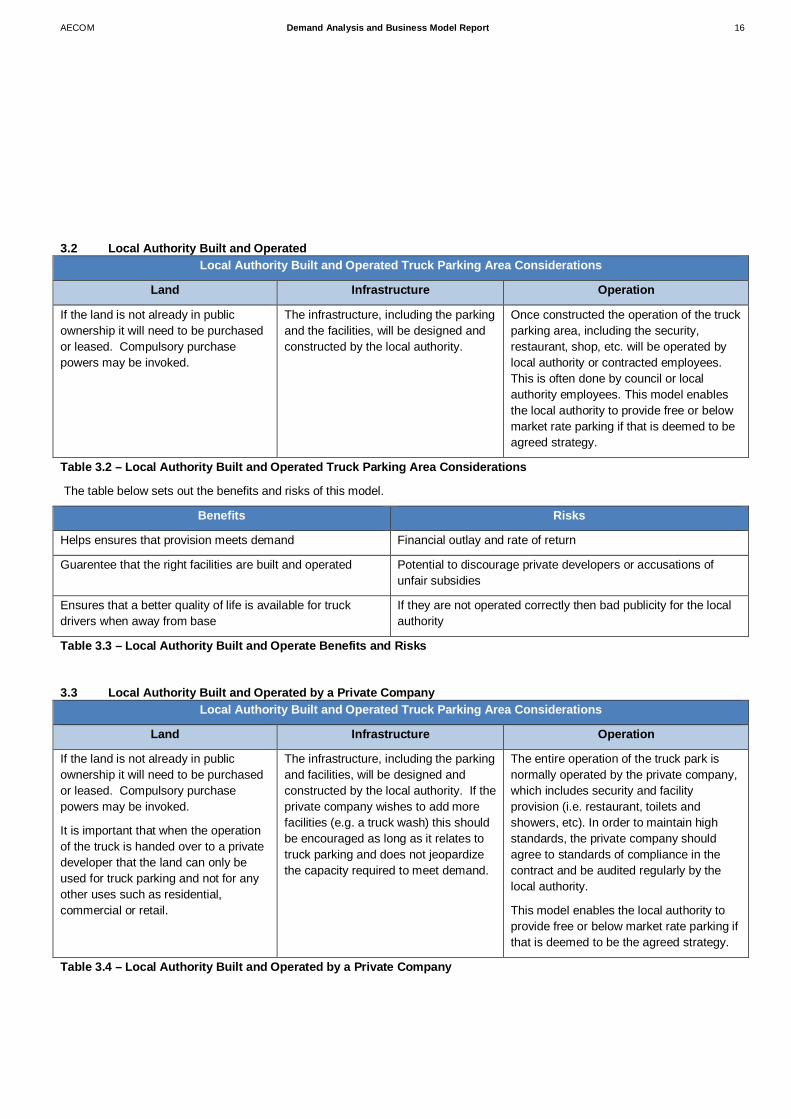
3.2 Local Authority Built and OperatedLocal Authority Built and Operated Truck Parking Area Considerations
Land Infrastructure Operation
If the land is not already in publicownership it will need to be purchasedor leased. Compulsory purchasepowers may be invoked.
The infrastructure, including the parkingand the facilities, will be designed andconstructed by the local authority.
Once constructed the operation of the truckparking area, including the security,restaurant, shop, etc. will be operated bylocal authority or contracted employees.This is often done by council or localauthority employees. This model enablesthe local authority to provide free or belowmarket rate parking if that is deemed to beagreed strategy.
Table 3.2 – Local Authority Built and Operated Truck Parking Area Considerations
The table below sets out the benefits and risks of this model.
Benefits Risks
Helps ensures that provision meets demand Financial outlay and rate of return
Guarentee that the right facilities are built and operated Potential to discourage private developers or accusations ofunfair subsidies
Ensures that a better quality of life is available for truckdrivers when away from base
If they are not operated correctly then bad publicity for the localauthority
Table 3.3 – Local Authority Built and Operate Benefits and Risks
3.3 Local Authority Built and Operated by a Private CompanyLocal Authority Built and Operated Truck Parking Area Considerations
Land Infrastructure Operation
If the land is not already in publicownership it will need to be purchasedor leased. Compulsory purchasepowers may be invoked.
It is important that when the operationof the truck is handed over to a privatedeveloper that the land can only beused for truck parking and not for anyother uses such as residential,commercial or retail.
The infrastructure, including the parkingand facilities, will be designed andconstructed by the local authority. If theprivate company wishes to add morefacilities (e.g. a truck wash) this shouldbe encouraged as long as it relates totruck parking and does not jeopardizethe capacity required to meet demand.
The entire operation of the truck park isnormally operated by the private company,which includes security and facilityprovision (i.e. restaurant, toilets andshowers, etc). In order to maintain highstandards, the private company shouldagree to standards of compliance in thecontract and be audited regularly by thelocal authority.
This model enables the local authority toprovide free or below market rate parking ifthat is deemed to be the agreed strategy.
Table 3.4 – Local Authority Built and Operated by a Private Company
AECOM Demand Analysis and Business Model Report 17
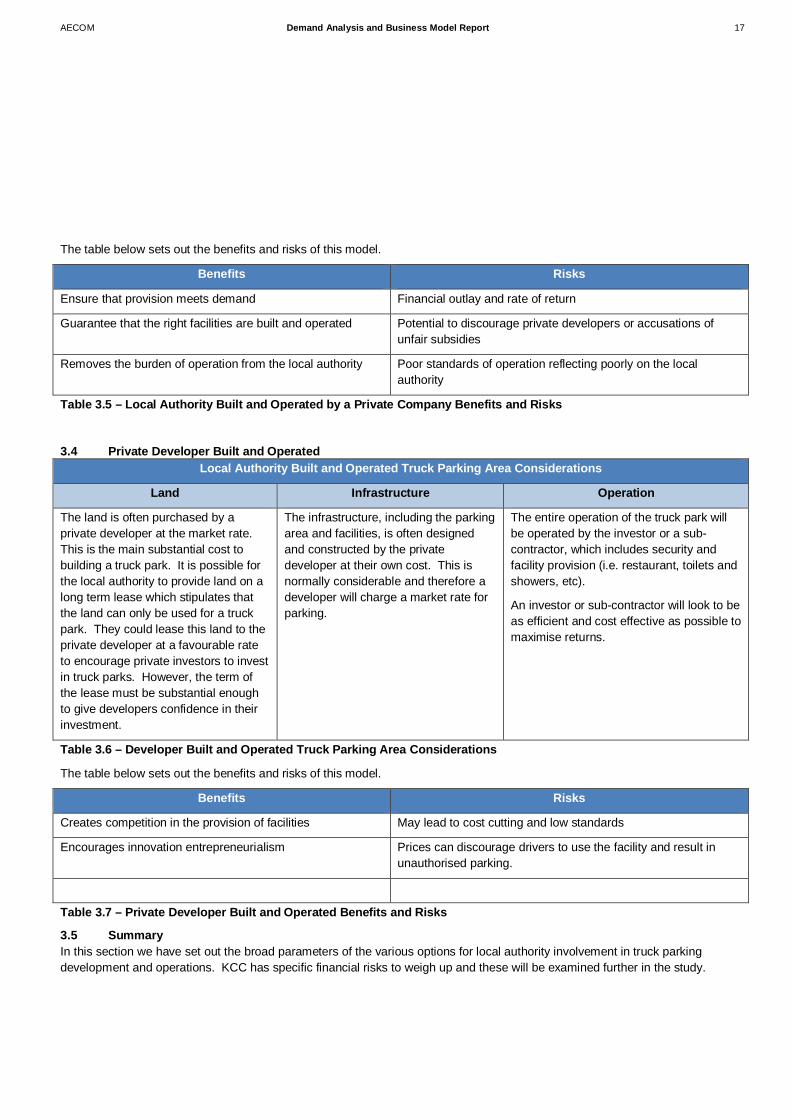
The table below sets out the benefits and risks of this model.
Benefits Risks
Ensure that provision meets demand Financial outlay and rate of return
Guarantee that the right facilities are built and operated Potential to discourage private developers or accusations ofunfair subsidies
Removes the burden of operation from the local authority Poor standards of operation reflecting poorly on the localauthority
Table 3.5 – Local Authority Built and Operated by a Private Company Benefits and Risks
3.4 Private Developer Built and OperatedLocal Authority Built and Operated Truck Parking Area Considerations
Land Infrastructure Operation
The land is often purchased by aprivate developer at the market rate.This is the main substantial cost tobuilding a truck park. It is possible forthe local authority to provide land on along term lease which stipulates thatthe land can only be used for a truckpark. They could lease this land to theprivate developer at a favourable rateto encourage private investors to investin truck parks. However, the term ofthe lease must be substantial enoughto give developers confidence in theirinvestment.
The infrastructure, including the parkingarea and facilities, is often designedand constructed by the privatedeveloper at their own cost. This isnormally considerable and therefore adeveloper will charge a market rate forparking.
The entire operation of the truck park willbe operated by the investor or a sub-contractor, which includes security andfacility provision (i.e. restaurant, toilets andshowers, etc).
An investor or sub-contractor will look to beas efficient and cost effective as possible tomaximise returns.
Table 3.6 – Developer Built and Operated Truck Parking Area Considerations
The table below sets out the benefits and risks of this model.
Benefits Risks
Creates competition in the provision of facilities May lead to cost cutting and low standards
Encourages innovation entrepreneurialism Prices can discourage drivers to use the facility and result inunauthorised parking.
Table 3.7 – Private Developer Built and Operated Benefits and Risks
3.5 SummaryIn this section we have set out the broad parameters of the various options for local authority involvement in truck parkingdevelopment and operations. KCC has specific financial risks to weigh up and these will be examined further in the study.

Demand Forecasting

AECOM Demand Analysis and Business Model Report 19
4.1 IntroductionA successful truck parking strategy has two critical elements that need to be determined. The first is location which can bedetermined by a variety of factors including the routes vehicles take, the level of provision already available and policy regardingthe length of time drivers can work without breaks. The second factor to consider is the quantity of parking to be provided.Determining factors will be volume of traffic, the propensity of drivers to take breaks and to some extent the location of the truckpark. The two factors are to a degree, interdependent
This section addresses how the project forecasts the level of demand for truck parking between 2014 and 2060. This has beendone primarily through a spreadsheet model that determines demand based primarily on the volume of truck traffic on keycorridors.
4.2 MethodologyThe methodology for building the model is set out in the following four key stages.
4.2.1 Corridor AnalysisPreliminary work identified that the suitable sites were to be located on either the M20 or A2/M2 corridors, the principle truckroutes between London and the Channel Tunnel/Port of Dover. Figure 4.1 shows the location of the key corridors and themodelled sites.
Figure 4.1 – Modelled Truck Stop Sites
4 Demand Forecasting

AECOM Demand Analysis and Business Model Report 20
As such, truck volumes were obtained for those corridors as the key driver of demand. Volumes were obtained from theHighways Agency TRADS database, providing real count data as well as the Lower Thames model (LTM) undertaken byAECOM for another project providing a readily available forecasting model.
The LTM was compared to the TRADS Data, and whilst it was found to be indicative, figures provided by TRADS weresignificantly higher than the LTM model. This, coupled with advice from the AECOM modelling team regarding the efficacy of themodel for the purpose of determining truck stop demand – largely as it was not designed to look at HGVs specifically, createdsome concerns regarding its robustness.
As such, the decision was taken to use Highways Agency TRADS data and apply growth factors from the DfT, Eurotunnel andPort of Dover in order to forecast volume to 2060. Further details are provided in the ‘Growth Factors’.
4.2.2 Network SectorsHA TRADS provides detailed data for traffic volumes across the vast majority of the trunk road network, classified by vehiclelength. A reading can be taken nearest to each truck stop site in order to gain a snapshot of traffic at that point. However, thisdoes not account for traffic flow and changes to the volume as traffic enters or exits at different junctions.
To account for this, readings were taken across the entire corridor and averaged out to provide a volume indicative of flow alongthe entire length of the corridor. This average was used to determine base volume of traffic.
As large vehicles are classed by vehicle length over and above 6.6m, the classification will capture both HGVs and coaches(buses form an insignificant proportion of traffic on these routes). As such, Port of Dover and Channel Tunnel coach volumeswere subtracted from the overall total.
4.2.3 Growth ForecastsThree key measures of growth were used to predict the uplift in traffic for the model. These were:
DfT National Travel Model – HGV Growth Channel State of Freight Report 2006 Port of Dover 2009 Master Plan
The DfT National Travel Model, predicts the overall growth of HGV traffic across the network, and has been used to forecastgrowth in Local Traffic, which accounts for around 6% on the M20 and M2/A2, when comparing Port of Dover /Channel Tunneldaily averages with the overall volume averages.
Channel Corridor and Port of Dover Forecasts were added together to provide growth for international traffic. Table 4.1 showsthe factors used.
Annual 2015 2020 2025 2030General Growth Factor 0.8 0Eurotunnel Growth Factor 0.49Dover Port Growth Factor - 2.3 2.85 3.55 0
Table 4.1 – Channel Crossing Growth Factors
General growth factors predicted a growth of 21.5% by 2040, equating to an annual average growth of 0.8% per annum. It isassumed that this rate continues beyond 2040.
Eurotunnel has not provided us with growth forecast, as such we have taken the Channel Corridor forecasts of 2.43% per annumto 2030 and we have assumed that the Channel Tunnel accounts for about 20% of this growth. Growth is expected to flat lineafter 2030 as the tunnel will be at capacity.
The Port of Dover provides an accelerating annual growth forecast to 2025, and this has been incorporated as above.

AECOM Demand Analysis and Business Model Report 21
Parking requirements are determined by overnight parking rather than short term daytime parking. As such, demand is based oninternational traffic volumes as local traffic is unlikely to be stopping overnight en-route.
Local Traffic will provide a level of day time use that can be inputted into the financial model, calibrated by observations andfeedback on current levels of day time truck park usage reported by site operators to the study team.
4.2.4 ParkingHaving established base volumes and determined how traffic will grow, the data now needs to be linked to determine parking. Asa measure of parking, figures were used from observational audits of lorry parking across the UK produced by AECOM for theDfT in 2005 and 2011, covering both appropriate parking (truck stops and MSAs) and inappropriate parking (Lay-bys,industrial estates).
Appropriate ParkingThe audits counted the number of trucks parked along key strategic routes including the M20 and M2 as well as the capacity ofappropriate parking sites. These figures were used to establish the base level of parking undertaken along the corridors.
Night Time UpliftEvidence from truck stop interviews as well as sample observations conducted for this project suggests that sites are consistently100% full overnight, in light of recent changes to insurance policies for certain freight operations, as such, capacity observationswere taken and used to indicate appropriately parked traffic.
Inappropriate parking volumes were taken from the 2005 and 2011 audits for the following districts shown in Table 4.2 and thendistributed proportionately to the volume on each corridor.
Local Authority DistrictsSwale District
Canterbury DistrictMaidstone District
Tonbridge and Malling DistrictDover District
MedwayShepway DistrictAshford DistrictDartford District
Gravesham DistrictTable 4.2 – Local Authority Districts
This is expected to grow in line with international traffic as local traffic is unlikely to be parking overnight in inappropriate places.An enforcement factor of 3% per year is also applied that will slow the rate of growth in order to represent improving levels ofenforcement. This is based on the difference between the 2005 and 2011 audits that show an 18% reduction. This 3% was thenadded to the appropriate parking simulating them being forced into truck stops or motorway service facilities.
A third factor, not considered in the report is latent demand – covering drivers who have tried to park but been turned away fromexisting truck parks, a measure that was obtained by asking truck stops how many vehicles are turned away, though it’s difficultto tell if there’s any double counting, with trucks being turned away from multiple sites. This is assumed to apply across bothcorridors.
Table 4.3 shows the level parking across each category and on each route.
Corridor Appropriate Latent InappropriateM20 642 32 247M2/A2 261 13 134
Table 4.3 – Level of Parking Accross the Network

AECOM Demand Analysis and Business Model Report 22
Truck stop demand therefore will be taken on the basis of appropriate + latent demand.
4.2.5 Demand ForecastingHaving established both the traffic volumes and the level of appropriate and latent parking on each route the two figures can bedivided to establish the proportion of vehicles parking on each corridor. That ratio can then be applied to the volume forecasts perannum to 2060 in order to predict the anticipated need for truck parking in Kent.
The next section outlines the results of the model.
4.3 Analysis
4.3.1 Volume SplitFigure 4.2 shows the HGV traffic volume split between the two main corridors based on average traffic levels across their entirelength. It shows the majority of traffic, 84% travelling on the M20/A20. Volume indications outside Dover indicate an 81%, 19%split in favour of the M20 with additional traffic coming from the M20. Taking the demand across both corridors we get thefollowing figures.
Figure 4.2 – Traffic Volume Split (Highways Agency TRADS Database)
Table 4.4 summarises the model outputs and shows the daily overnight parking demand and volumes every 5 years to 2060 foreach corridor. Data is available for every year in the model if required. It can be seen that the demand for parking spacesincreases between 2014 and 2060 by 330% from around 990 to over 3,300 spaces.
Road Year 2015 2020 2025 2030 2035 2040 2045 2050 2055 2060
M20Volume 6,201 7,115 8,209 9,674 11,209 13,346 15,344 16,941 18,704 20,651Demand 706 810 935 1,102 1,276 1,520 1,747 1,929 2,130 2,352
A2/M2Volume 1,215 1,395 1,609 1,896 2,197 2,616 3,007 3,320 3,666 4,048Demand 287 330 381 449 520 619 711 785 867 957
TOTAL Volume 7,416 8,510 9,818 11,570 13,407 15,961 18,351 20,261 22,370 24,698TOTAL Demand 994 1,140 1,315 1,550 1,796 2,138 2,459 2,714 2,997 3,309
Table 4.4 – Daily HGV Forecasts

AECOM Demand Analysis and Business Model Report 23
4.3.2 Aggregated Demand AnalysisFigure 4.3 shows the demand forecast graphically, and demonstrates a rapid and increasing growth in volume, the driverprimarily being growth at Dover and supported by a consistent 0.5% growth of Channel Tunnel Ro-Ro traffic. Current levels ofprovision are shown, and it can be clearly seen that current facilities are already full.
Figure 4.3 – Aggregated Daily Demand – All Corridors
Figure 4.4 takes the volume of traffic as a whole to show aggregated demand and provides a plan of future provision to developthe requisite 5 sites envisaged, an average size of 550 spaces is required, which provides 10% capacity above the maximumsize for the sites, providing a strong indication of adequate demand to justify the proposed five sites. The model automaticallyprovides a new site when demand gets to within 1% of provision. It is assumed that there are no competitive factors involved andthat demand for the current truck stops does not alter allowing an indicative timetable to be produced.

AECOM Demand Analysis and Business Model Report 24
Figure 4.4 – Aggregated Daily Demand – All Corridors
4.4 SummaryThe demand model has provided a forecast that balances robustness with the limitations of information and timescale available.It provides an indication of both the capacity required as well as an approximate timetable, based on an average site capacitythat meets the specification of 5 sites. It is apparent that there is an immediate demand for truck parking and this is forecasted togrow at an increasing rate towards 2030.

Financial Modelling

AECOM Demand Analysis and Business Model Report 26
5.1 IntroductionAECOM developed a financial analysis tool for KCC to identify the likely internal rate of return for one or more lorry parks basedon the assumptions set out in the preceding chapters and costs estimates for building and operating a lorry park. There are anumber of fundamental issues that KCC need to understand in order to make the case for promoting a number of new lorry parksand pursuing the most appropriate method of ownership.
What is the likely demand and utilisation and how will it change over time? This is set out in chapter 4 and is a key input tothe financial model.
Where, how many and what size of lorry parks are feasible? This needs to take into account the findings in both chapters2 and 4, and is a key input to the financial model.
What pricing strategy or other revenue raising mechanisms are feasible? This will be a function of a number of variables,including demand and willingness to pay. The demand and pricing strategy are key inputs to the financial model,estimating likely annual revenue.
What are the costs of constructing and operating the lorry parks and the desired facilities? This is another key input,noting that there it may be feasible to phase the construction of lorry parks in response to demand.
What is the annual cash flow? This is based on the above inputs. The financial model calculates the internal rate of returnover a specified number of years. This provides a benchmark with which to evaluate the investment, its commercialviability and appropriate methods of ownership.
There are a number of assumptions and caveats that are relevant to this chapter:
There has been no risk adjustment to the cost and revenue assumptions. Ideally a quantified risk analysis would beundertaken of revenue and costs to examine the impact on the business case.
There has been no consideration of wider economic or social costs and benefits, as would be the case if putting forward awebTAG compliant business case for investment by the public sector in a transport scheme.
The assumptions on demand, utilisation, pricing strategy, discount rates, life of lorry park/ operating period and costs areall subject to refinement and sensitivity tests.
No assumption has been made on asset value at the end of the appraisal period or depreciation.
No account has been made of the availability of commercial or public sector loans and guarantees or grants. Theseshould, in practice, be based on the business case for a lorry park.
5.2 Revenue Derivation
5.2.1 Demand and Lorry Park UtilisationRevenue within the model is derived as a function of truck parking demand, charges, and added value services such as therestaurant or cafe. Chapter 5 sets out the assumptions on demand and utilisation over time. The main driver of revenue relates toovernight lorry parking. Table 5.1 summarises utilisation over 25 years for each site. It should be noted that Year 1 is the firstyear of operation and not the construction year. The model is set up for a year ‘0’ build year with operations for the next 25 years/ next 40 years and closure in year 26 for major refurbishment.
5 Financial Modelling

AECOM Demand Analysis and Business Model Report 27
Year WhiteCliffs
BusinessPark 1
Westenhanger(site behind
STOP 24)
LympneIndustrial
Estate
SiteAdjacent
to AshfordInt’l Truck
Stop
East ofStanford
(siteoppositeSTOP 24)
SiteAdjacent
toMaidstone
MSA
A2/CoxhillRoad,
Shepherds-well (east)
A2/CoxhillRoad,
Shepherds-well (west)
1 16 53 26 26 53 53 16 162 25 81 53 53 81 81 25 25
3 33 110 81 81 110 110 33 334 42 139 110 110 139 139 42 425 52 170 139 139 170 170 52 526 61 201 156 170 201 201 61 617 71 233 156 201 233 233 71 718 81 265 156 233 265 265 81 819 93 306 156 265 306 306 93 93
10 106 348 156 306 348 348 106 10611 119 391 156 348 391 391 119 11912 133 435 156 391 435 435 133 13313 147 468 156 435 482 482 147 14714 161 468 156 482 529 529 161 16115 174 468 156 529 571 571 174 17416 187 468 156 571 614 614 187 18717 200 468 156 614 659 659 200 20018 214 468 156 659 704 704 214 21419 232 468 156 704 763 763 232 23220 234 468 156 763 824 824 251 25121 234 468 156 824 886 858 270 27022 234 468 156 858 951 858 290 29023 234 468 156 858 1019 858 310 31024 234 468 156 858 1088 858 331 33125 234 468 156 858 1161 858 353 353
Table 5.1– Lorry Park Utilisation over Time. Note, Shepherdwell East is not expected to reach capacity within the life ofthe forecast
Demand is calculated using the model from 1 year after construction to the point at which it reaches capacity, whereby growthstops and the site remains full. It is assumed that each site will be built when the previous site reaches 100% capacity. Table 6.1shows the level of growth for each site, where year 1 is the first revenue generating year, as such years indicate the life of thesite, rather than years from 2014.
Assuming that a given site reaches capacity at a faster rate than the assumptions set out above will result in a better NPV andreturn. These assumptions may also impact on the case for building more than one lorry park. Changing these assumptions, inparticular in the early years of operation, can have a substantial impact on the business case.

AECOM Demand Analysis and Business Model Report 28
5.2.2 Pricing StrategyThe pricing strategy assumes a charge structure of:
£ per lorry
Overnight £15Day < 2 hours Free
Table 5.2 – Pricing Strategy
It is possible to change these assumptions in the model, for example to bring charges in line with those charged elsewhere. Thiscan have a significant impact on the business case.
Charges are not assumed to change over time, although in practice there may be scope to increase them depending on averagereturns and wages in the freight industry.
5.2.3 Estimated Added Value Services RevenueThe potential revenue that could be generated from the provision of added value services such as a restaurant and shop may bean important consideration. For the purposes of this study AECOM have been relatively modest in their assumptions and havenot taken into account potential revenue that would be generated from other provisions such as fuel. However, these may benecessary to build a stronger business case for a given site.
The average additional spend on value added services e.g. in the restaurant, is assumed to be:
£
Overnight £6Day £3
Table 5.3 – Average Additional Spend
This average additional spend is assumed to apply to all lorry drivers, overnight lorry drivers are expected to spend £6 each withdaytime drivers spending much less – around £3 on sundries such as drinks or newspapers. Revenue within the model istherefore the level of overnight demand multiplied by overnight fees added to day time drivers multiplied by daytime fees.
5.3 Costs
5.3.1 IntroductionWhen modelling development projects, there are a number of key components that need to be considered within the model.These are:
Capital Costs
Operating Costs
Maintenance Costs
The following section looks at these in turn, highlighting the method of estimation nd any assumptions and limitations theestimates have in this high level model.
5.3.2 Capital CostsCapital costs are items such as land purchase, design and construction and facilities.
Purchase/Lease Property CostsDue to reasons of confidentiality regarding site assessment it has not be advisable to do a detailed investigation into specific landplot values. For the purposes of this project we have taken an overall agricultural land value for the area derived from a range ofsources of £17,500/ha. A higher rate of £920,000/ha has been applied to the two sites that are located in areas where industrialusage is permitted, again derived from a range of general sources – these site are 56 Lympne Industrial Estate and 57 Dover

AECOM Demand Analysis and Business Model Report 29
White Cliffs. This rate has also been applied for the sake of argument at site 6 adjacent to Ashford truckstop where it is believedan uplifted land value will apply.
SiteID
Name/Description LocatedOn
NearestTrunk Road/Junction
Authority/District
Size(Ha)
Number ofTruckParkingSpaces
Land Value Estimate£m
A2/M2/A2 Corridor57 White Cliffs
Business Park 1A2 A2/A256 Dover 3 234 2.75
21 A2/Coxhill Road,Shepherdswell(east)
A2 A2 Dover 24 1,872 0.42 (agricultural land)
20 A2/Coxhill Road,Shepherdswell(west)
A2 Coxhill Rd Dover 4 312 0.12 (agricultural land)
M20/A20 Corridor
8 Westenhanger (sitebehind STOP 24)
M20 J11 M20 Shepway 6 468 0.105 (agricultural land)
56 Lympne IndustrialEstate
M20 B2067 Shepway 2 156 1.8
6 Site Adjacent toAshford Int’l TruckStop
M2070 J10 M20 Ashford 11 858 10.1
12 East of Stanford(site opposite M20from STOP 24)
B2068 J11 M20 Shepway 16 1248 0.28 (agricultural land)
5 Site Adjacent toMaidstone MSA,Hollingbourne
M20 J8 M20 Maidstone 11 858 0.2 (agricultural land)
Table 5.4 – Land Value Estimates by Site
It has been assumed that the land will be purchased (if it is not already in KCC’s ownership). This will be a one off payment thatwill need to be set against the projected revenue of the lorry park in the future.
5.3.3 Construction CostsThe site development, infrastructure and security costs have been estimated for the potential sites, based on reports fromquantity surveyors for a number of existing truck parks, taking into account relative sizes of the candidate sites. Cost estimatesinclude earthworks, site clearance, and surfacing, with prices factored up to current values..
With regards to security, the estimates assume a minimum best standard based on our previous research. This includes securesite access, CCTV and security staff.
An additional 20% contingency has been assumed to cover sensitivity in pricing as well as risk, with a full engineeringassessment yet to be carried out at the sites. As such, the model aims to provide the ‘worst case’ in terms of capital costs.
There may also be considerable professional services costs, dependent on what services are required. The following are likely tobe required:

AECOM Demand Analysis and Business Model Report 30
Architectural services;
Planning Permission and associated fees;
Structural Engineers; and
Contractor & Project Manager.
Though these costs will be individually tendered, for the purposes of this study the costs for these services have been assumedand factored into the infrastructure and equipment costs.
5.3.4 Operational CostsOperational costs are incurred when the facilities are open including utilities, labour, tax and insurance and must be accountedfor in the outline financial analysis. Table 5.5 provides a full breakdown of operating costs used. As the sites are likely to be of asimilar size, it has been assumed that they will be the same across all candidate sites are bespoke to each site and thereforecarry a degree of uncertainty and as such as indicative.
Component CostManagement fees £65,000Security/Labour £230,000Electricity £70,000Gas £1,500Gardening £4,500Maintenance & repair £28,000Marketing £74,000Vehicle Wash £1,000Restaurant Building £5,000Restaurant Fixtures & Fittings £5,000Taxes £13,000Insurance £9,000Accounting £14,000Other (Contingency) £65,000
Table 5.5 – Operating Costs
A further complication exists in that many of these costs are dependent on the operational model of the truck stop, as such themodel only seeks to evaluate the commercial case for a truck park irrespective of its operational model
Staff
Operational staff costs will be determined by the level of security and the additional services provided. Taking these intoconsideration, a forecast budget for staff shall be estimated in the outline financial analysis. Furthermore, staff may also requirerelevant training (e.g. health and safety).
Associated Taxes & Insurances
As well as those costs discussed above, it will also be necessary to consider the relevant local/national taxes and insurances.The following should be considered as a minimum:
Business rate;

AECOM Demand Analysis and Business Model Report 31
Staff taxes;
Public liability taxes;
Contents insurance; and
Buildings insurance.
Such taxes and insurances have been factored into the business case but should be amended when the correct rates have beendetermined.
Table 5.6 shows the average costs for each site over 25 and 40 years.
Average Annual
SiteDevelopmentYear Life Capital Cost Revenue Op + Main Costs
57 2016 25 £ 7,455,494 £ 1,032,785 £ 686,15957 2016 40 £ 2,349,247 £ 1,302,265 £ 720,02221 2016 25 £ 26,586,739 £ 1,149,204 £ 690,42221 2016 40 £ 13,083,369 £ 1,993,281 £ 723,30420 2016 25 £ 8,713,480 £ 1,149,204 £ 750,99820 2016 40 £ 4,297,240 £ 2,039,008 £ 761,1648 2016 25 £ 7,880,245 £ 2,563,752 £ 687,5988 2016 40 £ 3,887,623 £ 2,834,037 £ 721,539
56 2016 25 5,230,783 £ 1,179,684 £ 804,94356 2016 40 £ 3,887,623 £ 2,834,037 £ 721,5396 2016 25 £ 22,999,939 £ 3,538,412 £ 705,2336 2016 40 £ 6,445,470 £ 4,617,092 £ 760,130
12 2016 25 £ 18,279,798 £ 3,775,542 £ 722,84412 2016 40 £ 8,999,899 £ 5,843,812 £ 758,6695 2016 25 £ 13,083,439 £ 3,538,412 £ 660,8915 2016 40 £ 6,445,470 £ 4,617,092 £ 714,963
Table 5.6 – Average Cost per Site
5.4 Other Costs and BenefitsThe analysis in this section is based on the commercial viability of additional lorry parks in Kent. However, there are wider costsand benefits that are likely to accrue but which would not be taken into account by a private operator seeking to make aninvestment decision. The Kent Multi-facility Lorry Park Scoping Strategy (2007)4 undertook economic impact analysis to estimatea cash equivalent benefit to society resulting from the provision of sufficient overnight lorry parking capacity in Kent and a wellmanaged off-highway alternative to Operation Stack. Whilst the analysis indicated it did not include all the likely benefits andcosts, it suggested that first year benefits would be in the order of £2.5m and a £77m benefit (in 2004 prices) over a 30 year timeframe. These benefits took into account impacts on local businesses, policing costs, and congestion.
There are likely to be broader socio-economic costs and benefits involved in the construction and operation of new lorry parks inKent.
4 A report by AECOM for the Department for Transport and Highways Agency

Modelling Outcomes
AECOM Demand Analysis and Business Model Report 33
6.1 IntroductionThis section sets out the results of the financial model runs for the various sites. We also examine the results to identify apossible single ‘priority site’ meriting KCC’s further careful attention.
This analysis is based on a snapshot of each of the sites being built in 2016 and not on the basis of the sites being built on asequential basis, although the financial model can be adjusted to reflect the latter.
The financial model calculates annual revenue and costs based on assumptions regarding demand, lorry park utilisation, pricingstrategy and lorry park costs. The financial analysis is based on estimating cash flow as a function of these, the rate of return andthe present value. A 25 and a 40 year time period has been assumed. If necessary, different time periods could be investigated.
The model then determines the Internal Rate of Return (or economic rate of return). This is in effect the discount rate thatmakes the net present value of the cash flows equal to zero. It provides an indication of the efficiency of the investment, whichcan be compared to the rate of return from other investments and a minimum acceptable rate of return, which will vary byoperator, sector and appetite for risk. This can be used as the basis for determining and how and whether to take forward theinvestment and the most appropriate ownership model.
A Net Present Value for the investment is also calculated, providing an estimate of the magnitude of the return. As theconstruction and operation of the lorry parks is potentially a commercial venture, the social discount rate of 3.5% (3% after 30years) cited in the Green Book may not be appropriate. Instead, the rate should reflect the potential commercial returns byoperators in the market place facing a similar level of risk. This can be assumed to be somewhere between 5 – 10% (7.5% isassumed in the model, but can be changed), although a higher value may be appropriate if cost and revenue risks areconsidered to be particularly high.
It is important to note that within this commission AECOM is not giving investment advice. The truck park assessments as setout in this report are based on a series of assumptions as set out in the report and associated technical notes and as agreedbetween AECOM and Kent County Council. The outcome of assessments are directly driven by the assumptions and the dataused for the assessments and subject to uncertainty. Whilst the uncertainty of the assessments can be the subject of a riskanalysis, the remit of this work does not include undertaking of risk analysis.
6.2 Model OutputsTable 6.1 gives the Internal Rate of Return (IRR) and Net Present Value (NPV) outputs of the model taking into consideration a25 and 40 year investment horizon. It can be seen that across sites and between the 25 year and 40 year investment horizonsthere is a large variation in both IRR and NPV. In broad terms the higher the IRR and NPV the better the investment is likely tobe.
6 Modelling Outcomes

AECOM Demand Analysis and Business Model Report 34
Average Annual
SiteDevelopmentYear Life Capital Cost Revenue Op + Main Costs IRR NPV
57 2016 25 £ 7,455,494 £ 1,032,785 £ 686,159 1.14% -£5,674,868.3457 2016 40 £ 2,349,247 £ 1,302,265 £ 720,022 3.84% -£4,616,436.21
21 2016 25 £ 26,586,739 £ 1,149,204 £ 750,998 -3.66%-
£23,598,536.29
21 2016 40 £ 13,083,369 £ 2,039,008 £ 761,164 1.21%-
£21,994,054.4920 2016 25 £ 8,713,480 £ 1,149,204 £ 690,422 1.60% -£6,366,252.9720 2016 40 £ 4,297,240 £ 1,993,281 £ 723,304 5.59% -£3,621,719.088 2016 25 £ 7,880,245 £ 2,563,752 £ 687,598 13.45% £7,835,325.708 2016 40 £ 3,887,623 £ 2,834,037 £ 721,539 13.94% £10,553,299.21
56 2016 25 5,230,783 £ 1,179,684 £ 804,943 5.65% -£896,444.2956 2016 40 £ 3,887,623 £ 2,834,037 £ 721,539 13.94% £10,553,299.216 2016 25 £ 22,999,939 £ 3,538,412 £ 705,233 7.15% -£1,073,053.736 2016 40 £ 6,445,470 £ 4,617,092 £ 760,130 8.79% £5,614,663.58
12 2016 25 £ 18,279,798 £ 3,775,542 £ 722,844 8.98% £4,167,909.5412 2016 40 £ 8,999,899 £ 5,843,812 £ 758,669 10.82% £14,537,439.975 2016 25 £ 13,083,439 £ 3,538,412 £ 660,891 11.15% £8,151,597.435 2016 40 £ 6,445,470 £ 4,617,092 £ 714,963 12.26% £14,804,105.63
Table 6.1 – IRR and NPV Model Outputs
A comparison of M20 corridor sites is provided in the next section. It is noted from the above table that the M2 corridor sites (57, 21, 20) do notshow very positive financial outcomes at this stage of the analysis. However, changes in pricing point (say increasing the parking fee from £15to £20 or £25) has a significant effect. For example an uplift in fee to £25 for site 57 yields over a 40 year horizon a positive NPV and IRR of7.75%. Similarly an uplift in demand, say for example from drivers utilising the M20 route but willing to divert the reasonably short distance tothe M2/A2 corridor sites near Dover, would again change the financial outcomes. For these sites it should be noted that the demand model doesnot account for ‘switching’ to an alternative corridor in search of good overnight parking.

AECOM Demand Analysis and Business Model Report 35
Figures 6.1-6.8 show the results of each site in terms of revenue, costs and cash flow. Construction costs have not been includedon the charts.
Figure 6.1 – Site 57
Figure 6.2 – Site 20

AECOM Demand Analysis and Business Model Report 36
Figure 6.3 – Site 21
Figure 6.4 – Site 8

AECOM Demand Analysis and Business Model Report 37
Figure 6.5 – Site 56
Figure 6.6 – Site 6

AECOM Demand Analysis and Business Model Report 38
Figure 6.7 – Site 12
Figure 6.8 – Site 5

AECOM Demand Analysis and Business Model Report 39
6.3 Single Site Recommendation for the M20 corridorThe study team has been directed by KCC to identify a single M20 corridor site that may be taken forward as the prime site forfurther investigation.
Having undertaken the overall site assessment process to determine preferred sites on the two corridors in terms of transportand site characteristics, environmental and planning considerations and having performed the financial assessment to determinethe most attractive sites in a commercial sense it is possible to provide some commentary on what may be considered to be themost appropriate single site to consider for possible development. This can be viewed as the ‘priority site’ meriting KCC’s furthercareful attention as well as the first of a series of developments as part of a strategy to secure truck parking capacity as demandbuilds to the 2060 horizon.
In the process of recommending a single site we rely on the outcomes of the original site assessment ranking detailed in full inthe Site Assessment Report and the financial modelling (specifically Internal Rate of Return and Net Present Value) set out inthis report, and we apply the study team’s professional judgement based on our understanding the current and future situation inKent with respect to the issues of high volumes of international freight traffic transiting the County. In this respect we provide afurther qualitative narrative to help support our recommendation based around the following wider issues for consideration:
Qualitative Aspect CommentEnvironment aspects – are thereno significant aspects?
The absence of significant and specific concerns on environmental aspects such as effect onthe setting, proximity to ancient woodland and so on is a very positive attribute for a site.
Scale-ability – can the site beexpanded in the future?
The degree to which the sight many be ‘built-out’ over a period of time, depending on actualdemand, capacity provided by other sites and so on.
Current and future Motorway Junction capacity is also an important consideration here.
Use for Operation Stack – couldthe site have a possible role in aStack event?
A larger site can have potential to provide space for trucks during a Stack event, providing afurther pre-assembly or buffer zone delaying or preventing a phase II event being called. Tomaximise its use for this it would be best located directly on the M20 west of the EurotunnelTerminal.
Proximity to existing sites – isthe site co-located with anexisting one?
A site that is adjacent to an existing facility has specific advantages in that the constructionof new facilities may not be immediately needed and indeed the current operators may beinterested in developing the site.
In addition separate but co-located sites may be advantageous in terms of competitivepricing and where one park is full the truck driver does not have to travel far to the alternativesite.
Table 6.2 – Wider Issues for Consideration
Additionally, the availability of the actual land to buy or lease must ultimately play a significant part in determining thedevelopment potential of a site. This has not been a feature of the study team’s current commission and therefore is notcommented on. The Council’s powers of compulsory purchase may come into play here, but this will be determined by theultimate operational model adopted.

AECOM Demand Analysis and Business Model Report 40
6.3.1 Single Site Ranking and Supporting NarrativeTable 6.3 sets out the ranking of sites according to the order of the overall site assessment ranking, the IRR and the NPV.Please note that this ranking does not correlate with the site assessment ranking as it also takes into consideration the outcomesof the financial model (IRR and NPV).
Rankorder
Overall assessment ranking IRR NPV
1st Site 8 – Westenhanger (site behind STOP 24)
Site 8 - Westenhanger(site behind STOP 24)
Site 5 - Site Adjacent to MaidstoneMSA, Hollingbourne
2nd Site 56 - Lympne Industrial Estate Site 5 - Site Adjacent to MaidstoneMSA, Hollingbourne
Site 8 – Westenhanger(site behind STOP 24)
3rd Site 6 - Site adjacent Ashford Int'lTruck Stop
Site 12 - East of Stanford (siteopposite M20 from STOP 24)
Site 12 - East of Stanford (siteopposite M20 from STOP 24)
4th Site 12 - East of Stanford (siteopposite M20 from STOP 24)
Site 6 - Site adjacent Ashford Int'lTruck Stop
Site 56 - Lympne Industrial Estate
5th Site 5 - Site Adjacent to MaidstoneMSA, Hollingbourne
Site 56 - Lympne Industrial Estate Site 6 - Site adjacent Ashford Int'lTruck Stop
Table 6.3 – Site Ranking by Overall Site Assessment, IRR and NPV
Whilst in reality the actual differences in any one site’s overall rank and financial outcome may not be huge, the table doesprovide a useful comparison ‘snapshot’ to help determine a single site. It can be seen in terms of financial outcome sites 8 and5 might be judged to be of equal standing. Indeed site 5 is large, adjacent to the existing motorway MSA with the potential toassist with a Stack operation. However, there may be concerns about the effect on the setting of the North Downs AONB andthe site is within 1Km of a local wildlife site and ancient woodland.
Site 56 Lympne Industrial Estate is well ranked in the overall general assessment. It does have some archaeological interest butdoes enjoy outline planning permission for B1,2 and 8 uses. The site is large but being somewhat off the ‘mainline’ may havelimited uses in a Stack situation. The site is less well regarded in terms of its financial outcomes with a negative NPV in the 25year time horizon.
Site 6 adjacent to the current Ashford Truck stop is mid-placed in the overall assessment ranking and somewhat lower down thefinancial scale. For the purposes of our modelling we have judged this plot of land to be costly to acquire. However the siteshould not be ignored as the current operator of Ashford Truck stop may be interested in expanding operations at this or anothersite. If this is done on site then expansion costs would be less than building a new site from scratch.
Finally, our appraisal exposes site 8 Westenhanger near to Stop 24 as the favoured option both in terms of the general and thefinancial assessment. It is large and may benefit from being able to share facilities with the existing Stop 24. It is well positionedon Junction 11 for both Dover and Eurotunnel traffic and could therefore play a role in Stack. Furthermore, when capacity isexhausted, site12 on the opposite site of the M20 could provide the next parking opportunity in what could become a clusteredzone of parking facilities.
6.4 SummaryIn this section we have sought to identify the financial attributes of the 8 selected sites, using Internal Investment Return and NetPresent Value as key metrics. We show revenue, costs and cash flow against demand over a 25 year period. Utilising theoutcomes of the financial assessment, the ranking process of the earlier overall site assessment process and through theapplication of profession judgement against a range of relative parking related issues, AECOM considers that site 8Westenhanger at M20 Junction 11 represents the single site on the M20 corridor to be taken forward as the prime site for further

AECOM Demand Analysis and Business Model Report 41
investigation. Further work on site specific demand modelling and corresponding financial modelling including grant and loanscenarios is detailed in the Phase 2 Kent Lorry Parks Feasibility Study Report.