DELTA ELECTRONICS, INC. 2014 ANNUAL...
145
Smarter Solutions, Greener Planet Delta’s LEED Gold-certified green building reduced energy consumption by 47% with our own solutions in 2014. DELTA ELECTRONICS, INC. 2014 ANNUAL REPORT Ticker: 2308
Transcript of DELTA ELECTRONICS, INC. 2014 ANNUAL...

Smarter Solutions, Greener PlanetDelta’s LEED Gold-certified green building reduced energyconsumption by 47% with our own solutions in 2014.
DELTA ELECTRONICS, INC. 2014 ANNUAL REPORT
Ticker: 2308

Table of Contents
A Letter to Our Shareholders
Corporate Governance
Consolidated Financial Highlights
Financial Report Balance Sheets
Statements of Income
Statements of Changes in Stockholders Equity
Statements of Cash Flows
Notes to Financial Statements
01
05
06
0710
12
14
16
18

01
A Letter to Our Shareholders
Dear Shareholders:
Thanks to the hardwork of our colleagues, Delta has performed well, growing in both revenues and profits this past year. Delta reported consolidated revenues of NT$190.6 billion in the year 2014, an 8% growth compared to the year before. Gross profits amount to NT$51.5 billion, with a profit margin of 27%, a 14% increase compared to the year before. Net operating profits amount to NT$22.8 billion, accounting for 12% of the revenues, growing 17% compared to the year before. And net income after tax amount to NT$20.7 billion, a net profit margin of 10.9%, growing 16% compared to the year before. Delta's EPS (earnings per share) for the year 2014 reached a new record of NT$8.49 with a ROE (return on equity) of 21.1%, which has also grown steadily compared to 2013. Delta's market capitalization has surpassed NT$450 billion, with over 70% of shares being held by foreign institutional investors, implying that Delta's management philosophy and operating performance is well acknowledged by the market. The following summarizes the business results and future prospects of Delta's three major business categories:
Power Electronics
Power Electronics has served as the cornerstone on which Delta has built its technology and operation upon. It has been a long term major contributor to Delta's revenues and profits. Delta continues to be a dominant player in the world's power supply and brushless DC fan market. We desire not only to continue extending our lead in IT, automotive and consumer electronic fields, but also to apply our technologies in new fields such as cloud computing, medical care, electric vehicles, LED lighting, and smart homes. This stance has been widely acknowledged by our customers. By extending our technologies' applications, increasing energy conversion efficiency, and integrating energy recycling into low power consumption ultra slim products, Delta can create exceptional value for ODM customers and also cooperate with them to pioneer new global markets. We believe that the prevalence of cloud computing and "Internet
Yancey Hai, Chairman

of things" can bring about countless opportunities. Riding on the growing trend of stringent environmental restrictions, Delta's Power Electronics business group will continue to grow and contribute significantly to our revenues and profits.
Energy Management
Energy Management has been Delta's duty through which we strive to fulfill our mission, as it is at the forefront of Delta's brand philosophy “Smarter, Greener, Together.". It is the very reason why Delta has invested so much into developing key products, systems and solutions for energy management, industrial automation, power systems, and power quality management in the recent years.
Delta has invested in industrial automation for over 20 years, developing innovative products such as the SCARA industrial robot, machine vision systems, CNC controllers, energy efficient industrial automation solutions and other smart solutions. Through constant feedback from the market, we can optimize these products and allow our customers to increase their production lines’ efficiency and quality. Delta's nomination in the ROBO-STOX is testament to Delta's development in the industrial automation market through the buildup and integration of professionals in respective fields, an exceptional customer support team, regional sales platform and advanced technology. This achievement has been well acknowledged and recognized. Delta's telecom power sales have continued to grow in scale with the development of the global communications infrastructure. With the successful M&A of Eltek ASA by our European subsidiary, we have moved one step closer to becoming the leader in global telecom power. We custom design data centers and UPS for key infrastructural organizations such as government, transportation, telecom, semiconductor and financial groups, to not only ensure seamless operation of key services required by customers, but also provide savings in energy and operations cost. We have achieved important breakthroughs in various areas such as electric vehicles, renewable energy, and energy storage and management. With these technologies, Delta has built power plants in Japan and also smart charging systems with built-in communications capabilities that can flexibly arrange charging conditions according to information provided by the power grid in the U.S. These management systems can support power companies to lower the investment that they need to expand the general power infrastructure, and allow electric vehicles to use off-peak power to charge and thereby lower their charging cost. With the increasing demand for smart energy management and flexible automated production, we believe that Energy Management will be the primary driving force for Delta to continue to grow.
03
Smart Green Life
Networking and display solutions are Delta’s representatives in the Smart Green Life category. Delta Networks is Delta Electronics’ answer to network communication. Not only does it provide services for various enterprise customers, it is also Delta's internal networking specialist. Delta Networks has performed exceptionally well, developing systems and solutions for all other business groups within the corporation. Delta's display business seeks to maintain our leading position in high-end projection sector. It has provided a brand new solution for remote monitoring. By integrating the most advanced network control system with a completely embedded display wall controller, it is the first custom-designed multi-panel video wall display controlling system that integrates both image and sound in command and control centers. Boasting the most advanced DSP (Digital signal processing) technology to support over 10,000 signal sources and display units simultaneously, the system enhances image processing capability and allows for real-time previews with synchronized playback features, fulfilling all needs to remote monitoring and management. Delta's display business unit’s strategy to move from single display monitors to image systems and integrated remote monitoring systems has proven successful, with satisfied customers applying it to power grid, transportation networks, communications networks, social security, and smart buildings. Having invested steadfastly into Smart Green Life for a prolonged period and riding on the growing use of internet communication and various cloud applications, we believe that the Smart Green Life business will continue to support the growth of Delta.
With a strong ODM foundation and gradual transition to provide integrated systematic solutions, we have successfully completed nearly 200 solution projects across the globe. We strive hard to make the best of all opportunities and work towards the company's mission of "providing innovative, clean, and energy-efficient solutions for a better tomorrow" to bring about positive effects. To successfully develop a solutions-oriented business model, Delta requires the professional knowledge to evaluate a customer's issue, and provides suitable integrated products and technology. To do this, the horizontal integration and cooperation between different business groups and related technologies is critical to success. In response to the constantly evolving industry, products and technology, Delta not only strives to develop new industries and technologies, enhances the organization capability from within, but also seeks other methods such as M&A and alliances with other corporations to fulfill customers’ demands promptly. Some examples include the previously mentioned merger with the Norwegian power supply company, and the cooperation between Delta and Mitsubishi Heavy Industries to enter the area of battery energy storage. Through both internal development and external opportunities, we believe that Delta can effectively increase the efficiency in systematic services and provide customer solutions in Taiwan and the rest of the world.

Last year, Delta was listed amongst the top 20 international brands in Taiwan for the fourth time, making us the only industrial brand in the domestic electronics industry to be accredited with such an honor for four consecutive years. Not only have we moved up four ranks, but upon evaluation, Delta's brand value has increased 24% to reach USD$ 170 million, demonstrating our outstanding brand management performance. Delta has also been commended by many of our long term customers such as SONY, Panasonic, Celestica, and Lenovo. Our efforts in improving the enterprise's social responsibility, corporate governance, and investor services have also been widely acknowledged by the general public. Last year, Delta was ranked first place by CommonWealth magazine as Taiwan's Most Admired Company in the electronics industry sector for thirteen consecutive years. We also received the top award honor of “Excellence in Corporate Social Responsibility” in the large corporation category for the eighth consecutive year. Delta was accredited top rank in Global View magazine's 10th Annual Corporate Social Responsibility (CSR) reward for both "Overall Performance" and "Sustainable Operations". Since the award's inception in 2005, Delta has been awarded top rank for 9 times, the highest in Taiwan. Delta was also selected by Dow Jones Sustainability Indices (DJSI) World Index for four years in a row and the second consecutive year for the DJSI-Emerging Markets Index published in 2013. Last year, Delta participated in the Carbon Disclosure Project (CDP) and surpassed nearly 2000 listed company around the globe. Not only did Delta receive the highest appraisal, it was also the only company from the Greater China region to be selected as part of the Climate Performance Leadership Index (CPLI). In terms of corporate management, Delta has received the highest ranking of A++ for information disclosure. These all demonstrate the recognition of the general public towards Delta's efforts.
Our stable and superb performance is the result of the unwavering efforts from our colleagues to which we express our immense gratitude. We are also deeply grateful for the support of our customers, suppliers, shareholders and the public towards Delta. We will strive to continue towards our strategic goal, to deliver the Delta philosophy, to fulfill our corporate society responsibility, and to improve our operation efficiency and profitability. We will demonstrate the strength of Delta, earn global respect and make our colleagues proud of being a Delta family member.
Yancey Hai, Chairman

05
Corporate GovernanceDelta believes that high quality corporate governance is the best way to ensure that the company always delivers excellent performance and provides an optimum balance for all stakeholders' interests. Corporate governance is therefore our top priority.
At Delta, the board currently consists of thirteen directors, including three independent directors. The role of CEO and chairman has been split since 2004. To enhance the board's responsibility and trust, it convenes at least once quarterly to review the company's performance and discuss important strategic issues. In 2014, the board convened on eight occasions. The overall attendance rate was 90.5%.
Key resolutions passed by the board are published in a timely manner on the Market Observation Post System of the Taiwan Stock Exchange and in the corporate governance section of the Delta website. Other relevant documents are also provided online for reference.
The board has organized a Compensation Committee consisting of three independent directors, to evaluate the performance-linked compensation of the company’s directors and executive officers. An Audit Committee is responsible for reviewing the financial reports, performance of accountants, implementation of internal control systems, compliance with regulations and risk management. The committee is also composed of three independent directors. Apart from the board meetings and committee meetings, all of the directors also take part in Delta’s internal strategy meetings to ensure they are familiar with the company's current activities and can provide appropriate advice when necessary.
We do not participate in high-risk or highly leveraged investments. Through our auditing, finance, legal and intellectual property departments, and others, we are able to assess and manage risks associated with all operations to maintain company sustainability.
Delta’s efforts in corporate governance continued to win outside recognition in 2014. Since 2011, Delta has been selected as a member of the prestigious Dow Jones Sustainability™ World Index (DJSI World) for 4 consecutive years. In 2014 it was also included in the DJSI Emerging Markets Index and ranked first in five criteria among DJSI’s World-leading Electronic Equipment, Instrument and Component Companies segment. We received an A++ Information Disclosure and Transparency Ranking for three consecutive years from the Securities and Futures Institute in Taiwan.

Consolidated Financial Highlights
20,000
40,000
60,000
80,000
100,000
120,000
180,000
160,000
140,000
20132010 2011 2012
190,000
200,000
2014
20,000
40,000
60,000
80,000
100,000
120,000
180,000
160,000
140,000
20132010 2011 2012
190,000
200,000
2014
Revenues
SalesGross profitGross marginOperating profitOperating MarginNet Income After TaxNet MarginEPS (NT$)Total AssetsTotal Shareholders' EquityROE (%)
2014
(in NT$ million, except otherwise indicated)
2013
Net Profits
Return on Stockholders' Equity
3.0%
0%
8.0%
13.0%
18.0%
23.0%
28.0%
33.0%
2013
Earnings Per Share
0.00
1.00
2.00
3.00
4.00
5.00
6.00
7.00
8.00
9.00
10.00
NT$
4.58
171,302 162,474
10,991
15,754
6.69
171,760 177,053
14,783
17,776
6.13
7.32
2010 20122011
14.3%
22.7%
18.4% 20.2%
2010 2011 2012 2013
*2010~2011 financials are based on Taiwan GAAP; 2012~2014 financials are based on IFRS.
190,63551,49527.0%22,81712.0%20,69910.9%8.49
220,452102,88521.06%
177,05345,02025.4%19,50811.0%17,77610.0%7.32
197,32993,64820.20%
190,635
20,699
2014
21.06%
8.49
2014
NT$ millionNT$ million

07
Financial Report
DELTA ELECTRONICS, INC. ANDSUBSIDIARIES
CONSOLIDATED FINANCIAL STATEMENTS AND
REPORT OF INDEPENDENT ACCOUNTANTS
DECEMBER 31, 2014 AND 2013
------------------------------------------------------------------------------------------------------------------------------------For the convenience of readers and for information purpose only, the auditors’ report and the accompanyingfinancial statements have been translated into English from the original Chinese version prepared and used inthe Republic of China. In the event of any discrepancy between the English version and the originalChinese version or any differences in the interpretation of the two versions, the Chinese-language auditors’report and financial statements shall prevail.

1
REPORT OF INDEPENDENT ACCOUNTANTS TRANSLATED FROM CHINESE
PWCR14000323To Delta Electronics, Inc.
We have audited the accompanying consolidated balance sheets of Delta Electronics, Inc. andsubsidiaries as of December 31, 2014 and 2013, and the related consolidated statements ofcomprehensive income, of changes in equity and of cash flows for the years then ended. Thesefinancial statements are the responsibility of the Company's management. Our responsibility is toexpress an opinion on these financial statements based on our audits. We did not audit the financialstatements of certain investments accounted for under equity method, which statements reflect totalassets (including investments accounted for under equity method) of $6,519,788 thousand and$6,051,355 thousand, constituting 2.96% and 3.07% of the consolidated total assets as of December 31,2014 and 2013, respectively, and total comprehensive income (including share of profit of associatesand joint ventures accounted for under equity method and share of other comprehensive income ofassociates and joint ventures accounted for under equity method) of $1,101,031 thousand and$993,227 thousand, constituting 4.44% and 3.99% of the consolidated total comprehensive income forthe years then ended, respectively. Those financial statements and the information disclosed in Note 13were audited by other independent accountants whose reports thereon have been furnished to us, andour opinion expressed herein is based solely on the audit reports of the other independent accountants.
We conducted our audits in accordance with the “Regulations Governing Auditing and Attestation ofFinancial Statements by Certified Public Accountants” and generally accepted auditing standards inthe Republic of China. Those standards require that we plan and perform the audit to obtain reasonableassurance about whether the financial statements are free of material misstatement. An audit includesexamining, on a test basis, evidence supporting the amounts and disclosures in the financial statements.An audit also includes assessing the accounting principles used and significant estimates made bymanagement, as well as evaluating the overall financial statement presentation. We believe that ouraudits and the reports of the other independent accountants provide a reasonable basis for our opinion.

09
2
In our opinion, based on our audits and the reports of other independent accountants, the consolidatedfinancial statements referred to above present fairly, in all material respects, the financial position ofDelta Electronics, Inc. and subsidiaries as of December 31, 2014 and 2013, and their financialperformance and cash flows for the years then ended, in conformity with the “Rules Governing thePreparation of Financial Statements by Securities Issuers” and the International Financial ReportingStandards, International Accounting Standards, IFRIC Interpretations, and SIC Interpretations asendorsed by the Financial Supervisory Commission (FSC).
We have also audited the parent company only financial statements of Delta Electronics, Inc. as of andfor the years ended December 31, 2014 and 2013, on which we have expressed a modified unqualifiedopinion on such financial statements.
The consolidated financial statements of Delta Electronics, Inc. and subsidiaries as of and for the yearended December 31, 2014 expressed in US dollars are presented solely for the convenience of thereader and were translated from the financial statements expressed in New Taiwan dollars using theexchange rate of $31.65 to US$1.00 at December 31, 2014. This basis of translation is not inaccordance with International Financial Reporting Standards, International Accounting Standards, andrelevant interpretations and interpretative bulletins that are ratified by the FSC.
PricewaterhouseCoopers, TaiwanMarch 10, 2015-------------------------------------------------------------------------------------------------------------------------------------------------The accompanying consolidated financial statements are not intended to present the financial position and results ofoperations and cash flows in accordance with accounting principles generally accepted in countries and jurisdictions otherthan the Republic of China. The standards, procedures and practices in the Republic of China governing the audit of suchfinancial statements may differ from those generally accepted in countries and jurisdictions other than the Republic ofChina. Accordingly, the accompanying consolidated financial statements and report of independent accountants are notintended for use by those who are not informed about the accounting principles or auditing standards generally accepted inthe Republic of China, and their applications in practice.As the financial statements are the responsibility of the management, PricewaterhouseCoopers cannot accept any liabilityfor the use of, or reliance on, the English translation or for any errors or misunderstandings that may derive from thetranslation.

3
DELTA ELECTRONICS, INC. AND SUBSIDIARIESCONSOLIDATED BALANCE SHEETS
DECEMBER 31, 2014 AND 2013(Expressed in thousands of dollars)
US Dollars New Taiwan Dollars
Assets Notes December 31, 2014 December 31, 2014 December 31, 2013
Current assets
Cash and cash equivalents 6(1) $ 2,321,005 $ 73,459,818 $ 59,023,870
Financial assets at fair value through profitor loss - current
6(2) 1,252 39,626 82,749
Available-for-sale financial assets - current 6(3) 21,748 688,324 686,511
Derivative financial assets for hedging -current
6(5) - - 13,340
Notes receivable, net 62,275 1,971,006 1,535,567
Accounts receivable, net 6(6) 1,357,226 42,956,211 41,121,837
Accounts receivable - related parties 7 39,814 1,260,102 1,083,328
Other receivables 14,704 465,368 407,045
Other receivables - related parties 7 1,375 43,507 157,570
Current income tax assets 6(30) 12,664 400,804 5,957
Inventories 6(7) 681,579 21,571,975 18,041,829
Prepayments 147,835 4,678,972 4,183,426
Other current assets 8 9,366 296,443 160,072
Total current assets 4,670,843 147,832,156 126,503,101
Non-current assets
Financial assets at fair value through profitor loss - non-current
6(2) 3,663 115,924 109,810
Available-for-sale financial assets -non-current
6(3) 220,130 6,967,099 7,677,790
Financial assets carried at cost -non-current
6(4) 23,658 748,761 400,605
Investments accounted for under equitymethod
6(8) 224,339 7,100,336 6,696,275
Property, plant and equipment 6(9) 1,163,184 36,814,759 37,194,762
Investment property, net 6(10) 70,264 2,223,848 1,960,453
Intangible assets 6(11) 369,858 11,706,015 10,857,876
Deferred income tax assets 6(30) 135,358 4,284,096 3,288,189
Other non-current assets 6(13) 84,025 2,659,428 2,639,953
Total non-current assets 2,294,479 72,620,266 70,825,713
Total assets $ 6,965,322 $ 220,452,422 $ 197,328,814
(Continued)

11~4~
DELTA ELECTRONICS, INC. AND SUBSIDIARIESCONSOLIDATED BALANCE SHEETS (CONTINUED)
DECEMBER 31, 2014 AND 2013(Expressed in thousands of dollars)
US Dollars New Taiwan DollarsLiabilities and Equity Notes December 31, 2014 December 31, 2014 December 31, 2013
Current liabilitiesShort-term borrowings 6(14) $ 183,295 $ 5,801,298 $ 4,561,722
Financial liabilities at fair value throughprofit or loss - current
6(15) 1,631 51,606 16,883
Derivative financial liabilities for hedging -current
6(5) - - 2,644
Notes payable - - 808
Accounts payable 1,058,584 33,504,170 32,628,527
Accounts payable - related parties 7 7,735 244,813 187,088
Other payables 607,310 19,221,347 17,533,426
Current income tax liabilities 6(30) 53,665 1,698,484 1,390,013
Other current liabilities 6(16) 129,625 4,102,644 3,046,701
Total current liabilities 2,041,845 64,624,362 59,367,812
Non-current liabilitiesLong-term borrowings 6(16) 836,275 26,468,103 18,827,664
Deferred income tax liabilities 6(30) 310,054 9,813,212 7,431,813
Other non-current liabilities 6(17) 123,465 3,907,668 3,815,895
Total non-current liabilities 1,269,794 40,188,983 30,075,372
Total Liabilities 3,311,639 104,813,345 89,443,184
EquityShare capital
Share capital - common stock 6(19) 770,156 24,375,433 24,375,433
Capital surplusCapital surplus 6(20) 815,885 25,822,764 25,790,922
Retained earnings 6(21)Legal reserve 491,383 15,552,256 13,774,636
Special reserve 16,668 527,556 4,074,505
Unappropriated retained earnings 1,059,805 33,542,818 25,212,328
Other equity interestOther equity interest 96,811 3,064,085 419,768
Equity attributable to owners of theparent
3,250,708 102,884,912 93,647,592
Non-controlling interest 6(22) 402,975 12,754,165 14,238,038
Total equity 3,653,683 115,639,077 107,885,630
Significant contingent liabilities andunrecorded contract commitments
9
Significant subsequent events 11
Total liabilities and equity $ 6,965,322 $ 220,452,422 $ 197,328,814
The accompanying notes are an integral part of these consolidated financial statements.See report of independent accountants dated March 10, 2015.

DELTA ELECTRONICS, INC. AND SUBSIDIARIESCONSOLIDATED STATEMENTS OF COMPREHENSIVE INCOME
FOR THE YEARS ENDED DECEMBER 31, 2014 AND 2013(Expressed in thousands of dollars, except earnings per share data)
US Dollars New Taiwan Dollars
Items Notes 2014 2014 2013
Sales revenue 6(23) and 7 $ 6,023,227 $ 190,635,120 $ 177,053,122
Operating costs 6(24) and 7 ( 4,396,227) ( 139,140,582) ( 132,033,192)
Gross profit 1,627,000 51,494,538 45,019,930
Operating expenses 6(28)(29)
Selling expenses ( 301,794) ( 9,551,788) ( 8,412,757)
General and administrative expenses ( 211,200) ( 6,684,466) ( 5,824,674)
Research and development expenses ( 393,093) ( 12,441,396) ( 11,274,117)
Total operating expenses ( 906,087) ( 28,677,650) ( 25,511,548)
Operating profit 720,913 22,816,888 19,508,382
Non-operating income and expenses
Other income 6(25)(32) 106,762 3,379,023 3,036,141
Other gains and losses 6(26) ( 15,703) ( 497,007) ( 752,798)
Finance costs 6(27) ( 5,183) ( 164,035) ( 175,959)
Share of profit of associates and joint ventures accounted for under equity method
6(8) 30,963 979,988 880,788
Total non-operating income and expenses
116,839 3,697,969 2,988,172
Profit before income tax 837,752 26,514,857 22,496,554
Income tax expense 6(30) ( 132,748) ( 4,201,486) ( 3,581,786)
Profit for the year from continuing operations
705,004 22,313,371 18,914,768
Profit for the year from discontinued operations
6(12) - - 119,628
Profit for the year $ 705,004 $ 22,313,371 $ 19,034,396
(Continued)

13 ~6~
DELTA ELECTRONICS, INC. AND SUBSIDIARIESCONSOLIDATED STATEMENTS OF COMPREHENSIVE INCOME (CONTINUED)
FOR THE YEARS ENDED DECEMBER 31, 2014 AND 2013(Expressed in thousands of dollars, except earnings per share data)
US Dollars New Taiwan Dollars
Items Notes 2014 2014 2013
Other comprehensive income
Financial statements translationdifferences of foreign operations
$ 141,637 $ 4,482,798 $ 3,524,544
Unrealized (loss) gain on valuation ofavailable-for-sale financial assets
( 46,202) ( 1,462,288) 2,594,163
Cash flow hedges ( 359) ( 11,359) ( 15,109)
Share of other comprehensive (loss)income of associates and joint venturesaccounted for under equity method
( 242) ( 7,654) 3,453
Income tax relating to the components ofother comprehensive income
6(30) ( 15,772) ( 499,175) ( 258,127)
Other comprehensive income for the year $ 79,062 $ 2,502,322 $ 5,848,924
Total comprehensive income for the year $ 784,066 $ 24,815,693 $ 24,883,320
Profit attributable to:
Owners of the parent $ 653,994 $ 20,698,900 $ 17,776,202
Non-controlling interest $ 51,010 $ 1,614,471 $ 1,258,194
Comprehensive income attributable to:
Owners of the parent $ 737,543 $ 23,343,226 $ 23,004,286
Non-controlling interest $ 46,523 $ 1,472,467 $ 1,879,034
Basic earnings per share (in dollars) 6(31)
Profit from continuing operations $ 0.27 $ 8.49 $ 7.10
Profit from discontinued operations - - 0.22
Total basic earnings per share $ 0.27 $ 8.49 $ 7.32
Diluted earnings per share (in dollars) 6(31)
Profit from continuing operations $ 0.27 $ 8.42 $ 7.02
Profit from discontinued operations - - 0.22
Total diluted earnings per share $ 0.27 $ 8.42 $ 7.24
The accompanying notes are an integral part of these consolidated financial statements.See report of independent accountants dated March 10, 2015.

~7~
DEL
TAEL
ECTR
ON
ICS,
INC
.AN
DSU
BSI
DIA
RIE
SC
ON
SOLI
DAT
EDST
ATEM
ENTS
OF
CH
AN
GES
INEQ
UIT
YFO
RTH
EY
EAR
SEN
DED
DEC
EMB
ER31
,201
4A
ND
2013
(Exp
ress
edin
thou
sand
sofd
olla
rs)
Equi
tyat
tribu
tabl
eto
owne
rsof
the
pare
ntR
etai
ned
earn
ings
Oth
ereq
uity
inte
rest
Not
esSh
are
capi
tal-
com
mon
stoc
kC
apita
lsur
plus
Lega
lres
erve
Spec
ial
rese
rve
Una
ppro
pria
ted
reta
ined
earn
ings
Fina
ncia
lst
atem
ents
trans
latio
ndi
ffere
nces
offo
reig
nop
erat
ions
Unr
ealiz
edga
inor
loss
onav
aila
ble-
for-
sale
finan
cial
asse
ts
Hed
ging
inst
rum
ent
gain
(loss
)on
effe
ctiv
ehe
dge
ofca
shflo
whe
dges
Equi
tydi
rect
lyre
late
dto
non-
curr
ent
asse
tshe
ldfo
rsal
eTo
tal
Non
-con
trolli
ngin
tere
stTo
tale
quity
2013
New
Taiw
anD
olla
rsBa
lanc
eat
Janu
ary
1,20
13$24,211,780
$24,774,551
$12,163,682
$2,156,092
$23,808,695
($4,259,517)
($
492,915)
$26,229
($
26,975)
$82,361,622
$15,966,356
$98,327,978
Shar
e-ba
sed
paym
ents
6(18
)163,653
934,077
--
--
--
-1,097,730
-1,097,730
Dist
ribut
ion
of20
12ea
rnin
gsLe
galr
eser
ve6(
21)
--
1,610,954
-(
1,610,954)
--
--
--
-Sp
ecia
lres
erve
--
-1,918,413
(1,918,413)
--
--
--
-C
ash
divi
dend
s-
--
-(
12,843,202)
--
--
(12,843,202)
-(
12,843,202)
Cha
nge
ineq
uity
ofas
soci
ates
and
join
tven
ture
sacc
ount
edfo
rund
ereq
uity
met
hod
-47,950
--
--
--
-47,950
-47,950
Diff
eren
cebe
twee
nco
nsid
erat
ion
and
carr
ying
amou
ntof
subs
idia
ries
acqu
ired
ordi
spos
ed-
34,344
--
--
--
(55,138)
(20,794)
-(
20,794)
Cha
nges
inno
n-co
ntro
lling
inte
rest
s-
--
--
--
--
-(
3,607,352)
(3,607,352)
Oth
erco
mpr
ehen
sive
inco
me
fort
heye
ar-
--
--
2,556,027
2,597,295
(7,351)
82,113
5,228,084
620,840
5,848,924
Prof
itfo
rthe
year
--
--
17,776,202
--
--
17,776,202
1,258,194
19,034,396
Bala
nce
atD
ecem
ber3
1,20
13$24,375,433
$25,790,922
$13,774,636
$4,074,505
$25,212,328
($1,703,490)
$2,104,380
$18,878
$-
$93,647,592
$14,238,038
$107,885,630
2014
New
Taiw
anD
olla
rsBa
lanc
eat
Janu
ary
1,20
14$24,375,433
$25,790,922
$13,774,636
$4,074,505
$25,212,328
($1,703,490)
$2,104,380
$18,878
$-
$93,647,592
$14,238,038
$107,885,630
Dist
ribut
ion
of20
13ea
rnin
gsLe
galr
eser
ve6(
21)
--
1,777,620
-(
1,777,620)
--
--
--
-R
ever
salo
fspe
cial
rese
rve
--
-(
3,546,949)
3,546,949
--
--
--
-C
ash
divi
dend
s-
--
-(
14,137,739)
--
--
(14,137,739)
-(
14,137,739)
Cha
nge
ineq
uity
ofas
soci
ates
and
join
tven
ture
sacc
ount
edfo
rund
ereq
uity
met
hod
-32,255
--
--
--
-32,255
-32,255
Shar
eof
chan
gesi
neq
uitie
sof
subs
idia
ries
-(
73)
--
--
--
-(
73)
-(
73)
Proc
eeds
from
inve
stm
ents
acco
unte
dfo
rund
erth
eeq
uity
met
hod
-(
340)
--
-(
9)
--
-(
349)
-(
349)
Cha
nges
inno
n-co
ntro
lling
inte
rest
s-
--
--
--
--
-(
2,956,340)
(2,956,340)
Oth
erco
mpr
ehen
sive
inco
me
fort
heye
ar-
--
--
4,118,876
(1,462,302)
(12,248)
-2,644,326
(142,004)
2,502,322
Prof
itfo
rthe
year
--
--
20,698,900
--
--
20,698,900
1,614,471
22,313,371
Bala
nce
atD
ecem
ber3
1,20
14$24,375,433
$25,822,764
$15,552,256
$527,556
$33,542,818
$2,415,377
$642,078
$6,630
$-
$102,884,912
$12,754,165
$115,639,077
(Con
tinue
d)

15
~8~
DEL
TAEL
ECTR
ON
ICS,
INC
.AN
DSU
BSI
DIA
RIE
SC
ON
SOLI
DAT
EDST
ATEM
ENTS
OF
CH
AN
GES
INEQ
UIT
Y(C
ON
TIN
UED
)FO
RTH
EY
EAR
SEN
DED
DEC
EMB
ER31
,201
4A
ND
2013
(Exp
ress
edin
thou
sand
sofd
olla
rs)
Equi
tyat
tribu
tabl
eto
owne
rsof
the
pare
ntR
etai
ned
earn
ings
Oth
ereq
uity
inte
rest
Not
esSh
are
capi
tal-
com
mon
stoc
kC
apita
lsur
plus
Lega
lres
erve
Spec
ial
rese
rve
Una
ppro
pria
ted
reta
ined
earn
ings
Fina
ncia
lst
atem
ents
trans
latio
ndi
ffere
nces
offo
reig
nop
erat
ions
Unr
ealiz
edga
inor
loss
onav
aila
ble-
for-
sale
finan
cial
asse
ts
Hed
ging
inst
rum
ent
gain
(loss
)on
effe
ctiv
ehe
dge
ofca
shflo
whe
dges
Equi
tydi
rect
lyre
late
dto
non-
curr
ent
asse
tshe
ldfo
rsal
eTo
tal
Non
-con
trolli
ngin
tere
stTo
tale
quity
2014
US
Dol
lars
Bala
nce
atJa
nuar
y1,
2014
$770,156
$814,879
$435,218
$128,736
$796,598
($
53,823)
$66,489
$596
$-
$2,958,849
$449,859
$3,408,708
Dist
ribut
ion
of20
13ea
rnin
gsLe
galr
eser
ve6(
21)
--
56,165
-(
56,165)
--
--
--
-R
ever
salo
fspe
cial
rese
rve
--
-(
112,068)
112,068
--
--
--
-C
ash
divi
dend
s-
--
-(
446,690)
--
--
(446,690)
-(
446,690)
Cha
nge
ineq
uity
ofas
soci
ates
and
join
tven
ture
sacc
ount
edfo
rund
ereq
uity
met
hod
-1,019
--
--
--
-1,019
-1,019
Shar
eof
chan
gesi
neq
uitie
sof
subs
idia
ries
-(
2)
--
--
--
-(
2)
-(
2)
Proc
eeds
from
inve
stm
ents
acco
unte
dfo
rund
erth
eeq
uity
met
hod
-(
11)
--
--
--
-(
11)
-(
11)
Cha
nges
inno
n-co
ntro
lling
inte
rest
s-
--
--
--
--
-(
93,407)
(93,407)
Oth
erco
mpr
ehen
sive
inco
me
fort
heye
ar-
--
--
130,138
(46,202)
(387)
-83,549
(4,487)
79,062
Prof
itfo
rthe
year
--
--
653,994
--
--
653,994
51,010
705,004
Bala
nce
atD
ecem
ber3
1,20
14$
770,156
$815,885
$491,383
$16,668
$1,059,805
$76,315
$20,287
$209
$-
$3,250,708
$402,975
$3,653,683
The
acco
mpa
nyin
gno
tesa
rean
inte
gral
part
ofth
ese
cons
olid
ated
finan
cial
stat
emen
ts.
See
repo
rtof
inde
pend
enta
ccou
ntan
tsda
ted
Mar
ch10
,201
5.

~9~
DELTA ELECTRONICS, INC. AND SUBSIDIARIESCONSOLIDATED STATEMENTS OF CASH FLOWS
FOR THE YEARS ENDED DECEMBER 31, 2014 AND 2013(Expressed in thousands of dollars)
US Dollars New Taiwan DollarsCASH FLOWS FROM OPERATING ACTIVITIES Notes 2014 2014 2013
Profit before tax for the year from continuing operations $ 837,752 $ 26,514,857 $ 22,496,554
Profit before tax for the year from discontinued operations 6(12) - - 132,798
Consolidated profit before tax for the year 837,752 26,514,857 22,629,352
Adjustments to reconcile net income to net cash generatedfrom operating activitiesIncome and expenses having no effect on cash flows
Depreciation 6(9)(10) 208,953 6,613,373 7,227,049
Amortization 6(11) 32,310 1,022,608 1,114,557
Provision for bad debts 6(6) 7,885 249,547 177,496
Interest expense 6(27) 5,134 162,480 242,701
Interest income 6(25) ( 29,995) ( 949,336) ( 724,410)
Dividend income 6(25) ( 4,478) ( 141,714) ( 140,180)
Net loss (gain) on financial assets or liabilities at fairvalue through profit or loss
6(26) 1,953 61,827 ( 56,480)
Share of profit of associates accounted for under theequity method
6(8) ( 30,963) ( 979,988) ( 880,788)
Loss on disposal of property, plant and equipment 6(26) 370 11,725 9,303
Gain on disposal of non-current assets classified as heldfor sale (shown as profit (loss) from discontinuedoperations)
6(12) - - ( 25,989)
(Gain) loss on disposal of investments 6(26) ( 1,805) ( 57,117) 400,298
Impairment loss on financial assets 6(26) 898 28,420 42,012
Impairment loss on non-financial assets 6(26) 1,731 54,800 32,141
Reversal of impairment loss on non-financial assets(shown as profit (loss) from discontinued operations)
6(12) - - ( 809,194)
Changes in assets/liabilities relating to operating activitiesNet changes in assets relating to operating activities
Financial assets at fair value through profit or loss ( 1,878) ( 59,439) ( 15,515)
Notes receivable ( 13,758) ( 435,439) ( 214,819)
Accounts receivable ( 86,316) ( 2,731,916) ( 6,554,316)
Accounts receivable - related parties 15,214 481,531 450,800
Other receivables ( 1,770) ( 56,029) 43,592
Other receivables - related parties 3,604 114,063 75,440
Inventories ( 111,537) ( 3,530,146) ( 2,753,789)
Prepayments ( 15,781) ( 499,479) ( 1,672,894)
Other current assets ( 879) ( 27,820) 171,821
Other non-current assets ( 3,596) ( 113,808) ( 79,596)
Net changes in liabilities relating to operating activitiesNotes payable ( 26) ( 808) 808
Accounts payable 27,627 874,379 6,293,187
Accounts payable - related parties 1,790 56,643 ( 49,045)
Other payables 52,666 1,666,867 3,062,366
Other current liabilities 34,184 1,081,930 ( 184,513)
Other non-current liabilities 2,900 91,773 24,936
Cash generated from operations 932,189 29,503,784 27,836,331
Interest received 29,995 949,336 724,410
Dividend received 25,247 799,053 308,122
Interest paid ( 5,131) ( 162,395) ( 226,124)
Income taxes paid ( 102,829) ( 3,254,540) ( 3,220,469)
Net cash provided by operating activities 879,471 27,835,238 25,422,270
(Continued)

17~10~
DELTA ELECTRONICS, INC. AND SUBSIDIARIESCONSOLIDATED STATEMENTS OF CASH FLOWS (CONTINUED)
FOR THE YEARS ENDED DECEMBER 31, 2014 AND 2013(Expressed in thousands of dollars)
US Dollars New Taiwan DollarsCASH FLOWS FROM INVESTING ACTIVITIES Notes 2014 2014 2013
Acquisition of financial assets at fair value through profit orloss, designated upon initial recognition
($ 911) ($ 28,844) ($ 114,700)
Proceeds from disposal of financial assets at fair valuethrough profit or loss, designated upon initial recognition
- - 970,000
Acquisition of available-for-sale financial assets ( 52,260) ( 1,654,042) ( 362,670)
Proceeds from disposal of available-for-sale financial assets 32,231 1,020,122 801,448
Proceeds from capital reduction of available-for-salefinancial assets
572 18,112 -
Acquisition of financial assets at cost ( 10,833) ( 342,878) -
Proceeds from capital reduction of financial assets carried atcost
10 306 -
Acquisition of investments accounted for using equitymethod
( 3,537) ( 111,948) -
Proceeds from disposal of investments accounted for underthe equity method
3,290 104,144 939
Net cash flow from acquisition of subsidiaries (net of cashacquired)
6(32) ( 83,609) ( 2,646,215) ( 605,843)
Proceeds from disposal of subsidiaries 6(12) - - ( 644,799)
Acquisition of property, plant and equipment 6(9) ( 174,782) ( 5,531,856) ( 8,823,567)
Proceeds from disposal of property, plant and equipment 5,596 177,119 443,672
Acquisition of intangible assets 6(11) ( 12,658) ( 400,617) ( 398,634)
Increase in other financial assets ( 3,381) ( 106,993) ( 12,841)
Decrease (increase) in other non-current assets 2,938 92,972 ( 320,291)
Net cash used in investing activities ( 297,334) ( 9,410,618) ( 9,067,286)
CASH FLOWS FROM FINANCING ACTIVITIESIncrease (decrease) in short-term borrowings 39,165 1,239,576 ( 576,247)
Proceeds from long-term debt 834,862 26,423,380 18,324,619
Repayment of long-term debt ( 594,004) ( 18,800,236) ( 16,396,307)
Exercise of employee share options 6(18) - - 1,097,730
Change in non-controlling interests ( 68,963) ( 2,182,681) ( 803,844)
Cash dividends paid ( 446,690) ( 14,137,739) ( 12,843,202)
Net cash used in financing activities ( 235,630) ( 7,457,700) ( 11,197,251)
Effects due to changes in exchange rate 109,605 3,469,028 2,770,009
Increase in cash and cash equivalents 456,112 14,435,948 7,927,742
Cash and cash equivalents at beginning of year 1,864,893 59,023,870 51,096,128
Cash and cash equivalents at end of year $ 2,321,005 $ 73,459,818 $ 59,023,870
The accompanying notes are an integral part of these consolidated financial statements.See report of independent accountants dated March 10, 2015.

11
DELTA ELECTRONICS, INC. AND SUBSIDIARIESNOTES TO THE CONSOLIDATED FINANCIAL STATEMENTS
DECEMBER 31, 2014 AND 2013(Expressed in thousands of New Taiwan dollars, except as otherwise indicated)
1. HISTORY AND ORGANIZATION
Delta Electronics, Inc. (the Company) was incorporated as a company limited by shares under theprovisions of the Company Law of the Republic of China (R.O.C.). The Company and its subsidiaries(collectively referred herein as the Group) are the global leader in power and thermal managementsolutions and are primarily engaged in the research and development, design, manufacturing and saleof electronic control systems, industrial automation products, digital display products, communicationproducts, consumer electronics products, energy-saving lighting application and energy technologyservices, etc. The Group’s mission statement, to provide innovative, clean and energy-efficientsolutions for a better tomorrow, focuses on the role in addressing key environmental issues such asglobal climate change. With the concern for the environment, the Group continues to developinnovative energy-efficient products and solutions. In recent years, the Group has transformed from aproduct provider towards a solution provider and the Group’s business is segregated into powerelectronics business, energy management business, and smart green life business.
2. THE DATE OF AUTHORIZATION FOR ISSUANCE OF THE CONSOLIDATED FINANCIALSTATEMENTS AND PROCEDURES FOR AUTHORIZATION
These consolidated financial statements were authorised for issuance by the Board of Directors onMarch 10, 2015.
3. APPLICATION OF NEW STANDARDS, AMENDMENTS AND INTERPRETATIONS
(1) Effect of the adoption of new issuances of or amendments to International Financial ReportingStandards (“IFRS”) as endorsed by the Financial Supervisory Commission (“FSC”)
None.
(2) Effect of new issuances of or amendments to IFRSs as endorsed by the FSC but not yet adopted bythe Group
According to Financial-Supervisory-Securities-Auditing No. 1030010325 issued on April 3, 2014,commencing 2015, companies with shares listed on the TWSE or traded on the Taipei Exchange orEmerging Stock Market shall adopt the 2013 version of IFRS (not including IFRS 9, ‘Financialinstruments’) as endorsed by the FSC and the “Regulations Governing the Preparation of FinancialReports by Securities Issuers” effective January 1, 2015 (collectively referred herein as the “2013version of IFRSs” in preparing the consolidated financial statements. The related new standards,interpretations and amendments are listed below:

19 12
Based on the Group’s assessment, the adoption of the 2013 version of IFRS has no significantimpact on the consolidated financial statements of the Group, except the following:
A. IAS 19 (revised), ‘Employee benefits’
The standard requires additional disclosures to present how defined benefit plans may affect the
amount, timing and uncertainty of the entity’s future cash flows.
The Group expects to recognise previously unrecognised past service cost and as a consequence
of the elimination of the corridor approach to recognise prior unrecognised actuarial losses by
increasing accrued pension liabilities by $25,830, increasing deferred tax assets by $56,653,
increasing deferred tax liabilities by $32,367 and decreasing retained earnings by $79,197,
decreasing non-controlling interests by $11,488 and decreasing long-term equity investments by
$89,141 at January 1, 2014, and by decreasing accrued pension liabilities by $111,338,
New Standards, Interpretations and Amendments
Effective Date byInternational
Accounting StandardsBoard
Limited exemption from comparative IFRS 7 disclosures for first-timeadopters (amendment to IFRS 1)
July 1, 2010
Severe hyperinflation and removal of fixed dates for first-time adopters(amendment to IFRS 1)
July 1, 2011
Government loans (amendment to IFRS 1) January 1, 2013Disclosures-Transfers of financial assets (amendment to IFRS 7) July 1, 2011Disclosures-Offsetting financial assets and financial liabilities(amendment to IFRS 7)
January 1, 2013
IFRS 10, ‘Consolidated financial statements’ January 1, 2013(Investment entities:
January 1, 2014)IFRS 11, ‘Joint arrangements’ January 1, 2013IFRS 12, ‘Disclosure of interests in other entities’ January 1, 2013IFRS 13, ‘Fair value measurement’ January 1, 2013Presentation of items of other comprehensive income (amendment toIAS 1)
July 1, 2012
Deferred tax: recovery of underlying assets (amendment to IAS 12) January 1, 2012IAS 19 (revised), ‘Employee benefits’ January 1, 2013IAS 27, ‘Separate financial statements’ January 1, 2013IAS 28, ‘Investments in associates and joint ventures’ January 1, 2013
Offsetting financial assets and financial liabilities (amendment to IAS 32) January 1, 2014IFRIC 20, ‘Stripping costs in the production phase of a surface mine’ January 1, 2013Improvements to IFRSs 2010 January 1, 2011Improvements to IFRSs 2009-2011 January 1, 2013

13
increasing deferred tax assets by $63,987, increasing deferred tax liabilities by $62,446,
increasing retained earnings by $36,485, decreasing non-controlling interests by $7,205 and
decreasing long-term equity investments by $83,599 at December 31, 2014;operating expenses
would decrease by $1,679, gain on investment would increase by $5,541, income tax expense
would increase by $1,345 and other comprehensive income would increase by $110,106 for the
year ended December 31, 2014.
B. IAS 1, ‘Presentation of financial statements’
The amendment requires entities to separate items presented in OCI classified by nature into two
groups on the basis of whether they are potentially reclassifiable to profit or loss subsequently
when specific conditions are met. If the items are presented before tax then the tax related to
each of the two groups of OCI items (those that might be reclassified and those that will not be
reclassified) must be shown separately. Accordingly, the Group will adjust its presentation of the
statement of comprehensive income.
C. IFRS 12, ‘Disclosure of interests in other entities’
The standard integrates the disclosure requirements for subsidiaries, joint arrangements,
associates and unconsolidated structured entities. The Group will disclose additional information
about its interests in consolidated entities and unconsolidated entities accordingly.
D. IFRS 13, ‘Fair value measurement’
The standard defines fair value, sets out a framework for measuring fair value, and requires
disclosures about fair value measurements. Based on the Group’s assessment, the adoption of the
standard has no significant impact on its consolidated financial statements, and the Group will
disclose additional information about fair value measurements accordingly.
(3) Effect of IFRSs issued by IASB but not yet endorsed by the FSC
New standards, interpretations and amendments issued by IASB but not yet included in the 2013
version of IFRS as endorsed by the FSC:

21
14
The Group is assessing the potential impact of the new standards, interpretations and amendmentsabove and has not yet been able to reliably estimate their impact on the consolidated financialstatements.
4. SUMMARY OF SIGNIFICANT ACCOUNTING POLICIES
The principal accounting policies applied in the preparation of these consolidated financial statementsare set out below. These policies have been consistently applied to all the periods presented, unlessotherwise stated.
(1) Compliance statement
The consolidated financial statements of the Group have been prepared in accordance with the “RulesGoverning the Preparation of Financial Statements by Securities Issuers” and the InternationalFinancial Reporting Standards, International Accounting Standards, IFRIC Interpretations, and SICInterpretations as endorsed by the FSC (collectively referred herein as the “IFRSs”)
New Standards, Interpretations and Amendments
InternationalAccounting Standards
BoardIFRS 9, ‘Financial instruments' January 1, 2018Sale or contribution of assets between an investor and its associate or jointventure (amendments to IFRS 10 and IAS 28)
January 1, 2016
Investment Entities: Applying the Consolidation Exception (IFRS 10, IFRS12 and IAS 28)
January 1, 2016
Accounting for acquisition of interests in joint operations(amendments to IFRS 11)IFRS 14, 'Regulatory deferral accounts' January 1, 2016IFRS 15, ‘Revenue from contracts with customers' January 1, 2017Disclosure Initiative (Amendments to IAS 1) January 1, 2016Clarification of acceptable methods of depreciation and amortisation(amendments to IAS 16 and IAS 38)
January 1, 2016
Agriculture: bearer plants (amendments to IAS 16 and IAS 41) January 1, 2016Sale or Contribution of Assets between an Investor and its Associate orJoint Venture (Amendments to IFRS 10 and IAS 28)
January 1, 2016
Defined benefit plans: employee contributions (amendments to IAS 19R) July 1, 2014Equity method in separate financial statements (amendments to IAS 27) January 1, 2016Recoverable amount disclosures for non-financial assets(amendments to IAS 36)Novation of derivatives and continuation of hedge accounting(amendments to IAS 39)IFRIC 21, ‘Levies’ January 1, 2014Improvements to IFRSs 2010-2012 July 1, 2014Improvements to IFRSs 2011-2013 July 1, 2014Improvements to IFRSs 2012-2014 January 1, 2016
January 1, 2016
January 1, 2014
January 1, 2014

15
(2) Basis of preparation
A. Except for the following items, the consolidated financial statements have been prepared underthe historical cost convention:
(a) Financial assets and financial liabilities (including derivative instruments) at fair valuethrough profit or loss.
(b) Available-for-sale financial assets measured at fair value.
(c) Liabilities on cash-settled share-based payment arrangements measured at fair value.
(d) Defined benefit liabilities recognised based on the net amount of pension fund assets plusunrecognised past service cost and unrecognised actuarial losses, and less unrecognisedactuarial gains and present value of defined benefit obligation.
B. The preparation of financial statements in conformity with International Financial ReportingStandards, International Accounting Standards, IFRIC Interpretations, and SIC Interpretations asendorsed by the FSC (collectively referred herein as the “IFRSs”) requires the use of certaincritical accounting estimates. It also requires management to exercise its judgment in theprocess of applying the Group’s accounting policies. The areas involving a higher degree ofjudgment or complexity, or areas where assumptions and estimates are significant to theconsolidated financial statements are disclosed in Note 5.
(3) Basis of consolidation
A. Basis for preparation of consolidated financial statements:
(a) All subsidiaries are included in the Group’s consolidated financial statements. Subsidiariesare all entities (including special purpose entities) over which the Group has the power togovern the financial and operating policies. In general, control is presumed to exist when theparent owns, directly or indirectly through subsidiaries, more than half of the voting power ofan entity. The existence and effect of potential voting rights that are currently exercisable orconvertible have been considered when assessing whether the Group controls another entity.Subsidiaries are fully consolidated from the date on which control is transferred to the Group.They are de-consolidated from the date that control ceases.
(b) Inter-company transactions, balances and unrealised gains or losses on transactions betweencompanies within the Group are eliminated. Accounting policies of subsidiaries have beenadjusted where necessary to ensure consistency with the policies adopted by the Group.
(c) Profit or loss and each component of other comprehensive income are attributed to theowners of the parent and to the non-controlling interests. Total comprehensive income isattributed to the owners of the parent and to the non-controlling interests even if this resultsin the non-controlling interests having a deficit balance.
(d) Changes in a parent’s ownership interest in a subsidiary that do not result in the parent losingcontrol of the subsidiary (transactions with non-controlling interests) are accounted for asequity transactions, i.e. transactions with owners in their capacity as owners. Anydifference between the amount by which the non-controlling interests are adjusted and the

23
16
fair value of the consideration paid or received is recognised directly in equity.
(e) When the Group loses control of a subsidiary, the Group remeasures any investment retainedin the former subsidiary at its fair value. Any difference between fair value and carryingamount is recognised in profit or loss. All amounts previously recognised in othercomprehensive income in relation to the subsidiary are reclassified to profit or loss, on thesame basis as would be required if the related assets or liabilities were disposed of. That is,when the Group loses control of a subsidiary, all gains or losses previously recognised inother comprehensive income in relation to the subsidiary should be reclassified from equityto profit or loss, if such gains or losses would be reclassified to profit or loss when the relatedassets or liabilities are disposed of.
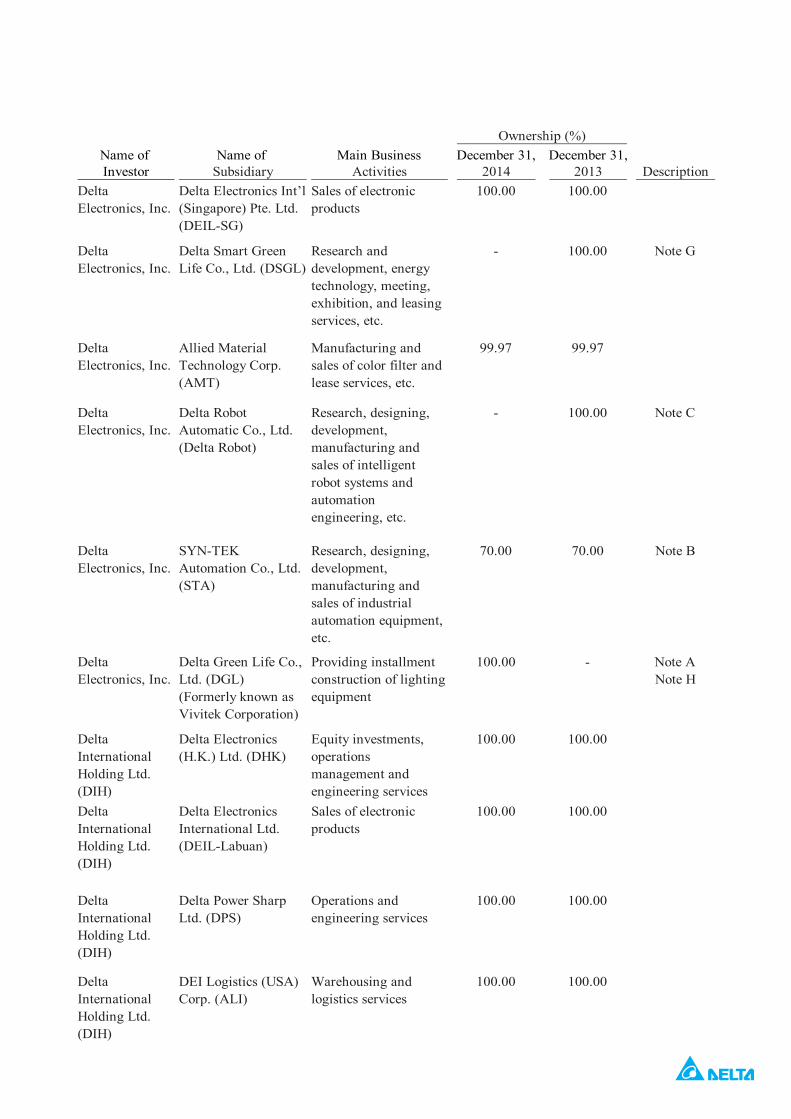
B. Subsidiaries included in the consolidated financial statements:
Name of Name of Main Business December 31, December 31,Investor Subsidiary Activities 2014 2013 Description
DeltaElectronics, Inc.
Delta InternationalHolding Ltd. (DIH)
Equity investments 94.00 94.00
DeltaElectronics, Inc.
Delta NetworksHolding Ltd. (DNH)
Equity investments 100.00 100.00
DeltaElectronics, Inc.
Deltronics(Netherlands) B.V.(DEN)
Trading of equipment,components andmaterials of telecomand computersystems
100.00 100.00
DeltaElectronics, Inc.
PreOptix (HongKong) Co., Ltd.(PHK)
Equity investments 39.62 39.62
DeltaElectronics, Inc.
NeoEnergyMicroelectronics,Inc. (NEM)
Designing andexperimenting onintegrated circuit andinformation softwareservices
83.11 83.11
DeltaElectronics, Inc.
Cyntec Co., Ltd.(Cyntec)
Research, development,manufacturing and salesof film optic-electronicsdevices
100.00 100.00
DeltaElectronics, Inc.
DelBio Inc. (DelBio) Manufacturing,wholesale and retail ofmedical equipment
100.00 100.00
DeltaElectronics, Inc.
Delta ElectronicsCapital Company(Delta Capital)
Equity investments 100.00 100.00
Ownership (%)
17
Name of Name of Main Business December 31, December 31,Investor Subsidiary Activities 2014 2013 Description
DeltaElectronics, Inc.
Delta Electronics Int’l(Singapore) Pte. Ltd.(DEIL-SG)
Sales of electronicproducts
100.00 100.00
DeltaElectronics, Inc.
Delta Smart GreenLife Co., Ltd. (DSGL)
Research anddevelopment, energytechnology, meeting,exhibition, and leasingservices, etc.
- 100.00 Note G
DeltaElectronics, Inc.
Allied MaterialTechnology Corp.(AMT)
Manufacturing andsales of color filter andlease services, etc.
99.97 99.97
DeltaElectronics, Inc.
Delta RobotAutomatic Co., Ltd.(Delta Robot)
Research, designing,development,manufacturing andsales of intelligentrobot systems andautomationengineering, etc.
- 100.00 Note C
DeltaElectronics, Inc.
SYN-TEKAutomation Co., Ltd.(STA)
Research, designing,development,manufacturing andsales of industrialautomation equipment,etc.
70.00 70.00 Note B
DeltaElectronics, Inc.
Delta Green Life Co.,Ltd. (DGL)(Formerly known asVivitek Corporation)
Providing installmentconstruction of lightingequipment
100.00 - Note ANote H
DeltaInternationalHolding Ltd.(DIH)
Delta Electronics(H.K.) Ltd. (DHK)
Equity investments,operationsmanagement andengineering services
100.00 100.00
DeltaInternationalHolding Ltd.(DIH)
Delta ElectronicsInternational Ltd.(DEIL-Labuan)
Sales of electronicproducts
100.00 100.00
DeltaInternationalHolding Ltd.(DIH)
Delta Power SharpLtd. (DPS)
Operations andengineering services
100.00 100.00
DeltaInternationalHolding Ltd.(DIH)
DEI Logistics (USA)Corp. (ALI)
Warehousing andlogistics services
100.00 100.00
Ownership (%)
25 18
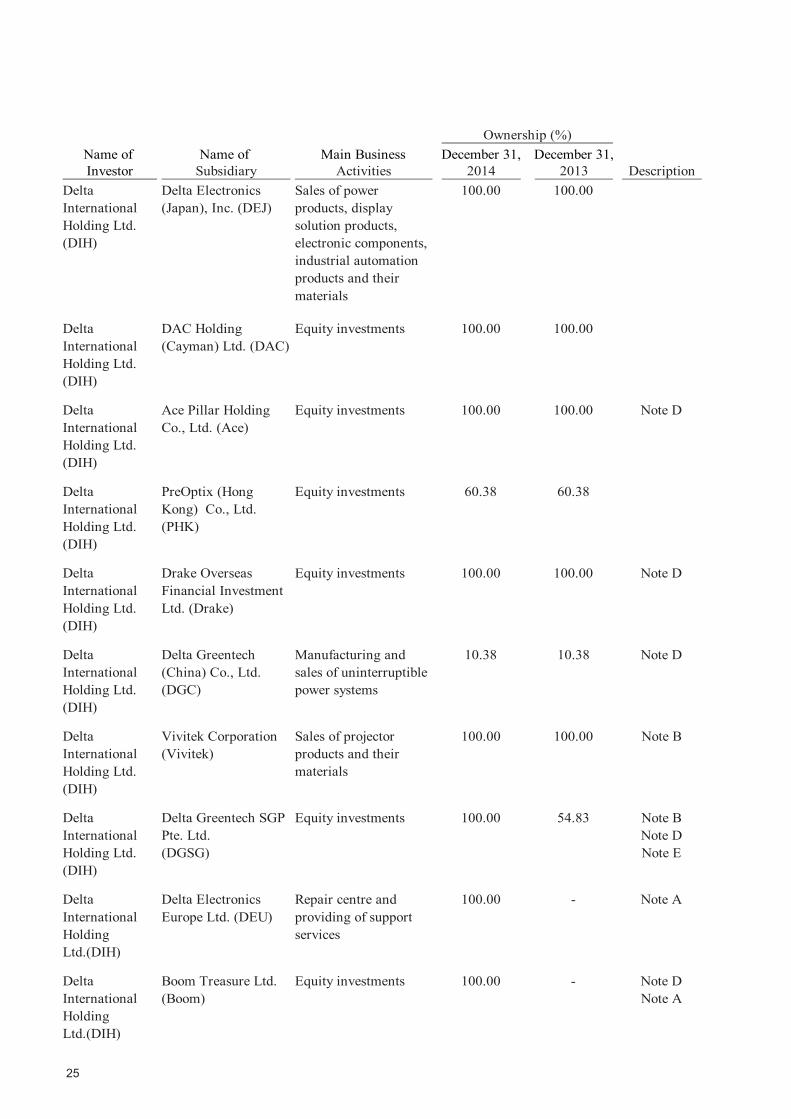
Name of Name of Main Business December 31, December 31,Investor Subsidiary Activities 2014 2013 Description
DeltaInternationalHolding Ltd.(DIH)
Delta Electronics(Japan), Inc. (DEJ)
Sales of powerproducts, displaysolution products,electronic components,industrial automationproducts and theirmaterials
100.00 100.00
DeltaInternationalHolding Ltd.(DIH)
DAC Holding(Cayman) Ltd. (DAC)
Equity investments 100.00 100.00
DeltaInternationalHolding Ltd.(DIH)
Ace Pillar HoldingCo., Ltd. (Ace)
Equity investments 100.00 100.00 Note D
DeltaInternationalHolding Ltd.(DIH)
PreOptix (HongKong) Co., Ltd.(PHK)
Equity investments 60.38 60.38
DeltaInternationalHolding Ltd.(DIH)
Drake OverseasFinancial InvestmentLtd. (Drake)
Equity investments 100.00 100.00 Note D
DeltaInternationalHolding Ltd.(DIH)
Delta Greentech(China) Co., Ltd.(DGC)
Manufacturing andsales of uninterruptiblepower systems
10.38 10.38 Note D
DeltaInternationalHolding Ltd.(DIH)
Vivitek Corporation(Vivitek)
Sales of projectorproducts and theirmaterials
100.00 100.00 Note B
DeltaInternationalHolding Ltd.(DIH)
Delta Greentech SGPPte. Ltd.(DGSG)
Equity investments 100.00 54.83 Note BNote DNote E
DeltaInternationalHoldingLtd.(DIH)
Delta ElectronicsEurope Ltd. (DEU)
Repair centre andproviding of supportservices
100.00 - Note A
DeltaInternationalHoldingLtd.(DIH)
Boom Treasure Ltd.(Boom)
Equity investments 100.00 - Note DNote A
Ownership (%)

19
Name of Name of Main Business December 31, December 31,Investor Subsidiary Activities 2014 2013 Description
DeltaElectronics(H.K.) Ltd.(DHK)
Delta Electronics(Dongguan) Co., Ltd.(DDG)
Manufacturing andsales of transformerand power supplies
100.00 100.00
DeltaElectronics(H.K.) Ltd.(DHK)
Delta ElectronicsPower (Dongguan)Co., Ltd. (DEP)
Manufacturing andsales of transformerand power supplies
100.00 100.00
DeltaElectronics(H.K.) Ltd.(DHK)
Delta Electronics(Shanghai) Co., Ltd.(DPEC)
Product design andmanagementconsulting service, etc.
100.00 100.00
DeltaElectronics(H.K.) Ltd.(DHK)
Delta Electronics(Jiangsu) Ltd. (DWJ)
Manufacturing andsales of power suppliesand transformers
55.00 55.00
DeltaElectronics(H.K.) Ltd.(DHK)
Delta ElectronicsComponents(Wujiang) Ltd.(DWC)
Manufacturing andsales of transformers
55.00 55.00
DeltaElectronics(H.K.) Ltd.(DHK)
Delta Electro-Optics(Wujiang) Ltd.(DWO)
Manufacturing andsales of peripherals andelectronic controlequipment
55.00 55.00
DeltaElectronics(H.K.) Ltd.(DHK)
Delta Video DisplaySystem (Wujiang)Ltd. (DWV)
Manufacturing andsales of variousprojectors
55.00 55.00
DeltaElectronics(H.K.) Ltd.(DHK)
Delta Electronics(Wuhu) Co., Ltd.(DWH)
Manufacturing andsales of power suppliesand transformers
100.00 100.00
DeltaElectronics(H.K.) Ltd.(DHK)
Delta Electronics(Chenzhou) Co., Ltd.(DCZ)
Manufacturing andsales of power suppliesand transformers
100.00 100.00
DeltaElectronics(H.K.) Ltd.(DHK)
Delta ElectronicsInternational MexicoS.A. DE C.V. (DEIL-MX)
Sales of powermanagement ofindustrial automationproduct andtelecommunicationsequipment
100.00 100.00
Ownership (%)

27
20
Name of Name of Main Business December 31, December 31,Investor Subsidiary Activities 2014 2013 Description
DeltaElectronics(H.K.) Ltd.(DHK)
Delta Electronics(Wujiang) TradingCo., Ltd. (DWT)
Installation, consultingand trading ofelectronic products
100.00 100.00
DeltaElectronics(H.K.) Ltd.(DHK)
Delta Green (Tianjin)Industries Co., Ltd.(DGT)
Manufacturing andsales of transformersand bluetooth module
100.00 100.00
DeltaElectronics(H.K.) Ltd.(DHK)
Delta Electronics(Pingtan) Co., Ltd.
Wholesale and retail ofelectronic products andenergy-savingequipment
100.00 - Note A
PreOptix (HongKong) Co., Ltd.(PHK)
PreOptix (Jiang Su)Co., Ltd. (PJS)
Manufacturing andsales of lenses andoptical engines forprojectors
100.00 100.00
DeltaElectronics(Japan), Inc.(DEJ)
Addtron Technology(Japan), Inc. (ATJapan)
Trading of networkingsystem and peripherals
100.00 100.00
DeltaElectronics(Japan), Inc.(DEJ)
Delta Electronics(Korea), Inc. (DeltaKorea)
Sales of powerproducts, displaysolution productselectronic components,industrial automationproducts and theirmaterials
100.00 100.00
DAC Holding(Cayman) Ltd.(DAC)
Delta ElectronicsMexico S.A. DE C.V.(DEM)
Manufacturing andsales of electronicproducts
100.00 100.00
DAC Holding(Cayman) Ltd.(DAC)
Delta ViedeoTechnology Ltd.(DVT)
Sales of electronicproducts
100.00 100.00
Drake OverseasFinancialInvestment Ltd.(Drake)
Drake Investment(HK) Ltd. (Drake-HK)
Equity investments 100.00 100.00 Note D
Ace PillarHolding Co.,Ltd. (Ace)
Delta Greentech(China) Co., Ltd.(DGC)
Manufacturing andsales of uninterruptiblepower systems
3.81 3.81 Note D
Ownership (%)

21
Name of Name of Main Business December 31, December 31,Investor Subsidiary Activities 2014 2013 Description
DrakeInvestment(HK) Ltd.(Drake-HK)
Delta Greentech(China) Co., Ltd.(DGC)
Manufacturing andsales of uninterruptiblepower systems
48.51 48.51 Note D
Delta GreentechSGP Pte. Ltd.(DGSG)
Delta Greentech(China) Co., Ltd.(DGC)
Manufacturing andsales of power suppliesand transformers
8.21 8.21 Note D
Boom TreasureLtd. (Boom)
Delta Greentech(China) Co., Ltd.(DGC)
Manufacturing andsales of power suppliesand transformers
25.00 - Note DNote F
DeltaElectronics(Wuhu) Co.,Ltd. (DWH)
Wuhu DeltaTechnology Co., Ltd.(WDT)
Manufacturing andsales of power suppliesand transformers
100.00 100.00
DeltaElectronics(Wuhu) Co.,Ltd. (DWH)
Delta EnergyTechnology (Wuhu)Co., Ltd. (DET-WH)
Research anddevelopment of energy-saving technology,energy-savingequipment, energymanagement systemand technologyconsulting service, etc.
30.00 30.00
DeltaElectronics(Chenzhou)Co., Ltd. (DCZ)
Chenzhou DeltaTechnology Co., Ltd.(CDT)
Manufacturing andsales of power suppliesand transformers
100.00 100.00
DeltaElectronics(Chenzhou)Co., Ltd. (DCZ)
Delta EnergyTechnology(Chenzhou) Co., Ltd.(DET-CZ)
Research anddevelopment of energy-saving technology,energy-savingequipment, energymanagement systemand technologyconsulting service, etc.
30.00 30.00
DeltaElectronics(Dongguan)Co., Ltd.(DDG)
Delta EnergyTechnology(Dongguan) Co., Ltd.,(DET-DG)
Research anddevelopment of energy-saving technology,energy-savingequipment, energymanagement systemand technologyconsulting service, etc.
30.00 30.00
Ownership (%)

29
22
Name of Name of Main Business December 31, December 31,Investor Subsidiary Activities 2014 2013 Description
Delta Electro-Optics(Wujiang) Ltd.(DWO)
Delta EnergyTechnology(Wujiang) Co., Ltd.(DET-WJ)
Research anddevelopment of energy-saving technology,energy-savingequipment, energymanagement systemand technologyconsulting service, etc.
30.00 30.00
DeltaElectronics(Shanghai) Co.,Ltd. (DPEC)
Delta EnergyTechnology (Wuhu)Co., Ltd. (DET-WH)
Research anddevelopment of energy-saving technology,energy-savingequipment, energymanagement systemand technologyconsulting service, etc.
70.00 70.00
DeltaElectronics(Shanghai) Co.,Ltd. (DPEC)
Delta EnergyTechnology(Chenzhou) Co., Ltd.(DET-CZ)
Research anddevelopment of energy-saving technology,energy-savingequipment, energymanagement systemand technologyconsulting service, etc.
70.00 70.00
DeltaElectronics(Shanghai) Co.,Ltd. (DPEC)
Delta EnergyTechnology(Dongguan) Co., Ltd.(DET-DG)
Research anddevelopment of energy-saving technology,energy-savingequipment, energymanagement systemand technologyconsulting service, etc.
70.00 70.00
DeltaElectronics(Shanghai) Co.,Ltd. (DPEC)
Delta EnergyTechnology(Wujiang) Co., Ltd.(DET-WJ)
Research anddevelopment of energy-saving technology,energy-savingequipment, energymanagement systemand technologyconsulting service, etc.
70.00 70.00
Ownership (%)

23
Name of Name of Main Business December 31, December 31,Investor Subsidiary Activities 2014 2013 Description
DeltaElectronics(Shanghai) Co.,Ltd. (DPEC)
Delta EnergyTechnology(Shanghai) Co., Ltd.(DET-SH)
Research anddevelopment of energy-saving technology,energy-savingequipment, energymanagement systemand technologyconsulting service, etc.
10.00 10.00
Delta Greentech(China) Co.,Ltd. (DGC)
Delta EnergyTechnology(Shanghai) Co., Ltd.(DET-SH)
Research anddevelopment of energy-saving technology,energy-savingequipment, energymanagement systemand technologyconsulting service, etc.
90.00 90.00
Delta NetworksHolding Ltd.(DNH)
Delta Networks, Inc.(DNI Cayman)
Equity investments 100.00 100.00
Delta Networks,Inc. (DNICayman)
Delta Networks, Inc.(Taiwan) (DNIT)
Manufacturing andsales of networkingsystem and peripherals
99.98 99.98
Delta Networks,Inc. (DNICayman)
DNI Logistics (USA)Corp. (ALN)
Trading of networkingsystem and peripherals
100.00 100.00
Delta Networks,Inc. (DNICayman)
Delta NetworksInternational Ltd.(DNIL-Labuan)
Trading of networkingsystem and peripherals
100.00 100.00
Delta Networks,Inc. (DNICayman)
Delta Networks(H.K.) Ltd. (DNHK)
Equity investments 100.00 100.00
Ownership (%)

31
24
Name of Name of Main Business December 31, December 31,Investor Subsidiary Activities 2014 2013 Description
Delta Networks(H.K.) Ltd.(DNHK)
Delta Networks(Dongguan) Ltd.(DII)
Manufacturing andsales of other radiotransmission apparatus,incorporating receptionapparatus and otherradio-broadcastreceivers, combinedwith sound recordingor reproducingapparatus
100.00 100.00
Delta Networks(H.K.) Ltd.(DNHK)
Delta Networks(Shanghai) Ltd.(DNS)
Design of computersoftware
100.00 100.00
Delta Networks(H.K.) Ltd.(DNHK)
Delta Networks(Xiamen) Ltd. (DNX)
Operation of radiotransmission apparatus,and automatic dataprocessing, reception,conversion andtransmission orregeneration of voice,images or other data ofthe machine, includingswitches and routers,with a special programto control a computeror word processor withmemory business
100.00 100.00
Delta Networks,Inc. (Taiwan)(DNIT)
Ayecom TechnologyCo., Ltd. (Ayecom)
Manufacturing andsales of wire andwirelesstelecommunicationsequipment, electronicparts and controlledtelecommunicationsradio frequency devices
100.00 100.00
Cyntec Co.,Ltd. (Cyntec)
Fairview Assets Ltd.(Fairview)
Equity investments 100.00 100.00
Fairview AssetsLtd. (Fairview)
Grandview HoldingLtd. (Grandview)
Equity investments 100.00 100.00
GrandviewHolding Ltd.(Grandview)
Cyntec Holding(H.K.) Ltd. (CHK)
Equity investments 100.00 100.00
Ownership (%)

25
Note A: Companies were established or acquired through merger during 2014.
Note B: Companies were established or acquired through merger during 2013.
Note C: On April 1, 2014, the Company’s wholly-owned subsidiary – Delta Robot AutomaticCo., Ltd. was merged into the Company and the surviving company was the Company.
Note D: DIH acquired stock ownership in Ace, Drake, DGSG (please refer to Note E) andBoom (please refer to Note F) which indirectly acquired 3.811%, 48.51%, 8.21% and25% stock ownership, respectively in DGC. Including the original 10.38% stockownership held by DIH, the Company’s consolidated stock ownership in DGC was95.91% and DGC was included in the consolidated financial statements.
Note E: DIH indirectly held 8.21% share ownership of DGC through DGSG, and acquired54.83% share ownership of DGSG on April 1, 2013. DGSG was included in theconsolidated financial statements effective on that date, and DIH acquired 45.17%share ownership of DGSG on September 1, 2014.
Note F: DIH acquired 100% share ownership of Boom on September 1, 2014. Boom wasincluded in the consolidated financial statement effective on that date, and DIH
Name of Name of Main Business December 31, December 31,Investor Subsidiary Activities 2014 2013 Description
GrandviewHolding Ltd.(Grandview)
Cyntec InternationalLtd. (CIL-Labuan)
Trading 100.00 100.00
Cyntec Holding(H.K.) Ltd.(CHK)
Cyntec (Suzhou) Co.,Ltd. (CSC)
Research, development,manufacturing andsales of new-typeelectronic componentsand wholesale, importand export of similarproducts
100.00 100.00
Cyntec Holding(H.K.) Ltd.(CHK)
Cyntec Electronics(Suzhou) Co., Ltd.(CES)
Research, development,manufacturing andsales of new-typeelectronic components(chip components,sensing elements,hybrid integratedcircuits) and wholesale,import and export ofsimilar products
100.00 100.00
DelBio Inc.(DelBio)
DelBio (Wujiang)Co., Ltd.
Manufacturing,wholesale and retail ofmedical equipment
100.00 100.00 Note B
Ownership (%)

33 26
indirectly held 25% share ownership of DGC.
Note G: Formerly known as Delta Smart Green Life Co., Ltd. and was renamed on August 25,2014. Liquidation was completed at December 4, 2014.
Note H: Formerly known as Vivitek Corporation and was renamed on December 29, 2014.
Note I: On December 19, 2012, the Board of Directors of DelSolar and NSP resolved to mergethrough share exchange. Each common share of DelSolar will be converted into 0.735share of NSP. DelSolar will be the dissolved company and NSP will be the survivingcompany after the consolidation. The effective date was May 31, 2013. TheCompany acquired 17% ownership of NSP after share exchange and does not havecontrol over NSP. Therefore, the Company deconsolidated DelSolar from May 31,2013. Gain or loss arising from loss of control is disclosed in Note 6(12).
C. Subsidiaries not included in the consolidated financial statements: None.
D. Adjustments for subsidiaries with different balance sheet dates: None.
E .Nature and extent of the restrictions on fund remittance from subsidiaries to the parent company:None.
(4) Foreign currency translation
Items included in the financial statements of each of the Group’s entities are measured using thecurrency of the primary economic environment in which the entity operates (the “functionalcurrency”). The consolidated financial statements are presented in New Taiwan dollars, which isthe Company’s functional and the Group’s presentation currency.
A. Foreign currency transactions and balances
(a) Foreign currency transactions are translated into the functional currency using the exchangerates prevailing at the dates of the transactions or valuation where items are remeasured.Foreign exchange gains and losses resulting from the settlement of such transactions arerecognised in profit or loss in the period in which they arise, except when deferred in othercomprehensive income as qualifying cash flow hedges.
(b) Monetary assets and liabilities denominated in foreign currencies at the period end arere-translated at the exchange rates prevailing at the balance sheet date. Exchangedifferences arising upon re-translation at the balance sheet date are recognised in profit orloss.
(c) Non-monetary assets and liabilities denominated in foreign currencies held at fair valuethrough profit or loss are re-translated at the exchange rates prevailing at the balance sheetdate; their translation differences are recognised in profit or loss as part of the fair value gainor loss. Non-monetary assets and liabilities denominated in foreign currencies held at fairvalue through other comprehensive income are re-translated at the exchange rates prevailingat the balance sheet date; their translation differences are recognised in other comprehensiveincome. However, non-monetary assets and liabilities denominated in foreign currencies

27
that are not measured at fair value are translated using the historical exchange rates at thedates of the initial transactions.
(d) All foreign exchange gains and losses are presented in the statement of comprehensiveincome within other gains and losses.
B. Translation of foreign operations
(a) The operating results and financial position of all the group entities that have a functionalcurrency different from the presentation currency are translated into the presentation currencyas follows:
i. Assets and liabilities for each balance sheet presented are translated at the closingexchange rate at the date of that balance sheet;
ii. Income and expenses for each statement of comprehensive income are translated ataverage exchange rates of that period; and
iii. All resulting exchange differences are recognised in other comprehensive income.
(b) When a foreign operation of an associate or jointly controlled entity is partially disposed ofor sold, exchange differences that were recorded in other comprehensive income areproportionately reclassified to profit or loss as part of the gain or loss on sale. In addition,when the Group still retains partial interest in the former foreign associate or jointlycontrolled entity after losing significant influence over the former foreign associate, or losingjoint control of the former jointly controlled entity, such transactions should be accounted foras disposal of all interest in these foreign operations.
(c) When the foreign operation partially disposed of or sold is a subsidiary, cumulative exchangedifferences that were recorded in other comprehensive income are proportionately transferredto the non-controlling interest in this foreign operation. In addition, if the Group retainspartial interest in the former foreign subsidiary after losing control of the former foreignsubsidiary, such transactions should be accounted for as disposal of all interest in the foreignoperation.
(d) Goodwill and fair value adjustments arising on the acquisition of a foreign entity are treatedas assets and liabilities of the foreign entity and translated at the closing exchange rates at thebalance sheet date.
(5) Classification of current and non-current items
A. Assets that meet one of the following criteria are classified as current assets; otherwise they areclassified as non-current assets:
(a) Assets arising from operating activities that are expected to be realised, or are intended to besold or consumed within the normal operating cycle;
(b) Assets held mainly for trading purposes;
(c) Assets that are expected to be realised within twelve months from the balance sheet date;

35 28
(d) Cash and cash equivalents, excluding restricted cash and cash equivalents and those that areto be exchanged or used to pay off liabilities more than twelve months after the balance sheetdate.
B. Liabilities that meet one of the following criteria are classified as current liabilities; otherwisethey are classified as non-current liabilities:
(a) Liabilities that are expected to be paid off within the normal operating cycle;
(b) Liabilities arising mainly from trading activities;
(c) Liabilities that are to be paid off within twelve months from the balance sheet date;
(d) Liabilities for which the repayment date cannot be extended unconditionally to more thantwelve months after the balance sheet date. Terms of a liability that could, at the option of thecounterparty, result in its settlement by the issue of equity instruments do not affect itsclassification.
(6) Cash equivalents
Cash equivalents refer to short-term highly liquid investments that are readily convertible to knownamount of cash and subject to an insignificant risk of changes in value. Time deposits that meet theabove criteria and are held for the purpose of meeting short-term cash commitment in operations areclassified as cash equivalents.
(7) Financial assets at fair value through profit or loss
A. Financial assets at fair value through profit or loss are financial assets held for trading orfinancial assets designated as at fair value through profit or loss on initial recognition.Financial assets are classified in this category of held for trading if acquired principally for thepurpose of selling in the short-term. Derivatives are also categorized as financial assets held fortrading unless they are designated as hedges. Financial assets that meet one of the followingcriteria are designated as at fair value through profit or loss on initial recognition:
(a) Hybrid (combined) contracts; or
(b) They eliminate or significantly reduce a measurement or recognition inconsistency; or
(c) They are managed and their performance is evaluated on a fair value basis, in accordancewith a documented risk management or investment strategy.
B. On a regular way purchase or sale basis, financial assets held for trading are recognised andderecognised using trade date accounting. Derivatives and financial assets designated as at fairvalue through profit or loss on initial recognition are recognised and derecognised usingsettlement date accounting.

29
C. Financial assets at fair value through profit or loss are initially recognised at fair value. Relatedtransaction costs are expensed in profit or loss. These financial assets are subsequentlyremeasured and stated at fair value, and any changes in the fair value of these financial assets arerecognised in profit or loss. Investments in equity instruments that do not have a quoted marketprice in an active market and whose fair value cannot be reliably measured or derivatives that arelinked to and must be settled by delivery of such unquoted equity instruments are presented in‘financial assets measured at cost’.
(8) Available-for-sale financial assets
A. Available-for-sale financial assets are non-derivatives that are either designated in this categoryor not classified in any of the other categories.
B. On a regular way purchase or sale basis, available-for-sale financial assets are recognised andderecognised using trade date accounting.
C. Available-for-sale financial assets are initially recognised at fair value plus transaction costs.These financial assets are subsequently remeasured and stated at fair value, and any changes inthe fair value of these financial assets are recognised in other comprehensive income.Investments in equity instruments that do not have a quoted market price in an active market andwhose fair value cannot be reliably measured or derivatives that are linked to and must be settledby delivery of such unquoted equity instruments are presented in ‘financial assets measured atcost’.
(9) Notes and accounts receivable, other receivables
Notes receivable and accounts receivable are claims resulting from the sale of goods or services.Other receivables are those arising from transactions other than the sale of goods or services.Notes receivable, accounts receivable and other receivables are recognized initially at fair value andsubsequently measured at amortised cost using the effective interest method, less provision forimpairment. However, for short-term accounts receivable without bearing interest, as the effect ofdiscounting is insignificant, they are measured subsequently at original invoice amount.
(10) Impairment of financial assets
A. The Group assesses at each balance sheet date whether there is objective evidence that afinancial asset or a group of financial assets is impaired as a result of one or more events thatoccurred after the initial recognition of the asset (a ‘loss event’) and that loss event (or events)has an impact on the estimated future cash flows of the financial asset or group of financialassets that can be reliably estimated.
B. The criteria that the Group uses to determine whether there is objective evidence of animpairment loss is as follows:
(a) Significant financial difficulty of the issuer or debtor;
(b) A breach of contract, such as a default or delinquency in interest or principal payments;
(c) The Group, for economic or legal reasons relating to the borrower’s financial difficulty,

37
30
granted the borrower a concession that a lender would not otherwise consider;
(d) It becomes probable that the borrower will enter bankruptcy or other financialreorganisation;
(e) The disappearance of an active market for that financial asset because of financialdifficulties; or
(f) Observable data indicating that there is a measurable decrease in the estimated future cashflows from a group of financial assets since the initial recognition of those assets, althoughthe decrease cannot yet be identified with the individual financial asset in the group,including adverse changes in the payment status of borrowers in the group or national orlocal economic conditions that correlate with defaults on the assets in the group;
(g) Information about significant changes with an adverse effect that have taken place in thetechnology, market, economic or legal environment in which the issuer operates, andindicates that the cost of the investment in the equity instrument may not be recovered;
(h) A significant or prolonged decline in the fair value of an investment in an equityinstrument below its cost.
C. When the Group assesses that there has been objective evidence of impairment and animpairment loss has occurred, accounting for impairment is made as follows according to thecategory of financial assets:
(a) Financial assets measured at amortised cost
The amount of the impairment loss is measured as the difference between the asset’scarrying amount and the present value of estimated future cash flows discounted at thefinancial asset’s original effective interest rate, and is recognised in profit or loss. If, in asubsequent period, the amount of the impairment loss decreases and the decrease can berelated objectively to an event occurring after the impairment loss was recognised, thepreviously recognised impairment loss is reversed through profit or loss to the extent thatthe carrying amount of the asset does not exceed its amortised cost that would have been atthe date of reversal had the impairment loss not been recognised previously. Impairmentloss is recognised and reversed by adjusting the carrying amount of the asset through theuse of an impairment allowance account.
(b) Financial assets measured at cost
The amount of the impairment loss is measured as the difference between the asset’scarrying amount and the present value of estimated future cash flows discounted at currentmarket return rate of similar financial asset, and is recognised in profit or loss.Impairment loss recognised for this category shall not be reversed subsequently.Impairment loss is recognised by adjusting the carrying amount of the asset through the useof an impairment allowance account.

31
(c) Available-for-sale financial assets
The amount of the impairment loss is measured as the difference between the asset’sacquisition cost (less any principal repayment and amortisation) and current fair value, lessany impairment loss on that financial asset previously recognised in profit or loss, and isreclassified from ‘other comprehensive income’ to ‘profit or loss’. If, in a subsequentperiod, the fair value of an investment in a debt instrument increases, and the increase canbe related objectively to an event occurring after the impairment loss was recognised, thensuch impairment loss is reversed through profit or loss. Impairment loss of an investmentin an equity instrument recognised in profit or loss shall not be reversed through profit orloss. Impairment loss is recognised and reversed by adjusting the carrying amount of theasset through the use of an impairment allowance account.
(11) Derecognition of financial assets
The Group derecognises a financial asset when one of the following conditions is met:
A. The contractual rights to receive cash flows from the financial asset expire.
B. The contractual rights to receive cash flows from the financial asset have been transferred andthe Group has transferred substantially all risks and rewards of ownership of the financial asset.
C. The contractual rights to receive cash flows from the financial asset have been transferred, andthe Group has not retained control of the financial asset.
(12) Inventories
Inventories are stated at the lower of cost and net realisable value. Inventories are recorded atstandard cost and variances are allocated to inventories and cost of goods sold at the balance sheetdate. The cost of finished goods and work in progress comprises raw materials, direct labour,other direct costs and related production overheads (allocated based on normal operating capacity).It excludes borrowing costs. The item by item approach is used in applying the lower of cost andnet realisable value. Net realisable value is the estimated selling price in the ordinary course ofbusiness, less the estimated cost of completion and applicable variable selling expenses.
(13) Non-current assets (or disposal groups) held for sale
Non-current assets (or disposal group) are classified as assets held for sale when their carryingamount is to be recovered principally through a sale transaction rather than through continuing use,and a sale is considered highly probable. They are stated at the lower of carrying amount and fairvalue less costs to sell.
(14) Investments accounted for under the equity method / associates
A. Associates are all entities over which the Group has significant influence but not control. Ingeneral, it is presumed that the investor has significant influence, if an investor holds, directlyor indirectly 20 percent or more of the voting power of the investee. Investments in associatesare accounted for under the equity method and are initially recognised at cost.

3932
B. The Group’s share of its associates’ post-acquisition profits or losses is recognised in profit orloss, and its share of post-acquisition movements in other comprehensive income is recognisedin other comprehensive income. When the Group’s share of losses in an associate equals orexceeds its interest in the associate, including any other unsecured receivables, the Group doesnot recognise further losses, unless it has incurred / legal or constructive obligations or madepayments on behalf of the associate.
C. When changes in an associate’s equity are not recognised in profit or loss or othercomprehensive income of the associate and such changes do not affect the Group’s ownershippercentage of the associate, the Group recognises change in ownership interests in the associatein ‘capital surplus’ in proportion to its ownership.
D. Unrealised gains on transactions between the Group and its associates are eliminated to theextent of the Group’s interest in the associates. Unrealised losses are also eliminated unlessthe transaction provides evidence of an impairment of the asset transferred. Accountingpolicies of associates have been adjusted where necessary to ensure consistency with thepolicies adopted by the Group.
E. In the case that an associate issues new shares and the Group does not subscribe or acquire newshares proportionately, which results in a change in the Group’s ownership percentage of theassociate but maintains significant influence on the associate, then ‘capital surplus’ and‘investments accounted for under the equity method’ shall be adjusted for the increase ordecrease of its share of equity interest. If the above condition causes a decrease in theGroup’s ownership percentage of the associate, in addition to the above adjustment, theamounts previously recognised in other comprehensive income in relation to the associate arereclassified to profit or loss proportionately on the same basis as would be required if therelevant assets or liabilities were disposed of.
F. Upon loss of significant influence over an associate, the Group remeasures any investmentretained in the former associate at its fair value. Any difference between fair value andcarrying amount is recognised in profit or loss.
G. When the Group disposes its investment in an associate and loses significant influence overthis associate, the amounts previously recognised in other comprehensive income in relation tothe associate are reclassified to profit or loss or transferred directly to retained earnings. If itretains significant influence over the associate, the amounts previously recognised in othercomprehensive income in relation to the associate are reclassified to profit or lossproportionately in accordance with the aforementioned approach.
(15) Cash surrender value of life insurance
Premium paid for life insurance with saving nature belonging to cash surrender value is recognisedas a deduction to insurance premium expense in current period and is added to the carryingamount of cash surrender value.

33
(16) Property, plant and equipment
A. Property, plant and equipment are initially recorded at cost. Borrowing costs incurred duringthe construction period are capitalised.
B. Subsequent costs are included in the asset’s carrying amount or recognised as a separate asset,as appropriate, only when it is probable that future economic benefits associated with the itemwill flow to the Group and the cost of the item can be measured reliably. The carryingamount of the replaced part is derecognised. All other repairs and maintenance are charged toprofit or loss during the financial period in which they are incurred.
C. Land is not depreciated. Other property, plant and equipment apply cost model and aredepreciated using the straight-line method to allocate their cost over their estimated useful lives(leasehold improvements are amortized over the term of the lease). If each component ofproperty, plant and equipment is significant, it is depreciated separately.
D. The assets’ residual values, useful lives and depreciation methods are reviewed, and adjusted ifappropriate, at each balance sheet date. If expectations for the assets’ residual values anduseful lives differ from previous estimates or the patterns of consumption of the assets’ futureeconomic benefits embodied in the assets have changed significantly, any change is accountedfor as a change in estimate under IAS 8, ‘Accounting Policies, Changes in AccountingEstimates and Errors’, from the date of the change. The estimated useful lives of property,plant and equipment are 2~8 years except for buildings, the estimated useful life of which is5~55 years.
(17) Investment property
An investment property is stated initially at its cost and measured subsequently using the costmodel. Except for land, investment property is depreciated on a straight-line basis over itsestimated useful life of 7~50 years.
(18) Intangible assets
A. Goodwill
Goodwill arises in a business combination accounted for by applying the acquisition method.Acquisition prices in business combination are calculated by the price of acquisition and directcosts for related acquisition. The amount of goodwill recognised is the difference of theacquisition prices less net fair value of identifiable assets acquired. The amortisation durationof acquisition price may not exceed one year after the acquisition.
B. Tademarks
(a) Separately acquired trademarks with finite useful lives are stated at acquisition cost and areamortized on a straight-line basis over their estimated useful lives.
(b) Certain trademarks which are assessed to generate net cash inflows and have indefiniteuseful lives are recorded at actual cost. These are not amortized and instead are tested forimpairment annually.

41 34
C. Intangible assets other than goodwill and trademarks, mainly computer software, patents,customer relationship and technology authorization fees, are amortized on a straight-line basisover their estimated useful lives of 2~12 years.
(19) Impairment of non-financial assets
A. The Group assesses at each balance sheet date the recoverable amounts of those assets wherethere is an indication that they are impaired. An impairment loss is recognised for the amountby which the asset’s carrying amount exceeds its recoverable amount. The recoverableamount is the higher of an asset’s fair value less costs to sell or value in use. When thecircumstances or reasons for recognizing impairment loss for an asset in prior years no longerexist, the impairment loss shall be reversed to the extent of the loss previously recognised inprofit or loss. Such recovery of impairment loss shall not result to the asset’s carrying amountgreater than its amortized cost where no impairment loss was recognized.
B. The recoverable amounts of goodwill and intangible assets with an indefinite useful life andintangible assets that have not yet been available for use shall be evaluated periodically. Animpairment loss is recognised for the amount by which the asset’s carrying amount exceeds itsrecoverable amount. Impairment loss of goodwill previously recognised in profit or loss shallnot be reversed in the following years.
C. Goodwill for impairment testing purpose is allocated to cash generating units. This allocationis identified based on operating segments. Goodwill is allocated to a cash generating unit or agroup of cash generating unit that expects to benefit from business combination that willproduce goodwill.
(20) Borrowings
Borrowings are recognised initially at fair value, net of transaction costs incurred. Borrowingsare subsequently stated at amortised cost; any difference between the proceeds (net of transactioncosts) and the redemption value is recognised in profit or loss over the period of the borrowingsusing the effective interest method.
(21) Notes and accounts payable
Notes and accounts payable are obligations to pay for goods or services that have been acquired inthe ordinary course of business from suppliers. They are recognised initially at fair value andsubsequently measured at amortised cost using the effective interest method. However, forshort-term accounts payable without bearing interest, as the effect of discounting is insignificant,they are measured subsequently at original invoice amount.
(22) Financial liabilities at fair value through profit or loss
Financial liabilities at fair value through profit or loss are financial liabilities held for trading orfinancial liabilities designated as at fair value through profit or loss on initial recognition.Derivatives are classified in this category of held for trading unless they are designated as hedges.Derivatives are initially recognised at fair value, and related transaction costs are expensed in

35
profit or loss. These financial liabilities are subsequently remeasured and stated at fair value, andany changes in the fair value of these financial liabilities are recognised in profit or loss.
(23) Derecognition of financial liabilities
A financial liability is derecognised when the obligation under the liability specified in the contractis discharged or cancelled or expires.
(24) Offsetting financial instruments
Financial assets and liabilities are offset and reported at net amount in the balance sheet whenthere is a legally enforceable right to offset the recognised amounts and there is an intention tosettle on a net basis or realise the asset and settle the liability simultaneously.
(25) Derivative financial instruments and hedging activities
A. Derivatives are initially recognised at fair value on the date a derivative contract is entered intoand are subsequently remeasured at their fair value. Any changes in the fair value arerecognised in profit or loss.
B. The Group designates certain derivatives as either:
(a) Hedges of the fair value of recognised assets or liabilities or a firm commitment (fair valuehedge);
(b) Hedges of a particular risk associated with a recognised asset or liability or a highlyprobable forecast transaction (cash flow hedge);
C. The Group documents at the inception of the transaction the relationship between hedginginstruments and hedged items, as well as its risk management objectives and strategy forundertaking various hedging transactions. The Group also documents its assessment, both athedge inception and on an ongoing basis, of whether the derivatives that are used in hedgingtransactions are highly effective in offsetting changes in fair values or cash flows of hedgeditems.
D. The full fair value of a hedging derivative is classified as a non-current asset or liability whenthe remaining maturity of the hedged item is more than 12 months, and as a current asset orliability when the remaining maturity of the hedged item is less than 12 months. Tradingderivatives are classified as current assets or liabilities.
E. Fair value hedge
(a) Changes in the fair value of derivatives that are designated and qualified as fair valuehedges are recorded in profit or loss, together with any changes in the fair value of thehedged asset or liability that are attributable to the hedged risk.
(b) If the hedge no longer meets the criteria for hedge accounting, the adjustment to thecarrying amount of a hedged item for which the effective interest method is used isamortised to profit or loss over the period to maturity.

43 36
F. Cash flow hedge
(a) The effective portion of changes in the fair value of derivatives that are designated andqualified as cash flow hedges is recognised in other comprehensive income. The gain orloss relating to the ineffective portion is recognised immediately in the statement ofcomprehensive income within ‘other gains and losses’.
(b) When a hedging instrument expires, or is sold, cancelled or executed, or when a hedge nolonger meets the criteria for hedge accounting, any cumulative gain or loss existing inother comprehensive income at that time remains in other comprehensive income. Whena forecast transaction occurs or is no longer expected to occur, the cumulative gain or lossthat was reported in other comprehensive income is transferred to profit or loss in theperiods when the hedged forecast cash flow affects profit or loss.
(26) Employee benefits
A. Short-term employee benefits
Short-term employee benefits are measured at the undiscounted amount of the benefitsexpected to be paid in respect of service rendered by employees in a period and should berecognised as expenses in that period when the employees render service.
B. Pensions
(a) Defined contribution plans
Under the defined contribution plans, the contributions are recognised as pension expenseswhen they are due on an accrual basis. Prepaid contributions are recognised as an asset tothe extent of a cash refund or a reduction in the future payments.
(b) Defined benefit plans
i. The liability recognised in the balance sheet in respect of defined benefit pension plansis the present value of the defined benefit obligation at the balance sheet date less thefair value of plan assets, together with adjustments for unrecognised past service costs.The defined benefit obligation is calculated annually by independent actuaries using theprojected unit credit method. The present value of the defined benefit obligation isdetermined by discounting the estimated future cash outflows using interest rates ofhigh-quality corporate bonds that are denominated in the currency in which the benefitswill be paid, and that have terms to maturity approximating to the terms of the relatedpension liability; when there is no deep market in such corporate bonds, the Group usesinterest rates of government bonds (at the balance sheet date) instead.
ii. Actuarial gains and losses arising on defined benefit plans are recognised in profit orloss using the corridor method.
iii.Past service costs are recognised immediately in profit or loss if vested immediately; ifnot, the past service costs are amortised on a straight-line basis over the vesting period.

37
C. Employees’ bonus and directors’ and supervisors’ remuneration
Employees’ bonus and directors’ and supervisors’ remuneration are recognised as expenses andliabilities, provided that such recognition is required under legal or constructive obligation andthe amounts can be reliably estimated. However, if the accrued amounts for employees’bonus and directors’ and supervisors’ remuneration are different from the actual distributedamounts as resolved by the stockholders at their stockholders’ meeting subsequently, thedifferences should be recognised based on the accounting for changes in estimates. TheGroup calculates the number of shares of employees’ stock bonus based on the fair value pershare at the previous day of the stockholders’ meeting held in the year following the financialreporting year, after taking into account the effects of ex-rights and ex-dividends.
(27) Employee share-based payment
A. For the equity-settled share-based payment arrangements, the employee services received aremeasured at the fair value of the equity instruments granted at the grant date, and arerecognised as compensation cost over the vesting period, with a corresponding adjustment toequity. The fair value of the equity instruments granted shall reflect the impact of marketvesting conditions and non-market vesting conditions. Compensation cost is subject toadjustment based on the service conditions that are expected to be satisfied and the estimatesof the number of equity instruments that are expected to vest under the non-market vestingconditions at each balance sheet date. Ultimately, the amount of compensation costrecognised is based on the number of equity instruments that eventually vest.
B. For the cash-settled share-based payment arrangements, the employee services received andthe liability incurred are measured at the fair value of the liability to pay for those services, andare recognised as compensation cost and liability over the vesting period. The fair value ofthe liability shall be remeasured at each balance sheet date until settled at the settlement date,with any changes in fair value recognised in profit or loss.
(28) Income tax
A. The tax expense for the period comprises current and deferred tax. Tax is recognised in profitor loss, except to the extent that it relates to items recognised in other comprehensive incomeor items recognised directly in equity, in which cases the tax is recognised in othercomprehensive income or equity.
B. The current income tax charge is calculated on the basis of the tax laws enacted orsubstantively enacted at the balance sheet date in the countries where the Company and itssubsidiaries operate and generate taxable income. Management periodically evaluatespositions taken in tax returns with respect to situations in accordance with applicable taxregulations. It establishes provisions where appropriate based on the amounts expected to bepaid to the tax authorities. An additional 10% tax is levied on the unappropriated retainedearnings and is recorded as income tax expense in the year the stockholders resolve to retainthe earnings.

4538
C. Deferred tax is recognised, using the balance sheet liability method, on temporary differencesarising between the tax bases of assets and liabilities and their carrying amounts in theconsolidated financial statements. However, the deferred tax is not accounted for if it arisesfrom initial recognition of goodwill or of an asset or liability in a transaction other than abusiness combination that at the time of the transaction affects neither accounting nor taxableprofit or loss. Deferred tax is provided on temporary differences arising on investments insubsidiaries, except where the timing of the reversal of the temporary difference is controlledby the Group and it is probable that the temporary difference will not reverse in the foreseeablefuture. Deferred tax is determined using tax rates (and laws) that have been enacted orsubstantially enacted by the balance sheet date and are expected to apply when the relateddeferred tax asset is realised or the deferred tax liability is settled.
D. Deferred tax assets are recognised only to the extent that it is probable that future taxable profitwill be available against which the temporary differences can be utilised. At each balancesheet date, unrecognised and recognised deferred tax assets are reassessed.
E. Current income tax assets and liabilities are offset and the net amount is reported in the balancesheet when there is a legally enforceable right to offset the recognised amounts and there is anintention to settle on a net basis or realise the asset and settle the liability simultaneously.Deferred tax assets and liabilities are offset on the balance sheet when the entity has the legallyenforceable right to offset current tax assets against current tax liabilities and they are leviedby the same taxation authority on either the same entity or different entities that intend to settleon a net basis or realise the asset and settle the liability simultaneously.
F. Part of unused investment tax credits arising from expenditures incurred on acquisitions ofequipment or technology, research and development are recognised as deferred income taxassets to the extent that is probable that future taxable profit will be available against theinvestment tax credits.
(29) Share capital
Ordinary shares are classified as equity. Incremental costs directly attributable to the issue of newshares or stock options are shown in equity as a deduction, net of tax, from the proceeds.
(30) Dividends
Dividends are recorded in the Company’s financial statements in the period in which they areapproved by the Company’s shareholders. Cash dividends are recorded as liabilities.
(31) Revenue recognition
A. Sales of goods
The Group manufactures and sells computer information system, power supply, componentsand related products. Revenue is measured at the fair value of the consideration received orreceivable taking into account the value-added tax, returns, rebates and discounts for the saleof goods to external customers in the ordinary course of the Group’s activities. Revenue

39
arising from the sales of goods should be recognised when the Group has delivered the goodsto the customer, the amount of sales revenue can be measured reliably and it is probable thatthe future economic benefits associated with the transaction will flow to the entity. Thedelivery of goods is completed when the significant risks and rewards of ownership have beentransferred to the customer, the Group retains neither continuing managerial involvement tothe degree usually associated with ownership nor effective control over the goods sold, and thecustomer has accepted the goods based on the sales contract or there is objective evidenceshowing that all acceptance provisions have been satisfied.
B. Sales of services
The Group provides the installation of partial software and module services. Revenue isrecognised based on the percentage of completion of the transaction at the balance sheet date,if all of the following conditions are met:
(a) The amount of the revenue can be measured reliably;
(b) It is probable that the economic benefits related to the transaction will flow to theenterprise;
(c) The costs incurred and to be incurred associated with the transaction can be measuredreliably; and
(d) The degree of completion of the transaction can be measured reliably at the balance sheetdate.
(32) Government grants
Government grants are recognised at their fair value only when there is reasonable assurance thatthe Group will comply with any conditions attached to the grants and the grants will be received.Government grants are recognised in profit or loss on a systematic basis over the periods in whichthe Group recognises expenses for the related costs for which the grants are intended tocompensate. Government grants related to property, plant and equipment are presented bydeducting the grants from the asset’s carrying amount and are amortised to profit or loss over theestimated useful lives of the related assets as reduced depreciation expenses.
(33) Business combinations
A. The Group uses the acquisition method to account for business combinations. Theconsideration transferred for an acquisition is measured as the fair value of the assetstransferred, liabilities incurred or assumed and equity instruments issued at the acquisition date,plus the fair value of any assets and liabilities resulting from a contingent considerationarrangement. All acquisition-related costs are expensed as incurred. Identifiable assetsacquired and liabilities and contingent liabilities assumed in a business combination aremeasured initially at their fair values at the acquisition date. There is a choice on anacquisition-by-acquisition basis to measure the non-controlling interest in the acquiree either atfair value or at the non-controlling interest’s proportionate share of the acquiree’s identifiable

4740
net assets.
B. The excess of the consideration transferred, the amount of any non-controlling interest in theacquiree and the fair value of any previous equity interest in the acquiree over the fair value ofthe identifiable assets acquired and the liabilities assumed is recorded as goodwill at theacquisition date. If the total of consideration transferred, non-controlling interest in theacquiree recognised and the fair value of previously held equity interest in the acquiree is lessthan the fair value of the identifiable assets acquired and the liabilities assumed, the differenceis recognised directly in profit or loss on the acquisition date.
(34) Operating segments
Operating segments are reported in a manner consistent with the internal reporting provided to thechief operating decision-maker. The Group’s chief operating decision-maker is responsible forallocating resources and assessing performance of the operating segments.
5. CRITICAL ACCOUNTING JUDGEMENTS, ESTIMATES AND KEY SOURCES OFASSUMPTION UNCERTAINTY
The preparation of these consolidated financial statements requires management to make criticaljudgements in applying the Group’s accounting policies and make critical assumptions and estimatesconcerning future events. Assumptions and estimates may differ from the actual results and arecontinually evaluated and adjusted based on historical experience and other factors. Such assumptionsand estimates have a significant risk of causing a material adjustment to the carrying amounts of assetsand liabilities within the next financial year; and the related information is addressed below:
(1) Critical judgements in applying the Group’s accounting policies
A. Financial assets-impairment of equity investments
The Group follows the guidance of IAS 39 to determine whether a financial asset-equityinvestment is impaired. This determination requires significant judgement. In making thisjudgement, the Group evaluates, among other factors, the duration and extent to which the fairvalue of an equity investment is less than its cost and the financial health of and short-termbusiness outlook for the investee, including factors such as industry and sector performance,changes in technology and operational and financing cash flow.
If the decline of the fair value of an individual equity investment below cost was consideredsignificant or prolonged, the Group would suffer an additional loss of $8,404,184 in its 2014financial statements, for the transfer of the accumulated fair value adjustments recognised inother comprehensive income on the impaired available-for-sale financial assets to profit or lossor the recognition of the impairment loss on the impaired financial assets measured at cost inprofit or loss.
B. Investment property
The Group uses part of the property for its own use and part to earn rentals or for capitalappreciation. When the portions cannot be sold separately, the property is classified as

41
investment property only if the own-use portion accounts for less than 20% of the property.
(2) Critical accounting estimates and assumptions
The Group makes estimates and assumptions based on the expectation of future events that arebelieved to be reasonable under the circumstances at the end of the reporting period. The resultingaccounting estimates might be different from the related actual results. The estimates andassumptions that have a significant risk of causing a material adjustment to the carrying amounts ofassets and liabilities within the next financial year are addressed below:
A. Revenue recognition
In principle, sales revenues are recognised when the earning process is completed. The Groupestimates discounts and returns based on historical results and other known factors. Provisionsfor such liabilities are recorded as a deduction item to sales revenues when the sales arerecognised. The Group reassesses the reasonableness of estimates of discounts and returnsperiodically.
B. Impairment assessment of tangible and intangible assets (excluding goodwill)
The Group assesses impairment based on its subjective judgement and determines the separatecash flows of a specific group of assets, useful lives of assets and the future possible income andexpenses arising from the assets depending on how assets are utilised and industrialcharacteristics. Any changes of economic circumstances or estimates due to the change ofGroup strategy might cause material impairment on assets in the future.
C. Impairment assessment of goodwill
The impairment assessment of goodwill relies on the Group’s subjective judgement, includingidentifying cash-generating units, allocating assets and liabilities as well as goodwill to relatedcash-generating units, and determining the recoverable amounts of related cash-generating units.Please refer to Note 6(11) for the information on goodwill impairment.
D. Impairment assessment of investments accounted for under the equity method
The Group assesses the impairment of an investment accounted for under the equity method assoon as there is any indication that it might have been impaired and its carrying amount is notrecoverable. The Group assesses the recoverable amounts of an investment accounted forunder the equity method based on the present value of the Group’s share of expected future cashflows of the investee, and analyzes the reasonableness of related assumptions.

4942
6. DETAILS OF SIGNIFICANT ACCOUNTS
(1) Cash and cash equivalents
A. The Group associates with a variety of financial institutions all with high credit quality todisperse credit risk, so it expects that the probability of counterparty default is remote. TheGroup’s maximum exposure to credit risk at balance sheet date is the carrying amount of allcash and cash equivalents.
B. Details of the Group’s cash and cash equivalents pledged to others as collateral are provided inNote 8.
(2) Financial assets at fair value through profit or loss
December 31, 2014 December 31, 2013Cash on hand 6,052$ 5,068$Checking and demand deposits 49,206,516 22,951,196Time deposits 24,247,250 36,067,606Total 73,459,818$ 59,023,870$
December 31, 2014 December 31, 2013Current items:
Financial assets held fortradingListed stocks 26,573$ 22,979$Convertible bonds 4,500 18,000
31,073 40,979Valuation adjustment of
financial assets held fortrading 8,553 41,770
Total 39,626$ 82,749$
December 31, 2014 December 31, 2013Non-current items:
Financial assets designatedas at fair value throughprofit or lossConvertible bonds 96,700$ 96,700$
Valuation adjustment offinancial assets designatedas at fair value throughprofit or loss on initialrecognition 19,224 13,110
Total 115,924$ 109,810$

43
A. The Group recognised net gain on financial assets held for trading of $7,708 and $49,975 for theyears ended December 31, 2014 and 2013, respectively. The Group recognised net gain onfinancial assets designated as at fair value through profit or loss on initial recognition of $8,471and $20,868 for the years ended December 31, 2014 and 2013, respectively.
B. The counterparties of the Group’s private placement of convertible bonds are mostly listedcompanies in Taiwan and overseas. The Group expects that the counterparties of the privateplacement of convertible bonds that it invested in are not likely to default. The maximumexposure to credit risk at balance sheet date is the carrying amount of financial assets designatedas at fair value through profit or loss on initial recognition.
C. The non-hedging derivative instrument transactions and contract information are as follows:
Contract periodForward exchange contracts:
- Sell USD / Buy RMB USD 584,500 103.10.16~104.06.30- Buy USD / Sell EUR EUR 3,000 103.09.25~104.03.30- Sell USD / Buy SGD SGD 17,469 103.01.23~104.11.04- Buy USD / Sell SGD SGD 631 103.04.03~104.01.14- Sell USD / Buy TWD USD 14,000 103.10.16~104.02.25- Sell EUR / Buy TWD EUR 40 103.12.11~104.02.04- Sell USD / Buy JPY USD 2,500 103.11.14~104.02.09- Buy USD / Sell JPY USD 1,000 103.12.02~104.01.20- Sell USD / Buy EUR EUR 4,200 103.10.30~104.02.12- Sell USD / Buy CZK CZK 20,000 103.12.03~104.01.22- Buy USD / Sell RMB USD 102,000 103.12.05~104.03.25- Sell JPY / Buy USD JPY 1,500 103.12.16~104.03.04- Sell USD / Buy HKD HKD 95,395 103.11.24~104.05.13- Buy USD / Sell KRW USD 672 103.11.18~104.02.06
December 31, 2014Contract amount (nominal
Financial instruments principal) (in thousands)

5144
The Group entered into forward exchange contracts to manage exposures to foreign exchangerate fluctuations of import or export sales. However, the forward exchange transactions did notmeet the criteria for hedge accounting. Therefore, the Group did not apply hedge accounting.
D. The Group has no financial assets at fair value through profit or loss pledged to others.
(3) Available-for-sale financial assets
Contract periodForward exchange contracts:
- Sell USD / Buy RMB USD 160,000 102.07.18~103.04.10- Sell USD / Buy EUR EUR 2,550 102.11.01~103.03.13- Sell USD / Buy CZK CZK 12,500 102.12.04~103.01.23- Sell USD / Buy TWD USD 9,200 102.11.22~103.02.10- Sell JPY / Buy USD JPY 2,000 102.12.06~103.01.24- Sell USD / Buy SGD SGD 11,736 102.01.31~103.10.14- Sell EUR / Buy TWD EUR 50 102.09.26~103.01.27- Sell USD / Buy JPY USD 11,800 102.10.30~103.03.13- Buy USD / Sell EUR EUR 5,600 102.09.25~103.04.29- Buy USD / Sell KRW USD 900 102.11.18~103.02.07
December 31, 2013Contract amount (nominal
Financial instruments principal) (in thousands)
December 31, 2014 December 31, 2013Current items:
Listed stocks 947,304$ 763,466$Emerging stocks 36,526 -Valuation adjustment of
available-for-salefinancial assets 295,506)( 76,955)(
688,324$ 686,511$

45
A. The Group recognised fair value change in other comprehensive (loss) income of ($1,419,468)and $2,188,356 for the years ended December 31, 2014 and 2013, respectively.
B. The net asset value of the Group’s equity investment in WK Technology Fund V and WKTechnology Fund VIII declined significantly to below its initial investment cost. Accordingly,the Group recognised impairment loss of $15,549 for the year ended December 31, 2014.
C. The net assets of the Group’s equity investment in HELIO Optoelectronics Corp. declinedsignificantly to below its initial investment cost. Accordingly, the Group recognized impairmentloss of $12,871 and $42,012 for the years ended December 31, 2014 and 2013, respectively.
D. The Group has no debt instruments available-for-sale financial assets.
E. As of December 31, 2014 and 2013, the Group has no available-for-sale financial assets pledgedto others.
(4) Financial assets measured at cost
Based on the Group’s intention, its stocks investment should be classified as available-for-salefinancial assets. However, as those stocks are not traded in active market, and sufficient industryinformation of companies similar to stocks investment companies and their financial informationcannot be obtained, the fair value of the stocks investment cannot be measured reliably. TheGroup classified those stocks as financial assets measured at cost.
December 31, 2014 December 31, 2013Non-current items:
Listed stocks 4,594,911$ 4,090,714$Emerging stocks 141,000 254,492Unlisted stocks 1,356,108 1,183,109
6,092,019 5,528,315
945,512 2,191,487
Accumulated impairment-available-for-sale financialassets 70,432)( 42,012)(
6,967,099$ 7,677,790$
Valuation adjustment ofavailable-for-salefinancial assets
December 31, 2014 December 31, 2013Non-current items:
Unlisted stocks 773,911$ 424,525$Accumulated impairment -
financial assets measuredat cost 25,150)( 23,920)(
748,761$ 400,605$

53 46
(5) Hedge accounting
A. The Group entered into derivative financial instruments contracts with a variety of financialinstitutions with high credit quality and the Group deals with several banks to disperse the creditrisk. The maximum exposure to credit risk at balance sheet date is the carrying amount ofderivative financial instruments for hedging.
B. Cash flow hedges
In order to prevent the risk resulting from future cash flow fluctuation due to foreign exchangerate fluctuations, the Group entered into foreign currency forward contracts which meet allcriteria for hedge accounting. The related information is as follows:
a) The hedged highly probable forecast transactions denominated in foreign currency areexpected to occur during the next 12 months. Amounts accumulated in other comprehensiveincome as of December 31, 2014 are recycled into profit or loss in the period or periodswhen the hedged item affects profit or loss.
b) Information about gain or loss arising from cash flow hedges recognised in profit or loss andother comprehensive income:
December 31, 2014 December 31, 2013Items Assets (Liabilities) Assets (Liabilities)
Current items:Forward foreign exchange contracts
- cash flow hedge -$ 10,696$
Period ofDerivative gain (loss)
instruments Period of expected to beHedged designated Fair value anticipated recognized initems as hedges December 31, 2013 cash flow profit or loss
Receivables inforeign currencies
Forward exchangecontracts
($ 2,644) 2014.03.18 2014.03.18
Payables inforeign currencies
Forward exchangecontracts
13,340 2014.03.18~2014.08.12
2014.03.18~2014.08.12
Designated for hedging instruments
Items 2014 2013Amount of gain or loss adjusted in other 12,914)($ 13,151$
comprehensive incomeAmount of gain or loss transferred from 1,555)( 28,260
other comprehensive income to profitor loss
Years ended December 31,

47
(6) Accounts receivable and overdue receivables
A. The Group took out a credit insurance on the accounts receivable from certain main customers,
whereby 90% of the receivable amount can be covered when the receivables are uncollectible.
B. The Group entered into an agreement with a financial institution to sell its accounts receivable.
Under the agreement, the Group is not required to bear uncollectible risk of the underlying
accounts receivable, but is liable for the losses incurred on any business dispute.
As of December 31, 2014 and 2013, the outstanding accounts receivable sold to the financial
institution were as follows:
C. The aging analysis of accounts receivable that were past due but not impaired is as follows:
The above aging analysis was based on past due date.
December 31, 2014 December 31, 2013Accounts receivable 43,711,298$ 41,694,257$Less: Allowance for doubtful accounts 755,087)( 572,420)(
42,956,211 41,121,837Overdue receivables (shown as other non-current
assets) 80,029 75,700Less: Allowance for doubtful accounts 80,029)( 75,700)(
42,956,211$ 41,121,837$
AccountsPurchaser of accounts receivable receivable sold Amount advanced Collateral
Taishin International Bank 47,249$ -$ None
AccountsPurchaser of accounts receivable receivable sold Amount advanced Collateral
Taishin International Bank 132,438$ -$ None
December 31, 2014
December 31, 2013
December 31, 2014 December 31, 2013Up to 90 days 2,554,237$ 2,170,070$91 to 180 days 377,851 254,398181 to 365 days 646,493 535,647Over 365 days 432,783 313,596
4,011,364$ 3,273,711$

55
48
D. Movements on the Group’s provision for impairment of accounts receivable are as follows:
E. The credit quality of accounts receivable that were neither past due nor impaired was in thefollowing categories based on the Group’s credit quality control policy:
Group 1: Medium to low risk customers: These customers include large enterprise groups whichare operating well, financial transparency is high and approved by the headquarters’credit controller as well as government and educational institutions.
Group 2: Normal risk customers: Customers other than the medium to low risk customers.
F. The maximum exposure to credit risk at December 31, 2014 and 2013 was the carrying amountof each class of accounts receivable.
Individual Groupprovision provision Total
At January 1 75,700$ 572,420$ 648,120$Provision for impairment 8,464 241,083 249,547Write-offs during the
period 8,641)( 84,026)( 92,667)(Net exchange differences 4,506 25,610 30,116At December 31 80,029$ 755,087$ 835,116$
2014
Individual Groupprovision provision Total
At January 1 70,383$ 408,601$ 478,984$Provision for impairment 5,795 171,701 177,496Write-offs during the
period 2,296)( 1,271)( 3,567)(Effect of decrease inconsolidated entities - 23,245)( 23,245)(
Net exchange differences 1,818 16,634 18,452At December 31 75,700$ 572,420$ 648,120$
2013
December 31, 2014 December 31, 2013Group 1 26,956,282$ 24,843,119$Group 2 11,988,565 13,005,007
38,944,847$ 37,848,126$

49
(7) Inventories
Allowance forCost valuation loss Book value
Raw materials 6,368,533$ 536,922)($ 5,831,611$Work in process 1,697,115 - 1,697,115Finished goods 14,441,030 796,464)( 13,644,566Inventory in transit 398,683 - 398,683
22,905,361$ 1,333,386)($ 21,571,975$
December 31, 2014
Allowance forCost valuation loss Book value
Raw materials 5,450,697$ 489,750)($ 4,960,947$Work in process 1,588,689 - 1,588,689Finished goods 12,098,739 778,125)( 11,320,614Inventory in transit 171,579 - 171,579
19,309,704$ 1,267,875)($ 18,041,829$
December 31, 2013
2014 2013Cost of goods sold 137,107,429$ 131,377,438$Loss on long-term purchase contract - 9,853Provision for inventory obsolescence and
market price decline 131,583 246,504Others 358,756 443,536
137,597,768 132,077,331Less: Cost of goods sold from discontinued
operations - 1,650,665)(137,597,768$ 130,426,666$
Years ended December 31,

57 50
(8) Investments accounted for under the equity method
A. Details of investments accounted for under the equity method are set forth below:
Note: The percentage of ownership in associates represent the percentage of common sharesheld by the Group.
B. Share of profit (loss) of associates accounted for under the equity method are set forth below:
C. The financial statements of DET were reviewed by other independent accountants. Investmentsaccounted for under the equity method in these companies amounted to $6,519,788 and$6,051,355 as of December 31, 2014 and 2013, and share of profit and other comprehensiveincome of associates accounted for under the equity method were $1,101,031 and $993,227 forthe years ended December 31, 2014 and 2013, respectively.
D. The financial information of the Group’s principal associates is summarized below:
% %Name of associates (Note) Book value (Note) Book value
Delta Electronics (Thailand)Public Co., Ltd. (DET)
20.93 6,519,788$ 20.93 6,051,355$
Amita Technologies, Inc.(Amita) 26.93 254,160 30.97 233,118
Digital ProjectionInternational Ltd. (DPI) 41.00 292,213 32.11 280,034
Trillion Science Inc.(Trillion), etc. 34,175 131,768
7,100,336$ 6,696,275$
December 31, 2014 December 31, 2013
Name of associates 2014 2013DET 1,070,975$ 992,012$DPI, etc. 90,987)( 111,224)(
979,988$ 880,788$
Years ended December 31,
Assets Liabilities Revenue Profit/(Loss)December 31, 2014DET 36,982,505$ 10,295,501$ 41,879,493$ 5,536,586$Amita 781,222 429,491 600,183 27,537DPI 784,145 725,498 1,419,449 51,370)(Others 175,833 3,892 1 11,128)(
38,723,705$ 11,454,382$ 43,899,126$ 5,501,625$

51
E. The Group’s investment in DET has quoted market price. The fair value of DET as of December31, 2014 and 2013 was $17,800,959 and $12,761,160, respectively.
Assets Liabilities Revenue Profit/(Loss)December 31, 2013DET 33,675,899$ 10,540,890$ 40,809,811$ 5,217,471$Amita 355,504 145,974 212,373 76,423)(DPI 623,417 519,378 1,181,897 29,564)(Others 441,834 11,384 - 124,828
35,096,654$ 11,217,626$ 42,204,081$ 5,236,312$

59
52
(9)P
rope
rty,p
lanta
ndeq
uipm
ent
Unfin
ished
cons
tructi
onM
achi
nery
and
Testi
ngan
deq
uipm
ent
AtJa
nuar
y1,2
014
Land
Build
ings
equi
pmen
teq
uipm
ent
Othe
rsun
dera
ccep
tance
Total
Cost
4,96
0,55
2$
29,2
85,5
38$
26,2
36,4
04$
9,92
8,49
8$
7,94
2,01
4$
757,
920
$79
,110
,926
$Ac
cum
ulate
dde
prec
iatio
nan
dim
pairm
ent
12,2
60)
(7,
791,
223)
(19
,132
,188
)(
8,66
4,47
2)(
6,31
6,02
1)(
-41
,916
,164
)(
4,94
8,29
2$
21,4
94,3
15$
7,10
4,21
6$
1,26
4,02
6$
1,62
5,99
3$
757,
920
$37
,194
,762
$
2014
Open
ing
netb
ook
amou
nt4,
948,
292
$21
,494
,315
$7,
104,
216
$1,
264,
026
$1,
625,
993
$75
7,92
0$
37,1
94,7
62$
Addi
tions
-15
3,47
11,
496,
328
1,00
2,22
179
8,21
12,
081,
625
5,53
1,85
6Ac
quire
dth
roug
hbu
sines
sco
mbi
natio
ns-
-27
1,22
34,
292
-5,
542
Disp
osal
-1,
120)
(10
9,24
9)(
10,4
73)
(46
,056
)(
21,9
46)
(18
8,84
4)(
Tran
sfer
80,1
51)
(33
3,81
930
,449
29,0
5625
9,58
098
5,01
3)(
412,
260)
(De
prec
iatio
nch
arge
-1,
646,
003)
(2,
810,
990)
(87
3,49
7)(
1,13
4,01
8)(
-6,
464,
508)
(Im
pairm
entl
oss
-24
0)(
26,0
13)
(11
2)(
--
26,3
65)
(Ne
texc
hang
ediff
eren
ces
102,
529
1,03
7,59
376
8,72
899
,885
146,
955
981,
114)
(1,
174,
576
Clos
ing
netb
ook
amou
nt4,
970,
670
$21
,371
,835
$6,
453,
496
$1,
512,
329
$1,
654,
957
$85
1,47
2$
36,8
14,7
59$
AtDe
cem
ber3
1,20
14Co
st4,
982,
097
$30
,256
,283
$26
,454
,466
$10
,350
,897
$8,
408,
929
$85
1,47
2$
81,3
04,1
44$
Accu
mul
ated
depr
eciat
ion
and
impa
irmen
t11
,427
)(
8,88
4,44
8)(
20,0
00,9
70)
(8,
838,
568)
(6,
753,
972)
(-
44,4
89,3
85)
(4,
970,
670
$21
,371
,835
$6,
453,
496
$1,
512,
329
$1,
654,
957
$85
1,47
2$
36,8
14,7
59$

53
Unf
inis
hed
cons
truct
ion
Mac
hine
ryan
dTe
stin
gan
deq
uipm
ent
AtJ
anua
ry1,
2013
Land
Build
ings
equi
pmen
teq
uipm
ent
Oth
ers
unde
racc
epta
nce
Tota
lC
ost
4,58
0,05
2$
27,2
89,7
55$
28,3
88,7
11$
9,43
9,40
3$
7,29
6,75
9$
4,77
1,03
4$
81,7
65,7
14$
Acc
umul
ated
depr
ecia
tion
and
impa
irmen
t14
,528
)(
7,20
5,43
6)(
18,9
86,7
32)
(7,
924,
944)
(5,
725,
707)
(-
39,8
57,3
47)
(4,
565,
524
20,0
84,3
199,
401,
979
1,51
4,45
91,
571,
052
4,77
1,03
441
,908
,367
Less
:Cla
ssifi
edas
non-
curr
enta
sset
she
ldfo
rsal
e-
1,91
5,99
3)(
2,60
9,46
3)(
60,6
33)
(20
7,31
9)(
1,83
6,51
3)(
6,62
9,92
1)(
4,56
5,52
4$
18,1
68,3
26$
6,79
2,51
6$
1,45
3,82
6$
1,36
3,73
3$
2,93
4,52
1$
35,2
78,4
46$
2013
Ope
ning
netb
ook
amou
nt4,
565,
524
$20
,084
,319
$9,
401,
979
$1,
514,
459
$1,
571,
052
$4,
771,
034
$41
,908
,367
$A
dditi
ons
586,
507
2,47
2,26
62,
894,
933
863,
111
969,
101
1,02
4,86
78,
810,
785
Acq
uire
dth
roug
hbu
sine
ssco
mbi
natio
ns-
--
3,75
64,
405
-8,
161
Effe
ctof
decr
ease
inco
nsol
idat
eden
titie
s-
1,65
5,94
9)(
3,29
9,18
1)(
67,2
36)
(48
5,28
1)(
659,
813)
(6,
167,
460)
(D
ispo
sals
-3,
181)
(32
4,00
6)(
66,8
12)
(58
,751
)(
-45
2,75
0)(
Tran
sfer
155,
971)
(1,
634,
799
1,27
1,13
446
,603
637,
274
4,25
3,36
5)(
819,
526)
(D
epre
ciat
ion
char
ge-
1,69
9,94
5)(
3,24
4,34
1)(
1,08
8,76
7)(
1,09
0,23
1)(
-7,
123,
284)
(Im
pairm
emtl
oss
--
32,0
80)
(61
)(
--
32,1
41)
(N
etex
chan
gedi
ffere
nces
47,7
68)
(66
2,00
643
5,77
858
,973
78,4
2412
4,80
3)(
1,06
2,61
0C
losi
ngne
tboo
kam
ount
4,94
8,29
2$
21,4
94,3
15$
7,10
4,21
6$
1,26
4,02
6$
1,62
5,99
3$
757,
920
$37
,194
,762
$
AtD
ecem
ber3
1,20
13C
ost
4,96
0,55
2$
29,2
85,5
38$
26,2
36,4
04$
9,92
8,49
8$
7,94
2,01
4$
757,
920
$79
,110
,926
$A
ccum
ulat
edde
prec
iatio
nan
dim
pairm
ent
12,2
60)
(7,
791,
223)
(19
,132
,188
)(
8,66
4,47
2)(
6,31
6,02
1)(
-41
,916
,164
)(
4,94
8,29
2$
21,4
94,3
15$
7,10
4,21
6$
1,26
4,02
6$
1,62
5,99
3$
757,
920
$37
,194
,762
$

61
54
(10) Investment propertyLand Buildings Total
At January 1, 2014Cost 385,573$ 3,573,416$ 3,958,989$Accumulated depreciation
and impairment - 1,998,536)( 1,998,536)(385,573$ 1,574,880$ 1,960,453$
2014Opening net book amount 385,573$ 1,574,880$ 1,960,453$Reclassifications 80,151 332,109 412,260Depreciation charge - 148,865)( 148,865)(Closing net book amount 465,724$ 1,758,124$ 2,223,848$
At December 31, 2014Cost 465,724$ 4,321,469$ 4,787,193$Accumulated depreciation
and impairment - 2,563,345)( 2,563,345)(465,724$ 1,758,124$ 2,223,848$
Land Buildings TotalAt January 1, 2013Cost 229,602$ 2,109,236$ 2,338,838$Accumulated depreciation
and impairment - 1,106,703)( 1,106,703)(229,602$ 1,002,533$ 1,232,135$
2013Opening net book amount 229,602$ 1,002,533$ 1,232,135$Additions (from purchase) - 12,782 12,782Disposals - 225)( 225)(Reclassifications 155,971 663,555 819,526Depreciation charge - 103,765)( 103,765)(Closing net book amount 385,573$ 1,574,880$ 1,960,453$
At December 31, 2013Cost 385,573$ 3,573,416$ 3,958,989$Accumulated depreciation
and impairment - 1,998,536)( 1,998,536)(385,573$ 1,574,880$ 1,960,453$

55
A. Rental income from the lease of the investment property and direct operating expenses arisingfrom the investment property are shown below:
B. The fair value of the investment property held by the Group as at December 31, 2014 and 2013was $2,470,502 and $2,031,366, respectively, which was revalued by independent appraisers.Valuations were made using the market approach.
2014 2013Rental revenue from the lease of the
investment property 234,352$ 109,997$Direct operating expenses arising from the
investment property that generated rentalincome for the period -$ -$
Direct operating expenses arising from theinvestment property that did not generaterental income for the period 23,035$ 12,755$
Years ended December 31,

63
56
(11)
Intan
gibl
eass
etsCu
stom
erAt
Janu
ary1
,201
4Tr
adem
arks
Paten
tsGo
odwi
llRe
lation
ship
Othe
rsTo
talCo
st41
3,165
$1,0
45,01
4$
6,906
,772
$3,7
84,42
2$
1,381
,174
$13
,530,5
47$
Accu
mul
atedd
epre
ciatio
nan
dim
pairm
ent
3,567
)(
840,9
84)
(-
1,280
,410)
(54
7,71
0)(
2,672
,671)
(40
9,598
$20
4,030
$6,9
06,77
2$
2,504
,012
$83
3,46
4$
10,85
7,876
$20
14Op
enin
gnet
book
amou
nt40
9,598
$20
4,030
$6,9
06,77
2$
2,504
,012
$83
3,46
4$
10,85
7,876
$Ad
ditio
ns-a
cqui
red
sepa
ratel
y-
3,573
--
397,
044
400,6
17Ad
ditio
ns-a
cqui
red
thro
ugh
busin
essc
ombin
ation
s-
-3,2
761,2
51,53
3-
1,254
,809
Recla
ssific
ation
s-
1,006
)(
--
1,00
6-
Amor
tizati
on3,2
93)
(19
0,447
)(
-44
8,453
)(
380,
415)
(1,0
22,60
8)(
Impa
irmen
tlos
s-
-27
,263)
(1,1
72)
(-
28,43
5)(
Nete
xcha
nged
iffer
ence
s-
405
107,6
5213
7,234
1,53
5)(
243,7
56Cl
osin
gnet
book
amou
nt40
6,305
$16
,555
$6,9
90,43
7$
3,443
,154
$84
9,56
4$
11,70
6,015
$
AtDe
cem
ber3
1,20
14Co
st41
3,165
$1,0
13,50
8$
6,989
,919
$5,2
07,66
9$
1,637
,465
$15
,261,7
26$
Accu
mul
atedd
epre
ciatio
nan
dim
pairm
ent
6,860
)(
996,9
53)
(51
81,7
64,51
5)(
787,
901)
(3,5
55,71
1)(
406,3
05$
16,55
5$
6,990
,437
$3,4
43,15
4$
849,
564
$11
,706,0
15$

57
Custo
mer
AtJa
nuar
y1,2
013
Trad
emar
ksPa
tents
Good
will
Relat
ionsh
ipOt
hers
Total
Cost
413,1
64$
1,040
,791
$6,
856,1
28$
3,684
,059
$79
5,921
$12
,790,0
63$
Accu
mul
ated
depr
eciat
ionan
dim
pairm
ent
274)
(63
9,825
)(
-82
0,654
)(
386,4
88)
(1,8
47,24
1)(
412,8
9040
0,966
6,85
6,128
2,863
,405
409,4
3310
,942,8
22Le
ss:Cl
assif
iedas
non-
curre
ntas
sets
held
fors
ale-
--
-5,0
09)
(5,0
09)
(41
2,890
$40
0,966
$6,
856,1
28$
2,863
,405
$40
4,424
$10
,937,8
13$
2013
Open
ingn
etbo
okam
ount
412,8
90$
400,9
66$
6,85
6,128
$2,8
63,40
5$
409,4
33$
10,94
2,822
$Ad
ditio
ns-a
cqui
reds
epar
ately
--
-4,4
5139
4,183
398,6
34Ad
ditio
ns-a
cqui
redt
hrou
ghbu
sines
scom
bina
tions
--
6,287
20,41
152
4,691
551,3
89Ef
fecto
fdec
reas
ein
cons
olida
teden
tities
--
--
10,42
5)(
10,42
5)(
Amor
tizati
on3,2
92)
(19
8,283
)(
-41
9,234
)(
493,7
48)
(1,1
14,55
7)(
Nete
xcha
nged
iffer
ence
s-
1,347
44,35
734
,979
9,330
90,01
3Cl
osin
gnet
book
amou
nt40
9,598
$20
4,030
$6,
906,7
72$
2,504
,012
$83
3,464
$10
,857,8
76$
AtDe
cem
ber3
1,20
13Co
st41
3,165
$1,0
45,01
4$
6,90
6,772
$3,7
84,42
2$
1,381
,174
$13
,530,5
47$
Accu
mul
ated
depr
eciat
ionan
dim
pairm
ent
3,567
)(
840,9
84)
(-
1,280
,410)
(54
7,710
)(
2,672
,671)
(40
9,598
$20
4,030
$6,
906,7
72$
2,504
,012
$83
3,464
$10
,857,8
76$

65 58
A. Details of amortisation on intangible assets are as follows:
B. The Group bought registered or under-application trademarks rights such as 、
、VIVITEK、麗訊 and totaling $413,164 from Luxeon InternationalHolding Ltd. in the fourth quarter of 2012. Trademarks registered in certain countries areassessed to have finite useful lives. The remaining trademarks which have indefinite usefullives shall not be amortized but are tested for impairment annually.
C. Goodwill and trademarks with indefinite useful lives are allocated as follows to the Group’scash-generating units identified according to operating segment:
Acquisition prices in business combination are calculated by the price of acquisition and directcosts for related acquisition. The amount of goodwill recognised is the difference of theacquisition prices less net fair value of identifiable assets acquired. The amortisation durationof acquisition price may not exceed one year after the acquisition.
D. Goodwill and trademarks with indefinite useful lives are allocated to the Group’scash-generating units identified according to operating segment. The recoverable amount of allcash-generating units has been determined based on value-in-use calculations. Thesecalculations use pre-tax cash flow projections based on financial budgets approved by themanagement covering a five-year period.
The recoverable amount of all cash-generating units calculated using the value-in-useexceeded their carrying amount, so goodwill and indefinite useful lives trademarks were notimpaired. The key assumptions used for value-in-use calculations are gross margin, growthrate and discount rate.
2014 2013Operating costs 30,917$ 32,655$Selling expenses 368,529 317,344Administrative expenses 159,027 240,695Research and development expenses 464,135 523,863
1,022,608$ 1,114,557$
Years ended December 31,
December 31, 2014 December 31, 2013Goodwill:Cyntec and its 5,124,137$ 5,124,137$
subsidiariesDGC 1,834,985 1,728,016Others 31,315 54,619
6,990,437$ 6,906,772$Trademarks:Smart green life
business 386,823$ 386,823$

59
Management determined budgeted gross margin based on past performance and itsexpectations of market development. The weighted average growth rates used are consistentwith the forecasts included in industry reports. The discount rates used are pre-tax andreflect specific risks relating to the relevant operating segments.
E. The subsidiary – Ayecom Technology Co., Ltd. was merged into Delta Networks., Ltd. (Taiwan)starting from the effective date of consolidation of January 1, 2015. The Group has assessedand recognised impairment loss on goodwill and customer relationship of $28,435 for the yearended December 31, 2014.
(12) Non-current assets held for sale and discontinued operations
A. On December 19, 2012, the Board of Directors of DelSolar and Neo Solar Power Corporation(NSP) resolved to merge both companies through share exchange. Each common share ofDelSolar will be converted into 0.735 share of NSP. DelSolar will be the dissolved companyand NSP will be the surviving company after the consolidation. The effective date was May 31,2013. DelSolar meets the criteria of the subsidiary classified as held for sale due to the mergerthrough share exchange. The assets, liabilities and equity relating to DelSolar classified asdisposal group as held for sale meets the definition of discontinued operations to be presentedin discontinued operations. The disposal group classified as held for sale originally belonged toenergy management business.
Analysis of the result and cash flows of discontinued operations, and the result recognized onthe remeasurement of assets or disposal group, is as follows:
For the period fromJanuary 1 to May 31, 2013
Operating revenue 1,219,537$Operating costs and expenses 1,930,290)(Total non-operating income and expenses 8,368Loss before tax from discontinued operations 702,385)(Income tax expense 13,170)(Loss from discontinued operations, net 715,555)(Pre-tax gain recognized on the remeasurement of assets
of disposal group 809,194Pre-tax gain recognized on the disposal of disposal
group 25,989Income tax -Gain recognized on the remeasurement of assets of
disposal group, net of tax and on the disposal ofdisposal group 835,183
Total profit from discontinued operations 119,628$

67
60
Cash flows from discontinued operations:
(13) Other non-current assets
(14) Short-term borrowings
(15) Financial liabilities at fair value through profit or loss
A. The Group recognized net (loss) gain of ($72,100) and $4,576 for the years ended December31, 2014 and 2013, respectively.
B. The non-hedging derivative instruments transaction and contract information are provided inNote 6(2)C.
The Group entered into forward exchange contracts to manage exposures to foreign exchangerate fluctuations of import or export sales. However, these transactions did not meet all thecriteria for hedge accounting. Therefore, the Group did not apply the hedge accounting.
For the period fromJanuary 1 to May 31, 2013
Cash flows from operating activities 153,587$Cash flows from investing activities 365,185)(Cash flows from financing activities 515,024)(Effect on exchange rate changes 85,091Total cash flows 641,531)($
December 31, 2014 December 31, 2013Long-term prepaid rent 1,296,245$ 1,281,917$Prepayments for business facilities 1,030,137 925,750Guarantee deposits paid 121,209 174,999Cash surrender value of life insurance 111,650 112,832Prepayments for investments - 38,000Others 100,187 106,455
2,659,428$ 2,639,953$
December 31, 2014 December 31, 2013Unsecured bank loans 5,801,298$ 4,561,722$Credit lines 83,349,486$ 83,452,252$Interest rate per annum 0.53%~2.16% 0.45%~2.21%
December 31, 2014 December 31, 2013Current item:
Valuation adjustment of non-hedging derivatives 51,606$ 16,883$

61
(16) Long-term borrowings
As of December 31, 2014, the revolving loans of $26,366,000 can be drawn down during theperiod from May 30, 2014 to December 31, 2016 and are payable before the due date under theagreement.
(17) Pensions
A. a) The Group has a defined benefit pension plan as follows:
i. The Company and its domestic subsidiaries have a defined benefit pension plan inaccordance with the Labor Standards Law, covering all regular employees’ service yearsprior to the enforcement of the Labor Pension Act on July 1, 2005 and service yearsthereafter of employees who chose to continue to be subject to the pension mechanismunder the Law. Under the defined benefit pension plan, two units are accrued for eachyear of service for the first 15 years and one unit for each additional year thereafter,subject to a maximum of 45 units. Pension benefits are based on the number of unitsaccrued and the average monthly salaries and wages of the last 6 months prior toretirement. The Company contributes monthly an amount equal to 2% of the employees’monthly salaries and wages to the retirement fund deposited with Bank of Taiwan, thetrustee, under the name of the independent retirement fund committee.
ii. Certain subsidiaries located in Mainland China maintain defined benefit retirement(resignation) plans with relative contribution scheme. The employees and thesubsidiaries contribute an amount relatively based on a certain percentage of the monthlybasic salary depending on the employee’s position. When an employee retires or resigns,the total contribution from the employee is reimbursed based on the accumulatedcontribution (without interest) less withdrawals made by the employee in advance duringthe service period. The employee is also entitled to receive benefits calculated based onthe accumulated contribution (without interest) from the related subsidiary multiplied bythe approved benefit percentage for the employee’s service years less withdrawals madeby the employee in advance during the service period.
Type of borrowings December 31, 2014 December 31, 2013Credit loans 26,520,214$ 18,908,043$Less: Current portion (shown as other
current liabilities) 52,111)( 80,379)(26,468,103$ 18,827,664$
Credit lines 33,892,214$ 26,863,542$Interest rate per annum 0.43%~0.90% 0.43%~1.5%

69
62
b) The amounts recognised in the balance sheet are as follows:
c) Movements in present value of defined benefit obligations are as follows:
d) Movements in fair value of plan assets:
2014 2013Present value of funded defined benefit
obligations3,978,106)($ 4,079,520)($
Fair value of plan assets 644,925 687,276Present value of unfunded defined benefit
obligations 3,333,181)( 3,392,244)(Unrecognised actuarial losses/(gains) - -Unrecognised past service cost 109,617)( 7,398Net liability in the balance sheet - -
3,442,798)($ 3,384,846)($
December 31,
2014 2013Present value of defined benefit
obligationsAt January 1 4,079,520$ 4,198,165$Current pension costs 119,298 119,763Actuarial gain (loss) 151,654)( 205,584)(Exchange difference 46,448 46,200Benefits paid 110,623)( 78,881)(Settlement 4,883)( 143)(
3,978,106 4,079,520Classified as non-current assets held for
sale - -3,978,106$ 4,079,520$
2014 2013Fair value of plan assetsAt January 1 687,276$ 696,559$Expected return on plan assets 12,060 10,725Actuarial gain (loss) 3,994 1,882)(Employer contributions 49,258 49,166Benefits paid 107,663)( 63,642)(Decrease due to consolidated
subsidiaries - 3,650)(644,925 687,276
Classified as non-current assets held forsale - 3,650)(
644,925$ 683,626$

63
e) Amounts of expenses recognised in statements of comprehensive income:
Details of cost and expenses recognised in statements of comprehensive income are asfollows:
f) i. The Bank of Taiwan was commissioned to manage the Fund of the Company’s anddomestic subsidiaries’ defined benefit pension plan in accordance with the Fund’s annualinvestment and utilisation plan and the “Regulations for Revenues, Expenditures,Safeguard and Utilisation of the Labor Retirement Fund” (Article 6: The scope ofutilisation for the Fund includes deposit in domestic or foreign financial institutions,investment in domestic or foreign listed, over-the-counter, or private placement equitysecurities, investment in domestic or foreign real estate securitization products, etc.).With regard to the utilisation of the Fund, its minimum earnings in the annualdistributions on the final financial statements shall be no less than the earnings attainablefrom the amounts accrued from two-year time deposits with the interest rates offered bylocal banks. The composition of fair value of plan assets as of December 31, 2014 and2013 is given in the Annual Labor Retirement Fund Utilisation Report published by thegovernment. Expected return on plan assets was a projection of overall return for theobligations period, which was estimated based on historical returns and by reference tothe status of Labor Retirement Fund Utilisation by the Labor Pension Fund SupervisoryCommittee and taking into account the effect that the Fund’s minimum earnings in theannual distributions on the final financial statements shall be no less than the earningsattainable from the amounts accrued from two-year time deposits with the interest ratesoffered by local banks. The actual return on plan assets of the Company’s and domesticsubsidiaries’ for the years ended December 31, 2014 and 2013 were $16,135 and $8,843,
2014 2013Current service cost 109,548$ 129,359$Interest cost 79,347 63,583Expected return on plan assets 10,240)( 10,725)(Actuarial gain (loss) 1,863 -Profit (loss) arising from curtailment or
settlement3,731)( -
Current pension cost 176,787$ 182,217$
Years ended December 31,
2014 2013Cost of sales 73,393$ 67,980$Selling expenses 10,523 11,506General and administrative expenses 40,564 50,481Research and development expenses 52,307 52,250
176,787$ 182,217$
Years ended December 31,

7164
respectively.
ii. The defined benefit pension plans maintained by the subsidiaries located in MainlandChina do not have plan assets.
g) The principal actuarial assumptions used were as follows:
Assumptions regarding future mortality experience are set based on actuarial advice inaccordance with published statistics and experience in each territory.
h) Historical information of experience adjustments was as follows:
i) Expected contributions to the defined benefit pension plans of the Group within one yearfrom December 31, 2014 are $54,156.
B. a) Effective July 1, 2005, the Company and its domestic subsidiaries have established adefined contribution pension plan (the “New Plan”) under the Labor Pension Act, coveringall regular employees with R.O.C. nationality. Under the New Plan, the Company and itsdomestic subsidiaries contribute monthly an amount based on 6% of the employees’monthly salaries and wages to the employees’ individual pension accounts at the Bureau ofLabor Insurance. The benefits accrued are paid monthly or in lump sum upon terminationof employment. The pension costs under the defined contribution pension plans of theCompany and its domestic subsidiaries for the years ended December 31, 2014 and 2013were $267,404 and $253,168, respectively.
b) Other overseas companies have defined contribution plans in accordance with the localregulations.
2014 2013Discount rate 1.875%~4% 1.75%~4.5%Future salary increases 3%~3.5% 3%~3.5%Expected return on plan assets 1.75% 1.75%
Years ended December 31,
2014 2013 2012Present value of defined benefit
obligation4,008,199)($ 4,079,520)($ 4,198,165)($
Fair value of plan assets 644,925 687,276 696,559Surplus/(deficit) in the plan 3,363,274)($ 3,392,244)($ 3,501,606)($Experience adjustments on plan
liabilities 38,534$ 12,492$ 24,360)($Experience adjustments on plan
assets 4,260$ 3,001)($ 6,907)($
Years ended December 31,

65
(18) Share-based payment
A. a) As of December 31, 2013, the Company’s share-based payment arrangements were asfollows:
Note A: Two years’ service vested 40%; three years’ service vested 70%; four years’service vested 100%.
Note B: Quantity granted is calculated based on the share conversion ratio between theCompany and Cyntec.
b) Details of the above share-based payment arrangements are as follows:
i. First employee stock options compensation plan of the Company
Note: Weighted-average exercise price of options outstanding at beginning of year wasadjusted due to the change in common stock after taking into account stockdividends and employees’ bonus distributed.
ii. Second employee stock options compensation plan of Cyntec assumed by the Company
Quantity Contract VestingType of arrangement Grant date granted period conditions
First employee stock options 2007.12.18 60,000,000 6 years (Note A)compensation plan of theCompany
Second employee stock options 2007.12.03 5,355,070 6 years "compensation plan of Cyntec (Note B)assumed by the Company
" 2007.12.27 254,195 6 years "(Note B)
Weighted-averageNo. of exercise priceshares (in dollars) (Note)
Options outstanding at beginning of the year 15,910,798 70.1$Options granted - -Options exercised 15,701,418)( 68.4Options forfeited 209,380)( 68.1Options outstanding at end of the year (Note) - -$Options exercisable at end of the year -
Year ended December 31, 2013

73
66
Note: Weighted-average exercise price of options outstanding at beginning of year wasadjusted due to the change in common stock after taking into account stockdividends and employees’ bonus distributed.
c) The weighted-average stock price of stock options at exercise dates for the year endedDecember 31, 2013 was $135.3 (in dollars).
d) As of December 31, 2013, the Company’s share-based payment arrangements were allexpired.
e) Information on estimation of fair value of employee stock options of Cyntec assumed by
the Company using the Black-Scholes option-pricing model on the grant date are as
follows:
Note: Expected price volatility rate was estimated by using the stock prices of the mostrecent period with length of this period approximate to the length of the stockoptions’ expected life, and the standard deviation of return on the stock during thisperiod.
Weighted-averageNo. of exercise priceshares (in dollars)(Note)
Options outstanding at beginning of the year 642,079 36.59$Options granted - -Options exercised 641,922)( 35.76Options forfeited 157)( 35.19Options outstanding at end of the year (Note) - -$Options exercisable at end of the year (Note) -
Year ended December 31, 2013
Expected Expected Weighted-
Stock Exercise price Expected dividend Risk-free average
Type of Grant price price volatility vesting yield interest fair valuearrangement date (in dollars) (in dollars) (Note) period rate rate (in dollars)
Second employee 2007.12.03 100.5$ 41.8$ 40.23% 2.33 years 0.00% 0.853% 60.7591$
stock options
compensation
plan of Cyntec
assumed by
the Company
" 2007.12.27 100.5 41.4 40.23% 2.48 years 0.00% 0.877% 61.3189

67
B. NEM’s share-based payment transactions
a) For the years ended December 31, 2014 and 2013, NEM’s share-based paymenttransactions are set forth below:
Type of Grant Quantity Contractarrangement date granted period Vesting conditions
First employee 2009.11.25 572,600 8 years Two years’ service vested 50%;stock options three years’ service vested 75%;compensation plan four years’ service vested 100%
Second 2010.04.30 590,000 8 years 〃
employee stockoptionscompensation plan
Third employee 2010.12.21 388,000 8 years 〃
stock optionscompensation plan
Fourth employee 2011.12.21 1,299,400 8 years 〃
stock optionscompensation plan
Fifth employee 2012.12.10 847,000 8 years 〃
stock optionscompensation plan
Sixth employee 2013.03.11 155,000 8 years 〃
stock optionscompensation plan
Seventh employee 2013.07.29 40,000 8 years 〃
stock optionscompensation plan
Eighth employee 2013.10.28 65,000 8 years 〃
stock optionscompensation plan
Ninth employee 2014.04.29 1,433,600 8 years 〃
stock optionscompensation plan

75
68
b) Details of the employee stock options compensation plan of NEM are set forth below:
c) The expiry date and exercise price of stock options outstanding at balance sheet date are asfollows:
Weighted- Weighted-average average
No. of exercise price No. of exercise priceshares (in dollars) shares (in dollars)
Options outstanding at 2,623,400 10$ 2,605,400 10$beginning of the year
Options granted 1,433,600 10 260,000 10Options exercised - - - -Options forfeited 1,172,000)( 10 242,000)( 10Options outstanding at
end of the year 2,885,000 10$ 2,623,400 10$Options exercisable at
end of the year 1,006,800 1,062,950
Years ended December 31,2014 2013
Exercise ExerciseIssue date No. of price No. of priceapproved Expiry date shares (in dollars) shares (in dollars)
2009.11.25 2017.11.24 157,000 10$ 317,000 10$2010.04.30 2018.04.29 125,000 10 157,000 102010.12.21 2018.12.20 288,000 10 328,000 102011.12.21 2019.12.20 194,400 10 764,400 102012.12.10 2020.12.09 582,000 10 797,000 102013.03.11 2021.03.10 155,000 10 155,000 102013.07.29 2021.07.28 40,000 10 40,000 102013.10.28 2021.10.27 65,000 10 65,000 102014.04.29 2022.04.28 1,278,000 10 - -
December 31, 2014 December 31, 2013
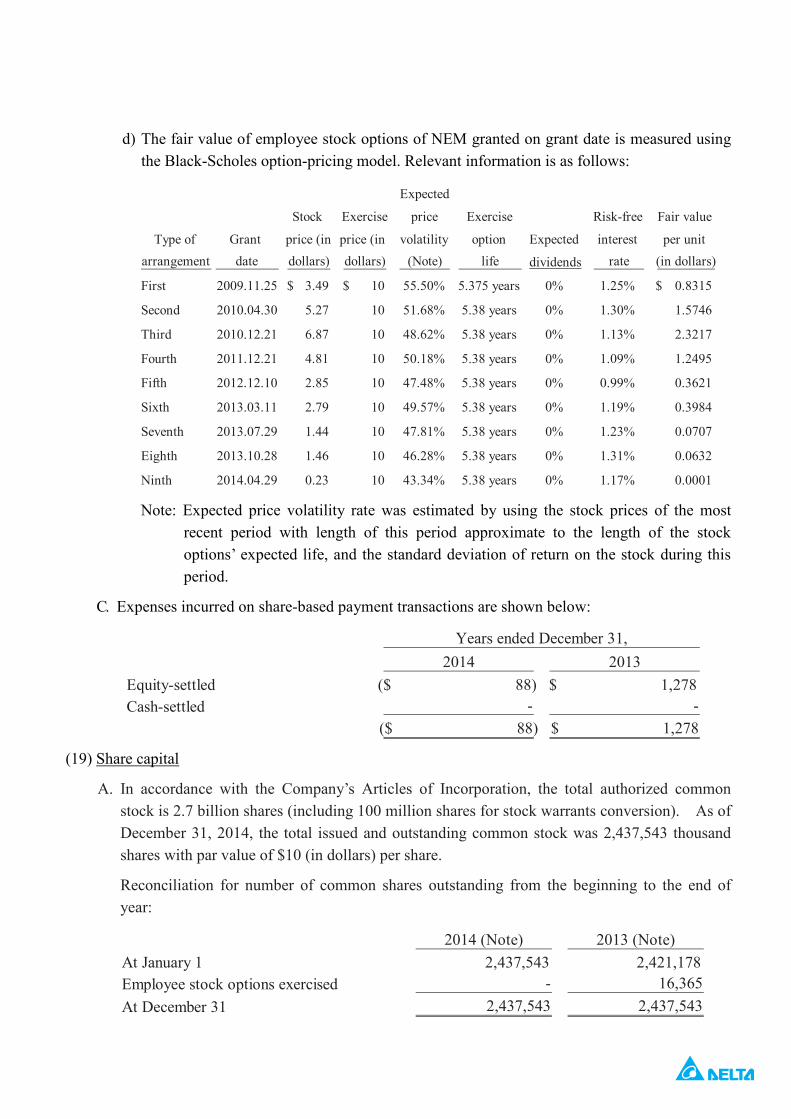
69
d) The fair value of employee stock options of NEM granted on grant date is measured usingthe Black-Scholes option-pricing model. Relevant information is as follows:
Note: Expected price volatility rate was estimated by using the stock prices of the mostrecent period with length of this period approximate to the length of the stockoptions’ expected life, and the standard deviation of return on the stock during thisperiod.
C. Expenses incurred on share-based payment transactions are shown below:
(19) Share capital
A. In accordance with the Company’s Articles of Incorporation, the total authorized commonstock is 2.7 billion shares (including 100 million shares for stock warrants conversion). As ofDecember 31, 2014, the total issued and outstanding common stock was 2,437,543 thousandshares with par value of $10 (in dollars) per share.
Reconciliation for number of common shares outstanding from the beginning to the end ofyear:
Expected
Stock Exercise price Exercise Risk-free Fair value
Type of Grant price (in price (in volatility option Expected interest per unitarrangement date dollars) dollars) (Note) life dividends rate (in dollars)
First 2009.11.25 3.49$ 10$ 55.50% 5.375 years 0% 1.25% 0.8315$
Second 2010.04.30 5.27 10 51.68% 5.38 years 0% 1.30% 1.5746
Third 2010.12.21 6.87 10 48.62% 5.38 years 0% 1.13% 2.3217
Fourth 2011.12.21 4.81 10 50.18% 5.38 years 0% 1.09% 1.2495
Fifth 2012.12.10 2.85 10 47.48% 5.38 years 0% 0.99% 0.3621
Sixth 2013.03.11 2.79 10 49.57% 5.38 years 0% 1.19% 0.3984
Seventh 2013.07.29 1.44 10 47.81% 5.38 years 0% 1.23% 0.0707
Eighth 2013.10.28 1.46 10 46.28% 5.38 years 0% 1.31% 0.0632
Ninth 2014.04.29 0.23 10 43.34% 5.38 years 0% 1.17% 0.0001
2014 2013Equity-settled 88)($ 1,278$Cash-settled - -
88)($ 1,278$
Years ended December 31,
2014 (Note) 2013 (Note)At January 1 2,437,543 2,421,178Employee stock options exercised - 16,365At December 31 2,437,543 2,437,543

77 70
Note: In thousand shares.
B. On December 20, 2004, the Board of Directors of the Company adopted a resolution thatallowed certain stockholders to issue 16 million units of global depository receipts (GDRs),represented by 80 million shares of common stock (Deposited Shares), with one unit of GDRrepresenting 5 shares of common stock. After obtaining approval from SFB, these GDRs werelisted on the Securities Exchange of Luxembourg, with total proceeds of US$134,666 thousand.The issuance of GDRs was represented by outstanding shares, therefore, there is no dilutiveeffect on the common shares’ equity. The main terms and conditions of the GDRs are asfollows:
a. Voting rights
GDR holders may, pursuant to the Depositary Agreement and the relevant laws andregulations of the R.O.C., exercise the voting rights pertaining to the underlying commonshares represented by the GDRs.
b. Redemption of GDRs
For sales and redemption of the underlying common shares represented by the GDRs whenthe holders of the GDRs request the Depositary to redeem the GDRs in accordance with therelevant R.O.C. regulations and the provisions in the Depositary Agreement, the Depositarymay (i) deliver the underlying common shares represented by the GDRs to the GDRholders, or (ii) sell the underlying common shares represented by the GDRs in the R.O.C.stock market on behalf of the GDR holder. The payment of proceeds from such sale shall bemade subject to the relevant R.O.C. laws and regulations and the provisions in theDepositary Agreement.
c. Distribution of dividends, preemptive rights and other rights
Distribution of dividends, preemptive rights and other rights and interests of GDR unitsbear the same rights as common shares.
d. After considering the stock dividend distribution year by year, as of December 31, 2014,there were 1,149 thousand units outstanding, representing 5,745 thousand common sharesof the Company’s common stock.
(20) Capital surplus
Pursuant to the R.O.C. Company Law, capital surplus arising from paid-in capital in excess of parvalue on issuance of common stocks and donations can be used to cover accumulated deficit or toissue new stocks or cash to shareholders in proportion to their share ownership, provided that theCompany has no accumulated deficit. Further, the R.O.C. Securities and Exchange Law requiresthat the amount of capital surplus to be capitalised mentioned above should not exceed 10% of thepaid-in capital each year. Capital surplus should not be used to cover accumulated deficit unlessthe legal reserve is insufficient.

71
(21) Retained earnings
A. Under the Company’s Articles of Incorporation, the current year’s earnings, if any, shall bedistributed in the following order:
a. Payment of all taxes and dues.
b. Offset against prior years' operating losses, if any.
c. Set aside 10% of the remaining amount as legal reserve, unless the accumulated amount ofthe legal reserve has reached the total authorized capital of the Company.
d. Setting aside or reversing a special reserve according to relevant regulations whennecessary.
e. The amount of distributable earnings after deducting items a, b, c and d, plus beginningundistributed earnings (the earnings), shall be distributed in the following percentageaccording to the resolution approved at the stockholders’ meeting:
(a) Directors' remuneration: up to 1% of the earnings.
(b) Employees' bonus: at least 3% of the earnings. The Company can issue the employeestock bonus to qualified employees of subsidiaries. The related regulations should beauthorized by the Company’s Board of Directors or authorized person.
(c) Stockholders' bonus: balance of the earnings after deducting (a) and (b).
B. The Company’s dividend policy is summarized below: as the Company operates in a volatilebusiness environment and is in the stable growth stage, the residual dividend policy is adoptedtaking into consideration the Company’s financial structure, operating results and futureexpansion plans. According to the dividend policy adopted by the Board of Directors, at least50% of the Company’s distributable earnings as of the end of the period shall be appropriatedas dividends, and cash dividends shall account for at least 5% of the total dividends distributed.
C. Except for covering accumulated deficit or issuing new stocks or cash to shareholders inproportion to their share ownership, the legal reserve shall not be used for any other purpose.The use of legal reserve for the issuance of stocks or cash to shareholders in proportion to theirshare ownership is permitted, provided that the distribution of the reserve is limited to theportion in excess of 25% of the Company’s paid-in capital.
D. a) In accordance with the regulations, the Company shall set aside special reserve from the debitbalance on other equity items at the balance sheet date before distributing earnings. Whendebit balance on other equity items is reversed subsequently, the reversed amount could beincluded in the distributable earnings.
b) The amounts previously set aside by the Company as special reserve on initial application ofIFRSs in accordance with Jin-Guan-Zheng-Fa-Zi Letter No. 1010012865, dated April 6,2012, shall be reversed proportionately when the relevant assets are used, disposed of orreclassified subsequently. Such amounts are reversed upon disposal or reclassified if the

7972
assets are investment property of land, and reversed over the use period if the assets areinvestment property other than land.
E. a) The appropriations of 2013 and 2012 earnings had been approved by the shareholders duringtheir meeting on June 10, 2014 and June 7, 2013, respectively. Details are summarized below:
Note A: The shareholders during their meeting had approved to distribute employees’ cashbonuses of $2,492,438 and directors’ and supervisors’ remuneration of $30,400.
Note B: The shareholders during their meeting had approved to distribute employees’ cashbonuses of $2,047,925 and directors’ and supervisors’ remuneration of $30,400.
There was no difference in the amounts of the earnings appropriation as approved by thestockholders with that proposed by the Board of Directors. The information is posted in the“Market Observation Post System” at the website of the Taiwan Stock Exchange.
b) The appropriations of 2014 earnings had been proposed by the Board of Directors on March10, 2015. Details are summarized below:
Note: The Board of Directors proposed to distribute employees’ cash bonuses of $2,893,928and directors’ and supervisors’ remuneration of $32,900.
As of March 10, 2015, the abovementioned 2014 earnings appropriation had not beenapproved by the stockholders.
F. For the years ended December 31, 2014 and 2013, employees’ bonus were accrued at$3,758,478 and $3,333,446, respectively, and directors’ and supervisors’ remuneration wereaccrued at $30,854 and $32,182, respectively. The basis of estimates is based on a certainpercentage of net income prescribed by the Company’s Articles of Incorporation and resolved
Dividends DividendsAmount per share Amount per share(Note A) (in dollars) (Note B) (in dollars)
Appropriation for legal 1,777,620$ 1,610,954$reserve
(Reversal of) appropriation 3,546,949)( 1,918,413for special reserve
Cash dividends 14,137,751 5.8$ 12,843,222 5.29101501$
2013 2012Years ended December 31,
Amount Dividends per share(Note) (in dollars)
Appropriation for legal reserve 2,069,890$Appropriation for special reserve 527,556Cash dividends 14,625,260 6$
2014

73
by the Board of Directors, after taking into account the legal reserve and other factors. Thecalculation of shares of stock bonus distributed is based on the closing price of the Company’scommon stock at the previous day of the next stockholders’ meeting after taking into accountthe effects of ex-rights and ex-dividends. While, if the estimated amounts are different from theamounts approved during the stockholders’ meeting subsequently, the difference is recognizedas gain or loss in the following year. However, if the accrued amounts for employees’ bonusand directors’ and supervisors’ remuneration are significantly different from the distributedamounts resolved by the Board of Directors, then the differences shall be adjusted retroactivelyin the statement of comprehensive income for the current year. The proposed amounts of thebonus to employees and directors’ and supervisors’ remuneration were consistent with theresolution during the stockholders’ meeting and the same amount had been charged againstearnings for 2013.
(22) Non-controlling interest
Because the Group’s certain subsidiaries have traded with non-controlling interest, havedistributed cash dividends and were affected by the consolidated entity’s movement for the yearsended December 31, 2014 and 2013, the non-controlling interest decreased by $2,956,340 and$3,607,352 for the years ended December 31, 2014 and 2013, respectively.
(23) Operating revenue
2014 2013At January 1 14,238,038$ 15,966,356$Share attributable to non-controlling
interest:Profit for the period 1,614,471 1,258,194Currency translation differences 142,008)( 621,136Unrealised gain on valuation of
available-for-sale financial assets 4 11Loss on hedges belonging to effective
hedging in cash flow hedge - 307)(Decrease in non-controlling interest 2,956,340)( 3,607,352)(
At December 31 12,754,165$ 14,238,038$
Years ended December 31,
2014 2013Sales revenue 188,437,064$ 176,302,888$Service revenue 1,063,348 1,305,968Other operating revenue 1,134,708 663,803
190,635,120 178,272,659Less: Operating revenue from discontinued
operations - 1,219,537)(190,635,120$ 177,053,122$
Years ended December 31,

81
74
(24) Operating cost
(25) Other income
(26) Other gains and losses
2014 2013Cost of sales 137,597,768$ 132,077,331$Cost of services 720,332 971,486Other operating costs 882,482 635,040
139,200,582 133,683,857Less: Operating costs from discontinued
operations - 1,650,665)(139,200,582$ 132,033,192$
Years ended December 31,
2014 2013Interest income 949,336$ 724,410$Rental income 330,879 188,506Dividend income 141,714 140,180Others 1,957,094 2,031,330
3,379,023 3,084,426Less: Other income from discontinued
operations - 48,285)(3,379,023$ 3,036,141$
Years ended December 31,
2014 2013(Loss) gain on financial assets (liabilities)
at fair value through profit or loss61,827)($ 56,480$
Net currency exchange gain 266,881 210,444Gain (loss) on disposal of investments 57,117 400,298)(Loss on disposal of property, plant
and equipment 11,725)( 9,303)(Impairment loss 83,220)( 74,153)(Miscellaneous disbursements 664,233)( 537,403)(
497,007)( 754,233)(Less: Other gain and loss from
discontinued operations - 1,435497,007)($ 752,798)($
Years ended December 31,

75
(27) Finance costs
(28) Expenses by nature
(29) Employee benefit expense
2014 2013Interest expense 162,480$ 242,701$Loss (gain) on effective cash flow hedges
reclassified from equity to profit or loss 1,555 28,260)(164,035 214,441
Less: Finance costs from discontinuedoperations - 38,482)(
164,035$ 175,959$
Years ended December 31,
2014 2013Changes in inventories of finished goodsand work in process, raw materials andconsumables used 99,746,574$ 97,875,265$
Employee benefit expense 32,814,321 29,365,601Depreciation charges on property, plant
and equipment 6,464,508 7,123,284Amortisation charges on intangible assets 1,022,608 1,114,557Transportation expenses 1,807,614 1,705,979Advertising costs 777,141 966,585Operating lease payments 326,448 318,336Other expenses 24,859,018 21,005,423Total cost of sales and operating expenses 167,818,232 159,475,030Less: Cost of sales and operating expenses
from discontinued operations - 1,930,290)(167,818,232$ 157,544,740$
Years ended December 31,
2014 2013Wages and salaries 24,791,319$ 22,536,768$Employees' bonuses 3,749,479 3,344,004Labor and health insurance fees 2,602,120 2,099,103Pensions costs 489,512 468,550Other personnel expenses 1,181,891 917,176
32,814,321$ 29,365,601$
Years ended December 31,

8376
(30) Income taxA. Income tax expense
a) Components of income tax expense:
b) The income tax (charge)/credit relating to components of other comprehensive income is as
follows:
2014 2013Current tax:Current tax on profits for the year 3,663,253$ 2,927,085$Adjustments in respect of prior years 348,084)( 263,072)(Total current tax 3,315,169 2,664,013Deferred tax:Origination and reversal of temporary
differences 912,994 933,500Origination and reversal of loss
carryforward 26,677)( 2,557)(Total deferred tax 886,317 930,943Income tax expense 4,201,486$ 3,594,956$Less: Income tax expense on
discontinued operations - 13,170)(4,201,486$ 3,581,786$
Years ended December 31,
2014 2013Fair value gain on available-for-sale
financial assets 9$ 3,142)($Currency translation differences 498,277 268,720Cash flow hedges 889 7,451)(
499,175$ 258,127$
Years ended December 31,

77
B. Reconciliation between income tax expense and accounting profit
2014 2013Tax calculated based on profit before
tax and statutory tax rate7,067,495$ 6,435,610$
Effects from items disallowed by taxregulation 1,751,709)( 2,289,852)(
Effect from investment tax credits 745,592)( 307,942)(Effect from net operating loss
carryforward 20,624)( 20,212Prior year income tax overestimate 348,084)( 263,072)(Income tax expense 4,201,486 3,594,956Less: Income tax expense from
discontinued operations - 13,170)(4,201,486$ 3,581,786$
Years ended December 31,

85
78
C.A
mou
ntso
fdef
erre
dta
xas
sets
orlia
bilit
iesa
sare
sult
ofte
mpo
rary
diffe
renc
es,l
ossc
arry
forw
ard
and
inve
stmen
ttax
cred
itsar
easf
ollo
ws:
Reco
gnise
din
othe
rRe
cogn
ised
inco
mpr
ehen
sive
Reco
gnise
din
Janu
ary
1pr
ofit
orlo
ssin
com
eeq
uity
Dec
embe
r31
Tem
pora
rydi
ffere
nces
:-
Def
erre
dta
xas
sets:
Allo
wan
cefo
rinv
ento
ryob
soles
cenc
e15
6,18
9$
41,8
63$
-$
-$
198,
052
$In
vestm
ents
tax
cred
its23
,497
354,
647
--
378,
144
Pens
ion
liabi
lity
731,
109
232,
040)
(-
-49
9,06
9A
sset
sim
pairm
ent
45,8
8318
9,64
8-
-23
5,53
1N
etop
erat
ing
loss
carry
forw
ard
3,98
626
,677
--
30,6
63D
epre
ciatio
ndi
ffere
nce
betw
een
tax
and
finan
cialb
asis
1,18
3,30
628
3,34
6-
-1,
466,
652
Oth
ers
1,14
4,21
933
1,76
6-
-1,
475,
985
Subt
otal
3,28
8,18
999
5,90
7-
-4,
284,
096
-D
efer
red
tax
liabi
lities
:Lo
ng-te
rmeq
uity
inve
stmen
ts5,
972,
059)
($1,
868,
569)
($49
9,17
5)($
-$
8,33
9,80
3)($
Land
reva
luat
ion
incr
emen
ttax
119,
862)
(-
--
119,
862)
(O
ther
s1,
339,
892)
(13
,655
)(
--
1,35
3,54
7)(
Subt
otal
7,43
1,81
3)(
1,88
2,22
4)(
499,
175)
(-
9,81
3,21
2)(
Tota
l4,
143,
624)
($88
6,31
7)($
499,
175)
($-
$5,
529,
116)
($
Yea
rend
edD
ecem
ber3
1,20
14
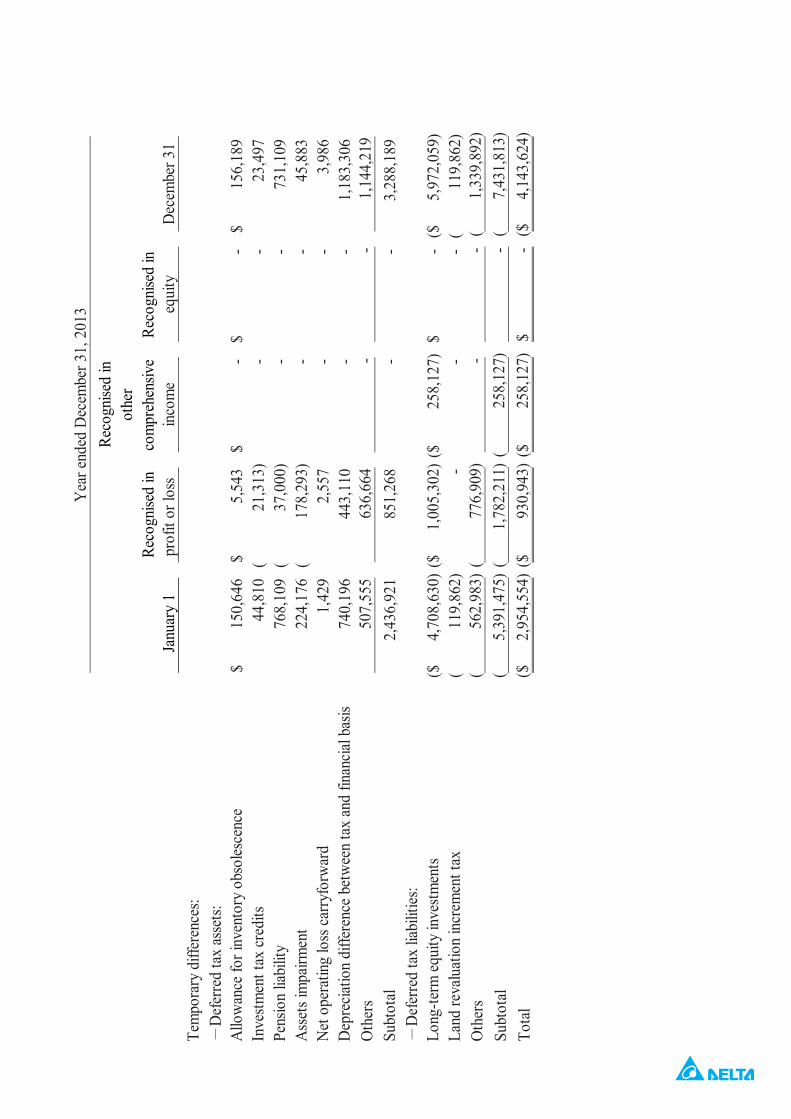
79
Reco
gnise
din
othe
rRe
cogn
ised
inco
mpr
ehen
sive
Reco
gnise
din
Janu
ary
1pr
ofit
orlo
ssin
com
eeq
uity
Dec
embe
r31
Tem
pora
rydi
ffere
nces
:-
Def
erre
dta
xas
sets:
Allo
wan
cefo
rinv
ento
ryob
soles
cenc
e15
0,64
6$
5,54
3$
-$
-$
156,
189
$In
vestm
entt
axcr
edits
44,8
1021
,313
)(
--
23,4
97Pe
nsio
nlia
bilit
y76
8,10
937
,000
)(
--
731,
109
Asse
tsim
pairm
ent
224,
176
178,
293)
(-
-45
,883
Net
oper
atin
glo
ssca
rryfo
rwar
d1,
429
2,55
7-
-3,
986
Dep
recia
tion
diffe
renc
ebe
twee
nta
xan
dfin
ancia
lbas
is74
0,19
644
3,11
0-
-1,
183,
306
Oth
ers
507,
555
636,
664
--
1,14
4,21
9Su
btot
al2,
436,
921
851,
268
--
3,28
8,18
9-
Def
erre
dta
xlia
bilit
ies:
Long
-term
equi
tyin
vestm
ents
4,70
8,63
0)($
1,00
5,30
2)($
258,
127)
($-
$5,
972,
059)
($La
ndre
valu
atio
nin
crem
entt
ax11
9,86
2)(
--
-11
9,86
2)(
Oth
ers
562,
983)
(77
6,90
9)(
--
1,33
9,89
2)(
Subt
otal
5,39
1,47
5)(
1,78
2,21
1)(
258,
127)
(-
7,43
1,81
3)(
Tota
l2,
954,
554)
($93
0,94
3)($
258,
127)
($-
$4,
143,
624)
($
Yea
rend
edD
ecem
ber3
1,20
13

87 80
D. According to Act for Industrial Innovation and Statute for Upgrading Industries (before its
abolishment), details of the Company’s investments tax credits and unrecognized deferred tax
assets are as follows:
E. Expiration dates of unused net operating loss carryfoward and amounts of unrecognized
deferred tax assets are as follows:
F. The amounts of deductible temporary differences that were not recognised as deferred tax
assets are as follows:
Unrecognised Tax credit ofdeferred investment
Qualifying items Unused tax credits tax assets usable untilInvestments in emerging
important strategicindustries 378,144$ -$ 2016
Unrecognised Tax credit ofdeferred investment
Qualifying items Unused tax credits tax assets usable untilMachinery and equipment 1,141$ 281$ 2014Employees' training 109 109 2013Investments in emerging
important strategicindustries 408,072 385,435 2016
409,322$ 385,825$
December 31, 2014
December 31, 2013
UnrecognisedAmount filed / Unused deferred Usable
Year incurred assessed amount tax assets until year2007-2014 8,305,131$ 8,222,491$ 8,099,839$ 2024
UnrecognisedAmount filed / Unused deferred Usable
Year incurred assessed amount tax assets until year2007-2013 8,028,877$ 7,998,841$ 7,981,567$ 2023
December 31, 2014
December 31, 2013
2014 2013Deductible temporary differences 440,537$ 417,427$
December 31,

81
G. The Company has not recognised taxable temporary differences associated with investment in
subsidiaries as deferred tax liabilities. As of December 31, 2014 and 2013, the amounts of
temporary differences unrecognised as deferred tax liabilities were $153,223,544 and
$143,317,539, respectively.
H. The status of the Company and its domestic subsidiaries’ assessed and approved income tax
returns are as follows:
I. Unappropriated retained earnings:
J. The balance of the imputation tax credit account and the creditable tax rate are as follows:
Latest year assessed by Tax AuthorityThe Company 2012
Cyntec and DNIT 2011Delta Capital, NEM, AMT, DelBio,
Ayecom, Delta Robot and DGL 2012DSGL 2014SYN-TKE Not assessed yet
December 31, 2014 December 31, 2013Earnings generated in
and before 1997 685,952$ 685,952$Earnings generated in
and after 1998 32,859,866 24,526,37633,545,818$ 25,212,328$
December 31, 2014 December 31, 2013Imputation tax credit
account balance 872,035$ 1,074,283$
2014 (Estimated) 2013 (Actual)Creditable tax ratio 2.65% 2.80%

89 82
(31) Earnings per share
(Note) The share-based payment arrangements were all expired on December 17, 2013. There is noeffect on diluted earnings per share for the year ended December 31, 2014.
Weighted averagenumber of
ordinary shares EarningsAmount outstanding per shareafter tax (shares in thousands) (in dollars)
Basic earnings per shareProfit attributable to ordinary shareholders
of the parent 20,698,900$ 2,437,543 8.49$
Diluted earnings per shareProfit attributable to ordinary shareholders 20,698,900$ 2,437,543
of the parentAssumed conversion of all dilutive
potential ordinary shares (Note):Employees' bonus - 21,681
Profit attributable to ordinaryshareholders of the parent plusassumed conversion of all dilutivepotential ordinary shares 20,698,900$ 2,459,224 8.42$
Year ended December 31, 2014

83
Weighted averagenumber of
ordinary shares EarningsAmount outstanding per shareafter tax (shares in thousands) (in dollars)
Basic earnings per shareProfit from continuing operations
attributable to ordinary shareholders ofthe parent
17,244,431$ 2,427,935 7.10$
Gain from discontinued operationsattributable to ordinary shareholders ofthe parent 531,771 2,427,935 0.22
Profit attributable to ordinaryshareholders of the parent 17,776,202$ 2,427,935 7.32$
Diluted earnings per shareProfit from continuing operations
attributable to ordinary shareholders ofthe parent 17,244,431$ 2,427,935
Assumed conversion of all dilutivepotential ordinary shares:Employees' stock option - 4,612Employees' bonus - 23,763
Profit from continuing operationsattributable to ordinary shareholders ofthe parent plus assumed conversion ofall dilutive potential ordinary shares 17,244,431 2,456,310 7.02$
Profit from discontinued operationsattributable to ordinary shareholders ofthe parent 531,771 2,456,310 0.22
Profit attributable to ordinaryshareholders of the parent plusassumed conversion of all dilutivepotential ordinary shares 17,776,202$ 2,456,310 7.24$
Year ended December 31, 2013

91 84
(32) Business combinations
A. Business combination transactions of the Group for the years ended December 31, 2014 and2013 are as follows:
(a) On January 3, 2013, the Group acquired 100% stock ownership of Vivitek by cash totaling$43,560 through DIH and obtained control over Vivitek, an overhead projector and relatedproducts and materials retailer operating in the US. As a result of the acquisition, the Groupexpected to increase its presence in these markets. It also expects to reduce costs througheconomies of scale.
(b) The Group has acquired 54.83% share ownership in DGSG from the associate, DET,through DIH on April 1, 2013 for cash of $447,375, and has gained control over DGSG.The Group expects to increase profit in Mainland China market after the acquisition.
(c) The Group established its subsidiary STA in 2013 and has signed assets transactionagreement with SYN-TEK Technologies Inc. (hereinafter referred to as SYN-TEK) topurchase inventory, equipment, software, and ownership and obligations of other existingclients. Thereafter, the Group expects to improve its competitiveness on related products ofindustrial automation.
(d)On April 8, 2014, the Company acquired 100% share ownership in Vivitek-TW for cash of$135,083.
(e) On August 1, 2014, the Group acquired 100% share ownership in DEU from the Group’sassociate, DET, for cash of $111,337.
(f) On September 1, 2014, the Group acquired 100% share ownership in Boom through DIHfor cash of $2,652,858.
B. Consideration paid for acquisitions of the abovementioned subsidiaries and fair valueinformation of assets acquired and liabilities assumed from the acquisitions on the acquisitiondate are as follows:

85
C. Starting from the acquisition of share ownership of Vivitek-TW, DEU and Boom, the operatingrevenue and profit (loss) before tax included in the consolidated statements of comprehensiveincome and contributed by those companies amounted to $191,901 and ($138,735),respectively. Had those companies been consolidated from January 1, 2013, the consolidatedstatement of comprehensive income would show operating revenue and profit before incometax as follows:
2014 2013Purchase consideration
Cash paid 2,899,278$ 640,935$Fair value of the non-controlling interest - 363,282
2,899,278 1,004,217Fair value of the identifiable assets
acquired and liabilities assumedCash 253,063 35,092Accounts receivable 76 85,466Accounts receivable - related parties 10,235 -Other current assets 6,226 2,404Inventories - 75,851Dividends receivable 126,591 -Investments accounted for using equity
method 1,317,347 399,930Property, plant and equipment 5,542 8,161Customer relationship 1,251,533 -Goodwill - 6,287Other non-current assets 197 548,495Bank borrowings - 49,441)(Accounts payable 1,264)( 57,130)(Accounts payable - related parties 1,082)( -Income tax payable 6,334)( -Other current liabilities 23,335)( 24,362)(Other non-current liabilities - 18,865)(Deferred income tax liabilities 42,793)( -Total identifiable net assets 2,896,002 1,011,888
Goodwill (gain recognized in bargainpurchase transaction ) 3,276$ 7,671)($
Years ended December 31,
2014 2013Operating revenue 190,697,230$ 177,259,653$Profit before income tax 26,518,104 22,657,541
Years ended December 31,

93 86
7. RELATED PARTY TRANSACTIONS
(1) Significant transactions and balances with related parties
A. Sales of goods
The sales terms, including prices and collections, were negotiated based on cost, market,competitors and other factors.
B. Purchases of goods:
The purchase terms, including prices and payments, were negotiated based on cost, market,competitors and other factors.
C. Period-end balances arising from sales of goods:
The receivables from related parties arise mainly from sales transactions. The receivables aredue 60~90 days after the date of sale. The receivables are unsecured in nature and bear nointerest. There are no provisions held against receivables from related parties.
D. Period-end balances arising from purchases of goods:
2014 2013Sales of goods:Associates 3,919,209$ 3,793,085$Others 1,023,383 1,220,921
4,942,592$ 5,014,006$
Years ended December 31,
2014 2013Purchases of goods:Associates 667,260$ 830,559$Others 56,825 49,784
724,085$ 880,343$
Years ended December 31,
December 31, 2014 December 31, 2013Receivables from related
parties:Associates 985,685$ 898,335$Others 274,417 184,993
1,260,102$ 1,083,328$
December 31, 2014 December 31, 2013
Associates 225,241$ 178,224$Others 19,572 8,864
244,813$ 187,088$
Payables to related parties:

87
The payables to related parties arise mainly from purchase transactions and are due 70 daysafter the date of purchase. The payables bear no interest.
E. Period-end balances arising from other transactions:
The above pertain mainly to advance payments.
F. Property transactions:
(a) The Group has separately acquired 45.17% and 54.83% share ownership of DGSG for$393,351 and $450,000 from an associate in 2014 and 2013, respectively. The relatedcosts have been fully paid as of December 31, 2014.
(b) The Group acquired 100% share ownership of DEU for $109,434 from an associate in2014. The related costs have been fully paid as of December 31, 2014.
(c) The Group has increased its investment in the associate – DPI by $106,523 during 2014,and the shareholding ratio was 41% after the capital increase.
(2) Key management compensation
8. PLEDGED ASSETS
The Group’s assets pledged as collateral are as follows:
December 31, 2014 December 31, 2013Other receivables-related
partiesAssociates 40,790$ 153,190$Others 2,717 4,380
43,507$ 157,570$
2014 2013Salaries and other short-term employee
benefits 529,412$ 432,759$
Years ended December 31,
December 31, December 31,Pledged assets 2014 2013 Pledge purpose
Demand deposits and timedeposits (shown as otherassets - current andnon-current)
3,000$ 4,021$ Collateral for customsduties
Time deposits(shown as other current assets) 160,769 52,754
Performance bondsand land lease
163,769$ 56,775$
Book value

9588
9. SIGNIFICANT CONTINGENT LIABILITIES AND UNRECOGNISED CONTRACTCOMMITMENTS
(1) Contingencies
None.
(2) Commitments
A. Capital commitments
Capital expenditures contracted for at the balance sheet date but not yet incurred are as follows:
B. Operating lease commitments
The future aggregate minimum lease payments under non-cancellable operating leases are asfollows:
10. SIGNIFICANT DISASTER LOSS
None.
11. SIGNIFICANT EVENTS AFTER THE BALANCE SHEET DATE
(1) The Group acquired 100% of share capital of Vitor Technology Inc. for cash of $79,575 onJanuary 1, 2015. As of March 10, 2015, $70,075 had been paid.
(2) In order to integrate overall resources, expand operations and improve operating performance andcompetitiveness, on November 24, 2014, the Board of Directors of Delta Networks, Inc. and itswholly-owned investee – Ayecom Technology Co., Ltd. both agreed on the merger. AyecomTechnology Co., Ltd. was merged into Delta Networks, Inc. and was dissolved after the merger.The surviving company was Delta Networks, Inc. The effective date had been proposed to beJanuary 1, 2015.
(3) The Company’s wholly-owned subsidiary – DEN participated in the bid for share capital of EltekASA (Norway) and won the bid on December 15, 2014. The period for public tender offer is fromJanuary 12, 2015 to February 10, 2015. DEN acquired 100% share capital of Eltek ASA (Norway)at NOK$11.75 per share, and the total transaction amount was estimated to be approximatelyNOK$38.7 billion As of the expiration of the public tender offer period, the share capital of EltekASA (Norway) which participated in the bid has reached 94.2598%.
December 31, 2014 December 31, 2013Property, plant and equipment 571,260$ 466,857$
December 31, 2014 December 31, 2013Not later than one year 107,460$ 80,035$Later than one year but not 178,419 156,240later than five years
Later than five years 102,221 22,672388,100$ 258,947$

89
12. OTHERS
(1) Capital risk management
The Group’s objectives (including disposal groups held for sale) when managing capital are tomaintain an integrity credit rating and good capital structure to support operating and maximumstockholders’ equity.
(2) Financial instruments
A. Fair value information of financial instruments
The fair value of financial instruments measured at amortized cost (including notes receivable,accounts receivable (including related parties), other receivables (including related parties),short-term loans, notes payable, accounts payable (including related parties) and otherpayables) are based on their book value as book value is approximate to fair value. The fairvalue of long-term loans (including current portion) is based on book value as their interestrate is approximate to market interest rate. The fair value information of financial instrumentsmeasured at fair value is provided in Note 12(3).
B. Financial risk management policies
The Group’s activities expose it to a variety of financial risks: market risk (including foreignexchange risk, interest rate risk and price risk), credit risk and liquidity risk. The Group’soverall risk management programme focuses on the unpredictability of financial markets andseeks to minimise potential adverse effects on the Group’s financial position and financialperformance. The Group uses derivative financial instruments to hedge certain risk exposures(see Notes 6(2), 6(5) and 6(15)).

97
90
C. Significant financial risks and degrees of financial risks
a) Market risk
Foreign exchange risk
i. The Group operates internationally and is exposed to foreign exchange risk arising fromvarious currency exposures, primarily with respect to the USD, RMB and EUR.Foreign exchange risk arises from future commercial transactions, recognised assets andliabilities and net investments in foreign operations.
ii. Management has set up a policy to require group companies to manage their foreignexchange risk against their functional currency. The group companies are required tohedge their entire foreign exchange risk exposure with the Group treasury. To managetheir foreign exchange risk arising from future commercial transactions and recognisedassets and liabilities, entities in the Group use forward foreign exchange contracts,transacted with Group treasury.
iii. The Group adopts the derivative financial instruments like forward exchange contracts /forward exchange transactions, etc. to hedge the fair value risk and cash flow risk due toforeign exchange rate fluctuations. The Group monitors at any time and pre-sets a “stoploss” amount to limit its foreign exchange risk.
iv. The Group’s businesses involve some non-functional currency operations (theCompany’s and certain subsidiaries’ functional currency: NTD; other certain subsidiaries’functional currency: USD and RMB). The information on assets and liabilitiesdenominated in foreign currencies whose values would be materially affected by theexchange rate fluctuations is as follows:
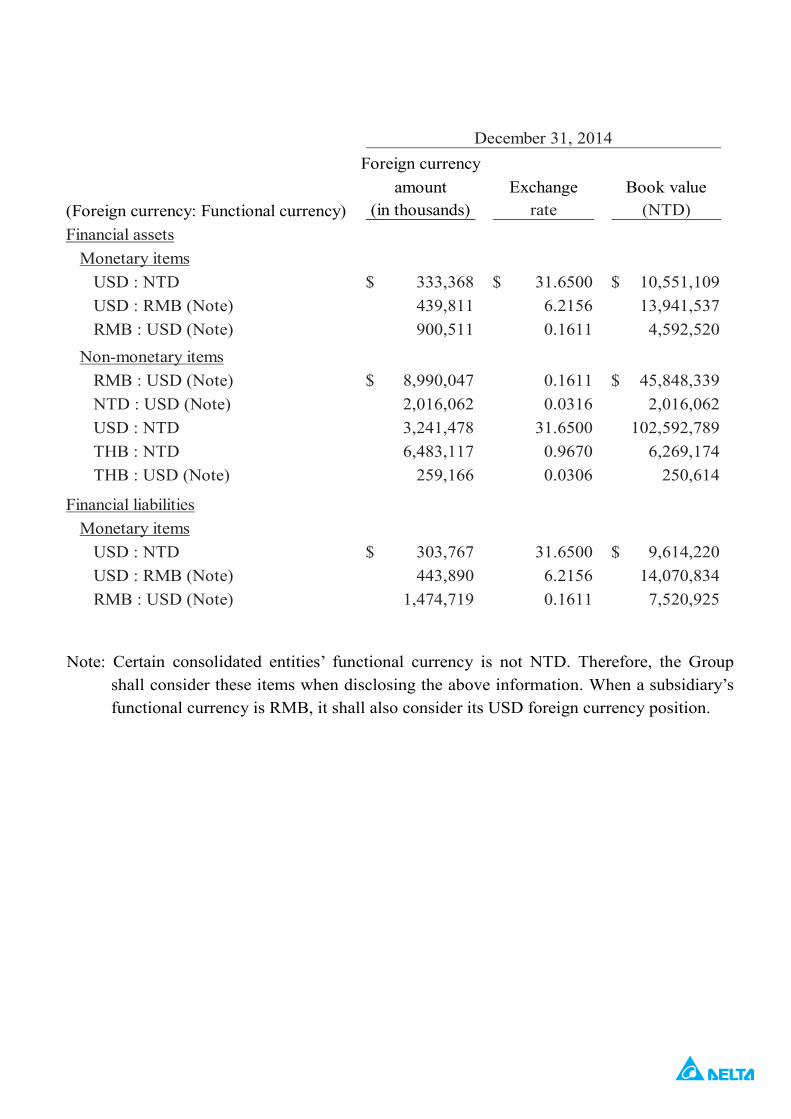
91
Note: Certain consolidated entities’ functional currency is not NTD. Therefore, the Groupshall consider these items when disclosing the above information. When a subsidiary’sfunctional currency is RMB, it shall also consider its USD foreign currency position.
Foreign currencyamount Exchange Book value
(Foreign currency: Functional currency) (in thousands) rate (NTD)Financial assets
Monetary itemsUSD : NTD 333,368$ 31.6500$ 10,551,109$USD : RMB (Note) 439,811 6.2156 13,941,537RMB : USD (Note) 900,511 0.1611 4,592,520
Non-monetary itemsRMB : USD (Note) 8,990,047$ 0.1611 45,848,339$NTD : USD (Note) 2,016,062 0.0316 2,016,062USD : NTD 3,241,478 31.6500 102,592,789THB : NTD 6,483,117 0.9670 6,269,174THB : USD (Note) 259,166 0.0306 250,614
Financial liabilitiesMonetary items
USD : NTD 303,767$ 31.6500 9,614,220$USD : RMB (Note) 443,890 6.2156 14,070,834RMB : USD (Note) 1,474,719 0.1611 7,520,925
December 31, 2014

99 92
Note: Certain consolidated entities’ functional currency is not NTD. Therefore, the Groupshall consider these items when disclosing the above information. When a subsidiary’sfunctional currency is RMB, it shall also consider its USD foreign currency position.
Foreign currencyamount Exchange Book value
(Foreign currency: Functional currency) (in thousands) rate (NTD)Financial assets
Monetary itemsUSD : NTD 361,992$ 29.8050$ 10,789,174$USD : RMB (Note) 507,266 6.0520 15,119,066RMB : USD (Note) 1,318,179 0.1652 6,491,769
Non-monetary itemsRMB : USD (Note) 6,935,119$ 0.1652$ 34,154,074$NTD : USD (Note) 1,811,490 0.0336 1,811,490USD : NTD 2,850,254 29.8050 84,951,812THB : NTD 5,548,147 0.9135 5,342,282THB : USD (Note) 776,215 0.0306 709,073
Financial liabilitiesMonetary items
USD : NTD 339,002$ 29.8050$ 10,103,950$USD : JPY (Note) 23,776 104.9800 708,645USD : RMB (Note) 553,164 6.0520 16,487,063RMB : USD (Note) 1,133,961 0.1652 5,584,532
December 31, 2013
(Foreign currency: Extent of Effect on Effect onFunctional currency) variation profit or loss comprehensive incomeFinancial assets
Monetary itemsUSD : NTD 1% 105,511$ -$USD : RMB (Note) 1% 139,415 -RMB : USD (Note) 1% 45,925 -
Financial liabilitiesMonetary items
USD : NTD 1% 96,142$ -$USD : RMB (Note) 1% 140,708 -RMB : USD (Note) 1% 75,209 -
Year ended December 31, 2014Sensitivity analysis
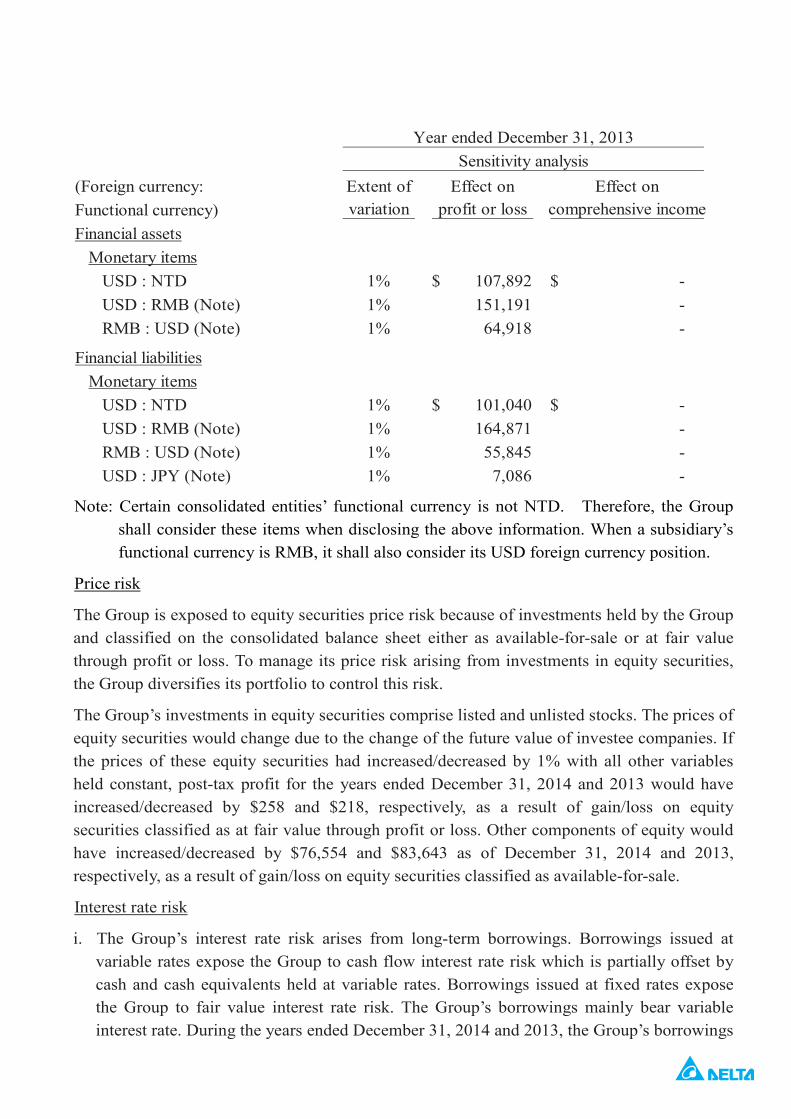
93
Note: Certain consolidated entities’ functional currency is not NTD. Therefore, the Groupshall consider these items when disclosing the above information. When a subsidiary’sfunctional currency is RMB, it shall also consider its USD foreign currency position.
Price risk
The Group is exposed to equity securities price risk because of investments held by the Groupand classified on the consolidated balance sheet either as available-for-sale or at fair valuethrough profit or loss. To manage its price risk arising from investments in equity securities,the Group diversifies its portfolio to control this risk.
The Group’s investments in equity securities comprise listed and unlisted stocks. The prices ofequity securities would change due to the change of the future value of investee companies. Ifthe prices of these equity securities had increased/decreased by 1% with all other variablesheld constant, post-tax profit for the years ended December 31, 2014 and 2013 would haveincreased/decreased by $258 and $218, respectively, as a result of gain/loss on equitysecurities classified as at fair value through profit or loss. Other components of equity wouldhave increased/decreased by $76,554 and $83,643 as of December 31, 2014 and 2013,respectively, as a result of gain/loss on equity securities classified as available-for-sale.
Interest rate risk
i. The Group’s interest rate risk arises from long-term borrowings. Borrowings issued atvariable rates expose the Group to cash flow interest rate risk which is partially offset bycash and cash equivalents held at variable rates. Borrowings issued at fixed rates exposethe Group to fair value interest rate risk. The Group’s borrowings mainly bear variableinterest rate. During the years ended December 31, 2014 and 2013, the Group’s borrowings
(Foreign currency: Extent of Effect on Effect onFunctional currency) variation profit or loss comprehensive incomeFinancial assets
Monetary itemsUSD : NTD 1% 107,892$ -$USD : RMB (Note) 1% 151,191 -RMB : USD (Note) 1% 64,918 -
Financial liabilitiesMonetary items
USD : NTD 1% 101,040$ -$USD : RMB (Note) 1% 164,871 -RMB : USD (Note) 1% 55,845 -USD : JPY (Note) 1% 7,086 -
Year ended December 31, 2013Sensitivity analysis

101
94
at variable rate were denominated in NTD and USD.
ii. If the interest rate increases by 0.25%, and all other conditions are the same, the impact onpost-tax profit would decrease by $68,000 and $49,333 for the years ended December 31,2014 and 2013, respectively, resulting from the variable rate borrowings.
b) Credit risk
i. Credit risk refers to the risk of financial loss to the Group arising from default by theclients or counterparties of financial instruments on the contract obligations as describedbelow:
a. According to the Group’s credit policy, each local entity in the Group is responsible formanaging and analysing the credit risk for each of their new clients before standardpayment and delivery terms and conditions are offered. Internal risk control assessesthe credit quality of the customers, taking into account their financial position, pastexperience and other factors.
b. Individual risk limits are set based on internal or external ratings in accordance withlimits set by the credit controller. The utilisation of credit limits is regularly monitored.
c. For banks and financial institutions, only well rated parties are accepted.
d. Credit risk arises from cash and cash equivalents, derivative financial instruments anddeposits with banks and financial institutions, as well as credit exposures to wholesaleand retail customers, including outstanding receivables and committed transactions.
ii. The management does not expect any significant losses from non-performance by thesecounterparties.
iii. The credit quality information of significant financial assets that are neither past due norimpaired is described in Note 6(6).
c) Liquidity risk
i. Cash flow forecasting is performed in the operating entities of the Group and aggregatedby Group treasury. Group treasury monitors rolling forecasts of the Group’s liquidityrequirements to ensure it has sufficient cash to meet operational needs.
ii. The table below analyses the Group’s (including non-current disposal group classified asheld for sale) non-derivative financial liabilities and net-settled or gross-settled derivativefinancial liabilities into relevant maturity groupings based on the remaining period at thebalance sheet date to the contractual maturity date for non-derivative financial liabilitiesand to the expected maturity date for derivative financial liabilities:

95
Derivative financial liabilities:
As of December 31, 2014 and 2013, the derivative financial liabilities which were operatedby the Group are due within 1 year.
iii. The Group does not expect the timing of occurrence of the cash flows estimated through thematurity date analysis will be significantly earlier, nor expect the actual cash flow amountwill be significantly different.
(3) Fair value estimation
A. The table below analyses financial instruments measured at fair value, by valuation method.The different levels have been defined as follows:
Level 1: Quoted prices (unadjusted) in active markets for identical assets or liabilities.
Level 2: Inputs other than quoted prices included within level 1 that are observable for the assetor liability, either directly (that is, as prices) or indirectly (that is, derived from prices).
Level 3: Inputs for the asset or liability that are not based on observable market data.
The following table presents the Group’s financial assets and liabilities (including non-currentdisposal group classified as held for sale) that are measured at fair value at December 31, 2014and 2013.
Less than Between 1 Between 2 OverDecember 31, 2014 1 year and 2 years and 5 years 5 years
Short-term borrowings 5,801,298$ -$ -$ -$Notes and accounts payable
(including related parties) 33,748,983 - - -Other payables 19,221,347 - - -Long-term borrowings(including current portion) 52,111 26,456,375 11,728 -
Non-derivative financial liabilities:
Less than Between 1 Between 2 OverDecember 31, 2013 1 year and 2 years and 5 years 5 years
Short-term borrowings 4,561,722$ -$ -$ -$Notes and accounts payable
(including related parties) 32,816,423 - - -Other payables 17,533,426 - - -Long-term borrowings(including current portion) 80,379 18,749,638 78,026 -

10396
B. The fair value of financial instruments traded in active markets is based on quoted marketprices at the balance sheet date. A market is regarded as active if quoted prices are readily andregularly available from an exchange, dealer, broker, industry group, pricing service, or
December 31, 2014 Level 1 Level 2 Level 3 TotalFinancial assets:Financial assets at fair value
through profit or lossEquity securities 25,774$ -$ -$ 25,774$Forward exchange contracts - 8,047 - 8,047Convertible bonds 5,805 115,924 - 121,729
Available-for-sale financialassetsEquity securities 6,373,236 - 1,282,187 7,655,423
6,404,815$ 123,971$ 1,282,187$ 7,810,973$Financial liabilities:Financial liabilities at fair
value through profit or lossForward exchange contracts -$ 51,606$ -$ 51,606$
December 31, 2013 Level 1 Level 2 Level 3 TotalFinancial assets:Financial assets at fair value
through profit or lossEquity securities 21,782$ -$ -$ 21,782$Forward exchange contracts - 40,987 - 40,987Convertible bonds 19,980 109,810 - 129,790
Derivative financial assetsfor hedging - 13,340 - 13,340
Available-for-sale financialassetsEquity securities 7,255,613 - 1,108,688 8,364,301
7,297,375$ 164,137$ 1,108,688$ 8,570,200$Financial liabilities:Financial liabilities at fair
value through profit or lossForward exchange contracts -$ 16,883$ -$ 16,883$
Derivative financial liabilitiesfor hedging - 2,644 - 2,644
-$ 19,527$ -$ 19,527$
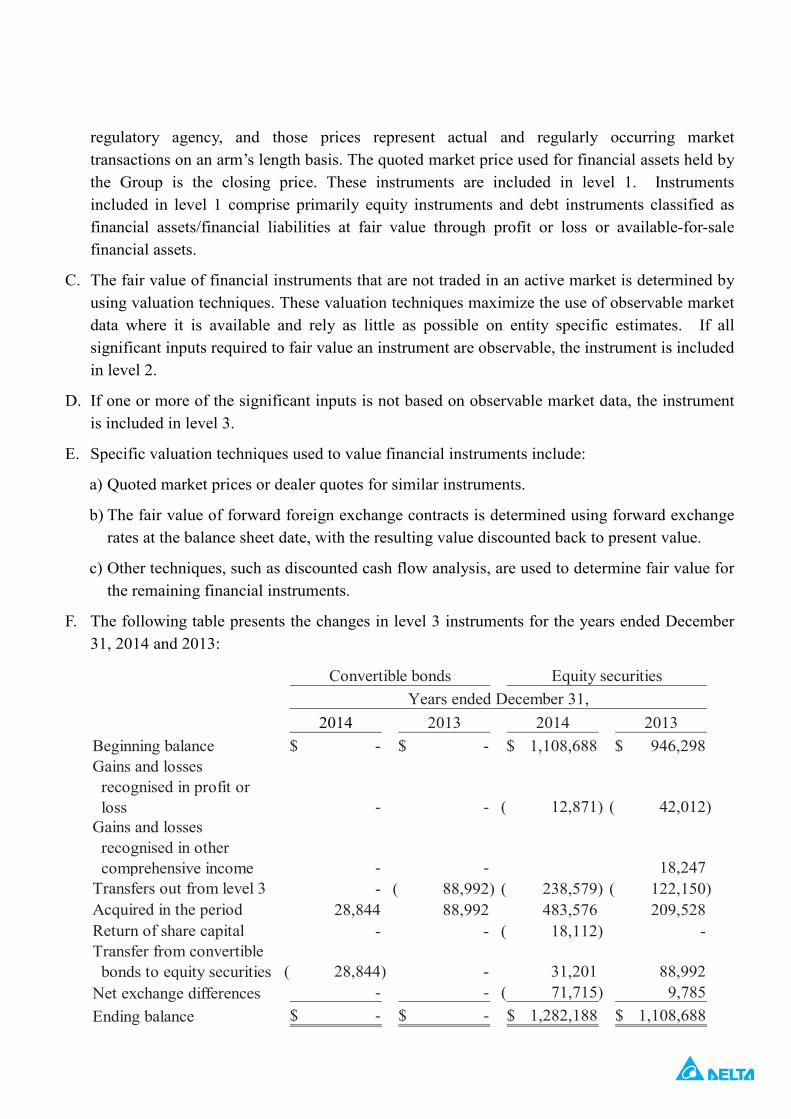
97
regulatory agency, and those prices represent actual and regularly occurring markettransactions on an arm’s length basis. The quoted market price used for financial assets held bythe Group is the closing price. These instruments are included in level 1. Instrumentsincluded in level 1 comprise primarily equity instruments and debt instruments classified asfinancial assets/financial liabilities at fair value through profit or loss or available-for-salefinancial assets.
C. The fair value of financial instruments that are not traded in an active market is determined byusing valuation techniques. These valuation techniques maximize the use of observable marketdata where it is available and rely as little as possible on entity specific estimates. If allsignificant inputs required to fair value an instrument are observable, the instrument is includedin level 2.
D. If one or more of the significant inputs is not based on observable market data, the instrumentis included in level 3.
E. Specific valuation techniques used to value financial instruments include:
a) Quoted market prices or dealer quotes for similar instruments.
b) The fair value of forward foreign exchange contracts is determined using forward exchangerates at the balance sheet date, with the resulting value discounted back to present value.
c) Other techniques, such as discounted cash flow analysis, are used to determine fair value forthe remaining financial instruments.
F. The following table presents the changes in level 3 instruments for the years ended December31, 2014 and 2013:
2014 2013 2014 2013Beginning balance -$ -$ 1,108,688$ 946,298$Gains and losses
recognised in profit orloss - - 12,871)( 42,012)(
Gains and lossesrecognised in othercomprehensive income - - 18,247
Transfers out from level 3 - 88,992)( 238,579)( 122,150)(Acquired in the period 28,844 88,992 483,576 209,528Return of share capital - - 18,112)( -Transfer from convertible
bonds to equity securities 28,844)( - 31,201 88,992Net exchange differences - - 71,715)( 9,785Ending balance -$ -$ 1,282,188$ 1,108,688$
Convertible bonds Equity securitiesYears ended December 31,
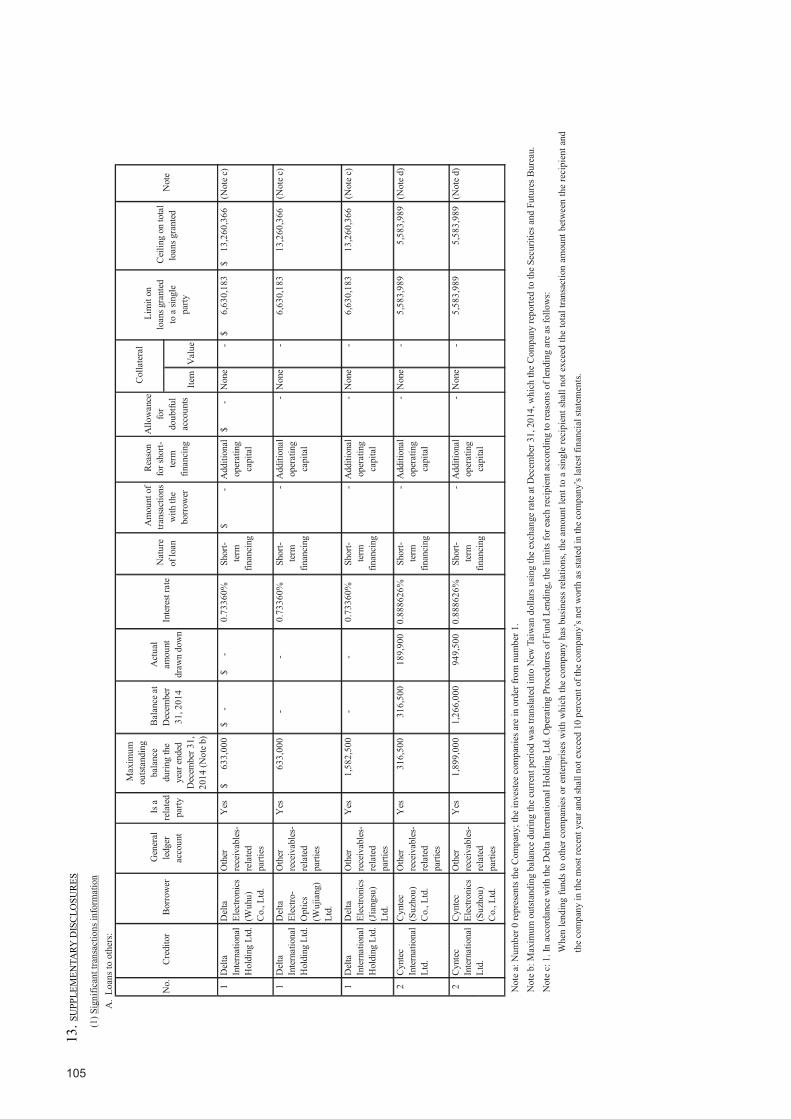
105
98
13.S
UPP
LEM
ENTA
RYD
ISC
LOSU
RES
(1)S
igni
fican
ttra
nsac
tions
info
rmat
ion
A.
Loan
sto
othe
rs:
Not
ea:
Num
ber0
repr
esen
tsth
eC
ompa
ny;t
hein
vest
eeco
mpa
nies
are
inor
derf
rom
num
ber1
.N
ote
b:M
axim
umou
tsta
ndin
gba
lanc
edu
ring
the
curre
ntpe
riod
was
trans
late
din
toN
ewTa
iwan
dolla
rsus
ing
the
exch
ange
rate
atD
ecem
ber3
1,20
14,w
hich
the
Com
pany
repo
rted
toth
eSe
curit
iesa
ndFu
ture
sBur
eau.
Not
ec:
1.In
acco
rdan
cew
ithth
eD
elta
Inte
rnat
iona
lHol
ding
Ltd.
Ope
ratin
gPr
oced
ures
ofFu
ndLe
ndin
g,th
elim
itsfo
reac
hre
cipi
enta
ccor
ding
tore
ason
sofl
endi
ngar
eas
follo
ws:
Whe
nle
ndin
gfu
ndst
oot
herc
ompa
nies
oren
terp
rises
with
whi
chth
eco
mpa
nyha
sbu
sines
sre
latio
ns,t
heam
ount
lent
toa
singl
ere
cipi
ents
hall
note
xcee
dth
eto
talt
rans
actio
nam
ount
betw
een
the
reci
pien
tand
the
com
pany
inth
em
ostr
ecen
tyea
rand
shal
lnot
exce
ed10
perc
ento
fthe
com
pany
’sne
twor
thas
state
din
the
com
pany
’sla
test
finan
cial
state
men
ts.Item
Val
ue
1D
elta
Inte
rnat
iona
lH
oldi
ngLt
d.
Del
taEl
ectro
nics
(Wuh
u)C
o.,L
td.
Oth
erre
ceiv
able
s-re
late
dpa
rties
Yes
$63
3,00
0$
-$
-0.
7336
0%Sh
ort-
term
finan
cing
$-
Add
ition
alop
erat
ing
capi
tal
$-
Non
e-
$6,
630,
183
$13
,260
,366
(Not
ec)
1D
elta
Inte
rnat
iona
lH
oldi
ngLt
d.
Del
taEl
ectro
-O
ptic
s(W
ujia
ng)
Ltd.
Oth
erre
ceiv
able
s-re
late
dpa
rties
Yes
633,
000
--
0.73
360%
Shor
t-te
rmfin
anci
ng
-A
dditi
onal
oper
atin
gca
pita
l
-N
one
-6,
630,
183
13,2
60,3
66(N
ote
c)
1D
elta
Inte
rnat
iona
lH
oldi
ngLt
d.
Del
taEl
ectro
nics
(Jia
ngsu
)Lt
d.
Oth
erre
ceiv
able
s-re
late
dpa
rties
Yes
1,58
2,50
0-
-0.
7336
0%Sh
ort-
term
finan
cing
-A
dditi
onal
oper
atin
gca
pita
l
-N
one
-6,
630,
183
13,2
60,3
66(N
ote
c)
2C
ynte
cIn
tern
atio
nal
Ltd.
Cyn
tec
(Suz
hou)
Co.
,Ltd
.
Oth
erre
ceiv
able
s-re
late
dpa
rties
Yes
316,
500
316,
500
189,
900
0.88
8626
%Sh
ort-
term
finan
cing
-A
dditi
onal
oper
atin
gca
pita
l
-N
one
-5,
583,
989
5,58
3,98
9(N
ote
d)
`
2C
ynte
cIn
tern
atio
nal
Ltd.
Cyn
tec
Elec
troni
cs(S
uzho
u)C
o.,L
td.
Oth
erre
ceiv
able
s-re
late
dpa
rties
Yes
1,89
9,00
01,
266,
000
949,
500
0.88
8626
%Sh
ort-
term
finan
cing
-A
dditi
onal
oper
atin
gca
pita
l
-N
one
-5,
583,
989
5,58
3,98
9(N
ote
d)
Rea
son
fors
hort-
term
finan
cing
No.
Cre
dito
rB
orro
wer
Gen
eral
ledg
erac
coun
t
Isa
rela
ted
party
Max
imum
outst
andi
ngba
lanc
edu
ring
the
year
ende
dD
ecem
ber3
1,20
14(N
ote
b)
Bal
ance
atD
ecem
ber
31,2
014
Act
ual
amou
ntdr
awn
dow
nIn
tere
stra
teN
atur
eof
loan
Am
ount
oftra
nsac
tions
with
the
borr
ower
Allo
wan
cefo
rdo
ubtfu
lac
coun
ts
Col
late
ral
Lim
iton
loan
sgra
nted
toa
singl
epa
rty
Cei
ling
onto
tal
loan
sgra
nted
Not
e

99
Whe
npr
ovid
ing
shor
t-term
finan
cing
toot
herc
ompa
nies
oren
terpr
ises,
thesh
ort-t
ermfin
ancin
gam
ount
toas
ingle
recip
ients
hall
note
xcee
d10
perc
ento
fthe
comp
any’s
netw
orth
assta
tedin
thec
ompa
ny’s
lates
tfin
ancia
lstat
emen
ts.2.
Inac
cord
ance
with
theD
eltaI
ntern
ation
alHo
ldin
gLtd
.Ope
ratin
gPro
cedu
resof
Fund
Lend
ing,
thel
imits
fort
otal
amou
ntof
fund
lendi
ngac
cord
ingt
oits
reaso
nsar
easf
ollow
s:W
hen
lendi
ngfu
ndst
oot
herc
ompa
nieso
rent
erpris
eswi
thwh
ichth
ecom
pany
hasb
usin
essr
elatio
ns,t
heam
ount
lentt
oas
ingle
recip
ients
hall
note
xcee
dth
etot
altra
nsac
tion
amou
ntbe
twee
nth
erec
ipien
tand
thec
ompa
nyin
them
ostr
ecen
tyea
rand
thet
otala
mou
ntlen
tsha
llno
texc
eed2
0perc
ento
fthe
comp
any’s
netw
orth
assta
tedin
thec
ompa
ny’s
lates
tfin
ancia
lstat
emen
ts.W
hen
prov
idin
gsh
ort-t
ermfin
ancin
gto
other
comp
anies
oren
terpr
ises,
theto
talsh
ort-t
ermfin
ancin
gam
ount
shall
note
xcee
d20
perc
ento
fthe
com
pany
’sne
twor
thas
stated
inth
ecom
pany
’slat
estf
inan
cial
statem
ents.
Thea
ggre
gate
amou
ntof
total
fund
slen
ttoo
ther
com
pani
esor
enter
prise
swith
which
thec
ompa
nyha
sbus
ines
srela
tions
andt
otals
hort-
term
finan
cingp
rovi
dedt
ooth
erco
mpa
nies
oren
terpr
isess
hall
note
xcee
d20
perc
ento
fthe
com
pany
’sne
twor
thas
stated
inth
ecom
pany
’slat
estf
inan
cials
tatem
ents.
Note
d:1.
Inac
cord
ance
with
theC
yntec
Inter
natio
nalL
td.O
pera
tingP
roce
dures
ofFu
ndLe
ndin
g,wh
enpr
ovid
ings
hort-
term
finan
cingt
ooth
erco
mpa
nies
orot
here
nterp
rise,
thea
mou
ntlen
ttoa
single
recip
ients
hall
not
exce
ed40
perc
ento
fthe
comp
any’s
netw
orth
assta
tedin
thec
ompa
ny’s
lates
tfin
ancia
lstat
emen
ts.2.
Inac
cord
ance
with
the
Cynt
ecIn
terna
tiona
lLtd
.Ope
ratin
gPr
oced
ures
ofFu
ndLe
ndin
g,th
elim
itsfo
rtot
alam
ount
offu
ndlen
ding
shall
note
xcee
d40
perc
ento
fthe
com
pany
’sne
twor
thas
stated
inth
eco
mpa
ny’s
lates
tfin
ancia
lstat
emen
ts.B.
Prov
ision
ofen
dorse
men
tsan
dgua
rantee
stoo
thers
:
Note
a:Th
enum
bers
filled
info
rthe
endo
rsem
ents/
guar
antee
spro
vide
dbyt
heCo
mpa
nyor
subs
idiar
iesar
easf
ollow
s:(1
)Th
eCom
pany
is‘0
’.(2
)Th
esub
sidiar
iesar
enum
bered
inor
ders
tartin
gfro
m‘1
’.No
teb:
Relat
ions
hipb
etwee
nthe
endo
rser/g
uara
ntor
andt
hepa
rtybe
inge
ndor
sed/
guara
ntee
disc
lassif
iedin
tothe
follo
wing
sixca
tegor
ies:
(1)
Havi
ngbu
sines
srela
tions
hip.
(2)
Thee
ndor
ser/g
uara
ntor
paren
tcom
pany
owns
direc
tlym
oret
han5
0%vo
tings
hares
ofth
eend
orse
d/gu
aran
teeds
ubsid
iary.
(3)
Thee
ndor
ser/g
uara
ntor
paren
tcom
pany
andi
tssu
bsid
iaries
join
tlyow
nmor
etha
n50%
votin
gsha
resof
thee
ndor
sed/
guar
antee
dcom
pany
.(4
)Th
eend
orse
d/gu
aran
teedp
aren
tcom
pany
direc
tlyor
indi
rectly
owns
mor
etha
n50%
votin
gsha
resof
thee
ndor
ser/g
uaran
tors
ubsid
iary.
(5)
Mutu
algu
arant
eeof
thet
radea
sreq
uired
byth
econ
struc
tionc
ontra
ct.
Comp
any
name
Relat
ionsh
ipwi
ththe
endo
rser/
guar
antor
(Note
b)
1
Delta
Elec
tronic
s(S
hang
hai)
Co.,L
td.
Delta
Gree
ntech
(Chin
a)Co
.,Ltd.
132
6,352
$5,
355
$-
$-
$-
$-
652,7
04$
NN
Y
Outst
andin
gen
dorse
ment
/gua
rante
eam
ount
atDe
cemb
er31
,201
4(N
oted)
Numb
er(N
otea)
Endo
rser/
guar
antor
Party
being
endo
rsed/g
uara
nteed
Limi
ton
endo
rseme
nts/g
uara
ntees
prov
idedf
ora
single
party
(Note
c)
Max
imum
outst
andi
ngen
dorse
men
t/g
uara
ntee
amou
ntas
ofDe
cemb
er31
,201
4(N
oted)
Prov
ision
ofen
dorse
ments
/gua
rante
esto
thepa
rtyin
Main
land
China
Note
Actu
alam
ount
draw
ndow
n(N
oted)
Amou
ntof
endo
rseme
nts/g
uara
ntees
secu
redwi
thco
llater
al
Ratio
ofac
cumu
lated
endo
rseme
nt/
guar
antee
amou
ntto
net
asse
tvalu
eof
thee
ndor
ser/
guar
antor
comp
any
Ceili
ngon
total
amou
ntof
endo
rseme
nts/g
uara
ntees
prov
ided
(Note
c)
Prov
ision
ofen
dorse
ments
/gua
rante
esby
paren
tco
mpan
yto
subs
idiar
y
Prov
ision
ofen
dorse
ments
/gua
rante
esby
subs
idiar
yto
paren
tco
mpan
y

107
100
(6)
Due
tojo
intv
entu
re,e
ach
shar
ehol
derp
rovi
des
endo
rsem
ents
/gua
rant
ees
toth
een
dors
ed/g
uara
ntee
dco
mpa
nyin
prop
ortio
nto
itsow
ners
hip.
Not
ec:
Inac
cord
ance
with
the
Del
taEl
ectro
nics
(Sha
ngha
i)C
o.,L
td.O
pera
ting
Proc
edur
esof
endo
rsem
ents
and
guar
ante
es,e
ndor
sem
ents
and
guar
ante
espr
ovid
edto
othe
rcom
pani
esor
othe
rent
erpr
ise
shal
lnot
exce
ed10
perc
ento
fthe
com
pany
’sne
twor
th,t
heam
ount
lent
toa
sing
lere
cipi
ents
hall
note
xcee
d5
perc
ento
fthe
com
pany
’sne
twor
thas
stat
edin
the
com
pany
’sla
test
finan
cial
stat
emen
ts.
Not
ed:
Usi
ngth
eex
chan
gera
teat
Dec
embe
r31,
2014
,whi
chth
eC
ompa
nyre
porte
dto
the
Secu
ritie
san
dFu
ture
sB
urea
u.
C.
Hol
ding
ofm
arke
tabl
ese
curit
ies
atth
een
dof
the
perio
d:(n
otin
clud
ing
subs
idia
ries,
asso
ciat
esan
djo
intv
entu
res.
Com
bine
dam
ount
sle
ssth
an$1
00,0
00as
ofD
ecem
ber3
1,20
14)
Num
bero
fsha
res
Boo
kva
lue
Ow
ners
hip
(%)
Fair
valu
eD
elta
Elec
troni
cs,I
nc.
Dyn
apac
kIn
tern
atio
nal
Tec
hnol
ogy
Cor
pora
tion
com
mon
stoc
k
Non
eA
vaila
ble-
for-
sale
finan
cial
asse
ts5,
013,
459
$36
9,49
23.
30$
369,
492
-
Del
taEl
ectro
nics
,Inc
.T
ong
Hsi
ngEl
ectro
nic
Indu
strie
s,Lt
d.co
mm
onst
ock
Non
eA
vaila
ble-
for-
sale
finan
cial
asse
ts1,
021,
000
111,
289
0.63
111,
289
-
Del
taEl
ectro
nics
,Inc
.N
eoSo
larP
ower
Cor
p.co
mm
onst
ock
Non
eA
vaila
ble-
for-
sale
finan
cial
asse
ts16
1,59
0,29
64,
831,
550
18.8
74,
831,
550
-
Del
taEl
ectro
nics
,Inc
.D
elta
Am
eric
aLt
d.pr
efer
red
shar
esN
one
Fina
ncia
lass
etsc
arrie
dat
cost
-no
n-cu
rren
t2,
100,
000
103,
065
Pref
erre
dsh
ares
103,
065
-
Del
taEl
ectro
nics
,Inc
.O
ther
sN
one
406,
837
406,
838
-D
elta
Inte
rnat
iona
lH
oldi
ngLt
d.So
larf
lare
Com
mun
icat
ions
,Inc
.pr
efer
red
shar
esN
one
Ava
ilabl
e-fo
r-sa
lefin
anci
alas
sets
9,54
7,23
530
2,17
04.
1030
2,17
0-
Del
taIn
tern
atio
nal
Hol
ding
Ltd.
Men
tisT
echn
olog
y,LL
C,e
tc.
Non
e96
,307
96,3
07-
Del
troni
cs(N
ethe
rland
s)B
.V.
Del
taA
mer
ica
Ltd.
Non
eFi
nanc
iala
sset
scar
ried
atco
st-
non-
curr
ent
350,
000
29,6
582.
7729
,658
-
Cyn
tec
Co.
,Ltd
.SU
SUM
UC
o.,L
td.c
omm
onst
ock
Non
eFi
nanc
iala
sset
scar
ried
atco
st-
non-
curr
ent
200,
000
104,
081
11.5
310
4,08
1-
Cyn
tec
Co.
,Ltd
.LU
XT
ERA
,IN
C.p
refe
rred
shar
esN
one
Fina
ncia
lass
etsc
arrie
dat
cost
-no
n-cu
rren
t52
,056
,222
313,
220
3.60
313,
220
Del
taEl
ectro
nics
Cap
italC
ompa
nyB
inha
iInv
estm
entC
ompa
nyLi
mite
dco
nver
tible
bond
sN
one
Fina
ncia
lass
etsa
tfai
rval
ueth
roug
hpr
ofit
orlo
ss-n
on-
curr
ent
115,
924
115,
924
-
Del
taEl
ectro
nics
Cap
italC
ompa
nyT
ong
Hsi
ngEl
ectro
nic
Indu
strie
s,Lt
d.co
mm
onst
ock
Non
eA
vaila
ble-
for-
sale
finan
cial
asse
ts1,
769,
000
192,
821
1.09
192,
821
-
Del
taEl
ectro
nics
Cap
italC
ompa
nyFi
neT
ekC
o.,L
td.c
omm
onst
ock
Non
eA
vaila
ble-
for-
sale
finan
cial
asse
ts77
1,75
011
1,51
82.
0911
1,51
8-
Del
taEl
ectro
nics
Cap
italC
ompa
nyN
ien
Mad
eEn
terp
rise
Co.
,Ltd
.N
one
Ava
ilabl
e-fo
r-sa
lefin
anci
alas
sets
1,98
7,89
021
8,40
00.
8721
8,40
0-
Del
taEl
ectro
nics
Cap
italC
ompa
nyLe
dlin
kO
ptic
s,In
c.co
mm
onst
ock,
etc.
Non
e1,
250,
043
1,25
0,04
3-Not
eSe
curit
iesh
eld
byM
arke
tabl
ese
curit
ies
Rel
atio
nshi
pw
ithth
ese
curit
iesi
ssue
rG
ener
alle
dger
acco
unt
Aso
fDec
embe
r31,
2014

101
D.
Agg
rega
tepu
rcha
seso
rsal
esof
the
sam
ese
curit
iesr
each
ing
$300
mill
ion
or20
%of
paid
-inca
pita
l:
Num
bero
fsh
ares
Am
ount
Num
bero
fsh
ares
Am
ount
Num
bero
fsh
ares
Selli
ngpr
ice
Boo
kva
lue
Gai
n(lo
ss)
ondi
spos
alN
umbe
rof
shar
esA
mou
nt
211,
983
$(N
ote
a)
521,
621)
(
(Not
eb)
415,
286
(Not
ec)
2,72
8,91
8
(Not
ed)
35,0
40,0
006,
150,
289
--
--
207,
180,
000
20,7
44,2
95
(Not
ee)
35,0
40,0
001,
114,
519
--
--
202,
180,
000
6,77
5,34
2
(Not
ef)
12,1
75,4
7088
0,04
4
Del
taIn
tern
atio
nal
Hol
ding
Ltd.
Boo
mTr
easu
reLi
mite
d
Inve
stmen
tsac
coun
ted
foru
nder
the
equi
tym
etho
d
Lom
bard
Inte
rnat
iona
lPC
CLt
d.
Non
e-
-1
--
--
12,
728,
918
613,
765
$28
1,07
8)($
5,01
3,45
936
9,49
2$
Del
taIn
tern
atio
nal
Hol
ding
Ltd.
Del
taG
reen
tech
SGP
Pte
Ltd.
Inve
stmen
tsac
coun
ted
foru
nder
the
equi
tym
etho
d
Del
taG
reen
tech
Inte
rnat
iona
lH
oldi
ngLt
d.
Ass
ocia
te6,
676,
368
464,
758
5,49
9,10
2-
--
-
9,29
2,45
977
1,27
4$
-4,
279,
000
332,
687
$D
elta
Elec
troni
csIn
c.
Dyn
apac
kIn
tern
atio
nal
Tech
nolo
gyC
orpo
ratio
n
Ava
ilabl
e-fo
r-sal
efin
anci
alas
sets
Add
ition
Disp
osal
Bal
ance
asat
Dec
embe
r31,
2014
Inve
stor
Mar
keta
ble
secu
rity
Gen
eral
ledg
erac
coun
tC
ount
erpa
rtyR
elat
ions
hip
with
the
inve
stor
Bal
ance
asat
Janu
ary
1,20
14
Fairv
iew
Ass
etsL
td.
Gra
ndvi
ewH
oldi
ngLt
d.In
vestm
ents
acco
unte
dfo
rund
erth
eeq
uity
met
hod
Gra
ndvi
ewH
oldi
ngLt
d.Su
bsid
iary
172,
140,
000
14,5
94,0
06
Cen
tralis
edtra
ding
mar
ket
Non
e
Del
taEl
ectro
nics
Inc.
Neo
Sola
rPo
wer
Cor
p.A
vaila
ble-
for-s
ale
finan
cial
asse
ts
Neo
Sola
rPo
wer
Cor
p.N
one
121,
524,
872
5,35
3,17
1
Gra
ndvi
ewH
oldi
ngLt
d.C
ynte
cH
oldi
ng(H
.K.)
Ltd.
Inve
stmen
tsac
coun
ted
foru
nder
the
equi
tym
etho
d
Cyn
tec
Hol
ding
(H.K
.)Lt
d.
Subs
idia
ry16
7,14
0,00
0
40,0
65,4
24-
--
-16
1,59
0,29
64,
831,
550
5,66
0,82
3

109
102
Not
ea:
The
amou
ntis
the
reve
rsal
ofde
crea
sein
fair
valu
eca
used
bydi
spos
al.
Not
eb:
InN
ovem
ber2
014,
Del
taEl
ectro
nics
Inc.
hasa
cqui
red
Neo
Sola
rPow
erCo
rp.f
orca
shof
$1,0
61,7
34,w
hich
incl
udes
the
reco
gniti
onof
valu
atio
nof
fair
valu
ein
thep
erio
d.N
ote
c:In
Sept
embe
r201
4,D
elta
Inte
rnat
iona
lHol
ding
Ltd.
hasa
cqui
red
Del
taG
reen
tech
SGP
Pte
Ltd.
forc
ash
of$3
93,3
51,w
hich
incl
udes
the
prof
it(lo
ss)o
fass
ocia
tesr
ecog
nise
din
the
perio
dan
dch
ange
sin
netv
alue
.N
ote
d:In
Sept
embe
r201
4,D
elta
Inte
rnat
iona
lHol
ding
Ltd.
hasa
cqui
red
Boom
Trea
sure
Lim
ited
forc
ash
of$2
,652
,858
,whi
chin
clud
esth
epro
fit(lo
ss)o
fass
ocia
tesr
ecog
nise
din
thep
erio
d.N
ote
e:Fa
irvie
wA
sset
sLtd
.inv
este
d$1
,109
,016
inG
rand
view
Hol
ding
Ltd.
and
reco
gniz
edsh
are
ofpr
ofit
(loss
)acc
ount
edfo
rund
ereq
uity
met
hod
and
adju
stmen
tofc
hang
ein
neta
sset
valu
e.N
ote
f:G
rand
view
Hol
ding
Ltd.
inve
sted
$1,1
09,0
16in
Cynt
ecH
oldi
ng(H
.K.)
Ltd.
and
reco
gniz
edsh
are
ofpr
ofit
(loss
)acc
ount
edfo
rund
ereq
uity
met
hod
and
adju
stmen
tofc
hang
ein
neta
sset
valu
e.N
ote
g:Cy
ntec
Hol
ding
(H.K
.)in
veste
d$1
,107
,750
inCy
ntec
Elec
troni
cs(S
uzho
u)Co
.,Lt
d.an
dre
cogn
ized
shar
eof
prof
it(lo
ss)a
ccou
nted
foru
nder
equi
tym
etho
dan
dad
justm
ento
fcha
nge
inne
tass
etva
lue.
Not
eh:
InD
ecem
ber2
014,
Cynt
ecCo
.,Lt
d.ha
sacq
uire
dLu
xter
aIn
c.fo
rcas
hof
$313
,220
.E.
Acq
uisit
ion
ofre
ales
tate
reac
hing
$300
mill
ion
or20
%of
paid
-inca
pita
l:Num
bero
fsh
ares
Am
ount
Num
bero
fsh
ares
Am
ount
Num
bero
fsh
ares
Selli
ngpr
ice
Book
valu
eG
ain
(loss
)on
disp
osal
Num
bero
fsh
ares
Am
ount
-1,
101,
478
$-
-$
-$
-$
-4,
764,
272
$
(Not
eg)
52,0
56,2
2231
3,22
0-
--
-52
,056
,222
313,
220
(Not
eh)
Cynt
ecH
oldi
ng(H
.K.)
Ltd.
Cynt
ecEl
ectro
nics
(Suz
hou)
Co.,
Ltd.
Inve
stmen
tsac
coun
ted
foru
nder
thee
quity
met
hod
Cynt
ecEl
ectro
nics
(Suz
hou)
Co.,
Ltd.
Subs
idia
ry-
3,66
2,79
4$
Cynt
ecCo
.,Lt
d.LU
XTE
RAIn
c.Fi
nanc
ial
asse
tsca
rried
atco
st-no
n-cu
rrent
Non
eN
one
--
Inve
stor
Mar
keta
ble
secu
rity
Gen
eral
ledg
erac
coun
tCo
unte
rpar
tyRe
latio
nshi
pw
ithth
ein
vesto
r
Bala
nce
asat
Janu
ary
1,20
14A
dditi
onD
ispos
alBa
lanc
easa
tDec
embe
r31,
2014
Orig
inal
owne
rRe
latio
nshi
pD
ateo
fthe
who
sold
ther
eal
betw
een
the
orig
inal
esta
teto
the
orig
inal
owne
rtra
nsac
tion
coun
terp
arty
and
thea
cqui
rer
Real
esta
teac
quire
dby
Real
esta
teac
quire
d
Ifth
ecou
nter
party
isa
rela
ted
party
,inf
orm
atio
nas
toth
elas
ttra
nsac
tion
ofth
erea
lesta
teis
disc
lose
dbe
low
:
Non
e-
--
$-
Com
pare
and
nego
tiate
thep
rice
inop
enbi
dsO
ffice
build
ing
Am
ount
Basis
orre
fere
nce
used
inse
tting
the
pric
e
Reas
onfo
rac
quisi
tion
ofre
ales
tate
and
statu
sof
ther
eale
state
Oth
erCo
unte
rpar
tyco
mm
itmen
ts
Han
gzho
uIn
sigm
aTe
chno
logy
Indu
stry
Inve
stmen
tCo.
,Ltd
-
Del
taEl
ectro
nics
(Sha
ngha
i)Co
.,Lt
d.
Build
ings
inH
angz
hou
2014
.8.2
9$
528,
532
Acq
uire
dby
cash
Dat
eoft
heev
ent
Tran
sact
ion
amou
ntSt
atus
ofpa
ymen
tCo
unte
rpar
tyRe
latio
nshi
pw
ithth
eco
unte
rpar
ty

103
F.D
ispo
salo
frea
lest
ate
reac
hing
$300
mill
ion
or20
%of
paid
-inca
pita
lorm
ore:
Non
e.G
.Pu
rcha
ses
orsa
les
ofgo
ods
from
orto
rela
ted
parti
esre
achi
ng$1
00m
illio
nor
20%
ofpa
id-in
capi
talo
rmor
e:
Purc
hase
s(s
ales
)(N
ote
a)A
mou
nt
Perc
enta
geof
tota
lpur
chas
es(s
ales
)C
redi
tter
ms
Uni
tpric
eC
redi
tter
ms
Bal
ance
Perc
enta
geof
tota
lno
tes/
acco
unts
rece
ivab
le(p
ayab
le)
Del
taEl
ectro
nics
Inc.
Del
taEl
ectro
nics
Inte
rnat
iona
lLtd
.Su
bsid
iary
Sale
s$
1,52
2,42
43.
9475
days
$-
-$
60,5
170.
79
Del
taEl
ectro
nics
Inc.
Del
taEl
ectro
-Opt
ics
(Wuj
iang
)Ltd
.Su
bsid
iary
Sale
s20
0,43
50.
5275
days
--
80,1
310.
60
Del
taEl
ectro
nics
Inc.
DEI
Logi
stic
s(U
SA)
Cor
p.Su
bsid
iary
Sale
s24
3,50
70.
6375
days
--
46,0
081.
45
Del
taEl
ectro
nics
Inc.
Del
taG
reen
tech
(Chi
na)
Co.
,Ltd
.Su
bsid
iary
Sale
s25
2,34
10.
6575
days
--
111,
087
0.02
Del
taEl
ectro
nics
Inc.
Cyn
tec
(Suz
hou)
Co.
Ltd.
Subs
idia
rySa
les
105,
617
0.27
75da
ys-
-1,
836
20.2
7
Del
taEl
ectro
nics
Inc.
Del
taEl
ectro
nics
Int'l
(Sin
gapo
re)P
te.L
td.
Subs
idia
rySa
les
6,76
5,15
617
.52
75da
ys-
-1,
554,
521
1.04
Del
taEl
ectro
nics
Inte
rnat
iona
lLtd
.D
elta
Elec
troni
cs(J
apan
),In
c.A
ffilia
ted
ente
rpris
eSa
les
499,
030
2.04
75da
ys-
--
-
Del
taEl
ectro
nics
Inte
rnat
iona
lLtd
.D
EILo
gist
ics(
USA
)C
orp.
Affi
liate
den
terp
rise
Sale
s14
,782
,130
60.5
075
days
--
2,57
0,33
485
.71
Del
taEl
ectro
nics
Inte
rnat
iona
lLtd
.V
ivite
kC
orpo
ratio
nA
ffilia
ted
ente
rpris
eSa
les
390,
982
1.60
75da
ys-
-12
70.
00
Del
taEl
ectro
nics
Inte
rnat
iona
lLtd
.D
elta
Elec
troni
csIn
c.U
ltim
ate
pare
ntco
mpa
ny
Sale
s15
4,13
70.
6375
days
--
152
0.01
Del
taEl
ectro
nics
Inte
rnat
iona
lLtd
.D
eltro
nics
(Net
herla
nds)
B.V
.A
ffilia
ted
ente
rpris
eSa
les
140,
161
0.57
75da
ys-
-93
,376
3.11
Not
ePu
rcha
ser/s
elle
rC
ount
erpa
rty
Rel
atio
nshi
pw
ithth
eco
unte
rpar
ty
Tra
nsac
tion
Diff
eren
cesi
ntra
nsac
tion
term
com
pare
dto
third
party
trans
actio
nsN
otes
/acc
ount
srec
eiva
ble
(pay
able
)

111
104
Purc
hase
s(s
ales
)(N
otea
)A
mou
nt
Perc
enta
geof
tota
lpur
chas
es(s
ales
)Cr
edit
term
sU
nitp
rice
Cred
itte
rms
Bala
nce
Perc
enta
geof
tota
lno
tes/a
ccou
nts
rece
ivab
le(p
ayab
le)
Del
taEl
ectro
nics
Inte
rnat
iona
lLtd
.D
elta
Elec
troni
csIn
t'l(S
inga
pore
)Pte
.Ltd
.A
ffilia
ted
ente
rpris
eSa
les
$31
0,50
01.
2775
days
$-
-$
--
Del
taEl
ectro
nics
Inte
rnat
iona
lLtd
.D
elta
Indi
aEl
ectro
nics
Pvt.
Ltd.
Ass
ocia
teSa
les
120,
429
0.49
75da
ys-
--
-
Del
taEl
ectro
nics
Inte
rnat
iona
lLtd
.D
igita
lPro
ject
ion
Ltd.
Ass
ocia
teSa
les
216,
411
0.89
75da
ys-
--
-
Del
taEl
ectro
nics
Int'l
(Sin
gapo
re)P
te.L
td.
Del
taEl
ectro
nics
Inte
rnat
iona
lLtd
.A
ffilia
ted
ente
rpris
eSa
les
2,39
8,34
81.
4975
days
--
375,
642
0.96
Del
taEl
ectro
nics
Int'l
(Sin
gapo
re)P
te.L
td.
Del
taEl
ectro
nics
(Don
ggua
n)Co
.,Lt
d.A
ffilia
ted
ente
rpris
eSa
les
8,22
9,62
15.
1275
days
--
1,85
7,45
14.
73
Del
taEl
ectro
nics
Int'l
(Sin
gapo
re)P
te.L
td.
Del
taEl
ectro
nics
Pow
er(D
ongg
uan)
Co.,
Ltd.
Affi
liate
den
terp
rise
Sale
s20
,008
,561
12.4
675
days
--
5,05
4,97
412
.89
Del
taEl
ectro
nics
Int'l
(Sin
gapo
re)P
te.L
td.
Del
taEl
ectro
nics
(Jia
ngsu
)Ltd
.A
ffilia
ted
ente
rpris
eSa
les
16,9
58,4
0110
.56
75da
ys-
-1,
701,
454
4.34
Del
taEl
ectro
nics
Int'l
(Sin
gapo
re)P
te.L
td.
Del
taEl
ectro
nics
Com
pone
nts(
Wuj
iang
)Lt
d.
Affi
liate
den
terp
rise
Sale
s4,
802,
320
2.99
75da
ys-
-95
9,90
82.
45
Del
taEl
ectro
nics
Int'l
(Sin
gapo
re)P
te.L
td.
Del
taEl
ectro
-Opt
ics
(Wuj
iang
)Ltd
.A
ffilia
ted
ente
rpris
eSa
les
4,13
3,44
12.
5775
days
--
139
0.00
Del
taEl
ectro
nics
Int'l
(Sin
gapo
re)P
te.L
td.
Del
taV
ideo
Disp
lay
Syste
m(W
ujia
ng)L
td.
Affi
liate
den
terp
rise
Sale
s5,
737,
360
3.57
75da
ys-
-84
6,63
62.
16
Del
taEl
ectro
nics
Int'l
(Sin
gapo
re)P
te.L
td.
Del
taEl
ectro
nics
(Che
nzho
u)Co
.,Lt
d.A
ffilia
ted
ente
rpris
eSa
les
1,68
5,99
81.
0575
days
--
499,
860
1.27
Not
es/a
ccou
ntsr
ecei
vabl
e(pa
yabl
e)
Not
ePu
rcha
ser/s
elle
rCo
unte
rpar
ty
Rela
tions
hip
with
the
coun
terp
arty
Tran
sact
ion
Diff
eren
cesi
ntra
nsac
tion
term
com
pare
dto
third
party
trans
actio
ns

105
Purc
hase
s(s
ales
)(N
ote
a)A
mou
nt
Perc
enta
geof
tota
lpur
chas
es(s
ales
)C
redi
tter
ms
Uni
tpric
eC
redi
tter
ms
Bal
ance
Perc
enta
geof
tota
lno
tes/a
ccou
nts
rece
ivab
le(p
ayab
le)
Del
taEl
ectro
nics
Int'l
(Sin
gapo
re)P
te.L
td.
Che
nzho
uD
elta
Tech
nolo
gyC
o.Lt
d.A
ffilia
ted
ente
rpris
eSa
les
$59
2,26
80.
3775
days
$-
-$
132,
266
0.34
Del
taEl
ectro
nics
Int'l
(Sin
gapo
re)P
te.L
td.
Del
taEl
ectro
nics
(Wuh
u)C
o.,L
td.
Affi
liate
den
terp
rise
Sale
s3,
554,
712
2.21
75da
ys-
-54
3,60
41.
39
Del
taEl
ectro
nics
Int'l
(Sin
gapo
re)P
te.L
td.
Wuh
uD
elta
Tech
nolo
gyC
o.,L
td.
Affi
liate
den
terp
rise
Sale
s17
0,84
90.
1175
days
--
26,0
390.
07
Del
taEl
ectro
nics
Int'l
(Sin
gapo
re)P
te.L
td.
Del
taEl
ectro
nics
(Jap
an),
Inc.
Affi
liate
den
terp
rise
Sale
s1,
804,
518
1.12
75da
ys-
-56
4,29
51.
44
Del
taEl
ectro
nics
Int'l
(Sin
gapo
re)P
te.L
td.
Del
taEl
ectro
nics
(Kor
ea),
Inc.
Affi
liate
den
terp
rise
Sale
s15
0,19
80.
0975
days
--
38,7
880.
10
Del
taEl
ectro
nics
Int'l
(Sin
gapo
re)P
te.L
td.
DEI
Logi
stics
(USA
)C
orp.
Affi
liate
den
terp
rise
Sale
s2,
607,
817
1.62
75da
ys-
-2,
728,
493
6.96
Del
taEl
ectro
nics
Int'l
(Sin
gapo
re)P
te.L
td.
PreO
ptix
(Jia
ngSu
)Co.
Ltd.
Affi
liate
den
terp
rise
Sale
s17
9,66
60.
1175
days
--
33,0
890.
08
Del
taEl
ectro
nics
Int'l
(Sin
gapo
re)P
te.L
td.
Viv
itek
Cor
pora
tion
Affi
liate
den
terp
rise
Sale
s23
8,02
20.
1575
days
--
119,
607
0.30
Del
taEl
ectro
nics
Int'l
(Sin
gapo
re)P
te.L
td.
Del
taN
etw
orks
Inte
rnat
iona
lLtd
.A
ffilia
ted
ente
rpris
eSa
les
1,23
4,93
00.
7775
days
--
425,
808
1.09
Del
taEl
ectro
nics
Int'l
(Sin
gapo
re)P
te.L
td.
Del
taEl
ectro
nics
Inc.
Ulti
mat
epa
rent
com
pany
Sale
s23
,569
,539
14.6
775
days
--
8,08
6,26
520
.61
Del
taEl
ectro
nics
Int'l
(Sin
gapo
re)P
te.L
td.
Del
troni
cs(N
ethe
rland
s)B
.V.
Affi
liate
den
terp
rise
Sale
s93
7,77
10.
5875
days
--
225,
047
0.57
Del
taEl
ectro
nics
Int'l
(Sin
gapo
re)P
te.L
td.
Del
taEn
ergy
Syste
ms
(Sw
itzer
land
)AG
Ass
ocia
teSa
les
317,
707
0.20
75da
ys-
-70
,895
0.18
Purc
hase
r/sel
ler
Cou
nter
party
Rel
atio
nshi
pw
ithth
eco
unte
rpar
ty
Tran
sact
ion
Diff
eren
cesi
ntra
nsac
tion
term
com
pare
dto
third
party
trans
actio
nsN
otes
/acc
ount
srec
eiva
ble
(pay
able
)
Not
e

113
106
Purc
hase
s(s
ales
)(N
ote
a)A
mou
nt
Perc
enta
geof
tota
lpur
chas
es(s
ales
)C
redi
tter
ms
Uni
tpri
ceC
redi
tter
ms
Bal
ance
Perc
enta
geof
tota
lno
tes/
acco
unts
rece
ivab
le(p
ayab
le)
Del
taE
lect
roni
csIn
t'l(S
inga
pore
)Pte
.Ltd
.D
elta
Gre
ente
ch(B
rasi
l)S.
A.
Ass
ocia
teSa
les
$36
6,15
40.
2375
days
$-
-$
178,
601
0.46
Del
taE
lect
roni
csIn
t'l(S
inga
pore
)Pte
.Ltd
.D
elta
Pow
erSo
lutio
ns(I
ndia
)Pvt
Ltd
.A
ssoc
iate
Sale
s18
4,66
00.
1175
days
--
53,3
890.
14
Del
taE
lect
roni
csIn
t'l(S
inga
pore
)Pte
.Ltd
.D
elta
Gre
ente
ch(U
SA)
Cor
pora
tion
Ass
ocia
teSa
les
884,
302
0.55
75da
ys-
-17
2,84
20.
44
Del
taE
lect
roni
csIn
t'l(S
inga
pore
)Pte
.Ltd
.D
elta
Indi
aE
lect
roni
csPv
t.L
td.
Ass
ocia
teSa
les
547,
678
0.34
75da
ys-
-12
7,42
90.
32
Del
taE
lect
roni
csIn
t'l(S
inga
pore
)Pte
.Ltd
.D
elta
Ele
ctro
nics
(Slo
vaki
a)s.
r.o.
Ass
ocia
teSa
les
535,
302
0.33
75da
ys-
-50
,566
0.13
Del
taE
lect
roni
csIn
t'l(S
inga
pore
)Pte
.Ltd
.D
elta
Prod
ucts
Cor
pora
tion
Rel
ated
part
yin
subs
tanc
eSa
les
972,
483
0.61
75da
ys-
-27
0,57
10.
69
Del
taE
lect
roni
csIn
t'l(S
inga
pore
)Pte
.Ltd
.D
igita
lPro
ject
ion
Ltd
.A
ssoc
iate
Sale
s33
7,67
20.
2175
days
--
197,
750
0.50
Del
taN
etw
orks
Inte
rnat
iona
lLtd
.D
elta
Net
wor
ks(D
ongg
uan)
Ltd
.A
ffili
ated
ente
rpri
seSa
les
17,8
38,7
9846
.77
75da
ys-
-4,
987,
852
43.6
7
Del
taN
etw
orks
Inte
rnat
iona
lLtd
.D
NIL
ogis
tics
(USA
)C
orp.
Aff
iliat
eden
terp
rise
Sale
s9,
873,
057
25.8
875
days
--
3,51
0,29
330
.74
Del
taN
etw
orks
Inte
rnat
iona
lLtd
.A
yeco
mT
echn
olog
yC
o.,
Ltd
.A
ffili
ated
ente
rpri
seSa
les
275,
559
0.72
75da
ys-
-35
,390
0.31
Del
taN
etw
orks
Inte
rnat
iona
lLtd
.D
elta
Net
wor
ks,I
nc.
(Tai
wan
)A
ffili
ated
ente
rpri
seSa
les
562,
268
1.47
75da
ys-
-12
0,30
11.
05
Del
taN
etw
orks
(Don
ggua
n)L
td.
Del
taN
etw
orks
Inte
rnat
iona
lLtd
.A
ffili
ated
ente
rpri
seSa
les
17,7
44,3
4082
.06
75da
ys-
-5,
231,
508
91.2
2
Purc
hase
r/se
ller
Cou
nter
part
y
Rel
atio
nshi
pw
ithth
eco
unte
rpar
ty
Tra
nsac
tion
Diff
eren
ces
intr
ansa
ctio
nte
rmco
mpa
red
toth
ird
part
ytr
ansa
ctio
nsN
otes
/acc
ount
sre
ceiv
able
(pay
able
)
Not
e

107
Purc
hase
s(s
ales
)(N
ote
a)A
mou
nt
Perc
enta
geof
tota
lpur
chas
es(s
ales
)C
redi
tter
ms
Uni
tpric
eC
redi
tter
ms
Bal
ance
Perc
enta
geof
tota
lno
tes/a
ccou
nts
rece
ivab
le(p
ayab
le)
Del
taN
etw
orks
,Inc
.(T
aiw
an)
Del
taN
etw
orks
Inte
rnat
iona
lLtd
.A
ffilia
ted
ente
rpris
eSa
les
$1,
312,
539
41.6
975
days
$-
-$
251,
200
30.2
6
Del
taN
etw
orks
,Inc
.(T
aiw
an)
DN
ILog
istic
s(U
SA)
Cor
p.A
ffilia
ted
ente
rpris
eSa
les
1,14
5,96
236
.40
75da
ys-
-35
5,18
142
.79
Del
taEl
ectro
nics
(Don
ggua
n)C
o.,L
td.
Del
taEl
ectro
nics
Inte
rnat
iona
lLtd
.A
ffilia
ted
ente
rpris
eSa
les
469,
273
3.93
75da
ys-
-48
,424
16.5
3
Del
taEl
ectro
nics
(Don
ggua
n)C
o.,L
td.
Del
taEl
ectro
nics
Int'l
(Sin
gapo
re)P
te.L
td.
Affi
liate
den
terp
rise
Sale
s9,
084,
945
76.1
775
days
--
2,12
4,40
072
.52
Del
taEl
ectro
nics
(Don
ggua
n)C
o.,L
td.
Del
taEl
ectro
nics
(Sha
ngha
i)C
o.,L
td.
Affi
liate
den
terp
rise
Sale
s71
1,21
95.
9675
days
--
219,
198
7.48
Del
taEl
ectro
nics
Pow
er(D
ongg
uan)
Co.
,Ltd
.
Del
taEl
ectro
nics
Inte
rnat
iona
lLtd
.A
ffilia
ted
ente
rpris
eSa
les
5,90
0,41
322
.19
75da
ys-
-68
3,48
810
.97
Del
taEl
ectro
nics
Pow
er(D
ongg
uan)
Co.
,Ltd
.
Del
taEl
ectro
nics
Int'l
(Sin
gapo
re)P
te.L
td.
Affi
liate
den
terp
rise
Sale
s19
,056
,881
71.6
775
days
--
5,03
3,04
980
.80
Del
taEl
ectro
nics
Pow
er(D
ongg
uan)
Co.
,Ltd
.
Del
taEl
ectro
nics
(Sha
ngha
i)C
o.,L
td.
Affi
liate
den
terp
rise
Sale
s1,
263,
510
4.75
75da
ys-
-45
6,09
17.
32
Del
taEl
ectro
nics
Pow
er(D
ongg
uan)
Co.
,Ltd
.
Del
taN
etw
orks
(Don
ggua
n)Lt
d.A
ffilia
ted
ente
rpris
eSa
les
207,
342
0.78
75da
ys-
-51
,966
0.83
Del
taEl
ectro
nics
(Jia
ngsu
)Ltd
.D
elta
Elec
troni
csIn
tern
atio
nalL
td.
Affi
liate
den
terp
rise
Sale
s3,
689,
164
9.39
75da
ys-
-7,
025
0.15
Not
es/a
ccou
ntsr
ecei
vabl
e(p
ayab
le)
Not
ePu
rcha
ser/s
elle
rC
ount
erpa
rty
Rel
atio
nshi
pw
ithth
eco
unte
rpar
ty
Tran
sact
ion
Diff
eren
cesi
ntra
nsac
tion
term
com
pare
dto
third
party
trans
actio
ns

115
108
Purc
hase
s(s
ales
)(N
ote
a)A
mou
nt
Perc
enta
geof
tota
lpur
chas
es(s
ales
)C
redi
tter
ms
Uni
tpric
eC
redi
tter
ms
Bal
ance
Perc
enta
geof
tota
lno
tes/a
ccou
nts
rece
ivab
le(p
ayab
le)
Del
taEl
ectro
nics
(Jia
ngsu
)Ltd
.D
elta
Elec
troni
cs(S
hang
hai)
Co.
,Ltd
.A
ffilia
ted
ente
rpris
eSa
les
$3,
255,
952
8.29
75da
ys$
--
$1,
369,
010
28.8
8
Del
taEl
ectro
nics
(Jia
ngsu
)Ltd
.D
elta
Elec
troni
cs(W
ujia
ng)T
radi
ngC
o.,
Ltd.
Affi
liate
den
terp
rise
Sale
s25
0,12
40.
6475
days
--
642
0.01
Del
taEl
ectro
nics
(Jia
ngsu
)Ltd
.D
elta
Elec
troni
csIn
t'l(S
inga
pore
)Pte
.Ltd
.A
ffilia
ted
ente
rpris
eSa
les
31,7
97,1
1780
.93
75da
ys-
-3,
283,
924
69.2
8
Del
taEl
ectro
nics
Com
pone
nts
(Wuj
iang
)Ltd
.
Del
taEl
ectro
nics
Inte
rnat
iona
lLtd
.A
ffilia
ted
ente
rpris
eSa
les
171,
035
2.09
75da
ys-
-5,
687
0.26
Del
taEl
ectro
nics
Com
pone
nts
(Wuj
iang
)Ltd
.
Del
taEl
ectro
nics
(Sha
ngha
i)C
o.,L
td.
Affi
liate
den
terp
rise
Sale
s1,
120,
205
13.6
875
days
--
999,
278
46.2
4
Del
taEl
ectro
nics
Com
pone
nts
(Wuj
iang
)Ltd
.
Del
taEl
ectro
nics
Int'l
(Sin
gapo
re)P
te.L
td.
Affi
liate
den
terp
rise
Sale
s6,
678,
035
81.5
775
days
--
1,00
5,84
546
.54
Del
taEl
ectro
-Opt
ics
(Wuj
iang
)Ltd
.D
elta
Elec
troni
csIn
tern
atio
nalL
td.
Affi
liate
den
terp
rise
Sale
s1,
514,
721
14.8
975
days
--
--
Del
taEl
ectro
-Opt
ics
(Wuj
iang
)Ltd
.D
elta
Elec
troni
cs(S
hang
hai)
Co.
,Ltd
.A
ffilia
ted
ente
rpris
eSa
les
5,96
8,19
958
.65
75da
ys-
-1,
033,
405
68.9
6
Del
taEl
ectro
-Opt
ics
(Wuj
iang
)Ltd
.D
elta
Elec
troni
csC
ompo
nent
s(W
ujia
ng)
Ltd.
Affi
liate
den
terp
rise
Sale
s17
3,68
71.
7175
days
--
431,
595
28.8
0
Del
taEl
ectro
-Opt
ics
(Wuj
iang
)Ltd
.D
elta
Elec
troni
csIn
t'l(S
inga
pore
)Pte
.Ltd
.A
ffilia
ted
ente
rpris
eSa
les
2,49
3,59
024
.50
75da
ys-
-19
,430
1.30
Del
taV
ideo
Disp
lay
Syste
m(W
ujia
ng)L
td.
Del
taEl
ectro
nics
Inte
rnat
iona
lLtd
.A
ffilia
ted
ente
rpris
eSa
les
3,67
8,70
044
.19
75da
ys-
-28
,410
2.16
Not
es/a
ccou
ntsr
ecei
vabl
e(p
ayab
le)
Not
ePu
rcha
ser/s
elle
rC
ount
erpa
rty
Rel
atio
nshi
pw
ithth
eco
unte
rpar
ty
Tran
sact
ion
Diff
eren
cesi
ntra
nsac
tion
term
com
pare
dto
third
party
trans
actio
ns

109
Purc
hase
s(s
ales
)(N
ote
a)A
mou
nt
Perc
enta
geof
tota
lpur
chas
es(s
ales
)C
redi
tter
ms
Uni
tpric
eC
redi
tter
ms
Bal
ance
Perc
enta
geof
tota
lno
tes/a
ccou
nts
rece
ivab
le(p
ayab
le)
Del
taV
ideo
Disp
lay
Syste
m(W
ujia
ng)L
td.
Del
taEl
ectro
nics
(Sha
ngha
i)C
o.,L
td.
Affi
liate
den
terp
rise
Sale
s$
1,63
6,71
019
.66
75da
ys$
--
$68
6,02
952
.09
Del
taV
ideo
Disp
lay
Syste
m(W
ujia
ng)L
td.
Del
taEl
ectro
nics
(Wuj
iang
)Tra
ding
Co.
,Lt
d.
Affi
liate
den
terp
rise
Sale
s53
9,43
86.
4875
days
--
27,7
012.
10
Del
taV
ideo
Disp
lay
Syste
m(W
ujia
ng)L
td.
Del
taEl
ectro
nics
Int'l
(Sin
gapo
re)P
te.L
td.
Affi
liate
den
terp
rise
Sale
s2,
180,
029
26.1
875
days
--
539,
683
40.9
8
Del
taEl
ectro
nics
(Wuj
iang
)Tra
ding
Co.
,Ltd
.
Del
taG
reen
tech
(Chi
na)
Co.
,Ltd
.A
ffilia
ted
ente
rpris
eSa
les
251,
397
27.6
375
days
--
250.
13
Del
taEl
ectro
nics
(Wuh
u)C
o.,L
td.
Del
taEl
ectro
nics
Int'l
(Sin
gapo
re)P
te.L
td.
Affi
liate
den
terp
rise
Sale
s5,
559,
122
76.8
075
days
--
1,28
1,96
295
.24
Del
taEl
ectro
nics
(Wuh
u)C
o.,L
td.
Del
taEl
ectro
nics
Inte
rnat
iona
lLtd
.A
ffilia
ted
ente
rpris
eSa
les
1,67
9,07
423
.20
75da
ys-
-64
,035
4.76
Wuh
uD
elta
Tech
nolo
gyC
o.,L
td.
Del
taEl
ectro
nics
(Wuh
u)C
o.,L
td.
Affi
liate
den
terp
rise
Sale
s42
7,87
964
.56
75da
ys-
-83
,000
75.4
3
Del
taEl
ectro
nics
(Che
nzho
u)C
o.,L
td.
Del
taEl
ectro
nics
Int’l
(Sin
gapo
re)P
te.L
td.
Affi
liate
den
terp
rise
Sale
s6,
042,
932
98.9
375
days
--
947,
826
99.8
8
Che
nzho
uD
elta
Tech
nolo
gyC
o.Lt
d.D
elta
Elec
troni
csPo
wer
(Don
ggua
n)C
o.,L
td.
Affi
liate
den
terp
rise
Sale
s70
1,39
320
.56
75da
ys-
-27
8,70
530
.74
Che
nzho
uD
elta
Tech
nolo
gyC
o.Lt
d.D
elta
Elec
troni
cs(C
henz
hou)
Co.
,Ltd
.A
ffilia
ted
ente
rpris
eSa
les
2,58
6,34
075
.81
75da
ys-
-61
0,51
667
.33
Del
taEl
ectro
nics
(Sha
ngha
i)C
o.,L
td.
Del
taG
reen
tech
(Chi
na)
Co.
,Ltd
.A
ffilia
ted
ente
rpris
eSa
les
10,2
70,6
8359
.76
75da
ys-
-3,
058,
708
58.1
1
Not
es/a
ccou
ntsr
ecei
vabl
e(p
ayab
le)
Not
ePu
rcha
ser/s
elle
rC
ount
erpa
rty
Rel
atio
nshi
pw
ithth
eco
unte
rpar
ty
Tran
sact
ion
Diff
eren
cesi
ntra
nsac
tion
term
com
pare
dto
third
party
trans
actio
ns

117
110
Not
ea:
Incl
udin
gth
ese
rvic
ein
com
ein
exce
ssof
$100
,000
.
Not
eb:
Selli
ngpr
ice
isba
sed
onm
ater
ials
cost
plus
adm
inist
ratio
nfe
esan
dre
late
dco
sts.T
heco
llect
ion
term
tore
late
dpa
rties
is60
~90
days
afte
rdel
iver
yan
dto
third
parti
esis
rece
ipti
nad
vanc
eor
30~1
20da
ysaf
ter
deliv
ery.
Not
ec:
Selli
ngpr
ice
isba
sed
onm
ater
ials
cost
plus
adm
inis
tratio
nfe
esan
dre
late
dco
sts.
The
cred
itte
rmto
rela
ted
parti
esis
60~9
0da
ys,w
hile
30~1
20da
ysfo
rthe
third
parti
es.
Purc
hase
s(s
ales
)(N
otea
)A
mou
nt
Perc
enta
geof
tota
lpur
chas
es(s
ales
)Cr
edit
term
sU
nitp
rice
Cred
itte
rms
Bala
nce
Perc
enta
geof
tota
lno
tes/a
ccou
nts
rece
ivab
le(p
ayab
le)
PreO
ptix
(Jia
ngSu
)Co
.Ltd
.D
elta
Elec
troni
csIn
t’l(S
inga
pore
)Pte
.Ltd
.A
ffilia
ted
ente
rpris
eSa
les
$57
2,36
50.
9975
days
$-
-$
48,7
200.
96
Del
taEl
ectro
nics
(Jap
an),
Inc.
Del
taEl
ectro
nics
Int’l
(Sin
gapo
re)P
te.L
td.
Affi
liate
den
terp
rise
Sale
s59
6,21
112
.24
75da
ys-
-14
0,49
520
.85
Cynt
ecCo
.,Lt
d.Cy
ntec
Inte
rnat
iona
lLtd
.A
ffilia
ted
ente
rpris
eSa
les
2,06
2,95
657
.44
(Not
eb)
(Not
eb)
(Not
eb)
198,
533
33.7
0
Cynt
ecCo
.,Lt
d.D
EILo
gisti
cs(U
SA)
Corp
.A
ffilia
ted
ente
rpris
eSa
les
196,
747
5.48
75da
ys-
-52
,927
8.98
Cynt
ec(S
uzho
u)Co
.Lt
dCy
ntec
Inte
rnat
iona
lLtd
.A
ffilia
ted
ente
rpris
eSa
les
2,77
8,45
610
0.00
(Not
ec)
(Not
ec)
(Not
ec)
510,
785
100.
00
Cynt
ecEl
ectro
nics
(Suz
hou)
Co.,
Ltd.
Cynt
ecIn
tern
atio
nalL
td.
Affi
liate
den
terp
rise
Sale
s5,
321,
911
99.7
6(N
otec
)(N
otec
)(N
otec
)76
4,18
499
.91
Cynt
ecIn
tern
atio
nal
Ltd.
Cynt
ecCo
.,Lt
d.A
ffilia
ted
ente
rpris
eSa
les
740,
004
5.02
(Not
ec)
(Not
ec)
(Not
ec)
136,
808
2.49
Cynt
ecIn
tern
atio
nal
Ltd.
Del
taEl
ectro
nics
Int’l
(Sin
gapo
re)P
te.L
td.
Affi
liate
den
terp
rise
Sale
s48
3,26
12.
9875
days
--
141,
335
2.57
Purc
hase
r/sel
ler
Coun
terp
arty
Rela
tions
hip
with
the
coun
terp
arty
Tran
sact
ion
Diff
eren
cesi
ntra
nsac
tion
term
com
pare
dto
third
party
trans
actio
nsN
otes
/acc
ount
srec
eiva
ble(
paya
ble)
Not
e

111
H.
Rec
eiva
bles
from
rela
ted
parti
esre
achi
ng$1
00m
illio
nor
20%
ofpa
id-in
capi
talo
rmor
e:
Am
ount
Act
ion
take
n
Del
taEl
ectro
nics
Inc.
Del
taG
reen
tech
(Chi
na)C
o.,L
td.
Subs
idia
ry$
111,
087
3.96
$-
-$
56,3
16$
-
Del
taEl
ectro
nics
Inc.
Del
taEl
ectro
nics
Int'l
(Sin
gapo
re)P
te.
Ltd.
Subs
idia
ry1,
754,
633
5.89
--
1,75
4,63
3-
Del
taEl
ectro
nics
Inte
rnat
iona
lLtd
.D
EILo
gisti
cs(U
SA)C
orp.
Affi
liate
den
terp
rise
2,57
0,33
44.
3722
5,48
4-
2,54
9,62
5-
Del
taEl
ectro
nics
Int'l
(Sin
gapo
re)P
te.
Ltd.
Del
taEl
ectro
nics
Inte
rnat
iona
lLtd
.A
ffilia
ted
ente
rpris
e37
5,64
27.
86-
-35
8,68
6-
Del
taEl
ectro
nics
Int'l
(Sin
gapo
re)P
te.
Ltd.
Del
taEl
ectro
nics
(Don
ggua
n)C
o.,
Ltd.
Affi
liate
den
terp
rise
1,85
7,45
14.
46-
-1,
857,
451
-
Del
taEl
ectro
nics
Int'l
(Sin
gapo
re)P
te.
Ltd.
Del
taEl
ectro
nics
Pow
er(D
ongg
uan)
Co.
,Ltd
.A
ffilia
ted
ente
rpris
e5,
054,
974
4.05
--
5,05
4,97
4-
Del
taEl
ectro
nics
Int'l
(Sin
gapo
re)P
te.
Ltd.
Del
taEl
ectro
nics
(Jia
ngsu
)Ltd
.A
ffilia
ted
ente
rpris
e1,
701,
454
9.26
--
1,70
1,45
4-
Del
taEl
ectro
nics
Int'l
(Sin
gapo
re)P
te.
Ltd.
Del
taEl
ectro
nics
Com
pone
nts
(Wuj
iang
)Ltd
.A
ffilia
ted
ente
rpris
e95
9,90
87.
46-
-95
9,90
8-
Del
taEl
ectro
nics
Int'l
(Sin
gapo
re)P
te.
Ltd.
Del
taV
ideo
Disp
lay
Syste
m(W
ujia
ng)L
td.
Affi
liate
den
terp
rise
846,
636
6.62
--
846,
636
-
Del
taEl
ectro
nics
Int'l
(Sin
gapo
re)P
te.
Ltd.
Del
taEl
ectro
nics
(Che
nzho
u)C
o.,L
td.
Affi
liate
den
terp
rise
499,
860
4.24
--
499,
860
-
Am
ount
colle
cted
subs
eque
ntto
the
bala
nce
date
(Not
eb)
Allo
wan
cefo
rdo
ubtfu
lacc
ount
sC
redi
tor
Cou
nter
party
Rel
atio
nshi
pw
ithth
eco
unte
rpar
ty
Bal
ance
asat
Dec
embe
r31,
2014
(Not
ea)
Turn
over
rate
Ove
rdue
rece
ivab
les

119
112
Am
ount
Act
ion
take
n
Del
taEl
ectro
nics
Int'l
(Sin
gapo
re)P
te.
Ltd.
Che
nzho
uD
elta
Tech
nolo
gyC
o.Lt
d.A
ffilia
ted
ente
rpris
e$
132,
266
6.46
$-
-$
88,6
20-
Del
taEl
ectro
nics
Int'l
(Sin
gapo
re)P
te.
Ltd.
Del
taEl
ectro
nics
(Wuh
u)C
o.,L
td.
Affi
liate
den
terp
rise
543,
604
6.45
--
543,
604
-
Del
taEl
ectro
nics
Int'l
(Sin
gapo
re)P
te.
Ltd.
Del
taEl
ectro
nics
(Jap
an),
Inc.
Affi
liate
den
terp
rise
564,
295
4.39
--
376,
161
-
Del
taEl
ectro
nics
Int'l
(Sin
gapo
re)P
te.
Ltd.
DEI
Logi
stics
(USA
)Cor
p.A
ffilia
ted
ente
rpris
e2,
728,
493
2.00
--
618,
170
-
Del
taEl
ectro
nics
Int'l
(Sin
gapo
re)P
te.
Ltd.
Viv
itek
Cor
pora
tion
Affi
liate
den
terp
rise
119,
607
4.16
--
72,2
35-
Del
taEl
ectro
nics
Int'l
(Sin
gapo
re)P
te.
Ltd.
Del
taN
etw
orks
Inte
rnat
iona
lLtd
.A
ffilia
ted
ente
rpris
e42
5,80
83.
91-
-42
5,80
8-
Del
taEl
ectro
nics
Int'l
(Sin
gapo
re)P
te.
Ltd.
Del
taEl
ectro
nics
Inc.
Ulti
mat
epa
rent
com
pany
8,08
6,26
52.
86-
-3,
915,
474
-
Del
taEl
ectro
nics
Int'l
(Sin
gapo
re)P
te.
Ltd.
Del
troni
cs(N
ethe
rland
s)B
.V.
Affi
liate
den
terp
rise
225,
047
6.82
--
185,
730
-
Del
taEl
ectro
nics
Int'l
(Sin
gapo
re)P
te.
Ltd.
Del
taG
reen
tech
(Bra
sil)S
.A.
Ass
ocia
te17
8,60
12.
17-
-83
,997
-
Del
taEl
ectro
nics
Int'l
(Sin
gapo
re)P
te.
Ltd.
Del
taG
reen
tech
(USA
)Cor
pora
tion
Ass
ocia
te17
2,84
25.
07-
-67
,416
-
Del
taEl
ectro
nics
Int'l
(Sin
gapo
re)P
te.
Ltd.
Del
taIn
dia
Elec
troni
csPv
t.Lt
d.A
ssoc
iate
127,
429
4.65
--
73,3
01-
Del
taEl
ectro
nics
Int'l
(Sin
gapo
re)P
te.
Ltd.
Del
taPr
oduc
tsC
orpo
ratio
nR
elat
edpa
rtyin
subs
tanc
e27
0,57
14.
42-
-16
5,19
7-
Del
taEl
ectro
nics
Int'l
(Sin
gapo
re)P
te.
Ltd.
Dig
italP
roje
ctio
nLt
d.A
ssoc
iate
197,
750
3.57
--
112,
483
-
Del
taN
etw
orks
Inte
rnat
iona
lLtd
.D
elta
Net
wor
ks(D
ongg
uan)
Ltd.
Affi
liate
den
terp
rise
4,98
7,85
23.
87-
-4,
108,
170
-
Ove
rdue
rece
ivab
les
Am
ount
colle
cted
subs
eque
ntto
the
bala
nce
date
(Not
eb)
Allo
wan
cefo
rdo
ubtfu
lacc
ount
sC
redi
tor
Cou
nter
party
Rel
atio
nshi
pw
ithth
eco
unte
rpar
ty
Bal
ance
asat
Dec
embe
r31,
2014
(Not
ea)
Turn
over
rate

113
Am
ount
Act
ion
take
n
Del
taN
etw
orks
Inte
rnat
iona
lLtd
.D
NIL
ogist
ics(
USA
)Cor
p.A
ffilia
ted
ente
rpris
e$
3,51
0,29
33.
03$
--
$1,
937,
043
-
Del
taN
etw
orks
Inte
rnat
iona
lLtd
.D
elta
Net
wor
ks,I
nc.(
Taiw
an)
Affi
liate
den
terp
rise
120,
301
4.84
--
120,
071
-
Del
taN
etw
orks
(Don
ggua
n)Lt
d.D
elta
Net
wor
ksIn
tern
atio
nalL
td.
Affi
liate
den
terp
rise
5,23
1,50
84.
23-
-4,
039,
054
-
Del
taN
etw
orks
,Inc
.(Ta
iwan
)D
elta
Net
wor
ksIn
tern
atio
nalL
td.
Affi
liate
den
terp
rise
251,
200
5.15
--
183,
441
-
Del
taN
etw
orks
,Inc
.(Ta
iwan
)D
NIL
ogist
ics(
USA
)Cor
p.A
ffilia
ted
ente
rpris
e35
5,18
14.
07-
-17
2,33
9-
Del
taEl
ectro
nics
(Don
ggua
n)C
o.,
Ltd.
Del
taEl
ectro
nics
Int'l
(Sin
gapo
re)P
te.
Ltd.
Affi
liate
den
terp
rise
2,12
4,40
04.
36-
-1,
827,
087
-
Del
taEl
ectro
nics
(Don
ggua
n)C
o.,
Ltd.
Del
taEl
ectro
nics
(Sha
ngha
i)C
o.,L
td.
Affi
liate
den
terp
rise
219,
198
4.25
--
146,
070
-
Del
taEl
ectro
nics
Pow
er(D
ongg
uan)
Co.
,Ltd
.D
elta
Elec
troni
csIn
tern
atio
nalL
td.
Affi
liate
den
terp
rise
683,
488
5.10
--
683,
488
-
Del
taEl
ectro
nics
Pow
er(D
ongg
uan)
Co.
,Ltd
.D
elta
Elec
troni
csIn
t'l(S
inga
pore
)Pte
.Lt
d.A
ffilia
ted
ente
rpris
e5,
033,
049
4.36
--
2,75
6,93
6-
Del
taEl
ectro
nics
Pow
er(D
ongg
uan)
Co.
,Ltd
.D
elta
Elec
troni
cs(S
hang
hai)
Co.
,Ltd
.A
ffilia
ted
ente
rpris
e45
6,09
13.
92-
-19
,396
-
Del
taEl
ectro
nics
(Jia
ngsu
)Ltd
.D
elta
Elec
troni
cs(S
hang
hai)
Co.
,Ltd
.A
ffilia
ted
ente
rpris
e1,
369,
010
4.44
--
857,
104
-
Del
taEl
ectro
nics
(Jia
ngsu
)Ltd
.D
elta
Elec
troni
csIn
t'l(S
inga
pore
)Pte
.Lt
d.A
ffilia
ted
ente
rpris
e3,
283,
924
10.3
9-
-3,
283,
924
-
Ove
rdue
rece
ivab
les
Am
ount
colle
cted
subs
eque
ntto
the
bala
nce
date
(Not
eb)
Allo
wan
cefo
rdo
ubtfu
lacc
ount
sC
redi
tor
Cou
nter
party
Rel
atio
nshi
pw
ithth
eco
unte
rpar
ty
Bal
ance
asat
Dec
embe
r31,
2014
(Not
ea)
Turn
over
rate

121
114
Am
ount
Act
ion
take
n
Del
taEl
ectro
nics
Com
pone
nts
(Wuj
iang
)Ltd
.D
elta
Elec
troni
cs(S
hang
hai)
Co.
,Ltd
.A
ffilia
ted
ente
rpris
e$
999,
278
4.36
$-
-$
647,
582
-
Del
taEl
ectro
nics
Com
pone
nts
(Wuj
iang
)Ltd
.D
elta
Elec
troni
csIn
t'l(S
inga
pore
)Pte
.Lt
d.A
ffilia
ted
ente
rpris
e1,
005,
845
9.13
--
1,00
5,84
5-
Del
taEl
ectro
-Opt
ics(
Wuj
iang
)Ltd
.D
elta
Elec
troni
cs(S
hang
hai)
Co.
,Ltd
.A
ffilia
ted
ente
rpris
e1,
033,
405
4.26
--
1,00
7,17
2-
Del
taEl
ectro
-Opt
ics(
Wuj
iang
)Ltd
.D
elta
Elec
troni
csC
ompo
nent
s(W
ujia
ng)L
td.
Affi
liate
den
terp
rise
431,
595
0.83
--
14,4
68-
Del
taV
ideo
Disp
lay
Syste
m(W
ujia
ng)L
td.
Del
taEl
ectro
nics
(Sha
ngha
i)C
o.,L
td.
Affi
liate
den
terp
rise
686,
029
3.85
--
457,
735
-
Del
taV
ideo
Disp
lay
Syste
m(W
ujia
ng)L
td.
Del
taEl
ectro
nics
Int'l
(Sin
gapo
re)P
te.
Ltd.
Affi
liate
den
terp
rise
539,
683
8.38
--
539,
683
-
Del
taEl
ectro
nics
(Wuh
u)C
o.,L
td.
Del
taEl
ectro
nics
Int'l
(Sin
gapo
re)P
te.
Ltd.
Affi
liate
den
terp
rise
1,28
1,96
25.
46-
-1,
281,
962
-
Del
taEl
ectro
nics
(Che
nzho
u)C
o.,L
td.
Del
taEl
ectro
nics
Int'l
(Sin
gapo
re)P
te.
Ltd.
Affi
liate
den
terp
rise
947,
826
6.66
--
947,
826
-
Che
nzho
uD
elta
Tech
nolo
gyC
o.Lt
d.D
elta
Elec
troni
csPo
wer
(Don
ggua
n)C
o.,L
td.
Affi
liate
den
terp
rise
278,
705
5.22
--
--
Che
nzho
uD
elta
Tech
nolo
gyC
o.Lt
d.D
elta
Elec
troni
cs(C
henz
hou)
Co.
,Ltd
.A
ffilia
ted
ente
rpris
e61
0,51
64.
71-
-37
7,39
0-
Ove
rdue
rece
ivab
les
Am
ount
colle
cted
subs
eque
ntto
the
bala
nce
date
(Not
eb)
Allo
wan
cefo
rdo
ubtfu
lacc
ount
sC
redi
tor
Cou
nter
party
Rel
atio
nshi
pw
ithth
eco
unte
rpar
ty
Bal
ance
asat
Dec
embe
r31,
2014
(Not
ea)
Turn
over
rate

115
Not
ea:
Incl
udin
got
herr
ecei
vabl
ein
exce
ssof
$100
,000
.
Not
eb:
The
amou
ntre
pres
ents
colle
ctio
nssu
bseq
uent
toD
ecem
ber3
1,20
14up
toM
arch
10,2
015.
I.D
eriv
ativ
efin
anci
alin
strum
ents
unde
rtake
ndu
ring
the
year
ende
dD
ecem
ber3
1,20
14:s
eeN
otes
6(2)
,6(5
),6(
15)a
nd12
(2).
Am
ount
Act
ion
take
n
Del
taEl
ectro
nics
(Sha
ngha
i)Co
.,Lt
d.D
elta
Gre
ente
ch(C
hina
)Co.
,Ltd
.A
ffilia
ted
ente
rpris
e$
3,05
8,70
83.
91$
--
$1,
899,
842
-
Del
taEl
ectro
nics
(Jap
an),
Inc.
Del
taEl
ectro
nics
Int'l
(Sin
gapo
re)P
te.
Ltd.
Affi
liate
den
terp
rise
140,
495
4.07
--
42,8
58-
Cynt
ecCo
.,Lt
d.Cy
ntec
Inte
rnat
iona
lLtd
.A
ffilia
ted
ente
rpris
e19
8,53
39.
22-
-19
8,53
3-
Cynt
ec(S
uzho
u)Co
.Ltd
.Cy
ntec
Inte
rnat
iona
lLtd
.A
ffilia
ted
ente
rpris
e51
0,78
58.
57-
-51
0,78
5-
Cynt
ecEl
ectro
nics
(Suz
hou)
Co.,
Ltd.
Cynt
ecIn
tern
atio
nalL
td.
Affi
liate
den
terp
rise
764,
184
10.4
8-
-76
4,18
4-
Cynt
ecIn
tern
atio
nalL
td.
Cynt
ecCo
.,Lt
d.A
ffilia
ted
ente
rpris
e13
6,80
83.
53-
-13
6,80
8-
Cynt
ecIn
tern
atio
nalL
td.
Del
taEl
ectro
nics
Int'l
(Sin
gapo
re)P
te.
Ltd.
Affi
liate
den
terp
rise
141,
335
4.52
--
83,7
38-
Cred
itor
Coun
terp
arty
Rela
tions
hip
with
the
coun
terp
arty
Bala
ncea
sat
Dec
embe
r31,
2014
(Not
ea)
Turn
over
rate
Ove
rdue
rece
ivab
les
Am
ount
colle
cted
subs
eque
ntto
the
bala
nced
ate(
Not
eb)
Allo
wan
cefo
rdo
ubtfu
lacc
ount
s

123
116
J.Si
gnifi
cant
inte
r-com
pany
trans
actio
nsdu
ring
the
year
ende
dD
ecem
ber3
1,20
14:
Gen
eral
ledg
erac
coun
t
Am
ount
(Not
eh)
Tran
sact
ion
term
s
Perc
enta
geof
cons
olid
ated
tota
lop
erat
ing
reve
nue
orto
tala
sset
s(N
ote
c)0
Del
taEl
ectro
nics
Inc.
Del
taEl
ectro
nics
Inte
rnat
iona
lLtd
.1
Sale
s1,
522,
424
$(N
ote
d)0.
800
Del
taEl
ectro
nics
Inc.
Del
taEl
ectro
-Opt
ics(
Wuj
iang
)Ltd
.1
Sale
s20
0,43
5(N
ote
d)0.
110
Del
taEl
ectro
nics
Inc.
DEI
Logi
stics
(USA
)Cor
p.1
Sale
s24
3,50
7(N
ote
d)0.
130
Del
taEl
ectro
nics
Inc.
Del
taG
reen
tech
(Chi
na)C
o.,L
td.
1Sa
les
252,
341
(Not
ed)
0.13
0D
elta
Elec
troni
csIn
c.C
ynte
c(S
uzho
u)C
o.Lt
d.1
Sale
s10
5,61
7(N
ote
d)0.
060
Del
taEl
ectro
nics
Inc.
Del
taEl
ectro
nics
Int'l
(Sin
gapo
re)P
te.L
td.
1Sa
les
6,76
5,15
6(N
ote
d)3.
551
Del
taEl
ectro
nics
Inte
rnat
iona
lLtd
.D
elta
Elec
troni
cs(J
apan
),In
c.3
Sale
s49
9,03
0(N
ote
d)0.
261
Del
taEl
ectro
nics
Inte
rnat
iona
lLtd
.D
EILo
gisti
cs(U
SA)C
orp.
3Sa
les
14,7
82,1
30(N
ote
d)7.
751
Del
taEl
ectro
nics
Inte
rnat
iona
lLtd
.V
ivite
kC
orpo
ratio
n3
Sale
s39
0,98
2(N
ote
d)0.
211
Del
taEl
ectro
nics
Inte
rnat
iona
lLtd
.D
elta
Elec
troni
csIn
c.2
Sale
s15
4,13
7(N
ote
d)0.
081
Del
taEl
ectro
nics
Inte
rnat
iona
lLtd
.D
eltro
nics
(Net
herla
nds)
B.V
.3
Sale
s14
0,16
1(N
ote
d)0.
071
Del
taEl
ectro
nics
Inte
rnat
iona
lLtd
.D
elta
Elec
troni
csIn
t'l(S
inga
pore
)Pte
.Ltd
.3
Sale
s31
0,50
0(N
ote
d)0.
162
Del
taEl
ectro
nics
Int'l
(Sin
gapo
re)P
te.L
td.
Del
taEl
ectro
nics
Inte
rnat
iona
lLtd
.3
Sale
s2,
398,
348
(Not
ed)
1.26
2D
elta
Elec
troni
csIn
t'l(S
inga
pore
)Pte
.Ltd
.D
elta
Elec
troni
cs(D
ongg
uan)
Co.
,Ltd
.3
Sale
s8,
229,
621
(Not
ed)
4.32
2D
elta
Elec
troni
csIn
t'l(S
inga
pore
)Pte
.Ltd
.D
elta
Elec
troni
csPo
wer
(Don
ggua
n)C
o.,L
td.
3Sa
les
20,0
08,5
61(N
ote
d)10
.50
2D
elta
Elec
troni
csIn
t'l(S
inga
pore
)Pte
.Ltd
.D
elta
Elec
troni
cs(J
iang
su)L
td.
3Sa
les
16,9
58,4
01(N
ote
d)8.
902
Del
taEl
ectro
nics
Int'l
(Sin
gapo
re)P
te.L
td.
Del
taEl
ectro
nics
Com
pone
nts(
Wuj
iang
)Ltd
.3
Sale
s4,
802,
320
(Not
ed)
2.52
2D
elta
Elec
troni
csIn
t'l(S
inga
pore
)Pte
.Ltd
.D
elta
Elec
tro-O
ptic
s(W
ujia
ng)L
td.
3Sa
les
4,13
3,44
1(N
ote
d)2.
172
Del
taEl
ectro
nics
Int'l
(Sin
gapo
re)P
te.L
td.
Del
taV
ideo
Disp
lay
Syste
m(W
ujia
ng)L
td.
3Sa
les
5,73
7,36
0(N
ote
d)3.
012
Del
taEl
ectro
nics
Int'l
(Sin
gapo
re)P
te.L
td.
Del
taEl
ectro
nics
(Che
nzho
u)C
o.,L
td.
3Sa
les
1,68
5,99
8(N
ote
d)0.
882
Del
taEl
ectro
nics
Int'l
(Sin
gapo
re)P
te.L
td.
Che
nzho
uD
elta
Tech
nolo
gyC
o.Lt
d.3
Sale
s59
2,26
8(N
ote
d)0.
312
Del
taEl
ectro
nics
Int'l
(Sin
gapo
re)P
te.L
td.
Del
taEl
ectro
nics
(Wuh
u)C
o.,L
td.
3Sa
les
3,55
4,71
2(N
ote
d)1.
862
Del
taEl
ectro
nics
Int'l
(Sin
gapo
re)P
te.L
td.
Wuh
uD
elta
Tech
nolo
gyC
o.,L
td.
3Sa
les
170,
849
(Not
ed)
0.09
2D
elta
Elec
troni
csIn
t'l(S
inga
pore
)Pte
.Ltd
.D
elta
Elec
troni
cs(J
apan
),In
c.3
Sale
s1,
804,
518
(Not
ed)
0.95
2D
elta
Elec
troni
csIn
t'l(S
inga
pore
)Pte
.Ltd
.D
elta
Elec
troni
cs(K
orea
),In
c.3
Sale
s15
0,19
8(N
ote
d)0.
082
Del
taEl
ectro
nics
Int'l
(Sin
gapo
re)P
te.L
td.
DEI
Logi
stics
(USA
)Cor
p.3
Sale
s2,
607,
817
(Not
ed)
1.37
2D
elta
Elec
troni
csIn
t'l(S
inga
pore
)Pte
.Ltd
.Pr
eOpt
ix(J
iang
Su)C
o.Lt
d.3
Sale
s17
9,66
6(N
ote
d)0.
092
Del
taEl
ectro
nics
Int'l
(Sin
gapo
re)P
te.L
td.
Viv
itek
Cor
pora
tion
3Sa
les
238,
022
(Not
ed)
0.12
2D
elta
Elec
troni
csIn
t'l(S
inga
pore
)Pte
.Ltd
.D
elta
Net
wor
ksIn
tern
atio
nalL
td.
3Sa
les
1,23
4,93
0(N
ote
d)0.
652
Del
taEl
ectro
nics
Int'l
(Sin
gapo
re)P
te.L
td.
Del
taEl
ectro
nics
Inc.
2Sa
les
23,5
69,5
39(N
ote
d)12
.36
2D
elta
Elec
troni
csIn
t'l(S
inga
pore
)Pte
.Ltd
.D
eltro
nics
(Net
herla
nds)
B.V
.3
Sale
s93
7,77
1(N
ote
d)0.
492
Del
taEl
ectro
nics
Int'l
(Sin
gapo
re)P
te.L
td.
Dig
italP
roje
ctio
nLt
d.3
Sale
s33
7,67
2(N
ote
d)0.
183
Del
taN
etw
orks
Inte
rnat
iona
lLtd
.D
elta
Net
wor
ks(D
ongg
uan)
Ltd.
3Sa
les
17,8
38,7
98(N
ote
d)9.
363
Del
taN
etw
orks
Inte
rnat
iona
lLtd
.D
NIL
ogist
ics(
USA
)Cor
p.3
Sale
s9,
873,
057
(Not
ed)
5.18
Num
ber
(Not
ea)
Com
pany
nam
eC
ount
erpa
rtyR
elat
ions
hip
(Not
eb)
Tran
sact
ion

117
Gen
eral
ledg
erac
coun
t
Am
ount
(Not
eh)
Tran
sact
ion
term
s
Perc
enta
geof
cons
olid
ated
tota
lop
erat
ing
reve
nue
orto
tala
sset
s(N
ote
c)3
Del
taN
etw
orks
Inte
rnat
iona
lLtd
.A
yeco
mTe
chno
logy
Co.
,Ltd
.3
Sale
s27
5,55
9$
(Not
ed)
0.14
3D
elta
Net
wor
ksIn
tern
atio
nalL
td.
Del
taN
etw
orks
,Inc
.(Ta
iwan
)3
Sale
s56
2,26
8(N
ote
d)0.
294
Del
taN
etw
orks
(Don
ggua
n)Lt
d.D
elta
Net
wor
ksIn
tern
atio
nalL
td.
3Sa
les
17,7
44,3
40(N
ote
d)9.
315
Del
taN
etw
orks
,Inc
.(Ta
iwan
)D
elta
Net
wor
ksIn
tern
atio
nalL
td.
3Sa
les
1,31
2,53
9(N
ote
d)0.
695
Del
taN
etw
orks
,Inc
.(Ta
iwan
)D
NIL
ogist
ics(
USA
)Cor
p.3
Sale
s1,
145,
962
(Not
ed)
0.60
6D
elta
Elec
troni
cs(D
ongg
uan)
Co.
,Ltd
.D
elta
Elec
troni
csIn
tern
atio
nalL
td.
3Sa
les
469,
273
(Not
ed)
0.25
6D
elta
Elec
troni
cs(D
ongg
uan)
Co.
,Ltd
.D
elta
Elec
troni
csIn
t'l(S
inga
pore
)Pte
.Ltd
.3
Sale
s9,
084,
945
(Not
ed)
4.77
6D
elta
Elec
troni
cs(D
ongg
uan)
Co.
,Ltd
.D
elta
Elec
troni
cs(S
hang
hai)
Co.
,Ltd
.3
Sale
s71
1,21
9(N
ote
d)0.
377
Del
taEl
ectro
nics
Pow
er(D
ongg
uan)
Co.
,Ltd
.D
elta
Elec
troni
csIn
tern
atio
nalL
td.
3Sa
les
5,90
0,41
3(N
ote
d)3.
107
Del
taEl
ectro
nics
Pow
er(D
ongg
uan)
Co.
,Ltd
.D
elta
Elec
troni
csIn
t'l(S
inga
pore
)Pte
.Ltd
.3
Sale
s19
,056
,881
(Not
ed)
10.0
07
Del
taEl
ectro
nics
Pow
er(D
ongg
uan)
Co.
,Ltd
.D
elta
Elec
troni
cs(S
hang
hai)
Co.
,Ltd
.3
Sale
s1,
263,
510
(Not
ed)
0.66
7D
elta
Elec
troni
csPo
wer
(Don
ggua
n)C
o.,L
td.
Del
taN
etw
orks
(Don
ggua
n)Lt
d.3
Sale
s20
7,34
2(N
ote
d)0.
118
Del
taEl
ectro
nics
(Jia
ngsu
)Ltd
.D
elta
Elec
troni
csIn
tern
atio
nalL
td.
3Sa
les
3,68
9,16
4(N
ote
d)1.
948
Del
taEl
ectro
nics
(Jia
ngsu
)Ltd
.D
elta
Elec
troni
cs(S
hang
hai)
Co.
,Ltd
.3
Sale
s3,
255,
952
(Not
ed)
1.71
8D
elta
Elec
troni
cs(J
iang
su)L
td.
Del
taEl
ectro
nics
(Wuj
iang
)Tra
ding
Co.
,Ltd
.3
Sale
s25
0,12
4(N
ote
d)0.
138
Del
taEl
ectro
nics
(Jia
ngsu
)Ltd
.D
elta
Elec
troni
csIn
t'l(S
inga
pore
)Pte
.Ltd
.3
Sale
s31
,797
,117
(Not
ed)
16.6
89
Del
taEl
ectro
nics
Com
pone
nts(
Wuj
iang
)Ltd
.D
elta
Elec
troni
csIn
tern
atio
nalL
td.
3Sa
les
171,
035
(Not
ed)
0.09
9D
elta
Elec
troni
csC
ompo
nent
s(W
ujia
ng)L
td.
Del
taEl
ectro
nics
(Sha
ngha
i)C
o.,L
td.
3Sa
les
1,12
0,20
5(N
ote
d)0.
599
Del
taEl
ectro
nics
Com
pone
nts(
Wuj
iang
)Ltd
.D
elta
Elec
troni
csIn
t'l(S
inga
pore
)Pte
.Ltd
.3
Sale
s6,
678,
035
(Not
ed)
3.50
10D
elta
Elec
tro-O
ptic
s(W
ujia
ng)L
td.
Del
taEl
ectro
nics
Inte
rnat
iona
lLtd
.3
Sale
s1,
514,
721
(Not
ed)
0.79
10D
elta
Elec
tro-O
ptic
s(W
ujia
ng)L
td.
Del
taEl
ectro
nics
(Sha
ngha
i)C
o.,L
td.
3Sa
les
5,96
8,19
9(N
ote
d)3.
1310
Del
taEl
ectro
-Opt
ics(
Wuj
iang
)Ltd
.D
elta
Elec
troni
csC
ompo
nent
s(W
ujia
ng)L
td.
3Sa
les
173,
687
(Not
ed)
0.09
10D
elta
Elec
tro-O
ptic
s(W
ujia
ng)L
td.
Del
taEl
ectro
nics
Int'l
(Sin
gapo
re)P
te.L
td.
3Sa
les
2,49
3,59
0(N
ote
d)1.
3111
Del
taV
ideo
Disp
lay
Syste
m(W
ujia
ng)L
td.
Del
taEl
ectro
nics
Inte
rnat
iona
lLtd
.3
Sale
s3,
678,
700
(Not
ed)
1.93
11D
elta
Vid
eoD
ispla
ySy
stem
(Wuj
iang
)Ltd
.D
elta
Elec
troni
cs(S
hang
hai)
Co.
,Ltd
.3
Sale
s1,
636,
710
(Not
ed)
0.86
11D
elta
Vid
eoD
ispla
ySy
stem
(Wuj
iang
)Ltd
.D
elta
Elec
troni
cs(W
ujia
ng)T
radi
ngC
o.,L
td.
3Sa
les
539,
438
(Not
ee)
0.28
11D
elta
Vid
eoD
ispla
ySy
stem
(Wuj
iang
)Ltd
.D
elta
Elec
troni
csIn
t'l(S
inga
pore
)Pte
.Ltd
.3
Sale
s2,
180,
029
(Not
ee)
1.14
12D
elta
Elec
troni
cs(W
ujia
ng)T
radi
ngC
o.,L
td.
Del
taG
reen
tech
(Chi
na)C
o.,L
td.
3Sa
les
251,
397
(Not
ee)
0.13
13D
elta
Elec
troni
cs(W
uhu)
Co.
,Ltd
.D
elta
Elec
troni
csIn
t'l(S
inga
pore
)Pte
.Ltd
.3
Sale
s5,
559,
122
(Not
ee)
2.92
13D
elta
Elec
troni
cs(W
uhu)
Co.
,Ltd
.D
elta
Elec
troni
csIn
tern
atio
nalL
td.
3Sa
les
1,67
9,07
4(N
ote
e)0.
8814
Wuh
uD
elta
Tech
nolo
gyC
o.,L
td.
Del
taEl
ectro
nics
(Wuh
u)C
o.,L
td.
3Sa
les
427,
879
(Not
ed)
0.22
15D
elta
Elec
troni
cs(C
henz
hou)
Co.
,Ltd
.D
elta
Elec
troni
csIn
t’l(S
inga
pore
)Pte
.Ltd
.3
Sale
s6,
042,
932
(Not
ed)
3.17
16C
henz
hou
Del
taTe
chno
logy
Co.
Ltd.
Del
taEl
ectro
nics
Pow
er(D
ongg
uan)
Co.
,Ltd
.3
Sale
s70
1,39
3(N
ote
d)0.
3716
Che
nzho
uD
elta
Tech
nolo
gyC
o.Lt
d.D
elta
Elec
troni
cs(C
henz
hou)
Co.
,Ltd
.3
Sale
s2,
586,
340
(Not
ed)
1.36
17D
elta
Elec
troni
cs(S
hang
hai)
Co.
,Ltd
.D
elta
Gre
ente
ch(C
hina
)Co.
,Ltd
.3
Sale
s10
,270
,683
(Not
ed)
5.39
Num
ber
(Not
ea)
Com
pany
nam
eC
ount
erpa
rtyR
elat
ions
hip
(Not
eb)
Tran
sact
ion

125
118
Gen
eral
ledg
erac
coun
t
Am
ount
(Not
eh)
Tran
sact
ion
term
s
Perc
enta
geof
cons
olid
ated
tota
lop
erat
ing
reve
nue
orto
tala
sset
s(N
ote
c)18
PreO
ptix
(Jia
ngSu
)Co.
Ltd.
Del
taEl
ectro
nics
Int’l
(Sin
gapo
re)P
te.L
td.
3Sa
les
572,
365
$(N
ote
d)0.
3019
Del
taEl
ectro
nics
(Jap
an),
Inc.
Del
taEl
ectro
nics
Int’l
(Sin
gapo
re)P
te.L
td.
3Sa
les
596,
211
(Not
ed)
0.31
20C
ynte
cC
o.,L
td.
Cyn
tec
Inte
rnat
iona
lLtd
.3
Sale
s2,
062,
956
(Not
ed)
1.08
20C
ynte
cC
o.,L
td.
DEI
Logi
stics
(USA
)Cor
p.3
Sale
s19
6,74
7(N
ote
d)0.
1021
Cyn
tec
(Suz
hou)
Co.
Ltd
Cyn
tec
Inte
rnat
iona
lLtd
.3
Sale
s2,
778,
456
(Not
ed)
1.46
22C
ynte
cEl
ectro
nics
(Suz
hou)
Co.
,Ltd
.C
ynte
cIn
tern
atio
nalL
td.
3Sa
les
5,32
1,91
1(N
ote
d)2.
7923
Cyn
tec
Inte
rnat
iona
lLtd
.C
ynte
cC
o.,L
td.
3Sa
les
740,
004
(Not
ed)
0.39
23C
ynte
cIn
tern
atio
nalL
td.
Del
taEl
ectro
nics
Int’l
(Sin
gapo
re)P
te.L
td.
3Sa
les
483,
261
(Not
ed)
0.25
0D
elta
Elec
troni
csIn
c.D
elta
Gre
ente
sh(C
hina
)Co.
,Ltd
.1
Acc
ount
srec
eiva
ble
111,
087
(Not
ed)
0.05
0D
elta
Elec
troni
csIn
c.D
elta
Elec
troni
csIn
t'l(S
inga
pore
)Pte
.Ltd
.1
Acc
ount
srec
eiva
ble
and
othe
rrec
eiva
bles
1,75
4,63
3(N
ote
d)0.
80
1D
elta
Elec
troni
csIn
tern
atio
nalL
td.
DEI
Logi
stics
(USA
)Cor
p.3
Acc
ount
srec
eiva
ble
2,57
0,33
4(N
ote
d)1.
172
Del
taEl
ectro
nics
Int'l
(Sin
gapo
re)P
te.L
td.
Del
taEl
ectro
nics
Inte
rnat
iona
lLtd
.3
Acc
ount
srec
eiva
ble
375,
642
(Not
ed)
0.17
2D
elta
Elec
troni
csIn
t'l(S
inga
pore
)Pte
.Ltd
.D
elta
Elec
troni
cs(D
ongg
uan)
Co.
,Ltd
.3
Acc
ount
srec
eiva
ble
1,85
7,45
1(N
ote
d)0.
842
Del
taEl
ectro
nics
Int'l
(Sin
gapo
re)P
te.L
td.
Del
taEl
ectro
nics
Pow
er(D
ongg
uan)
Co.
,Ltd
.3
Acc
ount
srec
eiva
ble
5,05
4,97
4(N
ote
d)2.
292
Del
taEl
ectro
nics
Int'l
(Sin
gapo
re)P
te.L
td.
Del
taEl
ectro
nics
(Jia
ngsu
)Ltd
.3
Acc
ount
srec
eiva
ble
1,70
1,45
4(N
ote
d)0.
772
Del
taEl
ectro
nics
Int'l
(Sin
gapo
re)P
te.L
td.
Del
taEl
ectro
nics
Com
pone
nts(
Wuj
iang
)Ltd
.3
Acc
ount
srec
eiva
ble
959,
908
(Not
ed)
0.44
2D
elta
Elec
troni
csIn
t'l(S
inga
pore
)Pte
.Ltd
.D
elta
Vid
eoD
ispla
ySy
stem
(Wuj
iang
)Ltd
.3
Acc
ount
srec
eiva
ble
846,
636
(Not
ed)
0.38
2D
elta
Elec
troni
csIn
t'l(S
inga
pore
)Pte
.Ltd
.D
elta
Elec
troni
cs(C
henz
hou)
Co.
,Ltd
.3
Acc
ount
srec
eiva
ble
499,
860
(Not
ed)
0.23
2D
elta
Elec
troni
csIn
t'l(S
inga
pore
)Pte
.Ltd
.C
henz
hou
Del
taTe
chno
logy
Co.
Ltd.
3A
ccou
ntsr
ecei
vabl
e13
2,26
6(N
ote
d)0.
062
Del
taEl
ectro
nics
Int'l
(Sin
gapo
re)P
te.L
td.
Del
taEl
ectro
nics
(Wuh
u)C
o.,L
td.
3A
ccou
ntsr
ecei
vabl
e54
3,60
4(N
ote
d)0.
252
Del
taEl
ectro
nics
Int'l
(Sin
gapo
re)P
te.L
td.
Del
taEl
ectro
nics
(Jap
an),
Inc.
3A
ccou
ntsr
ecei
vabl
e56
4,29
5(N
ote
d)0.
262
Del
taEl
ectro
nics
Int'l
(Sin
gapo
re)P
te.L
td.
DEI
Logi
stics
(USA
)Cor
p.3
Acc
ount
srec
eiva
ble
2,72
8,49
3(N
ote
d)1.
242
Del
taEl
ectro
nics
Int'l
(Sin
gapo
re)P
te.L
td.
Viv
itek
Cor
pora
tion
3A
ccou
ntsr
ecei
vabl
e11
9,60
7(N
ote
d)0.
052
Del
taEl
ectro
nics
Int'l
(Sin
gapo
re)P
te.L
td.
Del
taN
etw
orks
Inte
rnat
iona
lLtd
.3
Acc
ount
srec
eiva
ble
425,
808
(Not
ed)
0.19
2D
elta
Elec
troni
csIn
t'l(S
inga
pore
)Pte
.Ltd
.D
elta
Elec
troni
csIn
c.2
Acc
ount
srec
eiva
ble
8,08
6,26
5(N
ote
d)3.
672
Del
taEl
ectro
nics
Int'l
(Sin
gapo
re)P
te.L
td.
Del
troni
cs(N
ethe
rland
s)B
.V.
3A
ccou
ntsr
ecei
vabl
e22
5,04
7(N
ote
d)0.
103
Del
taN
etw
orks
Inte
rnat
iona
lLtd
.D
elta
Net
wor
ks(D
ongg
uan)
Ltd.
3A
ccou
ntsr
ecei
vabl
e4,
987,
852
(Not
ed)
2.26
3D
elta
Net
wor
ksIn
tern
atio
nalL
td.
DN
ILog
istic
s(U
SA)C
orp.
3A
ccou
ntsr
ecei
vabl
e3,
510,
293
(Not
ed)
1.59
3D
elta
Net
wor
ksIn
tern
atio
nalL
td.
Del
taN
etw
orks
,Inc
.(Ta
iwan
)3
Acc
ount
srec
eiva
ble
120,
301
(Not
ed)
0.05
4D
elta
Net
wor
ks(D
ongg
uan)
Ltd.
Del
taN
etw
orks
Inte
rnat
iona
lLtd
.3
Acc
ount
srec
eiva
ble
5,23
1,50
8(N
ote
d)2.
375
Del
taN
etw
orks
,Inc
.(Ta
iwan
)D
elta
Net
wor
ksIn
tern
atio
nalL
td.
3A
ccou
ntsr
ecei
vabl
e25
1,20
0(N
ote
d)0.
115
Del
taN
etw
orks
,Inc
.(Ta
iwan
)D
NIL
ogist
ics(
USA
)Cor
p.3
Acc
ount
srec
eiva
ble
355,
181
(Not
ed)
0.16
6D
elta
Elec
troni
cs(D
ongg
uan)
Co.
,Ltd
.D
elta
Elec
troni
csIn
t'l(S
inga
pore
)Pte
.Ltd
.3
Acc
ount
srec
eiva
ble
2,12
4,40
0(N
ote
d)0.
966
Del
taEl
ectro
nics
(Don
ggua
n)C
o.,L
td.
Del
taEl
ectro
nics
(Sha
ngha
i)C
o.,L
td.
3A
ccou
ntsr
ecei
vabl
e21
9,19
8(N
ote
d)0.
10
Num
ber
(Not
ea)
Com
pany
nam
eC
ount
erpa
rtyR
elat
ions
hip
(Not
eb)
Tran
sact
ion

119
Not
ea:
The
trans
actio
nin
form
atio
nof
the
Com
pany
and
the
cons
olid
ated
subs
idia
riess
houl
dbe
note
din
colu
mn
“Num
ber”
.The
num
berm
eans
:1.
Pare
ntco
mpa
nyis
‘0’
2.Th
esu
bsid
iarie
sare
num
bere
din
orde
rsta
rting
from
‘1’.
Not
eb:
Rel
atio
nshi
pbe
twee
ntra
nsac
tion
com
pany
and
coun
terp
arty
iscl
assif
ied
into
the
follo
win
gth
ree
cate
gorie
s:1.
Pare
ntco
mpa
nyto
subs
idia
ry.
2.Su
bsid
iary
topa
rent
com
pany
.3.
Subs
idia
ryto
subs
idia
ryN
ote
c:R
egar
ding
perc
enta
geof
trans
actio
nam
ount
toco
nsol
idat
edto
talo
pera
ting
reve
nues
orto
tala
sset
s,it
isco
mpu
ted
base
don
perio
d-en
dba
lanc
eof
trans
actio
nto
cons
olid
ated
tota
lass
ets
forb
alan
cesh
eeta
ccou
nts
and
base
don
accu
mul
ated
trans
actio
nam
ount
fort
hepe
riod
toco
nsol
idat
edto
talo
pera
ting
reve
nues
fori
ncom
esta
tem
enta
ccou
nts.
Not
ed:
Ther
eis
nosi
mila
rtra
nsac
tion
toco
mpa
rew
ith.I
twill
follo
wth
eag
reed
pric
ean
dtra
nsac
tion
term
sand
allt
hecr
edit
term
sare
75da
ys.
Not
ee:
Ther
eis
nosi
mila
rtra
nsac
tion
toco
mpa
rew
ith.I
twill
follo
wth
eag
reed
pric
ean
dtra
nsac
tion
term
sand
allt
hecr
edit
term
sare
60~9
0da
ys.
Not
ef:
Onl
yre
late
dpa
rtytra
nsac
tions
inex
cess
of$1
00m
illio
nar
edi
sclo
sed.
Gen
eral
ledg
erac
coun
t
Am
ount
(Not
eh)
Tran
sact
ion
term
s
Perc
enta
geof
cons
olid
ated
tota
lop
erat
ing
reve
nue
orto
tala
sset
s(N
ote
c)7
Del
taEl
ectro
nics
Pow
er(D
ongg
uan)
Co.
,Ltd
.D
elta
Elec
troni
csIn
tern
atio
nalL
td.
3A
ccou
ntsr
ecei
vabl
e68
3,48
8$
(Not
ed)
0.31
7D
elta
Elec
troni
csPo
wer
(Don
ggua
n)C
o.,L
td.
Del
taEl
ectro
nics
Int'l
(Sin
gapo
re)P
te.L
td.
3A
ccou
ntsr
ecei
vabl
e5,
033,
049
(Not
ed)
2.28
7D
elta
Elec
troni
csPo
wer
(Don
ggua
n)C
o.,L
td.
Del
taEl
ectro
nics
(Sha
ngha
i)C
o.,L
td.
3A
ccou
ntsr
ecei
vabl
e45
6,09
1(N
ote
d)0.
218
Del
taEl
ectro
nics
(Jia
ngsu
)Ltd
.D
elta
Elec
troni
cs(S
hang
hai)
Co.
,Ltd
.3
Acc
ount
srec
eiva
ble
1,36
9,01
0(N
ote
d)0.
628
Del
taEl
ectro
nics
(Jia
ngsu
)Ltd
.D
elta
Elec
troni
csIn
t'l(S
inga
pore
)Pte
.Ltd
.3
Acc
ount
srec
eiva
ble
3,28
3,92
4(N
ote
d)1.
499
Del
taEl
ectro
nics
Com
pone
nts(
Wuj
iang
)Ltd
.D
elta
Elec
troni
cs(S
hang
hai)
Co.
,Ltd
.3
Acc
ount
srec
eiva
ble
999,
278
(Not
ed)
0.45
9D
elta
Elec
troni
csC
ompo
nent
s(W
ujia
ng)L
td.
Del
taEl
ectro
nics
Int'l
(Sin
gapo
re)P
te.L
td.
3A
ccou
ntsr
ecei
vabl
e1,
005,
845
(Not
ed)
0.46
10D
elta
Elec
tro-O
ptic
s(W
ujia
ng)L
td.
Del
taEl
ectro
nics
(Sha
ngha
i)C
o.,L
td.
3A
ccou
ntsr
ecei
vabl
e1,
033,
405
(Not
ed)
0.47
10D
elta
Elec
tro-O
ptic
s(W
ujia
ng)L
td.
Del
taEl
ectro
nics
(Wuj
iang
)Tra
ding
Co.
,Ltd
.3
Acc
ount
srec
eiva
ble
431,
595
(Not
ed)
0.20
11D
elta
Vid
eoD
ispla
ySy
stem
(Wuj
iang
)Ltd
.D
elta
Elec
troni
cs(S
hang
hai)
Co.
,Ltd
.3
Acc
ount
srec
eiva
ble
686,
029
(Not
ed)
0.31
11D
elta
Vid
eoD
ispla
ySy
stem
(Wuj
iang
)Ltd
.D
elta
Elec
troni
csIn
t'l(S
inga
pore
)Pte
.Ltd
.3
Acc
ount
srec
eiva
ble
539,
683
(Not
ed)
0.24
13D
elta
Elec
troni
cs(W
uhu)
Co.
,Ltd
.D
elta
Elec
troni
csIn
t'l(S
inga
pore
)Pte
.Ltd
.3
Acc
ount
srec
eiva
ble
1,28
1,96
2(N
ote
d)0.
5815
Del
taEl
ectro
nics
(Che
nzho
u)C
o.,L
td.
Del
taEl
ectro
nics
Int'l
(Sin
gapo
re)P
te.L
td.
3A
ccou
ntsr
ecei
vabl
e94
7,82
6(N
ote
d)0.
4316
Che
nzho
uD
elta
Tech
nolo
gyC
o.Lt
d.D
elta
Elec
troni
csPo
wer
(Don
ggua
n)C
o.,L
td.
3A
ccou
ntsr
ecei
vabl
e27
8,70
5(N
ote
d)0.
1316
Che
nzho
uD
elta
Tech
nolo
gyC
o.Lt
d.D
elta
Elec
troni
cs(C
henz
hou)
Co.
,Ltd
.3
Acc
ount
srec
eiva
ble
610,
516
(Not
ed)
0.28
17D
elta
Elec
troni
cs(S
hang
hai)
Co.
,Ltd
.D
elta
Gre
ente
ch(C
hina
)Co.
,Ltd
.3
Acc
ount
srec
eiva
ble
3,05
8,70
8(N
ote
d)1.
3919
Del
taEl
ectro
nics
(Jap
an),
Inc.
Del
taEl
ectro
nics
Int'l
(Sin
gapo
re)P
te.L
td.
3A
ccou
ntsr
ecei
vabl
e14
0,49
5(N
ote
d)0.
0620
Cyn
tec
Co.
,Ltd
.C
ynte
cIn
tern
atio
nalL
td.
3A
ccou
ntsr
ecei
vabl
e25
7,70
9(N
ote
e)0.
1221
Cyn
tec
(Suz
hou)
Co.
Ltd
Cyn
tec
Inte
rnat
iona
lLtd
.3
Acc
ount
srec
eiva
ble
510,
785
(Not
ee)
0.23
22C
ynte
cEl
ectro
nics
(Suz
hou)
Co.
,Ltd
.C
ynte
cIn
tern
atio
nalL
td.
3A
ccou
ntsr
ecei
vabl
e76
4,18
4(N
ote
e)0.
3523
Cyn
tec
Inte
rnat
iona
lLtd
.C
ynte
cC
o.,L
td.
3A
ccou
ntsr
ecei
vabl
e13
6,80
8(N
ote
e)0.
0623
Cyn
tec
Inte
rnat
iona
lLtd
.D
elta
Elec
troni
csIn
t'l(S
inga
pore
)Pte
.Ltd
.3
Acc
ount
srec
eiva
ble
141,
335
(Not
ed)
0.06
Num
ber
(Not
ea)
Com
pany
nam
eC
ount
erpa
rtyR
elat
ions
hip
(Not
eb)
Tran
sact
ion

127
120
(2)I
nfor
mat
ion
onin
vest
ees
Info
rmat
ion
rela
ted
toin
vest
eeco
mpa
nies
’pro
fitor
loss
was
trans
late
dat
the
aver
age
rate
fort
heye
aren
ded
Dec
embe
r31,
2014
,oth
ersa
retra
nsla
ted
atth
era
teof
exch
ange
prev
ailin
gat
the
bala
nce
shee
tdat
e.
Bal
ance
asat
Dec
embe
r31,
2014
Bal
ance
asat
Dec
embe
r31,
2013
Num
bero
fsh
ares
Ow
ners
hip
(%)
Boo
kva
lue
Del
taEl
ectro
nics
,In
c.
Del
taIn
tern
atio
nal
Hol
ding
Ltd.
Cay
man
Isla
nds
Equi
tyin
vestm
ents
$8,
922,
118
$8,
922,
118
67,6
80,0
0094
.00
$62
,215
,252
$6,
410,
023
$5,
842,
455
(Not
ej)
Del
taEl
ectro
nics
,In
c.
Del
taN
etw
orks
Hol
ding
Ltd.
Cay
man
Isla
nds
Equi
tyin
vestm
ents
1,37
7,20
61,
377,
206
39,8
00,0
0010
0.00
11,9
75,4
322,
403,
674
2,40
3,67
4-
Del
taEl
ectro
nics
,In
c.
PreO
ptix
(Hon
gK
ong)
Co.
,Ltd
.H
ong
Kon
gEq
uity
inve
stmen
ts15
9,93
515
9,93
55,
250,
000
39.6
221
6,19
137
,771
14,9
66-
Del
taEl
ectro
nics
,In
c.
Cyn
tec
Co.
,Ltd
.Ta
iwan
Res
earc
h,de
velo
pmen
t,m
anuf
actu
ring
and
sale
sof
thin
film
optic
-ele
ctro
nic
devi
ces
12,0
67,9
3112
,067
,931
1,13
9,48
9,77
810
0.00
26,5
80,5
794,
231,
330
3,82
8,75
5-
Del
taEl
ectro
nics
,In
c.
Del
taEl
ectro
nics
Cap
italC
ompa
nyTa
iwan
Equi
tyin
vestm
ents
2,50
0,00
02,
500,
000
250,
000,
000
100.
002,
697,
879
148,
574
148,
574
-
Net
inco
me
(loss
)of
the
inve
stee
for
the
year
ende
dD
ecem
ber3
1,20
14
Inve
stmen
tinc
ome
(loss
)rec
ogni
zed
byth
eC
ompa
nyfo
rth
eye
aren
ded
Dec
embe
r31,
2014
Not
eIn
vesto
rIn
veste
eLo
catio
nM
ain
busin
essa
ctiv
ities
Initi
alin
vestm
enta
mou
ntSh
ares
held
asat
Dec
embe
r31,
2014
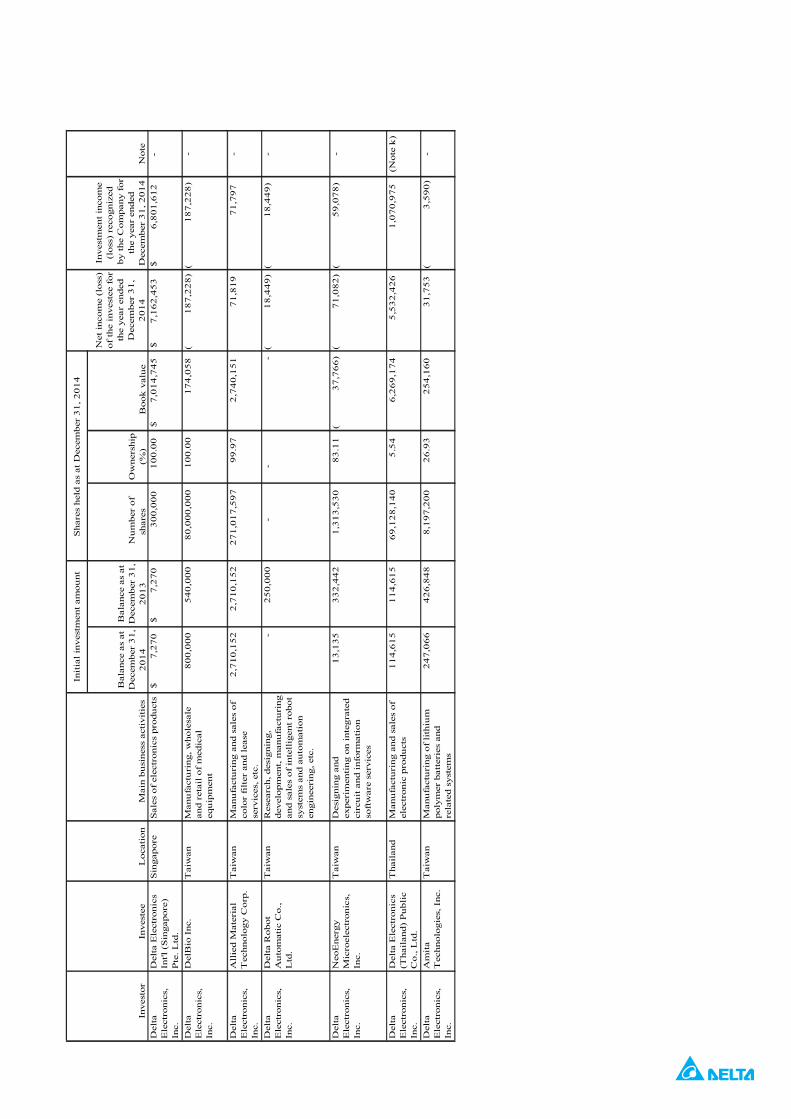
12
1
Bal
ance
asat
Dec
embe
r3
1,
20
14
Bal
ance
asat
Dec
embe
r3
1,
20
13
Nu
mbe
rof
shar
esO
wne
rshi
p(%
)B
ook
valu
eD
elta
Ele
ctro
nics
,In
c.
Del
taE
lect
roni
csIn
t'l(S
inga
pore
)P
te.L
td.
Sin
gapo
reS
ales
ofel
ectr
onic
spr
odu
cts
$7
,27
0$
7,2
70
30
0,0
00
10
0.0
0$
7,0
14
,74
5$
7,1
62
,45
3$
6,8
01
,61
2-
Del
taE
lect
roni
cs,
Inc.
Del
Bio
Inc.
Tai
wan
Man
ufa
ctu
ring
,who
lesa
lean
dre
tail
ofm
edic
aleq
uip
men
t
80
0,0
00
54
0,0
00
80
,00
0,0
00
10
0.0
01
74
,05
8(
18
7,2
28
)(
18
7,2
28
)-
Del
taE
lect
roni
cs,
Inc.
All
ied
Mat
eria
lT
echn
olog
yC
orp.
Tai
wan
Man
ufa
ctu
ring
and
sale
sof
colo
rfi
lter
and
leas
ese
rvic
es,e
tc.
2,7
10
,15
22
,71
0,1
52
27
1,0
17
,59
79
9.9
72
,74
0,1
51
71
,81
97
1,7
97
-
Del
taE
lect
roni
cs,
Inc.
Del
taR
obot
Au
tom
atic
Co.
,L
td.
Tai
wan
Res
earc
h,de
sign
ing,
deve
lopm
ent,
man
ufa
ctu
ring
and
sale
sof
inte
llig
ent
robo
tsy
stem
san
dau
tom
atio
nen
gine
erin
g,et
c.
-2
50
,00
0-
--
(1
8,4
49
)(
18
,44
9)
-
Del
taE
lect
roni
cs,
Inc.
Neo
Ene
rgy
Mic
roel
ectr
onic
s,In
c.
Tai
wan
Des
igni
ngan
dex
peri
men
ting
onin
tegr
ated
circ
uit
and
info
rmat
ion
soft
war
ese
rvic
es
13
,13
53
32
,44
21
,31
3,5
30
83
.11
(3
7,7
66
)(
71
,08
2)
(5
9,0
78
)-
Del
taE
lect
roni
cs,
Inc.
Del
taE
lect
roni
cs(T
hail
and)
Pu
blic
Co.
,Ltd
.
Tha
ilan
dM
anu
fact
uri
ngan
dsa
les
ofel
ectr
onic
prod
uct
s1
14
,61
51
14
,61
56
9,1
28
,14
05
.54
6,2
69
,17
45
,53
2,4
26
1,0
70
,97
5(N
ote
k)
Del
taE
lect
roni
cs,
Inc.
Am
ita
Tec
hnol
ogie
s,In
c.T
aiw
anM
anu
fact
uri
ngof
lith
ium
poly
mer
batt
erie
san
dre
late
dsy
stem
s
24
7,0
66
42
6,8
48
8,1
97
,20
02
6.9
32
54
,16
03
1,7
53
(3
,59
0)
-
Inve
stm
ent
inco
me
(los
s)re
cogn
ized
byth
eC
ompa
nyfo
rth
eye
aren
ded
Dec
embe
r3
1,2
01
4N
ote
Inve
stor
Inve
stee
Loc
atio
nM
ain
busi
ness
acti
viti
es
Init
ial
inve
stm
ent
amou
ntS
hare
she
ldas
atD
ecem
ber
31
,20
14
Net
inco
me
(los
s)of
the
inve
stee
for
the
year
ende
dD
ecem
ber
31
,2
01
4

129
122
Bal
ance
asat
Dec
embe
r31,
2014
Bal
ance
asat
Dec
embe
r31,
2013
Num
bero
fsh
ares
Ow
ners
hip
(%)
Boo
kva
lue
Del
taEl
ectro
nics
,In
c.
Del
troni
cs(N
ethe
rland
s)B
.V.
Net
herla
nds
Sale
sofe
lect
roni
cpr
oduc
ts$
192,
224
$36
,723
4,76
5,00
010
0.00
$33
6,35
4$
37,9
40$
57,1
08-
Del
taEl
ectro
nics
,In
c.
Del
taSm
artG
reen
Life
Co.
,Ltd
.Ta
iwan
Res
earc
h,de
velo
pmen
t,en
ergy
,tec
hnol
ogy,
mee
ting,
exhi
bitio
n,an
dle
asin
gse
rvic
es
-10
,000
--
-(
159)
(16
1)-
Del
taEl
ectro
nics
,In
c.
SYN
-TEK
Aut
omat
ion
Co.
,Lt
d.
Taiw
anM
anuf
actu
ring
ofel
ectro
nic
parts
,etc
.11
0,25
011
0,25
011
,025
,000
70.0
088
,338
(22
,033
)(
15,4
23)
-
Del
taEl
ectro
nics
,In
c.
Del
taG
reen
Life
Co.
,Ltd
.Ta
iwan
Insta
llmen
tcon
struc
tion
oflig
htin
geq
uipm
ent
135,
083
-23
,650
,000
100.
0013
0,26
2(
4,82
1)(
4,82
1)-
Del
taIn
tern
atio
nal
Hol
ding
Ltd.
Del
taEl
ectro
nics
Inte
rnat
iona
lLtd
.M
alay
siaSa
leso
fele
ctro
nic
prod
ucts
63,3
0063
,300
2,00
0,00
010
0.00
7,99
7,41
21,
652,
232
1,92
0,98
7(N
otes
aan
dj)
Del
taIn
tern
atio
nal
Hol
ding
Ltd.
Del
taEl
ectro
nics
(H.K
.)Lt
d.H
ong
Kon
gEq
uity
inve
stmen
ts10
,393
,768
10,3
93,7
682,
549,
297,
600
100.
0040
,954
,071
4,15
1,80
04,
151,
800
(Not
ea)
Del
taIn
tern
atio
nal
Hol
ding
Ltd.
DA
CH
oldi
ng(C
aym
an)L
td.
Cay
man
Isla
nds
Equi
tyin
vestm
ents
510,
839
510,
839
22,2
00,0
0010
0.00
356,
650
47,2
0847
,208
(Not
ea)
Del
taIn
tern
atio
nal
Hol
ding
Ltd.
Trill
ion
Scie
nce,
Inc.
U.S
.AR
esea
rch
onsp
ecia
lch
emic
alm
ater
ials
used
inpr
ecisi
onco
atin
gpr
oces
s
569,
700
569,
700
9,00
0,00
019
.78
34,1
76(
140,
772)
(33
,728
)(N
ote
a)
Del
taIn
tern
atio
nal
Hol
ding
Ltd.
Del
taEl
ectro
nics
(Jap
an),
Inc.
Japa
nSa
leso
fpow
erpr
oduc
ts,di
spla
yso
lutio
npr
oduc
ts,el
ectro
nic
com
pone
nts,
indu
stria
laut
omat
ion
prod
ucts
and
thei
rmat
eria
ls
90,4
8690
,486
5,60
010
0.00
222,
401
53,9
4053
,940
(Not
ea)
Inve
stor
Inve
stee
Loca
tion
Mai
nbu
sines
sact
iviti
es
Initi
alin
vestm
enta
mou
ntSh
ares
held
asat
Dec
embe
r31,
2014
Net
inco
me
(loss
)of
the
inve
stee
for
the
year
ende
dD
ecem
ber3
1,20
14
Inve
stmen
tinc
ome
(loss
)rec
ogni
zed
byth
eC
ompa
nyfo
rth
eye
aren
ded
Dec
embe
r31,
2014
Not
e

123
Bal
ance
asat
Dec
embe
r31,
2014
Bal
ance
asat
Dec
embe
r31,
2013
Num
bero
fsh
ares
Ow
ners
hip
(%)
Boo
kva
lue
Del
taIn
tern
atio
nal
Hol
ding
Ltd
.
Dig
italP
roje
ctio
nIn
tern
atio
nalL
td.
Bri
tain
Equ
ityin
vest
men
ts$
362,
087
$25
1,31
219
,249
,667
41.0
0$
292,
213
($56
,067
)($
53,3
49)
(Not
ea)
Del
taIn
tern
atio
nal
Hol
ding
Ltd
.
PreO
ptix
(Hon
gK
ong)
Co.
,Ltd
.H
ong
Kon
gE
quity
inve
stm
ents
253,
200
253,
200
8,00
0,00
060
.38
312,
920
37,6
1322
,710
(Not
ea)
Del
taIn
tern
atio
nal
Hol
ding
Ltd
.
Del
taPo
wer
Shar
pL
td.
Hon
gK
ong
Ope
ratio
nsm
anag
emen
tand
engi
neer
ing
serv
ices
40,9
3140
,931
10,0
00,0
0010
0.00
60,8
32(
1,25
1)(
1,25
1)(N
ote
a)
Del
taIn
tern
atio
nal
Hol
ding
Ltd
.
DE
ILog
istic
s(U
SA)C
orp.
U.S
.AW
areh
ousi
ngan
dlo
gist
ics
serv
ices
15,8
2515
,825
500,
000
100.
0011
9,46
39,
561
9,56
1(N
ote
a)
Del
taIn
tern
atio
nal
Hol
ding
Ltd
.
Ace
Pilla
rHol
ding
Ltd
.Sa
moa
Equ
ityin
vest
men
ts43
2,19
643
2,19
62,
858,
718
100.
0049
3,04
725
,456
12,8
77(N
ote
a)
Del
taIn
tern
atio
nal
Hol
ding
Ltd
.
Dra
keO
vers
eas
Fina
ncia
lIn
vest
men
tLtd
.
Bri
tish
Vir
gin
Isla
nds
Equ
ityin
vest
men
ts5,
447,
482
5,44
7,48
21
100.
006,
144,
260
315,
415
155,
254
(Not
ea)
Del
taIn
tern
atio
nal
Hol
ding
Ltd
.
Del
taE
lect
roni
csIn
tern
atio
nal
Mex
ico
SAD
EC
.V.
Mex
ico
Sale
sof
pow
erm
anag
emen
tsy
stem
ofin
dust
rial
auto
mat
ion
prod
ucta
ndte
leco
mm
unic
atio
nseq
uipm
ent
--
1-
-2,
641
-(N
ote
a)
Del
taIn
tern
atio
nal
Hol
ding
Ltd
.
Viv
itek
Cor
pora
tion
U.S
.ASa
les
ofpr
ojec
torp
rodu
cts
47,4
7547
,475
9,00
0,00
010
0.00
76,5
722,
997
(5,
486)
(Not
ea)
Del
taIn
tern
atio
nal
Hol
ding
Ltd
.
Del
taG
reen
tech
SGP
Pte
Ltd
.Si
ngap
ore
Equ
ityin
vest
men
ts88
4,00
547
4,75
012
,175
,470
100.
0088
0,04
448
,784
4,70
7(N
ote
a)
Del
taIn
tern
atio
nal
Hol
ding
Ltd
.
Del
taE
lect
roni
csE
urop
eL
imite
dB
rita
inR
epai
rcen
tre
and
prov
idin
gof
supp
orts
ervi
ce11
5,83
9-
500,
000
100.
0011
6,96
48,
025
4,88
6(N
ote
a)
Inve
stor
Inve
stee
Loc
atio
nM
ain
busi
ness
activ
ities
Initi
alin
vest
men
tam
ount
Shar
eshe
ldas
atD
ecem
ber3
1,20
14
Net
inco
me
(los
s)of
the
inve
stee
for
the
year
ende
dD
ecem
ber3
1,20
14
Inve
stm
enti
ncom
e(l
oss)
reco
gniz
edby
the
Com
pany
for
the
year
ende
dD
ecem
ber3
1,20
14N
ote

131
124
Balan
ceas
atDe
cem
ber3
1,20
14
Balan
ceas
atDe
cem
ber3
1,20
13Nu
mbe
rof
shar
esOw
nersh
ip(%
)Bo
okva
lue
Delta
Inter
natio
nal
Hold
ingL
td.
Boom
Trea
sure
Lim
ited
Hong
Kong
Equi
tyin
vestm
ents
$2,
757,
376
$-
110
0.00
$2,
728,
918
$25
,524
($16
,021
)(N
otea
)
Delta
Elec
troni
cs(H
.K.)
Ltd.
Crys
talric
h(Ho
ngKo
ng)C
o.,Lt
d.Ho
ngKo
ngEq
uity
inve
stmen
ts-
94,9
50-
--
(51
)(
263)
(Not
eb)
Delta
Elec
troni
cs(H
.K.)
Ltd.
Delta
Elec
troni
csIn
terna
tiona
lM
exico
SADE
C.V.
Mex
icoSa
lesof
powe
rman
agem
ent
syste
mof
indu
strial
auto
mati
onpr
oduc
tand
telec
omm
unica
tions
equi
pmen
t
33,2
3233
,232
252,
002
100.
008,
857
2,64
12,
641
(Not
eb)
Drak
eOv
erse
asFi
nanc
ialIn
vestm
ent
Ltd.
Drak
eInv
estm
ent
(H.K
.)Lt
d.Ho
ngKo
ngEq
uity
inve
stmen
ts1,
235,
585
1,23
5,58
530
4,50
4,30
610
0.00
3,36
4,78
531
5,66
631
5,66
6(N
otec
)
Delta
Netw
orks
Hold
ingL
td.
Delta
Netw
orks
Inc.
Caym
anIsl
ands
Equi
tyin
vestm
ents
5,62
9,23
65,
629,
236
1,19
6,88
6,00
010
0.00
11,9
46,2
912,
436,
632
2,40
5,99
1(N
oted
)
Delta
Netw
orks
,Inc
.De
ltaNe
twor
ks(H
.K.)
Lim
ited
Hong
Kong
Equi
tyin
vestm
ents
1,10
7,75
01,
107,
750
35,0
00,0
0010
0.00
3,92
4,80
269
7,34
869
7,34
8(N
otee
)
Delta
Netw
orks
,Inc
.De
ltaNe
twor
ks,
Inc.
(Taiw
an)
Taiw
anM
anuf
actu
ringa
ndsa
lesof
netw
orki
ngsy
stem
and
perip
hera
ls
466,
816
466,
816
50,0
40,8
3899
.98
2,01
6,06
225
6,78
725
6,73
6(N
otee
)
Delta
Netw
orks
,Inc
.De
ltaNe
twor
ksIn
terna
tiona
lLtd
.M
alays
iaTr
adin
gofn
etwor
king
syste
man
dper
iphe
rals
31,6
5031
,650
1,00
0,00
010
0.00
6,01
6,60
01,
591,
988
1,52
2,78
4(N
otee
)
Delta
Netw
orks
,Inc
.DN
ILog
istics
(USA
)Cor
p.U.
S.A
Trad
ingo
fnetw
orki
ngsy
stem
andp
erip
hera
ls17
,599
17,5
9950
0,00
010
0.00
49,2
134,
334
4,33
4(N
otee
)
Shar
eshe
ldas
atDe
cem
ber3
1,20
14
Neti
ncom
e(lo
ss)of
thei
nves
teefo
rth
eyea
rend
edDe
cem
ber3
1,20
14
Inve
stmen
tinc
ome
(loss)
reco
gnize
dby
theC
ompa
nyfo
rth
eyea
rend
edDe
cem
ber3
1,20
14No
teIn
vesto
rIn
veste
eLo
catio
nM
ainbu
sines
sacti
vitie
s
Initi
alin
vestm
enta
mou
nt

125
Not
ea:
Inve
stm
ent
inco
me
/lo
ssre
cogn
ized
byD
elta
Inte
rnat
iona
lHol
ding
Ltd
.N
ote
b:In
vest
men
tin
com
e/
loss
reco
gniz
edby
Del
taE
lect
roni
cs(H
.K.)
Ltd
.N
ote
c:In
vest
men
tin
com
e/
loss
reco
gniz
edby
Dra
keO
vers
eas
Fin
anci
alIn
vest
men
tL
td.
Not
ed:
Inve
stm
ent
inco
me
/lo
ssre
cogn
ized
byD
elta
Net
wor
ksH
oldi
ngL
td.
Not
ee:
Inve
stm
ent
inco
me
/lo
ssre
cogn
ized
byD
elta
Net
wor
ks,I
nc.
Not
ef:
Inve
stm
ent
inco
me
/lo
ssre
cogn
ized
byD
elta
Net
wor
ks,I
nc.(
Tai
wan
)N
ote
g:In
vest
men
tin
com
e/
loss
reco
gniz
edby
Cyn
tec
Co.
,Ltd
.N
ote
h:In
vest
men
tin
com
e/
loss
reco
gniz
edby
Fai
rvie
wA
sset
sL
td.
Not
ei:
Inve
stm
ent
inco
me
/lo
ssre
cogn
ized
byG
rand
view
Hol
ding
Ltd
.N
ote
j:T
hein
vest
men
tinc
ome
/los
sis
net
ofth
eel
imin
atio
nof
inte
rcom
pany
tran
sact
ions
.N
ote
k:T
hew
eigh
ted
aver
age
com
bine
dow
ners
hip
perc
enta
geof
20.0
1%,t
hein
vest
men
tinc
ome
/lo
ssis
net
ofth
eel
imin
atio
nof
inte
rcom
pany
tran
sact
ions
.
Bal
ance
asat
Dec
embe
r31
,20
14
Bal
ance
asat
Dec
embe
r31
,20
13N
umbe
rof
shar
esO
wne
rshi
p(%
)B
ook
valu
eD
elta
Net
wor
ks,I
nc.
(Tai
wan
)
Aye
com
Tec
hnol
ogy
Co.
,L
td.
Tai
wan
Man
ufac
turi
ngan
dsa
les
ofw
ire
and
wir
eles
ste
leco
mm
unic
atio
nseq
uipm
ent,
elec
tron
icpa
rts
and
cont
roll
edte
leco
mm
unic
atio
nsra
dio
freq
uenc
yde
vice
s
$18
5,00
0$
185,
000
30,0
00,0
0010
0.00
$13
3,76
7$
47,1
30$
17,2
12(N
ote
f)
Cyn
tec
Co.
,L
td.
Fai
rvie
wA
sset
sL
td.
Cay
man
Isla
nds
Equ
ity
inve
stm
ents
1,11
2,60
01,
111,
403
32,6
20,0
6210
0.00
20,7
54,8
844,
455,
585
4,45
5,58
5(N
ote
g)
Fai
rvie
wA
sset
sL
td.
Gra
ndvi
ewH
oldi
ngL
td.
Cay
man
Isla
nds
Equ
ity
inve
stm
ents
6,55
7,24
75,
448,
231
207,
180,
000
100.
0020
,744
,295
4,46
1,50
04,
461,
500
(Not
eh)
Gra
ndvi
ewH
oldi
ngL
td.
Cyn
tec
Inte
rnat
iona
lLtd
.M
alay
sia
Tra
ding
158,
250
158,
250
5,00
0,00
010
0.00
13,9
64,4
384,
669,
625
4,62
3,98
7(N
otes
ian
dj)
Gra
ndvi
ewH
oldi
ngL
td.
Cyn
tec
Hol
ding
(H.K
.)L
td.
Hon
gK
ong
Equ
ity
inve
stm
ents
6,39
8,99
75,
289,
981
202,
180,
000
100.
006,
775,
342
(16
2,49
2)(
162,
492)
(Not
ei)
Sha
res
held
asat
Dec
embe
r31
,201
4
Net
inco
me
(los
s)of
the
inve
stee
for
the
year
ende
dD
ecem
ber
31,
2014
Inve
stm
enti
ncom
e(l
oss)
reco
gniz
edby
the
Com
pany
for
the
year
ende
dD
ecem
ber
31,2
014
Not
eIn
vest
orIn
vest
eeL
ocat
ion
Mai
nbu
sine
ssac
tivi
ties
Init
iali
nves
tmen
tam
ount

133
126
(3)I
nfor
mat
ion
onin
vest
men
tsin
Mai
nlan
dC
hina
Rem
itted
toM
ainl
and
Chi
na
Rem
itted
back
toT
aiw
anD
elta
Elec
troni
cs(D
ongg
uan)
Co.
,Ltd
.
Man
ufac
turin
gan
dsa
les
oftra
nsfo
rmer
sand
pow
ersu
pplie
s
$3,0
95,6
87In
vest
edby
DH
K$
2,12
7,86
1$
-$
-$
2,12
7,86
1$
238,
163
94.0
0$
211,
436
$4,
384,
228
$30
5,73
9(N
otes
can
du)
Del
taG
reen
tech
(Chi
na)C
o.,
Ltd.
Man
ufac
turin
gan
dsa
les
ofun
inte
rrup
tible
pow
ersu
pplie
s
2,89
6,74
3In
vest
edby
DIH
,Ace
,D
rake
,DG
SGan
dB
oom
6,26
2,75
92,
976,
633
-9,
239,
392
748,
507
90.1
650
6,00
23,
402,
217
-(N
otes
dan
dt)
Del
taEl
ectro
nics
Pow
er(D
ongg
uan)
Co.
,Ltd
.
Man
ufac
turin
gan
dsa
les
ofpo
wer
supp
lies
1,33
2,46
5In
vest
edby
DH
K53
5,51
8-
-53
5,51
870
3,40
894
.00
779,
338
3,00
1,73
742
5,24
9(N
otes
ean
du)
Del
taEl
ectro
nics
(Sha
ngha
i)C
o.,L
td.
Prod
uctd
esig
nan
dm
anag
emen
tcon
sulti
ngse
rvic
e,et
c.
4,04
5,08
8In
vest
edby
DH
K-
--
-1,
309,
310
94.0
01,
230,
921
6,14
9,51
8-
(Not
esf
and
u)
Del
taEl
ectro
nics
(Wuh
u)C
o.,
Ltd.
Man
ufac
turin
gan
dsa
les
oftra
nsfo
rmer
sand
pow
ersu
pplie
s
4,24
1,10
0In
vest
edby
DH
K17
8,50
6-
-17
8,50
618
1,66
594
.00
170,
403
4,38
1,14
1-
(Not
esg
and
u)
Del
taEl
ectro
nics
(Che
nzho
u)C
o.,L
td.
Man
ufac
turin
gan
dsa
les
oftra
nsfo
rmer
sand
pow
ersu
pplie
s
1,99
3,95
0In
vest
edby
DH
K-
--
-16
5,75
594
.00
270,
016
2,86
7,18
6-
(Not
esh
and
u)
Acc
umul
ated
amou
ntof
inve
stm
ent
inco
me
rem
itted
back
toT
aiw
anas
ofD
ecem
ber
31,2
014
Am
ount
rem
itted
from
Tai
wan
toM
ainl
and
Chi
na/A
mou
ntre
mitt
edba
ckto
Tai
wan
fort
heye
aren
ded
Dec
embe
r31,
2014
Inve
stee
inM
ainl
and
Chi
naM
ain
busi
ness
activ
ities
Paid
-inca
pita
lIn
vest
men
tm
etho
d
Acc
umul
ated
amou
ntof
rem
ittan
cefr
omT
aiw
anto
Mai
nlan
dC
hina
asof
Janu
ary
1,20
14
Not
e
Acc
umul
ated
amou
ntof
rem
ittan
cefr
omT
aiw
anto
Mai
nlan
dC
hina
asof
Dec
embe
r31,
2014
Net
inco
me
ofin
vest
eefo
rthe
year
ende
dD
ecem
ber
31,2
014
Ow
ners
hip
held
byC
ompa
ny(d
irect
orin
dire
ct)
Inve
stm
ent
inco
me
(loss
)re
cogn
ized
byth
eC
ompa
nyfo
rthe
year
ende
dD
ecem
ber3
1,20
14(N
ote
s)
Boo
kva
lue
ofin
vest
men
tsin
Mai
nlan
dC
hina
asof
Dec
embe
r31,
2014

127
Rem
itted
toM
ainl
and
Chi
na
Rem
itted
back
toTa
iwan
Del
taEl
ectro
nics
(Jia
ngsu
)Lt
d.
Man
ufac
turin
gan
dsa
les
ofpo
wer
supp
lies
$1,2
66,0
00In
veste
dby
DH
K$
654,
522
$-
$-
$65
4,52
2$
762,
734
51.7
0$
405,
360
$3,
819,
303
$-
(Not
eu)
Del
taEl
ectro
nics
Com
pone
nts
(Wuj
iang
)Lt
d.
Man
ufac
turin
gan
dsa
les
ofpo
wer
supp
lies
2,81
0,83
7In
veste
dby
DH
K65
4,52
2-
-65
4,52
264
7,73
751
.70
335,
362
3,31
2,84
8-
(Not
esi
and
u)
Del
taEl
ectro
-O
ptic
s(W
ujia
ng)
Ltd.
Man
ufac
turin
gan
dsa
les
ofpe
riphe
rals
and
elec
troni
cco
ntro
leq
uipm
ents
917,
850
Inve
sted
byD
HK
409,
076
--
409,
076
837,
347
51.7
042
8,59
71,
318,
356
55,8
39(N
otes
jan
du)
Del
taV
ideo
Disp
lay
Syste
m(W
ujia
ng)
Ltd.
Man
ufac
turin
gan
dsa
les
ofva
rious
proj
ecto
rs91
7,85
0In
veste
dby
DH
K21
2,72
0-
-21
2,72
013
5,93
851
.70
87,2
411,
305,
362
-(N
otes
kan
du)
Del
taEl
ectro
nics
(Wuj
iang
)Tr
adin
gC
o.,
Ltd.
Insta
llatio
n,co
nsul
ting
and
tradi
ngof
elec
troni
cpr
oduc
ts
63,3
00In
veste
dby
DH
K11
,900
--
11,9
0012
3,49
794
.00
116,
011
608,
287
-(N
otes
lan
du)
Del
taG
reen
(Tia
njin
)In
dustr
ies
Co.
,Ltd
.
Man
ufac
turin
gan
dsa
les
oftra
nsfo
rmer
sand
blue
toot
hm
odul
e
716,
872
Inve
sted
byD
HK
982,
745
--
982,
745
(8,
666)
94.0
0(
8,19
0)83
6,24
7-
(Not
esm
and
u)
Inve
stee
inM
ainl
and
Chi
naM
ain
busin
essa
ctiv
ities
Paid
-inca
pita
lIn
vestm
ent
met
hod
Acc
umul
ated
amou
ntof
rem
ittan
cefro
mTa
iwan
toM
ainl
and
Chi
naas
ofJa
nuar
y1,
2014
Am
ount
rem
itted
from
Taiw
anto
Mai
nlan
dC
hina
/Am
ount
rem
itted
back
toTa
iwan
fort
heye
aren
ded
Dec
embe
r31,
2014
Acc
umul
ated
amou
ntof
rem
ittan
cefro
mTa
iwan
toM
ainl
and
Chi
naas
ofD
ecem
ber3
1,20
14
Net
inco
me
ofin
veste
efo
rthe
year
ende
dD
ecem
ber
31,2
014
Ow
ners
hip
held
byC
ompa
ny(d
irect
orin
dire
ct)
Inve
stmen
tin
com
e(lo
ss)
reco
gniz
edby
the
Com
pany
fort
heye
aren
ded
Dec
embe
r31,
2014
(Not
es)
Boo
kva
lue
ofin
vestm
ents
inM
ainl
and
Chi
naas
ofD
ecem
ber3
1,20
14
Acc
umul
ated
amou
ntof
inve
stmen
tin
com
ere
mitt
edba
ckto
Taiw
anas
ofD
ecem
ber
31,2
014
Not
e

135
128
Rem
itted
toM
ainl
and
Chi
na
Rem
itted
back
toTa
iwan
Del
taN
etw
orks
(Don
ggua
n)Lt
d.
Man
ufac
turin
gan
dsa
les
ofot
herr
adio
trans
miss
ion
appa
ratu
sinc
orpo
ratin
gre
cept
ion
appa
ratu
sand
othe
rrad
io-b
road
cast
rece
iver
s,co
mbi
ned
with
soun
dre
cord
ing
orre
prod
ucin
gap
para
tus
$1,1
07,7
50In
veste
dby
DN
HK
$1,
414,
956
$-
$-
$1,
414,
956
$70
7,67
910
0.00
$70
7,67
9$
3,11
6,37
2$
696,
300
(Not
esn
and
v)
Del
taN
etw
orks
(Sha
ngha
i)Lt
d.
Des
ign
ofco
mpu
ter
softw
are
63,3
00In
veste
dby
DN
HK
89,7
10-
-89
,710
4,10
710
0.00
4,10
785
,926
-(N
otes
oan
dv)
Del
taN
etw
orks
(Xia
men
)Lt
d.
Ope
ratio
nof
radi
otra
nsm
issio
nap
para
tus,
and
auto
mat
icda
tapr
oces
sing,
rece
ptio
n,co
nver
sion
and
trans
miss
ion
orre
gene
ratio
nof
voic
e,im
ages
orot
herd
ata
ofth
em
achi
ne,i
nclu
ding
switc
hesa
ndou
ters
,with
asp
ecia
lpro
gram
toco
ntro
la
com
pute
rorw
ord
proc
esso
rwith
mem
ory
busin
ess
22,1
55In
veste
dby
DN
HK
22,1
55-
-22
,155
3,37
510
0.00
3,37
53,
778
-(N
ote
v)
Ow
ners
hip
held
byC
ompa
ny(d
irect
orin
dire
ct)
Inve
stee
inM
ainl
and
Chi
naM
ain
busin
essa
ctiv
ities
Paid
-inca
pita
lIn
vestm
ent
met
hod
Acc
umul
ated
amou
ntof
rem
ittan
cefro
mTa
iwan
toM
ainl
and
Chi
naas
ofJa
nuar
y1,
2014
Am
ount
rem
itted
from
Taiw
anto
Mai
nlan
dC
hina
/Am
ount
rem
itted
back
toTa
iwan
fort
heye
aren
ded
Dec
embe
r31,
2014
Not
e
Inve
stmen
tin
com
e(lo
ss)
reco
gniz
edby
the
Com
pany
fort
heye
aren
ded
Dec
embe
r31,
2014
(Not
es)
Boo
kva
lue
ofin
vestm
ents
inM
ainl
and
Chi
naas
ofD
ecem
ber3
1,20
14
Acc
umul
ated
amou
ntof
inve
stmen
tin
com
ere
mitt
edba
ckto
Taiw
anas
ofD
ecem
ber
31,2
014
Acc
umul
ated
amou
ntof
rem
ittan
cefro
mTa
iwan
toM
ainl
and
Chi
naas
ofD
ecem
ber3
1,20
14
Net
inco
me
ofin
veste
efo
rthe
year
ende
dD
ecem
ber
31,2
014

129
Rem
itted
toM
ainl
and
Chi
na
Rem
itted
back
toTa
iwan
Cyn
tec
(Suz
hou)
Co.
,Ltd
.
Res
earc
h,de
velo
pmen
t,m
anuf
actu
ring
and
sale
sof
new
-type
elec
troni
cco
mpo
nent
sand
who
lesa
le,i
mpo
rtan
dex
port
ofsim
ilarp
rodu
cts
$2,0
57,2
50In
veste
dby
CH
K$
1,94
5,28
4$
-$
-$
1,94
5,28
4($
28,9
33)
100.
00($
2,89
3)$
2,03
8,84
5$
-(N
otes
pan
dw
)
Cyn
tec
Elec
troni
cs(S
uzho
u)C
o.,L
td.
Res
earc
h,de
velo
pmen
t,m
anuf
actu
ring
and
sale
sof
new
-type
elec
troni
cco
mpo
nent
s(ch
ipco
mpo
nent
s,se
nsin
gel
emen
ts,hy
brid
inte
grat
edci
rcui
ts)an
dw
hole
sale
,im
port
and
expo
rtof
simila
rpro
duct
s
4,33
6,05
0In
veste
dby
CH
K3,
228,
300
1,10
7,75
0-
4,33
6,05
0(
105,
674)
100.
00(
10,5
67)
4,76
4,27
2-
(Not
ew
)
PreO
ptix
(Jia
ngsu
)C
o.,L
td.
Man
ufac
turin
gan
dsa
les
ofle
nses
and
optic
alen
gine
sfor
proj
ecto
rs
419,
363
Inve
sted
byPH
K40
4,17
1-
-40
4,17
139
,162
96.3
837
,771
489,
962
-(N
otes
qan
dx)
Wuh
uD
elta
Tech
nolo
gyC
o.,L
td.
Man
ufac
turin
gan
dsa
les
oftra
nsfo
rmer
sand
pow
ersu
pplie
s
150,
447
Inve
sted
byD
WH
--
--
36,3
7294
.00
34,1
9023
4,88
5-
(Not
er)
Del
taEn
ergy
Tech
nolo
gy(W
uhu)
Co.
,Lt
d.
Res
earc
han
dde
velo
pmen
tof
ener
gy-s
avin
gte
chno
logy
,ene
rgy-
savi
ngeq
uipm
ent,
ener
gym
anag
emen
tsys
tem
and
tech
nolo
gyco
nsul
ting
serv
ice,
etc.
10,2
00In
veste
dby
DPE
Can
dD
WH
--
--
(67
8)94
.00
(63
7)7,
905
-(N
ote
r)
Inve
stee
inM
ainl
and
Chi
naM
ain
busin
essa
ctiv
ities
Paid
-inca
pita
lIn
vestm
ent
met
hod
Acc
umul
ated
amou
ntof
rem
ittan
cefro
mTa
iwan
toM
ainl
and
Chi
naas
ofJa
nuar
y1,
2014
Am
ount
rem
itted
from
Taiw
anto
Mai
nlan
dC
hina
/Am
ount
rem
itted
back
toTa
iwan
fort
heye
aren
ded
Dec
embe
r31,
2014
Acc
umul
ated
amou
ntof
rem
ittan
cefro
mTa
iwan
toM
ainl
and
Chi
naas
ofD
ecem
ber3
1,20
14
Net
inco
me
ofin
veste
efo
rthe
year
ende
dD
ecem
ber
31,2
014
Ow
ners
hip
held
byC
ompa
ny(d
irect
orin
dire
ct)
Not
e
Inve
stmen
tin
com
e(lo
ss)
reco
gniz
edby
the
Com
pany
fort
heye
aren
ded
Dec
embe
r31,
2014
(Not
es)
Boo
kva
lue
ofin
vestm
ents
inM
ainl
and
Chi
naas
ofD
ecem
ber3
1,20
14
Acc
umul
ated
amou
ntof
inve
stmen
tin
com
ere
mitt
edba
ckto
Taiw
anas
ofD
ecem
ber
31,2
014

137
130
Rem
itted
toM
ainl
and
Chi
na
Rem
itted
back
toTa
iwan
Che
nzho
uD
elta
Tech
nolo
gyC
o.,L
td.
Man
ufac
turin
gan
dsa
les
oftra
nsfo
rmer
sand
pow
ersu
pplie
s
$13
0,04
7In
veste
dby
DC
Z$
-$
-$
-$
-$
117,
863
94.0
0$
109,
539
$38
6,49
5$
-(N
ote
r)
Del
taEn
ergy
(Che
nzho
u)Te
chno
logy
Co.
,Ltd
.
Res
earc
han
dde
velo
pmen
tof
ener
gy-s
avin
gte
chno
logy
,ene
rgy-
savi
ngeq
uipm
ent,
ener
gym
anag
emen
tsys
tem
and
tech
nolo
gyco
nsul
ting
serv
ice,
etc.
10,2
00In
veste
dby
DPE
Can
dD
CZ
--
--
187
94.0
017
59,
443
-(N
ote
r)
Del
taEn
ergy
Tech
nolo
gy(D
ongg
uan)
Co.
,Ltd
.
Res
earc
han
dde
velo
pmen
tof
ener
gy-s
avin
gte
chno
logy
,ene
rgy-
savi
ngeq
uipm
ent,
ener
gym
anag
emen
tsys
tem
and
tech
nolo
gyco
nsul
ting
serv
ice,
etc.
30,5
99In
veste
dby
DPE
Can
dD
DG
--
--
4,91
594
.00
4,60
015
0,71
7-
(Not
er)
Del
taEn
ergy
Tech
nolo
gy(W
ujia
ng)
Co.
,Ltd
.
Res
earc
han
dde
velo
pmen
tof
ener
gy-s
avin
gte
chno
logy
,ene
rgy-
savi
ngeq
uipm
ent,
ener
gym
anag
emen
tsys
tem
and
tech
nolo
gyco
nsul
ting
serv
ice,
etc.
20,4
00In
veste
dby
DPE
Can
dD
WO
--
--
163
94.0
015
310
,673
-(N
ote
r)
Am
ount
rem
itted
from
Taiw
anto
Mai
nlan
dC
hina
/Am
ount
rem
itted
back
toTa
iwan
fort
heye
aren
ded
Dec
embe
r31,
2014
Not
e
Acc
umul
ated
amou
ntof
rem
ittan
cefro
mTa
iwan
toM
ainl
and
Chi
naas
ofD
ecem
ber3
1,20
14
Net
inco
me
ofin
veste
efo
rthe
year
ende
dD
ecem
ber
31,2
014
Ow
ners
hip
held
byC
ompa
ny(d
irect
orin
dire
ct)
Inve
stmen
tin
com
e(lo
ss)
reco
gniz
edby
the
Com
pany
fort
heye
aren
ded
Dec
embe
r31,
2014
(Not
es)
Boo
kva
lue
ofin
vestm
ents
inM
ainl
and
Chi
naas
ofD
ecem
ber3
1,20
14
Acc
umul
ated
amou
ntof
inve
stmen
tin
com
ere
mitt
edba
ckto
Taiw
anas
ofD
ecem
ber
31,2
014
Inve
stee
inM
ainl
and
Chi
naM
ain
busin
essa
ctiv
ities
Paid
-inca
pita
lIn
vestm
ent
met
hod
Acc
umul
ated
amou
ntof
rem
ittan
cefro
mTa
iwan
toM
ainl
and
Chi
naas
ofJa
nuar
y1,
2014

131
Not
ea:
The
capi
talw
astra
nsla
ted
base
don
the
capi
talc
ertif
ied
repo
rtof
the
inve
stee
com
pani
esin
toN
ewTa
iwan
Dol
lars
atth
eav
erag
eex
chan
gera
teof
RMB
6.20
60to
US$
1an
dRM
B5.
0999
toN
T$1.
Not
eb:
The
accu
mul
ated
rem
ittan
ceas
ofJa
nuar
y1,
2014
,rem
itted
orco
llect
edth
ispe
riod,
accu
mul
ated
rem
ittan
ceas
ofD
ecem
ber3
1,20
14an
din
vest
men
tinc
ome
rem
itted
back
asof
Dec
embe
r31,
2014
was
trans
late
din
toN
ewTa
iwan
Dol
lars
atth
eav
erag
eex
chan
gera
teof
NTD
31.6
5to
US$
1at
the
bala
nce
shee
tdat
e.N
ote
c:Ex
cept
fort
hefa
cilit
yof
US$
67,2
31pe
rmitt
edby
Inve
stm
entC
omm
issio
n,th
eca
pita
lizat
ion
ofea
rnin
gsof
US$
27,0
81pe
rmitt
edby
Inve
stm
entC
omm
issi
onis
excl
uded
from
the
Com
pany
’sam
ount
ofin
vest
men
tin
Mai
nlan
dCh
ina.
Not
ed:
Exce
ptfo
rthe
faci
lity
ofU
S$29
1,92
4pe
rmitt
edby
Inve
stm
entC
omm
issio
n,th
eca
pita
lizat
ion
ofea
rnin
gsof
US$
980
perm
itted
byIn
vest
men
tCom
mis
sion
isex
clud
edfro
mth
eC
ompa
ny’s
amou
ntof
inve
stm
enti
nM
ainl
and
Chin
a.N
ote
e:Ex
cept
fort
hefa
cilit
yof
US$
16,9
20pe
rmitt
edby
Inve
stm
entC
omm
issio
n,th
eca
pita
lizat
ion
ofea
rnin
gsof
US$
22,6
54pe
rmitt
edby
Inve
stm
entC
omm
issi
onis
excl
uded
from
the
Com
pany
’sam
ount
ofin
vest
men
tin
Mai
nlan
dCh
ina.
Not
ef:
The
capi
taliz
atio
nof
earn
ings
ofU
S$11
0,40
1pe
rmitt
edby
Inve
stm
entC
omm
issi
onis
excl
uded
from
the
Com
pany
’sam
ount
ofin
vest
men
tin
Mai
nlan
dCh
ina.
Not
eg:
Exce
ptfo
rthe
faci
lity
ofU
S$5,
640
perm
itted
byIn
vest
men
tCom
mis
sion
,the
capi
taliz
atio
nof
earn
ings
ofU
S$12
0,32
0pe
rmitt
edby
Inve
stm
entC
omm
issi
onis
excl
uded
from
the
Com
pany
’sam
ount
ofin
vest
men
tin
Mai
nlan
dCh
ina.
Not
eh:
The
capi
taliz
atio
nof
earn
ings
ofU
S$59
,220
perm
itted
byIn
vest
men
tCom
mis
sion
isex
clud
edfro
mth
eC
ompa
ny’s
amou
ntof
inve
stm
enti
nM
ainl
and
Chin
a.
Rem
itted
toM
ainl
and
Chi
na
Rem
itted
back
toTa
iwan
Del
taEn
ergy
Tech
nolo
gy(S
hang
hai)
Co.
,Ltd
.
Res
earc
han
dde
velo
pmen
tof
ener
gy-s
avin
gte
chno
logy
,ene
rgy-
savi
ngeq
uipm
ent,
ener
gym
anag
emen
tsys
tem
and
tech
nolo
gyco
nsul
ting
serv
ice,
etc.
$50
,999
Inve
sted
byD
PEC
and
DG
C
$-
$-
$-
$-
($4,
721)
90.5
4($
4,27
4)$
39,1
03$
-(N
ote
r)
Del
Bio
(Wuj
iang
)C
o.,L
td.
Man
ufac
turin
g,w
hole
sale
and
reta
ilof
med
ical
equi
pmen
t
60,8
40In
veste
dby
Del
Bio
48,1
0215
,192
-63
,300
(12
,927
)10
0.00
(12
,927
)40
,081
--
Del
taEl
ectro
nics
(Pin
gtan
)C
o.,L
td.
Elec
troni
can
den
ergy
-sa
ving
equi
pmen
tw
hole
sale
,etc
.
25,8
41In
veste
dby
DH
K-
23,8
29-
23,8
29-
94.0
0(
425)
23,5
27-
(Not
ey)
Boo
kva
lue
ofin
vestm
ents
inM
ainl
and
Chi
naas
ofD
ecem
ber3
1,20
14
Acc
umul
ated
amou
ntof
inve
stmen
tin
com
ere
mitt
edba
ckto
Taiw
anas
ofD
ecem
ber
31,2
014
Not
e
Am
ount
rem
itted
from
Taiw
anto
Mai
nlan
dC
hina
/Am
ount
rem
itted
back
toTa
iwan
fort
heye
aren
ded
Dec
embe
r31,
2014
Acc
umul
ated
amou
ntof
rem
ittan
cefro
mTa
iwan
toM
ainl
and
Chi
naas
ofD
ecem
ber3
1,20
14
Net
inco
me
ofin
veste
efo
rthe
year
ende
dD
ecem
ber
31,2
014
Ow
ners
hip
held
byC
ompa
ny(d
irect
orin
dire
ct)
Inve
stmen
tin
com
e(lo
ss)
reco
gniz
edby
the
Com
pany
fort
heye
aren
ded
Dec
embe
r31,
2014
(Not
es)
Inve
stee
inM
ainl
and
Chi
naM
ain
busin
essa
ctiv
ities
Paid
-inca
pita
lIn
vestm
ent
met
hod
Acc
umul
ated
amou
ntof
rem
ittan
cefro
mTa
iwan
toM
ainl
and
Chi
naas
ofJa
nuar
y1,
2014

139
132
Not
ei:
Exce
ptfo
rthe
faci
lity
ofU
S$20
,680
perm
itted
byIn
vestm
entC
omm
issio
n,th
eca
pita
lizat
ion
ofea
rnin
gsof
US$
25,2
35pe
rmitt
edby
Inve
stmen
tCom
miss
ion
isex
clud
edfro
mth
eCo
mpa
ny’s
amou
ntof
inve
stmen
tin
Mai
nlan
dCh
ina.
Not
ej:
Exce
ptfo
rthe
faci
lity
ofU
S$12
,925
perm
itted
byIn
vestm
entC
omm
issio
n,th
eca
pita
lizat
ion
ofea
rnin
gsof
US$
2,06
8pe
rmitt
edby
Inve
stmen
tCom
miss
ion
isex
clud
edfro
mth
eCo
mpa
ny’s
amou
ntof
inve
stmen
tin
Mai
nlan
dCh
ina.
Not
ek:
Exce
ptfo
rthe
faci
lity
ofU
S$6,
721
perm
itted
byIn
vestm
entC
omm
issio
n,th
eca
pita
lizat
ion
ofea
rnin
gsof
US$
8,27
2pe
rmitt
edby
Inve
stmen
tCom
miss
ion
isex
clud
edfro
mth
eCo
mpa
ny’s
amou
ntof
inve
stmen
tin
Mai
nlan
dCh
ina.
Not
el:
Exce
ptfo
rth
efa
cilit
yof
US$
376
perm
itted
byIn
vestm
entC
omm
issio
n,th
eca
pita
lizat
ion
ofea
rnin
gsof
US$
1,50
4pe
rmitt
edby
Inve
stmen
tCom
miss
ion
isex
clud
edfro
mth
eCo
mpa
ny’s
amou
ntof
inve
stmen
tin
Mai
nlan
dCh
ina.
Not
em
:Exc
eptf
orth
efa
cilit
yof
US$
31,0
50pe
rmitt
edby
Inve
stmen
tCom
miss
ion,
the
capi
taliz
atio
nof
earn
ings
ofU
S$26
5pe
rmitt
edby
Inve
stmen
tCom
miss
ion
isex
clud
edfro
mth
eCo
mpa
ny’s
amou
ntof
inve
stmen
tin
Mai
nlan
dCh
ina.
Not
en:
Exce
ptfo
rthe
faci
lity
ofU
S$44
,706
perm
itted
byIn
vestm
entC
omm
issio
n,th
eca
pita
lizat
ion
ofea
rnin
gsof
US$
11,3
12pe
rmitt
edby
Inve
stmen
tCom
miss
ion
isex
clud
edfro
mth
eCo
mpa
ny’s
amou
ntof
inve
stmen
tin
Mai
nlan
dCh
ina.
Not
eo:
Exce
ptfo
rth
efa
cilit
yof
US$
2,83
4pe
rmitt
edby
Inve
stmen
tCom
miss
ion,
the
capi
taliz
atio
nof
earn
ings
ofU
S$29
8pe
rmitt
edby
Inve
stmen
tCom
miss
ion
isex
clud
edfro
mth
eCo
mpa
ny’s
amou
ntof
inve
stmen
tin
Mai
nlan
dCh
ina.
Not
ep:
Exce
ptfo
rthe
faci
lity
ofU
S$19
8,46
2pe
rmitt
edby
Inve
stmen
tCom
miss
ion,
the
capi
taliz
atio
nof
earn
ings
ofU
S$4,
000
perm
itted
byIn
vestm
entC
omm
issio
nis
excl
uded
from
the
Com
pany
’sam
ount
ofin
vestm
enti
nM
ainl
and
Chin
a.
Not
eq:
Exce
ptfo
rthe
faci
lity
ofU
S$7,
520
perm
itted
byIn
vestm
entC
omm
issio
n,th
ein
vestm
ento
fUS$
5,25
0by
PreO
ptix
Co.,
Ltd.
was
perm
itted
byIn
vestm
entC
omm
issio
n.
Not
er:
Acc
ordi
ngto
the
regu
latio
nsof
the
Inve
stmen
tCom
miss
ion,
the
rein
vestm
ento
fthe
inve
stee
com
pani
esin
Mai
nlan
dCh
ina
isno
treq
uire
dto
obta
inth
eap
prov
alof
the
Inve
stmen
tCom
miss
ion;
thus
the
inve
stmen
tam
ount
sare
excl
uded
from
the
calc
ulat
ion
ofth
eCo
mpa
ny’s
ceili
ngof
inve
stmen
tam
ount
inM
ainl
and
Chin
a.
Not
es:
The
Com
pany
reco
gniz
edin
vestm
enti
ncom
e/l
ossb
ased
onth
ere
view
edfin
anci
alsta
tem
ents.
Not
et:
Join
tlyin
veste
dth
roug
hD
elta
Inte
rnat
iona
lHol
ding
Ltd.
,Ace
Pilla
rHol
ding
Co.,
Ltd.
,Dra
keIn
vestm
ent(
H.K
.)Lt
d.,D
elta
Gre
ente
chSG
PPt
eLt
d.an
dBo
omTr
easu
reLi
mite
d.
Not
eu:
Inve
stth
roug
hD
elta
Elec
troni
cs(H
.K.)
Ltd.
Not
ev:
Inve
stth
roug
hD
elta
Net
wor
ks(H
.K.)
Ltd.
Not
ew
:Inv
estt
hrou
ghCy
ntec
Hol
ding
(H.K
.)Lt
d.
Not
ex:
Inve
stth
roug
hPr
eOpt
ix(H
ong
Kon
g)Co
.,Lt
d.
Not
ey:
On
Sept
embe
r15,
2014
,the
Inve
stmen
tCom
miss
ion
ofth
eM
inist
ryof
Econ
omic
Affa
irs(M
OEA
)has
appr
oved
the
esta
blish
men
tofD
elta
Elec
troni
cs(P
ingt
an)C
o.,L
td.a
ndth
eCo
mpa
nyis
expe
cted
tous
eth
eca
pita
lofU
S$4,
700
thou
sand
held
byD
elta
Elec
troni
cs(H
.K.)
Ltd.
asca
pita
lsto
ck.

133
Not
ea:
The
accu
mul
ated
amou
ntre
mitt
edou
tofT
aiw
anto
Mai
nlan
dCh
ina
and
inve
stm
enta
mou
ntap
prov
edby
the
inve
stm
entc
omm
issi
onw
astra
nsla
ted
into
New
Taiw
anD
olla
rsat
the
aver
age
exch
ange
rate
ofN
TD31
.65
toU
S$1
atth
eba
lanc
esh
eetd
ate.
Not
eb:
The
inve
stm
enti
ncom
eof
US$
22,0
00,U
S$18
,000
,US$
10,5
09an
dU
S$14
,351
wer
ere
mitt
edba
ckon
Mar
ch11
,201
1,Ju
ne27
,201
2,A
ugus
t14,
2012
,Jun
e24
,200
9an
dD
ecem
ber
29,2
005,
resp
ectiv
ely,
from
the
inve
stee
com
pani
esin
Mai
nlan
dCh
ina
and
was
perm
itted
byIn
vest
men
tCom
mis
sion
onA
ugus
t3,2
012,
Aug
ust2
8,20
12,J
uly
17,2
009
and
Janu
ary
6,20
06,r
espe
ctiv
ely,
whi
char
ede
duct
ible
from
the
Com
pany
’sac
cum
ulat
edam
ount
rem
itted
outo
fTai
wan
toM
ainl
and
Chin
a.
Not
ec:
Acc
ordi
ngto
“Reg
ulat
ion
Gov
erni
ngth
eA
ppro
val
ofIn
vest
men
tor
Tech
nica
lC
oope
ratio
nin
Mai
nlan
dCh
ina”
,the
Com
pany
and
Cyn
tec
Co.
,Ltd
.obt
aine
dth
eap
prov
alof
oper
atio
nhe
adqu
arte
rsfro
mIn
dustr
ial
Dev
elop
men
tBur
eau
ofM
inist
ryof
Econ
omic
Affa
irs.T
here
isno
ceili
ngof
inve
stm
enta
mou
nt.
Not
ed:
The
ceili
ngof
inve
stm
ents
ofth
eth
irdqu
arte
rof2
013,
whi
chis
the
last
time
Del
Bio
filed
anap
plic
atio
nw
ithth
eM
inis
tryof
Econ
omic
Affa
irs,i
s$71
,517
.The
refo
re,i
tisn
otov
erth
ece
iling
ofin
vest
men
tam
ount
.
The
sign
ifica
ntpu
rcha
ses,
sale
s,ac
coun
tspa
yabl
ean
dac
coun
tsre
ceiv
able
that
the
Com
pany
dire
ctly
cond
ucte
dw
ithin
vest
eeco
mpa
nies
inM
ainl
and
Chin
aas
wel
las
thos
eth
atth
eC
ompa
nyin
dire
ctly
cond
ucte
dw
ithin
vest
eeco
mpa
nies
inM
ainl
and
Chin
ath
roug
hD
elta
Elec
troni
csIn
tern
atio
nalL
td.(
DEI
L-La
buan
),D
elta
Elec
troni
csIn
t'l(S
inga
pore
)Pte
.Ltd
.(D
EIL-
SG),
Del
taN
etw
orks
Inte
rnat
iona
lLtd
.(D
NIL
-Lab
uan)
and
Cyn
tec
Inte
rnat
iona
lLtd
.(C
IL-L
abua
n)fo
rthe
year
ende
dD
ecem
ber3
1,20
14ar
esh
own
inN
otes
13.(1
)Gan
dH
.
Com
pany
nam
eA
ccum
ulat
edam
ount
rem
itted
from
Taiw
anto
Mai
nlan
dC
hina
asof
Dec
embe
r31,
2014
Inve
stmen
tam
ount
appr
oved
byth
eIn
vestm
ent
Com
miss
ion
ofM
inist
ryof
Econ
omic
Affa
irs(M
OEA
)
Cei
ling
ofin
vestm
ents
inM
ainl
and
Chi
naim
pose
dby
the
Inve
stmen
tCom
miss
ion
ofM
OEA
Del
taEl
ectro
nics
,Inc
.(N
otes
ban
dc)
15,5
34,0
79$
16,0
81,9
93$
-$
Cyn
tec
Co.
,Ltd
.6,
281,
334
6,28
1,33
411
,979
,184
Del
Bio
Inc.
(Not
ed)
63,3
0012
6,60
010
4,43
5

141
134
14. OPERATING SEGMENT INFORMATION
(1) General information
The Group considers the business from a product perspective. The Group’s business is segregatedinto power electronics business, energy management business and smart green life business.Breakdown of the revenue from all sources is as follows:
A. Power and components business: Embedded Power Supplies, Mobile Power, Fans and CoolingManagement, Core Components of Information and Communication and other items. Providesglobal power management and cooling plans and management.
B. Energy management business: Industrial Automation, Communication Power System,Uninterruptible Power System and Information Centre, Renewable Energy, RechargingEquipment for Automotive Electronics and Electronic Cars and other items. Provides energyautomation plans for factories and buildings.
C. Smart green life business: Network Devices, Conferencing and Visual Imaging System, LEDLighting Plans, Medical Devices, Innergie Power Consumption Products, Vivitek HighDefinition Projector and other items.
Because of the change of product classification, the Group’s reporting business changed. Theprior period information was restated for comparison.
(2) Measurement of segment information
The Group’s segment profit (loss) is measured with the operating profit (loss) before tax, which isused as a basis for the Group in assessing the performance of the operating segments. Theaccounting policies of the operating segments are in agreement with the significant accountingpolicies summarized in Note 4.
(3) Segment information
The segment information provided to the chief operating decision-maker for the reportablesegments is as follows:

135
(4) Reconciliation information for segment profit (loss)
A. The revenue from external parties reported to the chief operating decision-maker is measured ina manner consistent with that in the statement of comprehensive income.
B. A reconciliation of reportable segments profit (loss) to profit (loss) before tax and discontinuedoperations is provided as follows:
(5) Information on products and services
As the Group considered the business from a product perspective, the reportable segments werebased on different products and services. Revenues from external customers are the same as inNote 14(3).
Power Energyelectronics management Smart greenbusiness business life business Total
Revenue from externalcustomers 114,480,481$ 35,788,687$ 37,159,614$ 187,428,782$
Segment income 18,059,044$ 6,074,269$ 3,768,003$ 27,901,316$
Power Energyelectronics management Smart greenbusiness business life business Total
Revenue from externalcustomers 103,972,001$ 32,767,240$ 33,744,729$ 170,483,970$
Segment income 14,558,435$ 5,309,968$ 3,201,434$ 23,069,837$
Year ended December 31, 2014
Year ended December 31, 2013
2014 2013Reportable segments' profit 27,901,316$ 23,069,837$Other segments' loss 5,084,428)( 3,561,455)(Non-operating income and expenses 3,697,969 2,988,172Profit before tax and discontinued
operations 26,514,857$ 22,496,554$
Years ended December 31,

143136
(6) Geographical information
Information about geographic areas for the years ended December 31, 2014 and 2013 were asfollows:
(7) Major customer information
There are no customers accounting for more than 10% of the Group’s operating revenues for theyears ended December 31, 2014 and 2013.
Non-current Non-currentRevenue assets Revenue assets
Mainland China 110,796,379$ 31,442,091$ 98,752,432$ 30,434,455$USA 29,931,606 1,627 26,227,965 1,470Taiwan 436,612 21,355,701 1,311,636 21,362,860Others 49,470,523 604,631 50,761,089 854,259
190,635,120$ 53,404,050$ 177,053,122$ 52,653,044$
Years ended December 31,2014 2013

![¦°hocc.medicine.psu.ac.th/files/annual_report/AnnualReport2009[HOCC].pdfรายงานประจำปี 2552 ศูนย์องค์รวมเพื่อการศึกษาและบำบัดโรค](https://static.fdocuments.net/doc/165x107/6050296984fb45058f3c8dd8/hocc-hoccpdf-aaaaaaaaaaaaa-2552-aaaaaoeaaaaoeaaaaaaaaaaaaaaaaaaaaaaaaaaa.jpg)