Dell 2020 Energy Intensity Goal - Mid-term...
27
Dell 2020 Energy Intensity Goal - Mid-term Report 1 June 2017 John Pflueger, Dell | Corporate Responsibility, Author Gary Verdun, Dell | Environmental Affairs, Author Alyssa Caddle, Dell | Corporate Responsibility, Contributor Maureen Martinez, Dell | Environmental Affairs, Contributor June 2017 THIS WHITE PAPER IS FOR INFORMATIONAL PURPOSES ONLY, AND MAY CONTAIN TYPOGRAPHICAL ERRORS AND TECHNICAL INACCURACIES. THE CONTENT IS PROVIDED AS IS, WITHOUT EXPRESS OR IMPLIED WARRANTIES OF ANY KIND. © 2017 All rights reserved. Reproduction of this material in any manner whatsoever without the express written permission of Dell Inc. is strictly forbidden. For more information, contact Dell. Dell, the Dell logo, and Dell EMC PowerEdge are trademarks of Dell Inc. Other trademarks and trade names may be used in this document to refer to either the entities claiming the marks and names or their products. Dell disclaims proprietary interest in the marks and names of others. Dell 2020 Energy Intensity Goal - Mid-term Report
Transcript of Dell 2020 Energy Intensity Goal - Mid-term...

Dell 2020 Energy Intensity Goal - Mid-term Report
1 June 2017
John Pflueger, Dell | Corporate Responsibility, Author
Gary Verdun, Dell | Environmental Affairs, Author
Alyssa Caddle, Dell | Corporate Responsibility, Contributor
Maureen Martinez, Dell | Environmental Affairs, Contributor
June 2017
THIS WHITE PAPER IS FOR INFORMATIONAL PURPOSES ONLY, AND MAY CONTAIN TYPOGRAPHICAL ERRORS AND
TECHNICAL INACCURACIES. THE CONTENT IS PROVIDED AS IS, WITHOUT EXPRESS OR IMPLIED WARRANTIES OF
ANY KIND.
© 2017 All rights reserved. Reproduction of this material in any manner whatsoever without the express written permission of Dell
Inc. is strictly forbidden. For more information, contact Dell.
Dell, the Dell logo, and Dell EMC PowerEdge are trademarks of Dell Inc. Other trademarks and trade names may be used in this
document to refer to either the entities claiming the marks and names or their products. Dell disclaims proprietary interest in the
marks and names of others.
Dell 2020 Energy Intensity Goal - Mid-term Report
Dell 2020 Energy Intensity Goal - Mid-term Report
2 June 2017
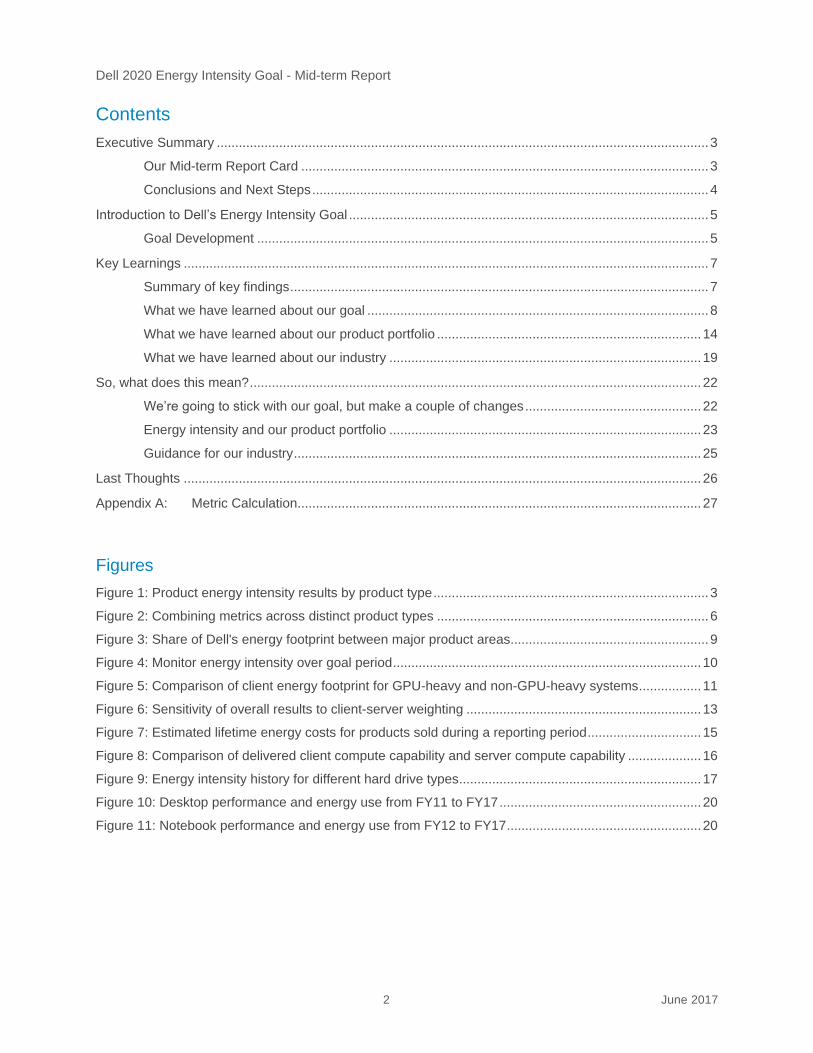
Contents
Executive Summary ...................................................................................................................................... 3
Our Mid-term Report Card ............................................................................................................... 3
Conclusions and Next Steps ............................................................................................................ 4
Introduction to Dell’s Energy Intensity Goal .................................................................................................. 5
Goal Development ........................................................................................................................... 5
Key Learnings ............................................................................................................................................... 7
Summary of key findings .................................................................................................................. 7
What we have learned about our goal ............................................................................................. 8
What we have learned about our product portfolio ........................................................................ 14
What we have learned about our industry ..................................................................................... 19
So, what does this mean? ........................................................................................................................... 22
We’re going to stick with our goal, but make a couple of changes ................................................ 22
Energy intensity and our product portfolio ..................................................................................... 23
Guidance for our industry ............................................................................................................... 25
Last Thoughts ............................................................................................................................................. 26
Appendix A: Metric Calculation .............................................................................................................. 27
Figures
Figure 1: Product energy intensity results by product type ........................................................................... 3
Figure 2: Combining metrics across distinct product types .......................................................................... 6
Figure 3: Share of Dell's energy footprint between major product areas ...................................................... 9
Figure 4: Monitor energy intensity over goal period .................................................................................... 10
Figure 5: Comparison of client energy footprint for GPU-heavy and non-GPU-heavy systems ................. 11
Figure 6: Sensitivity of overall results to client-server weighting ................................................................ 13
Figure 7: Estimated lifetime energy costs for products sold during a reporting period ............................... 15
Figure 8: Comparison of delivered client compute capability and server compute capability .................... 16
Figure 9: Energy intensity history for different hard drive types .................................................................. 17
Figure 10: Desktop performance and energy use from FY11 to FY17 ....................................................... 20
Figure 11: Notebook performance and energy use from FY12 to FY17 ..................................................... 20

Dell 2020 Energy Intensity Goal - Mid-term Report
3 June 2017
Executive Summary
In October 2013, Dell announced its Legacy of Good initiative of 21 corporate responsibility goals
covering a wide range of environmental, social and community issues. As part of this program, Dell also
announced our industry’s first portfolio wide energy intensity goal – establishing our intent to reduce the
overall energy intensity of our product portfolio by 80% by 2020, from a fiscal year 2012 baseline.1
We’re now roughly halfway between the announcement of that goal and its target date. As such, this is a
great opportunity for us to provide a more detailed, mid-term report – going into more depth than we are
normally able within our annual corporate responsibility report.
Figure 1: Product energy intensity results by product type
Our Mid-term Report Card
Overall, we’ve made a lot of progress. Including our FY17 results, we’ve reduced our product portfolio’s
energy intensity by 54% from our FY12 baseline. While this is slightly off the pace we need to hit in order
to achieve our goal, our progress to date demonstrates significant reductions in energy intensity with all
product types moving aggressively in the right direction. That being said, we’ve also found that this
1 We measure energy intensity as the sum of the expected lifetime energy consumption over all units sold during a reporting period divided by the sum of a measure of delivered capability (once again, over all units sold during a reporting period). For more information on our approach and calculation method, please see “Settling on Energy Intensity” on page 5 and Appendix A on page 27.

Dell 2020 Energy Intensity Goal - Mid-term Report
4 June 2017
number is somewhat subjective and is sensitive to how we weigh the relative capabilities of client and
enterprise products.
We discovered that monitors and GPU-heavy client systems,2 originally thought to be immaterial, are an
important part of our overall energy profile. Monitors, in particular, are responsible for over 20% of our
total energy footprint. While we have an internal approach for estimating monitor performance, we do not
have a means at the moment for determining the relative value of one unit of monitor performance vs. the
compute performance values of the rest of our portfolio.
We also discovered that our goal has a long timeframe when compared both to our industry’s technology
and our customers’ use of our products. The measurement approaches we started with are becoming
less relevant over time. As a result, we have adjusted our goal and assessment methodologies to keep
up with changes in our industry and customer’s usage models.
Our goal has also provided us insights into how our customers benefit from a focus on energy. Over the
last four years, for example, we have saved our customers an average of $470 million per year in
expected lifetime energy costs.
Through our goal, we have learned much about our products and the relationship between industry
trends and energy intensity. We have every reason to believe, as well, that we will continue to garner
new insights into our portfolio – insights that might have remained hidden had we not chosen this
particular goal.
Conclusions and Next Steps
We’ve already started to make changes to our goal, specifically how we measure progress based on
these insights. For example, we’ve changed the benchmark used to measure client system capability,3
and we will likely have to do the same for our server products as well. It is also likely that a separate
benchmark for GPU-heavy client systems will be necessary. We will continue to assess how we measure
monitor capability. We’re also going to take a new look at how we bring the different product types
together in our overall calculation.
We have identified key areas to watch, including monitor energy intensity, the effect of smaller form
factors on overall portfolio energy intensity, and the continuing transition to solid state drives in enterprise
servers and storage systems. We also need to do a better job of communicating how Dell innovations
help us capture the performance potential available in our suppliers’ products while aggressively reducing
lifetime energy use.
Our goal also has implications for how we engage with our peers and other stakeholders. We will
continue to actively engage in the development of energy efficiency and environmental programs such as
ENERGY STAR® and the Electronic Products Environmental Assessment Tool (EPEAT). We also plan to
present our findings and insights to our community, particularly where we feel industry or wider efforts will
be required for progress.
2 GPU-heavy client systems are those that predominantly ship with external graphics processors in addition to a primary CPU, (e.g., Dell Precision workstations).
3 Capability refers to the performance or work component of the energy intensity metric.

Dell 2020 Energy Intensity Goal - Mid-term Report
5 June 2017
Introduction to Dell’s Energy Intensity Goal
As part of its Legacy of Good program of Dell 2020 goals, Dell introduced the first portfolio-wide energy
goal in the IT industry back in October of 2013. Dell’s previous product energy goals covered specific
product segments and only covered a few years at a time. The goal introduced in late 2013 covered Dell’s
entire product portfolio and was scoped to carry Dell through to the end of the decade.
Goal Development
Development of the goal required working with each of the main product groups within Dell – servers,
storage, networking and client systems.4 During the development process, members of Dell’s Corporate
Responsibility and Environmental Affairs and Regulatory Compliance organizations worked with product
development teams as well as members of Dell’s CTO (Chief Technical Officer) organization.
Settling on Energy Intensity
Early work focused on identifying the type of goal that would be most appropriate for measuring and
tracking energy use in Dell products. The initial question to resolve was whether the goal should focus on
absolute energy use, or a ratio of energy use to a measure of work, which we refer to as energy intensity.
An absolute metric would be somewhat reflective of improvements in energy efficiency, but would be
clouded by factors unrelated to energy consumption – unit sales, for example, As a result, the team
settled on crafting an energy intensity goal.
Intensity metrics start with an absolute measurement, then normalize that measurement through an
additional factor that is appropriate for the topic or area being analyzed. In the case of product portfolio
energy consumption, the team had a number of choices. It could normalize energy consumption by
product revenue, it could normalize by units sold. Eventually, the team settled on normalizing through
some proxy for performance, with that proxy being different for each major type of product.
This also meant that the energy intensity metric for the goal would, at least for servers, be the reciprocal
of Performance per Watt (PPW). The relatively simple relationship between PPW and the energy intensity
metric helped communicate the goal to the client and server product teams.
While performance for client and servers systems was fairly straight-forward, based on performance
benchmarks, it was not immediately clear what the analogue would be for storage and networking
products. For these classes of products the team focused on storage capacity for storage systems and
maximum potential network bandwidth for the networking systems as our capability metrics.
Identifying and setting appropriate targets
With the basic form of the goal completed, the team focused on identifying appropriate and reasonable
targets. This work included looking at historical data on product performance and energy use, projecting
expected future performance and energy use based on product and component roadmaps, as well as
information from Dell suppliers.
4 Client systems include desktops, all-in-one devices, notebooks and tablets.

Dell 2020 Energy Intensity Goal - Mid-term Report
6 June 2017
Across all product types, system performance projections suggested that similar improvements in energy
intensity were possible. The team settled on an 80% reduction in energy intensity as the portfolio-wide
goal, expecting that some product types might under-perform, while others would over-perform. The team
did not have strong expectations ahead of time as to which product types would provide the best
performance.
Figure 2: Combining metrics across distinct product types
Comparing and combining across product types
One last issue remained with the goal – comparing energy intensity across different product types where
normalization factors, while all representing performance in some way, were fundamentally different. For
example, how was the team going to compare and/or combine results across product types that were as
different as storage systems and client notebooks?
The team settled on a two-part strategy, first developing an approach to compare across the enterprise
product types (servers, storage systems and networking systems), then comparing across the two
compute platforms (servers and client systems) by comparing and contrasting product type specific
benchmarks.
The enterprise comparison was enabled through an investigation of compute, storage and networking
provisioning for Dell’s virtualization farms. Virtualization is a technology that allows multiple applications to
share resources in a single system. It also enables other capabilities such as the packing and unpacking
of workloads so that they can be moved off compute infrastructure when not operating or moved between
systems to balance workloads.
Frequently, virtualization implementations will include separate compute, storage and networking systems
combined into a single, higher-level piece of IT infrastructure. These may also be architected to handle a
specific number of hypothetical, ‘average’ workloads. The ‘conversion factors’ between the three
functions were calculated based on the relative amount of compute power, storage capacity and

Dell 2020 Energy Intensity Goal - Mid-term Report
7 June 2017
networking capability provided for each workload. This was then converted into an estimate of an
equivalent number of Dell EMC PowerEdge M6205 systems by using the M620’s benchmark results.
Comparing client system performance to server system performance is not a trivial task. These systems
are designed to address very different types of workloads. The benchmarks that measure these systems,
therefore, do not directly provide comparable results. A review of these benchmarks, combined with
additional data, however, provided guidelines the team was able to use to create a dedicated conversion
factor between the two. This factor was used to convert client system compute performance into a
number of M620 equivalent systems.
One important note: monitors are missing from this approach. These products have been a relatively
recent addition to our goal. In addition, we do not have an approach today that enables us to compare
monitor capability with our compute, storage and networking based products. This is discussed in more
detail in a later section of this document.
Other benefits
The portfolio energy intensity goal enables some additional analysis and reporting. In order to calculate
this goal, it is necessary to calculate the lifetime expected energy consumption of all systems sold during
a given reporting period. This represents Dell’s annual downstream energy footprint. It also enables
calculation of lifetime carbon emissions associated with these products through application of an
appropriate emissions factor – which can also be considered to be Dell’s Scope 3, Category 11 carbon
emissions for use of sold product.6
Key Learnings
Summary of key findings
We are now midway between the initial announcement of Dell’s Legacy of Good program, including its
product portfolio energy intensity goal, and its 2020 endpoint. This is a good time, therefore, to assess
what we have learned so far.
Our findings break into three overall categories:
What we have learned about our goal
What we have learned about our product portfolio
What we have learned about our industry
In the first case, we have found that casting a complex problem into a simple goal carries with it
difficulties in communicating. There are some who question the goal’s value or its level of ambition. We
found that some product areas that we did not initially consider to be material to our results could not, in
fact, be neglected. We’ve also found that for a goal like this and a fairly long timeframe (seven years is a
long time in the technology sector), our notion of the goal and what it measures has to remain somewhat
5 The Dell EMC PowerEdge M620 is a blade server and part of Dell’s 12th generation of server products.
6 These are the carbon emissions that are generated by our customers’ purchase of electricity to run our products.

Dell 2020 Energy Intensity Goal - Mid-term Report
8 June 2017
fluid for the goal to continue to provide guidance. We’ve also found that the mechanics of simplifying the
goal to a single number create subjectivity in our assessment of progress. Specifically, whether we are
on-target or off-target depends on how we weight our client products with respect to our enterprise
products.
In the second case, we have been able to verify or support expected trends for which there has been little
good data previously available. We also found, however, a few things we did not expect. These types of
findings both suggest future areas of investigation as well as point out issues with the construction of our
metric.
In the last case, the news is not entirely unexpected. With respect to energy intensity, it’s becoming
harder and harder to recognize gains with each generation of product. This doesn’t mean that we have
reached the limits of energy efficiency in computing, but that we may have to reset our expectations going
forward as to the magnitude of the improvements we expect with each generation of product.7
What we have learned about our goal
Some people are just hard to satisfy
Despite the fact that Dell’s energy intensity goal was the first portfolio-wide, long-term energy goal for our
industry, we still received criticism early for our choice of goal and target. Most of this criticism could be
summarized by the following: “Isn’t this just a rollup of your component technical roadmaps?” The simple
answer is ‘yes’, but the simple answer hides the true complexities and challenges inherent in the goal.
To be competitive, we must ensure we meet our customers’ needs for great performance and full
solutions, while meeting their requirements for energy consumption. Our strategy to address both
performance and energy has two components.
First, we must be world-class system integrators, focusing on those areas where we have the greatest
control and opportunity to innovate. Second, we must be continually working with our partners on their
products and product roadmaps.8
Our strategy, system innovation and partner engagement, has been challenging for us to communicate.
The generation-over-generation improvements in processors or memory or hard drives are very visible,
very easy to discuss. It’s significantly more challenging to discuss improvements in how we have
integrated these components into the design of our final products and enable that performance at lower
energy demand. In a very real sense, it is easier for us to talk about our suppliers’ innovations than it has
been to talk about our own.
7 Please note this is not a product performance statement, but a statement pertaining to energy intensity or, alternately, “performance per Watt.” There are indications that component suppliers are looking to stay on performance curves, but doing so at an energy cost.
8 We’re providing a more detailed look into this strategy later in this document. See “Energy intensity and our product portfolio” starting on page 23.

Dell 2020 Energy Intensity Goal - Mid-term Report
9 June 2017
Monitors are material to Dell’s overall energy footprint
Well, we’re not perfect. We made some assumptions early that turned out not to be true. These
assumptions were about what needs to be covered within our metric, and what can be safely neglected
as not material to results. Our biggest miss was on monitors.
Figure 3: Share of Dell's energy footprint between major product areas
Figure 3 shows a comparison of energy footprint for three major product types: client systems, enterprise
systems (including servers, storage systems and networking systems) and monitors. Even for the first
year of our goal, monitors represented a little over 17% of Dell’s overall energy footprint. And that
proportion has grown over time.
For FY17, monitor energy footprint was a little over 21% of our aggregate portfolio energy footprint. Some
of this is due to monitor service lifetimes that are longer than other Dell products. That doesn’t, however,
explain the trend towards being an increasing share of Dell’s footprint. For that, we have to look into
customer behavior. Our customers are increasingly interested in higher-resolution, bigger displays with
higher brightness and better color reproducibility (color gamut), as well as more frequently adding an
auxiliary display for a laptop or second, and sometimes third, display to their desk. Our success in energy
reduction in the rest of our product portfolio is also a factor in that the lifetime energy use is falling at a
faster rate in the compute portion of the portfolio than it is in monitors.
So, a full picture of Dell’s portfolio energy footprint has to include monitors. Including monitors, however,
brings with it additional issues. We have a clear plan when it comes to measuring performance, or
capability, of our client and enterprise systems. There is no accepted industry ‘standard’ as to what
constitutes monitor performance or capability. Even if there were to be such a standard, there’s no clear
approach to how we would determine the relative value of one unit of monitor performance to our current
compute performance. This ratio is essential in order to calculate a composite portfolio energy intensity.
Even if we do not have a standard method for incorporating monitor ‘performance’ in with our products,
we’d still like to have a metric so that we can understand where monitor energy intensity is heading. And
we’ve been developing that metric. Our current internal proposal is to calculate monitor performance by

Dell 2020 Energy Intensity Goal - Mid-term Report
10 June 2017
taking the product of several key front of screen performance parameters – including screen size, number
of pixels, viewing angle, color gamut and brightness as these are key drivers of energy use in monitors.
While this metric attempts to account for the front of screen performance of the monitors it does not
account for inclusion of additional functionality such as USB ports, USB type C ports, wireless interfaces
etc. that are being integrated into some monitors. This performance metric seems to give us directionally
interesting information. This includes implications that monitors are not seeing energy intensity
improvements to the same degree as client or enterprise systems.
Figure 4 shows our estimate for monitor energy intensity since the start of the goal period, using the
above-mentioned metric as our method for calculating monitor capability.
Figure 4: Monitor energy intensity over goal period
The importance of including monitors in our analysis is one of our most important findings. When we look
at the footprint data, we see that the operational energy footprint of our monitors is just about on par with
the operational energy footprint of our client systems. The implication is that, in the office environment,
the monitor is becoming the most important energy consumer on the desk. Figure 4 shows that current
monitors are providing the same front of screen performance for about half the energy use today than
they did in FY 2012. This clearly demonstrates that monitors growing energy use footprint is not because
monitors are not making improvements but because client compute platforms are making improvements
at a faster rate.
Whether the lower rate of energy intensity reductions in monitors is due to an the nature of the
performance metric we developed or is due to a fundamental limitation of display technologies is not
evident at this time. Our energy intensity goal was created to a large extent relying on the performance
advancements and energy use reductions of silicon processes. Whether monitor technology can advance
at the same rate as silicon processes is unclear at this point. We know energy use is a key consideration
in our monitor development and will continue to implement cost effective energy savings measures.
We will continue to track monitor energy intensity using our metric as we also consider whether we
should make adjustments to the metric or if some other option would be better for our purposes.

Dell 2020 Energy Intensity Goal - Mid-term Report
11 June 2017
Turns out GPU-heavy clients are material to our energy footprint as well
As with monitors, when we first started calculating our energy intensity metric, we felt we could discount a
couple of Dell product lines, namely our Precision Workstations and our Alienware gaming products. The
belief was that the volume of these products was sufficiently low as to be negligible, compared to the vast
volume of other notebook and desktop products shipped by Dell. Well, we were wrong here, too.
Figure 5: Comparison of client energy footprint for GPU-heavy and non-GPU-heavy systems
These systems are architected for high performance, whether being used for engineering design or
analysis, media production, software development or gaming and entertainment. They are the
workhorses of the client system space. Great performance, however, does not come without an energy
cost. While external graphics processors will contribute somewhat to increased energy consumption,
these systems also typically include high-end primary processors and chipsets, large memory capabilities,
greater expandability, and premium audio systems. Mobile versions of these products also include high
end displays. All of these components and capabilities contribute to a larger lifetime energy footprint.
Figure 5 shows how the footprint of these systems (Dell’s Precision Workstations, Mobile Workstations
and Alienware product lines) compares to the balance of Dell’s client systems. In FY12, these systems
only represented close to 16% of our overall client energy footprint. By FY17, however, that share had
grown to over 26%.
Looking deeper, this trend is a testament to the progress that’s been made on the lifetime energy
reductions of mainstream desktops and notebooks. In actuality, the absolute energy footprint of the GPU-
heavy client systems has seen a slight decline even while unit volumes have been increasing. For the
more mainstream systems, however, Dell’s absolute energy footprint has almost been cut in half since the
goal’s baseline year!
It is essential to point out here that for the customers of these products the productivity enabled by the
performance of these systems far outweighs the cost of the energy they consume. The applications for

Dell 2020 Energy Intensity Goal - Mid-term Report
12 June 2017
these products are creating an ever increasing demand for higher performance. Customers in this space
are generally unwilling to accept energy reduction enhancements that sacrifice performance. This
requirement often constrains the application of energy reduction techniques we use in the rest of the
client portfolio and in many cases may drive future designs to increase lifetime energy as opposed to
reducing it. Applications such as virtual reality are driving the high end graphics capabilities into lower end
platforms that had not previously needed this level of graphics processing capability.
So, when we see the GPU-heavy systems showing a greater share of Dell’s client system footprint, it’s
not because they’re demanding more energy collectively, but because the other systems are demanding
significantly less.9 It is also important to point out that this section is dealing purely with the cumulative
lifetime energy footprint of these products and not on their energy intensity. Historically the performance
gains in GPU heavy products are much larger then mainstream systems. We will be evaluating whether
our current performance modeling in these products adequately reflects the true gains in performance
these products achieve.
Static metrics can lose relevance over time
We’ve also discovered that, for a goal of this type, a static metric will lose relevance over time.
Our energy intensity metric requires the collection of both performance and power information on our
systems. For client PC systems,10 this meant that we needed a benchmark that collected this data while
running an active workload simulating a typical user’s tasks and actions. When we first started tracking
against our goal, the SysMark 2007 office productivity benchmark was the most appropriate tool for these
measurements. This benchmark tool has also been our go-to workload for our client energy calculator.
The way our customers use our products, however, changes over time. As end-user activity patterns shift
and applications evolve, benchmarks such as SysMark 2007 require revision to retain relevance.
In order to minimize effects and effort associated with revising existing data on older systems, we have
stayed with SysMark 2007. Unfortunately, we have reached the end of its useful life as a measurement
tool. SysMark 2007 does not run on the latest operating systems (Win10); and we cannot run its preferred
operating system (Win7) on our latest hardware platforms.
Beginning with this year’s measurement, we have switched to SysMark 2014 and converted older system
data to scale appropriately.
One consequence of this shift: the newer benchmark shows a larger percentage gain in performance
from FY2012 to current systems than the older benchmark. We attribute much of this to the significant
investment in transistor count associated with integrating graphics into CPU silicon. The subsequent
increase in graphics performance, as well as other improvements in system hardware and software, are
better represented by the newer benchmark’s updated workloads.
9 One more thing: we’re also seeing increasing customer interest in these products. I.e., their share of our unit sales are increasing. This also plays a role in the footprint balance between GPU-heavy and non-GPU client systems.
10 Important to remember, as well, that when we crafted this goal, we believed we could exclude workstation and gaming products as immaterial due to unit volumes.

Dell 2020 Energy Intensity Goal - Mid-term Report
13 June 2017
Our portfolio energy intensity goal is sensitive
Specifically, it’s sensitive to the manner in which we weight client performance and server performance.
When we were first considering this goal, we thought it was very important to have a portfolio-wide
perspective. That meant that, sooner or later, we were going to have to have some way to relate client
system performance to server performance. Now, these are similar systems, in that they both ‘compute’.
The similarities, however, stop there.
The type of work these systems do is very different – not only in terms of the type of work being
performed on them, but also the very nature of the work. With the exception of some workstations, we
typically don’t ask client systems to perform complicated queries on large databases. Nor do we ask them
to forecast the weather or serve up web pages… typically. Similarly, we don’t ask servers to run user
interfaces or office applications.11
Figure 6: Sensitivity of overall results to client-server weighting
Performance benchmarks for server systems are architected to focus on the workloads most common or
best suited for that environment, Client system benchmarks do the same. And since they focus on
different types and collections of workloads, they’re really not measuring the same thing. Yet, to gauge
our efforts across our portfolio, we still want to aggregate the two.
So, we used an approach that offered a reasonable comparison. However, this still carries with it
subjective aspects. We believe we’re close, but, frankly, any performance measurement is just an
11 Well, this isn’t completely true. Running virtualized desktops on servers in data centers is becoming increasingly common. But then, we’re not talking one server, one app, one user. We’re talking one server, many apps, and many users.

Dell 2020 Energy Intensity Goal - Mid-term Report
14 June 2017
estimate. To measure true performance, we’d have to know how you use your machine, and tune a
benchmark specifically to your needs.
Now, math can be your friend... sometimes. If server and client systems were both seeing the same rate
of reduction in energy intensity, and for the same reasons, the weighting factor would be unimportant. It
turns out, however, that while our client and server systems are seeing similar energy intensity
improvements, they’re seeing them for two different reasons. Client system energy intensity is declining
mainly because the systems are significantly reducing lifetime energy use with some improvements in
performance –in other words, client energy intensity is decreasing. Server energy intensity is improving
because we are delivering significantly more compute capability now, in our server systems, than we
were a few short years ago with some improvement in lifetime energy use.
As a result, our overall number is sensitive to how we weigh the two product types. With our current
weighting, we’re seeing a portfolio-wide reduction in energy intensity of ~54% since our baseline year. If
we weigh server performance more, we can make the reduction even higher. If we weigh client
performance more, then our reduction is lower.
The lesson here is that it’s probably not that important to pay attention to the last decimal point of detail in
our calculations. What’s more important are the trends and general magnitude of improvements – as well
as the insights that we glean about our goal, our portfolio and our industry. As long as our approach to
calculation is consistent, the guidance and insights should be directionally correct.
While the above discussion focuses on the relative capabilities of server and client systems, some of the
same issues pertain to our storage and networking products. Though these products have, admittedly, a
smaller share of our unit sales, our approach to weighting all of the different product types may be under-
representing the importance of these products. This will be something we need to look at in more detail in
the future.
What we have learned about our product portfolio
Our customers’ energy costs and our downstream carbon footprint are related
One of the key components of our metric is the total expected lifetime energy consumption for the
products we sell in a given reporting period. This allows us to estimate how much our customers will have
to spend to power the equipment they purchase from us. It also allows us to estimate our downstream
carbon footprint for “Use of Sold Product.”

Dell 2020 Energy Intensity Goal - Mid-term Report
15 June 2017
Figure 7: Estimated lifetime energy costs for products sold during a reporting period
Figure 7 shows the history of both lifetime energy costs and downstream carbon emissions (use of sold
product) since the energy goal’s baseline year. This data underlies one of the more important aspects of
the goal – better data as to how our efforts affect our customers. Prior to the establishment of this goal,
we could estimate energy costs for a given model over time, but we did not have a way to determine the
overall effect on our customers, nor could we relate these costs to the total cost of ownership of our
products.
The benefits to our customers have been significant, though a bit challenging to calculate. One approach,
however, is to estimate how expected lifetime energy costs change if one uses energy intensity data from
previous years to calculate it. For example, we estimate our customers’ expected lifetime energy costs
from their FY17 purchases to be a little over $2.2 billion. If the energy intensity of our products had not
improved between FY16 and FY17, our customers would have had to have spent an additional $380
million during the lifetime of those FY17 purchases. This is not a one-year occurrence. In fact, for the past
four years, these savings have averaged over $470 million each year.
In addition, to financial benefits, though, we also help our customers with their environmental footprint.
Our downstream carbon emissions due to sold product are part of our customers’ operational Scope 2
carbon emissions.12 For many of our customers, tracking and managing their carbon emissions is an
important aspect of their corporate responsibility programs.
We do have one important caveat with respect to our sold product impact estimates. We are not
attempting to estimate energy ‘uplift’ due to power distribution and cooling architectures. This uplift is very
customer, location and situation dependent. For facilities where data is available, data centers for
example, the data is not granular enough for us to use in our modelling. In addition, there is very little
12 Scope 2 carbon emissions are that portion of an organization’s carbon footprint that are associated with the purchase of electricity, steam or other sources of energy.

Dell 2020 Energy Intensity Goal - Mid-term Report
16 June 2017
information available on power and cooling implications for residences, office environments, and data
rooms and closets belonging to small- and medium-sized businesses. The effect of this is that we are
likely underestimating how much we are saving our customers, both with respect to operational expenses
and environmental footprint.
We’re shipping more and more compute capability through our enterprise products
We knew this was happening, but we really didn’t have the data to describe it well … until now. While it
is subject to how we weight client compute performance relative to server compute performance, in our
baseline year, most of the compute capability we shipped was provided by notebooks and desktops –
(a ratio of a little more than four to one compared to servers). For FY17, this ratio was down to about five
to three. More and more, our delivered capability is coming from our server portfolio.
Figure 8 depicts the relative mix of delivered client and server compute capability. As we begin to
incorporate EMC products into these calculations, the mix will bias even further towards enterprise
products. It is not out of the question that we will see delivered capability from our enterprise products
reaching par with our client product portfolio during the timeframe of this goal.
Figure 8: Comparison of delivered client compute capability and server compute capability
Customer preferences affect our portfolio energy intensity
This is one of those conclusions that, on the surface, seems patently obvious. Our data, however, gives
us an opportunity to look under the surface, and identify specifics.
For both desktop and mobile products, customers have been increasingly interested in smaller product
form factors (as measured by total product volume). For mobile systems, we’ve reduced physical footprint
by eliminating space between the display and the edges of the system and have aggressively driven
thinner and thinner designs. For desktop systems, we’ve reduced the size of many of our existing
products, while introducing “micro form factor” products.
Reducing product size, however, makes heat removal more difficult. One solution is to reduce processor
thermal design power (TDP). TDP defines the maximum sustained power level the processor can use to

Dell 2020 Energy Intensity Goal - Mid-term Report
17 June 2017
do work. Reducing TDP, not surprisingly, reduces processor performance. Our data has allowed us to
measure these effects across our client portfolio.
Specifically, in calendar year 2011, the mainstream processors in our mobile products typically had a TDP
of 35 Watts. By calendar year 2016, these processors had a TDP of 15 Watts – this reduces the
processors available energy to do work by more than 50%.
One of the consequences: we have not seen all of the improvements in client product energy intensity
that we expected. One of the other consequences, however, is that the absolute energy footprint of our
client portfolio has gone down faster than expected – just not enough to offset the reduction in
performance increases. But, our customer buying patterns suggest that they are okay with the trade-off.
They prefer the smaller systems.
Solid State Drives (SSD) are tricky
We know that our energy intensity metric provides valuable insights and guidance. We also know,
however, that it’s overly simplistic. What the metric tells us about solid state drives is a little counter-
intuitive, as least at first. In turn, solid state drives and their place in IT architecture tell us a lot about
where our metric falls short and how storage systems are evolving over time.
Figure 9: Energy intensity history for different hard drive types
The move to solid state drives in both client and enterprise systems is driving significant improvements in
performance. This is due to the speed with which these drives allow access to non-volatile data storage.
With respect to storage capacity, however, they are more energy intensive than their spindle-based
counterparts. At least, they were during our baseline year.

18 June 2017
Dell 2020 Energy Intensity Goal - Mid-term Report
Drive speed is a big factor in energy intensity. Faster spindle-based systems tend to have a smaller
capacity, without a commensurate reduction in energy consumption. The ‘fat’ drives provide the most
capacity, but at the slowest speed. This is evident in Figure 9, where the 7200 rpm drives show to be the
least energy-intense.
That solid state drives were the most energy intense, during our baseline year, was not a surprise. At that
time, the capacity of these drives was fairly small, with energy consumption on par with that of other
drives of similar physical size. In the years, since, however, they have seen the steepest reduction in
energy intensity of all drives types. Solid state drive energy intensity eclipsed the 15k rpm drives within a
year of our baseline, then the 10k rpm drives a couple of years later.
Perhaps most interesting, however, is how fast solid state drives are closing the gap with the spindle-
based drives. If trends continue, SSDs, collectively, will be less energy intense than spindle-based drives
before the end of the goal timeframe. Two to three years after that SSDs may be even less energy-
intense than the biggest 7200 rpm drives.13
As mentioned earlier in this section, SSDs also highlight some of the weaknesses inherent in our portfolio
energy metric. The importance of SSDs is not that they’re silicon-based or that they may eventually be
less energy intense than spindle-based drives. Their value lies in being able to read and write data very
quickly. This is part of the value they bring. It also happens to be an aspect of these products that is not
included in our metric. So, even though this is where this particular product shines, it’s not reflected in our
metric.
Storage systems are more than the sum of their parts
Our metric is really good at looking at individual drives or types of drives. Real-world storage
architectures, however, are rarely homogeneous. They consist of many types of drives, with many
different use models. This is natural as the data storage in these systems is also not homogeneous. As a
result, the true energy intensity of an installation is not based on the sum of the parts, but how those parts
are put together into a solution, and how that solution is then operated. Our metric can help spot some
trends, but a comprehensive look at storage energy consumption requires some additional
considerations.
Solid State Drives (SSDs) are a prime example of this. They’re becoming a greater and greater part of
storage architectures. From our data, though, we know that SSDs are currently more energy intensive
than their spindle-based counterparts (i.e. spinning disks). That being said, SSDs are able to access data
much faster than other drives.14 Achieving similar performance with only spindle-based drives leads to
deployment of more drives than necessary and use of faster, 15k rpm drives – both of which increase the
energy intensity of the system. This is not addressed by our metric.
One type of solution where SSDs both help performance and help energy use are tiered storage
architectures. In these solutions, small fast drives provide access to the most commonly used data while
large slow drives provide access to less commonly used data or large data files that are best read
13 Please note “energy intensity” is not the same as “cost intensity.” As of the publication of this document SSD’s still demand a significant price premium over spindle-based drives.
14 This capability is measured in “IOPS” or input/output operations per second.

Dell 2020 Energy Intensity Goal - Mid-term Report
19 June 2017
sequentially. In these cases, the complete solution frequently uses less energy than an alternate solution
comprised only of one type of drive. Our metric does not consider this.
Dell EMC takes this even further with its Fully Automated Storage Tiering (FAST) technology. FAST
leverages combinations of flash, high rpm performance drives and low rpm high-capacity drives to
achieve greater performance and capacity levels at significantly lower power levels than can be achieved
by spinning drives or SSDs alone. Other storage innovations that enable Dell customers to meet their
storage needs with significantly lower overall energy consumption include compression, data
deduplication, copy data management, and geographically reduced erasure coding. Based on the way
the portfolio energy intensity metric is calculated, however, we are unable to derive how much benefit was
delivered to our customers as energy savings due to these features.
What we have learned about our industry
Client system performance trends
As we were developing our goal in late 2012 and the first half of 2013, we looked at both performance
and energy projections across a wide range of products. These expectations, along with our assessment
of our capabilities and progress, led us to the 80% reduction target for portfolio energy intensity. The
client portfolio was particularly important in the early assessments as that was where the majority of our
footprint and our delivered compute was based. What has happened in the client space was somewhat
different than what we had expected.
To illustrate the history of our client products during the goal period, we’ve averaged performance
estimates and expected lifetime energy consumption across all models of a given product type for each
year (desktops and notebooks). Figure 10 and Figure 11 show this data for desktops and notebooks
respectively. The two product types tell somewhat different stories, though the result is much the same.
Desktop products saw a 30% improvement in performance from FY11 to FY13. The three year period
from FY14 to FY16, though, showed a performance improvement of only 10%. So, what happened? Well,
FY14 saw the introduction of Intel’s Haswell architecture with a corresponding reduction in processor
Thermal Design Power (TDP).15 Reducing TDP enabled smaller desktop form factors, including the
introduction of the micro form factor. While the architecture changes and focus on lower TDP led to a
leveling out of performance, though, it also resulted in a significant reduction in lifetime energy use.
The FY15 results reflect a delay in introduction both of Intel’s Broadwell architecture and the transition to
the 14-nanometer device fabrication node. In addition, given that we refreshed our desktop platforms in
FY2015, but did so without new model introductions, we had no new data and no indicated progress for
much of the desk top portfolio. This is another unexpected discovery about our goal data collection. Our
data collection process for client products is part of the new product development process. Since we
generally introduce new models every year, this provides sufficient data annually to represent our
progress. If product introductions are sufficiently delayed or we extend an existing product family instead
of introducing a new family of products we can end up with a lack of new data in a given year. In FY16
and FY17, the 14-nanometer technology node was introduced. In addition, with the Haswell refresh and
15 Thermal Design Power is the maximum amount of heat that can be dissipated by a processor during typical operation.

Dell 2020 Energy Intensity Goal - Mid-term Report
20 June 2017
the desktop transition to the Skylake architecture, we saw significant performance improvements in
desktop systems.
Figure 10: Desktop performance and energy use from FY11 to FY17
Figure 11: Notebook performance and energy use from FY12 to FY17

Dell 2020 Energy Intensity Goal - Mid-term Report
21 June 2017
Notebook components and architectures tell a similar story. As with our desktop products, the introduction
of Intel’s Haswell architecture in FY14 led to a significant drop in lifetime energy consumption. The
reduction in processor TDP, however, affected performance of the notebook products. The Haswell
refresh in FY15 recovered the lost performance from the previous year and provided an additional
improvement in lifetime energy use as well.
FY16 saw the launch of Broadwell in mobile and was accompanied by significant performance
improvements, but little change to lifetime energy use. In FY17 we see the results of Skylake and a few
Kaby Lake systems along with a more complete transition to lower TDPs in our sampled systems.
The processor is the primary engine for performing work in our platforms and thus is a key contributor to
energy intensity in our notebooks and desktops. Continued advancements in processor architectures and
process technology transitions are necessary for us to see the performance improvements we expected
when we began our goal. The complexities of new process technologies have slowed down transitions in
our compute engines as evident in Intel’s change from a tick-tock model to a tick-tock-tock model for new
product introductions. We’re now expecting process technology transitions every three years instead of
the previous two years and will require architectural enhancements in between process technology
transitions to maintain expected performance gains.
Notebooks have another complicating factor in that they include a built in display. This display is subject
to the same limitations described for monitors and customers often gravitate towards larger, brighter and
higher resolution displays. As we continue to drive down the energy use of system electronics in
notebook systems the display is becoming an ever larger percentage of the total energy use budget. This
added load has a tendency to reduce the effect of system electronics power reductions on the energy
intensity metric and reduces the resulting gain in energy intensity. Notebooks also have long been
maniacally focused on energy use due to our customer’s desire for longer battery life and large reductions
in energy use are not easy to find.
For both desk tops and notebooks we also have an economic constraint to deal with in applying energy
reduction design enhancements. Using our lifetime energy use model and an energy cost of $0.15 per
kilowatt hour we see the average desk top with an annual energy cost of about $6.40 and notebooks with
an average annual energy cost of about $3.00. We must assure the end user costs of potential changes
are of equal or lesser magnitude than the resulting energy savings while still delighting our customers and
maintaining our competitiveness in the market.

Dell 2020 Energy Intensity Goal - Mid-term Report
22 June 2017
So, what does this mean?
The insights and guidance above are interesting, but are they actionable? What do they mean and what
is Dell doing as a result? As with the insights themselves, we can break this down into three areas. What
are the implications for our metric and goal? What has this meant or what does it mean for our products?
What does this mean for our industry?
We’re going to stick with our goal, but make a couple of changes
Results so far and expectations for the future
In our annual Corporate Responsibility (CR) report, we provide the results of the overall portfolio energy
intensity reduction to date. There’s a lot of data beneath that, and regardless of the sensitivity of our
overall results to our rollup methodology, the more detailed results provide an optimistic picture (see
Figure 1 on page 3).
During the timeframe of our goal, overall portfolio progress has tended to follow our progress within client
products. This is not surprising as, during our baseline year, we were shipping significantly more compute
capability in our client products than we were in our enterprise products, while energy footprint between
the two areas were similar.
As we continue to the end of the goal timeframe, however, we expect enterprise products to play an
increasingly important role in the overall metric. This will come as a result of continued gains in server
performance, as well as the incorporation of legacy EMC products into our portfolio.
Figure 1 suggests we’ll fall a little short of our goal, however underperformance of our client portfolio in
FY14 and FY15 was a major contributor to this as previously discussed. The client portfolio performance
since FY15 has been exemplary and done much to close the gap. We believe our target is still within
reach
We will continue to measure, track and report
Obviously, we’re going to continue to measure and track against our goal. After all, we’re only halfway
through the measurement period. Our goal and metric isn’t perfect, but it seems to be meeting its
intended purpose. It helps to highlight product energy consumption both within Dell and in our greater
community. It tells us, to some degree of accuracy, how we are doing. The measurements, calculations
and analysis have taught us much about our portfolio; and we have no reason to think we won’t continue
to learn more. Some of these insights are merely interesting, but others are actionable and will drive
decisions through the rest of the goal period.
We are also going to be transparent about our goal, how it’s calculated and what it’s telling us. We
understand there will always be critics. There will also be fervent supporters. Likely, the largest part of our
audience will be somewhere between the two extremes. The best approach we can take is to be open
and honest, both with our audience and with ourselves. As mentioned earlier, we know this goal isn’t
perfect. It can be hard to calculate. The relative importance of client products to enterprise products is
somewhat subjective. Reducing the performance of a portfolio as broad as Dell’s into a single number is
an aggressive simplification – one that tends to hide important detail. Plus, we still don’t have a firm
handle on how to deal with monitors.

Dell 2020 Energy Intensity Goal - Mid-term Report
23 June 2017
We don’t want, however, for great to be the enemy of good. Had we not pursued the metric, we would not
be fully aware of the importance of monitors or GPU-heavy client systems to our overall footprint. We
would not have an understanding of the degree to which we have reduced the energy footprint of our
client portfolio.
Review, and if necessary, update our methodologies
Our industry changes quickly. Measurement approaches that were appropriate for our baseline year have
been supplanted by newer techniques that are more representative of today’s compute demand and end
user workloads. In fact, in some cases, benchmarks that were relevant when we began our calculations
will not even run on newer machines.
We’ve already recognized and accommodated this to some degree, as evidenced by our switching from
the SYSmark 2007 client benchmark to the SYSmark 2014 benchmark for this reporting period. Switching
benchmarks is not trivial – in addition to calculating results for this reporting period (FY17), we also had to
recalculate prior year results using the updated benchmark and review how we weight client compute
capability with respect to server compute capability. While we have not started a similar effort with respect
to server benchmarks, our benchmark of choice, SPECint_rate2006 is now a decade old. It is likely that
we will have to replace it before the end of our goal timeframe.
In addition to the change in treatment of client systems, however, we’re likely going to need to treat GPU-
heavy systems separately. They’re playing an increasingly large role in our product portfolio. Plus, despite
its improvements over SYSmark 2007, SYSmark 2014 is not completely representative of how these
systems are used. As such, it does not fully capture the performance improvements GPU-heavy clients
systems have seen over the past few years.
We are going to continue, as well, to look at, and potentially refine, our metric for estimating the
performance capability of our monitor portfolio. This may also mean that we bring outside stakeholders,
peers, suppliers and competitors into the effort as well – a monitor performance capability metric is of
value to Dell, and may be of value to our industry as well. While we will work on this metric, though, one
issue may not be resolved during the timeframe of our goal – we may not be able to develop a credible
approach that will allow us to thread monitor capability into our overall portfolio calculations for energy
intensity. I.e., monitor energy intensity may have to stand on its own for a bit.
In addition to measuring the capability of the various product types in our portfolio, we may need, as well,
to update how we bring these various product types together into an overall result. While we want to
continue to present an accurate picture as to progress within our portfolio, we also want to make sure
we’re not marginalizing one product type’s performance with respect to the others – whether that
performance is relatively strong or relatively weak. The former case allows us to get credit for good work.
In the latter case, though, we definitely don’t want our approach to an overall rollup to hide a lack of
progress in a particular area.
Energy intensity and our product portfolio
We mentioned earlier that our strategy for reducing the energy intensity of our products has two
components: being a world-class system integrator and working closely to inform and influence our
suppliers. We also mentioned earlier that this strategy and its effects have been hard for us to
communicate. Well, we’re going to make an effort here to address that.

Dell 2020 Energy Intensity Goal - Mid-term Report
24 June 2017
Dell as a system integrator
As a system integrator, we do far more than just integrate the parts provided us by our suppliers. Keeping
Dell competitive requires innovation and technology development. With each new product, we balance
performance, cost, energy use and product features. Frequently, our design teams find that new design
features and design improvements for reducing energy use carry incremental costs. Resolving these
trade-offs are some of our most difficult design challenges. While maximizing performance has been a
historic requirement in this process, environmental aspects, including energy efficiency, are now key
elements in our development process and crucial for marketplace success.
The result of this focus is that Dell has been the developer or leader in many innovations pertaining to the
energy use of IT equipment. Some examples of our accomplishments:
Dell was the first PC manufacturer to transition 100% of its notebook portfolio to LED backlights
enabling longer battery life and eliminating mercury from our notebook systems.
Dell was a leader in reducing the energy draw from AC Adapters when not in use, breaking the
100mW no load power level on AC adapters at a time when the industry was transitioning to
below 500mW.
Since release of our 11th generation of servers in 2009, Dell has been shipping Dell Active
Power Controller processor power management, enabling improved efficiency at varying loads
and OS agnostic processor power management for our customers.
Enabling the reduction in energy consumption while continuing to deliver the features and performance
our customers require has long been an integral part of our technology and product development
process. In fact, of the over 9800 patents in Dell EMC’s portfolio, over 300 relate to power management,
energy savings, battery management, battery life, or related areas.
Dell as an industry and partner influencer
For over a decade, Dell has encouraged our silicon suppliers to consider energy efficiency as they
develop their future technologies and process capabilities. In some cases, we have even prioritized
energy use over performance. This focus has served our customers well. Our desktops use less energy.
Our mobile products have longer battery lives and can be smaller and lighter.
Today, Dell continues to inform and influence the technology roadmaps of our partners. We drive
strategic and differentiated feature requirements that enable the delivery of great products and solutions.
With our direct model and customer relationships, Dell is well positioned to define, develop and deliver
products that delight our customers.
Dell and EMC together
Like Dell, legacy EMC had its own goals with respect to product energy efficiency – goals more
specifically tied to their portfolio of storage products and storage systems. That being said, both of the
legacy companies had very similar attitudes and ambitions with respect to energy consumption, even if
their approaches were slightly different. While the legacy Dell goal focuses on the overall product
portfolio, the legacy EMC goals focused specifically on drive energy efficiency and continuous product
improvement. Bringing the two together makes each stronger.

Dell 2020 Energy Intensity Goal - Mid-term Report
25 June 2017
So, we’re keeping the legacy EMC disk drive efficiency goal. This goal aspires to ensuring that disk drive
energy efficiency is improving each year. But, EMC has also been aware that storage systems are not
just the sum of their components. They are complex integrated systems, reliant not only on drive
technology, but architecture and software as well. In particular, every generation of storage platform
software must be designed to take full advantage of each generation’s hardware efficiency improvements.
We’re also keeping the legacy EMC goal on demonstrating continuous improvement in both software and
hardware efficiency. In particular, we’re working to ensure that each generation of products that comes
through our storage and data protection product lines is assessed with respect to energy efficiency and
demonstrates equal or better efficiency than the previous generation.
As such, we will continue to report a separate metric (for products in our storage and data protection
lines) that tracks our progress in capturing the potential in our component suppliers’ products through
software that performs equal or better on equivalent hardware from release to release.
In total
Our strategy works. The results can be seen back in Figure 1. Our overall energy intensity results have
seen, and will continue to see, significant year-over-year improvements. We innovate where we see our
greatest opportunities to affect the final product. In addition, we actively influence the definition of our
technology partners’ future products. We use our relationships with and feedback from our customers
combined with our knowledge of future technology capabilities to envision and define future products that
will meet, and where possible exceed, our customer’s expectations. We also look forward to seeing what
the combined Dell EMC will do to reduce IT energy intensity.
Guidance for our industry
We believe that we have a responsibility (as industry leaders) to actively participate and engage in the
development of energy efficiency and public procurement programs like ENERGY STAR, US Department
of Energy (DoE), European Union Energy-related Products (ErP) Directive, Electronic Products
Environmental Assessment Tool (EPEAT), and others. To that extent, we look forward to sharing our
findings with our industry, non-profit, and regulatory partners. We encourage our industry peers,
customers and stakeholder groups to also take a seat at the table. The combined knowledge and
perspectives of a diverse set of stakeholders is vital to ensure that these programs are using the most up
to date information on technology roadmaps, meet the needs of market trends, and utilize current energy
and performance data sets to define appropriate targets for long term improvements.
We have the responsibility to represent the ‘voice of the customer’ in the setting and development of
energy efficiency and other environmental standards and programs. We must ensure we meet our
customers’ needs for great performance and full solutions, while meeting their requirements for energy
consumption. If done correctly, these programs can have a positive impact, not only on our environment,
but also for our customers by reducing their energy costs, cutting down on e-waste, and extending the
useful life of their products
We continue to encourage all of our technology providers to maintain their focus on energy efficiency as
they develop their future technologies and process capabilities. Consider carefully the needs of the
customer when weighing energy use and performance tradeoffs.

Dell 2020 Energy Intensity Goal - Mid-term Report
26 June 2017
Last Thoughts
Overall, we're happy with our goal, the level of ambition and what we've seen to date. Of course, we
know our goal isn't perfect. We know the methods we use to calculate our progress against the goal aren't
perfect. We also see that our progress so far is slightly off target. That being said, solving the challenges
involved in setting up the measurement process, and garnering the insights we have about our products
and our industry have been valuable. We now have a comprehensive, broad dataset on IT energy
intensity, with a timeframe long enough to show important trends.
At the same time, we’re only halfway through our goal. While our dataset and measurement process has
given us insight into the past, it also provides guidance for the future. We have a number of trends on our
‘watch list.’ And, it would be naïve for us to think that there’s not more to learn; that there aren’t other
important trends emerging. We now have an important sensing mechanisms for ourselves and for our
industry. As we learn more about the trends we’ve seen, and as we discover new things, we look forward
to sharing our insights with our peers in our industry, with our suppliers, with our customers, and with the
wide range of stakeholders to whom IT energy use is important.

Dell 2020 Energy Intensity Goal - Mid-term Report
27 June 2017
Appendix A: Metric Calculation
Calculating the portfolio metric requires two set of information – sales data for the relevant reporting
period and power and performance models for products in the portfolio. At the highest level, the lifetime
expected energy consumption (LEEC) for all units sold in a reporting period for each product type is
calculated by summing the product of the number of units sold of a given product model and the LEEC for
that model, across all models within a given product type. A similar calculation is made for delivered
capability for each product type.
Equation 1: Energy intensity equations for client, server and networking systems
𝐿𝐸𝐸𝐶𝑝𝑟𝑜𝑑𝑢𝑐𝑡 𝑡𝑦𝑝𝑒 = ∑ (𝑈𝑛𝑖𝑡𝑠𝑆𝑜𝑙𝑑𝑚𝑜𝑑𝑒𝑙 ∗ 𝐿𝐸𝐸𝐶𝑚𝑜𝑑𝑒𝑙 )
𝑎𝑙𝑙 𝑚𝑜𝑑𝑒𝑙𝑠 𝑖𝑛 𝑝𝑟𝑜𝑑𝑢𝑐𝑡 𝑡𝑦𝑝𝑒
𝐷𝑒𝑙𝑖𝑣𝑒𝑟𝑒𝑑 𝐶𝑎𝑝𝑎𝑏𝑖𝑙𝑖𝑡𝑦𝑝𝑟𝑜𝑑𝑢𝑐𝑡 𝑡𝑦𝑝𝑒 = ∑ (𝑈𝑛𝑖𝑡𝑠𝑆𝑜𝑙𝑑𝑚𝑜𝑑𝑒𝑙 ∗ 𝐷𝑒𝑙𝑖𝑣𝑒𝑟𝑒𝑑 𝐶𝑎𝑝𝑎𝑏𝑖𝑙𝑖𝑡𝑦𝑚𝑜𝑑𝑒𝑙 )
𝑎𝑙𝑙 𝑚𝑜𝑑𝑒𝑙𝑠 𝑖𝑛 𝑝𝑟𝑜𝑑𝑢𝑐𝑡 𝑡𝑦𝑝𝑒
𝐸𝑛𝑒𝑟𝑔𝑦 𝐼𝑛𝑡𝑒𝑛𝑠𝑖𝑡𝑦𝑝𝑟𝑜𝑑𝑢𝑐𝑡 𝑡𝑦𝑝𝑒 =𝐿𝑖𝑓𝑒𝑡𝑖𝑚𝑒 𝐸𝑥𝑝𝑒𝑐𝑡𝑒𝑑 𝐸𝑛𝑒𝑟𝑔𝑦 𝐶𝑜𝑛𝑠𝑢𝑚𝑝𝑡𝑖𝑜𝑛𝑝𝑟𝑜𝑑𝑢𝑐𝑡 𝑡𝑦𝑝𝑒
𝐷𝑒𝑙𝑖𝑣𝑒𝑟𝑒𝑑 𝐶𝑎𝑝𝑎𝑏𝑖𝑙𝑖𝑡𝑦𝑝𝑟𝑜𝑑𝑢𝑐𝑡 𝑡𝑦𝑝𝑒
This process is somewhat more complicated for storage systems, as the ‘capability’ for a given unit is the
sum of the capacities of all drives configured for that unit – and this will vary from order to order. For that
reason, calculation of total delivered storage capacity requires analysis of individual orders shipped
during the reporting period. Lifetime Expected Energy Consumption for storage systems is calculated by
estimating the LEEC for all storage systems sold during a reporting period, assuming no drives are
installed, calculating the LEEC for all drives sold during the period, and combining the results.
Equation 2: Energy intensity equations for storage systems
𝐿𝐸𝐸𝐶𝑠𝑡𝑜𝑟𝑎𝑔𝑒 𝑠𝑦𝑠𝑡𝑒𝑚𝑠 = ∑ 𝐿𝐸𝐸𝐶𝑠𝑡𝑜𝑟𝑎𝑔𝑒 𝑠𝑦𝑠𝑡𝑒𝑚𝑠,𝑛𝑜 𝑑𝑟𝑖𝑣𝑒𝑠
𝑎𝑙𝑙 𝑠𝑦𝑠𝑡𝑒𝑚𝑠 𝑠𝑜𝑙𝑑
+ ∑ 𝐿𝐸𝐸𝐶𝑑𝑟𝑖𝑣𝑒𝑠 𝑠𝑜𝑙𝑑
𝑎𝑙𝑙 𝑑𝑟𝑖𝑣𝑒𝑠 𝑠𝑜𝑙𝑑
𝐷𝑒𝑙𝑖𝑣𝑒𝑟𝑒𝑑 𝑆𝑡𝑜𝑟𝑎𝑔𝑒 𝐶𝑎𝑝𝑎𝑐𝑖𝑡𝑦 = ∑ 𝐷𝑒𝑙𝑖𝑣𝑒𝑟𝑒𝑑 𝑆𝑡𝑜𝑟𝑎𝑔𝑒 𝐶𝑎𝑝𝑎𝑐𝑖𝑡𝑦𝑢𝑛𝑖𝑡 𝑠𝑜𝑙𝑑
𝐴𝑙𝑙 𝑠𝑡𝑜𝑟𝑎𝑔𝑒 𝑢𝑛𝑖𝑡𝑠 𝑠𝑜𝑙𝑑𝑖𝑛 𝑎 𝑟𝑒𝑝𝑜𝑟𝑡𝑖𝑛𝑔 𝑝𝑒𝑟𝑖𝑜𝑑
𝐸𝑛𝑒𝑟𝑔𝑦 𝐼𝑛𝑡𝑒𝑛𝑠𝑖𝑡𝑦𝑠𝑡𝑜𝑟𝑎𝑔𝑒 𝑠𝑦𝑠𝑡𝑒𝑚𝑠 =𝐿𝑖𝑓𝑒𝑡𝑖𝑚𝑒 𝐸𝑥𝑝𝑒𝑐𝑡𝑒𝑑 𝐸𝑛𝑒𝑟𝑔𝑦 𝐶𝑜𝑛𝑠𝑢𝑚𝑝𝑡𝑖𝑜𝑛𝑠𝑡𝑜𝑟𝑎𝑔𝑒 𝑠𝑦𝑠𝑡𝑒𝑚𝑠
𝐷𝑒𝑙𝑖𝑣𝑒𝑟𝑒𝑑 𝑆𝑡𝑜𝑟𝑎𝑔𝑒 𝐶𝑎𝑝𝑎𝑐𝑖𝑡𝑦𝑠𝑡𝑜𝑟𝑎𝑔𝑒 𝑠𝑦𝑠𝑡𝑒𝑚𝑠