Delivering value growth through the cycle - repsol.com · and circumstances described in the...
54
Strategic Update Delivering value growth through the cycle June 2018 1
Transcript of Delivering value growth through the cycle - repsol.com · and circumstances described in the...

Strategic UpdateDelivering value growth through the cycle
June 2018
1

2
Disclaimer
ALL RIGHTS ARE RESERVED
© REPSOL, S.A. 2018
Repsol, S.A. is the exclusive owner of this document. No part of this document may be reproduced (including photocopying), stored, duplicated, copied, distributed or introduced into a
retrieval system of any nature or transmitted in any form or by any means without the prior written permission of Repsol, S.A.
This document contains statements that Repsol believes constitute forward-looking statements which may include statements regarding the intent, belief, or current expectations of Repsol
and its management, including statements with respect to trends affecting Repsol’s financial condition, financial ratios, results of operations, business, strategy, geographic concentration,
production volume and reserves, capital expenditures, costs savings, investments and dividend payout policies. These forward-looking statements may also include assumptions regarding
future economic and other conditions, such as future crude oil and other prices, refining and marketing margins and exchange rates and are generally identified by the words “expects”,
“anticipates”, “forecasts”, “believes”, estimates”, “notices” and similar expressions. These statements are not guarantees of future performance, prices, margins, exchange rates or other
events and are subject to material risks, uncertainties, changes and other factors which may be beyond Repsol’s control or may be difficult to predict. Within those risks are those factors
and circumstances described in the filings made by Repsol and its affiliates with the Comisión Nacional del Mercado de Valores and with any other supervisory authority of those markets
where the securities issued by Repsol and/or its affiliates are listed.
Repsol does not undertake to publicly update or revise these forward-looking statements even if experience or future changes make it clear that the projected performance, conditions or
events expressed or implied therein will not be realized.
This document mentions resources which do not constitute proved reserves and will be recognized as such when they comply with the formal conditions required by the system
“SPE/WPC/AAPG/SPEE Petroleum Resources Management System” (SPE-PRMS) (SPE – Society of Pretroleum Engineers).
Some of the figures included in this document are considered Alternative Performance Measures (APM) in accordance with the guidelines of the European Securities and Markets
Authority (ESMA). Further information on APMs (definition, purpose, reconciliation with financial statement figures) may be found on Repsol´s corporate website.
This document does not constitute an offer or invitation to purchase or subscribe shares, pursuant to the provisions of the Royal Legislative Decree 4/2015 of the 23rd of October
approving the recast text of the Spanish Securities Market Law and its implementing regulations. In addition, this document does not constitute an offer to purchase, sell, or exchange,
neither a request for an offer of purchase, sale or exchange of securities in any other jurisdiction.
The information contained in the document has not been verified or revised by the Auditors of Repsol.

Repsol: a unique, integrated global position
1. As of 31/12/2017. 2. Includes 1.2 Million tons of Ethylene and 1.4 Million tons of other base Chemicals
Upstream Downstream Both
Core businesses:
Upstream and
Downstream
1 Million bpd refining
capacity
~2.6 Million tons of
base chemicals2
capacity
~700 kboe/d
production
~2.4 billion boe proved
reserves1
~4,700 service stations
3

12016-20
Strategic Plan delivery and
energy trends
4

A successfully-navigated journey delivering value and resilience
Repsol is now a double-geared engine with a strong Upstream and Downstream
Successful performance
in lower part of the
commodity cycle
Downstream
leads the EU industry
Upstream doubled in
size and cash positive
as of 2017
Redeploying capital for
the energy transition with
GNF divestment
Reset cost base
through efficiencies &
synergies
Maintained rating & built
financial flexibility
0.9x1
Net Debt /
EBITDA
51. As of 31/12/2017

Why a strategic update?
Delivery drives new targets…
A positive Downstream environment combined with worse than anticipated
Upstream cycle pushed Repsol to accelerate target delivery
1. Average Breakeven 2016-2020 2. Including GNF divestment of €3.8B 3. Since 2014 4. Reduction from 2015 TRIR (Total Recordable Incident Rate). Indicator based on 1 million worked hours. NOTE: CAPEX refers to cash flow from investment activities.
HSE
Efficiency
Portfolio
Management
Resilience
Value
…Delivered in 2017SP targets for 2020…
Production
Dividend
FCF Breakeven
Credit rating
Capex reduction
Divestments
Synergies and efficiencies
CO2 emissions reduction
Health and safety
700 kboe/d
stable
$50/bbl1
investment grade
40% vs. 2014
€6.2B
€2.1B/y savings
1.9 Mt3
ambition of zero accidents
~700 kboe/d
Increased to €0.9/sh
$40/bbl
investment grade
57% vs. 2014
€9.0B2
€2.4B/y savings
1.4 Mt3
TRIR reduction 36%4
6

Why a strategic update?
…in an evolving and complex energy market
Repsol is in a unique position to face the future
Price volatility &
lower for longer
Volatility of oil price in
the medium term
Healthy oil price floor
in the long term driven
by resource replacement
economics
Energy transition
and disruptions
Natural gas is the fastest-
growing fossil fuel
Growing electrification
Increased share of
renewables
Shift value and focus
towards the customer
Competitive
strategies in motion
Growing differentiation of strategic modelswithin the industry
Repsol with a unique strategic model
Silver age of refining
and back to chemicals
Attractive outlook for
refining: demand growth
and IMO regulation in 2020
Chemicals growth
Growing markets offering
marketing opportunities
7

2
Value proposition
8
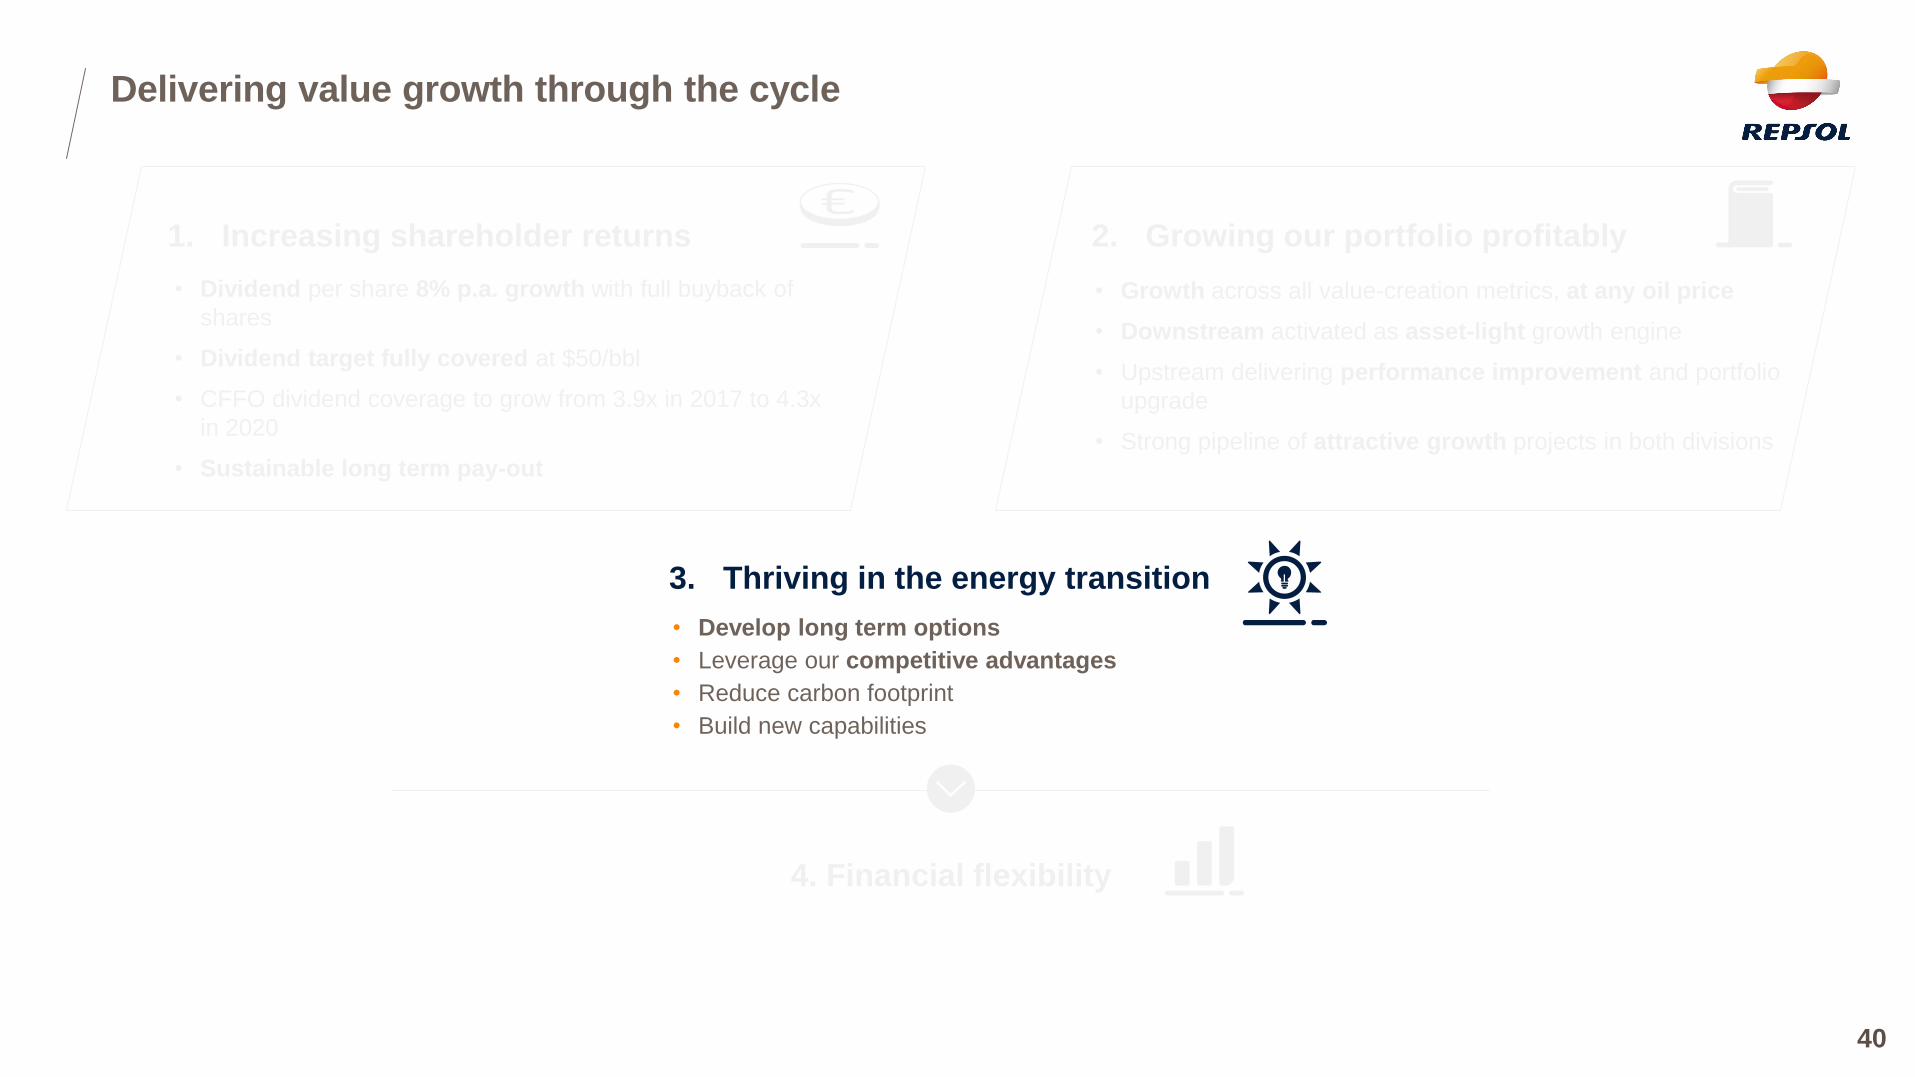
Delivering value growth through the cycle
A unique value proposition
• Dividend per share 8% p.a. growth with full buyback of
shares
• Dividend target fully covered at $50/bbl
• CFFO dividend coverage to grow from 3.9x in 2017 to 4.3x
in 2020
• Sustainable long term pay-out
1. Increasing shareholder returns
• Growth across all value-creation metrics, at any oil price
• Downstream activated as asset-light growth engine
• Upstream delivering performance improvement and portfolio
upgrade
• Strong pipeline of attractive growth projects in both divisions
2. Growing our portfolio profitably
• Develop long term options
• Leverage our competitive advantages
• Reduce carbon footprint
• Build new capabilities
3. Thriving in the energy transition
4. Financial flexibility
Note: CFFO (Cash Flow from Operation) = EBITDA +/-Working Capital variation + Dividends from affiliates -taxes paid -abandonment cost and others
In this document, economics shown under $50/bbl Brent and $3/MBtu HH flat in the period 2018-20, although it is not Repsol´s price deck
9

Our cash flow priority:
Profitable growth and enhanced shareholder return
Increase shareholder distribution and maintain strong capital discipline
Dividends
& Buybacks
Core
Portfolio
Capex
DownstreamExpand
and newLow carbon
business
Sustainable
dividend
growth
2018 Targets 2018-2020 Priorities for cash
At $50/bbl
While maintaining financial flexibility
10
€0.9/share
Buybacks to avoid
dilution

Delivering value growth through the cycle
11
• Dividend per share 8% p.a. growth with full buyback of
shares
• Dividend target fully covered at $50/bbl
• CFFO dividend coverage to grow from 3.9x in 2017 to 4.3x
in 2020
• Sustainable long term pay-out
1. Increasing shareholder returns
• Growth across all value-creation metrics, at any oil price
• Downstream activated as asset-light growth engine
• Upstream delivering performance improvement and portfolio
upgrade
• Strong pipeline of attractive growth projects in both divisions
2. Growing our portfolio profitably
• Develop long term options
• Leverage our competitive advantages
• Reduce carbon footprint
• Build new capabilities
3. Thriving in the energy transition
4. Financial flexibility

Note: Dividends in 2018-2020 include scrip option with buyback of dilution
An attractive shareholder distribution profile
1. Increasing shareholder returns
2018
0.90
2017
0.80
2020
1.00
2019
0.95
0.19
2016
0.80
0.27
Dividend per share based on disbursement year
Historic scrip dividendHistoric cash dividend
CAGR +8%€/share
12
Buybacks
Scrip dividend + buybacks

Sustainable top-tier DPS growth while increasing
dividend coverage
Note1: Analyst Consensus estimations May 16th, 2018 at $69/bbl oil price. Peers included: BP, Chevron, ConocoPhilips, Eni, ExxonMobil, Galp, Occidental, OMV, Shell, Equinor and Total
Note2: DPS = Dividends per share. Repsol data calculated under flat $50/bbl Brent and flat $3/Mbtu Henry Hub price
Source: Bloomberg, Thomson One and Repsol internal data
Repsol with higher expected DPS CAGR
than peer median in 2017-2020…
…with significant headroom for uplift in terms
of results and cash distribution even at $50/bbl
CFFO coverage of dividends growing from 3.9x in 2017 to 4.3x in 2020
%
Avg. 2018-2020
Dividend / CFFOAvg. 2018-2020 Payout
70%70%Repsol at $50/bbl
Median consensus peers
DPS growth CAGR
30%
25%
At $50/bbl flat Brent
1. Increasing shareholder returns
2016-2017
peer median
2017-2020 peer
median consensus
Repsol’s plan
2017-2020
<1%
4.5%
8.0%
13
%

Delivering value growth through the cycle
14
• Dividend per share 8% p.a. growth with full buyback of
shares
• Dividend target fully covered at $50/bbl
• CFFO dividend coverage to grow from 3.9x in 2017 to 4.3x
in 2020
• Sustainable long term pay-out
1. Increasing shareholder returns
• Growth across all value-creation metrics, at any oil price
• Downstream activated as asset-light growth engine
• Upstream delivering performance improvement and portfolio
upgrade
• Strong pipeline of attractive growth projects in both divisions
2. Growing our portfolio profitably
• Develop long term options
• Leverage our competitive advantages
• Reduce carbon footprint
• Build new capabilities
3. Thriving in the energy transition
4. Financial flexibility

Strong track-record in profit improvement across our portfolio
2. Growing our portfolio profitably
Upstream
UK turnaround
Success Story Description Impact
Turnaround of the main operational
KPIs and production increase01.
Refining
Siclos
New monitoring system enabling
operators to improve real-time
economic performance02.
Retail
Transforming
while Performing
Digitalization & technology
enabling new revenue streams.
Customer-centric strategy03.
-63%Unitary Opex
since 2014
+60%Production
since 2014
+$0.4/bblMargin
+€120MAccumulated
EBITDA increase
600k usersof Waylet in 9 months
+€20M/yAdditional
net margin
15

A double-geared engine ready to deliver value growth and
shareholder return
UpstreamImproving returns with
profitable growth while
high-grading portfolio Key priorities:
Value growth &
shareholder return
DownstreamConsolidating superior
performance and
enabling new value
growth levers
Focus on portfolio & balance sheet resilience
Positioned to deliver FCF breakeven @ $50/bbl
Strong cash generation from core business
Double-geared engine
Developing a low carbon business for
the energy transition
2. Growing our portfolio profitably
16

Downstream activated as a new growth engine
1. Excluding Capex from Talisman acquisition. Note: Capex refers to cash flow from investment activities. "Sustain" are the necessary investments to keep current state of businesses (eg., keep current production level for Upstream or industrial integrity for Downstream).
2018-2020 Capex breakdown 2018-2020 Capex breakdown by business
€ Billion € Billion
2015-20171
11
Core Portfolio
2018-2020
4
New Initiatives
Downstream Expand
and Low carbon
business
Upstream &
Downstream
Sustain
Upstream Growth
11
6.7
8.0
€15BCapex
2018-2020
Corporate
Downstream and
Low carbon business
45%
Upstream
53%
2. Growing our portfolio profitably
Core portfolio Capex in line with historical levels Balanced investments across businesses
17
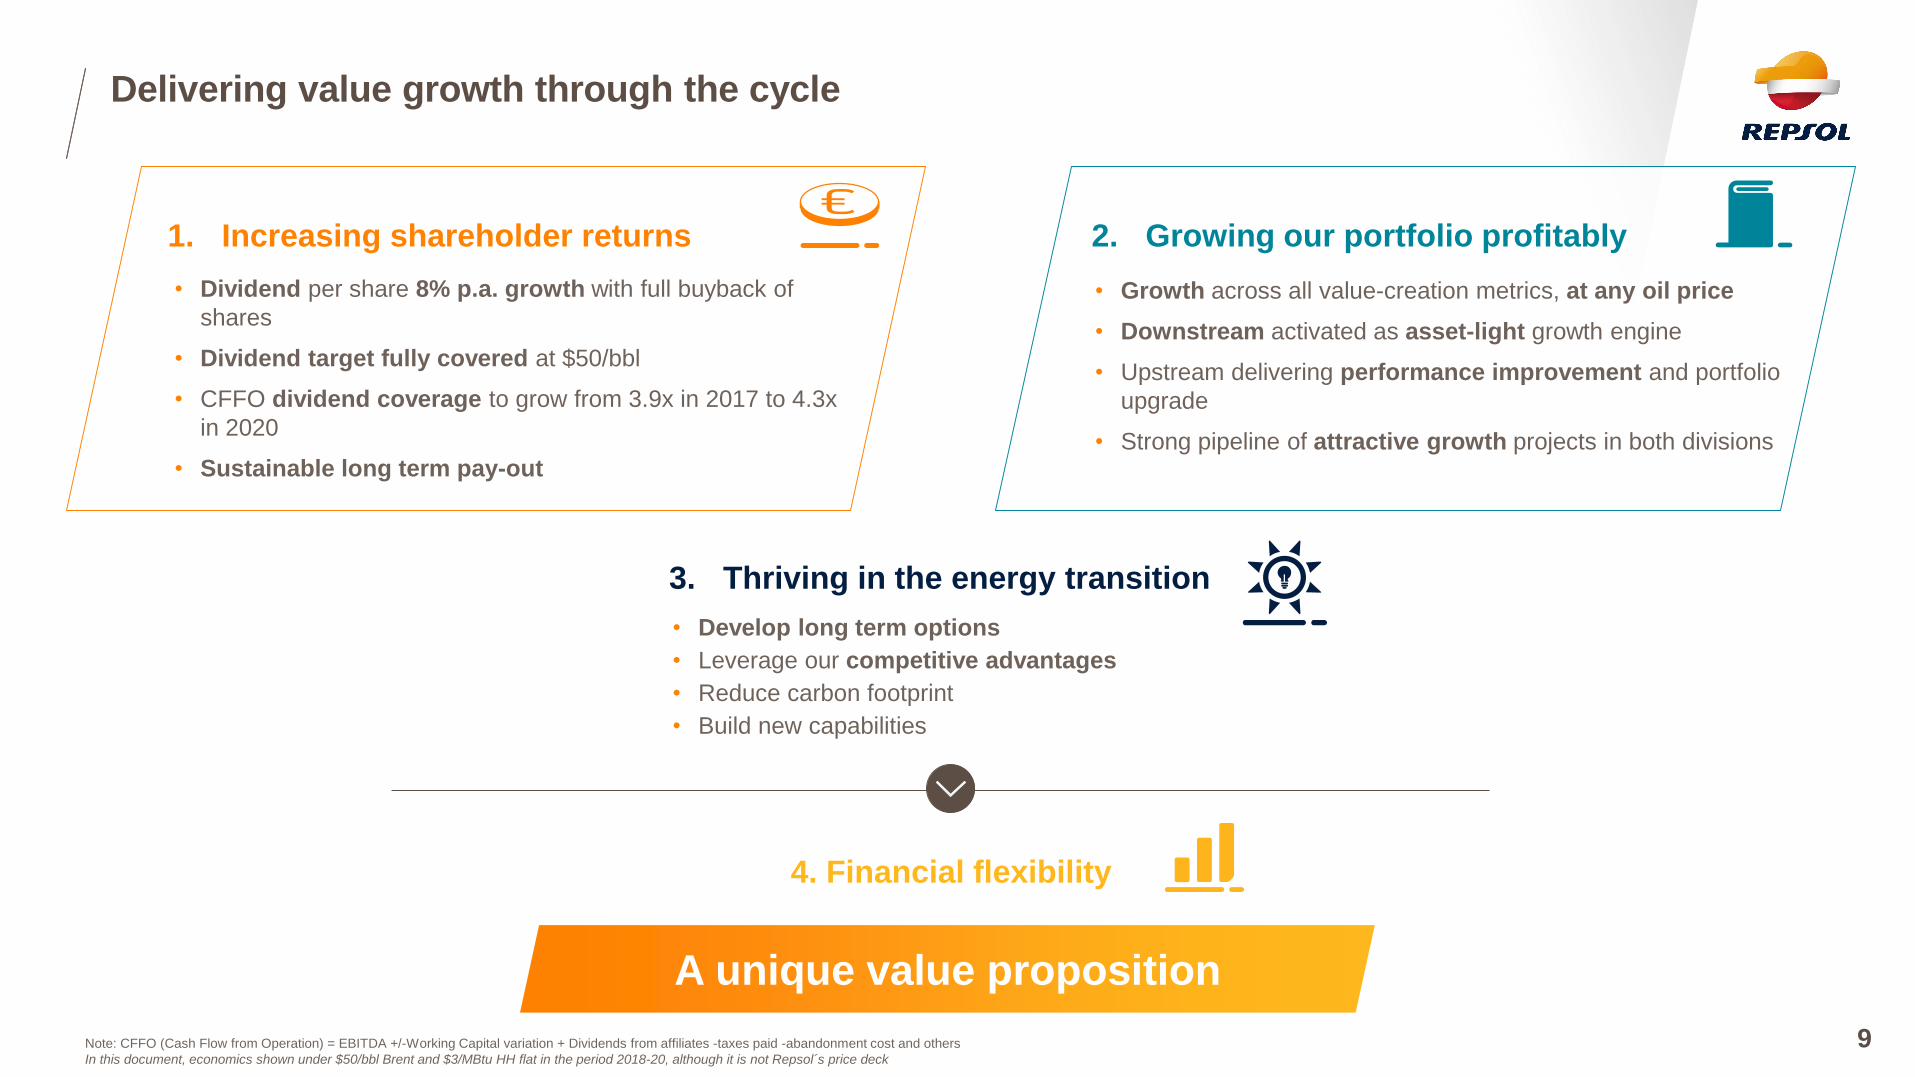
Growth secured within current assets focused on asset-light Downstream projects and
profitable Upstream growthAdditional growth will come from investments in new low carbon business
Upstream: short-cycle projects / production increase
(FO/FG in 2018 - 2020)
Downstream: Expand initiatives
Upstream: medium term phased projects
(FO/FG/ramp-up in 2020+)
2. Growing our portfolio profitably
MarcellusUS
AlaskaUS
DuvernayCanada
CPO-9Colombia
SagitarioBrazil
Campos 33Brazil
18
Eagle FordUS
BuckskinUS
YMENorway
NC_115 & NC_186Libya
Bunga Pakma& KinabaluMalaysia
CorridorIndonesia
SagariPeru
MarketingMexico
Marketing expansionPeru
Commercial Hinterland
Chemicals high
value products
Lubricants intl.
expansion
Trading
footprint growth
Global
projects
RegganeAlgeria
Note: FO = First Oil, FG = First Gas

Cashflow growth above 40% at flat prices with sustainable value
growth across the portfolio
4.6
Expand &
Low carbon
business
0.3
Profitability
improvement
0.2
International
margins
0.3
Efficiency and
Digital program
0.6
2020 CFFO
at $50/bbl
6.5
Corporation
and others
0.1
New
production2
0.4
2017 CFFO1
at $50/bbl
UPSTREAM
+€1.0B
DOWNSTREAM
+€0.8B
>9%6% +3 %ROACE
>10%
€ Billion
CAGR: +12%
@ $60/bbl
2. Growing our portfolio profitably
At $50/bbl flat Brent
CFFO at $50/bbl
19
Note1: CFFO (Cash Flow from Operation) = EBITDA +/- Working Capital variation + Dividends from affiliates - taxes paid - abandonment cost and othersNote2: Forecasts made under flat $50/bbl Brent price and flat $3/Mbtu Henry Hub price.1. Adjusting values to $50/bbl and excluding Spain extraordinary tax refund effect. Unadjusted CFFO in 2017 was €5.5B 2. Including growth, production mix and portfolio management

Consolidating superior performance and enabling
new value growth levers
Downstream
Delivering value growth across the portfolio
Improving returns with profitable growth while
high-grading portfolio
Upstream
20

Building a differentiated business model
2. Upstream value growth
Strengths of a nimble operator but with significant scale
1. Sustainable scale
• 750 kboe/d with focused diversification
• Strong pipeline of development projects
• Unconventionals complement exploration to
replace reserves
3. Efficient operator
• Costs below industry average in core positions
• Track record of development project execution
• Ability to manage and turn around difficult
assets
2. Access-advantaged
• Strong relationships in core positions
• Proven lower cost of supply (F&D) through
successful exploration and lean
developments
4. Flexibility & low capex intensity
• Appetite for mid scale assets rather than large,
capex-intensive projects
• Focus on short-cycle and phased developments
• Modulating unconventionals and exploration
activity for further capex flexibility
21
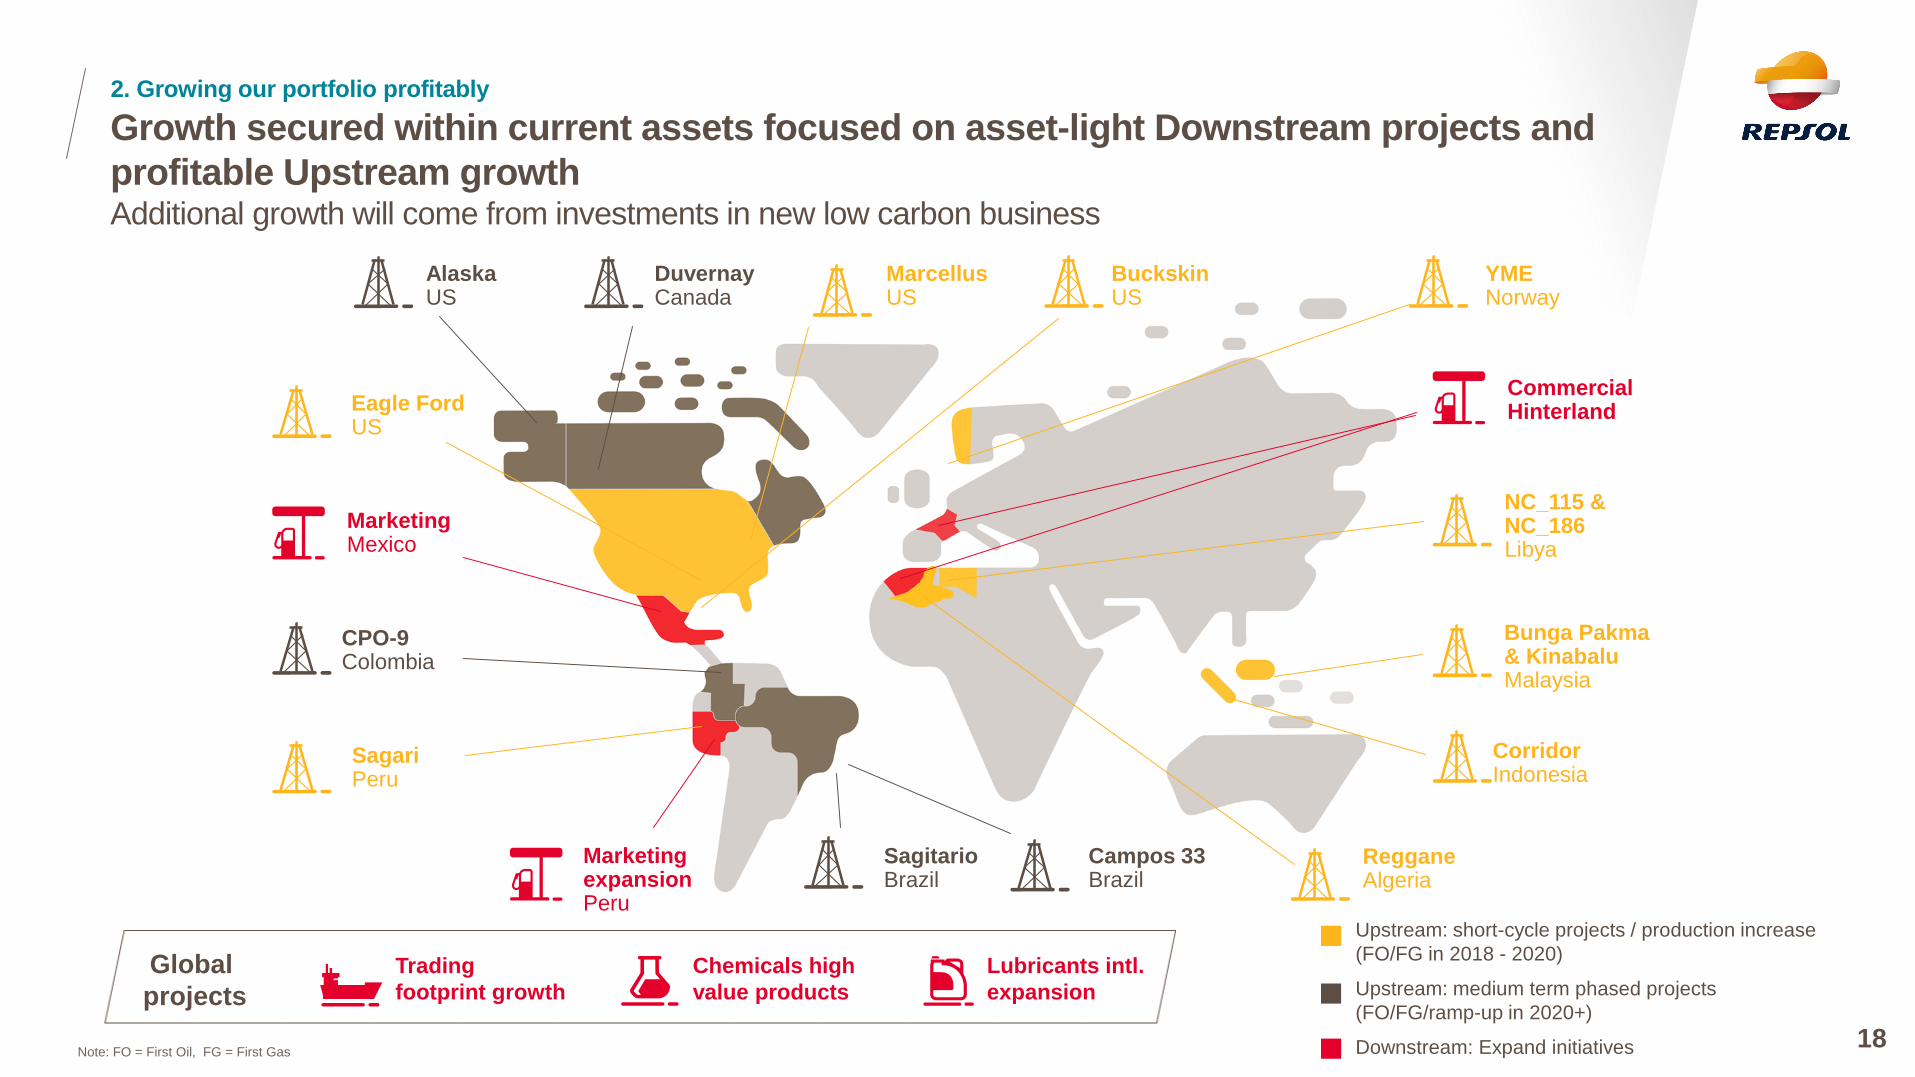
Solid Upstream portfolio based on three pillars
367 kboe/d
(53%)
Advantaged oil
Libya, Alaska, Brazil, GoMSEA, Latam
Lean plateau gas
• Sustained cash engine
• Low cost
• Pipeline-connected to growth
markets with premium
• Gas prices linked to oil
• Competitive position in core
operated assets
• Growth potential
• Long-term replacement
• High-margin barrels
• Key development projects from
exploration success
• Further exploration upside
O&G Unconventionals
North America
Production
2017
150 kboe/d
(22%)
178 kboe/d
(25%)
Resilience
gas focus on domestic markets
2. Upstream value growth
22
Flexibility
unconventional activity
modulation
Price upside
oil-prone, high-margin assets

Upstream strategy summary
1. Sustain
Efficiency and profit improvement
High-grading portfolio
Strong pipeline of growth projects
Improving returns and profitable growth, while high-grading portfolio
2. Grow
2. Upstream value growth
23

~60% allocated
to growth from
current assets
Increasing development Capex intensity in 2018-2020,
but still leaner than peers
2. Upstream value growth
~60% of Capex allocated to growth
and focused on core plays
Increased development Capex – still leaner
than peers – and focused exploration intensity
Development Intensity
($/boe)
2018-2020 Exploration & Development Capex (%)
41%
42%
17%
€8.0B
Explore
€8.0B
17%
8%
30%
44%
Grow
Sustain
Conventional
Unconventional
Deepwater
Exploration
Avg Peers2 18-20
11.9
2018-2020
9.2
2016-2017
7.7
2.1
Exploration Intensity ($/boe)
Avg peers2 18-20
1.7
2018-20201
2.2
2016-2017
+29%
-24%
241. Includes G&A, G&G exploration expenses. 2. Peers include BP, Chevron, Eni, ExxonMobil, Occidental, OMV, Shell, Equinor and Total. Source: Internal data; Peer analysis with internal calculations based on GEM 4.19 Wood MacKenzie tool for production and future Capex. CBT for exploration projections with G&G + G&A estimations added to Exploration costs; 25% to all companies.

Production secured from lean proven reserves and contingent resources
2020 lean and focused
production mix…
…guaranteed by reserves and
resources…
91%production
from lean plays
Conventionals
Unconventionals
Deep water
750
2020 20222017
Production
target (2020)
Production by resources
~85% proven
reserves
~700Kboe/d
w/
reserves
Reserves
Conventional Contingents
Unconventional Contingents
Prospectives + NNVV
2. Upstream value growth
... with NPV breakeven
well below $50/bbl
NPV breakeven looking forward of
2018-2022 production ($/bbl)
Undeveloped
reserves
Developed
reserves
Resources
Production 2018-2022
<$15 /bbl
$15-25/bbl
$25-50/bbl
25Note1: NPV Breakeven looking forward using 10% discount rate
695
23%
68%
9%

…delivering ~95 kboe/d new productionPipeline of Repsol’s short-cycle projects…
Dev projects onstream 2020 Main assets increasing production
Profitable short-cycle projects contributing to 95 kboe/d of
new production, enhancing cash margins by 2020
26
2. Upstream value growth
+95 kboe/d
Production from short-cycle projects
20202017
DUVERNAY
• Early
production
EAGLE FORD
• Production ramp-
up
BUCKSKIN
• Development
Stage 1 FO in '19
YME
• Fast track
development with
FO in 2020
SAGARI
• FG in 4Q 2017
REGGANE
• FG in 4Q 2017
MARCELLUS
• Increase to 2
development rigs
LIBYA
• Production ramp-up
MALAYSIA
• Bunga Pakma:
FG '18
• Kinabalu: FO '17
CORRIDOR
• Compression and
Suban wells
At $50/bbl flat Brent
• Oil-biased new production in Libya, YME,
Buckskin, Kinabalu, Duvernay and Eagle Ford

2017
New efficiency and digitalization program key to improving
profitability, delivering $1.0B/year in FCF by 2020
27
2. Upstream value growth
New efficiency and digitalization program1
to deliver $1.0B/year in FCF by 2020
Successful cost efficiency program
delivered $1.6B, above $1.3B target
2020
Revenues
0.3
$ Billion/year
1.0
OPEX
0.2
Taxes & Others
0.2
CAPEX
0.3
CAPEX
0.7
OPEX
0.9
• Drilling projects logistics optimization
• Modifications in well designs
• G&A Cost Efficiencies
• Moving from corrective to preventive
maintenance
1. New efficiency and digital program named RISE: Resilience, Innovation, Sustainability, Engagement. 2. $0.7B CFFO (€0.6B) corresponds to the "efficiency and digital program" amount shown in the CFFO bridge, slide 19
Illustrative examples
At $50/bbl flat Brent
Illustrative examples
• Capture market deflation
New efficiency and digitalization program is already delivering:
600+ initiatives, and $0.5B planned or in execution during 2018
$ Billion
1.6
$0.7B
CFFO
per
year2
Online performance monitoring to optimize wells
drilling
Well design (standardization and centralization)
to maximize use of existing inventory.
Analytics use for Predictive Maintenance
improvement and Logistic optimization, …
Production increase through improvements in
well completion and stimulation , reservoir
management, plant reliability and availability, …

Profitable growth, efficiency & digitalization program combined with
portfolio rotation, will deliver more than 30% growth in cash margin by 2020
Portfolio rotation with a value for
volume strategy…
…combined with short-cycle projects and
efficiency & digital program will grow CFFO/boe
750
AcquisitionsDivestmentsOrganic
production
potential
2020
2017
2.6% CAGR
2020
Value for
volume
kboe/d
695
High-grading
objectives
• Improve margins per barrel
• Scale in core positions
• Unconventionals to focus on Tier 1 operated assets
2. Upstream value growth
202020171
$/boe>30%
1: 2017 CFFO/boe normalized adjusting values to $50/bbl 28
CFFO/boe
At $50/bbl flat Brent

2020+ Repsol's projects with competitive returns
Mid and long-term projects with attractive
returns and phased developments
Repsol's new projects have competitive
full-cycle IRR and NPV breakeven
Ø 56
Peer 3Peer 1 Peer 2 Peer 9
New Projects full-cycle
NPV 10 Breakeven
Peer 5 Peer 6 Peer 7 Peer 8Peer 4
IRR of new projects
full-cycle
Median
Peers
21.4% 15.2%
42
7468
56 56 55 54 5344
41
2. Upstream value growth
Alaska (US)
• Advanced appraisal stage
• Phase 1: FO in 2023-24,
production plateau net
~46 kboe/d
<$45/bbl
Duvernay (Canada)
• 3 areas in advanced
appraisal stage
• Production ramp-up 2020
to 2024 (Net~ 66 kboe/d)
<$50/bbl
CPO-9 (Colombia)
• Dev. Phase-1 sanctioned,
production: net 7 kboe/d
2019
• Dev. Phase-2 FO in 2021-
2022 & production plateau
net 20 kboe/d
<$50/bbl
NPV breakeven
Current estimate
Campos 33 (Brazil)
• Fully appraised
• First gas/oil 2024-2025,
net ~45 kboe/d
<$40/bbl
Sagitario (Brazil)
• 3D seismic 2018, 2nd well
2018-2019
• First oil expected 2025+
-
29
$/bbl
Note1: NPV Breakeven does not include exploration cost.Note2: New projects breakeven average not including Repsol. Peers included: Anadarko, BP, Chevron, Eni, ExxonMobil, OMV, Shell, Equinor and Total.Note3: IRR = Internal Rate of Return, an investment profitability metric calculated as the discount rate at which the net present value of an investment is equal to zero.Source: Peer analysis with internal calculations based on GEM 4.19 and 4.20 Wood MacKenzie tool under WMK’s base price scenario.

Exploration focused on areas with competitive advantage
Key Exploration
advantages
Technical
• Basin knowledge
• G&G Technical Specialties
(imaging, structure, carbonates)
Commercial
• Preferred JV partner, deal
making and operator
capabilities
Government related
• Preferential government
interaction
• Government trust
North America
Focus on emerging plays
• Strong technical advantage as
Nanushuk play openers.
• Expanding our LATAM expertise and
footprint into Mexico
Europe-Russia
Potential growth areas
• Legacy expertise in North Africa-Mediterranean.
• Strategic partnership with GPN for Russian
exploration opportunities
• Near-field Exploration in Norway.
South America
Repsol core basins
•Exploiting our legacy advantages in the
Caribbean, Guyana margin and Brazil
pre-salt.
•Thrust belt knowledge & stakeholders
management in the Andean Basins.
South East Asia
Production replacement
• Top explorers in Indonesia.
• Significant remaining potential in
Vietnam acreage.
2. Upstream value growth
30

Summary of key target metrics to 2020
Cash Flow growth: +50% 2017-2020Production growth: 2.6% CAGR by 2020
2017
+8%
2020
CFFO
20202017
695750
2
3
+1
2. Upstream value growth
At $50/bbl flat Brent
Production
kboe/d
All while keeping FCF breakeven below $50/bbl
31Data under $50/bbl Brent and HH at $3/MbtuNote1: 2017 CFFO normalized adjusting values to $50/bbl
€ Billion

Improving returns with profitable growth while
high-grading portfolio
Upstream
Delivering value growth across the portfolio
Consolidating superior performance and enabling
new value growth levers
Downstream
32

Repsol's solid Downstream position across businesses
2. Downstream value growth
• 1 Mbpd of refining capacity
• Highly competitive EU 1Q in Solomon
NCM1 benchmark and fully invested
for IMO2
• Peru refining leader, updated with
new desulfurization units
• High performing integrated and
regional leader
• Capability for more than 30% light
feedstock (LPGs)
• Key positions in high value products
(PO/Polyols, Rubber, EVA)
Chemicals
Refining
TradingNWE
MED
WEST
LATAM
Presence in Downstream
markets with deficit
European leading integrated margin with proven ability to
deliver ongoing profit improvement across the portfolio
1. NCM: Net Cash Margin. 2. New regulation limiting sulfur content in marine bunkering from International Maritime Organization
Lubricants
• Strong position in Europe and
growing asset footprint globally
Commercial
• More than 4,700 service stations
• LPG leader in Spain
• Customer-centric with 10 million
customers and strong energy brand
• Leadership in convenience retail with
enhanced digital capabilities
• Spain fuels share: >37%, LPG share:
70%, Peru fuels share: >23%
• Increasing global footprint
33

Repsol is European R&M leader, and the best prepared player for IMO
Leading European R&M integrated profit Repsol's assets are fully invested for IMO
Leader in EU coking 25%
Fuel Oil yield <7%
Middle Distillates Yield >50%
of the total EU coking
capacity (while only 6%
of total distillation)
Repsol is leading the EU industry in
marketing, refining and integration
34Note: Profit is defined here as EBIT CCS, bars represent lower-upper bound of European refining & Marketing companies
Best year (2015)
Leadership
through refining
Worst year (2013)
Leadership based on
marketing strength
Avg. 2012-2017
Repsol position
2. Downstream value growth
$/bbl
>$2.5/bbl
Repsol
Repsol
Repsol

• World refining utilization above 83% in 2018-2020
• New IMO regulation positive for complex refiners
• Global Chemical utilization in 2018-2020 stable at ~89%
• Chemicals demand growing above world GDP
(at 3-4% per year)
• Strong oil products demand in Emerging Markets
• Growing Downstream markets opening generating
opportunities for advantaged players
Positive outlook for Downstream markets which Repsol is ready to benefit After investments made in the lower part of the cycle
Solid historical Downstream performance Positive environment outlook for Repsol Downstream
0
10
20
30
0
1000
2000
3000
4000
1.5
2010-2014 2015-2017
ROACE (%)Downstream EBITDA (€ Billion)
3.3
ROACEEBITDA
World
refining
utilization
Brent-WTI
World
Chemical
utilization
Avg. 81% Avg. 83%
Avg. 10.3 Avg. 3.1
Avg. 86% Avg. 89%
2. Downstream value growth
Source: Nexant; IHS; ICIS; BCG global Chemicals practice 35
0.0
4.0
1.0
2.0
3.0

Building upon our strengthsMain strategic lines by business
1.TwP = Transforming While Performing, a program for operational excellence
Chemicals Marketing TradingLubricantsLPGRefining
Sustain Grow Grow Sustain Grow Grow
Sustain
Expand
• Energy efficiency
• IMO readiness
• Digitalization and
optimization
• Peru
desulphuration
units
• Energy efficiency
• Digitalization and
optimization
• Differentiation
• TwP1
• Digitalization
• Non-oil business
growth &
partnerships
• Customer-centric
and digitalization
• Logistic services
& commercial
integration
• Maintain
leadership in
Spain
• Grow exports
• Maximize value
from the system
• Digitalization
• Biofuels • Growth in current
high value
products
• Expand into new
geographies
• New mobility
businesses
• Growth
opportunities in
hinterland
• Expand
international
presence (Asia,
Latam)
• Develop global
crude business
• Incremental
growth in key
products
2.7
1.5
CAPEX
18-20 (€ Billion)
Chemicals
growthA B International expansion
2. Downstream value growth
36

Repsol to focus growth on its higher-value Chemical products
A Chemical growth
Chemical
strategic goals
Global scale in 1-3
higher value
products
Further
differentiation
Strengthen
competitiveness of
core business
Key target products
PO-polyols
Rubber
EVA
Rationale
• Strong global demand growth forecast (~3.5% p.a.)
• Attractive alternatives of ethylene monetization
• Know-how retrofitting LDPE to EVA units
• Strong global demand growth forecast (4-4.5% p.a.)
• Established Sales & Marketing position
• Proprietary proven production technology
• Experience in project execution
• Attractive global demand growth forecast (~2.5% p.a.)
• Established Sales & Marketing position
• Strong product portfolio of customized products / solutions
• Production assets on three continents
WORLD
POSITION
#12player
#10player
#11player
Ambition to reach Tier 1 positions (Top 5)
2. Downstream value growth
Source: Nexant; IHS; ICIS; BCG global Chemicals practice 37

Asset-light Downstream internationalization focused on
commercial and trading businesses
B International expansion
Leverage refining logistics and
trading & marketing capabilities
to develop commercial
integrated positions
Leverage Trading and Marketing
capabilities and knowledge of Latin-
American markets to develop
commercial positions
Leverage Repsol Trading capabilities
and Downstream positions to:
• Develop a top tier global crude
position
• Growth in key market niches
• Perform international expansion
optimizing integrated margin
Expansion
Strategy
Priority
Businesses
CrudesChemicals Fuels & LPG
Marketing
Trading
LPG Lubricants
Diesel Gasoline
2. Downstream value growth
38
Commercial Hinterland Commercial LatAm Global Trading
Marketing
Trading

Downstream to generate more than €1B FCF per year in 2018-2020
Downstream 2018-2020 delivering ROACE > 18% while
investing in improving and expanding business
Cash Flow growth: +27% by 2020 ROACE: > 18% in 2018-2020
€ Billion
3.2
20202017
2.5
+0.7
Note: Downstream metrics without considering new Low carbon business (next section)
> 18%
2017 2020
ROACE
18-20
9.6 11.3
2. Downstream value growth
20
22
At $50/bbl flat Brent
CFFO ROACE
%
39
Avg. Capital
Employed
(€ Billion)
Delivering value growth through the cycle
40
• Dividend per share 8% p.a. growth with full buyback of
shares
• Dividend target fully covered at $50/bbl
• CFFO dividend coverage to grow from 3.9x in 2017 to 4.3x
in 2020
• Sustainable long term pay-out
1. Increasing shareholder returns
• Growth across all value-creation metrics, at any oil price
• Downstream activated as asset-light growth engine
• Upstream delivering performance improvement and portfolio
upgrade
• Strong pipeline of attractive growth projects in both divisions
2. Growing our portfolio profitably
• Develop long term options
• Leverage our competitive advantages
• Reduce carbon footprint
• Build new capabilities
3. Thriving in the energy transition
4. Financial flexibility

Key trends of the Energy Transition
3. Thriving in the energy transition
Energy Transition
41
Global Trends
Regulation change and
license to operate
Decarbonization
Technological shift and
Digital revolution
Customer centricity and new
consumption patterns
New Competitors
Trends in the energy
consumption model
Global growth in demand
Increased electrification in
energy consumption
Natural gas as transition source
Increased share of renewable
energy in the mix
Development of new services and
business models around the
customer

Repsol has defined an ambition to develop a new operated position in low
carbon businesses by swapping GNF
• Non-operated
• No synergies exploited
• 85% regulated business in 2017 EBITDA
with a mix of high/low carbon generation
Repsol is swapping a €5-6B exposure to a
medium carbon businesses through GNF…
• Operated business with full synergies
• Leveraging previous experience in low carbon
businesses, markets and know-how
• Focused business mix: wholesale gas, retail
G&P and low carbon generation
… To an operated and synergistic position in
low carbon businesses
Be players in the future energy transition, fostering sustainability and energy efficiency
Creating profitable low
carbon businesses
Enhancing capabilities to
thrive in energy transition
Reducing emissions in our
operations and products
3. Thriving in the energy transition
Gas
Natural
Fenosa
42
Ambition

• Create a successful wholesale gas
business, ensuring a competitive gas
supply
• Developing new business through
gas flexibility
• Deliver a competitive gas offer for
our future retail clients
Targets
by 2025
>15%Market share1
>5%Market share2
2.5MClients3
~ 4.5 GWCapacity
Investments in low carbon businesses with IRR above 10%4
3. Thriving in the energy transition
• To become a relevant Spanish low
carbon multi-energy retailer
• Progressively sophisticate our offer
including advanced energy services
and solutions
• Develop a strong position in Spain
achieving a low carbon integrated
business
• Technological vocation oriented to
solar, wind, CCGT and other low
carbon technologies
• Diversify in emerging countries that
yield higher returns
43
Wholesale Gas Retail G&P Low carbon generation
Leverage our industrial self consumption as
the largest gas consumer in Spain
Top
capability
Roadmap
Technical capabilities and experience in
managing large scale projects
Strong brand and ~10M clients base
with direct contact
We have developed a clear and focused roadmap to achieve
our ambition with an investment of €2.5B in 2018-2020
1. Spain market share including our refineries' consumption; 2. Spain market share in number of clients; 3. Not adjusted for dual clients; 4. Assuming an average financial leverage of ~50%
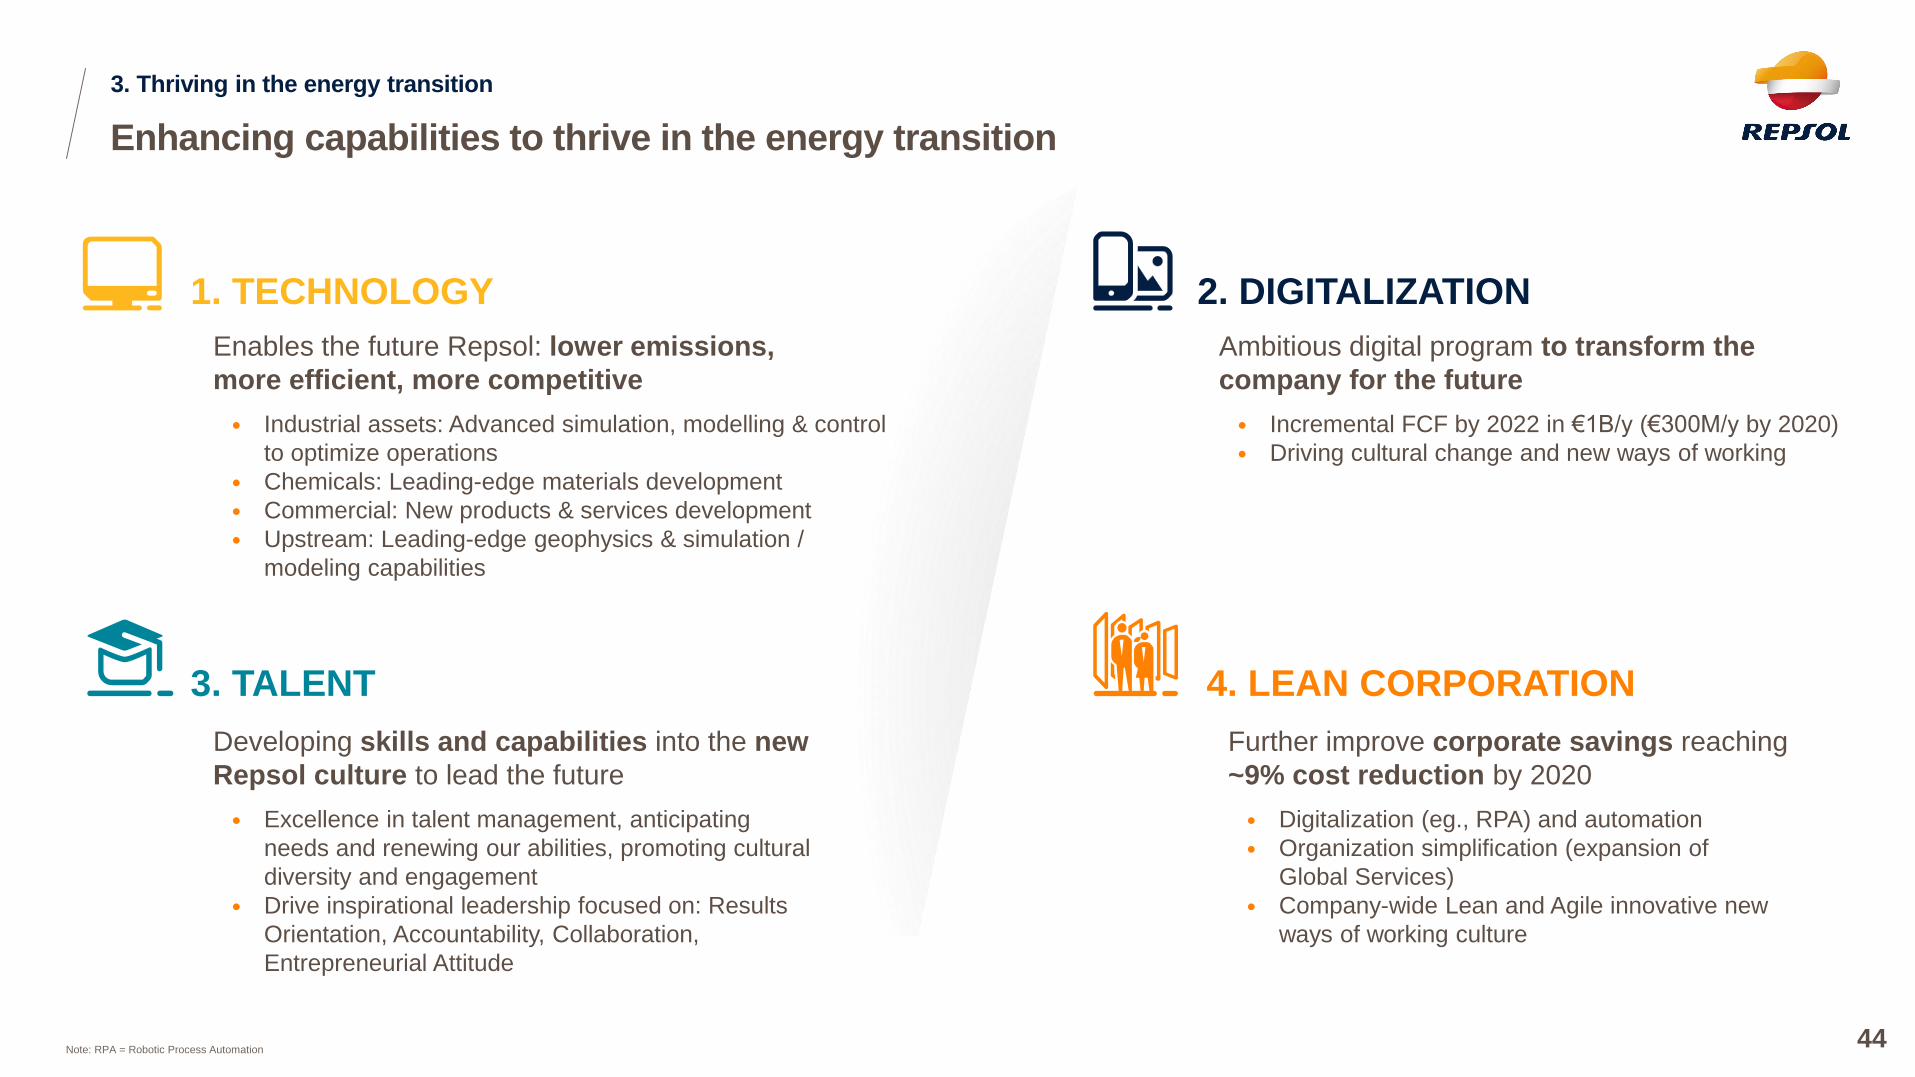
Enhancing capabilities to thrive in the energy transition
1. TECHNOLOGY
3. TALENT
2. DIGITALIZATION
4. LEAN CORPORATION
Enables the future Repsol: lower emissions,
more efficient, more competitive
• Industrial assets: Advanced simulation, modelling & control
to optimize operations
• Chemicals: Leading-edge materials development
• Commercial: New products & services development
• Upstream: Leading-edge geophysics & simulation /
modeling capabilities
Developing skills and capabilities into the new
Repsol culture to lead the future
• Excellence in talent management, anticipating
needs and renewing our abilities, promoting cultural
diversity and engagement
• Drive inspirational leadership focused on: Results
Orientation, Accountability, Collaboration,
Entrepreneurial Attitude
Ambitious digital program to transform the
company for the future
• Incremental FCF by 2022 in €1B/y (€300M/y by 2020)
• Driving cultural change and new ways of working
Further improve corporate savings reaching
~9% cost reduction by 2020
• Digitalization (eg., RPA) and automation
• Organization simplification (expansion of
Global Services)
• Company-wide Lean and Agile innovative new
ways of working culture
3. Thriving in the energy transition
44Note: RPA = Robotic Process Automation
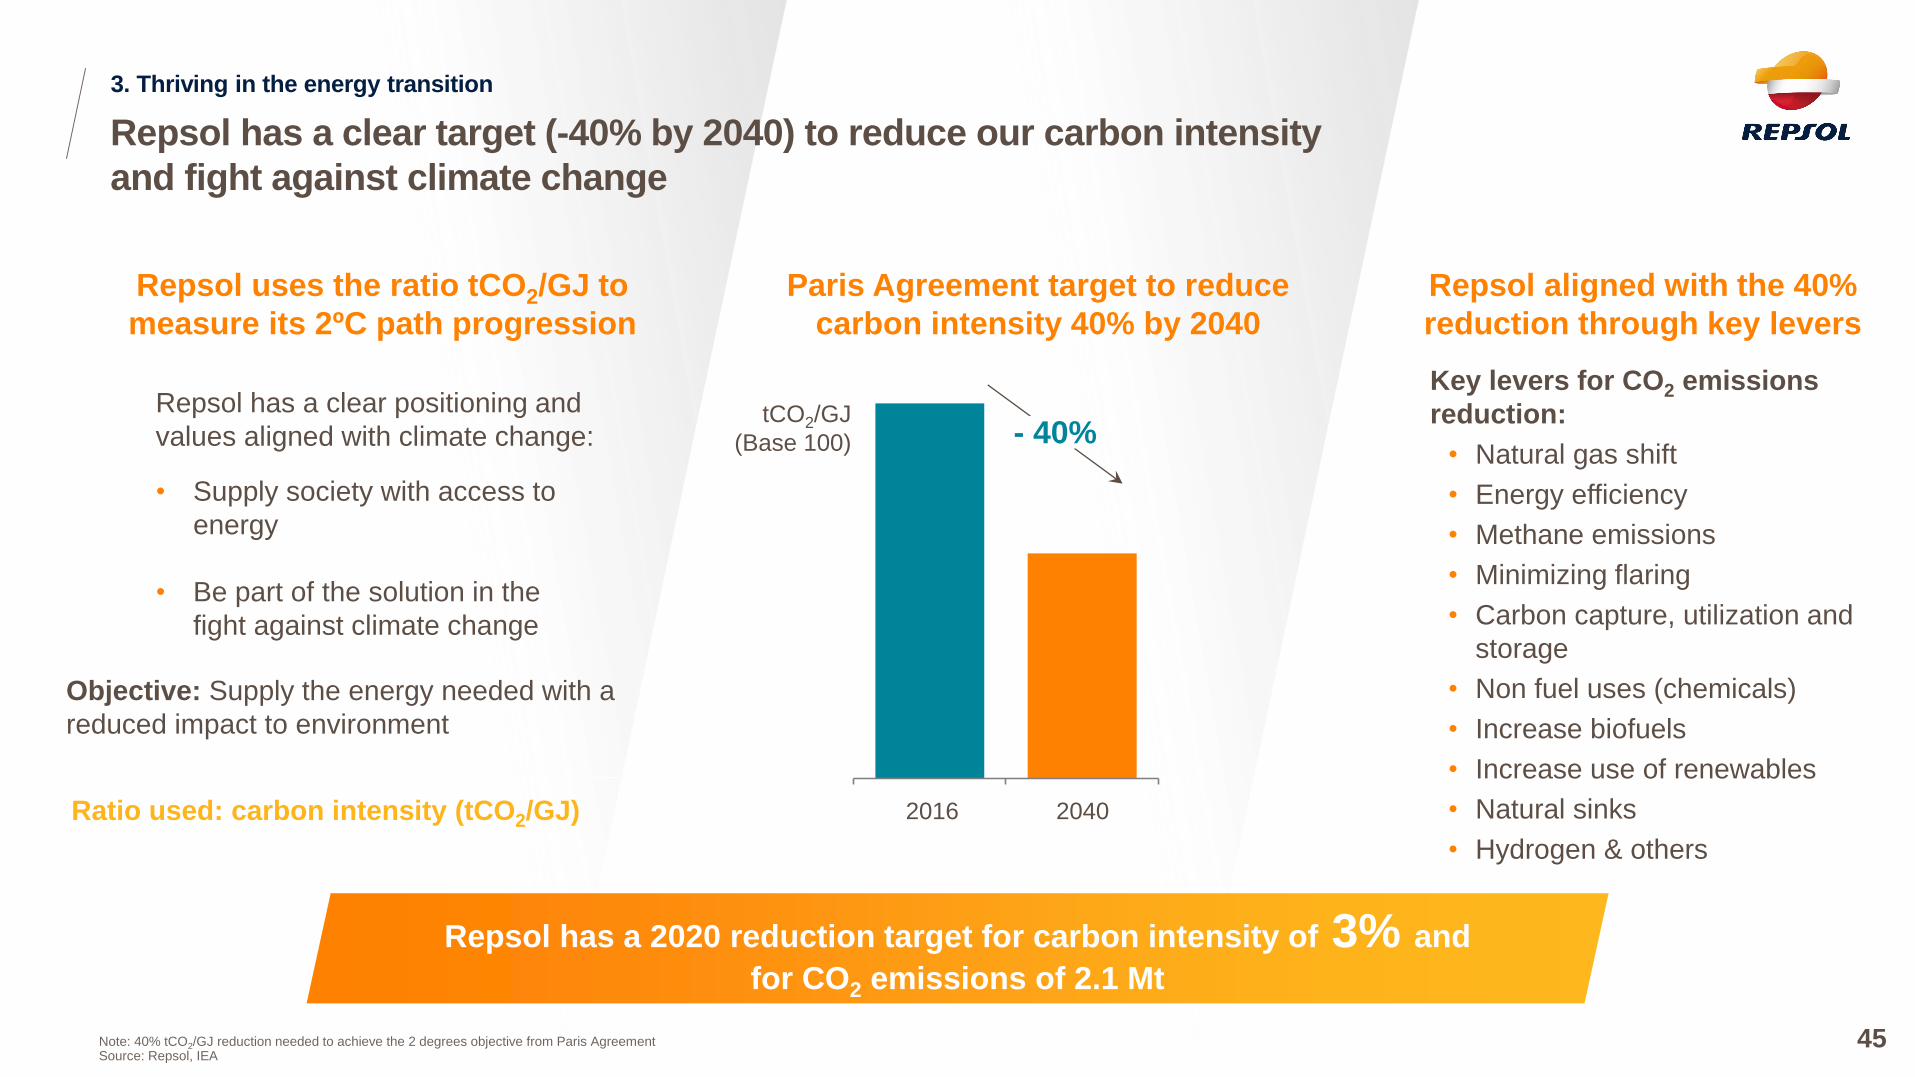
Repsol has a clear target (-40% by 2040) to reduce our carbon intensity
and fight against climate change
Paris Agreement target to reduce
carbon intensity 40% by 2040
Repsol aligned with the 40%
reduction through key levers
Repsol uses the ratio tCO2/GJ to
measure its 2ºC path progression
Repsol has a clear positioning and
values aligned with climate change:
• Supply society with access to
energy
• Be part of the solution in the
fight against climate change
Objective: Supply the energy needed with a
reduced impact to environment
Ratio used: carbon intensity (tCO2/GJ)
tCO2/GJ
(Base 100)
20402016
- 40%
Repsol has a 2020 reduction target for carbon intensity of 3% and
for CO2 emissions of 2.1 Mt
Key levers for CO2 emissions
reduction:
• Natural gas shift
• Energy efficiency
• Methane emissions
• Minimizing flaring
• Carbon capture, utilization and
storage
• Non fuel uses (chemicals)
• Increase biofuels
• Increase use of renewables
• Natural sinks
• Hydrogen & others
3. Thriving in the energy transition
45Note: 40% tCO2/GJ reduction needed to achieve the 2 degrees objective from Paris AgreementSource: Repsol, IEA

Delivering value growth through the cycle
46
• Dividend per share 8% p.a. growth with full buyback of
shares
• Dividend target fully covered at $50/bbl
• CFFO dividend coverage to grow from 3.9x in 2017 to 4.3x
in 2020
• Sustainable long term pay-out
1. Increasing shareholder returns
• Growth across all value-creation metrics, at any oil price
• Downstream activated as asset-light growth engine
• Upstream delivering performance improvement and portfolio
upgrade
• Strong pipeline of attractive growth projects in both divisions
2. Growing our portfolio profitably
• Develop long term options
• Leverage our competitive advantages
• Reduce carbon footprint
• Build new capabilities
3. Thriving in the energy transition
4. Financial flexibility

Repsol's Strategic Plan fully funded at $50/bbl,
keeping a strong financial position
4. Financial flexibility
2018 - 2020 2018 - 2020
GNF
divestment
CFFO @50 17.0
3.8
Sources of cash Uses of cash
20.8
11.0
1.6
4.2
4.0
20.8
Core Portfolio CAPEX
Financing costs1
Dividend & Buybacks
Downstream Expand and
Low carbon business Capex
Includes Upstream
Sustain & Growth
and Downstream
Sustain Capex
Capex, announced dividends (including
dividend increase to €1/share by 2020)
and buybacks, fully financed at $50/bbl
Repsol has financial flexibility in 2018-2020
of >€4B, since it will keep leverage ratio
well below industry average of 1.1x
Net Debt / EBITDA evolution
2017 2018 2019 2020
0.7x0.8x
0.7x
0.9x
Industry Avg.
1.1x
>€4B
1. Financing costs include leases, financial charges, dividends to minority, hybrid interests and other movements
At $50/bbl flat Brent
47
€ Billion

Target: increase shareholder distributions and maintain capital discipline
Dividends
& Buybacks
Core
Portfolio
CAPEX
DownstreamExpandand new
Low carbon business
Sustainable
dividend
growth
2018-2020 Priorities for cash
At $50/bbl
While maintaining financial flexibility
Our cash flow priority:
Profitable growth and enhanced shareholder return through the cycle
With a more favorable scenario
Organic project
acceleration
Additional Buybacks
4. Financial flexibility
48

3
Key targets &
Conclusions
49

Update 2018-2020: Key targets for growth and shareholder remuneration
Note: EPS considering Adjusted Net Income. 1. 2017 values adjusted to $50/bbl Brent scenario and to exclude Spain extraordinary tax refund effect. EPS in 2017 €1.6/share without adjustment
Production
2.6% CAGR
CFFO
+€1.9B growth
EPS
+€0.6/share growth
DPS
8% CAGR
20202017 202020171 20202017202020171
+17% CAGR vs 2017w/o 2017 GNF results
While focusing on financial discipline with ROACE > WACC, maintaining investment
grade and keeping our zero accidents ambition based on operational excellence
695750
CAGR
2.6%kboe/d
CAGR +12%
EPS
€/share
CAGR +12%
DPS paid
on year
€/share
4.6
6.5
1.4
2.0
0.8 1.0
CAGR +8%
At $50/bbl flat Brent
50
0.2
Scrip dividends
+ buybacksCash dividend
Scrip dividend
€ Billion

Update 2018-2020: Key targets for Energy Transition and New Capabilities
€2.5B invested in
low carbon business
Emissions reduction
-3% Kt/GJ CO2
Leaner with digital savings
of €0.3B/year by 2020
20222020
100%
20202016
€ Billion
20202016-2017
Non-
operated &
Regulated
Operated &
Merchant
& Low carbon
2.5
€1.0
B/yROE
6-7%
IRR1
>10%
CO2
emissions
reduction2
2.1Mt CO2
€0.3
B/y
Corporate
Cost reduction
from 2017
-9%By 2020
-16%By 2022
6
1. Assuming an average financial leverage of ~50% on new low carbon business. 2. Accumulated since 2014
97%
At $50/bbl flat Brent
Gas
Natural
Fenosa
Capital Employed Emissions intensity reduction
% € Billion
Pre-tax FCF savings
-3%
51
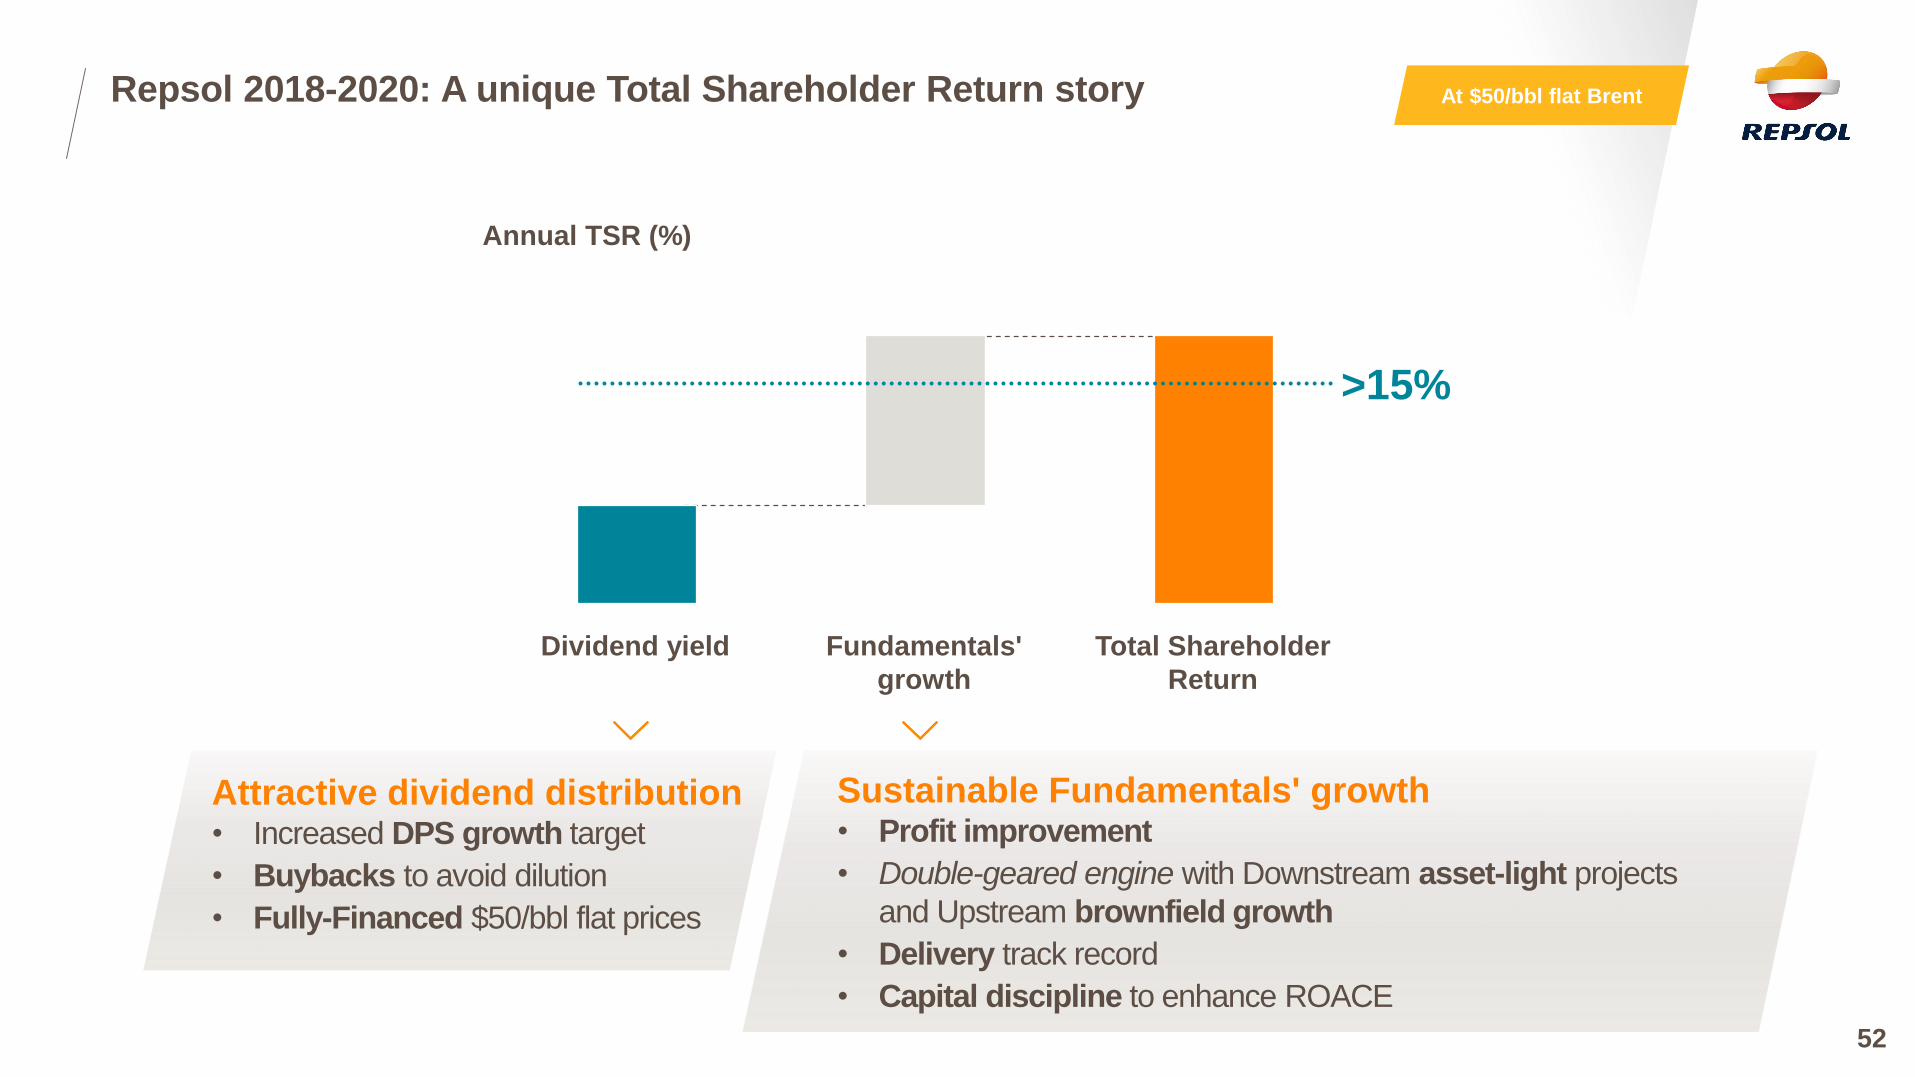
Repsol 2018-2020: A unique Total Shareholder Return story
Total Shareholder
Return
Fundamentals'
growth
Dividend yield
Annual TSR (%)
>15%
Attractive dividend distribution• Increased DPS growth target
• Buybacks to avoid dilution
• Fully-Financed $50/bbl flat prices
Sustainable Fundamentals' growth• Profit improvement
• Double-geared engine with Downstream asset-light projects
and Upstream brownfield growth
• Delivery track record
• Capital discipline to enhance ROACE
At $50/bbl flat Brent
52

Solid foundations for winning in the energy transition and ensuring a sustainable future
Strong value growth with a double engine model: Upstream and Downstream
Position of strength: Business momentum and financial robustness
Superior shareholder return across the cycle: Dividend growth path and high TSR upside
Strong growth of key financials and return on capital
Lean, more competitive and sustainable company, leveraging on our integrated model
Our Downstream is leading the industry with the positive impact of IMO enhancing our business
Upstream path focused towards profitable growth
Update 2018-2020: Conclusions
53

Strategic UpdateDelivering value growth through the cycle
June 2018
54