Delivering in challenging times - Amazon S3...result of a 15% discount obtained from the drilling...
61
Delivering in challenging times Annual Report 2015
Transcript of Delivering in challenging times - Amazon S3...result of a 15% discount obtained from the drilling...

Delivering in challenging timesAnnual Report 2015

Continuing global economic uncertainty brings significant challenges and demands strong and effective solutions.KMG EP is implementing the relevant strategies to ensure that we continue to deliver material value to all our stakeholders now and in the future. We are achieving this goal by being rigorous, resilient and responsive across all areas of our business.
Delivering in challenging timesContinuing global economic uncertainty brings significant challenges and demands strong and effective solutions.KMG EP is implementing the relevant strategies to ensure that we continue to deliver material value to all our stakeholders now and in the future. We are achieving this goal by being rigorous, resilient and responsive across all areas of our business.
Delivering in challenging times
www.kmgep.kz/ar15 JSC KazMunaiGas Exploration Production (“KMG EP” or “The Company”) was formed in March 2004 through the merger of Ozenmunaigas JSC (OMG) and Embamunaigas JSC (EMG).
The Company retained its position as one of the top three oil producers in Kazakhstan last year as can be seen from the 2015 results. Last year the Company produced 12,351 thousand tonnes of crude oil (251kbopd) including its share in production from JV Kazgermunai LLP (KGM), CCEL and PetroKazakhstan Inc. (PKI). The volume of KMG EP’s proven and probable reserves, as of year-end 2015, audited by DeGolyer and McNaughton, increased to around 152 million tonnes (1,115 billion barrels), some 15% more than at year-end 2014. This was mainly due to the involvement in the development of reserves through the implementation of more effective geological and technical measures, including the drilling of wells.
The shares of the Company are listed on the Kazakhstan Stock Exchange (KASE) and its global depositary receipts are traded on the London Stock Exchange (LSE).
Strategic overview
8 About the Company9 Financial and operational figures10 Where we operate12 Competitive advantages and industry position14 Chairman’s statement15 About Kazakhstan16 Chief Executive’s statement18 Independent Directors’ statement20 Interview with Chief Executive23 Overview of Kazakhstan’s oil and gas sector26 Milestones of the year30 Operational activities overview36 Operating and financial review 56 Risk factors60 Social policy
Corporate governance
68 Board of Directors70 Corporate governance report
Consolidated financial statements
82 Independent Auditor’s Report83 Consolidated Financial Statements87 Notes to the Consolidated Financial Statements
Appendices
114 Information for shareholders115 Contact details116 Reference information
1KazMunaiGas Exploration Production JSC Annual Report 2015

The main component of the further development of the company is to improve production efficiency on mature fields. To perform this task we carry out constant control of production processes with a view to their optimization, compliance with the energy conservation policy, as well as finding ways to improve oil recovery.
Proven and probable reserves As of year-end 2015, the volume of KMG EP’s proven and probable reserves audited by DeGolyer and McNaughton, increased to around 152 million tonnes (1,115 billion barrels), some 15% more than at year-end 2014. This was mainly due to the involvement in the development of reserves through the implementation of more effective geological and technical measures, including the drilling of wells.
+15%
Last year the Company produced 12,351 thousand tonnes of crude oil, including the share from KMG, CCEL and PKI. At the end of 2015 the Company maintained its position in the top three companies in terms of oil production in Kazakhstan. Working with Scientific Research Institute of Mining and Drilling Technologies LLP, we have focused on improving the efficiency of production activities.
12,351 thousand tonnes
Capital expenditure in 2015 was 98bn tenge, 23% lower than in 2014. This is mainly due to lower investments in maintenance Capex as well as a decrease in both drilling activity and the cost of drilling, which was the result of a 15% discount obtained from the drilling contractor.
-23%
Strategic overview2 3KazMunaiGas Exploration Production JSC Annual Report 2015 KazMunaiGas Exploration Production JSC Annual Report 2015
See page 31
See page 29
See page 34
Strategic overview
Delivering in challenging times
By being rigorous

Implementation of the transformation programme will improve the production efficiency of our fields, will increase oil production and reduce the operating costs. Moreover, we work not only to preserve and increase the resource base of Kazakhstan, but also to explore new exploration areas.
4 prioritiesWe have four clear priorities for 2016: · Streamlining back office functions;
· Improving functional discipline management;
· Improving centrally-driven knowledge and technology sharing;
· Increasing efficiency of well workovers by applying modern technologies in crude oil production
See page 14
Economic benefits generated within the framework of the MTO project The MTO and TORO projects will allow us to improve processes at all levels of control over the supply system, to lower stock levels in storage and also to shorten the lead times for organising purchases and sales. The overall benefit by the end of 2017 should be 3.3 billion tenge.
+1.3 billion tenge
See page 33
Thanks to the “smart wells” project, additional production from Uaz may rise about 3%. The time needed to restart well operations will be cut by 15-20%, the more economical mode of operating subsoil equipment will cut maintenance stoppages from 20 to 15 per year.
“Smart wells” project
See page 33
4 5KazMunaiGas Exploration Production JSC Annual Report 2015 KazMunaiGas Exploration Production JSC Annual Report 2015Strategic overview
By being resilient
Strategic overview
Delivering in challenging times

By being responsiveWe are sensitive to our wider responsibilities and, even in challenging times, never lose sight of our long-term goals and aspirations. Safety and security, environmental protection, community and personal development are at the heart of our business. The welfare of our people and their communities is paramount and our commitment to our charitable, educational and sponsorship programmes remains robust.
Investments in environmental protection programmes at the four main production operations. KMG EP is aware that its activities are directly related to the use of natural resources and recognises its responsibility to society for the responsible use of these resources and for the preservation of the environment.
4.6 billion tenge
Training session attendees Since its formation, KMG EP has provided training and skills development for its employees. KMG EP holds various corporate training programmes to promote uniform corporate policies and strategic priorities.
In 2015 total attendance at all of the Company’s training sessions was 37,941, with many employees attending more than one session.
37,941
Contractually required social expenditure Social expenses in 2015 included funding for social programs and the environment in Atyrau and Mangistau of 1.9 billion tenge, and for local expert training of 0.7 billion tenge. The Company’s social policy strategy aims to promote the development of the regions.
2.6 billion tenge
Strategic overview6 7KazMunaiGas Exploration Production JSC Annual Report 2015 KazMunaiGas Exploration Production JSC Annual Report 2015
See page 61
See page 64
See page 62
Strategic overview
Delivering in challenging times

About the Сompany Financial and operational figures
Mission The Mission of KMG EP is to produce hydrocarbons efficiently and rationally with the aim of maximising benefits to shareholders of the Company, creating long-term economic and social benefits in the regions of operation and also to assist in realising the potential of every employee.
StrategySince listing on the London and Kazakhstan Stock Exchanges in 2006 the activities of KMG EP have been pursued in accordance with the strategy approved by its shareholders. After successfully meeting medium – term targets in 2006-2009, the longer term Strategy 2020 was adopted in 2010.
The Company’s strategy for operational fields is geared towards supporting production levels, optimising costs, raising the Company’s efficiency and improving recovery factors of the producing reservoirs. All these measures are geared towards optimisation of production and operational processes.
The Company is focused on realising its maximum potential. Further development will take place in line with good oil field practices and established market trends, will be in the interests of the Company’s shareholders and involves searching for opportunities to raise the level of resources in line with delivery of the Company’s strategy.
Ownership structure
Assets structure
2P reserves mln tonnes*
152mt +15%
Export, mln tonnes p/annum**
6.4 -15%
Capex, bln tenge*
98 -23%
Exchange rate (end of period), tenge/US$
339.47 +86%
Production of crude, mln tonnes p/annum**
12.4 +0%
Revenue, bln tenge*
530 -37%
Net cash, bln tenge***
1,093 +150%
Net cash, US$ mln
US$ 3,221
Volume of sales, mln tonnes p/annum**
12.2 +0%
Net profits, bln tenge
244 +418%
Brent, US$/bbl
52.4 -47%
152
132
2015
2014
6.4
7.5
2015
2014
98
128
2015
2014
339.47
182.35
2015
2014
12.4
12.3
2015
2014
530
846
2015
2014
1,093
727
2015
2014
3,221
3,987
2015
2014
12.2
12.2
2015
2014
244
47
2015
2014
52.4
99.0
2015
2014
Republic of Kazakhstan 100%
Samruk-Kazyna Holding 100%
National Company KazMunayGas JSC 57.9%
KazMunaiGas Exploration Production
Free f loat 33.7%**Treasury shares 8.3%*
Producing assets
Producing joint ventures and associates
Exploration assets
– Ozenmunaigas JSC 100%– Embamunaigas JSC 100%
– JV Kazgermunai LLP 50%– CCEL (Karazhanbasmunai JSC) 50%– PetroKazakhstan Inc. 33%
– KMG EP Exploration Assets LLP 100%– Ural Oil and Gas LLP 50%– KS EP Investments BV
(Karpovskiy Severniy LLP)51%
* Percentage from total issued ordinary and preferred shares ** About 11% of ordinary (10% of ordinary and preferred) shares belong to the China Investment Corporation (CIC)
*Excluding interest in KGM, CCEL and PKI**Including interest in KGM, CCEL and PKI***Cash, cash equivalents and other financial assets less borrowing
8 KazMunaiGas Exploration Production JSC Annual Report 2015
Strategic overview
Strategic overview 9 KazMunaiGas Exploration Production JSC Annual Report 2015

Magnitogorsk
Kazan
NizhnekamskChernushki Yekaterinburg Tyumen
Ulyanovsk
Tobol
Syzran
Saratov
Volgograd
CPC pipeline(Capacity 700 kbopd)
Kungrad
Uchkuduk
Turkmenbashi
TURKMENISTANBukhara
Baku-Tbilisi-Ceyhanpipeline
Yurgamysh
Bishkek
KYRGYZSTANTashkent
Fergana
UZBEKISTAN
Ufa
Petropavlovsk
Omsk
Kokshetau
Aysara KocharaTavolzhan
Pavlodar
Semey
Aktogay KCP pipeline(Capacity 240 kbopd )
Almaty
Birlik
Shymkent
Taraz
Almetyevsk
Samara
Orenburg
Orsk
RUSSIA
Anzhero Sudzhensk
Kemerovo
Novosibirsk
Barnaul
Biisk
Druzhba (Alashankou)
Urumchi
Kostanay
Amankaragay
KenkiyakDossor
UAS pipeline(Capacity 300 kbopd)
Makat
Astrakhan
Atyrau
Kulsary
Munaily
Bautino
Aktau
Baku
KAZAKHSTAN
Tasta
Bol. Chagan
Oporniy
Sarykamys
Karaton
Komsomolsky
Temir
CHINA
Kashagan
Karachaganak
Aralsk
Beineu
AryskumDzhusaly
Zhanaozen
Aral Sea
Caspian Sea
Tenge
Astana
Temirtau
Karagaily
Sayak
Balkhash
Kalamkas
Say-utez
Karaganda
Tengiz
Uralsk
Lake Balkhash
Lake Zaisan
Where we operate
Magnitogorsk
Kazan
NizhnekamskChernushki Yekaterinburg Tyumen
Ulyanovsk
Tobol
Syzran
Saratov
Volgograd
CPC pipeline(Capacity 700 kbopd)
Kungrad
Uchkuduk
Turkmenbashi
TURKMENISTANBukhara
Baku-Tbilisi-Ceyhanpipeline
Yurgamysh
Bishkek
KYRGYZSTANTashkent
Fergana
UZBEKISTAN
Ufa
Petropavlovsk
Omsk
Kokshetau
Aysara KocharaTavolzhan
Pavlodar
Semey
Aktogay KCP pipeline(Capacity 240 kbopd )
Almaty
Birlik
Shymkent
Taraz
Almetyevsk
Samara
Orenburg
Orsk
RUSSIA
Anzhero Sudzhensk
Kemerovo
Novosibirsk
Barnaul
Biisk
Druzhba (Alashankou)
Urumchi
Kostanay
Amankaragay
KenkiyakDossor
UAS pipeline(Capacity 300 kbopd)
Makat
Astrakhan
Atyrau
Kulsary
Munaily
Bautino
Aktau
Baku
KAZAKHSTAN
Tasta
Bol. Chagan
Oporniy
Sarykamys
Karaton
Komsomolsky
Temir
CHINA
Kashagan
Karachaganak
Aralsk
Beineu
AryskumDzhusaly
Zhanaozen
Aral Sea
Caspian Sea
Tenge
Astana
Temirtau
Karagaily
Sayak
Balkhash
Kalamkas
Say-utez
Karaganda
Tengiz
Uralsk
Lake Balkhash
Lake Zaisan
4
5
1
3
2
7
8
6
KMG EP Production assets
Gas line Oil line Railway
KMG EP Production assets
Oil fieldOil refinery
1 Ozenmunaigas JSC
2 Embamunaigas JSC
3 Karazhanbasmunai JSC
4 JV Kazgermunai LLP
5 PetroKazakhstan Inc.
6 Ural Oil and Gas LLP (Fyodorovskiy block)
7 Karpovskiy Severniy LLP (Karpovskiy Severniy block)
8 KMG EP Exploration Assets LLP
Strategic overview10 11KazMunaiGas Exploration Production JSC Annual Report 2015 KazMunaiGas Exploration Production JSC Annual Report 2015

Competitive advantages and industry position
KMG EP is the largest oil and gas company in Kazakhstan, whose shares are quoted on the LSE and KASEThe principal shareholder is NC KazMunayGas JSC (NC KMG), which holds 57,9% of the total ordinary and preferred shares issued. Within the framework of three programmes of share buy-backs in 2009-2012 the Company bought back 8.3% of the total number of ordinary and preference shares. About 11% of ordinary (10.4% of ordinary and preferred shares) belong to the state investment fund of the Chinese People’s Republic – the China Investment Corporation (CIC). The remaining shares are held by institutional investors from the United Kingdom, continental Europe, USA, Asia and Kazakhstan.
Pre-emptive access to onshore oil and gas assets in KazakhstanNC KMG has the right to enter into agreements for subsurface usage in unlicensed blocks through direct negotiations, without having to go through a tender process. As a subsidiary company KMG EP may also benefit from such rights, in the case of a mutual economic interest.
Corporate governance, in accordance with international standards and providing for the protection of minority shareholders’ interestsKMG EP became one of the first enterprises in Kazakhstan to actively apply corporate governance practices in conformity with international standards. In recent years the system of corporate governance has undergone checks in various situations and market conditions, has been assessed by rating agencies, by analysts and by NC KMG itself and the Sovereign Wealth Fund Samruk-Kazyna JSC (SWF), and has invariably received high marks for effectiveness.
Successful partnership relations and a share in producing oil and gas companies in KazakhstanKMG EP holds 50% stakes in the jointly controlled oil and gas production companies JV Kazgermunai LLP (KGM) and CCEL (Karazhanbasmunai JSC) and also a 33% holding in PetroKazakhstan Inc. (PKI). Each of these companies brings a tangible contribution to the development of the oil and gas sector in Kazakhstan and also participates in the realisation of various social programmes. The close relationships with these companies have already confirmed their success and are a solid foundation for the further development of KMG EP.
Significant cash reservesKMG EP has a stable financial position and has sufficient financial means to undertake investments and pay out dividends and to continue its task of searching for assets to acquire, either independently, or together with strategic partners who possess the required experience and technologies.
Well-explored reservesThe main assets have well – explored reserves, which are sufficient to maintain long-term production.
Share listingsThe maximum price for one KMG EP GDR listed on the LSE during 2015 was US$14.50, while the minimum was US$6.00. The average price for one GDR during 2015 was US$9.65. The maximum price for one ordinary KMG EP share listed on the K ASE during 2015 was 15,500 tenge, while the minimum was 8,414 tenge. The average price for one ordinary share during 2015 was 12,280 tenge. The maximum price for one KMG EP preference share during 2015 was 12,000 tenge, while the minimum was 5,500 tenge. The average price for one share during 2015 was 7,829 tenge.
Fluctuations in the share price of KMG EP shares in 2015 were directly linked not only to the volatility in oil prices, but also to changes in the exchange rate of the national currency to the US dollar. On 15 July, 2015 the National Bank of Kazakhstan widened the currency f luctuation corridor from 188 to 198 tenge to 1 US dollar. The press service of the National Bank announced that the policy of more f lexible and gradual exchange rate adjustments undertaken in the first half of 2015 would continue in future, and would significantly reduce the risk of sudden large devaluations like those experienced in 2009 and 2014.
In July 2015 the exchange rate was 186 tenge to 1 US dollar, but it rapidly weakened after the announcement in August 2015 by the National Bank of Kazakhstan of a new monetary-credit policy based on inf lation targeting as well as the termination of the currency corridor and the switch to a free-f loating exchange rate system. The National Bank explained that these changes were driven by the rising pressures on the Kazakh economy associated with the weakening of the Chinese yuan and negative trends in the energy markets, in particular the 33% drop in the Brent crude oil price since the start of 2015.
Evaluations of KMG EP by independent observersIn November 2015 the ratings service of Standard & Poor’s confirmed the long – term corporate credit rating of NC KMG and KMG EP as BB+. The outlook remained “negative”.
Standard & Poor’s changed the profile of financial risks facing NC KMG from “characterized with a high level of debt burden” to “aggressive”, but it forecasts an improvement of the debt burden pressures upon conclusion of the deal for the sale of 50% of its current stake in the Kashagan field.
“At present we anticipate that the ratio of “net debt/EBITDA”, calculated according to the methodology of Standard & Poor’s will constitute on average 2.5-3.0 in the next 12-24 months, while the figure for free cash f low from operating activities will remain negative. However, we believe that the improvement in figures may be temporary, since, in our view, the company may repurchase its share in the Kashagan field when the oil prices increase and when the company is able to attract sufficient levels of investment without breaching its covenants. In relation to this, we are applying a negative correction on the component “financial policy” (-2 steps), which justifies an overall stand-alone credit profile rating (SACP) of the company at the level “b”. In addition, the rating of KMG includes an addition to the rating SACP (+4 steps), which ref lects our expectations of “very high” likelihood of receiving extraordinary support from the government,” states the Standard & Poor’s report.
In February 2016 Standard & Poor’s lowered the long – term credit rating of NC KMG and KMG EP from BB+ to BB, outlook “negative”. This decision was based on the lowering of the sovereign credit ratings of the Republic of Kazakhstan on February 17, 2016 to BBB-/A-3, due to the forecast lowering in the rate of economic growth and decrease in payments from current operations; outlook “negative”.
“We continue to evaluate the likelihood of NC KMG receiving timely and adequate extraordinary support from the state in a stressed financial situation as “very high” and rank SACP of the company at the level of “b”. We note that the revision of our assessments regarding the downwards movement in the oil price has not exerted an immediate effect on the company’s ratings, since the production of oil provides for only a small part of its profits. Furthermore, the company continues to receive current support from the government, which helps to maintain its ratings at the present levels,” states the Standard & Poor’s report.
The “negative” outlook ref lects a similar outlook for sovereign credit ratings. In accordance with the criteria of Standard & Poor’s, further lowering of the ratings of Kazakhstan by one step would determine a similar rating action in respect of NC KMG and its key subsidiary company KMG EP, all other factors remaining unchanged.
In March 2015 Moody’s international ratings agency withdrew the long – term rating of Baa3 with a “positive” outlook “for internal reasons of a business nature” but then reconfirmed the Baa3 rating for NC KMG in April 2015. At the same time Moody’s changed the forecast for a change in the rating from “positive” to “stable”. Confirmation of the rating ref lects Moody’s opinion that the company will continue to enjoy a high level of support from the government.
Analysts are looking ahead without much optimism regarding the future of oil markets. Thus Bank of America Merrill Lynch has reduced its forecast for Brent crude in 2016 to US$46 from US$50 per barrel and for WTI crude to US$45 from an earlier expected US$48 per barrel.
Morgan Stanley’s experts consider that a rapid strengthening of the US dollar could cause a fall in Brent prices to US$20 per barrel. According to their calculations, a 5% rise in the American currency would cause the oil price to drop by 10-25%. While excess fuel supply in global markets is the main reason for prices falling below US$60 per barrel, the subsequent decline from US$55 to US$35 per barrel is practically wholly related to the dollar exchange rate says the January report of the bank.
In January 2016 Moody’s rating agency lowered its oil price forecast, cutting the Brent and WTI crude price for 2016 to US$33 per barrel. Analysts expect an average US$5 increase in 2017-2018 prices.
According to the updated data from the World Bank report on January 26, 2016, its analysts forecast a 27% decline in the average price of Brent crude for 2016 to US$37 per barrel from US$51 per barrel. The bank’s experts forecast that prices will rise from current levels by the end of 2016, but note that risks of further downward pressure remain.
“There are several reasons for a recovery: firstly, the sharp fall in crude prices at the start of 2016 does not ref lect fundamental changes in the market and most likely, shall be recovered. Secondly, the production of more expensive oil will cause even greater losses and will force producers to decrease production volumes. Finally, demand for oil must slightly increase, due to the growth in the world economy,” states a review of the World Bank.
12 KazMunaiGas Exploration Production JSC Annual Report 2015
Strategic overview
Strategic overview 13 KazMunaiGas Exploration Production JSC Annual Report 2015

Chairman’s statement
We have four clear priorities for 2016:
• Streamlining back office functions;
• Improving functional discipline management;
• Improving centrally driven knowledge and technology sharing;
• Increasing efficiency of well workovers by applying modern technologies in crude oil production.
We anticipate additional tailwinds from upgrades to refining capacity, which should mean improved refining margins under our new agency model for domestic supply, and we are also assisted by the new excise duty regime.
Your Board remains completely focused on this agenda and on embedding the cultural and organisational changes in KMG EP that are required to drive it through. Your Board and our main shareholder are also discussing the scope for changes to our Charter and the Relationship Agreement that will strengthen your Board’s control and simplify decision making and organisation.
Christopher HopkinsonFirst Deputy Chief Executive of JSC NC KazMunayGasChairman of the Board of Directors of KMG EP
Dear Shareholder,
2015 was a challenging year for KMG EP, in which the firm delivered a negative operating margin as a result of a sharp and rapid fall in the oil price, which came at the same time as social costs increased. Along with the rest of the industry we face the prospect of lower oil prices persisting for longer than had been anticipated barely a year ago.
The Company has so far not been able to respond to these challenges by cutting its cost base with sufficient pace and lifting costs have continued to rise, with the breakeven point in 2015 at around US$70 per barrel. We anticipate that performance in 2016 will also be negative, as all of KMG EP’s operations are currently loss making and significant further deterioration in the cash position is expected in 2016. This situation requires immediate organisational changes.
We have been able to improve the efficiency of our maintenance programme significantly in 2015 and we have benefitted from close cooperation with NC KMG through participation in the Transformation Initiative and the Technical Institute. But we need to do much more.
To achieve our breakeven level in 2016 and 2017, we now need to accelerate progress significantly on our cost cutting and efficiency agenda, which has so far been slowed down by internal bureaucracy and duplication.
“We have been able to improve the efficiency of our maintenance programme significantly in 2015 and we have benefitted from close cooperation with NC KMG through participation in the Transformation Initiative and the Technical Institute. But we need to do much more.”
Kazakhstan is the ninth largest country in the world. Kazakhstan is one of the most developed countries in the region, with significant foreign investment.
About Kazakhstan
Population
17.4m Kazakhstan is home to more than 100 ethnic groups
Area
2.7m km2 Ninth largest country in the world by land area
Currency tenge
221.73 /$ The average exchange rate in 2015
Inflation
13.6% in 2015
Real GDP
+1.2% growth in 2015
Kazakhstan’s resources include
99 elements from the periodic table
14 KazMunaiGas Exploration Production JSC Annual Report 2015
Strategic overview
Strategic overview 15 KazMunaiGas Exploration Production JSC Annual Report 2015
Chief Executive’s Statement
tariffs, water and crude oil transportation tariffs, as well as tariffs and service costs of contracting companies and governmentally regulated gas prices. Nevertheless, other components of the operating costs, including the social element, are retained at the current level.
Consequently, the Company jointly with NC KMG and LLP KazMunayGas Production and Drilling Technology Research Institute focused its efforts on production efficiency improvement. At EMG we are implementing a digital field in addition to the implementation of optimisation processes for logistics, maintenance and repairs.
Also, we approved the Project on production efficiency improvement at Block 3 of the Uzen field at Ozenmunaigas JSC. The successful results of these projects will be applied throughout the KMG EP group of companies, and will allow us to reduce costs and improve efficiencies through optimisation of internal resources without significant additional investment.
The efficiency of geological and technical measures, including drilling of new wells, was also improved, which resonated in DeGolyer’s report. Thus, our 2P reserves, excluding stakes in JVs and associates, increased by 15% as of year-end 2015.
We are quite confident that should all the measures taken today be successful, KMG EP will be able not only to overcome the crisis period with minimum losses but will also be able to lay the foundations for further development, reserves growth and maximisation of shareholder value of the Company in the future.
Lastly, I would like to express my sincere gratitude to the members of the Board of Directors of KMG EP and the Company’s shareholders for their contribution to our development in these challenging times and share my hope for continuous mutually beneficial cooperation going forward.
The oil and gas sector is experiencing turbulent times, but every crisis is also an opportunity for optimisation and the creation of drivers of future successes. We are focused on production efficiency improvement, our investment plans were revised and we are putting forth efforts to maintain current production levels at the lowest possible costs, thereby laying the foundation for the Company’s success and financial stability.
In 2006 we carried out an IPO, attracted more than US$2 billion, and began to implement our development strategy. With these funds we acquired stakes in Karazhanbasmunai JSC, JV Kazgermunai LLP and PetroKazakhstan Inc. for a consideration in the vicinity of US$2.1 billion. To date we have received about US$3.8 billion in dividend payments from our joint ventures – our investments have mostly paid off.
Since the IPO, the Company consistently generated positive net cash f lows, with the total dividend payment to shareholders amounting to about US$3.9 billion.
As you know, in 2015 the cash balance of KMG EP decreased but there are reasons for that. A sharp decline in oil prices, the devaluation of the national currency and a high social makeup in activities of our main production companies created negative pressures on the cash position of KMG EP. At the same time, we conducted extensive work with all the relevant parties so as to resolve the issue of price determination of domestic crude supplies in 2015. Thus, as of April 2016 we shifted to an independent processing and marketing scheme for oil products, which in accordance with our estimates and given the finalisation of refineries’ modernisations should provide for an improved profitability, which will be solely dependent on market conditions.
It should be noted, however, that the Company mainly operates on mature fields, where production maintenance costs are relatively high. The growth of most of the operating costs depends on external factors such as electricity
Kurmangazy IskaziyevChief Executive Officer of KMG EP
“We are quite confident that should all the measures taken today be successful, KMG EP will be able not only to overcome the crisis period with minimum losses but will also be able to lay the foundations for further development, reserves growth and maximisation of shareholder value of the Company in the future.”
16 KazMunaiGas Exploration Production JSC Annual Report 2015
Strategic overview
Strategic overview 17 KazMunaiGas Exploration Production JSC Annual Report 2015

Independent Directors’ statement
2015. Cost is calculated as the cost of producing one tonne of crude oil, together with the cost of transportation and general and administrative costs. Between 2012 and 2014, KMG EP supplied oil to the domestic market at a margin to cost of production above three per cent.
During 2015, KazMunaiGas Refining and Marketing JSC (KMG RM) unilaterally made payments to KMG EP at an average price per annum of 21,288 tenge per tonne at the Atyrau refinery and 31,923 tenge per tonne at the Pavlodar refinery. These prices were not approved by KMG EP’s INEDs, as they were below the agreed cost +3% level. Following extensive negotiations between KMG EP’s management, NC KMG and KMG RM, an agreement was reached to settle the price for domestic supplies in 2015 at 37,000 tenge per tonne at both refineries (‘the Supply Agreement’). This price is approximately equal to the estimate of cost plus three per cent in accordance with the terms of the Relationship Agreement.
At the time of writing this report, KMG RM has failed to pay the sums due pursuant to the Supply Agreement.
2016 Domestic Oil Price AgreementThe volume obligation in the Relationship Agreement to supply oil to KMG RM expired at the end of 2015. However, the Kazakh Government continues to require that KMG EP supply the domestic market. Following the expiry of the volume obligation in the Relationship Agreement, KMG RM proposed prices for domestic oil supply that were unacceptable to KMG EP. KMG RM subsequently served a formal notice refusing to purchase oil after March 1, 2016.
Failure to meet the Kazakh government’s domestic supply requirement would result in KMG EP losing its licence to export oil. The Board of KMG EP, therefore, decided to have the required volume of oil refined at Atyrau and Pavlodar for a fee under a tolling arrangement (whereby KMG EP retains ownership of the oil) and to sell the resulting products into the domestic market. This processing scheme commenced with effect from April 1, 2016. A transitional price is currently being negotiated with respect to the first three months of 2016 on the basis of the netbacks generated by the processing scheme.
Dear Shareholders,
Over the course of 2015 and during the 2016 year to date, the Independent Non-Executive Directors (‘INEDs’) have experienced challenging times with respect to the corporate governance of KMG EP. The INEDs believe that shareholders should be aware of those challenges, and set out below a brief summary.
Proposed offer from NC KMG Shareholders will recall the proposed offer from NC KMG that was announced in July 2014 to acquire all the shares it did not already own in the Company. After receiving that approach, the INEDs engaged with KMG EP’s minority shareholders, and with NC KMG and its advisers, with a view to achieving a satisfactory transaction. In December 2014, the INEDs wrote to NC KMG stating that they would recommend the proposed offer to all shareholders, subject to agreement on the level of a dividend to be paid in respect of the year ended December 31, 2014. However, NC KMG subsequently withdrew its proposal on January 5, 2015, when it issued an announcement citing “ongoing volatility in the oil market and the inability to reach an agreement on price” as the reasons behind its withdrawal.
DividendKMG EP continues to hold substantial cash balances and despite the strong balance sheet, it has neither acquired any significant oil and gas assets nor substantially invested in exploration in recent years. In view of this, the INEDs have recommended to the Board that KMG EP should return its surplus cash to shareholders by way of a special dividend. The INEDs have proposed such a special dividend in each of the past three years, but on each occasion (including in the year ending December 31, 2015) the NC KMG majority controlled board has rejected the INEDs’ recommendation.
2015 Domestic Oil Price Agreement The Relationship Agreement entered into between NC KMG and KMG EP at the time of KMG EP’s IPO (‘the Relationship Agreement’) required KMG EP to supply oil to Kazmunaigas Trade House (now KMG RM) for the domestic market in specified volumes and at a price of cost +3%, up to and including Philip Dayer
Independent Non-Executive Director of KMG EP
Alastair FergusonIndependent Non-Executive Director of KMG EP
Edward WalsheIndependent Non-Executive Director of KMG EP
The Relationship AgreementIn November 2015, NC KMG published proposals (“Proposals”) to effect changes in the Relationship Agreement as set out at the time of KMG EP’s IPO in three key areas:
• to amend the Relationship Agreement and the Charter of the Company so as to enable NC KMG to have control of the Company;
• to amend the methodology for valuation of shares, which sets the price at which certain buybacks by the Company must be undertaken and which is embodied in the Charter of the Company; and
• to provide support for the Company in buying back shares/GDRs from shareholders within a set timeframe and at a predetermined price.
NC KMG justified its Proposals as necessary to give KMG EP the “benefit of the wider Group’s expertise and experience in key areas, reduce duplication, improve focus and decision making and significantly reduce cost”.
The INEDs were, and remain, in principle, fully supportive of the aim of achieving operational efficiencies. However, KMG EP must maintain its own adequate procedures, systems and controls to enable it to comply with its UK listing obligations.
Moreover, the Company already accesses NC KMG’s technical expertise that allows for the delivery of meaningful efficiency improvements without requiring any amendments to the Relationship Agreement or Charter, and without compromising both the Company’s independence and the commitments made at the time of the Company’s IPO. NC KMG has, to date, failed to explain to the INEDs why it requires the Company to discard these minority protections to achieve efficiencies, which are already in place.
In September 2015, KMG EP further supported the drive to greater efficiency with the formal transfer of eleven of its employees to the NC KMG Transformation Initiative team. KMG EP’s participation in that transformation programme has not been precluded or inhibited by the terms of the Relationship Agreement. KMG EP has also supported the newly established NC KMG Technical Institute (the “Scientific Research Institute of Production Technology and Drilling”) to improve productivity. The INEDs commend the professionalism and initiatives of the Technical Institute which complements the work of the Company’s own executives. The Technical Institute has proposed a number of initiatives to improve production in existing wells by deploying more electric submersible pumps (ESPs), implementing hydraulic fracturing where cost effective and drilling horizontal wells and sidetracks. Efficiencies of this type would deliver considerable benefit to KMG EP.
The INEDs believe that a cultural conservatism towards change within the wider KMG group, rather than the terms of the Relationship Agreement, may be responsible for impeding a faster realisation of these efficiencies. In short, the Relationship Agreement is a protection for minority interests and in no way inhibits progress, where such progress is possible.
The Proposals overall are intended to significantly augment the role of NC KMG as the controlling shareholder. At present, through its shareholding in KMG EP, NC KMG appoints a majority of the Company’s Board of Directors, including both the Chairman and CEO of the Company, who are key to all operational decision making. NC KMG, therefore, controls the business of the Board of Directors (including matters such as dividend policy) other than the few matters, which require the approval of a majority of the INEDs under the Charter, such as amending the Charter, the placement of shares in the Company, decisions on major transactions and on related party transactions and decisions on delisting the Company’s shares.
The INEDs believe that the amendments as proposed in November 2015 represented an undue curtailment of minority interests and that operational efficiencies are achievable by continued cooperation on the lines described above.
The INEDs are continuing to discuss with NC KMG their Proposals, which at the date of this letter, have not been finalised by NC KMG. As and when the Proposals have been finalised, the INEDs will provide KMG EP’s shareholders with their recommendations with respect to them.
Conclusion We, the INEDs, are confident that we can work together with NC KMG and our capable management team to meet our shared aim of achieving operational efficiencies and creating maximum value for all shareholders. The INEDs will continue to ensure that any changes to the corporate governance arrangements of KMG EP, including the Relationship Agreement, continue appropriately to protect the rights of minority shareholders of the Company.
18 KazMunaiGas Exploration Production JSC Annual Report 2015
Strategic overview
Strategic overview 19 KazMunaiGas Exploration Production JSC Annual Report 2015

Interview with the Chief Executive
“ Our company constantly improves technologies for crude production; and optimises operations to reduce capital expenditure and the costs of extracting crude. We are in favour of increasing exploration.”
Kurmangazy IskaziyevChief Executive Officer of KMG EP
Q Mr. Iskaziyev, how would you characterize the results achieved in 2015?
A In 2015 the oil industry, not only in Kazakhstan but around the world, suffered a serious decline which affected our further plans. Low oil prices are forcing us to review investments and to seek possibilities for savings, while supporting current production levels with minimal costs.
Despite negative external factors, production levels remain stable and in line with set plans. At our main field at Ozenmunaigas JSC we produced 5.5 million tonnes in 2015 which is 3% more than last year. On the whole, higher production was achieved by bringing new wells into operation and improvements in completions of producing wells.
Net profit for 2015 was higher at 244 billion tenge (US$ 1,096m) although the increase in net profits is mainly due to exchange rate gains which compensated for lower revenues caused by the fall in oil prices.
Q What production targets have you set yourself in the business plan?
A We plan a 1% rise in volumes from our main fields of Ozenmunaigas JSC (OMG) and Embamunaigas JSC (EMG) in 2016, raising total production volumes to 8.4 million tonnes, primarily due to production from the transfer fund of wells. At the same time we plan to reduce capital expenditure by 21% compared to 2015, primarily by reducing the volume of exploratory drilling. By 2020 overall production at OMG and EMG should increase by 4% compared to 2015, but this is conditional on improving the effectiveness of our currently producing wells, specifically including production increases from the declining well stock as a result of improvements of the recovery factor.
Production will decline by 17% compared to 2015 at our joint ventures of JV Kazgermunai LLP, Karazhanbasmunai JSC and PetroKazakhstan Inc., due to depletion of reserves. This means that the overall production of KMG EP, including its shares in KGM, CCEL and PKI is expected to be 3% lower by 2020 than in 2015.
Q What financial results are you planning to achieve?
A Present market conditions have impacted most significantly on the profitability of OMG. To support the enterprise, which is the sole urban employer in the area, the Board of Directors has agreed to provide 45 billion tenge of additional financial support in 2016. Taking into account the support of 37 billion tenge provided to OMG in 2015, this brings the total amount of support over two years to 82 billion tenge. Under the agreement terms, OMG should repay these funds by the end of 2017.
I would like to point out that both the budget and the business plan require additional work. Taking changes in external factors into account, we shall take all possible measures towards reducing costs and improving efficiency at KMG EP.
Q Will you be reducing operational expenditures through, for example, cutting employee numbers? In light of the crisis many global oil companies have already announced personnel cuts.
A We have done the utmost to reduce those expenditures, which do not affect the levels of production by postponing long-term projects to later dates. Regarding operational costs, the lion’s share is made up of wages and salaries. In 2014 these rose by 32%, including the annual indexation of salaries, the 10% increase of salaries to compensate for devaluation of the tenge and also the introduction from April 1, 2014 of a Unified System of Wages (USoW) of the “Exploration & Production” business department, set up on the initiative of the NC KMG holding company.
In 2015 expenditures on salaries rose by 13%, mainly due to the annual indexation of salaries by 7% and the effects of USoW over three months of the previous year. We treat labour costs as fixed, in other words these are costs that we cannot inf luence due to the social responsibility of KMG EP towards the Company’s workforce. However, we are trying to keep other expenditure items at present levels by raising efficiency.
Under our business plan the optimisation of production costs does not envisage reductions in headcounts, conditional on present macroeconomic conditions remaining unchanged. But in the case of deterioration in the situation, the Company will be forced to consider a range of anti-crisis measures, such as the shortening of working hours, holidays without pay, etc. If such measures would have to be introduced, and they would be extreme, then the management of the Company would be forced to include in the discussions of these matters representatives of trade unions and of the staff.
Q How are you planning to replenish reserves, given that KMG EP has not made large acquisitions recently and has cut back on exploration?
A Our company is aiming to re-activate exploration to replenish our reserves as soon as market conditions permit. At present we are looking at ways of securing sub-surface exploration and production rights at new blocks, which have attractive prospects, including on pre-salt prospects. In March 2015, for example, EMG adopted a long-term strategy which includes exploratory studies of deep pre-salt prospects in the Caspian basin.
We have worked hard to identify partners, investigate the feasibility of projects and secure corporate permissions. In future, should commercial deposits be located, we would also consider joint ventures. In particular, we are planning to explore several promising sites with potential oil bearing reservoirs below 7,000 metres.
At Zhanaozen we have started to broaden the resource base of KazGPZ. This plant provides residents with liquid gas, dry benzene-free gas and furnace fuel and also supplies Mangistau enterprises with technical-grade oxygen. Under plans up to 2024 we envisage a four stage increase in reserves and production.
NC KMG has also initiated a business transformation programme involving all of its subsidiary companies.
20 KazMunaiGas Exploration Production JSC Annual Report 2015
Strategic overview
Strategic overview 21 KazMunaiGas Exploration Production JSC Annual Report 2015

Interview with the Chief Executive continued Overview of Kazakhstan’s oil and gas sector
Q What sort of transformation is happening at KMG EP? What are the manifestations of these changes?
A This programme envisages optimisation of expenditures and processes, increases in effectiveness and, ultimately, in the profitability of the enterprise. Taking EMG where this programme is already being introduced as an example, there are three directions being realised, which are the cornerstone for future progress. These are the introduction of smart wells in the Uaz field, the optimisation of material-technical support services (MTO) and the optimisation of technical support and equipment maintenance processes (TORO).
The MTO and TORO projects will allow us to improve processes at all levels of control over the supply system, to lower stock levels in storage and also to shorten the lead times for organising purchases and their sales. The economic benefits generated within the framework of the MTO process between January 2015 and January 2016 have already reached 1.3 billion tenge. The overall effect by the end of 2017 should be 3.3 billion tenge.
Another project being delivered by specialists at EMG using their own resources is the “smart field”. At all stages of oil production at the Uaz field, equipment has been installed that takes readings and delivers them in real time to the control centre. In parallel, all information is delivered to the Centre for visualisation, where we can analyse it – and make long-term planning decisions on the basis of this information.
According to preliminary forecast data, thanks to the “smart field” project, production at the Uaz field could be about 3% higher. The time required to repair wells will also be cut by 15-20%. More careful handling of sub-surface equipment will reduce the frequency of maintenance operations from 20 to 15 per annum.
Q What social programmes are being delivered at KMG EP?
A We continue to make payments within the framework of our sub-surface production contracts towards the development of regions where KMG EP is active. In 2015 we contributed 1.9 billion tenge towards various social projects in the Atyrau and Mangistau regions. Local councils decide which social needs should be addressed by these funds, depending on regional requirements and on applications from residents. The Company also provides sponsorship assistance to sports associations, veterans of war conf licts and the Munayshi fund. Collaboration on social development continues and we are trying to improve living standards every year within those areas where we are present.
Q In the present economic conditions it is quite difficult to remain optimistic. What would you like to say to the workers of KMG EP, who number over 26,000 people across several regions of Kazakhstan?
A The Board has set serious tasks before management, which are geared towards taking KMG EP to a new stage of development. Our company constantly improves technologies for crude production; and optimises operations to reduce capital expenditure and the costs of extracting crude. We are in favour of increasing exploration. If each and every one of us performs their tasks with the emphasis on quality, we will transform our operating and management processes, deliver a stable level of crude production and enhance the shareholder value of KMG EP. We have all the prerequisites for this; we only need to work hard and to support each other to accomplish all our plans.
Kazakhstan’s hydrocarbon reserves make it one of the top 15 countries in the world with 1.8% of proven global oil reserves. Oil and gas producing basins cover 62% of the area of the country in which 172 oil fields have been identified. 80 of these fields are being developed.
Production of oil and condensate in Kazakhstan dropped slightly in 2015 to 79.46 million tonnes, which was 98.3 % of 2014 levels and below the 100.6 % planned for 2015. In future, while an increase in production is envisaged, the current forecast is less optimistic. In February 2015 the Ministry of Energy announced production plans for 104 million tonnes by 2020 but current expectations stand 12 million tonnes lower at 92 million tonnes.
The collapse in oil prices in global markets has had a negative effect on the financial and economic position of Kazakhstan’s oil and gas companies. Even the most successful ones report lower profits, while those producing from end-of-life fields are bearing significant losses. About 40% of producers active in Kazakhstan are low-profit and loss-making. According to the Kazakh government’s data, cumulative losses of oil producing companies in 2015 were over US$1.6 billion.
In the medium term experts expect large projects to be the main drivers of growth, namely Karachaganak and Tengiz, where expansion should increase production to 38 million tonnes from the current 20 million tonnes by 2021, and Kashagan, which is expected to come on-stream by the end of 2016.
The Tengiz field is one of the largest in the world. It is being developed by the TengizChevroil consortium (TCO). The license area includes the Tengiz field and Korolevskoye field, which is smaller but rich in reserves. The extractable crude reserves of the Tengiz and Korolevskoye fields are estimated at between 750 million and 1.1 billion tonnes. The total explored reserves in drilled and undrilled areas of the Tengiz field are estimated at 3.1 billion tonnes or 26 billion barrels of oil.
The Karachaganak field, located in the Western region of Kazakhstan with reserves of 1.2 billion tonnes of oil and condensate and in excess of 1.34 trillion cubic metres (tcm) of gas is one of the largest oil and gas condensate fields in the world. Karachaganak produces 49% of all the gas and 18% of all the oil in Kazakhstan.
Kashagan is a large offshore oil and gas field lying in the north of the Caspian Sea. Geological reserves are estimated at 4.8 billion tonnes of crude. Overall crude reserves are 38 billion barrels, of which about 10 billion barrels are extractable. Kashagan has significant natural gas reserves – over 1 trillion cubic metres. Production at Kashagan commenced in September 2013, but was suspended in October due to a gas leak in one of the main pipelines. An analysis carried out over several months revealed multiple micro-fractures in the pipeline caused by the reaction of H2S, a corrosive gas, on the metal pipes. North Caspian Operating Company (NCOC), the operator of the project, confirmed the need to completely replace about 200 kms of both the gas and oil pipelines connecting the offshore production facility with the onshore gas treatment plant at Bolashak.
22 KazMunaiGas Exploration Production JSC Annual Report 2015
Strategic overview
Strategic overview 23 KazMunaiGas Exploration Production JSC Annual Report 2015

Overview of Kazakhstan’s oil and gas sector continued
The volume of gas exports rose 14.4% in 2015 to 12.7 bcm. The volume of international gas transit through the Republic was 87.1 bcm, or 95% of the volume transported in 2014. A gas swap arrangement between Kazakhstan and Russia entails the replacement of Karachaganak gas, which has historically been supplied to Orenburg for processing, with imports of Central Asian and Russian gas, which are delivered to the southern part of Kazakhstan and the Kostanay region respectively.
In 2015 the government embarked on the second wave of privatisation, in accordance with the complex privatisation plan approved for 2014-2016. Several state owned companies and assets of national holding companies and national companies were put up for sale. NC KMG has decided to retain ownership of 75 companies out of the 206 that it owned.
Downstream operations run by KazMunaiGas Refining and Marketing JSC, including all oil refining plants and filling station networks will be among the assets to be privatised via the sale of 51% of KazMunaiGas Refining and Marketing JSC. In addition, no less than 51% of KMG International shall be put up for sale. Overall, this is part of the optimisation process at the NC KMG group, aimed at improving control and avoiding the duplication of production and corporate sector functions. It should also help improve internal integration, which should have a positive inf luence on the consolidated economic metrics of the group as a whole.
Sources of information: Ministry of Energy of Kazakhstan, Statistics Committee of the Ministry of National Economy of Kazakhstan.
development. The CPC line connecting the Tengiz field with the Russian Black Sea port of Novorossiysk is currently being expanded so that future volumes of crude pumped through it could reach 67-70 million tonnes per year. The bulk of the oil, some 55 million tonnes, is expected to be Kazakhstan crude from the Tengiz, Karachaganak and Kashagan fields. Current throughput capacity of the CPC pipeline is 57.5 million tonnes of crude, including 39.4 million tonnes from Kazakhstan. This expansion project is expected to be completed by December 2016.
In 2015 Kazakhstan supplied Russia with 2.3 million tonnes of oil on the basis of an inter-governmental agreement under which the parties agreed on reciprocal supplies of Kazakhstan crude to Russia in compensation for losses to the Russian federal budget in respect of oil products supplied by Russia to Kazakhstan during 2012-2013.
Due to the significant decline in world oil prices, export customs excise duties (ETP) for crude oil were lowered to US$60 per tonne from US$80 in March 2015 and reduced again to US$40 from US$60 per tonne from January 1, 2016.
The volume of gas produced by Kazakhstan oil and gas companies rose 5% to 45.3 billion cubic metres (bcm) in 2015, which was also 3% higher than planned. Thanks to the historical development of the pipeline system while Kazakhstan was a part of the integrated Soviet Union, current shipments of Kazakhstan gas are exported primarily in the direction of Russia. At the end of 2015, however, the new Kazakhstan–China “C-line” gas export pipeline was inaugurated. The gas export system to China consists of three branches running across three southern regions: these are the Yuzhny (Southern) Kazakhstan, Zhambyl and Almaty regions. When all three lines are fully operational the capacity of the A, B and C lines will be 55 bcm.
OIl production in 2015
79.5 million tonnes
Oil and gas-rich regions of Kazakhstan cover
62% of the nation’s surface area
Kazakhstan oil refineries processed
14.6 million tonnes of crude oil in 2015
The volume of crude oil refined in 2015 dropped slightly to 14.546 million tonnes which was 97.6% of 2014 volumes and below the 101.7% planned. Some 14.3 million tonnes of crude oil will be refined this year, according to the Ministry of Energy’s plan for the refining and production of oil products.
Currently Kazakhstan imports some light oil products to satisfy its domestic demand. After the completion of the ongoing reconstructions and modernisations of the three domestic oil refineries, however, (planned for completion by 2017), the total crude refining capacity will rise to 18.5 million tonnes of crude annually and will be able to fully satisfy the domestic demand for light oil products.
The 84.66 million tonnes of crude oil transported last year in Kazakhstan was a little lower at 97.8% of comparable 2014 volumes, but was 100% in line with planned volumes for 2015.
The volumes transported included 60.95 million tonnes of crude oil and gas condensate, which were exported, again slightly lower than the previous year at 97.7% of 2014 volumes. Some 38.044 million tonnes of crude were exported via the Caspian Pipeline Consortium (CPC) pipeline to Novorossiysk, 13.456 million tonnes were transported north via the Atyrau-Samara pipeline and 4.796 million tonnes went east to China via the Atasu-Alashankou pipeline. A further 3.171 million tonnes of crude was shipped through the port of Aktau while some 665,926 tonnes of gas condensate were sent to the Orenburg oil refinery in Siberia and 813,597 tonnes were shipped by rail.
Kazakhstan crude is exported to Europe via the CPC and Atyrau-Samara pipelines and terminals in the Black Sea and the Baltic, and also eastwards to the Chinese market. All markets in every direction have potential for further
24 KazMunaiGas Exploration Production JSC Annual Report 2015
Strategic overview
Strategic overview 25 KazMunaiGas Exploration Production JSC Annual Report 2015

Milestones of the year
Quarter 1The Independent Directors of the Company were notified by NC KMG that it was withdrawing its proposal to acquire the shares in KMG EP that it does not already own at a price of US$18.50 per GDR.
According to a decision of an Extraordinary General Meeting (EGM) of the Company, Christopher Hopkinson, First Deputy Chairman of the Management Board of NC KMG was appointed to the Board of Directors, due to the early retirement from his duties of Daniyar Berlibayev, Chairman of the Board. At a meeting of the Board of Directors, Mr. Hopkinson was then elected Chairman of the Board of Directors of KMG EP and member of the Appointments Committee of the Board of Directors of KMG EP.
Additional agreements extending the terms of contracts for the usage of subterranean resources were signed between the Ministry of Energy of Kazakhstan and subsidiary and associate companies of KMG EP. Contracts for the development of oilfields were extended with Embamunaigas (EMG): No.37 – Kenbay field – up to 2041; No.61 – Yugo-Vostochnoe Novobogatinskoe – up to 2048; and No.211 – Botakhan, Makat, Dossor, Tanatar, Kamyshitovoe and other fields (22 fields in total) – up to 2037; No.413 – Prorva, Kuljsary, Karaton, Koschagyl and other fields (13 fields in total) – up to 2043. Additionally, exploration contract No.468 for LLP Ural Oil and Gas LLP, which is active within the Fedorovsky block was extended until 2016.
Over the first three months of 2015 KMG EP, including its shares in JV Kazgermunai LLP (KMG), CCEL and PetroKazakhstan Inc. (PKI) produced 3,037 thousand tonnes of crude (249kbopd), which is a little less than during the same period in 2014, but 55 thousand tonnes or 4kbopd more than planned for the first quarter of 2015.
Revenues for the first three months of 2015 declined to 117 billion tenge (US$632m), some 47% below the same period in 2014. Net profits stood at 1.6 billion tenge (US$9m). Production costs rose 32% to 58 billion tenge (US$314m), compared with the same period in 2014, mainly due to higher remuneration for employees of production divisions.
Quarter 2The Ministry of Energy and LLP Ural Oil and Gas LLP, in which KMG EP has a 50% stake, signed a contract for the production of gas and condensate from the Rozhkovskoe field within the Fedorovsky block, located in the Western Kazakhstan region. The contract envisages production of gas and condensate from the Rozhkovskoe field within part of blocks XIII-11-C and part of blocks 12-A, B and C over a 25 year period. Production is scheduled to start in 2017.
According to a report by Miller & Lents Ltd (MLL) as of December 31, 2014, the reserves of liquid hydrocarbons at the fields of OMG, EMG, LLP KazGPZ and LLP Ural Oil and Gas LLP (KMG EP share: 50%), were as follows:
• Reserves in the category of “proven” (1P) were reduced by 16% or 19 million tonnes down to 103 million tonnes (763 million barrels);
• Reserves in the category “proven and probable” (2P) were reduced by 11% or 16 million tonnes down to 132 million tonnes (981 million barrels);
• Reserves in the category “proven, probable and possible” (3P) were reduced by 10% or 18 million tonnes down to 164 million tonnes (1,215 million barrels).
A new Board of Directors of KMG EP was elected for a one year term ending April 13, 2016 inclusive. On the decision of an EGM Kurtwood Hillman, Managing Director of Operational Production Assets of NC KMG replaced Timur Bimagambetov on the Board of Directors of KMG EP as the representative of NC KMG.
Shareholders decided on a dividend of 440 tenge per share (including taxes withheld in accordance with the legislation of Kazakhstan) for both ordinary and preference shares. The total cost of dividends for 2014 was around 30 billion tenge (US$162m).
During the first half of 2015 consolidated production, taking into account shares in KGM, CCEL and PKI was 6,122 thousand tonnes of oil (250kbopd), some 0.3% higher than the same period in 2014.
Net profit for the first six months of 2015 was 2.9 billion tenge (US$16m), compared to 210 billion tenge (US$1,193m) for the same period in 2014. Revenue for the first six months was 241 billion tenge (US$1,302m), some 48% lower than the same period in 2014. Production costs in Q1 2015 were 23% higher at 109 billion tenge (US$589m) than the same period in 2014, mainly due to higher remuneration of employees of production divisions approved by the Company as of April 1, 2014.
26 KazMunaiGas Exploration Production JSC Annual Report 2015
Strategic overview
Strategic overview 27 KazMunaiGas Exploration Production JSC Annual Report 2015

Quarter 3An additional agreement was entered into between the Ministry of Energy and Karazhanbasmunai JSC to extend the validity of the term of the contract for production of hydrocarbons at the oil and gas field of Karazhanbas in the Mangistau region until June 7, 2035.
An addendum was signed to the agreement on extending the term of validity of the contract No.40 dated May 31, 1996 for the development of the Uzen and Karamandybas oil fields in the Mangistau region until May 31, 2036, inclusive. Previously the contract was valid until 2021.
On August 20, 2015 the Government and National Bank of the Republic of Kazakhstan decided to switch to a free f loating rate of exchange for the tenge. Following this announcement the tenge/US dollar exchange rate depreciated by around 50% within a month, and continued to depreciate over the following months.
The Board of Directors accepted the request of the CEO Abat Nurseitov to resign from his position as CEO (Chairman of the Management Board) and membership of the Board of Directors of the Company, due to moving to another job. His responsibilities as a member of the Board of Directors were terminated on the same day. Kurmangazy Iskaziyev was elected as CEO (Chairman of the Management Board) of KMG EP. Previously Mr. Iskaziyev held the position of CEO of EMG – one of the main production assets of KMG EP.
KMG EP, including its shares in KGM, CCEL and PKI produced 9,245 thousand tonnes of oil (251kbopd), during the first nine months of 2015 or 0.3% more than during the same period in 2014.
Net profit for the first nine months of 2015 was 138 billion tenge (US$703m), compared to 242 billion tenge (US$1,357m) for the same period in 2014. Revenue was 349 billion tenge (US$1,783m). Changes in the exchange rate allowed the Company to book foreign exchange profits of 262 billion tenge. Production costs rose 11% to 160 billion tenge (US$817m) compared to the same period in 2014, mainly due to higher pay for employees of production divisions, which was awarded on April 1.
The production base of the Uzen field held the 8th annual competition of professional mastery “Uzdik maman” among workers of subsidiary organisations and joint ventures of KMG EP, in which 58 workers of OMG, EMG, Karazhanbasmunai JSC, JV Kazgermunai LLP and service company LLP Kruz took part. By the end of the competition, all of the top places in all of the 11 nominations were taken by employees of OMG.
In Atyrau the 4th Spartakiade of workers from all KMG EP group Companies took place. Some 350 oil workers from the Atyrau, Mangistau, Western Kazakhstan and Kyzylorda regions and also from the cities of Astana and Uralsk took part in the sports competitions.
Quarter 4The Board of Directors of KMG EP received a notification from Board member Kurtwood Hillman on October 20, 2015 requesting early termination of his responsibilities, which was granted on the same day.
Following the decision of an EGM Igor Goncharov, Head for Operating Production Assets and Senior Engineer of NC KMG and Kurmangazy Iskaziyev, General Director (Chairman of the Management Board) of KMG EP were elected to replace Kurtwood Hillman and Abat Nurseitov.
The Board of Directors approved the budget for 2016 and the business plan for 2016-2020, based on a forecast average annual oil price for Brent crude at US$40.1 per barrel for 2016-2017 rising to US$50.1 per barrel for 2018-2020 and an annual average exchange rate of 300 tenge/US dollar for 2016-2020. The planned 2016 production target for OMG and EMG was fixed at 8,434 thousand tonnes (170kbopd), which is 1% more than in 2015, due to an expected rise in the effectiveness of production operations.
The Board of Directors approved 45 billion tenge of additional financial support to OMG in 2016. Taking into account the 37 billion tenge provided in 2015, this brings the total amount of financial support for 2015-2016 to 82 billion tenge. OMG undertakes to repay these amounts no later than December 31 ,2017.
On November 9, 2015 NC KMG wrote to the Chairman of KMG EP to propose revisions to the existing Relationship Agreement between the companies. KMG EP replied that the Board of Directors of the Company had taken note of said letter and asked shareholders not to take any action at the present time.
KMG EP, including shares in KMG, CCEL and PKI produced 12,351 thousand tonnes of oil (251kbopd) – practically at 2014 levels.
Net profit for 2015 rose to 244 billion tenge (US$1,096m) compared with 47 billion tenge (US$263m) in 2014 on revenues of 530 billion tenge (US$2,384m). Production costs were 6% higher at 225 billion tenge (US$1,013m), mainly due to higher wages.
Milestones of the year continued
Q3 Q4Рroduced in the third quarter of 2015
251 thousand barrels per day
The Board of Directors has approved the budget for 2016 and Business Plan for
2016-2020
28 KazMunaiGas Exploration Production JSC Annual Report 2015
Strategic overview
Strategic overview 29 KazMunaiGas Exploration Production JSC Annual Report 2015
Operational activities overview
The planned volume of production in 2016 is 5,612 thousand tonnes (113 kbopd) at OMG and 2,822 thousand tonnes (57 kbopd) at EMG. The total planned production volume at OMG and EMG is 8,434 thousand tonnes (170 kbopd), which is 1% more than produced in 2015, due to increases in production efficiencies.
KMG EP’s share of the planned volume of production of KGM, CCEL (KBM) and PKI in 2016 is 3,777 thousand tonnes (77 kbopd), which is 4% less than produced in 2015, mainly due to the expected decline in crude production at PKI.
Capital expendituresTaking into account the fall in oil prices, the level of capital investments for 2015 was reduced by cutting costs that do not inf luence current production. In particular, a number of long – term projects were postponed to later dates. Capital expenditure in 2015 amounted to 98 billion tenge (US$443m), 23% lower than in 2014, mainly due to lower investment levels and lower costs of exploratory drilling thanks to a 15% discount from the supplier of drilling services. Last year OMG and EMG drilled 283 wells, compared with 297 wells in 2014.
Capital expenditure in 2016 is expected to be 85 billion tenge (US$282m), which is 21% less than in 2015. Lower capital expenditure stems mainly from a reduction in production drilling from 283 wells in 2015 to 171 wells in 2016.
Oil productionThe main constituent in the further development of the Company is increasing the effectiveness of production on developed fields. To fulfil this task, control of production processes is carried out on a constant basis at the production sites of KMG EP aimed at their optimisation. We also have introduced a policy of energy conservation and carry out studies to increase the recovery factors of the reservoirs.
In 2015 production from the main assets of KMG EP on the whole corresponded with the approved plan. During the reporting period KMG EP, including its stakes in JV Kazgermunai LLP (KGM), CCEL (Karazhanbasmunai JSC) and PetroKazakhstan Inc. (PKI), produced 12,351 thousand tonnes of crude oil (251 kbopd) in 2015, which is practically in line with 2014 volumes.
Ozenmunaigas JSC (OMG) produced 5,510 thousand tonnes (111 kbopd) in 2015, an increase of 182 thousand tonnes (4 kbopd) or 3% compared to 2014. Embamunaigas JSC (EMG) produced 2,823 thousand tonnes (57 kbopd), in line with 2014 levels. As a result, OMG and EMG production increased by 2% to 8,333 thousand tonnes (168 kbopd) compared to 2014.
KMG EP’s share of production from CCEL, KGM and PKI for 2015 amounted to 4,018 thousand tonnes of crude oil (83 kbopd), 4% lower than in 2014, which primarily relates to the planned decrease in crude production levels at PKI.
In 2015, the core assets OMG and EMG drilled 283 production and injection wells, some 5% less than in 2014. A total of 921 production and injection wells at OMG underwent major workovers, which ensured 433 thousand tonnes of additional production. Oil production in 2015 from new wells at OMG amounted to 523 thousand tonnes compared with 374 thousand tonnes in 2014. In 2015, major workovers at EMG of 248 wells provided an incremental production increase of 97 thousand tonnes, which is 9.4 thousand tonnes more than in 2014. Oil production in 2015 from new wells at EMG amounted to 66 thousand tonnes compared with 73 thousand tonnes in 2014. A total of 1,169 wells at OMG and EMG underwent major workovers compared with 1,174 wells in 2014 and 17,876 subsurface workovers were undertaken.
Since 2012, OMG specialists jointly with partners from Tatneft have been introducing new production technologies. From the inception of the programme 55 chain drives of type PTs80 sucker rod well pumps have been installed. The advantages of the PTs80 pump over a standard pumpjack are a lowering of dynamic loads and specific energy consumption on product lifting and the possibility of using wells with additional small diameter production columns without productivity loss. These chain driven sucker rod pumps are more effective on a diverse portfolio of wells which produce highly viscous crude and emulsions. The technological and economic effectiveness of using chain drives in wells is achieved due to the decrease in the amount of subsurface maintenance work required and savings in electricity consumption.
Also, technologies that have been successfully developed by specialists from Tatneft and equipment makers to counter saline deposits and the suppression of sulphate-reconstituting bacteria are being successfully introduced in OMG fields.
Production expenditures in 2015 were 225 billion tenge (US$1,013m), some 6% more than in 2014, mainly due to higher wages and salaries, partly compensated by reduced costs on maintenance and services.
Spending on staff remuneration in 2015 increased by 18%, mainly due to the indexing of salaries by 7% from January 2015 and a 6.9 billion tenge increase in the overall wages and salaries bill, resulting from the renewal of labour contracts at OMG and EMG.
Repairs and maintenance expenses were down 25% as expenses were optimised and work volumes were reallocated from third parties to KMG EP group companies.
Key performance indicators of OMG and EMG as of end 2015
OMG EMG KMG EP
Number of fields 2 41 43Number of producing wells 3,905 2,249 6,154Number of injection wells 1,260 442 1,702Average daily oil rate per well (tonnes/day) 4.5 3.7 4.1Crude reserves 2P, million barrels 716 300 1,016Lifting costs, US$ per barrel 14.4 11.3 13.3Lifting costs, tenge/tonne 23,524 18,285 21,679Oil production in 2015, thousand tonnes/day 15.1 7.7 22.8Oil production in 2015, kbopd 111.1 56.7 167.8
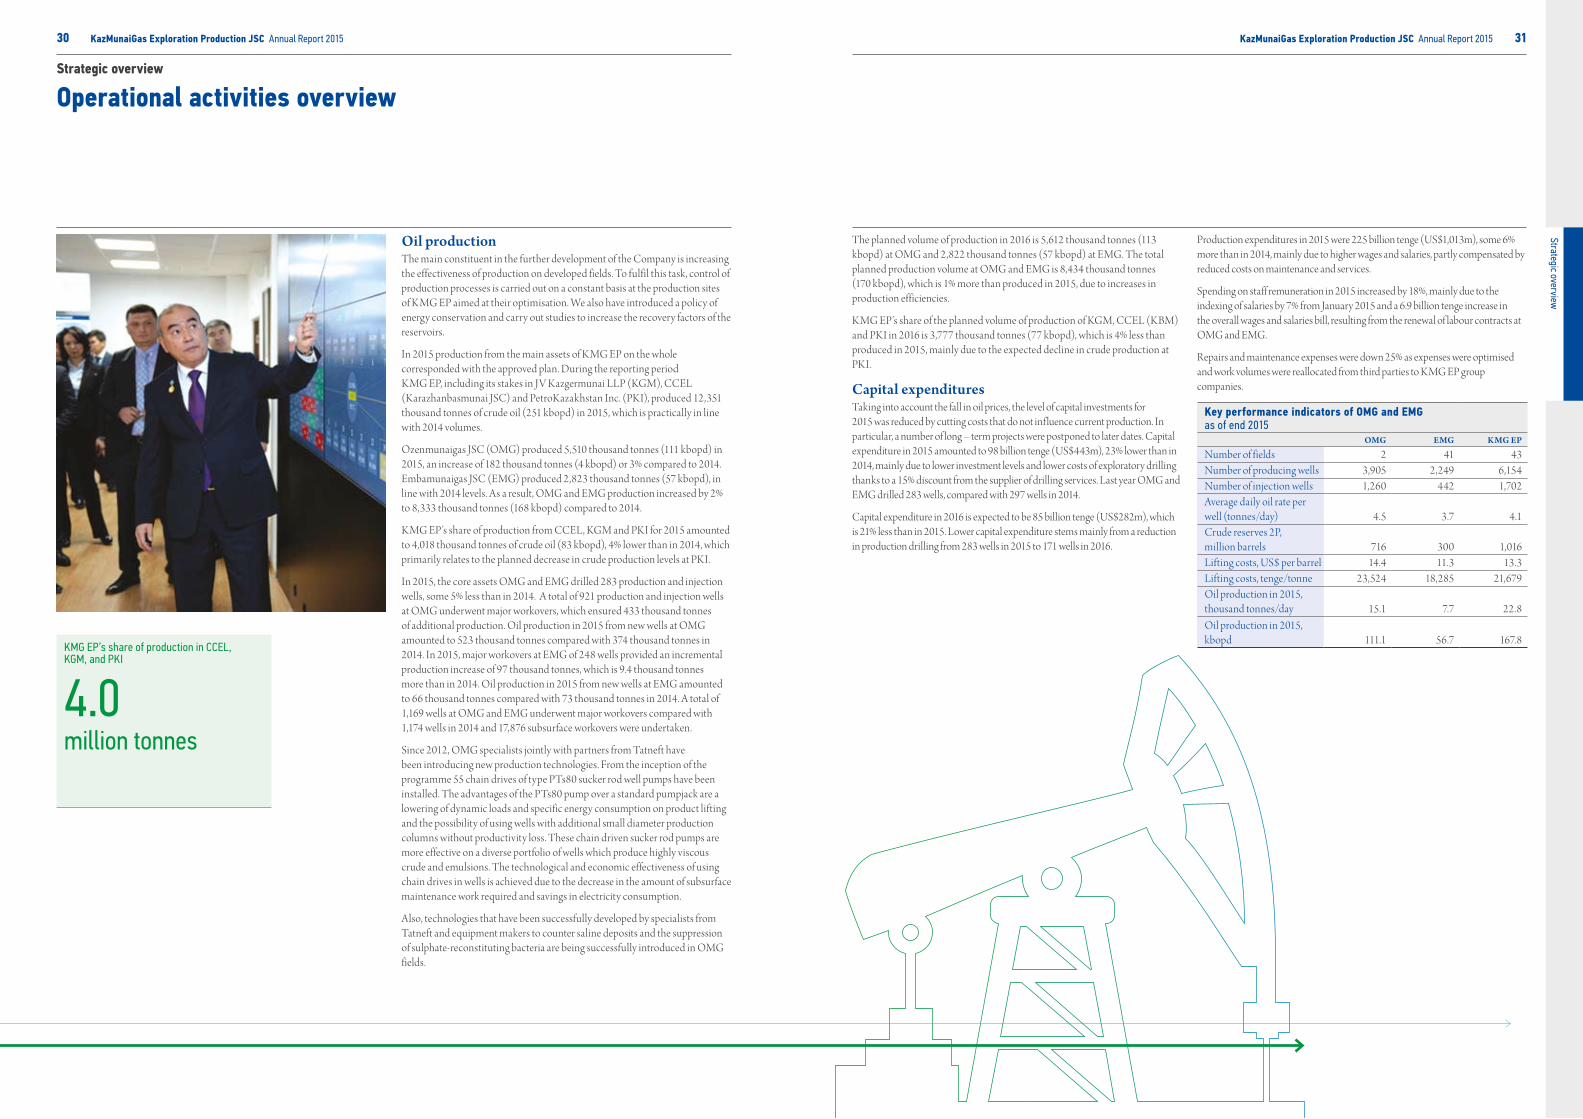
KMG EP’s share of production in CCEL, KGM, and PKI
4.0 million tonnes
30 KazMunaiGas Exploration Production JSC Annual Report 2015
Strategic overview
Strategic overview 31 KazMunaiGas Exploration Production JSC Annual Report 2015

Supplies for export and domestic marketsOMG and EMG export crude oil via the Caspian Pipeline Consortium (“CPC”) and via the Uzen-Atyrau-Samara pipeline (“UAS”) and OMG also delivers crude to the domestic market.
In 2015, the crude oil sales volumes of OMG and EMG stood at 8,305 thousand tonnes (165 kbopd), including 4,647 thousand tonnes (92 kbopd) for export, 2,742 thousand tonnes (54 kbopd) of crude and oil products for the domestic market and 916 thousand tonnes (18 kbopd) of crude oil delivered to Russia.1
Of the 2,742 thousand tonnes (54 kbopd) of crude and oil products shipped by OMG and EMG to the domestic market, 2,420 thousand tonnes (48 kbopd) were supplied to the Atyrau oil refinery (ANPZ) and 260 thousand tonnes (5.2 kbopd) to the Pavlodar petrochemical plant (PNHZ). A further 62 thousand tonnes of oil products (1.2 kbopd) were sold into the domestic market.
The share of sales by CCEL, KGM and PKI relating to KMG EP was 3,944 thousand tonnes of crude (80 kbopd), including 1,707 thousand tonnes of crude (34 kbopd) for export, which makes up 43% of the total volume of sales of the companies. Sales to the domestic market were 2,167 thousand tonnes (45 kbopd), of which 1,471 thousand tonnes (31 kbopd) was supplied to PNHZ while 506 thousand tonnes (11 kbopd) of crude were delivered to the Shymkent NPZ, 53 thousand tonnes (1.0 kbopd) to ANPZ and 138 thousand tonnes (2.5 kbopd) to the Aktau bitumen plant. Oil swap deliveries to Russia were 70 thousand tonnes (1.3 kbopd).
Until 2015 the Company supplied the domestic market within the limits identified in the IPO prospectus. From 2006 to 2010 deliveries were less than 1.9 million tonnes; and from 2011 to 2015 within the volume limits set by the Company’s business plan and approved by the Board of Directors. The prospectus stated that the supply price for the domestic market would be at cost plus 3%, calculated as the lifting cost of one tonne of crude oil, plus transportation and administrative costs. As of 2012-2014, supplies to the domestic market were carried out with a margin to lifting cost in excess of 3%, which went some way to offsetting the cost of increased staff numbers, which the Company agreed to adopt after Zhanaozen protests.
During 2015 KazMunaiGas Refining and Marketing JSC (KMG RM) paid 21,288 tenge per tonne at the Atyrau oil refinery (ANPZ) and 31,923 tenge per tonne at the Pavlodar oil refinery (PNHZ) on average throughout the year. The stated costs of supply to the domestic market were not approved by the independent directors of KMG EP. After extensive negotiations between the management of KMG EP and NC KMG / KMG RM, the agreed price
of business processes and structures; raise the effectiveness of activity; the creation of a shared information environment and an integrated management system and the creation of a corporate culture of continuous improvement.
The diagnosis and design of existing business processes within the framework of the Programme of business transformation is conducted at the 40 largest subsidiary and dependent companies of NC KMG, including: KMG EP, KazTransOil, KazTransGas, KazMunaiGas Refining and Marketing JSC, NMSK Kazmortransf lot, KMG International NV, AktauNefteService, NII Technology of Mining and Drilling KMG, etc.
Within the framework of this transformation NC KMG should become a functionally structured company. Supporting/service divisions will be segregated from the operating companies alongside other divisions that deal with non-core activities and formed as legal entities outside the production organisations. At the same time, workers will be offered positions in the service companies which are part of the NC KMG group of companies. Guarantees will be given to retain wage levels, qualifications and grades, the rights and work experience to qualify for annual leave and conditions of bonus remuneration. In the case of changes to working conditions such as levels of work payment and bonuses, workers will be offered compensation. According to NC KMG’s plans the reorganisation of companies will not be accompanied by a reduction in personnel headcounts.
These NC KMG changes commenced at EMG where several projects are being completed, which are conditionally called “rapid victories”. These are the optimisation of the process of material-technical support (MTO), the optimisation of the process of technical servicing and maintenance of oil production equipment (TORO), the introduction of the concept of the smart field using the example of the Uaz field. These projects are directed towards optimising the production of oil, reducing overheads and improvements in work productivity.
On the basis of preliminary reports, economic benefits obtained within the framework of the Project of optimisation of MTO between 2015 and January 2016 has already contributed 1.3 billion tenge (US$4.8m) and has recouped investments several times over. By the end of 2017 the project will allow EMG to save up to 60% of surplus stock and to save an overall 3.3 billion tenge (US$11.0m) (including the 1.3 billion tenge (US$4.8m) from 2015).
for domestic supplies for 2015 was set at 37,000 tenge per tonne to ANPZ and PNHZ. The stated price is as close as possible to the calculated level, cost plus 3%, in accordance with the conditions of the Agreement on relationships between KMG EP and NC KMG, which was concluded during preparation of KMG EP for the IPO.
The management of KMG EP negotiated with KMG RM on the terms of supply to the domestic market during 2016 to achieve the most profitable solution. KMG EP’s management has decided to change to processing crude oil with the sale of the resulting oil products meeting domestic supply obligations imposed by the Government. Changes associated with this new scheme have already been included in the approved 2016 budget. KMG EP share of the planned supplies to the domestic market by KGM, CCEL and PKI in 2016 will be 1.9 million tonnes (39 kbopd), or about 50% of the total volume of sales by these companies. KGM will supply crude to Pavlodar (PNHZ) in 2016 and to the Shymkent Refinery (PKOP) starting in 2017. PKI will also supply to Shymkent (PKOP) while CCEL will supply the Aktau bitumen plant. The average sales price in the domestic market in 2016 is expected to be 28,802 tenge per tonne (USD$12.5 p/bbl) for KGM, 38,075 tenge per tonne (USD$16.5 p/bbl) for PKI and 18,870 tenge per tonne (USD$9.4 p/bbl) for CCEL.
Key performance indicators of KGM, CCEL and PKI in 2015KGM CCEL PKI
Number of fields 5 1 12Number of wells 212 2,714 869Number of injection wells 26 796 378Lifting costs 2.8 19.1 5.2Oil reserves 2P, mmbbl 83 157 55Oil production, kbopd 31.6 19.6 30.7
Programme of business transformationThe Programme of business transformation at NC KMG, launched in October 2014 is being implemented on the initiative of Sovereign Wealth Fund Samruk-Kazyna JSC and is directed towards the changing, improvement and application of leading practices and management technologies to enhance the effectiveness of the activities of the NC KMG group of companies. The aim of the transformation process is to achieve the standardisation and optimisation
Thanks to the “smart wells” project, additional production from Uaz may rise about 3%. The time needed to restart well operations will be cut by 15-20%, the more economical mode of operating subsoil equipment will cut maintenance stoppages from 20 to 15 per year.
Extension of subsoil use contractsIn March 2015 additional contracts for the extension of the term of validity of contracts for subsoil use were signed between the Ministry of Energy and subsidiary and dependent companies of KMG EP. Four contracts for the development of oil reserves were extended. These are the Kenbay field (contract No 37) valid until 2041; the SE Novobogatinskoe field (contract No 61) valid until 2048; the Botakhan, Makat, Dossor, Tanatar, Kamyshitovoe and other fields (22 fields in total – contract No 211) valid until 2037; and the Prorva, Kulsary, Karaton, Koschagyl and others (13 fields in total – contract No 413) valid until 2043.
Additionally, the contract for the exploration of hydrocarbons (contract No 468) with Ural Oil and Gas has been extended until the end of 2016. A contract has been signed with the Ministry of Energy and UOG (50% owned by KMG EP) for the production of gas and condensate at the Rozhkovskoe field within the Fedorovsky block, located in the Western Kazakhstan region. The contract was signed by the parties on 2 April, 2015 for the production of gas and condensate at the Rozhkovskoe field within parts of the XIII-11-C and parts of the X11-12 – A, B and C blocks for a period of 25 years. Start of production is scheduled for 2017.
In July 2015 an additional agreement was signed to extend the term of the contract for production at the Karazhanbas oil and gas field in the Mangistau region until 2035. Previously the term of the contract was set until 2020. Also in July an addition was signed extending the validity of the contract for developing the Uzen and Karamandybas oil fields in the Mangistau region until 2036. Previously the contract was valid until 2021.
Problem with the development of contested territories of EMG were also resolved in 2015. The company is exploring for hydrocarbons in the Taysoygan block in the Atyrau region in accordance with an exploration and development contract dated May 12, 1999. Following the 2000 ratification of the Agreement between the Russian Federation and the Republic of Kazakhstan on the procedures for usage of the 929 State testing airbase, part of the territory of the Taysoygan block came under the territory of the airbase firing range.
Operational activities overview continued
1 Supplies to Russia were made under the oil swap agreement between the Kazakhstan and Russian governments. Counter-shipment supply volumes shipped to Russia are specified by the Ministry of Energy.
32 KazMunaiGas Exploration Production JSC Annual Report 2015
Strategic overview
Strategic overview 33 KazMunaiGas Exploration Production JSC Annual Report 2015

Because of this, EMG encountered certain limitations to the conduct of exploration and also in developing the explored territories within the block. On April 16, 2015 the Ministry of Defence of Kazakhstan and its Russian counterpart signed a protocol introducing changes and additions to the above mentioned Agreement on exclusion from the lease and the transfer to the Kazakh side of over 1.6 million hectares of land, including the exploration block of Taysoygan.
The protocol is subject to ratification. Within the limits of the area concerned, EMG is conducting geological exploration and test production from the Uaz and Kondybay fields. Following ratification the Agreement will allow extended exploration and appraisal of the block for the purposes of identifying commercial oil and gas reserves and development of infrastructure in the region and aimed at bringing the Uaz and Kondybay discoveries into production.
ReservesAccording to the DeGolyer and MacNaughton (DeGolyer) report proved plus probable (2P) reserves of liquid hydrocarbons as at December 31, 2015 excluding the Company’s stakes in JV Kazgermunai LLP, CCEL and PetroKazakhstan Inc. were 152 million tonnes (1,115 million barrels), which is 15% more than at the end of 2014 mainly due to the involvement in the development of reserves through the implementation of more effective geological and technical measures, including the drilling of wells.
Proved (1P) reserves of liquid hydrocarbons as at December 31, 2015 were 99 million tonnes (723 million barrels), and proved, probable and possible (3P) reserves stand at 204 million tonnes (1,491 million barrels).
Millions of tonnes Millions of barrels1P 2P 3P 1P 2P 3P
Reserves as at 31 Dec 20141 103 132 164 763 981 1,215Production 8.3 8.3 8.3 61 61 61Reserves growth -4.1 28 48 -20 194 337Reserves as at 31 Dec 20152 99 152 204 723 1,115 1,491Present worth at 10%,
US$m 2,535 2,849 3,395
Assessment of 2P reserves of joint ventures were made separately by independent auditors 3.KMG EP’s share in overall 2P reserves of KGM (50% stake), CCEL (50% stake) and PKI (33% stake) as at the end of 2015 amounted to 41 million tonnes (294 million barrels). Thus, total 2P reserves of KMG EP including its stakes in KGM, CCEL, and PKI as at the end of 2015 amounted to 193 million tonnes (1,409 million barrels).
Consolidated 2P reserves as of 31 December, 2015
Millions of tonnes
Millions of barrels
KMG EP 152 1,115KGM 50%, CCEL 50%, PKI 33% 41 294Consolidated reserves 193 1,409
1 2014 reserves were estimated by “Miller and Lents, LTD.”2 2015 reserves were estimated by “DeGolyer and MacNaughton”.3 Assessment of reserves as at 31 December 2015 of KGM and CCEL were made by «Miller
and Lents, Ltd.» and of PKI by «McDaniel».
Operational activities overview continued
ExplorationUnder the approved business plan the minimal necessary volume of works on the existing portfolio of exploration assets is envisaged. As soon as market conditions become more favourable, KMG EP will intensify exploration operations. At present the Company is investigating receiving subsoil use rights to new promising areas for exploration works, including deep pre-salt prospects in the Caspian basin.
In February 2015, KMG EP and the Committee of Geology and Subsoil Use of the Ministry for Investments and Development of the Republic of Kazakhstan signed a Memorandum on Mutual Cooperation in the field of exploration aimed at improving exploration efficiency and conducting geological studies of hydrocarbon bearing reservoirs in Kazakhstan.
Under the Memorandum, the Company will proceed with the geological studies of promising areas in Kazakh sedimentary basins to explore for potential oil and gas fields and increase hydrocarbon resources. The parties have agreed to share all available data on mineral resources and geological and technological data, and to proceed with mutually agreed exploration efforts, using the latest geological exploration technologies.
At the beginning of 2016 exploration results were received from the structures of the north-eastern wing of S. Nurzhanov, the Liman and Akkuduk blocks. While running production tests on reservoirs of Triassic age in an angled bore hole drilled in 2015 on the structure of the north-eastern wing of S. Nurzhanov, the well f lowed naturally dry oil at a rate of 130 tonnes p/day (about 900 bopd) on a 7 millimetre choke.
Upon completion of exploration on the Triassic section, production tests will be carried out on Jurassic and Cretaceous reservoirs. Preliminary evaluations of these hydrocarbon bearing structures indicate estimates of 3.9 million tonnes of producible hydrocarbons. In 2016-2017 the Company is planning to drill two appraisal wells aimed at delineating and quantifying new reserves and to carry out additional production tests. The Company is planning to commence test production at the field in 2018.
This new deposit in the structure of the north-eastern wing of S. Nurzhanov is separated from the main producing S. Nurzhanov field by a set of faults, having an offset of 180 metres and more. The S. Nurzhanov field, one of the main fields of EMG has been in production since 1963 and delivers around 17% of EMG’s production and about 16% of level 2P reserves.
During tests of sub-ledge reservoirs of Permo-Triassic age at the Liman block, the exploratory well PR-3 showed an industrial level of dry crude at a f low rate of 3.3 cubic metres per day (20 bopd). The Company is planning to drill four exploration wells in 2016 and also to carry out a study to calculate reserves and a forecast production profile. The start of test production of sub-ledge deposits of the Liman block is planned for 2017-2018.
While testing the exploratory well in a new area, adjacent to the producing field of Akkuduk, a f low of dry crude at a f low rate of up to 18 cubic metres per day (110 bopd) was achieved. As a result a new oil bearing reservoir of mid Jurassic age was identified. The Company is planning to drill two appraisal wells in 2016-2017 and to bring a new area of the field into commercial production, after confirming the presence of additional reserves and approval of an updated development plan.
In 2016 a 3D seismic exploration survey is planned for a territory adjacent to Uzen-Karamandybas to verify the potential of pre-Jurassic reservoirs at a depth of between 2.5 and 8 kilometres, the existence and the potential of which had been forecast from the results of exploration studies conducted earlier.
34 KazMunaiGas Exploration Production JSC Annual Report 2015
Strategic overview
Strategic overview 35 KazMunaiGas Exploration Production JSC Annual Report 2015

Operating and financial review
The following document is intended to assist the understanding and assessment of trends and significant changes in the Company’s results and financial condition. This review is based on the audited consolidated financial statements of the Company and should be read in conjunction with those statements and the accompanying notes. All financial data and discussions thereof are based on the audited consolidated financial statements prepared in accordance with the International Financial Reporting Standards (“IFRS”). According to the Company’s accounting policy, interests in joint ventures and associates are accounted for using the equity method, and thus are not consolidated line by line (“equity-accounted entities”).
OverviewKazMunaiGas Exploration Production (“the Company” or “KMG EP”) is engaged in the exploration, development, production, processing, and export of hydrocarbons and the acquisition of oil and gas assets. The Company has publicly listed Global Depositary Receipts (“GDR”) and shares traded on the London Stock Exchange (“LSE”) and Kazakhstan Stock Exchange (“K ASE”). Its majority shareholder is National Company KazMunayGas JSC (“NC KMG”), the wholly state-owned joint stock company, which represents the State’s interests in the Kazakh oil and gas industry. The Company’s core oil and gas assets are located in the Pre-Caspian, Mangistau and Southern Turgai basins.
Business environmentMacroeconomic factors affecting the Company’s financial performance for the period under review include movements in crude oil prices, domestic inf lation and foreign exchange rates, specifically the tenge/US dollar exchange rate.
4Q 2015 3 3Q 2015 4Q 2014 Change 2015 2014 Change
43.76 50.47 76.58 -43% Average Brent (DTD) (US$ / bbl) 52.39 98.95 -47%10.7% 1.5% 1.5% 613% Kazakhstan inf lation (%) 13.6% 7.4% 84%
300.44 216.92 181.39 66% Average tenge/US$ exchange rate 222.25 179.12 24%339.47 270.40 182.35 86% tenge/US$ exchange rate at the
reporting date339.47 182.35 86%
The National Bank of Kazakhstan (“NBK”) made a decision to abandon its support of the tenge, reducing foreign exchange interventions and efforts to control the rate of the tenge, effective from February 11, 2014. To prevent the destabilisation of financial markets and the economy as a whole, NBK established a tenge/dollar f luctuation band at 185 tenge per US dollar, plus or minus 3 tenge, in February 2014. In September 2014, NBK expanded the tenge/dollar f luctuation band to 185 tenge per US dollar, plus 3 tenge or minus 15 tenge. In July 2015, NBK expanded further the tenge/dollar f luctuation band to 185 tenge per US dollar, plus 13 or minus 15 tenge. On August 20, 2015, the Government of the Republic of Kazakhstan and NBK made a decision to switch to a free-f loating exchange rate regime of the tenge.
Production activityCrude oil production for the period ktonnes
2015
2014
OMG EMG PKI (33% share) KGM (50% share) CCEL (50% share)
2,823
2,823
1,449
1,611
1,500
1,500
1,069
1,066
5,510
5,328
12,351
12,328
Average daily production kbopd
2015
2014
OMG EMG PKI (33% share) KGM (50% share) CCEL (50% share)
57
57
31
34
32
32
20
20
111
107
251
250
The Company’s total crude oil production in 2015, including the share of production from its joint ventures and associated company, amounted to 12,351 ktonnes or 251 kbopd. OMG and EMG produced 168 kbopd with a further 31 kbopd from PKI, 32 kbopd from KGM and 20 kbopd from CCEL.
Compared to 2014, OMG production increased by 3% or 182 ktonnes, primarily due to ahead of schedule drilling and a decrease in the idle well park.
The share in PKI production declined by 10% or 162 ktonnes in 2015, compared to 2014, due to the natural decline at some of PKI’s mature fields and a decrease in drilling activity. The share in CCEL production increased by less than 1% or 3 ktonnes in 2015, compared with 2014, mainly due to an increase in well park. Total share in production volume of PKI, KGM and CCEL in 2015 was 4,018 ktonnes, which is 4% or 159 ktonnes less than in 2014.
The following table represents the Company’s principal oil and gas interests as of December 31, 2015:
Name Ownership interest Principal operations Financial statement ref lection
Ozenmunaigas JSC (“OMG”) 100% Crude oil upstream Consolidated entityEmbamunaigas JSC (“EMG”) 100% Crude oil upstream Consolidated entityKMG EP Exploration Assets (“KMGEP EA”) 100% Oil and gas exploration Consolidated entityKazakh Gas Processing Plant (“KazGPZ”) 100% Natural gas upstream and refining Consolidated entityJV Kazgermunai LLP (“KGM”) 50% Crude oil upstream Equity-accounted entityPetroKazakhstan Inc. (“PKI”) 33% Crude oil upstream Equity-accounted entityCITIC Canada Energy Limited (“CCEL”) 50% Crude oil upstream Financial assetUral Oil and Gas LLP (“UOG”) 50% Oil and gas exploration Equity-accounted entityKS EP Investments BV (“KS”) 51% Oil and gas exploration Equity-accounted entity
Key performance indicators 4Q 2015 3Q 2015 4Q 2014 Change 2015 2014 Change
3,106 3,123 3,111 0% Total production (ktonnes)* 12,351 12,328 0%105,896 134,884 (194,958) -154% Net income (KZT million) 243,669 47,038 418%
1.55 1.98 (2.86) -154% Basic and diluted EPS (KZT thousand) 3.57 0.69 417%28,199 (28,478) 17,541 61% EBITDA (KZT million)** 8,801 281,917 -97%
18% -32% -9% -300% Operating margin (%)*** -3% 17% -118%(16,954) (25,718) (81,309) -79% Operating cash f low before working capital
adjustments (KZT million)(69,583) 147,942 -147%
7% 10% -13% -154% ROE (%) 18% 3% 500%
* Including proportionate share of equity-accounted entities.** EBITDA is calculated by adding back the share of income in equity-accounted entities, finance income and non-cash expenses such as depreciation and amortisation to the Company’s
operating profit.*** Operating profit does not include share in results of equity accounted entities, CIT expenses, finance charges, impairment charges and other non-operating charges.
36 KazMunaiGas Exploration Production JSC Annual Report 2015
Strategic overview
Strategic overview 37 KazMunaiGas Exploration Production JSC Annual Report 2015

Wells as of reporting date*
Drilled in 2015*
Drilled in 2014*
Well workovers 2015
Well workovers 2014
Well servicing 2015
Well servicing 2014
Number of wells Number of well workovers Number of well servicing
5,165 229 227 OMG 921 890 14,335 15,0342,691 54 70 EMG 248 284 3,541 3,7231,735 84 114 PKI (100%)** 195 400 831 1,012
237 33 28 KGM (100%)** 56 44 101 883,606 112 179 CCEL (100%)** 20 255 3,370 3,577
*Development wells, including injection wells.** Includes 100% of the number of well operations related to JV and associated company.
Oil production in the reporting period from the new wells at OMG amounted to 523 ktonnes compared to 374 ktonnes in 2014, as drilling operations were ahead of schedule. OMG workovers of 921 wells provided an incremental production of 433 ktonnes, while 890 well workovers in 2014 provided incremental production of 417 ktonnes.
Oil production for 2015 from the new wells at EMG amounted to 66 ktonnes compared to 73 ktonnes in 2014. EMG performed 248 well workovers in 2015, which provided an incremental production of 97 ktonnes, while 284 well workovers provided 87 ktonnes in 2014.
Capital expenditure overview Capital expenditure figures presented in this section represent actual additions to the property, plant and equipment (“PPE”) and intangible assets (“IA”) accounts during the reporting period. The amounts indicated in the consolidated cash f low statement of the Company as purchases of PPE and intangible asset, ref lect additions presented herein adjusted for the changes in related working capital accounts, such as advances prepaid and accounts payable for PPE and IA.
Capital expenditures of OMG, EMG, Head office and other KMG EP subsidiaries KZT million
98,416 OMG
Head o�ce & other subsidiaries
EMG
68,516
25,395
4,505
Capital expenditure of equity-accounted entities KZT million
26,152 PKI (33%)
KGM (50%)
CCEL (50%)
UOG (50%)
KS (51%)10,8037,585
2,1125,281
371
Capital expenditure of equity-accounted entitiesPKI capital expenditures in 2015 amounted to KZT32.7 billion (KMG EP 33% share: KZT10.8 billion), which is KZT10.5 billion less than in 2014, mainly due to the decrease in drilling volumes in the current period.
KGM capital expenditures for the period were KZT15.2 billion (KMG EP 50% share: KZT7.6 billion), which is KZT3.0 billion less than in 2014, mainly due to the higher construction and modernisation of production facilities and the purchase of fixed assets in 2014 primarily relating to the Aksai field development, which was partially offset by higher production drilling in the reporting period.
CCEL capital expenditures in 2015 were KZT10.6 billion (KMG EP 50% share: KZT5.3 billion), which is KZT7.4 billion less than in 2014, primarily due to the decrease in drilling volumes and construction and modernization of production facilities in the current period.
UOG capital expenditures amounted to KZT4.2 billion (KMG EP 50% share: KZT2.1 billion), which is 1.9 billion more than in 2014, mainly due to the payment of a commercial discovery bonus, as required by law.
KS capital expenditures amounted to KZT0.7 billion (KMG EP 51% share: KZT0.4 billion), which mainly relates to deepening of the SK-2 well.
Operating and financial review continued
Capital expenditures of OMG, EMG, Head office and other KMG EP subsidiariesIn 2015, the Company’s capital expenditures amounted to KZT98.4 billion or KZT29.8 billion less than in 2014. Capital expenditures include the cost of drilling new wells, the construction and modernisation of production facilities, the purchase of fixed and intangible assets and non-production capital expenditures.
OMG capital expenditures for 2015 amounted to KZT68.5 billion, which is KZT20.0 billion less than in 2014, mainly due to a decrease in production drilling as a result of a discount obtained from the contractor for drilling services, a lower level of construction and modernisation of production facilities compared to 2014, and lower fixed asset purchases in the reporting period.
EMG capital expenditures amounted to KZT25.4 billion in 2015, which is KZT8.3 billion less than in 2014, mainly due to a lower level of production and exploration drilling, and lower fixed asset purchases, as well as the construction and modernisation of production facilities in the reporting period compared to 2014.
Head office and other subsidiaries’ capital expenditures in 2015 amounted to KZT4.5 billion, which is KZT1.5 billion less than in 2014, primarily due to higher construction and modernisation of production facilities in 2014.
Below are current 2016 capital expenditure expectations for consolidated and equity accounted entities:
Current 2016 capital expenditure expectations for OMG, EMG and other subsidiaries KZT million
84,632 Production drilling
Exploration
Construction works
Other CAPEX33,684
27,630
5,052
18,266
Current 2016 capital expenditure expectations for equity-accounted entities KZT million (proportional share)
27,557 Production drilling
Exploration
Construction works
Other CAPEX
6,107
12,625
4,434
4,391
* Capital expenditure amounts for 2016 presented herein represent currently expected amounts based on management’s estimates as of date of the issuance of this report. Amounts do not represent any formal commitments and are subject to changes in any direction.
38 KazMunaiGas Exploration Production JSC Annual Report 2015
Strategic overview
Strategic overview 39 KazMunaiGas Exploration Production JSC Annual Report 2015

The following table shows the exploration activity of the Company and its equity accounted entities during the reporting period:
Block (interest) Prospect Well Status as of reporting date
Liman (100%) Novobogat SE Trial production of Novobogat Southeast is being conducted. Drilling of the appraisal well PR-3 completed. Testing is being conducted. Extension of the exploration contract #406 for the appraisal period of Novobogat Southeast until 19.02.2018 was received.
Temir (100%) The Company is in the process of returning the contract area to the State.Zharkamys Eastern
(100%)Tuskum The Company is in the process of returning the contract area to the State due
to low prospects and expiration of the subsoil use agreement.Uzen-Karamandybas
(100%)NW Tenge In the process of agreeing amendments to the work program of the Contract
on transfer of volume of exploration works from 2015 to 2016. Taisoigan (100%) Uaz U-21 Drilling and testing of the U-21 well completed.
Protocol on the transfer of a military training area on the Taisoigan block was signed between the Ministry of Defence of the RK and Ministry of Defence of Russia. In the process of agreeing extension of the exploration contract for 3 years.
R-9 (100%) The Company is in the process of returning the contract area to the State. Karaton Sarkamys
(100%)NSV-1 In the process of agreeing amendments to the work program of the Contract
on transfer of volume of exploration works from 2015 to 2016.
The well drilling was completed. Achieved project depth of 3,818m. The well is being tested.
Karpovskiy Severniy (KS – 51%)
Orlovskaya Central SK-2 Completed deepening the SK-2 well to the depth of 5,755m. In the process of agreeing the testing of productive shelves allocated based on the result of the research.
Fedorovskiy block (UOG – 50%)
Rozhkovskiy U-25 Drilling the U-25 well. Depth as of reporting date – 1,110m.
Addendum #7 dated February 24, 2015 to an exploration contract #468 was concluded – the exploration period was prolonged until May 11, 2016. It was decided to extend the exploration contract period for two years from 2016 through 2018. Production contract at the Rozhkovskiy field was concluded on April 2, 2015.
Pavlovskaya, Yanvartsevskaya Seismic field works on the Yanvartsevskaya and Pavlovskaya areas are completed.
Drilling of the U-31 well was postponed to 2016 due to the need to clarify siting based on the result of 3D seismic. As of reporting date, processing of 3D seismic data of Pavlovskaya and Yanvartsevskaya areas is being completed.
Doszhan-Zhamansu (24.75% through PKI)
South Doszhan, South-Eastern Doszhan, Zhamansu
6 wells were drilled at the Doszhan-Zhamansu block during the reporting period: 5 wells with inf low of hydrocarbons and 1 well with inf low of water.
Karaganda (PKI – 33%) Karabulak, Buharsai 1 well was drilled at Karaganda block, with inf low of hydrocarbons.Karavanchi (PKI – 33%) Karavanchi 2 wells were drilled, 1 well is being tested, 1 well with inf low of hydrocarbons.Western Tuzkol
(PKI – 33%)Western Tuzkol 10 appraisal wells were drilled (1 well on the Taskuduk structure). 8 wells with
inf low of hydrocarbons, 2 wells with inf low of water.
Exploration activity
01 Karpovsky North 02 Fedorovskiy 03 Liman
04 Taisoigan 05 R-9 06 Temir
07 Zharkamys Eastern-1 08 PKI explorations blocks Exploration projects
Wells with inf low
Dry wells
Wells in testing
Wells in drilling
09 Karaton-Sarkamys 10 Uzen-Karamandybas
The following map depicts the Company’s major exploration projects along with the cumulative number of exploration wells that have been drilled as of December 31, 2015.
730 sq. km 3D Seismics
1 well
1 well
After acquisition:
1,014 sq. km 3D Seismics
6 wells
1 well
Before acquisition:
1,396 l. km 2D Seismics
2 wells
2 wells
165 sq. km 3D Seismics1,650 l. km 2D Seismics
9 wells
1 well
1 well
984 sq. km 3D Seismics3,620 l. km 2D Seismics
12 wells
200 sq. km 3D Seismics975 l. km 2D Seismics
200 sq. km 3D Seismics610 l. km 2D Seismics
2 wells
1,552 sq. km 3D Seismics3,900 l. km 2D Seismics
78 wells
14 wells
9 wells
160 sq. km 3D Seismics
2 wells
1 well
1,500 l. km 2D Seismics
2 wells
0102
04
08
06
07
03
05
09
10
Aktobe region
Caspian sea
Aral sea Kyzylorda region
West-Kazakhstan region
Atyrau region
Mangistau region
386 sq. km 3D Seismics150 l. km 2D Seismics
4 wells
5 wells
Operating and financial review continued
40 KazMunaiGas Exploration Production JSC Annual Report 2015
Strategic overview
Strategic overview 41 KazMunaiGas Exploration Production JSC Annual Report 2015

Results of operationsThe following section is based on the Company’s audited consolidated financial statements. The amounts shown in US dollars are included solely for the convenience of the user at the average exchange rate over the respective period for the consolidated statement of comprehensive income and the consolidated cash f low statement and at the closing rate for the consolidated statement of financial position.
4Q 2015 3Q 2015 4Q 2014 Change 2015 2014 Change(KZT million, unless otherwise stated) (KZT million, unless otherwise stated)
180,475 108,232 155,496 16% Revenue 529,812 845,770 -37%(65,012) (50,865) (67,280) -3% Production expenses (225,049) (211,900) 6%(28,341) (36,815) (27,136) 4% SG&A (118,601) (102,568) 16%(49,917) (49,011) (58,402) -15% Taxes other than on income (181,501) (328,211) -45%
(229) (1,186) (1,329) -83% Exploration expenses (1,892) (2,127) -11%(4,952) (4,538) (15,219) -67% DD&A (20,110) (59,485) -66%
32,024 (34,183) (13,870) 331% Operating profit / (loss) (17,341) 141,479 -112%(46,753) – – -100% Allowance for VAT recoverable (46,753) – -100%(16,576) (5,393) 11,466 -245% Share of results of associate and JVs (20,062) 60,191 -133%
(189) 4 (2,153) -91% Gain / (loss) on disposal of fixed assets (260) (4,221) -94%(3,500) (253) (228,252) -98% Impairment of PP&E (4,358) (256,683) -98%9,540 (8,249) (1,535) -721% Finance income / (costs), net 11,095 11,810 -6%
187,206 243,029 1,273 100% Foreign exchange gain / (loss), net 448,869 108,997 312%(55,856) (60,071) 38,113 -247% Income tax (expense) / benefit (127,521) (14,535) 777%
105,896 134,884 (194,958) -154% Net income / (loss) 243,669 47,038 418%6,7 (11.1) (5.3) -226% Profit / (loss) from operations
(US$ per bbl sold*)(1.3) 13.7 -109%
22,3 44.0 (74.8) -130% Net income / (loss) (US$ per bbl sold*) 18.3 4.5 307%
* Converted at 7.23 barrels per tonne of crude oil
RevenueThe following table shows sales volumes and realised prices resulting from OMG and EMG operations:
4Q 2015 3Q 2015 4Q 2014 Change 2015 2014 Change
Export sales of crude oil UAS pipeline
66,583 41,323 76,491 -13% Net sales (KZT million) 213,635 449,931 -53%779 560 779 0% Volume (ktonnes) 2,797 3,580 -22%
85,472 73,791 98,191 -13% Average price (KZT/tonne) 76,380 125,679 -39%39.35 47.05 74.87 -47% Average price (US$/bbl*) 47.53 97.05 -51%
CPC pipeline 53,759 30,453 38,263 40% Net sales (KZT million) 150,849 257,009 -41%
565 378 390 45% Volume (ktonnes) 1,850 1,991 -7%95,149 80,563 98,110 -3% Average price (KZT/tonne) 81,540 129,085 -37%
43.80 51.37 74.81 -41% Average price (US$/bbl*) 50.74 99.68 -49%120,342 71,776 114,754 5% Total sales of crude oil exported
(KZT million)364,484 706,940 -48%
1,344 938 1,169 15% Total crude oil exported (ktonnes) 4,647 5,571 -17%Domestic sales of crude oil
and oil products55,390 16,820 20,008 177% Net domestic sales (KZT million) 100,576 94,656 6%
844 667 421 100% Volume (ktonnes) 2,742 1,967 39%65,628 25,217 47,525 38% Average price (KZT/tonne) 36,680 48,122 -24%
30.21 16.08 36.24 -17% Average price (US$/bbl*) 22.83 37.16 -39%Shipments of crude oil to Russia
– 14,793 14,645 -100% Net sales (KZT million) 46,102 17,376 165%– 350 397 -100% Volume (ktonnes) 916 447 105%– 42,266 36,889 -100% Average price (KZT/tonne) 50,313 38,871 29%– 26.95 28.13 -100% Average price (US$/bbl*) 31.31 30.02 4%
Total sales175,732 103,389 149,407 18% Total net sales of crude oil (KZT million) 511,162 818,972 -38%
2,188 1,955 1,987 10% Total volume (ktonnes) 8,305 7,985 4%80,316 52,884 75,192 7% Average price (KZT/tonne) 61,546 102,564 -40%
36.97 33.72 57.34 -36% Average price (US$/bbl*) 38.30 79.20 -52%4,743 4,843 6,089 -22% Other sales (KZT million) 18,650 26,798 -30%
180,475 108,232 155,496 16% Total revenue (KZT million) 529,812 845,770 -37%
* Converted at 7.23 barrels per tonne of crude oil.
Operating and financial review continued
The increase in net income for 2015 is mainly due to a higher foreign exchange gain recognition as a result of the decision of the Government of the Republic of Kazakhstan and NBK to switch to the freely f loating tenge exchange rate regime in 3Q 2015, which was partially offset by a drop in the average Brent price from US$98.95 per barrel in 2014 to US$52.39 per barrel in 2015. Moreover, in 2015 production expenses and selling, general and administrative expenses increased compared to 2014, mainly due to the increase in employee benefit expenses and accrual of KZT16.1 billion fines and penalties related to CIT and EPT provision based on results of 2009-2012 tax audit, KZT3.3 billion of penalties related to CIT and EPT provisions on a possible future tax audit assessments for 2012-2015, KZT2.1 billion of penalties related to additional declaration of MET submitted for 3Q and 4Q 2012, as well as KZT2.1 billion of penalties related to lower accrual of advance payment, which were offset by the decrease in taxes other than on income and depreciation,
depletion and amortisation. Additionally, in 2015 the Company recognised allowance for VAT recoverable in the amount of KZT46.8 billion related to the Company’s sale of production assets to OMG and EMG as part of establishing new subsidiaries in 2012. In accordance with the tax legislation of the Republic of Kazakhstan, sale of production assets were subject to value-added-tax (“VAT”). VAT paid to the tax authorities after the reorganisation of the Company was recorded as VAT recoverable by OMG and EMG. The Company recognised an allowance for the entire VAT recoverable due to the fact that the authorities have not confirmed it as currently due and management taking the view that it is not probable to receive these amounts back from the Government. In 2014 the Company recognised a KZT255 billion impairment of PPE in regards to OMG assets and there was no such charge in 2015. Share of results of associate and JVs also decreased mainly due to a 47% drop in average Brent price from US$98.95 per barrel in 2014 to US$52.39 per barrel in 2015.
OMG and EMG export crude oil using two principal routes: via the pipeline owned by Caspian Pipeline Consortium (“CPC”) and via the Uzen-Atyrau-Samara pipeline (“UAS”) owned by KazTransOil JSC (in Kazakhstan). OMG and EMG also deliver their crude oil to the domestic market, and OMG made counter-oil supplies to the Russian Federation in 2015 and 2014 as part of the intergovernmental agreement.
The relative profitability of the two export routes depends on the quality of crude oil in the pipeline, the prevailing international market prices and the relevant pipeline tariffs. It should be noted that the volume of crude oil that can be shipped through the pipelines has to be agreed with the Ministry of Energy of the Republic of Kazakhstan (“ME”). Thus, crude oil volume allocations between different routes change from period to period primarily due to greater or lower ME quotas for a certain route.
In 2015, the Company shipped 916 thousand tonnes of crude oil to the Russian Federation to fulfil its obligations under the counter-oil supply agreement between the Government of Kazakhstan and the Russian Government. Thus, UAS and CPC shipments decreased in the reporting period due to the shipment of crude oil to Russia. As of the reporting date, the Company fulfilled its obligation under the counter-oil supply agreement between the Government of Kazakhstan and the Russian Government.
42 KazMunaiGas Exploration Production JSC Annual Report 2015
Strategic overview
Strategic overview 43 KazMunaiGas Exploration Production JSC Annual Report 2015

The following chart shows the OMG and EMG realised prices adjusted for crude oil transportation, rent tax, export customs duty (“ECD”), mineral extraction tax (“MET”) and other expenses based on the shipment route (netback analysis). The netback calculation methodology was changed in 2015 to include MET subtraction from the netback. As a result, the comparative information for 2014 was also restated.
Netback analysis US$/bbl*
MET
Average Brent price in 2015
Rent tax Export customs duty Transportation Price di�erential
5.7 15.6
20.3
1.7
1.7 1.0
52.4
Pavlodar re�nery
Atyrau re�nery
CPC
UAS
Counter shipments to Russia
CPC
UAS
Counter shipments to Russia
Atyrau re�nery
2015
2014
8.8 7.7 2.8 3.7 18.5 4.45.45.5
10.3 7.8 7.3 40.4 9.021.911.0
20.4 10.3 8.7 47.011.0
8.8 6.4 3.7 22.75.35.5
23.44.53.4
19.15.65.3
33.01.82.4
Quality bank Netback Premium of bbl di�erence
Average Brent price in 2014
0.3
1.6
99.0
* Converted at actual barrels per tonne of crude oil
Production expensesThe following table shows a breakdown of the Company’s production expenses, resulting mainly from OMG and EMG operations:
4Q 2015 3Q 2015 4Q 2014 Change 2015 2014 Change(KZT million, unless otherwise stated) (KZT million, unless otherwise stated)
40,017 38,260 37,111 8% Employee benefits 153,928 130,367 18%6,200 5,483 10,070 -38% Repairs and maintenance 20,206 26,781 -25%4,647 4,576 4,425 5% Energy 18,389 16,706 10%4,601 4,025 6,087 -24% Materials and supplies 18,357 20,050 -8%1,455 1,435 1,553 -6% Transportation service 5,345 5,875 -9%3,159 (5,011) 1,888 67% Change in crude oil balance 3,356 1,373 144%
554 165 492 13% Processing expenses 1,109 1,205 -8%(346) 186 3,206 -111% Change in estimate of environmental
remediation obligation127 1,110 -89%
2,313 (86) – 100% Decrease in asset retirement obligation in excess of capitalised asset
(1,686) – -100%
2,412 1,832 2,448 -1% Other 5,918 8,433 -30%65,012 50,865 67,280 -3% Total production expenses 225,049 211,900 6%
13.7 16.6 25.8 -47% Total production expenses (US$ per bbl sold*)
16.9 20.5 -18%
* Converted at 7.23 barrels per tonne of crude oil.
Operating and financial review continued
Export netbacks for 2015 decreased in the period compared to 2014, primarily due to a drop in the average Brent price from US$98.95 per barrel in 2014 to US$52.39 per barrel in 2015. Additionally, expenses related to export of crude oil via the CPC route increased in 2H 2015 due to the decision of the Government of the Republic of Kazakhstan and NBK to switch to the freely f loating tehge exchenge rate regime in 3Q 2015, which negatively affected CPC netback.
Domestic market netbacks decreased in 2015 due to the drop in average sales prices in Tenge terms and increase of the average tenge/US dollar exchange rate.
During 2015, per instructions from NC KMG, for crude oil supplied to Atyrau Oil Refinery Plant (“ANPZ”) and Pavlodar Oil Refinery Plant (“PNHZ”), the Company was paid by KazMunaiGas Refining and Marketing JSC an average price of approximately KZT21 thousand and KZT32 thousand per tonne, respectively. These prices were disputed by the Company and its INEDs and were not formally agreed.
In 4Q 2015 an agreement was reached whereby for all volumes shipped to ANPZ and PNHZ in 2015 the Company was to receive KZT37 thousand per tonne. The Company’s financial statements have been adjusted in the fourth quarter to ref lect the agreed price.
The sale price of counter crude oil shipments to Russia is based on the intergovernmental agreement between the Government of Kazakhstan and the Russian Government. A significant increase in counter crude oil shipments to Russia netbacks resulted due to a Russian Federation tax system manoeuver starting from January 1, 2015, when the Russian export tax burden was reallocated from ECD to MET. Due to the price formula specifics of counter oil supplies to Russia, this tax manoeuver positively affected its netbacks.
Production expenses in 2015 increased by KZT13.1 billion or 6% compared to 2014, primarily due to increased employee benefits. This was partially offset by a decrease in repair and maintenance and a decrease in asset retirement obligations in excess of capitalised asset.
Employee benefit expenses in 2015 increased by 18% compared to 2014, mainly due to a 7% indexation increase in basic salaries for production personnel from January 1, 2015 according to the terms of the collective agreement; introduction of a Unified System of Wages and additional 10% increase of wages starting from April 2014, and an increase in production bonuses from 25% to 33% for supporting production personnel starting from September 2014. Additionally, employee benefit expenses increased in 2015 compared to 2014 due to the rise in employee benefit liabilities in the amount of KZT6.9 billion, which resulted from prolongation of OMG and EMG oilfield licences.
Increase in energy expenses by 10% compared to 2014 is primarily related to the increase in tariffs of energy suppliers in the reporting period.
In 2014, the Company changed its estimate for the environmental remediation provision, which relates to certain soil contamination and oil waste disposal, in accordance with a memorandum of cooperation (“MOC”) signed by the Parent Company (comprising the Company and JSC OMG) with the Ministry of the Environment and Water Resources and Ministry of Oil and Gas in June 2014, and recognized a reversal of the related provision for the amount of KZT2.1 billion. In 4Q 2014, the Company reconsidered this ecology provision and accrued an additional provision in the amount of KZT3.2 billion. In 2015, the Company once again reconsidered the ecology provision and accrued additional provision in the amount of KZT0.1 billion.
A decrease in asset retirement obligation resulted mainly due to the extension of EMG subsoil agreements.
44 KazMunaiGas Exploration Production JSC Annual Report 2015
Strategic overview
Strategic overview 45 KazMunaiGas Exploration Production JSC Annual Report 2015

Lifting costsStarting from 4Q 2014 the Company changed its lifting costs calculation methodology. Lifting cost per barrel is calculated as production costs of OMG and EMG subsidiaries, including materials and supplies, production payroll, repairs and maintenance, and other production expenses except for the DD&A, taxes, contractual social obligations, actuarial costs, obligatory professional pension deductions and other expenses not directly related to the production process, divided by total crude oil produced.
As most of the OMG and EMG production expenses are denominated in Tenge, lifting costs in US$ per bbl decreased mainly due to the increase of the average tenge/US dollar exchange rate that resulted from the decision of the Government of the Republic of Kazakhstan and NBK to switch to the freely f loating tenge exchange rate regime in 3Q 2015.
The following chart depicts production lifting costs of OMG and EMG in US$/bbl*:
Lifting costs of OMG US$/bbl*
2015
2014
Employee bene�ts Repairs and maintenance Materials and supplies Energy Other
3.7
4.9
1.2
1.7
1.4
1.8
0.5
0.8
7.6
8.7
14.4
17.9
Lifting costs of OMG KZT per tonne
2015
2014
Employee bene�ts Repairs and maintenance Materials and supplies Energy Other
5,985
6,420
1,947
2,308
2,333
2,215
770
1,035
12,489
11,534
23,524
23,512
Lifting costs of EMG US$/bbl*
2015
2014
Employee bene�ts Repairs and maintenance Materials and supplies Energy Other
1.5
1.7
0.7
0.9
0.6
0.7
0.8
1.0
7.7
8.5
11.3
12.8
Lifting costs of EMG KZT per tonne
2015
2014
Employee bene�ts Repairs and maintenance Materials and supplies Energy Other
2,451
2,241
1,064
1,210
955
946
1,238
1,312
12,577
11,258
18,285
16,967
OMG and EMG lifting costs US$/bbl*
2015
2014
Employee bene�ts Repairs and maintenance Materials and supplies Energy Other
2.9
3.8
1.0
1.4
1.1
1.3
0.6
0.9
7.7
8.7
13.3
16.1
OMG and EMG lifting costs KZT per tonne
2015
2014
Employee bene�ts Repairs and maintenance Materials and supplies Energy Other
4,788
4,973
1,577
1,831
1,866
1,775
929
1,131
12,519
11,438
21,679
21,148
* Converted at 7.36 barrels per tonne of crude oil
Selling, general and administrative expensesThe following table presents a breakdown of the Company’s selling, general and administrative expenses resulting mainly from OMG, EMG and KMG EP Head office operations:
4Q 2015 3Q 2015 4Q 2014 Change 2015 2014 Change(KZT million, unless otherwise stated) (KZT million, unless otherwise stated)
21,036 13,814 16,163 30% Transportation expenses 66,637 68,687 -3%2,392 14,762 962 149% Fines and penalties 24,737 3,592 589%5,623 5,011 4,865 16% Employee benefits 19,364 16,758 16%
759 242 855 -11% Consulting and audit services 1,889 2,188 -14%423 228 392 8% Repairs and maintenance 1,026 1,023 0%281 257 497 -43% Sponsorship 726 933 -22%
(3,338) 1,112 1,113 -400% Management fees and commissions – 4,451 -100%1,165 1,389 2,289 -49% Other 4,222 4,936 -14%
28,341 36,815 27,136 4% Total SG&A expenses 118,601 102,568 16%
6.0 12.0 10.4 -42%Total SG&A expenses (US$ per bbl
sold*) 8.9 9.9 -10%
*Converted at 7.23 barrels per tonne of crude oil.
Selling, general and administrative expenses in 2015 amounted to KZT118.6 billion which is 16% higher than in 2014. The increase is mainly due to the rise in fines and penalties, which were partially offset by the decrease in management fees and commissions.
In 2015, the Company accrued KZT16.1 billion of penalties related to CIT and EPT provisions based on the results of the 2009-2012 tax audit, KZT3.3 billion of penalties related to CIT and EPT provisions on possible future tax audit assessments for 2012-2015, KZT2.1 billion of penalties related to the additional declaration of MET submitted for 3Q and 4Q 2012 and KZT2.1 billion of penalties related to lower accrual of advance payment.
Management fees and commissions in 2015 decreased compared to 2014 as the Company did not sign a management agreement with NC KMG for 2015.
Operating and financial review continued
46 KazMunaiGas Exploration Production JSC Annual Report 2015
Strategic overview
Strategic overview 47 KazMunaiGas Exploration Production JSC Annual Report 2015

Taxes other than on incomeThe following table presents a breakdown of the Company’s taxes other than on income as represented mainly by OMG and EMG operations:
4Q 2015 3Q 2015 4Q 2014 Change 2015 2014 Change(KZT million, unless otherwise stated) (KZT million, unless otherwise stated)
16,114 25,414 16,858 -4% MET 67,160 89,840 -25%22,648 11,563 16,993 33% Export customs duty 65,588 74,227 -12%
8,453 9,423 19,960 -58% Rent tax 39,838 151,861 -74%1,734 1,725 1,739 0% Property tax 6,265 6,204 1%
968 886 2,852 -66% Other taxes 2,650 6,079 -56%49,917 49,011 58,402 -15% Total taxes other than on income 181,501 328,211 -45%
10.5 16.0 22.4 -53% Total taxes other than on income (US$ per bbl sold*)
13.6 31.7 -57%
* Converted at 7.23 barrels per tonne of crude oil.
Taxes other than on income in 2015 decreased by KZT146.7 billion or 45% compared to 2014, mainly due to the decrease in rent tax, mineral extraction tax and ECD.
Rent tax decreased due to the average Brent price drop, which also resulted in the reduction of the average tax rate from 21% in 2014 to 11% in 2015, as well as a decrease in export volumes. This impact was partially offset by an increase in the average tenge/US dollar exchange rate.
The decrease of MET in 2015 compared to 2014 resulted from a drop in the average Brent price from US$98.95 per barrel in 2014 to US$52.39 per barrel in 2015 and the decrease of export volumes, which was partially offset by an increase in the average tenge/US dollar exchange rate, and additional charges recognised in 3Q 2015 in the amount of KZT12.8 billion for adjustments of the MET rate in 2012 as per the tax audit act for the 2009-2012 period.
ECD expenses decreased in 2015 compared to 2014 mainly due to the ECD rate drop (the ECD rate was dropped back from US$80 per tonne to US$60 per tonne effective from March 19, 2015) and the decrease of export volumes, which was partially offset by an increase in the average tenge/US dollar exchange rate.
Income tax expense4Q 2015 3Q 2015 4 4Q 2014 Change 2015 2014 Change
(KZT million, unless otherwise stated) (KZT million, unless otherwise stated)
161,752 194,955 (233,071) -169% Profit / (loss) before tax 371,190 61,573 503%181,828 200,601 (16,285) -100% Profit / (loss) before tax (with adjustments**) 395,610 258,065 53%
55,856 60,071 (38,113) -247% Income tax 127,521 14,535 777%55,856 60,071 9,158 510% Income tax (with adjustments**) 127,521 66,917 91%
11.8 19.6 (14.6) -181% Income tax, US$ per bbl* sold 9.6 1.4 586%35% 31% 16% 119% Effective tax rate 34% 24% 42%31% 30% -56% -155% Effective tax rate (with adjustments**) 32% 26% 23%
* Converted at 7.23 barrels per tonne of crude oil.** Profit before tax and income tax expense without share in results of JVs and associated company, impairment charges and related deferred tax benefit.
The main reason for the higher 2015 income tax compared to 2014 is the higher taxable profit from the increase in the average tenge/US dollar exchange rate as the result of the decision of the Government of the Republic of Kazakhstan and NBK to switch to the freely f loating tenge exchange rate regime in 3Q 2015.
The higher effective tax rate in 2015 compared to 2014 is due to accrual of CIT and EPT provisions in the amount of KZT10.0 billion related to the results of the 2009-2012 tax audit. In addition, the Company with its tax advisors has undertaken a review of its tax accounts covering the 2012-2015 period and has made an additional provision of CIT and EPT in the amount of KZT21.6 billion.
Overview of JV’s and associate’s operationsBelow is the Company’s share in income of associate and joint ventures as ref lected in the Company’s audited consolidated financial statements:
4Q 2015 3Q 2015 4Q 2014 Change 2015 2014 Change(KZT million, unless otherwise stated) (KZT million, unless otherwise stated)
(5,296) (108) 11,133 -148% Share in income / (loss) from KGM 2,626 41,672 -94%(6,395) (6,142) 604 -100% Share in income / (loss) from PKI (17,772) 21,735 -182%(4,885) 857 (261) 100% Share in income / (loss) from UOG (4,916) (722) 581%
– – (10) -100% Share in loss from KS – (2,494) -100%(16,576) (5,393) 11,466 -245% Share in income / (loss) in associate
and JVs(20,062) 60,191 -133%
KGM KGM’s core operating activity is the production and sales of hydrocarbons in the Akshabulak, Nuraly and Aksai oilfields in the South Turgai basin, Kyzylorda region. The Company acquired a 50% stake in JV Kazgermunai LLP in April 2007.
KGM’s oil production in 2015 was 3,000 ktonnes (50% share is 1,500 ktonnes), in line with 2014.
KGM key financial and operational indicators (100%) are shown below:
4Q 2015 3Q 2015 4Q 2014 Change 2015 2014 Change(US$ thousand, unless otherwise stated) (US$ thousand, unless otherwise stated)
112,082 140,695 274,215 -59% Revenue 628,154 1,399,617 -55%(80,605) (80,370) (114,903) -30% Operating expenses (398,697) (635,662) -37%
(237) 1 (51) 365% Finance income / (cost), net (790) 2,174 -136%35,329 (8,939) (7,354) -580% Foreign exchange gain / (loss), net 25,907 29,084 -11%
(114,608) (45,984) (18,571) 517% Income tax expense (218,532) (289,423) -24% (48,039) 5,403 133,336 -136% Net income 36,042 505,790 -93%
745 752 783 -5% Crude oil production, ktonnes 3,000 3,000 0%
The decrease in 2015 revenue mainly resulted from lower export volumes, as well as a decrease in the average export and domestic prices in comparison with 2014. Moreover, in 2015 KGM accrued US$10.9 million of penalties for EPT and CIT based on the tax audit of 2009-2012, which resulted in lower net income in 2015 compared to 2014.
KGM’s crude oil sales split by routes is as follows:
4Q 2015 3Q 2015 4Q 2014 Change 2015 2014 Change(ktonnes) (ktonnes)
552 595 596 -7% Domestic market 2,102 1,943 8%194 151 184 5% Export via KCP 880 942 -7%
– – – 0% Export via Aktau – 132 -100%746 746 780 -4% Total crude oil sales, ktonnes 2,982 3,017 -1%
A decrease in the export sales volumes and average export price has also resulted in a decrease in operating expenses, particularly rent tax (by US$139.1 million), MET (by US$49.1 million) and transportation expenses (by US$43.0 million).
ECD expenses decreased by US$19.1 million due to the decrease in export sales volume in 2015 compared to 2014 and the ECD rate drop from US$80 per tonne to US$60 per tonne effective from March 19, 2015.
Operating and financial review continued
48 KazMunaiGas Exploration Production JSC Annual Report 2015
Strategic overview
Strategic overview 49 KazMunaiGas Exploration Production JSC Annual Report 2015

Operating expenses on per barrel sold basis are as follows:
4Q 2015 3Q 2015 4Q 2014 Change 2015 2014 Change(US$ per bbl sold*) (US$ per bbl sold*)
3.0 4.0 3.6 -17% DD&A 3.7 3.3 12%3.1 2.6 3.4 -9% Transportation expenses 3.3 5.1 -35%2.2 1.6 2.3 -4% Export customs duty 2.6 3.4 -24%1.1 1.3 2.2 -50% Mineral extraction tax 1.8 3.9 -54%0.6 0.2 2.2 -73% Rent tax 1.5 7.4 -80%1.1 1.2 1.7 -35% Repairs and maintenance 1.2 1.1 9%1.0 1.0 1.5 -33% Employee benefits 1.1 1.3 -15%0.7 0.6 0.8 -13% Materials and supplies 0.6 0.6 0%
(0.4) – – -100% Fines and penalties 0.4 – 100%1.7 1.6 1.4 21% Other 1.2 1.2 0%
14.1 14.1 19.1 -26% Total operating expenses 17.4 27.3 -36%
* Converted at 7.7 barrels per tonne of crude oil.
The share in KGM income, ref lected in the audited consolidated financial statements of the Company, represents a proportionate share of the results of KGM for 2015, adjusted for the impact of amortisation of the fair value of the licences, partially offset by a related deferred tax benefit of KZT1.4 billion (KZT3.6 billion in 2014).
For the capital expenditure analysis of JVs and associate please refer to the “Capital Expenditure Overview” section.
PKIFor the purposes of this report joint operations of PKI have been proportionally consolidated.
PKI is an oil and gas group involved in field exploration and development, oil and gas production and the sale of crude oil. The Company acquired a 33% stake in PKI in December 2009.
During 2015 PKI produced 4,390 ktonnes (33% share: 1,449 ktonnes) which is 10% less than in 2014. The decline in production was due to the reserve depletion of some of PKI’s mature fields. PKI’s key financial and operational indicators (100%) are shown below:
4Q 2015 3Q 2015 4Q 2014 Change 2015 2014 Change(US$ thousand, unless otherwise stated) (US$ thousand, unless otherwise stated)
170,411 236,364 490,941 -65% Revenue 984,943 2,468,829 -60%(224,710) (235,718) (326,057) -31% Operating expenses (1,012,943) (1,472,762) -31%
(10,835) (8,496) (5,045) 115% Finance cost, net (41,796) (25,420) 64%(27,725) (57,718) (72,886) -62% Income tax expense (124,683) (454,061) -73%(92,859) (65,568) 86,953 -207% Net income / (loss) (194,479) 516,586 -138%
1,069 1,103 1,219 -12% Crude oil production, ktonnes 4,390 4,883 -10%
The decrease in revenue in 2015, in comparison with 2014, occurred mainly due to lower export volumes and a decrease in average Brent prices and domestic prices.
PKI’s crude oil sales split by routes is as follows:
4Q 2015 3Q 2015 4Q 2014 Change 2015 2014 Change(ktonnes) (ktonnes)
727 774 813 -11% Domestic sales 2,804 2,867 -2%166 160 244 -32% Export via KCP (PKKR 100%) 762 1,089 -30%
97 75 92 5% Export via KCP (KGM 50%) 440 471 -7%43 45 38 13% Export via KCP (TP 50%) 181 171 6%31 31 38 -18% Export via KCP (Kolzhan 100% & PKVI 75%) 105 152 -31%
– – – 0% Export Aktau (KGM 50%) – 66 -100%– – 11 -100% Export Uzbekistan (TP 50%) – 47 -100%
1,064 1,085 1,236 -14% Total crude oil sales, ktonnes 4,292 4,863 -12%
Operating expenses decreased mainly due to lower export sales and average export price that resulted in lower rent tax (by US$263.2 million), MET (by US$89.5 million) and transportation expenses (by US$60.8 million).
In 2015 PKI accrued US$2.1 million of PetroKazakhstan Kumkol Resources JSC’s (100% subsidiary) penalties related to CIT and EPT of 2013 and a US$4.2 million ecological fine. PKI also recognised a 50% share in KGM’s penalties accrued in the amount of US$5.5 million for EPT and the CIT based on the tax audit of 2009-2012. Moreover, PKI accrued US$13.9 million of penalties based on the tax audit results of Kolzhan LLP for 2011-2012 and US$9.8 million of fines and penalties related to the tax audit results of Turgai-Petroleum JSC for 2009-2012.
Operating expenses on per barrel sold basis are as follows:
4Q 2015 3Q 2015 4Q 2014 Change 2015 2014 Change(US$ per bbl sold*) (US$ per bbl sold*)
5.2 9.2 9.7 -46% DD&A 8.4 9.0 -7%3.0 3.6 4.6 -35% Transportation expenses 3.8 5.0 -24%2.3 2.1 3.4 -32% Export customs duty 2.9 3.7 -22%1.1 2.0 3.6 -69% Repairs and maintenance 2.1 3.1 -32%1.4 1.7 2.1 -33% Employee benefits 1.9 2.2 -14%1.2 1.4 2.7 -56% Mineral extraction tax 1.8 4.0 -55%0.9 1.2 4.7 -81% Rent tax 1.7 8.5 -80%1.1 1.0 1.7 -35% Materials and supplies 1.1 1.4 -21%2.7 (0.3) (3.7) 100% Fines and penalties 1.1 (0.7) -257%8.4 6.3 5.2 62% Other 5.8 2.9 100%
27.3 28.2 34.0 -20% Total operating expenses 30.6 39.1 -22%
* Converted at 7.75 barrels per tonne of crude oil.
The share in PKI results ref lected in the Company’s audited condensed consolidated financial statements represents a proportionate share of the results of PKI in 2015 adjusted for the impact of amortisation of the fair value of the licences for the amount of KZT7.3 billion (KZT5.7 billion in 2014).
For the capital expenditure analysis of JVs and associate please refer to the “Capital Expenditure Overview” section.
CCELAs per the purchase agreement arrangements, interest in CCEL is ref lected as a financial asset in the audited consolidated financial statements of the Company in accordance with IFRS. CCEL results included herein are presented for information purposes only and are not consolidated or equity accounted in the audited consolidated financial statements of the Company.
In December 2007, the Company acquired a 50% stake in CCEL Karazhanbasmunai JSC(“CCEL”). CCEL explores heavy oil in the Karazhanbas field, which is situated on the Buzachi peninsula, 230 km from Aktau. The field was discovered in 1974 and is the largest shallow field of high-viscosity oil in the CIS; its exploitation is carried out by applying thermal methods.
As of December 31, 2015 the Company had KZT30.3 billion (US$89.3 million) as a receivable from CCEL. The Company has accrued KZT3.4 billion (US$15.2 million) of interest income in 2015, relating to the US$26.87 million annual priority return from CCEL. In 2015, the Company received US$26.4 million as a priority return from CCEL.
In 2015, CCEL produced around 2,138 ktonnes (50% share: 1,069 ktonnes) of crude oil, which increased by less than 1% compared to 2014. CCEL’s key financial and operational indicators (100%) are as follows:
4Q 2015 3Q 2015 4Q 2014 Change 2015 2014 Change(US$ thousand, unless otherwise stated) (US$ thousand, unless otherwise stated)
99,734 139,950 226,302 -56% Revenue 569,399 1,172,474 -51%(163,330) (239,435) (195,795) -17% Operating expenses (763,435) (903,682) -16%
(8,220) (6,279) (6,637) 24% Finance cost, net (28,503) (26,550) 7%(21,264) (770) (8,803) 142% Income tax expense (7,707) (69,054) -89%(93,080) (106,534) 15,067 -718% Net income / (loss) (230,246) 173,188 -233%
534 543 539 -1% Crude oil production, ktonnes 2,138 2,132 0%
Operating and financial review continued
50 KazMunaiGas Exploration Production JSC Annual Report 2015
Strategic overview
Strategic overview 51 KazMunaiGas Exploration Production JSC Annual Report 2015

The decrease in revenue in 2015 is mainly a result of a decrease in average export and domestic sales prices. CCEL crude oil sales split by routes is as follows:
4Q 2015 3Q 2015 4Q 2014 Change 2015 2014 Change(ktonnes) (ktonnes)
210 272 221 -5% Export via Novorossiysk 885 872 1%217 164 165 32% Export via Ust’-Luga 666 438 52%
– – – 0% Export via Primorsk – 186 -100%63 97 127 -50% Domestic market 382 485 -21%
– – 45 -100% Shipments of crude oil to Russia 139 124 12%490 533 558 -12% Total crude oil sales, ktonnes 2,072 2,105 -2%
Total operating expenses in 2015 decreased by 16% compared to 2014 mainly due to the decrease in rent tax, ECD, repairs and maintenance and DD&A which was partially offset by an increase in foreign exchange loss resulting from the decision of the Government of the Republic of Kazakhstan and NBK to switch to the freely f loating tenge exchange rate regime in 3Q 2015.
Rent tax decreased in 2015 compared to 2014 mainly as a result of the decrease in average Brent price, which was partially offset by an increase of export sales. ECD expenses decreased due to the ECD rate drop from US$80 per tonne to US$60 per tonne effective from March 19, 2015, which was partially offset by an increase of export sales in 2015 compared to 2014.
Repairs and maintenance decreased in 2015, mainly due to the decrease in volume of well workovers and servicing in the reporting period compared to 2014.
Operating expenses on per barrel sold basis are as follows:
4Q 2015 3Q 2015 4Q 2014 Change 2015 2014 Change
(US$ per bbl sold*) (US$ per bbl sold*)
10.1 13.3 13.3 -24% Employee benefits 11.1 11.3 -2%8.7 7.1 8.9 -2% Export customs duty 7.4 8.1 -9%7.5 7.2 7.1 6% Transportation expenses 7.1 7.1 0%
(2.3) 6.1 0.7 -429% DD&A 4.9 8.7 -44%2.5 5.1 9.2 -73% Rent tax 4.3 15.2 -72%2.8 3.5 4.5 -38% Energy 3.9 4.6 -15%2.9 3.1 4.7 -38% Repairs and maintenance 3.8 4.7 -19%0.6 1.0 0.9 -33% Materials and supplies 0.9 0.9 0%0.2 0.3 0.4 -50% Mineral extraction tax 0.3 0.5 -40%
16.9 20.6 2.8 504% Other 11.4 3.1 268%49.9 67.3 52.5 -5% Total operating expenses 55.1 64.2 -14%
* Converted at 6.68 barrels per tonne of crude oil.
For the capital expenditure analysis of JVs and associate please refer to the “Capital Expenditure Overview” section.
Lifting cost and netback analysis of JVs and associated companyLifting costs of producing JVs and associate is represented as follows:
KGM PKI CCEL (US$ thousand, unless otherwise stated)
Employee benefits 17,925 40,735 137,454Materials 13,898 34,980 12,826Repair and maintenance 14,688 39,849 52,465Energy 12,339 27,161 54,612Other 5,008 33,576 15,221Total lifting expenses (US$ thousand) 63,858 176,301 272,578Production (ktonnes) 3,000 4,390 2,138Lifting cost US$ per bbl* 2.8 5.2 19.1
*The following average tonne / bbl conversion factors were used KGM 7.7, PKI 7.75, CCEL 6.68.
Netback of export sales at major producing JVs and associate is represented as follows:
KGM PKI CCEL (US$ per bbl sold*, unless otherwise stated)
Benchmark end-market quote (Brent) 52.4 52.4 52.4Price differential and premium of bbl difference, net (7.1) (7.5) (5.0)Average realised price 45.3 44.9 47.4Rent tax (5.0) (4.8) (5.3)Export customs duty (8.8) (8.3) (9.1)Transportation expenses (5.4) (6.5) (8.1)MET (5.2) (3.8) (0.2)Netback price 20.9 21.5 24.7
*The following average tonne / bbl conversion factors were used KGM 7.7, PKI 7.75, CCEL 6.68.
Netback of domestic sales at major producing JVs and associate is represented as follows:
KGM PKI CCEL (US$ per bbl sold*, unless otherwise stated)
Realised price 19.2 21.2 16.0Transportation expenses (2.2) (2.0) (0.9)MET (0.4) (0.7) (0.2)Netback price 16.6 18.5 14.9
*The following average tonne / bbl conversion factors were used KGM 7.7, PKI 7.75, CCEL 6.68.
CCEL netback of counter crude oil shipments to the Russian Federation is represented as follows:
CCEL (US$ per bbl sold*,
unless otherwise stated)
Realised price 44.0Transportation expenses (6.2)MET (0.3)Netback price 37.5
* A tonne / bbl conversion factor for shipments to Russia of 7.23 is used.
Operating and financial review continued
52 KazMunaiGas Exploration Production JSC Annual Report 2015
Strategic overview
Strategic overview 53 KazMunaiGas Exploration Production JSC Annual Report 2015

Corporate social responsibilitySocial expenditures million KZT
2015
2014
Contractual obligations Sponsorship Impairment of social assets
24,619
23,600
2,607
3,509
4,358
933
726
942
32,310
28,984
Corporate Social Responsibility (CSR) is a key and integral part of the Company’s activities. Since inception, the Company has allocated billions of Tenge for the construction of residential housing, health and sports centres, kindergartens, health camps, and contributed to the reconstruction of schools and hospitals in the Atyrau and Mangistau regions, as well as sponsoring the relocation of towns from some of the depleted EMG oil fields. The CSR strategy of the Company aims to develop the regions in which it operates.
In 2012, two service units – UBR and UTTiOS were created to employ approximately 2,000 people in the Mangistau region. In 2015, the Company incurred KZT23.7 billion of operating expenses at UBR and UTTiOS, including KZT19.3 billion of employee benefit expenses and KZT4.4 billion for materials, supplies and other expenses.
The Company has invested approximately KZT0.9 billion for the enlargement construction of worker accommodation, and production facilities as well as the purchase of equipment, to support the operations at UBR and UTTiOS. Expenses for the financing of UTTiOS were partially offset by the income from third parties in 2015, which totalled KZT5.3 billion (KZT6.3 billion in 2014).
In 2015 the Company spent KZT0.7 billion on sponsorship and supporting charities. The majority of this was used to finance social funds.
Obligations from exploration and production licences are arising from contracts for subsoil use and include payments to the social programs fund, the ecology fund and the commitment to train personnel. In 2015, the Company’s social expenses related to the execution of contractual obligations amounted to KZT2.6 billion, including the social programs and ecology fund that amounted to KZT1.9 billion as well as the training of local specialists which amounted to KZT0.7 billion.
Liquidity and capital resourcesThe Company’s liquidity requirements arise principally from the need to finance its existing operations (working capital), the need to finance investment (capital expenditure) and to reach its growth targets via acquisitions. The management believes that the Company has an adequate liquidity position to meet its obligations and pursue investment opportunities.
Financial asset movement for 2015 million KZT
734,325
+457,564
Beginning �nancial asset position
Net �nancial assets generated from operating activities and FOREX
Net �nancial assets used in investing activities
Net �nancial assets used in �nancing activities
Ending �nancial asset position
-56,678
-30,229
1,104,982
1,200,0001,000,000800,000600,000400,000
During 2015 net financial assets inf low from operating activities and FOREX amounted to KZT457.6 billion or KZT171.5 billion more than in 2014. The increase is primarily attributable to higher foreign exchange gain recognition, as a result of the decision of the Government of the Republic of Kazakhstan and NBK to switch to the freely f loating tenge exchange rate regime in 3Q 2015, which was partially offset by the effect of lower crude oil sales prices.
Net financial asset outf low from investing activity in 2015 was KZT56.7 billion versus an outf low of KZT44.4 billion in 2014. Increase in net outf lows primarily resulted from lower dividends received from JVs and associates (KZT60.1 billion less), which was partially offset by lower capital expenditures (KZT44.0 billion less) and higher loan repayments received from related parties (KZT1.9 billion more).
Net financial asset outf low from financing activities in 2015 was KZT30.2 billion (outf low of KZT130.1 billion in 2014). The decrease in outf lows is mainly associated with lower dividend payments made in 2015 compared to 2014 (KZT100.0 billion less).
Net cash positionThe table below shows a breakdown of the Company’s net cash position:
As at December 31,
2015
As at December 31,
2014 Change (KZT million,
unless otherwise stated) %
Current portion 5,585 3,000 86%Non-current portion 5,990 4,218 42%Total borrowings 11,575 7,218 60%
Cash and cash equivalents 237,310 180,245 32%Other current financial assets 833,912 535,513 56%Non-current financial assets 33,760 18,567 82%Total financial assets 1,104,982 734,325 50%Foreign currency denominated cash and financial assets, % 99% 94%Net cash 1,093,407 727,107 50%
Forward-looking statementsThis document includes statements that are, or may be deemed to be, ‘‘forward-looking statements’’. These forward-looking statements can be identified by the use of forward-looking terminology including, but not limited to, the terms ‘‘believes’’, ‘‘estimates’’, ‘‘anticipates’’, ‘‘expects’’, ‘‘intends’’, ‘‘may’’, ‘‘target’’, ‘‘will’’, or ‘‘should’’ or, in each case, their negative or other variations or comparable terminology, or by discussions of strategy, plans, objectives, goals, future events or intentions. These forward-looking statements include all matters that are not historical facts. They include, but are not limited to, statements regarding the Company’s intentions, beliefs and statements of current expectations concerning, amongst other things, the Company’s results of operations, financial condition, liquidity, prospects, growth, potential acquisitions, strategies and as to the industries in which the Company operates. By their nature, forward-looking statements involve risk and uncertainty because they relate to future events and circumstances that may or may not occur. Forward-looking statements are not guarantees of future performance and the actual results of the Company’s operations, financial condition and liquidity and the development of the country and the industries in which the Company operates may differ materially from those described in, or suggested by, the forward-looking statements contained in this document. The Company does not intend, and does not assume any obligation, to update or revise any forward-looking statements or industry information set out in this document, whether as a result of new information, future events or otherwise. The Company does not make any representation, warranty or prediction that the results anticipated by such forward-looking statements will be achieved.
Operating and financial review continued
54 KazMunaiGas Exploration Production JSC Annual Report 2015
Strategic overview
Strategic overview 55 KazMunaiGas Exploration Production JSC Annual Report 2015

The Company’s activity is subject to multiple risks and uncertainties of an economic, political, legislative, social and financial nature. When taking decisions, interested parties should bear in mind that these risk factors could have an impact on the Company’s financial and operating performance.
Risk Management Policy is an integral part of the Company’s corporate governance, and is a constantly developing process which helps it systematically identify, assess and manage its risk portfolio by analysing historical and current growth, as well as future growth prospects.
Further details on risk policy may be found in the Company’s Prospectus for ordinary shares and GDR issues, while an analysis of key financial risks may be found in the annual audited financial statements.
An additional incomplete list of principal risks is presented below.
Political risks • The country’s political leadership has the capacity to change foreign or
domestic policy in ways that could significantly affect the investment attractiveness of the country in general and the Company in particular;
• The Government could substantially cut export quotas or change the rules governing the volume and price of deliveries to the domestic market in ways which could have a significant impact on the Company’s financial performance.
• Deliveries to the domestic market are currently made at prices lower than for export sales. The Government has the power to revise the level of prices for domestic delivery. After negotiations with the Company the Government could still fix prices for domestic supplies below levels that are economically viable for the Company;
• The Government may also oblige the Company to supply it with sufficient oil to fulfil the government’s own oil delivery obligations according to inter-governmental agreements and at below-export prices;
• There is also the possibility of changes to legislation, including tax legislation, aimed at maximising budget revenues from the energy and natural resource industries;
• The Government could also limit the Company’s ability to manage its own cash f low, including the allocation of its deposit and cash portfolio. Changes to the Government’s foreign exchange management policy could also inf luence the financial results of the Company;
• The state’s representatives, SWF Samruk-Kazyna and NC KMG, could also have an impact on KMG EP which conf licts with the interests of KMG EP’s minority shareholders by taking or not taking a range of substantial decisions in the interests of the state.
Regional risksThe main operational divisions of the KMG EP group of companies are active in the Mangistau, Atyrau and Kzylordynskaya regions and the Western Kazakhstan region.
The main production units operate in regions characterised by severe climatic conditions. Some regions also suffer from a shortage of highly skilled oil production and gas processing professionals. These regions also have high social and economic risks which have a material impact on the Company’s operations. The risk of social conf licts and strikes is relatively high in the Mangistau Region as has been shown several times.
The Company has consistently sought to promote and maintain social stability in its operating regions and actively interacts with local governments and communities to ensure that its social programmes are carefully targeted. The resulting increase in non-commercial costs associated with reducing the risk of strikes and social strains could however have a negative impact on the financial performance of the Company.
Climatic conditions in these regions also vary widely according to the seasons, and their geographical remoteness requires a special emphasis on secure transport and electricity supplies to ensure continuous operations.
In order to minimise the possible consequences of risks associated with climatic events, including the threat posed by natural disasters, the Company pays special attention to measures ensuring continuity of business operations and industrial safety.
Exploration The key strategic goal of the Company is to increase reserves. The main risks associated with exploration activities are related to the unconfirmed nature and size of the actual resources being explored and the rising costs of current geological exploration projects. To reduce these risks the Company carries out comprehensive geological and geophysical analyses in addition to traditional seismic surveys, which include geochemical and gravimetric exploration techniques and special methods for seismic and gravimetric data processing.
ProductionOne of the Company’s most important tasks is to maintain an optimal level of production at its own fields, most of which are mature fields in the later stages of operation. To this end, the Company uses the latest methods and technologies to control key business production processes.
Key factors that may affect the efficiency of the Company’s production include:
• The status and condition of the main stock of wells;
• Technical integrity of equipment;
• Continuity of power supply;
• Weather conditions;
• Timeliness of procurement and supply of equipment;
• Quality of delivered equipment;
• Rising costs of services, materials and fixed assets outstripping productivity growth;
• Limited control over operating and capital costs;
• Problems with the timeliness and quality of service provided by contractors;
Economic risks • Changes in the global market price for oil which remains extremely volatile.
High volatility is due to a number of factors impacting on the global balance of supply and demand especially the international political environment and international conf licts affecting key oil-producing countries and the political environment in key energy producing regions.
• Low oil prices lasting for an extended period of time, in either domestic or foreign markets will have a negative impact on the Company’s financial performance, especially where prices fall below the cost of production.
• Current legislation regulating the procurement of goods and services does not permit improvement in the efficiency of technical support and logistics;
• The lack of a competitive environment among suppliers and contractors reduces the quality of work and services provided to the Company;
• Adverse changes to the financial system of Kazakhstan may worsen conditions for the placing of free cash funds (for details of financial risks, see below).
Strategic and investment risksThe main factors affecting the Company’s investment activities are:
• Limits on the number of new onshore assets in Kazakhstan available for purchase;
• Increased competition from large international oil companies for access to oil and gas assets.
In addition, because KMG EP is the largest oil and gas company in the Government’s portfolio, the state, through Sovereign Wealth Fund Samruk-Kazyna JSC and NC KMG, could direct KMG EP to act in the wider interests of the state as a whole which may run contrary to those of KMG EP’s shareholders.
This could happen if the Relationship Agreement between KMG EP and NC KMG, which provides for the business independence of KMG EP, is altered in a way which negatively affects the corporate governance of KMG EP.
All these factors, either separately or together could lead to an under-estimate or over-estimate of the attractiveness of KMG EP’s projects and could lead to inefficient investment decisions and, consequently, to a fall in the level of reserves and the value of the Company.
• Safety of operating personnel;
• Environmental security;
• Effectiveness of planning;
• Compliance with state regulators.
Lower production efficiency and an unplanned, significant decline in production rates could have a material impact on operational results and the value of the Company’s assets and reserves.
At the same time, production is also subject to the risk of failure or breakdown of primary equipment. To reduce these risks the Company employs preventive measures and a modernisation programme together with major repairs of equipment. The core production equipment is insured against loss from fire, explosion, natural and other hazards, and the Company also insures against the risk of well blowouts.
Health, safety and environmentThe Company’s production activities involve a wide range of risks to workers’ health and the environment. These risks include unsafe work practices, industrial accidents, environmental damage and pollution, and natural disasters. The consequences can be extremely severe, including fatal accidents in the workplace, air, soil and water pollution, fire, and the suspension or termination of production. Depending on the causes of such events, the consequences could adversely affect both the reputation and the financial and operating performance of the Company.
The Company undertakes various measures to prevent the occurrence of such threats, including control over occupational health and safety environments, hazard identification and safety training for personnel. The Company’s current labour protection systems and health, safety and environmental protection policies function in accordance with ISO 14001 and OHSAS 18001.
Every year the Company insures against occupational safety and environmental risks associated with its own activities and projects.
In addition, there is always the risk of ambiguity in the interpretation of environmental laws and regulations that may not always work in the Company’s favour, and which could lead to potential claims and penalties. Additional information on measures taken by the Company on health, safety and environmental protection matters is provided on page 63.
Financial risksThe Company is exposed to various financial risks, among which are currency risks, inf lation, changes in cash interest rates, credit and tax risks. The probability of their occurrence and degree of impact on financial results are continually evaluated by the Company and taken into account when drawing up development plans.
Inflation risksThe Company conducts its principal operations in the Republic of Kazakhstan and uses the Kazakhstan tenge as the base currency for accounts. The payment of wages, energy costs, and logistics services are all sensitive to the tenge inf lation rate.
Risk factors
56 KazMunaiGas Exploration Production JSC Annual Report 2015
Strategic overview
Strategic overview 57 KazMunaiGas Exploration Production JSC Annual Report 2015
Risk factors continued
Interest rate exposureThe Company’s operations are exposed to interest rate changes, which may adversely affect the value of temporarily deposited free funds or cash assets and, accordingly, the Company’s financial results.
Currency risksMuch of the Company’s revenues are denominated in US dollars (USD) or are linked to USD. Part of the Company’s expenses are also denominated in foreign currencies, or otherwise significantly dependant on the f luctuations of foreign currencies (mainly the USD and, to a lesser extent the euro and the Russian ruble) against the Kazakhstan tenge (KZT). Currently, approximately half the Company’s operating costs are denominated in KZT. A rise in the value of the US dollar would make oil exports more profitable.
If negatively impacted by interest and exchange rate changes the Company can use trade finance instruments (letters of credit, guarantees) to reduce its dependence on base interest rates.
The following indicators of the Company’s financial statements are most susceptible to change as a result of financial risks:
• net income;
• revenues;
• costs;
• receivables.
Credit risksOperations associated with the movement of material and cash f lows for counterparties are most susceptible to credit risks. These risks start with the financial institutions which service the financial f lows of the Company itself right through to the financial operations of the end buyers of products and contractors providing various services to the Company.
An efficient centralised cash management system has been introduced by the Company’s Treasury department.
The probability of financial risks and their impact on financial statements
RiskProbability of
occurrenceEffect ref lected in statements
Falling bank deposit rates High Lower profits due to falling revenues
Foreign exchange risk – risk of devaluation of exchange rate of KZT v Euro and USD)
High Rising costs of equipment and depreciation provisions
Inf lation risks High Increase in accounts receivable and cost of services supplied
Credit risks Average Problems with receivables. Reduction in profit.
Tax risksThe tax system of the Republic of Kazakhstan is characterised by low levels of law enforcement practice in respect of recently adopted regulations. It is also characterised by the risk of additional taxation, fines and penalties being levied on the basis of a broad interpretation of the legislation. These factors complicate planning of the Company’s tax payments. Management takes steps to minimise such risks by taking part in work to improve the quality of the Tax Code and by suggesting amendments. In addition, the Company continues to defend its interests in the courts.
Changes in customs regulations and dutiesAs the Company is engaged in foreign trade, factors such as changes to customs regulations, the volatility of export customs duty (ECD) rates, and lack of a transparent formula for calculating the ECD, could all adversely affect the Company’s financial results.
The Company continuously monitors changes in the current legislation of the Republic of Kazakhstan, however, and takes part in work on changes to customs regulations and on the harmonisation of the fiscal environment for subsoil use companies.
Partner risksThe Company cooperates with and engages both foreign and local companies in various areas of its business. It may have limited or no impact, however, on the way its partners conduct business or operate, even though this may affect the completion of specific projects and the operating and financial performance of the Company. Therefore, the Company pays particular attention to the selection of appropriate partners and seeks to develop long-term and mutually beneficial partner relationships.
Changes are probable in the terms and timing of payment for the supply of crude oil by purchasers belonging to the NC KMG group of companies. Changes in payment terms may be linked to an unforeseen worsening of a purchaser’s financial situation and/or other internal and external factors affecting the NC KMG group. Changes in payment terms can affect the Company’s working capital levels.
Information technologyThe Company is subject to risks in the area of IT security. Considering the public nature of the business conducted, the Company pays particular attention to providing for the integrity of important information and the secure storage and confidentiality of business data.
Corporate governance risksReduced organisational capacityOne of the major factors affecting the efficient operation of the Company is a reduction in its organisational capacity. Highly qualified personnel are necessary to maintain the Company’s competitive advantage and to ensure that the strategic goals of the KMG EP group of companies can be met. But each year, the Company faces challenges in attracting and retaining staff with appropriate qualifications, primarily due to a shortage of appropriately qualified professionals in some regions.
To lower this risk, the Company has developed a series of measures aimed at increasing the loyalty, motivation and professional skills of its staff. Considerable attention is also paid to improving management’s leadership skills and the development of a personnel reserve.
Fraud and corruptionResource allocation contrary to the best interests of the Company, the causing of damage to the Company for the sake of personal gain, or any other evidence of corruption is totally unacceptable, regardless of the size of the financial damage caused.
The Company takes all possible steps to prevent illegal activities and actions that could cause it reputational damage.
The Company is subject to the Kazakh Law on Combating Corruption, as well as the UK Bribery Act 2010 which came into force in July 2011. The Company has set up its own internal policies and procedures in strict accordance with these laws.
The Company provides the means for employees, business partners and third-party contractors engaged by the Company to report concerns regarding any possible or potential violations of the anti-corruption legislation by Company employees or other persons associated with the Company. Information on the whistle-blowing policy can be found on the corporate website.
All employees are acquainted with the Company’s anti-corruption policies and policy on proactive information and are required to sign up to confirm their understanding of the requirements of the anti-corruption legislation and the Company’s internal documents on combating corruption. Employees of the Company and its subsidiaries are trained in compliance with anti-corruption laws and with internal company policies.
The Company strives to ensure compliance with anti-corruption laws by third parties engaged by the Company. To this end, an appropriate clause is provided in all contracts concluded by the Company with third parties. This requires workers of third party companies to comply with anti-corruption legislation and to inform the Company of any suspected breaches, as well as the right of the Company to conduct a comprehensive assessment of the reliability of a third party if there is suspicion of violation of anti-corruption legislation.
58 KazMunaiGas Exploration Production JSC Annual Report 2015
Strategic overview
Strategic overview 59 KazMunaiGas Exploration Production JSC Annual Report 2015

Social policyKMG EP provides jobs for more than 26,000 people through its parent company and joint enterprises in several regions of Kazakhstan. The Company continues to improve employment conditions for its oil workers by financing the construction of social facilities alongside industrial projects.
KMG EP provides jobs for more than
26,000 employees
Social responsibilityThe Company fully acknowledges its responsibility to help maintain social stability and guarantee adequate standards of living for people in its operating regions. In this regard KMG EP bears the additional overheads of maintaining the existing headcount, regardless of current operational needs, and provides for health insurance and the cost of training under the collective agreement terms.
In spite of the current tough economic climate, the Company intends to maintain social payments and the permanent component of employees’ wages at current levels, provided that economic conditions do not deteriorate further.
Collective agreements with workers of OMG and EMG were concluded for 2014-2016. All obligations under collective agreements that were planned for 2016 will be met in full. These include bonus payments, and inf lation indexation of wages. However, starting with 2017, and taking into account the significant drop in oil prices and other macroeconomic factors, the terms of collective agreements for following years will be reviewed jointly with representatives of worker teams.
As in the past, KMG EP provides financial support towards social development in its operational areas within the framework of contracts for subsurface use. In 2015 various social projects in the Atyrau and Mangistau regions were granted 1.9 billion tenge (US$8.5m). Local municipalities decide which social needs these funds should be directed towards, depending on popular demand. Funding was mainly directed towards road repairs, improvements to urban infrastructure and the creation of jobs for the unemployed.
The Company also provides sponsorship support to sports societies, societies of Second World War veterans, and the Munayshy fund. Emba oilmen demonstrated their social solidarity by contributing a day’s pay to finance construction of four houses for socially vulnerable residents whose homes were f looded during the heavy rains of May 2015.
OMG supported a project for setting up a botanical garden in Zhanaozen and also sponsored township events on a regular basis. JV Kazgermunai LLP built a new hippodrome for the residents of Kyzylorda. At Karazhanbasmunai JSC a project called Zhas Maman has been set up which awards apprenticeships in the company to the best graduates of specialist higher education institutions.
Within the framework of providing project sponsorship assistance in 2015, some 51 million tenge was also provided for the launch of the Zhuldizay medical centre in Zhanaozen for the treatment and rehabilitation of children of limited abilities with the help of domestic and foreign specialists.
As part of the project, three operations were carried out at the Zhanaozen town hospital and two operations at the Mangistau regional hospital in Aktau while specialists from Lithuania, Israel, Russia, China and the cities of Astana and Almaty paid numerous visits. Instructors in physical rehabilitation and massage specialists from Zhanaozen also underwent training in Astana. Events to celebrate Nauryz Meyramy, Childrens’ protection day and the New Year were also held.
Before the 2016 New Year celebrations a Tusau keser event was held where according to national tradition, the legs of children taking part are bound together and then cut free after the event. This year’s Tusau keser included two children who, before being accepted at the treatment centre, were unable to walk. Only thanks to the efforts of the instructors, doctors and parents were they able to walk and take part in the fun.
The company also gave financial support to a project created to support the psycho-social development of patients with oncological illness in the Republic of Kazakhstan by contributing 15 million tenge to the “Amila” Social fund. Psychologists conducted over 17,000 consultations with patients, relatives and medical personnel while social workers conducted over 3,000 consultations and provided over 25,000 services in the medical-social, social-legal, social-psychological and other areas within the framework of the project. A “Sensory room” was also launched, which helps the process of treatment and rehabilitation from oncological illnesses.
Some 34 million tenge of financial aid was also provided for the treatment of 11 children at clinics abroad in 2014 within the framework of charitable support for the “Miloserdie Social fund”.
Expenditure on social projects, million tenge
Mangistau region Atyrtau regionTotal Compulsory Voluntary Total Compulsory Voluntary
2014 2,140 904 1,236 533 343 1902015 1,379 900 479 518 394 124
60 KazMunaiGas Exploration Production JSC Annual Report 2015
Strategic overview
Strategic overview 61 KazMunaiGas Exploration Production JSC Annual Report 2015

One example was a project for testing and applying polymer injection in the experimental area of horizon M-II-3 of the Nuraly field at JV Kazgermunai LLP. Proposed by Nuriman Abzhanov and implemented by LLP Alstron the project managed to stabilise the water cut, and resulted in the extraction of an additional 21,000 tonnes of crude in 2015.
Another was a project put forward by Aybek Bisenov, a Health & Safety and Environmental Protection engineer at Embamunaienergo, which was judged as the best health and safety project last year. The young specialist, using his own resources, created, edited and put in the soundtrack for an educational film on workplace safety measures, which is now being routinely broadcast throughout the company.
Our peopleSince its formation, KMG EP has provided training and skills development for its employees. KMG EP holds various corporate training programmes to promote uniform corporate policies and strategic priorities. In 2015, Company training sessions for a total of 37,941 people were held, with many employees attending multiple sessions.
Due to the fact that KMG EP operates under the regulatory requirements not only of Kazakhstan, but also of the United Kingdom, including the Listing Rules and Disclosure and Transparency Rules of the UKLA, KMG EP and the LSE developed an online training course in compliance. This was taken by 1,178 employees of KMG EP with training carried out between October and December 2015.
In September 2015 EMG started a project on dual learning. A total of 39 final year students from the Atyrau institute of oil and gas and the Higher technical school APEC Petrotechnic are combining study and work at the production divisions of EMG – NGDU Zhylyoymunaigas, Zhayikmunaigas and Kaynarmunaigas. The Company covers all costs connected with this new method of study. On completion the students will need to pass an examination to qualify as a well surveying operator, before being awarded the qualification, which will be recorded in their employment record book.
Annual Spartakiade According to established tradition the subsidiaries of KMG EP take turns to host the annual sports Spartakiade. The fourth Spartakiade of work collectives of KMG EP group companies was held in Atyrau in September 2015.
Over a four day period oilfield workers competed in several sports including volleyball, basketball, indoor soccer, ping-pong, tennis, swimming, track and field, chess and tug-of-war. They also measured up in the national sports of Kazakh Kuresi and Toguz Kumalak.
Teams from EMG, OMG, KBM, KGM and the Department of Utility Vehicles and Well Servicing, as well as a united services team from Zhanaozen and from the Head Office of KMG EP, together with Ural Oil and Gas LLP and Karpovskiy Severniy LLP took part. In total some 350 oilfield workers from the Atyrau, Mangistau, Western Kazakhstan and Kyzylorda regions and from Astana and Uralsk participated in the Spartakiade.
Health & Safety and EnvironmentFor KMG EP, implementing a leadership strategy does not mean simply achieving higher production and financial results. Achieving new production horizons and targets requires raising the overall quality of environmental management and environmental safety. The Board of KMG EP carefully monitors management’s progress in raising safety levels and constantly lowering the incident rates of accidents, workplace injuries and professional illnesses.
Occupational Health & SafetyOccupational safety is a top priority for KMG EP management. During the last three years the Company has conducted several large-scale initiatives aimed at maintaining employee safety. In the first instance, this involves improving working conditions, including the construction of service and utility complexes, canteens, administrative complexes, and operator’s cabins for the various Group units. Management also pays great attention to the quality of bought in specialist work clothes, safety shoes, and personal protective equipment.
Organisation name 2014 2015Expenditure on Health & Safety , industrial and fire protection, mln tenge
OMG 744 698EMG 563 236KBM 581 565KGM 222 279Subtotal: 2,111 1,779Expenditure on procurement of personal protective equipment , mln tenge
OMG 1,871 1,030EMG 617 364KBM 127 190KGM 76 54Subtotal: 2,692 1,637Total amount: 4,802 3,416
The operating environment of oil companies is recognised as being hazardous, consequently KMG EP actively works towards lowering the risks of life-threatening accidents and other risks for personnel.
In 2015 zero accidents were recorded by Karpovskiy Severniy LLP, Ural Oil and Gas LLP, KMG EP-Catering and UDTV.
Professional skill competitionIn August 2015 the eighth professional skill competition “Uzdik Maman” (Best Professional) was held among employees of KMG EP’s subsidiaries and joint ventures. Fifty eight employees from Ozenmunaigas JSC (OMG), EMG, Karazhanbasmunai JSC (KBM), JV Kazgermunai LLP (KGM) and service company LLP Kruz took part in the competition.
In 2015 “Uzdik Maman” took place at the Oil and Gas Production Department of OMG. Special work stations, equipment and inventory for completing the tasks were set up at the Uzen field.
Among the results, first place in all 11 categories was taken by workers from OMG, who also took second place in the three categories of oil and gas operator, well survey operator and electrician (gang). Workers from KGM took second place in the four categories of numerically controlled automated lathe operator, chemical laboratory assistant, oilfield equipment repairman and oil treatment operator (loading operator). Workers from KMB took second place in the two categories of reservoir pressure maintenance operator and underground well servicing operator (gang). Workers from LLP Kruz took part in the professional skills competition for the first time and took second place in the two categories of gas and arc welder and lathe operator.
Winners in each category were awarded “Uzdik Maman” medals. Contestants placed first, second, and third were awarded gift vouchers and will receive 30%, 20%, and 10% bonuses respectively on top of their basic salary for a year.
KMG EP youth movementYoung Professionals’ Councils have been operating both at KMG EP’s head office and in its subsidiaries since 2012. The movement’s mission is to stimulate young people to actively participate in the activities of the Company. This includes involvement in decisions on production and strategic goals, in the creation of a healthy environment for the professional development of young professionals and the development and instilling of corporate values among young professionals. It also aims to help in the nurturing and development of their creative potential in science and technology and in production management – in line with the strategy and goals of KMG EP.
A round table of the Council for young professionals from KMG EP dedicated to the role of the Council in the activities of the Company was held on June 11-12, 2015.
The round table discussion hosted participants from 18 KMG EP subsidiaries coming from the Mangistau, Atyrau, Western Kazakhstan and Kyzylorda regions and from Astana.
Participants of the round table also heard presentations from industry experts on the latest technologies for horizontal well drilling and geological exploration techniques. A discussion on the development of the Company in the medium term was also held within the context of the event.
Under the auspices of the Councils the Company has developed a competition under whose terms the winners of projects involving different sectors including Geology and Geophysics, Health & Safety and Environmental Protection, Reservoir Management and Finance, are expected to go forward and apply their ideas to the actual workplace. Winners of the 2014 competition, whose projects were judged during the Day of the Young Professional last year, presented the first results obtained from introducing their ideas into the workplace.
Social policy continued
62 KazMunaiGas Exploration Production JSC Annual Report 2015
Strategic overview
Strategic overview 63 KazMunaiGas Exploration Production JSC Annual Report 2015
On EMG’s territory some 15.324 tonnes of production and consumption waste was processed and disposed of. This includes 8.000 tonnes of oil-impregnated soil which was processed by EMG while 7.324 tonnes of waste was disposed of by third party organisations.
On the territory of KBM third party organisations processed and disposed of the 29.196 tonnes of production and consumption waste accumulated during 2015.
Some 17.130 tonnes of production and consumption waste accumulated at KGM was also fully disposed of.
Volumes treated in 2014-2015 in tonnes
Volume of disposed of waste
Volume of cleaned radioactive waste, post
de-activation
Volume of contaminated soil,
cleaned by biological methods
2014 2015 2014 2015 2014 2015EMG 27,970 10,524 – – 245,300 –OMG 65,090 123,733 1,000 6,000 405,740 –KBM 32,000 29,196 – – 27,400 –KGM 16,200 17,130 – – – –TOTAL 141,260 180,543 1,000 6,000 678,100 –
The basis for compliance with environmental protection requirements is carrying out ecological control at the production level. Ecological control is organised in accordance with the Programme of Ecological Control and also with the requirements of environmental legislation and the regulatory and procedural guidelines that regulate this type of environmental protection activity.
To prevent negative impacts of production on the environment, OMG, EMG, KBM and KGM all implement the Programme of Ecological Control. This determines the order and methods for monitoring the state of environmental factors such as air quality, eff luent run-off and ground water and the condition of soil, vegetation, and fauna during the production process.
Dynamics of gaseous pollutant emissions in tonnes
Name of organisation
Permitted volume of emissions
for 2014
Actual volume of emissions
for 2014
Permitted volume of emissions
for 2015
Actual volume of emissions
for 2015
EMG 14,796 8,975 13,353 6,954OMG 8,688 5,231 6,661 5,134KBM 4,161 4,161 5,660 5,651KGM 1,562 963 2,562 2,000TOTAL 29,207 19,330 28,227 19,739
Caspian water area protectionIn order to prevent pollution of the Caspian Sea the Company uses stepped steel structures with a special filling material that reinforce the coastline against landslides. These are the so-called ‘Reno mattresses’.
At the Teren-Uzek and Zapadnaya Prorva deposits of NGDU Zhylyoymunaigas some 8.47 km of protective dam has been reinforced. In addition, wells under water used by Zhylyoymunaigas, part of EMG, are also being continuously monitored.
At other divisions there were 40 work-related accidents, involving 42 workers, of whom 14 suffered serious injuries, 26 received light injuries and two lost their lives.
Of the total number injured some 25 returned to work, two were classified as disabled and 13 are undergoing rehabilitation treatments.
Disciplinary action was brought against 78 workers for permitting an accident in the workplace.
Specially formed commissions were set up to investigate the fatal accidents which occurred at KBM and OMG, and their investigations established the following causes:
1. Non-compliance with safety requirements by the victim of the fatal accident while operating electrical equipment and without using personal safety protection equipment;
2. Unsatisfactory organisation of the workplace environment by the employees responsible for maintaining standards resulting in inadequate control over working operations in a highly hazardous area.
Starting from 2015 KMG EP policy now demands full transparency of reporting. This requires, for example, the registration and logging of all injuries, including minor injuries in the workplace, even those which do not result in workers losing their ability to work. During the year targeted checks were carried out at divisional operating centres and frequent meetings, briefings and clarification events were held to ensure the timely notifiation and recording of accidents and the subsequent logging and conducting of enquiries into workplace accidents, including insignificant micro injuries.
Trends in workplace accidents 2013-2015 Annual safety training is conducted to raise workers awareness about health and occupational safety issues. All production areas have had specific safety instructions drawn up by profession and for each type of work. Pocket-book reminders about work safety are also issued to each worker.
Gas utilisationAssociated gas produced by OMG is fully utilised by KazGPZ.
EMG has drawn up and approved an associated gas utilisation and processing programme (“Programme”) whose purpose is to reduce, and in future to achieve 100% exclusion of associated gas f laring at field wellheads.
Once implemented, the proposed Programme should address several environmental issues. These include the reduction of atmospheric emissions, soil and water body pollution, and a reduction in the level of greenhouse gases released.
At present two such projects have been implemented within the framework of the Programme. One is called the “Extension of the system of preparation and transportation of associated gas at the oilfields operated by NGDU Zhaikmunaygas in the Isataysky District” and the other is the “Extension of the system of preparation and transportation of associated gas at the oilfields operated by NGDU Dossormunaygas in the Vostochny Makat field in the Makatsky District” at a total cost of 3 billion tenge (US$13 million).
These projects process associated gas to bring it up to industrial commodity grade so that it can be used to power the company’s own utilities and operations. Excess gas is sold to local consumers in Isataysky, Makatsky and Kyzyl-Kuginsky districts through the system of KazTransGaz Aymak. The capacity of the ongoing installation at NGDU Zhaikmunaigas is 20 million cubic metres (mcm) per annum and at NGDU Dossormunaygas it is 40 mcm per annum of commodity grade gas.
An ongoing problem for EMG is the f laring of gas at the Prorva Oilfields. Within the framework of the Programme complex works are under way for the design and construction of a special treatment plant to remove sulphur from associated gas from the Prorva fields. It has the capacity to treat 150 mcm per annum. The project facilitates the removal of sulphur from the associated gas, the separation of condensate and transportation of the purified gas through the Central Asia-Centre main gas pipeline through the Borankol gas processing plant owned by KazMunayTeniz for onward sale to consumers. The project is due for completion over the 2014-1016 period at a cost of 19.5 billion tenge (US$ 83 million).
At KBM the total volume of associated gas produced is utilised for its own purposes.
At KGM the total volume of associated gas produced is treated at a gas processing plant and while part of the treated volume is used for its own needs surplus gas is supplied to residents of the Kzylorda region as fuel.
Penalty sanctions for violations of ecological legislationThe results of 2015 show a declining trend in the issued and paid up penalty sanctions imposed for violation of ecological legislation compared to previous years. In 2015 the total amount of paid up penalty sanctions was 122.640 million tenge, which included payment for some of the penalties totalling 114.347 million tenge that were issued by the relevant state bodies in 2014.
Environmental protectionAs its business operations are directly related to the use of natural resources, KMG EP acknowledges it has a social responsibility to use these resources sustainably and to preserve the environment.
In 2015, 4.64 billion tenge (US$21 million) was spent on environmental protection programmes at the four main production operations.
Expenses for environmental protection 2014-2015 mln tenge
Name of development organisation Name of metricExpenditure on environmental
protection2014 2015
OMG 2,750 1,760EMG 1,860 1,530KBM 1,340 770KGM 530 580KMG EP 6,480 4,640
In accordance with the Environmental Monitoring Programme, during 2015 work was completed on identifying the remaining and newly oil-contaminated areas within territories contracted to OMG. During the reporting period 123 733.000 tonnes of production and consumption waste was processed and disposed of on the territory of OMG’s deposits. This included the processing of 60.000 tonnes of oil-contaminated soil by the Bekturov Institute of Chemical Sciences and a further 50.000 tonnes that was processed by a subcontracting company using a hydro-mechanical cleaning method. Using its own resources, OMG processed 8.243 tonnes of oil-impregnated soil while a further 5.490 tonnes of waste was transferred to subcontracting organisations for disposal.
As a result of the completion of the above works, one of the five fully equipped waste storage compounds was fully cleared. In addition, 6.000 tonnes of radioactively contaminated tubing and equipment was cleaned on the territory of OMG.
Social policy continued
64 KazMunaiGas Exploration Production JSC Annual Report 2015
Strategic overview
Strategic overview 65 KazMunaiGas Exploration Production JSC Annual Report 2015

KMG EP is a pioneer among Kazakh companies in applying corporate governance practices in line with international standards. Investor confidence in the Company and its management hinges on the Company’s levels of corporate governance.
KMG EP has developed and put in place an effective system to manage relations between the Board of Directors, the Management Board and shareholders. This system ensures that the Company continuously seeks the best investment opportunities while at the same time considering the interests of all shareholders.
Regulation of its relationship with the principal shareholder is a vital task of the Company’s corporate governance system. An agreement is in place between KMG EP and its parent company NC KazMunayGas (NC KMG) that provides for business independence while at the same time requiring KMG EP to act in the best interests of all its shareholders.
The Company’s Board includes three independent directors. They play a major role in ensuring that the Company complies with its corporate governance commitments. The independent directors at KMG EP use their experience to balance the inf luence of the principal shareholder and to closely supervise management decisions.
The inf luence of the independent directors is bolstered by a legal provision requiring the presence of no less than half of all independent directors for meetings of the Board of Directors to be quorate; their membership and chairmanship on all Board committees, and exclusive voting of the independent directors on issues related to the authorisation of interested-party transactions. This allocation of functions provides a more balanced and effective decision-making process in line with best practices.
Corporate governance 68 Board of Directors
70 Corporate governance report
Corporate governance
66 KazMunaiGas Exploration Production JSC Annual Report 2015 67 KazMunaiGas Exploration Production JSC Annual Report 2015Corporate governance

Yerzhan Zhangaulov
Kurmangazy Iskaziyev
Asiya Syrgabekova
Igor Goncharov
Christopher Hopkinson Chairman of the Board of Directors, First Deputy Chairman of the Management Board of JSC NC “KazMunayGas”
Christopher Hopkinson is a graduate of St Andrews University, Scotland. He has worked in the oil and gas industry since 1980. Before he joined NC K MG, he had been CEO at International Petroleum; General Director at Imperial Energy Corporation Plc and Senior Vice President North Africa at BG Group. Earlier in his career he held various posts at Shell and TNK BP Holding. He is a member of the Society of Petroleum Engineers.
Christopher Hopkinson was elected to the Board of Directors of the Company on January 13, 2015 and Chairman of the Board on January 20, 2015. He is a member of the Nominations Committee.
Kurmangazy Iskaziyev Chief Executive Officer and Chairman of the Management Board
Kurmangazy Iskaziyev has held the position of CEO of KMG EP and Chairman of the Management Board since 23 September, 2015. Concurrently he is First deputy General Director of JSC Embamunaigas (EMG), which performs the functions of CEO of EMG in his absence. From December 2013 to January 2015 he worked as Managing Director for geology - Senior Geologist of JSC NC KazMunayGas (NC KMG). Between February 2012 and December 2013 he was deputy Chairman of the Management Board of NC KMG for geology and future projects of NC KMG. Between 2004 and 2008 he was deputy director, then director of the department of geology and development at KMG EP. He started his career at the Balykshin department of exploratory drilling (BURB) of Embaneft production Union. He graduated from the oil faculty of the Kazakhstan Lenin Polytechnical Institute as a mining engineer-geologist and Tomsk Polytechnical University, gaining the qualification of Candidate of Geological-Mineralogical sciences. Kurmangazy Iskaziyev was elected member of the Board of Directors of the Company on 26 November, 2015.
Igor Goncharov Managing Director for Operating Production Assets of JSC NC KazMunayGas
Igor Goncharov graduated from Tomsk Polytechnical Institute in 1989 as a mining engineer-geophysicist, from Tomsk University of Control Systems in 2000 as an engineer-programmer and from Heriot-Watt University in 2002 with a Master of Science in Petroleum Engineering.
He was Senior Engineer at OJSC TomskNIPIneft VNK and held senior management positions, such as General Director of OOO Nord Imperial IEC Group, Head of Department of Subsoil Usage and Development of Oil and Gas Complex and also Acting State Counsel for the Tomsk region 2nd Class at the Administration of the Tomsk Region of the Russian Federation.
He has been working at NC K MG since September 2015. Igor Goncharov was elected to the Board of the Company on November 26, 2015.
Yerzhan Zhangaulov Managing Director (Legal) of JSC NC KazMunayGas
Yerzhan Zhangaulov previously worked as the Head of Legal Services, Executive Director for Legal Matters, and adviser to the Vice President of JSC NC KazMunayGas. He led the Legal Department of JSC NC Oil and Gas Transportation, headed the legal and personnel sections within the General Services Department of Kazakhstan’s Presidential Administration, served as a consultant to the Legislation, Defence and Law Enforcement Department at the Front Office of the Prime Minister of the Republic of Kazakhstan, and as assistant to Kazakhstan’s Justice Minister. He graduated from the Karaganda State Institute’s Faculty of Law in 1992.
Asiya Syrgabekova Managing Director (Investment and Risk Management) of JSC NC KazMunayGas
Asiya Syrgabekova has been working as the Managing Director for Investment and Risk Management of JSC NC KazMunayGas since November 2013. She was elected to the Board of Directors of K MG EP on March 26, 2010. Since 2003, she has been First Deputy Chairman of Halyk Bank, and between 2004 and 2006 she was Chairman of the Management Board of Halyk Bank. Between 1998 and 2003, she worked in the national oil and gas company, where she held various executive positions in KazakhOil, KaztransGas, and KazMunayGas. She graduated from Kazakhstan State University’s Faculty of Economics in 1982. In 1987, she graduated with a PhD in Economics from the Moscow Financial Institute.
Philip Dayer Independent Non-Executive Director of K MG EP
Philip Dayer LLB FCA qualifed as a chartered accountant with KPMG and then pursued a 25-year career in investment banking, specialising in consulting for LSE listed companies. He gained extensive experience working for companies such as Barclays de Zoete Wedd and Citicorp. He retired from ABN AMRO Hoare Govett in 2005. He advised Rosneft on its successful placement in 2006. Philip was Chairman of Dana Petroleum’s Audit Committee until it was purchased by KNOC.
Currently, Philip is an Independent non-executive Director and Chairman of the Audit Committee of the Parkmead Group and an independent non-executive director of VTB Capital and Severstal. He served as non-executive director of Navigators Underwriting Agency, IP Plus Plc and Arden Partners Plc. Philip joined the K MG EP Board of Directors in May 2010. He is chairman of the Audit Committee and a member of the Remuneration, Nominations and Strategic Planning Committees, and a member of the Independent Committee under the Board of Directors of the Company.
Edward Walshe Independent Non-Executive Director of K MG EP
Edward Walshe has over 37 years of experience in the oil and gas sector. He has worked in various roles with British Petroleum and British Gas, where he ran overseas exploration and production operations in Nigeria, Abu Dhabi, Central Asia, and South-East Asia. He has a PhD in Solid State Chemistry from the University of Dublin. Edward was elected to the Board of Directors on August 28, 2006. He chairs the Strategic Planning and Nominations Committees, is a member of the Audit and Remuneration Committees and also a member of the Independent Committee under the Board of Directors of the Company.
Alastair Ferguson Independent Non-Executive Director of K MG EP
Alastair Ferguson has 36 years’ experience in the oil and gas sector, mainly in BP. Since 2003 he has been living in Moscow. Between 2003 and 2011 he was employed at TNK-BP as the Executive Vice-President for Gas Business Development. Later he developed his own consultancy to advise clients on the Russian and Ukrainian energy sectors. He is a Senior Advisor to XENON Capital Partners. On January 1, 2015 he was appointed Chairman of the Board of Directors of Zoltav Resources. He has been a member of the K MG EP Board of Directors since October 2013. He chairs the Remuneration Committee, is a member of the Audit and Strategic Planning Committees, and is also a member of the Independent Committee under the Board of Directors of the Company.
Board of Directors
Christopher Hopkinson
Philip Dayer
Edward Walshe Alastair Ferguson
Corporate governance
68 KazMunaiGas Exploration Production JSC Annual Report 2015 69 KazMunaiGas Exploration Production JSC Annual Report 2015Corporate governance

KMG EP is a pioneer among Kazakh companies in applying corporate governance practices in line with international standards. Investor confidence in the Company and its management hinges on the Company’s levels of corporate governance.
KMG EP has developed and put in place an effective system to manage relations between the Board of Directors, the Management Board and Shareholders. This system ensures that the Company continuously seeks the best investment opportunities while at the same time considering the interests of all Shareholders.
Regulation of its relationship with the principal Shareholder is a vital task of the Company’s corporate governance system. An agreement is in place between KMG EP and its parent company NC KazMunayGas (NC KMG) that provides for business independence while at the same time requiring KMG EP to act in the best interests of all its Shareholders.
The Company’s Board includes three independent directors. They play a major role in ensuring that the Company complies with its corporate governance commitments. The independent directors at KMG EP use their experience to balance the inf luence of the principal Shareholder and to closely supervise Management decisions.
The inf luence of the independent directors is bolstered by a legal provision requiring the presence of no less than half of all independent directors for meetings of the Board of Directors to be quorate; their membership and chairmanship on all Board committees; and exclusive voting of the independent directors on issues related to the authorisation of interested- party transactions. This allocation of functions provides a more balanced and effective decision-making process in line with best practices.
Board of Directors of KMGThe governing body of the Company is the Board of Directors and the executive body is the Management Board. The Chief Executive Officer chairs the Management Board and also sits on the Board of Directors and is the sole representative of the executive body on the Board of Directors. Four BoD members, including Board Chairman Christopher Hopkinson, are representatives of JSC NC KazMunayGas. The Board of Directors also includes three independent directors, making a total of eight directors.
Corporate Governance Code ComplianceThis section of the Annual Report has been prepared in compliance with the requirements of the FCA’s (Financial Conduct Authority) Disclosure and Transparency Rules (DTR 7.2) (Corporate Governance Statements).
As an overseas company with GDRs admitted to the Official List of the United Kingdom Listing Authority, the Company is not obliged to comply with the UK Corporate Governance Code. However, in accordance with DTR 7.2 the Company is required to disclose in its Annual Report whether or not it complies with the Corporate Governance Code of the Republic of Kazakhstan and to disclose the actual principles of corporate governance which are applied in addition to the practices observed in accordance with applicable laws of the Republic of Kazakhstan.
Following the adoption of the UK Corporate Governance Code in May 2010 by the Financial Reporting Council, the UK independent corporate governance improvement organisation, the Company updated its Corporate Governance Code in 2012 to comply with the UK Corporate Governance Code, except for separate provisions. Specific information on where the Company’s current governance practices differ from those in the UK Code is set out in the present section of the Annual Report.
The directors recognise the importance of corporate governance and support the development of corporate governance standards in the Company. The Company intends to develop and implement corporate governance practices which impose additional obligations on the Company beyond those required under the legislation of Kazakhstan.
Kazakhstan Corporate Governance Code and the Company’s Corporate Governance CodeCorporate governance best practice in Kazakhstan is set out in the Kazakhstan Corporate Governance Code. This Code is based on best international practice in the area of corporate governance and Recommendations on the Application of Corporate Governance by Kazakhstan Joint Stock Companies, approved by the Securities Market Expert Council of the National Bank of the Republic of Kazakhstan in September 2002. The Code was approved by the Financial Institutions’ Association of Kazakhstan in March 2005, and by the Board of Issuers in February 2005.
The Company has adopted the Kazakhstan Corporate Governance Code as its own code. In 2012 the Company’s Corporate Governance Code was amended in order to also comply with the UK Corporate Governance Code adopted in 2010 (except for some provisions, the information on which is provided in the present section of the Annual Report). The amendments adopted by the Company impose additional obligations on KMG EP in respect of corporate governance to those provided by the Kazakhstan Corporate Governance Code. The Company believes that these additional amendments will significantly improve the corporate governance practices applied by the Company. KMG EP also takes into consideration other provisions of the UK Corporate Governance Code and will seek to improve its corporate governance standards in future.
Additional provisions of the Company’s Corporate Governance Code in addition to the requirements of the legislation of the Republic of Kazakhstan (the Kazakhstan Corporate Governance Code):
• Additional principles of corporate governance were introduced:
– The principle of independent activity of the Company
– The principle of responsibility
• Some of the corporate governance principles were supplemented by various provisions, such as:
– Social policy principles
– Provisions regarding relationships with the Shareholders of the Company
– Division of responsibilities between the Chairman of the Board of Directors and the General Director
– Provisions describing the role of the Chairman of the Board of Directors
– Requirement of a minimum number of independent directors
– Additional provisions governing the criteria for establishing the independence of independent directors
– Provisions on access to information and professional development for directors of the Company
– Provisions governing the principles of directors’ remuneration
– Provisions concerning the treatment of insider information
– Provisions for the responsibility of the Board of Directors to ensure effective risk management systems
– Provisions for the evaluation of the performance of the Chairman and members of the Board of Directors
– Provisions for the appointment/re-appointment of members of the Board of Directors.
A current version of the Company’s Corporate Governance Code is available on the KMG EP website.
During 2015 the Company complied with the provisions of Kazakhstan Corporate Governance Code in all significant aspects.
During 2015 the Company complied with the provisions of its own Corporate Governance Code in all significant aspects, save for the following:
• According to the Corporate Governance Code of the Company, directors should meet without the participation of the Chairman of the Board of the Directors at least once a year to evaluate the performance of the Chairman of the Board of the Directors, and in other cases, if so required.
The Board decided not to conduct an assessment of the activity of the Board in 2015, as such an assessment is planned for 2016. The assessment of the activity of the Board with the assistance of an external consultant is planned for 2017.
• The Corporate Governance Code of the Company provides an obligation for the Board of Directors (together with the internal Audit Committee) to carry out an evaluation of the effectiveness of risk management systems at least once a year.
The Board of Directors does not have a separate risk committee, and the role described above has been allocated to the Audit Committee of the Board of Directors according to the provisions of the committee. More detailed information about the Audit Committee is provided on page 74 of this report.
From the end of 2014 to Q1 2015, an external consultant LLP Ernst & Young – Consulting Services conducted work on the project “Consulting services for the development of risk control systems”. On conclusion of the project, the following were delivered: a Handbook on risk management; statements on Risk Management Committee; policy for risk management and methodologies for the evaluation of investment projects and the consolidation of risks at KMP EP level
Differences between the Company’s Code on corporate governance and the provisions of the UK Corporate Governance CodeBelow are the main differences between the Corporate Governance Code of the Company and the provisions of the UK Corporate Governance Code:
• According to the provisions of the UK Corporate Governance Code the Сhairman should, on appointment, meet the independence criteria set out in the same UK Corporate Governance Code.
The Corporate Governance Code of the Company does not contain provisions on the independence of the Chairman of the Board of Directors, and, according to the opinion of the directors, the Chairman of the Board of Directors would not meet the criteria of independence stated in the respective provisions of the UK Corporate Governance Code or the respective provisions of the Company’s Corporate Governance Code. The Chairman of the Board of Directors represents the major Shareholder.
• According to the UK Corporate Governance Code at least half of the members of the Board of Directors, excluding the Chairman, should be independent non-executive directors.
In contrast, the Corporate Governance Code and the Charter of the Company provide that at least one third of the Board of Directors’ members shall be independent non-executive directors. According to the Charter of the Company a number of key issues including related-party transactions, major transactions, approval of social expenses, and conclusion of subsoil use contracts, require the approval of majority of the independent non-executive directors. The Charter of the Company can be found on the Company’s website.
• The UK Corporate Governance Code also states that the Board of Directors shall appoint one of the independent non-executive directors to be a senior independent non-executive director.
The Company’s Corporate Governance Code does not provide for the appointment of a senior independent director by the Board of Directors, taking the current Shareholder structure into account. The requirement for a senior independent director will be re-evaluated periodically.
• The UK Corporate Governance Code states that non-executive directors should thoroughly scrutinise the performance of management in meeting agreed goals and objectives, and monitor their performance. They should satisfy themselves with the complete integrity of financial information provided and that financial controls and systems of risk management are robust and reliable.
The Company’s Corporate Governance Code imposes such requirements on all members of the Board of Directors.
• The UK Corporate Governance Code provides that the non-executive directors are responsible for determining the appropriate levels of remuneration of the executive directors and have a prime role in appointing and, where necessary removing, executive directors, and in succession planning.
The Company’s Corporate Governance Code places the responsibility for determining the appropriate levels of remuneration of the executive directors on the Remuneration Committee of the Board of Directors. It also provides for the involvement of the Nominations Committee of the Board of Directors in the appointment and removal of executive directors. In practice, the determination of the level of remuneration of the Board of Directors’ members and their appointment is inf luenced by the majority Shareholder.
Corporate governance reportCorporate governance
70 KazMunaiGas Exploration Production JSC Annual Report 2015 71 KazMunaiGas Exploration Production JSC Annual Report 2015Corporate governance

Directors’ responsibility statementIn accordance with the Company’s Corporate Governance Code, the Board of Directors and the Management Board shall be responsible for the accurate presentation of the Company’s Annual Report and Financial Statements.
According to the UKLA’s Disclosure and Transparency Rules, each member of the Board of Directors (see page 68), on the basis of the available information, confirms that:
• The financial statements prepared in accordance with the International Financial Reporting Standards (IFRS) give a true and fair account of the assets, liabilities, financial position, and the results of the financial and economic activities of the Company, and the consolidated balance sheets of the Company and its subsidiaries;
• The Management Board Report includes a fair review of the results of the Company’s financial and economic activities, the financial position of the Company, its joint obligations with its subsidiaries, and a description of the most important risks and uncertainties which the Company faces.
Structure of the Board of DirectorsAs of December 31, 2015 the Board of Directors consisted of the following eight members:
Name Position
Christopher Hopkinson Chairman of the BoardKurmangazy Iskaziyev Member of the Board (CEO)Yerzhan Zhangaulov Member of the BoardAsiya Syrgabekova Member of the BoardIgor Goncharov Member of the BoardPhilip Dayer Independent DirectorEdward Walshe Independent DirectorAlastair Ferguson Independent Director
On April 13, 2015 the Extraordinary General Meeting of Shareholders fixed the size of the Board at eight members for a term of office running from April 13, 2015 to April 13, 2016, inclusive.
The composition of that Board was as follows:
1. Christopher Simon Hopkinson – representing NC KazMunayGas;
2. Kurtwood Stone Hillman – representing NC KazMunayGas;
3. Asiya Narymanovna Syrgabekova – representing NC KazMunayGas;
4. Yerzhan Arystanbekovich Zhangaulov – representing NC KazMunayGas;
5. Abat Akmukanovich Nurseitov – CEO (Chairman of the Management Board of the Company);
6. Philip Dayer – Independent Director;
7. Edward Walshe – Independent Director;
8. Alastair Ferguson – Independent Director.
Responsibilities of the Board and Management BoardThe division of responsibilities between the Board of Directors, the Management Board and the CEO of the Company are determined by the Charter of the Company as set out in Sections 12 and 13.
The powers and responsibilities of the Board of Directors and the Management Board are regulated by the Board of Directors’ Regulations and the Management Board Regulations respectively.
The Board of Directors is responsible to Shareholders for the effective management and proper control of the activities of the Company, and acts in accordance with the approved decision-making system. The most important functions of the Board of Directors are to identify areas of strategic development and Company policy, and to take decisions on potential acquisitions of oil and gas assets, and other significant issues.
Accordingly, the Management Board is responsible for developing an action plan to implement these functions and for the daily operational activities of the Company. The Management Board reports to the Board of Directors on its progress towards achieving the objectives of the Company.
The Board of Directors meets on a regular basis and as necessary.
During 2015, the Board of Directors held 58 meetings, including 14 meetings in person and 44 meetings remotely.
During the year, the Board reviewed, inter alia, the following issues:
• Approval of the Company’s budgets and business plans
• Issues related to exploration
• Environmental, health and safety issues
• Issues related to amendments to subsoil use contracts
• Approval of the Company’s related-party transactions (transactions of JSC Ozenmunaigas and JSC Embamunaigas. More detailed information is given in the consolidated financial statements and in the analysis of the financial standing and results of financial and operating activities) on page 30
• Issues related to the operations of legal entities where the Company holds 10% or more of their shares (share holdings in their issued capital);
• The return of contract areas;
• Determining the salaries and conditions of remuneration and bonuses of the members of the Management Board;
Subsequently, the Board received written notices from two Board Members, Abat Nurseitov and Kurt Hillman, on the basis of which their terms of office were terminated early, on September 7, 2015 and on October 20, 2015 respectively.
In their place an Extraordinary General Meeting of Shareholders held on November 26, 2015 elected Kurmangazy Oryngazievich Iskaziyev to the Board as CEO (Chairman of the Management Board) of the Company and Igor Valerievich Goncharov as a representative of the main Shareholder for the term set for the Board of Directors as a whole, to April 13, 2016.
In accordance with the Company’s Corporate Governance Code, the Board has evaluated the independence of the other directors and believes that Philip Dayer, Edward Walshe, and Alastair Ferguson are independent in character and in their decision-making. The Board of Directors has found no relationships or circumstances which had, or could have, a significant impact on their independent decision-making.
Structure of the Management BoardAs of January 12, 2015 the Board of Directors introduced the following changes to the Management Board:
1. A limit of seven people was set for membership of the Management Board;
2. Aziz Toshkalykovich Ileuov was appointed Managing Director for Business Development for the same term of office of the Management Board as a whole.
Dastan Abdulgafarov, previously Managing Director for Business Development was appointed deputy CEO for economics and finance.
On September 7, 2015 the Board relieved Abat Akmukanovich Nurseitov of his responsibilities as CEO (Chairman of the Management Board).
On September 23, 2015 the Board elected Kurmangazy Oryngazievich Iskaziyev to replace Abat Nurseitov as CEO (Chairman of the Board) of the Company.
Additionally, on December 30, 2015, by mutual agreement Botagoz Ashirbekova, a member of the Management Board of the Company, left the Сompany.
Members of the Management Board as of 31 December 2015
Name Position
Kurmangazy Iskaziyev General Director and Chairman of the Management Board
Kairbek Yeleusinov Deputy General Director for ProductionDastan Abdulgafarov Deputy General Director for Economics
and FinanceMalik Saulebay Managing Director for Legal AffairsAziz Ileuov Managing Director for Corporate Management Shane Drader Financial Director – Financial Controller
• Preliminary approval of the Company’s consolidated financial statements for 2014;
• Introducing proposals on the amount of dividends to be paid for 2014;
• Reviewing the plans and reports of the internal audit department, and the status of implementation of the internal audit department’s recommendations;
• Consideration of the participation of the Sovereign Wealth Fund Samruk-Kazyna and NC KazMunayGas in the process of cash management of the Company;
• The introduction of amendments and additions related to subsoil use contracts;
• Reviewing the structure of the Company’s headquarters organisation and systems.
• Participation in the Programme of transformation and informing the public within the framework of the Charter of transformation of the Exploration and Production business of NC KazMunayGas;
• Strategic initiatives of the Company for 2015-2016;
• Potential projects for the acquisition of oil and gas assets;
• Current trends in oil supply to the domestic market of the Republic of Kazakhstan;
• Risk management.
In 2015, the Board approved the following documents:
• Risk Management Policy of the Company in revised format.
The Independent Committee under the Board of Directors of the Company acted on issues related to the acquisition, redemption, and delisting of shares and other securities listed in Kazakhstan and on foreign stock exchanges whose underlying assets are the Company’s shares.
The Independent Committee is made up exclusively of the three independent directors of the Company: Philip Dayer, Edward Walshe and Alastair Ferguson. In accordance with the terms of reference of the Independent Committee as defined by the Board, consultancy services were purchased from Brunswick, HSBC, Rothschild’s, Linklaters and a Kazakhstan law firm, in connection with the acquisition, buy-back and/or delisting of shares and/or other securities listed on the Kazakhstan and/or foreign stock exchange whose underlying
assets are the shares of the Company.
Corporate governance report continued
Corporate governance
72 KazMunaiGas Exploration Production JSC Annual Report 2015 73 KazMunaiGas Exploration Production JSC Annual Report 2015Corporate governance

Presence of members of the Board of Directors and members of the committees at meetings of the Board of Directors and committees in 2015
BoD Audit CommitteeNominations
CommitteeRemuneration
CommitteeStrategic Planning
Committee
Number of meetings held in 2015 58 15 6 7 4Daniyar Berlibaev 3 – – – –Christopher Hopkinson 55 – 5 – –Abat Nurseitov 40 – – – 3Kurmangazy Iskaziyev 4 – – – –Kurtwood Hillman 32 – – – 3Igor Goncharov 3 – – – –Timur Bimagambetov 14 – – – –Yerzhan Zhangaulov 57 – – – –Asiya Syrgabekova 56 – – – –Alastair Ferguson 58 15 1 7 4Philip Dayer 58 15 6 7 4Edward Walshe 58 15 6 7 4
The Management Board is the executive body and supervises the Company’s current activities. In 2015, some 36 meetings of the Management Board were held on a regular basis and as necessary.
In 2015, the Management Board approved a number of issues connected to the introduction of changes to contracts for subsoil usage. It also considered changes to the organisational structure of the Company, which allowed the Company to make rapid decisions on questions of financial and operational activities.
The Management Board makes decisions on other issues affecting the Company’s operations that are not within the sole competence of the General Meeting of Shareholders, the Board of Directors or other officers of the Company.
Board Committees
Audit Committee Nominations Committee
Remuneration Committee
Strategic Planning Committee
Independent Committee
Philip Dayer Edward Walshe Alastair Ferguson Edward Walshe Philip Dayer
Edward Walshe Philip Dayer Philip Dayer Timur Bimagambetov Edward Walshe
Alastair Ferguson Christopher Hopkinson Edward Walshe Abat Nurseitov Alastair Ferguson
Philip Dayer
Alastair Ferguson
Corporate governance report continued
Responsibilities and duties of the Audit CommitteeThe Audit Committee is responsible, among other things, for any Company report containing financial information, monitoring risk management and internal control systems, and for the involvement of the auditors of the Company in such processes.
It also receives information from the Company’s internal audit department, which monitors compliance with the Company’s internal control procedures. In particular, the Committee deals with issues of compliance with legal requirements, accounting standards, the applicable rules of the UK Listing Authority (UKLA) and of the Kazakhstan Stock Exchange (K ASE), and ensures an effective system of internal control. The Board of Directors is also responsible for preliminary approval of the annual financial report.
The Audit Committee periodically reviews major transactions on acquisitions and disposals, and considers any issues that the Board of Directors may refer to the Audit Committee for review.
Every year at the General Meeting of Shareholders, the Chairman of the Board of Directors reports the results of, and answer questions related to, the activities of the Audit Committee on behalf of the Chairman of the Audit Committee.
Activities of the Audit Committee in 2015In 2015 the Audit Committee held 15 meetings. The Chairman of the Audit Committee decides on the frequency and timing of meetings. The number of meetings is determined in accordance with the performance of duties by the Committee.
At least four meetings per year must be held to coincide with key dates in the preparation cycle of financial reporting and audit of the Company. These key dates mark the completion of preparation of the internal and external auditor’s plans, and of interim financial statements, preliminary announcements and the Annual Report.
In 2015, the Audit Committee reviewed the following issues:
• Financial statements
• Review of issues arising from the preparation of financial statements in accordance with IFRS;
• Approval of quarterly and annual financial statements for presentation to the Kazakhstan Stock Exchange and the London Stock Exchange;
• Approval of press releases in relation to financial statements and operating and financial reviews;
• Internal audit;
• Review and approval of the internal audit department’s operational plan;
• Internal audit team’s staff issues;
• Assessment of the effectiveness of the internal audit;
• Recommendations on the appointment of an external auditor;
• Monitoring of risk management and internal audit systems;
• Forecasts of Company cash f lows;
• Treasury Policy compliance;
• Compliance.
Remuneration CommitteeMembers of the Remuneration CommitteeIn 2015 this committee was exclusively composed of independent directors: Alastair Ferguson (Chairman of the Committee), Philip Dayer and Edward Walshe. The terms of office of the members of the Committee coincide with their terms of office as members of the Board of Directors.
Audit CommitteeMembers of the Audit CommitteeIn 2015 this committee was composed entirely of independent directors, namely: Philip Dayer (Chairman of the Сommittee), Edward Walshe and Alastair Ferguson. Appointments to the Audit Committee are made for a period of up to three years, and can be extended by the Board of Directors for not more than two additional three-year periods, provided that the members of the Audit Committee remain independent.
Corporate governance
74 KazMunaiGas Exploration Production JSC Annual Report 2015 75 KazMunaiGas Exploration Production JSC Annual Report 2015Corporate governance

Responsibilities and duties of the Remuneration CommitteeThe Remuneration Committee is responsible for monitoring the Company’s current system of remuneration for the members of the Board of Directors, CEO, members of the Management Board and other Company employees, including analysis of the remuneration policy in comparison with other companies.
The Remuneration Committee is also responsible for developing and providing recommendations to the Board of Directors on the principles and criteria for determining the amounts and terms of remuneration and compensation of the members of the Board of Directors, CEO and members of the Management Board of the Company, and for approving the terms of the Company’s share option plans and other long-term incentive programmes for Company managers and employees.
The Remuneration Committee oversees the coordination of the Company’s remuneration policy and of the Company’s current remuneration system with the Company’s development strategy, its financial position and with the general state of the labour market.
Nominations CommitteeIn 2015 the members of the Nominations Committee were Edward Walshe (Chairman of the Committee), Philip Dayer and Christopher Hopkinson. Alastair Ferguson, independent director, retired from the Committee following a decision by the Board of Directors dated January 20, 2015, protocol No.4.
The main purpose of the Committee is to increase the efficiency and quality of the Board’s work when selecting candidates to fill positions in the Company. It also undertakes succession planning, and defines the selection criteria for candidates to the Board of Directors as well as for the CEO, the Management Board and Company Secretary positions.
The Nominations Committee considers matters related to changes in the membership of the Board of Directors and Management Board, the termination of office and appointment of the Company Secretary, and the retirement and appointment of additional and alternate directors.
Activities of the Nominations Committee in 2015During 2015 the Nominations Committee held five meetings where the following issues were discussed:
• Recommendations to the Board of Directors on candidates for membership of the Board of Directors;
• Recommendations to the Board of Directors on membership of the Board Committees;
• Recommendations on the early termination of office of the CEO (Chairman of the Management Board) of the Company and the election of a provisional executive;
• Recommendations on the appointment of the new CEO (Chairman of the Management Board) of the Company.
Strategic Planning CommitteeIn 2015 the members of the Strategic Planning Committee were Edward Walshe (Chairman of the Committee), Timur Bimagambetov, Abat Nurseitov, Philip Dayer, and Alastair Ferguson. After the termination of the appointments of Timur Bimagambetov, Abat Nurseitov and Kurtwood Hillman as members of the Board of Directors on December 31, 2015, membership of the Committee was limited to the three independent directors of the Company. The main purpose of the Committee is to develop and provide recommendations to the Board on determining the Company’s priorities and its development strategy.
Name
Annual remuneration
US$ 000s
Physical attendance
US$ 000s
Phone/video conference
US$ 000s
Meetings of independent
directorsUS$ 000s
Chairmanship of committee
US$ 000s
Total for 2015 (excluding taxes)
US$ 000s
Total for 2015 (including taxes)
KZT 000s
Alastair Ferguson 150 80 30 20 15 295 81,264.24Edward Walshe 150 80 30 20 15 295 80,665.31Philip Dayer 150 80 30 20 25 305 82,893.69
Other members of the Board of Directors do not receive remuneration as members of the Board of Directors, but are entitled to reimbursement for costs associated with their appointment.
The total remuneration for members of the Management Board for 2015 was 803,521 thousand tenge.
Activities of the Strategic Planning Committee in 2015In 2015 the Strategic Planning Committee held four meetings where the following issues were discussed:
• The programme of strategic initiatives for 2015-2016 of KazMunaiGas EP (within the framework of the approved strategic development plan of the Company)
• Approval of the corrected corporate key performance indicators of KazMunaiGas EP with target results for 2015;
• Potential projects for the acquisition of oil and gas assets.
Major Shareholders and/or GDR holders
In accordance with the laws of the Republic of Kazakhstan, listed below are the holders of Company securities who own shares as at December 31, 2015, the number of which must be reported. This requirement does not apply to GDR holders. The Company considers it necessary, however, to specify that, on September 30, 2009, the State Investment Fund of the People’s Republic of China, China Investment Corporation (CIC), announced the acquisition of GDRs representing approximately 11% of the shares of the Company.
Shareholder Number of
ordinary sharesNumber of
preference sharesTotal number
of shares placed
Number of shares issued 70,220,935 4,136,107 74,357,042Shares held by JSC NC KazMunayGas 43,087,006 – 43,087,006Percentage of issued share capital 61.36% 0.00% 57.95%
Contracts of directors, letters of appointment of directors and employment contracts of members of the Management BoardAll members of the Management Board have signed employment contracts with the Company under which they are entitled to insurance covering accidents during travel and to reimbursement for costs incurred during business travel in accordance with the Company’s internal regulations.
It is not expected that any other employment agreements will be entered into with members of the Company’s Board of Directors or Management Board members.
Corporate governance report continued
In addition, the Remuneration Committee monitors the implementation of decisions of the General Meeting of Shareholders with respect to the amounts and the procedure for remunerating the Company’s Board of Directors.
The Remuneration Committee reports regularly to the Board of Directors, and annually reviews compliance with its terms of reference and its obligations to provide such information to the Board of Directors.
Activities of the Remuneration Committee in 2015In 2015 the Remuneration Committee held seven meetings. The Committee holds meetings as required, but not less than once every six months. Meetings may be convened by the Committee Chairman, any member of the Committee or by decision of the Board of Directors.
In 2015 the Remuneration Committee reviewed the following issues:
• Determining the level of salaries and the conditions of remuneration and bonuses of the members of the Management Board, employees of the internal audit department, and the Corporate Secretary.
• Issues related to the Option plan.
The total remuneration for the independent directors for the year to December 31, 2015 is listed in the table below:
Corporate governance
76 KazMunaiGas Exploration Production JSC Annual Report 2015 77 KazMunaiGas Exploration Production JSC Annual Report 2015Corporate governance
Risk managementThe Company operates a risk management system. The system is designed to identify, evaluate and manage significant risks to ensure that the Company can achieve its business goals while maintaining and increasing value for the Company’s Shareholders.
The system is based on well established international practices as well as on the requirements of the Listing Rules of the London Stock Exchange and the UK Combined Code of Corporate Governance.
The existing chain of command and interaction between the elements of the internal control system provides for a level of independence necessary for the internal control function to operate effectively, and is in line with international best practice in this area.
In 2015 the Company’s risk management system introduced changes to improve risk management practices. The policy determines overall strategy in the area of risk management and the distribution of roles and responsibilities within the risk management system. It determines the actions of management and all employees directed towards achieving the corporate-wide objectives of the Company.
The Company’s internal audit team provides the Board of Directors with unbiased information about how comprehensive the structure of the internal audit team of the Company actually is and how effectively it operates. In its work, the internal audit team takes a risk-oriented approach which allows it to identify and focus on critically important areas for the Company, thereby helping to improve the Company’s overall performance and the quality of its corporate governance.
The internal audit team also monitors the implementation of recommendations given by Management, and reports on its progress to the Audit Committee and the Board of Directors.
As regards risk management, the Management Board established a Risk Management Committee. For more details on its activities, please see below.
Corporate governance report continued
Risk Management CommitteeThe Risk Management Committee is an advisory and consultative body set up under the Company’s Management Board.
The Committee is made up of members of the Management Board and heads of the main functional departments of the Company.
The main objectives of the Committee are the prompt consideration of risk management issues within the Company, preparation of recommendations for the Management Board to follow on risk management issues, and monitoring the effectiveness of the risk management system.
General information about the Company’s risk profile can be found in the Risk Factors section on pages 56. Information about financial risks can be found in the Notes to the Consolidated Financial Statements, starting on page 87.
Information on taxation in the UKThe overview given below is based on UK law and HM Revenue & Customs practices in force as at the date of the present document, both of which are subject to change, possibly with retrospective effect. Except where otherwise stated, the overview discusses only certain UK tax consequences for absolute beneficial owners of shares or GDRs who are (1) considered to be UK residents for tax purposes; (2) considered to be residents for tax purposes in no other jurisdiction; and (3) not in possession of a permanent establishment in the Republic of Kazakhstan to which the holding of shares or GDRs is related (“the UK Holders”).
In addition, this overview (1) addresses only the tax consequences for the UK Holders who own shares and GDRs as capital assets and it does not address the tax consequences that may apply to certain other categories of the UK Holders, e.g. dealers; (2) assumes that the UK Holders do not, directly or indirectly, control 10% or more of the voting shares of the Company; (3) assumes that a holder of the GDRs is beneficially entitled to the underlying shares and to the dividends on those shares; and (4) does not address the tax consequences for the UK Holders that are insurance companies, investment companies or pension funds.
The following is intended only as a general guide and is not intended to be, nor should be considered to be, legal or tax advice to any particular UK Holders. Accordingly, investors should satisfy themselves with their tax advisors as to the overall tax consequences, including, specifically, the consequences under UK law and HM Revenue & Customs practice, of the acquisition, ownership and disposal of shares or GDRs in their own particular circumstances.
Withholding tax at sourceOn the assumption that income received from GDRs is from a non-UK source for tax purposes, it should not be subject to withholding tax at source in the UK. Dividend payments on shares will not be subject to UK withholding tax at source.
Taxation of dividendsA UK Holder receiving a dividend on shares or GDRs may be subject to UK income tax or corporation tax, as the case may be, on the gross amount of any dividend paid out before the deduction of any Kazakhstan withholding taxes, subject to the availability of any credit for Kazakhstan tax withheld. A UK Holder who is an individual resident and domiciled in the UK will be subject to UK income tax on the dividend paid on shares or GDRs and is entitled to a non-refundable tax credit equal to one ninth of the amount of the dividend received. A UK Holder who is an individual resident but not domiciled in the UK and who is entitled and prefers to be taxed in the UK on a remittance basis will be subject to UK income tax on the dividend paid on shares or GDRs to the extent that the dividend is remitted or treated as remitted to the UK, and will also be entitled to a non-refundable tax credit equal to one ninth of the amount of dividend received.
A UK Holder which is a company residing in the UK for tax purposes is not subject to UK corporate tax on the dividend paid on shares or GDRs, unless certain anti-avoidance rules in the tax law apply.
Taxation of disposals or deemed disposalsThe disposal by a UK Holder of interests in shares or GDRs may result in a chargeable gain or an allowable loss for the purposes of UK taxation of chargeable gains, depending on the UK Holder’s circumstances and subject to any available exemption or relief. A UK Holder who is an individual resident and domiciled in the UK will generally be liable to UK capital gains tax on chargeable gains made on the disposal of an interest in shares or GDRs. A UK Holder who is an individual resident but not domiciled in the UK and who is entitled and prefers to be taxed in the UK on a remittance basis will generally be liable to UK capital gains tax to the extent that the chargeable gains made on the disposal of an interest in the shares or GDRs are remitted or treated as remitted in the UK. In particular, dealings in GDRs on the London Stock Exchange may give rise to remitted profits that would, therefore, give rise to a UK capital gains tax liability.
An individual holder of shares or GDRs who ceases to be a resident or ordinarily resident in the UK for tax purposes for a period of less than five full tax years and who disposes of such shares or GDRs during that period may also be liable on returning to the UK to UK tax on capital gains, even though the individual may not be a resident or ordinarily resident in the UK at the time of the disposal.
A corporate UK Holder will generally be subject to UK corporation tax on any chargeable gains arising from a disposal of shares or GDRs.
Effect of Kazakhstan withholding taxes at sourceDividend payments in respect of shares and GDRs are subject to Kazakhstan withholding tax at source. A UK Holder, who is an individual UK resident, should generally be entitled to a credit for Kazakhstan tax properly withheld from such payments against UK income tax liability on such amounts, subject to UK tax rules for the calculation of such a credit. A UK Holder which is a company is not generally subject to UK corporation tax on dividend payments and thus is usually not able to claim credit for any such Kazakhstan withholding taxes at source.
Stamp duty and stamp duty reserve tax (“SDRT”)Assuming that any document effecting the transfer of, or containing an agreement to transfer, one or more shares or GDRs is neither executed in the UK nor relates to any property located in the UK, or to any matter or thing done or to be done in the UK (which may include the involvement of UK bank accounts in the payment mechanism), then no UK ad valorem stamp duty should be payable on such a document.
Even if the document effecting the transfer of, or containing an agreement to transfer, one or more shares or GDRs is executed in the UK and/or relates to any property located in the UK, or to any matter or thing done or to be done in the UK, in practice it should not be necessary to pay any UK ad valorem stamp duty on this document unless the document is required for any purpose in the UK. If it is necessary to pay UK ad valorem stamp duty, it may also be necessary to pay interest and penalties associated therewith.
As GDRs relate to the securities expressed in a currency other than sterling, no “bearer instrument” stamp duty should be payable on either the issue of the GDRs or any transfer of the securities transferable by means of the GDRs.
Assuming that the shares are neither registered in the UK register nor paired with shares issued by a company incorporated in the UK, no SDRT should be paid in respect of any agreement to transfer shares or GDRs.
Corporate governance
78 KazMunaiGas Exploration Production JSC Annual Report 2015 79 KazMunaiGas Exploration Production JSC Annual Report 2015Corporate governance

82 Independent Auditors’ Report
83 Consolidated Financial Statements
83 Consolidated Statement of Financial Position
84 Consolidated Statement of Comprehensive Income
85 Consolidated Statement of Cash Flows
86 Consolidated Statement of Changes in Equity
87 Notes to the Consolidated Financial Statements
ConsolidatedFinancialStatements
81 KazMunaiGas Exploration Production JSC Annual Report 201580 KazMunaiGas Exploration Production JSC Annual Report 2015Consolidated financial statem
ent

To the shareholders and management of Joint Stock Company KazMunaiGas Exploration Production.
We have audited the accompanying consolidated financial statements of Joint Stock Company KazMunaiGas Exploration Production and its subsidiaries (‘the Company’), which comprise the consolidated statement of financial position as at 31 December 2015 and the consolidated statement of comprehensive income, consolidated statement of changes in equity and consolidated statement of cash f lows for the year then ended, and a summary of significant accounting policies and other explanatory information.
Management’s Responsibility for the Consolidated Financial StatementsManagement is responsible for the preparation and fair presentation of these consolidated financial statements in accordance with International Financial Reporting Standards, and for such internal control as management determines is necessary to enable the preparation of consolidated financial statements that are free from material misstatement, whether due to fraud or error.
Auditors’ ResponsibilityOur responsibility is to express an opinion on these consolidated financial statements based on our audit. We conducted our audit in accordance with International Standards on Auditing. Those standards require that we comply with ethical requirements and plan and perform the audit to obtain reasonable assurance whether the consolidated financial statements are free from material misstatement.
An audit involves performing procedures to obtain audit evidence about the amounts and disclosures in the consolidated financial statements. The procedures selected depend on the auditors’ judgment, including the assessment of the risks of material misstatement of the consolidated financial statements, whether due to fraud or error. In making those risk assessments, the auditor considers internal control relevant to the entity’s preparation and fair presentation of the consolidated financial statements in order to design audit procedures that are appropriate in the circumstances, but not for the purpose of expressing an opinion on the effectiveness of the entity’s internal control. An audit also includes evaluating the appropriateness of accounting policies used and the reasonableness of accounting estimates made by management, as well as evaluating the overall presentation of the consolidated financial statements.
We believe that the audit evidence we have obtained is sufficient and appropriate to provide a basis for our audit opinion.
OpinionIn our opinion, the consolidated financial statements present fairly, in all material respects the financial position of Joint Stock Company KazMunaiGas Exploration Production and its subsidiaries as of 31 December 2015, and their financial performance and their cash f lows for the year then ended in accordance with International Financial Reporting Standards.
Jim DuckerAudit Partner
Evgeny ZhemaletdinovAuditor/General Director Ernst & Young LLP
State Audit License for audit activities on the territory of the Republic of Kazakhstan: series МФЮ-2 No. 0000003 issued by the Ministry of Finance of the Republic of Kazakhstan on 15 July 2005
23 February 2016
Auditor Qualification Certificate No. 0000553 dated 24 December 2003
LLP Ernst & Young Kazakhstan Al-Farabi ave., 77/7 Esentai Tower Almaty, 050060 Republic of Kazakhstan Tel.: +7 (727) 258 59 60 Fax: +7 (727) 258 59 61
NotesAs at December 31,
2015As at December 31,
2014
ASSETSNon-current assetsProperty, plant and equipment 5 234,367 156,436Intangible assets 6 9,619 10,855Investments in joint ventures 8 154,453 95,177Investments in associate 9 154,241 116,054Receivable from a jointly controlled entity 8 21,602 13,808Loans receivable from joint ventures 8 27,941 25,738Other financial assets 7 33,760 18,567Deferred tax asset 20 71,904 84,067VAT recoverable 24 − 42,300Other assets 5,717 15,472Total non-current assets 713,604 578,474Current assetsInventories 10 23,102 26,357Income taxes prepaid 36,225 23,916Taxes prepaid and VAT recoverable 24 16,132 37,831Mineral extraction and rent tax prepaid 6,064 2,581Prepaid expenses 30,135 30,011Trade and other receivables 7 105,443 56,570Receivable from a jointly controlled entity 8 8,822 4,658Loans receivable from joint ventures 8 − 7,692Other financial assets 7 833,912 535,513Cash and cash equivalents 7 237,310 180,245Total current assets 1,297,145 905,374Total assets 2,010,749 1,483,848EQUITYShare capital 11 163,004 163,004Other capital reserves 3,945 2,355Retained earnings 1,311,759 1,098,170Other components of equity 333,141 75,587Total equity 1,811,849 1,339,116LIABILITIESNon-current liabilitiesBorrowings 5,990 4,218Deferred tax liability 20 240 569Provisions 13 45,264 34,929Total non-current liabilities 51,494 39,716Current liabilitiesBorrowings 5,585 3,000Provisions 13 70,010 8,287Income taxes payable 13 15Mineral extraction tax and rent tax payable 22,249 34,200Trade and other payables 49,549 59,514Total current liabilities 147,406 105,016Total liabilities 198,900 144,732Total liabilities and equity 2,010,749 1,483,848
The notes on pages [84 to 111] are an integral part of these consolidated financial statements.
82 KazMunaiGas Exploration Production JSC Annual Report 2015
Consolidated financial statement
Consolidated financial statement
83 KazMunaiGas Exploration Production JSC Annual Report 2015
Independent Auditors’ Report Consolidated Statement of Financial PositionTenge million

Notes
For the year ended December 31,
2015
For the year ended December 31,
2014
Revenue 14 529,812 845,770Share of results of associate and joint ventures 8, 9 (20,062) 60,191Finance income 19 26,094 20,762Total revenue and other income 535,844 926,723Production expenses 15 (225,049) (211,900)Selling, general and administrative expenses 16 (118,601) (102,568)Exploration expenses (1,892) (2,127)Depreciation, depletion and amortization 5, 6 (20,110) (59,485)Taxes other than on income 17 (181,501) (328,211)Allowance for VAT recoverable 24 (46,753) −Impairment of property, plant and equipment 5, 18 (4,358) (256,683)Loss on disposal of property, plant and equipment (260) (4,221)Finance costs 19 (14,999) (8,952)Foreign exchange gain, net 448,869 108,997Profit before tax 371,190 61,573Income tax expense 20 (127,521) (14,535)Profit for the year 243,669 47,038Foreign currency translation difference 257,554 53,078Other comprehensive income for the period to be
reclassified to profit and loss in subsequent periods 257,554 53,078Total comprehensive income for the year, net of tax 501,223 100,116Earnings Per Share – Tenge thousandsBasic and diluted 12 3.57 0.69
The notes on pages [84 to 111] are an integral part of these consolidated financial statements.
Notes
For the year ended December 31,
2015
For the year ended December 31,
2014
Cash f lows from operating activitiesProfit before tax 371,190 61,573Adjustments to add/(deduct) non-cash items Depreciation, depletion and amortization 5, 6 20,110 59,485 Share of results of associate and joint ventures 8, 9 20,062 (60,191) Loss on disposal of property, plant and equipment (PPE) 260 4,221 Impairment of PPE 5, 18 4,358 256,683 Dry well expense on exploration and evaluation assets 6 − 1,263 Recognition of share-based payments 1,598 − Forfeiture of share-based payments (8) (127) Unrealised foreign exchange gain on non-operating activities (424,585) (76,188) Allowance on VAT recoverable 46,753 − Change in provisions 35,993 4,073 Other non-cash income and expense 1,196 247Add finance costs 19 14,999 8,952Deduct finance income 19 (26,094) (20,762)Working capital adjustments Change in other assets 3,676 2,129 Change in inventories 2,841 1,021 Change in taxes prepaid and VAT recoverable 9,888 (12,299) Change in prepaid expenses (123) (7,947) Change in trade and other receivables (34,792) 96,684 Change in trade and other payables (15,330) (8,629) Change in mineral extraction and rent tax payable and prepaid (2,906) (26,570)Income tax paid (99,422) (87,214)Net cash (used)/generated from operating activities (70,336) 196,404Cash f lows from investing activitiesPurchases of PPE (88,174) (132,186)Proceeds from sale of PPE 171 224Purchases of intangible assets (1,901) (2,042)Loans provided to the joint ventures 8 (3,389) (3,895)Dividends received from joint ventures and associate, net of withholding tax 8, 9 13,822 73,945Proceeds from withdrawal of financial assets held to maturity 144,960 23,617Proceeds from sale of other financial assets − 155Repayments of receivable from a jointly controlled entity 6,815 4,866Interest received 14,839 14,654Net cash generated/(used) in investing activities 87,143 (20,662) Cash f lows from financing activitiesRepayment of borrowings (1,241) (1,093) Dividends paid to Company’s shareholders 3, 11 (28,988) (128,995)Net cash used in financing activities (30,229) (130,088) Net change in cash and cash equivalents (13,422) 45,654 Cash and cash equivalents at the beginning of the year 7 180,245 119,036 Net foreign exchange difference on cash and cash equivalents 70,487 15,555Cash and cash equivalents at the end of the year 7 237,310 180,245
The notes on pages [84 to 111] are an integral part of these consolidated financial statements.
84 KazMunaiGas Exploration Production JSC Annual Report 2015
Consolidated financial statement
Consolidated financial statement
85 KazMunaiGas Exploration Production JSC Annual Report 2015
Consolidated Statement of Comprehensive IncomeTenge million
Consolidated Statement of Cash FlowsTenge million
Financial statements

Sharecapital
Treasuryshares
Othercapital
reservesRetained earnings
Foreigncurrency
translationreserve
Totalequity
As at December 31, 2013 263,095 (100,126) 2,482 1,185,815 22,509 1,373,775Profit for the year − − − 47,038 − 47,038Other comprehensive income − − − − 53,078 53,078Total comprehensive income − − − 47,038 53,078 100,116Forfeiture of share-based payments (Note 11) − − (127) − − (127)Exercise of employee options (Note 11) − 35 − − − 35Dividends (Note 11) − − − (134,683) − (134,683)As at December 31, 2014 263,095 (100,091) 2,355 1,098,170 75,587 1,339,116Profit for the year − − − 243,669 − 243,669Other comprehensive income − − − − 257,554 257,554Total comprehensive income − − − 243,669 257,554 501,223Recognition of share-based payments (Note 11) − − 1,598 − − 1,598Forfeiture of share-based payments (Note 11) − − (8) − − (8)Dividends (Note 11) − − − (30,080) − (30,080)As at December 31, 2015 263,095 (100,091) 3,945 1,311,759 333,141 1,811,849
The notes on pages [84 to 111] are an integral part of these consolidated financial statements.
1. Corporate information and principal activitiesKazMunaiGas Exploration Production Joint Stock Company (the ‘Company’) is incorporated in the Republic of Kazakhstan and is engaged in the acquisition, exploration, development, production, processing and export of hydrocarbons with its core operations of oil and gas properties located in the Pre-Caspian and Mangistau basins of western Kazakhstan. The Company’s direct majority shareholder is Joint Stock Company National Company KazMunaiGas (‘NC KMG’ or the ‘Parent Company’), which represents the state’s interests in the Kazakh oil and gas industry and which holds 63.21% of the Company’s outstanding shares as at December 31, 2015 (2014: 63.21%). The Parent Company is 100% owned by Samruk-Kazyna Sovereign Welfare Fund Joint Stock Company (‘Samruk-Kazyna SWF’), which is in turn 100% owned by the government of the Republic of Kazakhstan (the ‘Government’).
The Company conducts its principal operations through the wholly owned subsidiaries JSC ‘Ozenmunaigas’ and JSC ‘Embamunaigas’. In addition the Company has oil and gas interests in the form of other wholly owned subsidiaries, jointly controlled entities, an associate and certain other controlling and non-controlling interests in non-core entities. These consolidated financial statements ref lect the financial position and results of operations of all of the above interests.
2. Summary of significant accounting policiesThe principal accounting policies applied in the preparation of these consolidated financial statements are set out below. These policies have been consistently applied to all the years presented, unless otherwise stated.
2.1 Basis of preparationThese consolidated financial statements have been prepared in accordance with International Financial Reporting Standards (‘IFRS’). The consolidated financial statements have been prepared under the historical cost convention except for financial instruments. These consolidated financial statements are presented in Tenge and all values are rounded to the nearest million unless otherwise stated.
The preparation of financial statements in conformity with IFRS requires the use of certain critical accounting estimates. It also requires management to exercise its judgment in the process of applying the Company’s accounting policies. The areas involving a higher degree of judgment or complexity, or areas where assumptions and estimates are significant to the consolidated financial statements are disclosed in Note 4.
Exchange ratesThe official rate of the Kazakhstan Tenge to the US Dollar at December 31, 2015 and December 31, 2014 was 339.47 and 182.35 Tenge, respectively. Any translation of Tenge amounts to US Dollar or any other hard currency should not be construed as a representation that such Tenge amounts have been, could be or will in the future be converted into hard currency at the exchange rate shown or at any other exchange rate.
Adopted accounting standards and interpretationsThe Company has adopted the following new and amended IFRS during the year, which did not have any material effect on the financial performance or position of the Company:
IAS 19 Defined Benefit Plans: Employee Contributions (Amendments);
Improvements to IFRSs 2010-2012 cycle;Improvements to IFRSs 2011-2013 cycle.
Standards issued but not yet effectiveThe standards and interpretations that are issued but not yet effective up to the date of issuance of the Company’s financial statements listed below, are those that the Company reasonably expects will have an impact on the disclosures, financial position or performance when applied at a future date. The Company intends to adopt these standards and interpretations, if applicable when they become effective (effective for annual periods beginning on or after):
IFRS 9 Financial instruments: classification and measurement (January 1, 2018);
IFRS 15 Revenue from Contracts with Customers (January 1, 2018);
IFRS 11 Accounting for Acquisitions of Interests in Joint Operations (Amendments) (January 1, 2016);
IFRS 14 Regulatory Deferral Accounts (January 1, 2016);IAS 16 and IAS 38 Clarification of Acceptable Methods of
Depreciation and Amortisation (Amendments) (January 1, 2016);
IAS 27 Equity Method in Separate Financial Statements (Amendments) (January 1, 2016);
IAS 1 Disclosure Initiative (Amendments to IAS 1) (1 January, 2016);
IFRS 10, IFRS 12 and IAS2
Investment Entities: Applying the Consolidation Exception (Amendments to IFRS 10, IFRS 12 and IAS 28) (Effective for annual periods beginning on or after 1 January 2016);
Improvements to IFRSs
2012-2014 cycle (January 1, 2016);
IFRS 10 and IAS 28 Sale or Contribution of Assets between an Investor and its Associate or Joint Venture (Amendments) (January 1, 2016).
IFRS 16 Leases (January 1, 2019)
2.2 ConsolidationSubsidiariesSubsidiaries are entities controlled by the Company. The Company controls an entity when it is exposed to, or has rights to, variable returns from its involvement with the entity and has the ability to affect those returns through its control over the entity. The financial statements of subsidiaries are included in the consolidated financial statements from the date that control commences until the date control ceases. Inter-company transactions, balances and unrealised gains on transactions between companies are eliminated. Unrealised losses are also eliminated but considered an impairment indicator of the asset transferred. Accounting policies of subsidiaries are consistent with those of the Company.
86 KazMunaiGas Exploration Production JSC Annual Report 2015
Consolidated financial statement
Financial statements
87 KazMunaiGas Exploration Production JSC Annual Report 2015
Consolidated Statement of Changes in EquityTenge million
Notes to the Consolidated Financial StatementsTenge million unless otherwise stated
Financial statements

2. Summary of significant accounting policies continued2.2 Consolidation continuedInvestment in associate and interests in joint arrangementsThe Company’s investment in its associate and joint ventures are accounted for using the equity method. An associate is an entity in which the Company has significant inf luence. Significant inf luence is the power to participate in the financial and operating policy decisions of the investee, but is not control or joint control over those policies.
The Company is a party to a joint arrangement when it exercises joint control over an arrangement by acting collectively with other parties and decisions about the relevant activities require unanimous consent of the parties sharing control. The joint arrangement is either a joint operation or a joint venture depending on the rights and obligations of the parties to the arrangement.
In relation to interest in joint operations the Company recognises: (i) its assets, including its share of any assets held jointly, (ii) liabilities, including its share of any liabilities incurred jointly, (iii) revenue from the sale of its share of the output arising from the joint operation, (iv) its share of the revenue from the sale of the output by the joint operations, and (v) its expenses, including its share of any expenses incurred jointly.
Under the equity method, the investment in the associate and joint ventures are carried in the statement of financial position at cost plus post acquisition changes in the Company’s share of net assets of the associate and joint ventures.
A joint venture is a type of joint arrangement whereby the parties that have joint control of the arrangement have rights to the net assets of the joint venture.
The Company’s investment in an associate includes purchase price premium identified on acquisition, which is primarily attributable to the value of the licenses based on their proved reserves. The licenses are amortized over the proved developed reserves of the associate and joint ventures using the unit-of-production method.
The consolidated statement of comprehensive income ref lects the share of the results of operations of each associate and joint venture. Where there has been a change recognised directly in the equity of an associate or joint venture, the Company recognises its share of any changes and discloses this, when applicable, in the statement of changes in equity. Unrealised gains and losses resulting from transactions between the Company and its associate are eliminated to the extent of the interest in the associate.
The financial statements of the associate are prepared for the same reporting period as the parent company. Where necessary, adjustments are made to bring the accounting policies in line with those of the Company.
After application of the equity method, the Company determines whether it is necessary to recognise an additional impairment loss on the Company’s investment in its associate or joint ventures. The Company determines at each reporting date whether there is any objective evidence that the investment in the associate or joint venture is impaired. If this is the case the Company calculates the amount of impairment as the difference between the recoverable amount of the associate or joint venture and its carrying value and recognises the amount in the statement of comprehensive income.
Upon loss of significant inf luence over the associate, the Company measures and recognises any retaining investment at its fair value. Any difference between the carrying amount of the associate upon loss of significant inf luence and the fair value of the retaining investment and proceeds from disposal is recognised in the statement of comprehensive income.
Upon loss of joint control and provided the former jointly controlled entity does not become a subsidiary or associate, the Company measures and recognises its remaining investment at its fair value. Any difference between the carrying amount of the former jointly controlled entity upon loss of joint control and the fair value of the remaining investment and proceeds from disposal is recognised in the statement of comprehensive income. When the remaining investment constitutes significant inf luence, it is accounted for as investment in an associate.
2.3 Foreign currency translationThe consolidated financial statements are presented in Kazakhstan Tenge (‘Tenge’), which is the Company’s functional and presentation currency. Each subsidiary, associate and joint venture of the Company determines its own functional currency and items included in the financial statements of each entity are measured using that functional currency. Transactions in foreign currencies are initially recorded at the functional currency rate ruling at the date of the transaction. Monetary assets and liabilities denominated in foreign currencies are retranslated at the functional currency rate of exchange ruling at the reporting date. All differences are taken to the statement of comprehensive income. Non-monetary items measured at fair value in a foreign currency are translated using the exchange rates at the date when the fair value is determined.
The assets and liabilities of foreign operations are translated into Tenge at the rate of exchange ruling at the reporting date and their statements of comprehensive income are translated at the exchange rates at the date of transaction. The exchange differences arising on the translation are recognised in other comprehensive income or loss. On disposal of a foreign entity, the accumulated foreign currency translation reserve relating to that particular foreign operation is recognised in the statement of comprehensive income.
2.4 Oil and natural gas exploration and development expenditure
Exploration license costsExploration license costs are capitalized within intangible assets and amortized on a straight-line basis over the estimated period of exploration. Each property is reviewed on an annual basis to confirm that drilling activity is planned. If no future activity is planned, the remaining balance of the license cost is written off. Upon determination of economically recoverable reserves (‘proved reserves’ or ‘commercial reserves’), amortization ceases and the remaining costs are aggregated with exploration expenditure and held on a field-by-field basis as proved properties awaiting approval within other intangible assets. When development is approved internally, and all licenses and approvals are obtained from the appropriate regulatory bodies, then the relevant expenditure is transferred to property, plant and equipment (oil and natural gas properties).
Exploration expenditureGeological and geophysical exploration costs are charged against income as incurred. Costs directly associated with an exploration well are capitalized within intangible assets (exploration and evaluation assets) until the drilling of the well is complete and the results have been evaluated. These costs include employee remuneration, materials, fuel and energy used, rig costs and payments made to contractors. If hydrocarbons are not found, the exploration expenditure is written off as a dry hole. If hydrocarbons are found and, subject to further appraisal activity, which may include the drilling of further wells (exploration or exploratory-type stratigraphic test wells), are likely to be capable of commercial development then, the costs continue to be carried as an asset.
2. Summary of significant accounting policies continued2.4 Oil and natural gas exploration and
development expenditure continued All such carried costs are subject to technical, commercial and management review at least once a year to confirm the continued intent to develop or otherwise extract value from the discovery. When this is no longer the case, the costs are written off.
When proved reserves of oil and natural gas are determined and development is sanctioned, the relevant expenditure is transferred to property, plant and equipment (oil and natural gas properties).
Development expenditureExpenditure on the construction, installation or completion of infrastructure facilities such as platforms, pipelines and the drilling of development wells, except for expenditure related to development or delineation wells which do not find commercial quantities of hydrocarbons and are written off as dry hole expenditures in the period, is capitalized within property, plant and equipment
2.5 Property, plant and equipmentProperty, plant and equipment are stated at cost less accumulated depreciation, depletion and impairment.
The initial cost of an asset comprises its purchase price or construction cost, any costs directly attributable to bringing the asset into operation and the initial estimate of decommissioning obligation, if any. The purchase price or construction cost is the aggregate amount paid and the fair value of any other consideration given to acquire the asset.
Oil and gas properties are depreciated using a unit-of-production method over proved developed reserves. Certain oil and gas property assets with useful lives less than the remaining life of the fields are depreciated on a straight-line basis over useful lives of 4-15 years.
Other property, plant and equipment principally comprise buildings and machinery and equipment which are depreciated on a straight-line basis over average useful lives of 24 and 7 years, respectively.
The expected useful lives of property, plant and equipment are reviewed on an annual basis and, if necessary, changes in useful lives are accounted for prospectively.
The carrying value of property, plant and equipment is reviewed for impairment whenever events or changes in circumstances indicate the carrying value may not be recoverable.
An item of property, plant and equipment, inclusive of production wells which stop producing commercial quantities of hydrocarbons and are scheduled for abandonment, is derecognised upon disposal or when no future economic benefits are expected to arise from the continued use of the asset. Any gain or loss arising on derecognition of the asset (calculated as the difference between the net disposal proceeds and the carrying amount of the item) is included in the statement of comprehensive income in the period the item is derecognised.
2.6 Impairment of non-financial assetsThe Company assesses assets or groups of assets for impairment whenever events or changes in circumstances indicate that the carrying value of an asset may not be recoverable. Individual assets are grouped for impairment assessment purposes at the lowest level at which there are identifiable cash
f lows that are largely independent of the cash f lows of other groups of assets. If any such indication of impairment exists or when annual impairment testing for an asset group is required, the Company makes an estimate of its recoverable amount. An asset group’s recoverable amount is the higher of its fair value less costs to sell and its value in use. Where the carrying amount of an asset group exceeds its recoverable amount, the asset group is considered impaired and is written down to its recoverable amount. In assessing recoverable value, the estimated future cash f lows are adjusted for the risks specific to the asset group and are discounted to their present value using a discount rate that ref lects current market assessments of the time value of money.
An assessment is made at each reporting date as to whether there is any indication that previously recognised impairment losses may no longer exist or may have decreased. If such indication exists, the recoverable amount is estimated. A previously recognised impairment loss is reversed only if there has been a change in the estimates used to determine the asset’s recoverable amount since the last impairment loss was recognised. If that is the case, the carrying amount of the asset is increased to its recoverable amount. That increased amount cannot exceed the carrying amount that would have been determined, net of depreciation, had no impairment loss been recognised for the asset in prior years. Such reversal is recognised in the statement of comprehensive income.
After such a reversal, the depreciation charge is adjusted in future periods to allocate the asset’s revised carrying amount, less any residual value, on a systematic basis over its remaining useful life.
2.7 Intangible assetsIntangible assets are stated at cost less accumulated amortization and accumulated impairment losses. Intangible assets include capitalized expenditure for exploration and evaluation and other intangible assets, which are mainly comprised of computer software. Intangible assets acquired separately from a business are carried initially at cost. The initial cost is the aggregate amount paid and the fair value of any other consideration given to acquire the asset. Computer software costs have an estimated useful life of 3 to 7 years and are amortized on a straight line basis over this period.
The carrying value of intangible assets is reviewed for impairment whenever events or changes in circumstances indicate the carrying value may not be recoverable.
2.8 Financial assetsFinancial assets within the scope of IAS 39 are classified as financial assets at fair value through the statement of comprehensive income, held to maturity investments, available for sale financial assets, loans and trade and other receivables, as appropriate. When financial assets are recognised initially, they are measured at fair value, plus, in the case of investments not at fair value through the statement of comprehensive income, directly attributable transaction costs.
The Company determines the classification of its financial assets on initial recognition and, where allowed and appropriate, re-evaluates this designation at each financial year end.
All regular way purchases and sales of financial assets are recognised on the trade date, which is the date that the Company commits to purchase or sell the asset. Regular way purchases or sales are purchases or sales of financial assets that require delivery of assets within the period generally established by regulation or convention in the marketplace.
Financial statements
Notes to the Consolidated Financial Statements continued
88 KazMunaiGas Exploration Production JSC Annual Report 2015Financial statem
ents 89 KazMunaiGas Exploration Production JSC Annual Report 2015

2. Summary of significant accounting policies continued2.8 Financial assets continuedHeld to maturity investmentsNon derivative financial assets with fixed or determinable payments and fixed maturities are classified as held to maturity when the Company has the positive intention and ability to hold to maturity. After initial measurement held to maturity investments are measured at amortized cost using the effective interest method.
Trade and other receivablesTrade and other receivables are non-derivative financial assets with fixed or determinable payments that are not quoted in an active market. After initial measurement trade and other receivables are carried at amortized cost using the effective interest method less any allowance for impairment.
Available for sale financial investmentsAvailable for sale financial assets are those non-derivative financial assets that are designated as available for sale or are not classified in any of the other categories. After initial measurement, available for sale financial assets are measured at fair value with unrealized gains or losses recognised in other comprehensive income or loss until the investment is derecognised or determined to be impaired at which time the cumulative reserve is recognised in the statement of comprehensive income.
Fair valueFair value is the price that would be received from sale of an asset or paid to transfer a liability in an orderly transaction between market participants at the measurement date. The fair value measurement is based on the presumption that the transaction to sell the asset or transfer the liability takes place either:
In the principal market for the asset or liability; or•In the absence of a principal market, in the most advantageous market for the •asset or liability.
The principal or the most advantageous market must be accessible to the Company. The fair value of an asset or a liability is measured using the assumptions that market participants would use when pricing the asset or liability, assuming that market participants act in their economic best interest.
A fair value measurement of a non-financial asset takes into account a market participant’s ability to generate economic benefits by using the asset in its highest and best use or by selling it to another market participant that would use the asset in its highest and best use.
The Company uses valuation techniques that are appropriate in the circumstances and for which sufficient data are available to measure fair value, maximizing the use of relevant observable inputs and minimizing the use of unobservable inputs.
All assets and liabilities for which fair value is measured or disclosed in the financial statements are categorized within the fair value hierarchy, described as follows, based on the lowest level input that is significant to the fair value measurement as a whole:
Level 1 − Quoted (unadjusted) market prices in active markets for identical •assets or liabilities;Level 2 − Valuation techniques for which the lowest level input that •is significant to the fair value measurement is directly or indirectly observable;Level 3 − Valuation techniques for which the lowest level input that •is significant to the fair value measurement is unobservable.
For assets and liabilities that are recognised in the financial statements on a recurring basis, the Company determines whether transfers have occurred between Levels in the hierarchy by re-assessing categorization (based on the lowest level input that is significant to the fair value measurement as a whole) at the end of each reporting period.
For the purpose of fair value disclosures, the Company has determined classes of assets and liabilities on the basis of the nature, characteristics and risks of the asset or liability and the level of the fair value hierarchy as explained above.
Impairment of financial assetsThe Company assesses at each reporting date whether a financial asset or group of financial assets is impaired.
Assets carried at amortised costIf there is objective evidence that an impairment loss on assets carried at amortised cost has been incurred, the amount of the loss is measured as the difference between the asset’s carrying amount and the present value of estimated future cash f lows (excluding future expected credit losses that have not been incurred) discounted at the financial asset’s original effective interest rate (i.e. the effective interest rate computed at initial recognition). The carrying amount of the asset is reduced through use of an allowance account. The amount of the loss shall be recognised in the statement of comprehensive income.
If in a subsequent period the amount of the impairment loss decreases and the decrease can be related objectively to an event occurring after the impairment was recognised, the previously recognised impairment loss is reversed, to the extent that the carrying value of the asset does not exceed its amortised cost at the reversal date. Any subsequent reversal of an impairment loss is recognised in the statement of comprehensive income.
In relation to trade receivables, a provision for impairment is made when there is objective evidence (such as the probability of insolvency or significant financial difficulties of the debtor) that the Company will not be able to collect all of the amounts due under the original terms of the invoice. The carrying amount of the receivable is reduced through use of an allowance account. Impaired debts are derecognised when they are assessed as uncollectible.
Available for sale financial investmentsIf an available for sale asset is impaired, an amount comprising the difference between its cost (net of any principal payment and amortization) and its current fair value, less any impairment loss previously recognised in the statement of comprehensive income, is transferred from equity to the statement of comprehensive income. Reversals in respect of equity instruments classified as available for sale are not recognised in the statement of comprehensive income. Reversals of impairment losses on debt instruments are reversed through the statement of comprehensive income, if the increase in fair value of the instrument can be objectively related to an event occurring after the impairment loss was recognised in the statement of comprehensive income.
Derecognition of financial assetsA financial asset (or, where applicable a part of a financial asset or part of a group of similar financial assets) is derecognised when:
the rights to receive cash f lows from the asset have expired;•the Company retains the right to receive cash f lows from the asset, but has •assumed an obligation to pay them in full without material delay to a third party under a ‘pass through’ arrangement; or
2. Summary of significant accounting policies continued2.8 Financial assets continued
the Company has transferred its rights to receive cash f lows from the asset •and either (a) has transferred substantially all the risks and rewards of the asset, or (b) has neither transferred nor retained substantially all the risks and rewards of the asset, but has transferred control of the asset.
2.9 InventoriesInventories are stated at the lower of cost determined on a first-in first-out (‘FIFO’) basis and net realizable value. Cost includes all costs incurred in the normal course of business in bringing each item to its present location and condition. The cost of crude oil is the cost of production, including the appropriate proportion of depreciation, depletion and amortization (‘DD&A’) and overheads based on normal capacity. Net realizable value of crude oil is based on estimated selling price in the ordinary course of business less any costs expected to be incurred to complete the sale. Materials and supplies inventories are carried at amounts that do not exceed the expected amounts recoverable in the normal course of business.
2.10 Value added tax (VAT)The tax authorities permit the settlement of VAT on sales and purchases on a net basis. VAT recoverable represents VAT on domestic purchases net of VAT on domestic sales. Export sales are zero rated. However VAT offset is allowed based on the results of a tax audit carried out by the tax authorities to confirm VAT recoverable.
If the effect of the time value of money is material, long-term VAT recoverable is discounted using a risk-free rate that ref lects, where appropriate, the risks specific to the asset.
2.11 Cash and cash equivalentsCash and cash equivalents include cash on hand, deposits with banks, other short-term highly liquid investments with original maturities of three months or less.
2.12 Share capitalShare capitalOrdinary shares and non-redeemable preference shares with discretionary dividends are both classified as equity. External costs directly attributable to the issue of new shares are shown as a deduction from the proceeds in equity.
Treasury sharesWhere the Company or its subsidiaries purchases the Company’s shares, the consideration paid, including any attributable transaction costs, net of income taxes, is deducted from equity as treasury shares until such time as the shares are cancelled or reissued. No gain or loss is recognised in the statement of comprehensive income on the purchase, sale, issue or cancellation of the Company’s own equity instruments. Where such shares are subsequently sold or reissued, any consideration received is included in equity. Treasury shares are stated at weighted average cost.
DividendsDividends are recognised as a liability and deducted from equity at the reporting date only if they are declared before or on the reporting date. Dividends are disclosed when they are proposed before the reporting date or proposed or declared after the reporting date but before the financial statements are authorised for issue.
Share-based payment transactionsEmployees (including senior executives) of the Company receive remuneration in the form of share-based payment transactions, whereby employees render services as consideration for equity instruments (‘equity-settled transactions’).
In situations where equity instruments are issued and some services received by the entity as consideration cannot be specifically identified, the unidentified goods or services received (or to be received) are measured as the difference between the fair value of the share-based payment transaction and the fair value of any identifiable goods or services received at the grant date. This is then capitalized or expensed as appropriate.
The cost of equity-settled transactions with employees for awards granted on or after July 1, 2007 is measured by reference to the fair value at the date on which they are granted. The fair value is determined by using a Black-Scholes-Merton option pricing model.
The cost of equity-settled transactions is recognised, together with a corresponding increase in equity, over the period in which the service conditions are fulfilled. The cumulative expense recognised for equity-settled transactions at each reporting date until the vesting date ref lects the extent to which the vesting period has expired and the Company’s best estimate of the number of equity instruments that will ultimately vest.
The expense or credit for a period, in the statement of comprehensive income, represents the movement in cumulative expense recognised as at the beginning and end of that period. No expense is recognised for awards that do not ultimately vest.
Where an equity-settled award is cancelled, it is treated as if it vested on the date of cancellation, and any expense not yet recognised for the award is recognised immediately. This includes any award where non-vesting conditions within the control of either the entity or the employee are not met. All cancellations of equity-settled transaction awards are treated equally. Where the share-based award is cancelled on forfeiture any cost previously recognised is reversed through equity.
The dilutive effect of outstanding options is ref lected as additional share dilution in the computation of diluted earnings per share.
2.13 Trade payablesTrade payables are recognised initially at fair value and subsequently measured at amortized cost using the effective interest method.
2.14 ProvisionsProvisions are recognised when the Company has a present obligation (legal or constructive) as a result of a past event, it is probable that an outf low of resources embodying economic benefits will be required to settle the obligation and a reliable estimate can be made of the amount of the obligation. Where the Company expects some or all of a provision to be reimbursed, for example under an insurance contract, the reimbursement is recognised as a separate asset but only when the reimbursement is virtually certain. The expense relating to any provision is presented in the statement of comprehensive income net of any reimbursement. If the effect of the time value of money is material, provisions are discounted using a current rate that ref lects, where appropriate, the risks specific to the liability. Where discounting is used, the increase in the provision due to the passage of time is recognised as a finance cost.
Financial statements
Notes to the Consolidated Financial Statements continued
90 KazMunaiGas Exploration Production JSC Annual Report 2015Financial statem
ents 91 KazMunaiGas Exploration Production JSC Annual Report 2015

2. Summary of significant accounting policies continued2.15 BorrowingsBorrowings are recognised initially at fair value, net of transaction costs incurred. Borrowings are subsequently measured at amortized cost; any difference between the proceeds (net of transaction costs) and the redemption value is recognised in the statement of comprehensive income over the period of the borrowings using the effective interest method. Borrowings are classified as current liabilities unless the Company has an unconditional right to defer settlement of the liability for at least 12 months after the reporting date. Borrowing costs that are directly attributable to the acquisition, construction or production of a qualifying asset are capitalised.
2.16 Employee benefitsThe Company withholds 10% from the salary of its employees as the employees’ contribution to their pension fund. The pension deductions are limited to a maximum of 160,230 Tenge per month in 2015 (2014: 149,745 Tenge per month). Under the current Kazakhstan legislation, employees are responsible for their retirement benefits. Starting from January 1, 2014 the Company is required to contribute an additional 5% of the salary for a majority of its employees to their pension funds.
2.17 Revenue recognitionThe Company sells crude oil under short-term agreements priced by reference to Platt’s index quotations and adjusted for freight, insurance and quality differentials. Title typically passes and revenues are recognised when crude oil is physically placed onboard a vessel or off loaded from the vessel, transferred into pipe or other delivery mechanism depending on the contractually agreed terms.
The Company’s crude oil sale contracts generally specify maximum quantities of crude oil to be delivered over a certain period. Crude oil shipped but not yet delivered to the customer is recorded as inventory in the statement of financial position.
2.18 Income taxesCurrent income tax expense comprises current income tax, excess profit tax and deferred tax.
Current income tax assets and liabilities for the current and prior periods are measured at the amount expected to be recovered from or paid to the taxation authorities. The tax rates and tax laws used to compute the amount are those that are enacted or substantively enacted by the reporting date.
Excess profit tax (EPT) is treated as an income tax and forms part of income tax expense. In accordance with the applicable tax legislation enacted as of January 1, 2009, the Company accrues and pays EPT in respect of each subsurface use contract, at varying rates based on the ratio of aggregate annual income to deductions for the year for a particular subsurface use contract. The ratio of aggregate annual income to deductions in each tax year triggering the application of EPT is 1.25:1. EPT rates are applied to the part of the taxable income (taxable income after corporate income tax and allowable adjustments) related to each subsurface use contract in excess of 25% of the deductions attributable to each contract.
Deferred tax assets and liabilities are calculated in respect of temporary differences using the balance sheet method. Deferred income taxes are provided for all temporary differences arising between the tax bases of assets and liabilities and their carrying values for financial reporting purposes, except where the deferred income tax arises from the initial recognition of goodwill or
of an asset or liability in a transaction that is not a business combination and, at the time of the transaction, affects neither the accounting profit nor taxable profit or loss.
A deferred tax asset is recorded only to the extent that it is probable that taxable profit will be available against which the deductible temporary differences can be utilised. Deferred tax assets and liabilities are measured at tax rates that are expected to apply to the period when the asset is realised or the liability is settled, based on tax rates that have been enacted or substantively enacted at the reporting date.
Deferred income tax is provided on temporary differences arising on investments in subsidiaries, an associate and joint ventures except where the timing of the reversal of the temporary difference can be controlled and it is probable that the temporary difference will not reverse in the foreseeable future.
3. Significant non-cash transactionsDuring the year ended December 31, 2015 the Company excluded from the consolidated statement of cash f lows a non-cash transaction related to the offset of withholding income tax payable against the interest receivable on financial assets in the amount of 1,830 million Tenge (2014: 1,773 million Tenge) and none against dividends received from the associate (2014: 1,499 million Tenge).
4. Significant accounting estimates and judgementsThe preparation of consolidated financial statements in conformity with IFRS requires management to make estimates and assumptions that affect the reported amounts of assets and liabilities and disclosure of contingent assets and liabilities at the date of the consolidated financial statements and the reported amounts of assets, liabilities, revenues and expenses, and the disclosure of contingent assets and liabilities during the reporting period. The most significant estimates are discussed below:
Oil and gas reservesOil and gas reserves are a material factor in the Company’s computation of DD&A. The Company estimates its reserves of oil and gas in accordance with the methodology of the Society of Petroleum Engineers (SPE). In estimating its reserves under SPE methodology, the Company uses long-term planning prices. Using planning prices for estimating proved reserves removes the impact of the volatility inherent in using year end spot prices.
Management believes that long-term planning price assumptions, which are also used by management for their business planning and investment decisions, are more consistent with the long-term nature of the upstream business and provide the most appropriate basis for estimating oil and gas reserves.
All reserve estimates involve some degree of uncertainty. The uncertainty depends chief ly on the amount of reliable geological and engineering data available at the time of the estimate and the interpretation of this data.
The relative degree of uncertainty can be conveyed by placing reserves into one of two principal classifications, either proved or unproved. Proved reserves are more certain to be recovered than unproved reserves and may be further sub-classified as developed and undeveloped to denote progressively increasing uncertainty in their recoverability.
4. Significant accounting estimates and judgements continued Estimates are reviewed and revised annually. Revisions occur due to the evaluation or re-evaluation of already available geological, reservoir or production data, availability of new data, or changes to underlying price assumptions. Reserve estimates may also be revised due to improved recovery projects, changes in production capacity or changes in development strategy. Proved developed reserves are used to calculate the unit of production rates for DD&A. The Company has included in proved reserves only those quantities that are expected to be produced during the approved license period. This is due to the uncertainties surrounding the outcome of renewal procedures, since the renewal is ultimately at the discretion of the Government. An increase in the Company’s license periods and corresponding increase in reported reserves would generally lead to lower DD&A expense and could materially affect earnings and may be an indicator of impairment reversal. A reduction in proved developed reserves will increase DD&A expense (assuming constant production), reduce income and could also result in an immediate write-down of the property’s book value. Given the relatively small number of producing fields, it is possible that any changes in reserve estimates year on year could significantly affect prospective charges for DD&A.
Recoverability of oil and gas assetsThe Company assesses assets or cash-generating units (CGU) for impairment and for reversal of previously impaired amounts whenever events or changes in circumstances indicate that the carrying amount of an asset may not be recoverable or that previously recorded impairment may no longer exist or may have decrease. Where an indicator of impairment or reversal of impairment exists, a formal estimate of the recoverable amount is made, which is considered to be the higher of the fair value less costs to sell and value in use. These assessments require the use of estimates and assumptions such as long-term oil prices, discount, inf lation and foreign exchange rates, future capital requirements, operating performance (including production and sales volumes) that are subject to risk and uncertainty. Where the carrying amount of an asset or CGU exceeds its recoverable amount, the asset/CGU is considered to be impaired and is written down to its recoverable amount. Conversely when the recoverable amount exceeds the carrying amount of a previously impaired asset or CGU the carrying value is increased to the lower of the recoverable amount or the carrying value that would exist if no impairment had been previously made. In assessing recoverable amount the estimated future cash f lows are adjusted for the risks specific to the asset group and are discounted to their present value using a discount rate that ref lects current market assessments of the time value of money and the risks specific to the asset. This recoverable amount is compared to external indicators of fair value before a final judgment with respect to the amount of recoverable value is made. Fair value less costs to sell is identified as the price that would be received to sell the asset in an orderly transaction between market participants.
As at December 31, 2015 the Company carried out a formal assessment of the recoverable amount of JSC ‘Ozenmunaigas’ due to the declining crude oil prices through 2015 and at the start of 2016 and significant changes to assumptions used in the discounted cash f low model (DCF). As a result of this assessment the estimated recoverable amount was in excess of the carrying value of assets. The following significant changes in the underlying assumptions used in the DCF had the most favorable effect on the final result:
the license extension (Note 24);•devaluation of Tenge (Note 2);•discount rate;•budgeted reductions in capital expenditures. •
Brent crude oil price assumptions and KZT/USD exchange rate projections were based on expectations of independent research organizations. Estimated production volumes are based on the Company’s production plan used for the purposes of filing of application for extension of subsoil use contracts. Discount rate is WACC of 10.25%. If these assumptions had been assumed to be 5% lower or higher, the recoverable amount would still be higher than the carrying amount of oil and gas assets at JSC ‘Ozenmunaigas’.
To corroborate the results of management’s estimation of recoverable value the Company carried out the independent valuation of JSC ‘Ozenmunaigas’ assets. In addition the Company reviewed and compared valuation to that of other peer group Companies. Management has determined that it will not reverse any previously recorded impairment at December 31, 2015 as the variation of results from different sensitivities in the DCF and other valuation approaches are significant. Most material amongst these are the forecasts for future oil prices, KZT to USD exchange rate, level of Kazakhstani inf lation, the Company’s ability to control operating and capital expenditures and the current market capitalization.
Asset retirement obligationsUnder the terms of certain contracts, legislation and regulations the Company has legal obligations to dismantle and remove tangible assets and restore the land at each production site. Specifically, the Company’s obligation relates to the ongoing closure of all non-productive wells and final closure activities such as removal of pipes, buildings and recultivation of the contract territories. Since the license terms cannot be extended at the discretion of the Company, the settlement date of the final closure obligations has been assumed to be the end of each license period.
If the asset retirement obligations were to be settled at the end of the economic life of the properties, the recorded obligation would increase significantly due to the inclusion of all abandonment and closure costs. The extent of the Company’s obligations to finance the abandonment of wells and for final closure costs depends on the terms of the respective contracts and current legislation. Where neither contracts nor legislation include an unambiguous obligation to undertake or finance such final abandonment and closure costs at the end of the license term, no liability has been recognised. There is some uncertainty and significant judgment involved in making such a determination. Management’s assessment of the presence or absence of such obligations could change with shifts in policies and practices of the Government or in the local industry practice. The Company calculates asset retirement obligations separately for each contract.
The amount of the obligation is the present value of the estimated expenditures expected to be required to settle the obligation adjusted for expected inf lation and discounted using average long-term risk-free interest rates for emerging market sovereign debt adjusted for risks specific to the Kazakhstan market.
The Company reviews site restoration provisions at each reporting date, and adjusts them to ref lect the current best estimate in accordance with IFRIC 1 Changes in Existing Decommissioning, Restoration and Similar Liabilities.
Estimating the future closure costs involves significant estimates and judgments by management. Most of these obligations are several years in the future and, in addition to ambiguities in the legal requirements, the Company’s estimate can be affected by changes in asset removal technologies, costs and industry practice. Approximately 19.07% and 16.60% of the provision at December 31, 2015 and 2014 relates to final closure costs. The Company estimates future well abandonment cost using current year prices and the average long-term inf lation rate.
Financial statements
Notes to the Consolidated Financial Statements continued
92 KazMunaiGas Exploration Production JSC Annual Report 2015Financial statem
ents 93 KazMunaiGas Exploration Production JSC Annual Report 2015

4. Significant accounting estimates and judgements continuedThe long-term inf lation and discount rates used to determine the carrying value of obligation at December 31, 2015 were 5.0% and 7.9% respectively (2014: 5.0% and 7.9%). Movements in the provision for asset retirement obligations are disclosed in Note 13.
Environmental remediationThe Company also makes judgments and estimates in establishing provisions for environmental remediation obligations. Environmental expenditures are capitalized or expensed depending upon their future economic benefit. Expenditures that relate to an existing condition caused by past operations and do not have a future economic benefit are expensed.
Liabilities are determined based on current information about costs and expected plans for remediation and are recorded on a discounted basis based on management’s expectations with regard to timing of the procedures required. The Company’s environmental remediation provision represents management’s best estimate based on an independent assessment of the anticipated expenditure necessary for the Company to remain in compliance with the current regulatory regime in Kazakhstan.
Further uncertainties related to environmental remediation obligations are detailed in Note 24. Movements in the provision for environmental remediation obligations are disclosed in Note 13.
TaxationDeferred tax is calculated with respect to both corporate income tax (‘CIT’) and excess profit tax (‘EPT’). Deferred CIT and EPT are calculated on temporary differences for assets and liabilities allocated to contracts for subsoil use at the expected rates. Both deferred CIT and EPT bases are calculated under the terms of the tax legislation enacted in the tax code disclosed in Note 20. Further uncertainties related to taxation are detailed in Note 24.
5. Property, plant and equipment
Oil and gasproperties
Other assets
Constructionwork-in-progress Total
Net book amount at January 1, 2014 266,210 55,756 28,709 350,675Additions 178 2,673 123,188 126,039Change in ARO estimate 203 − − 203Disposals (4,182) (1,083) (1,025) (6,290)Transfers from construction-in-progress 107,950 13,027 (120,977) −Internal transfers (48) 25 23 −Depreciation charge (52,320) (5,188) − (57,508)Impairment (Note 18) (222,330) (16,451) (17,902) (256,683)Net book amount at December 31, 2014 95,661 48,759 12,016 156,436Additions 326 2,919 93,055 96,300Change in ARO estimate 5,451 − − 5,451Disposals (353) (583) (206) (1,142)Transfers from construction-in-progress 84,782 4,054 (88,836) −Internal transfers 2,641 (2,567) (74) −Depreciation charge (14,124) (4,196) − (18,320)Impairment (Note 18) − (3,614) (744) (4,358)Net book amount at December 31, 2015 174,384 44,772 15,211 234,367At December 31, 2015Cost 840,027 117,635 25,670 983,332Accumulated depreciation (319,434) (31,679) − (351,113)Accumulated impairment (346,209) (41,184) (10,459) (397,852)Net book amount 174,384 44,772 15,211 234,367At December 31, 2014Cost 749,948 114,640 29,493 894,081Accumulated depreciation (309,629) (28,550) − (338,179)Accumulated impairment (344,658) (37,331) (17,477) (399,466)Net book amount 95,661 48,759 12,016 156,436
6. Intangible assetsExploration and
evaluationassets
Other intangibles Total
Net book amount at January 1, 2014 8,412 3,652 12,064Additions 1,440 624 2,064Dry well write-off (1,263) − (1,263)Disposals (17) (16) (33)Amortization charge (982) (995) (1,977)Net book amount at December 31, 2014 7,590 3,265 10,855Additions 1,596 492 2,088Disposals (1,345) (164) (1,509)Amortization charge (738) (1,052) (1,790)Impairment − (25) (25)Net book amount at December 31, 2015 7,103 2,516 9,619At December 31, 2015Cost 47,248 8,485 55,733Accumulated amortization (23,480) (5,841) (29,321)Accumulated impairment (16,665) (128) (16,793)Net book amount 7,103 2,516 9,619At December 31, 2014Cost 41,897 9,271 51,168Accumulated amortization (22,075) (5,933) (28,008)Accumulated impairment (12,232) (73) (12,305)Net book amount 7,590 3,265 10,855
7. Financial assetsOther financial assets 2015 2014
US dollar denominated held to maturity deposits 31,680 16,848Tenge denominated held to maturity deposits 2,077 1,717Other 3 2Total non-current 33,760 18,567US dollar denominated term deposits 831,122 525,277Tenge denominated term deposits − 8,632Great Britain pound denominated term deposits 2,790 1,571Euro denominated term deposits − 33Total current 833,912 535,513
867,672 554,080
The weighted average interest rate on US dollar denominated term deposits in 2015 was 3.1% (2014: 1.9%). The weighted average interest rate on Tenge denominated term deposits in 2015 was 12.7% (2014: 7.9%).
Trade and other receivables 2015 2014
Trade receivables 93,027 56,633Dividend receivables 12,730 −Other 852 1,022Allowance for doubtful receivables (1,166) (1,085)
105,443 56,570
Financial statements
Notes to the Consolidated Financial Statements continued
94 KazMunaiGas Exploration Production JSC Annual Report 2015Financial statem
ents 95 KazMunaiGas Exploration Production JSC Annual Report 2015
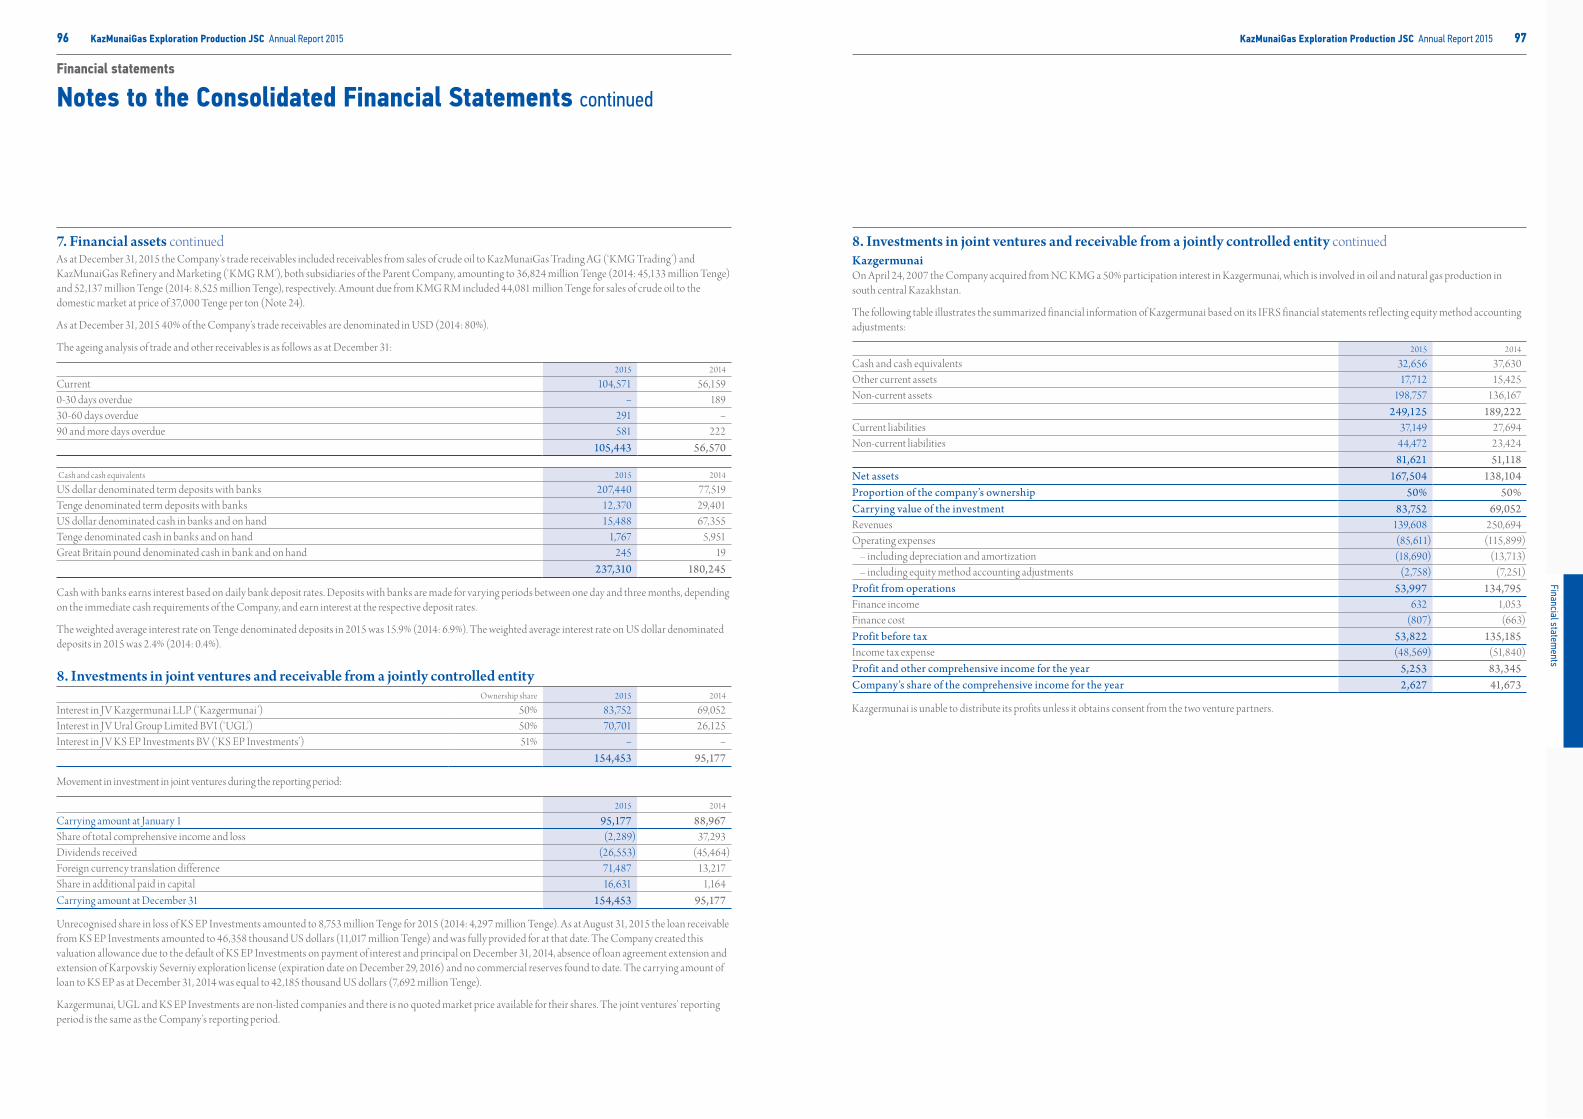
7. Financial assets continuedAs at December 31, 2015 the Company’s trade receivables included receivables from sales of crude oil to KazMunaiGas Trading AG (‘KMG Trading’) and KazMunaiGas Refinery and Marketing (‘KMG RM’), both subsidiaries of the Parent Company, amounting to 36,824 million Tenge (2014: 45,133 million Tenge) and 52,137 million Tenge (2014: 8,525 million Tenge), respectively. Amount due from KMG RM included 44,081 million Tenge for sales of crude oil to the domestic market at price of 37,000 Tenge per ton (Note 24).
As at December 31, 2015 40% of the Company’s trade receivables are denominated in USD (2014: 80%).
The ageing analysis of trade and other receivables is as follows as at December 31:
2015 2014
Current 104,571 56,1590-30 days overdue − 18930-60 days overdue 291 −90 and more days overdue 581 222
105,443 56,570
Cash and cash equivalents 2015 2014
US dollar denominated term deposits with banks 207,440 77,519Tenge denominated term deposits with banks 12,370 29,401US dollar denominated cash in banks and on hand 15,488 67,355Tenge denominated cash in banks and on hand 1,767 5,951Great Britain pound denominated cash in bank and on hand 245 19
237,310 180,245
Cash with banks earns interest based on daily bank deposit rates. Deposits with banks are made for varying periods between one day and three months, depending on the immediate cash requirements of the Company, and earn interest at the respective deposit rates.
The weighted average interest rate on Tenge denominated deposits in 2015 was 15.9% (2014: 6.9%). The weighted average interest rate on US dollar denominated deposits in 2015 was 2.4% (2014: 0.4%).
8. Investments in joint ventures and receivable from a jointly controlled entityOwnership share 2015 2014
Interest in JV Kazgermunai LLP (‘Kazgermunai’) 50% 83,752 69,052Interest in JV Ural Group Limited BVI (‘UGL’) 50% 70,701 26,125Interest in JV KS EP Investments BV (‘KS EP Investments’) 51% − −
154,453 95,177
Movement in investment in joint ventures during the reporting period:
2015 2014
Carrying amount at January 1 95,177 88,967Share of total comprehensive income and loss (2,289) 37,293Dividends received (26,553) (45,464)Foreign currency translation difference 71,487 13,217Share in additional paid in capital 16,631 1,164Carrying amount at December 31 154,453 95,177
Unrecognised share in loss of KS EP Investments amounted to 8,753 million Tenge for 2015 (2014: 4,297 million Tenge). As at August 31, 2015 the loan receivable from KS EP Investments amounted to 46,358 thousand US dollars (11,017 million Tenge) and was fully provided for at that date. The Company created this valuation allowance due to the default of KS EP Investments on payment of interest and principal on December 31, 2014, absence of loan agreement extension and extension of Karpovskiy Severniy exploration license (expiration date on December 29, 2016) and no commercial reserves found to date. The carrying amount of loan to KS EP as at December 31, 2014 was equal to 42,185 thousand US dollars (7,692 million Tenge).
Kazgermunai, UGL and KS EP Investments are non-listed companies and there is no quoted market price available for their shares. The joint ventures’ reporting period is the same as the Company’s reporting period.
8. Investments in joint ventures and receivable from a jointly controlled entity continuedKazgermunaiOn April 24, 2007 the Company acquired from NC KMG a 50% participation interest in Kazgermunai, which is involved in oil and natural gas production in south central Kazakhstan.
The following table illustrates the summarized financial information of Kazgermunai based on its IFRS financial statements ref lecting equity method accounting adjustments:
2015 2014
Cash and cash equivalents 32,656 37,630Other current assets 17,712 15,425 Non-current assets 198,757 136,167
249,125 189,222 Current liabilities 37,149 27,694Non-current liabilities 44,472 23,424
81,621 51,118Net assets 167,504 138,104Proportion of the company’s ownership 50% 50%Carrying value of the investment 83,752 69,052Revenues 139,608 250,694Operating expenses (85,611) (115,899) – including depreciation and amortization (18,690) (13,713) – including equity method accounting adjustments (2,758) (7,251)Profit from operations 53,997 134,795Finance income 632 1,053Finance cost (807) (663)Profit before tax 53,822 135,185Income tax expense (48,569) (51,840)Profit and other comprehensive income for the year 5,253 83,345Company’s share of the comprehensive income for the year 2,627 41,673
Kazgermunai is unable to distribute its profits unless it obtains consent from the two venture partners.
Financial statements
Notes to the Consolidated Financial Statements continued
96 KazMunaiGas Exploration Production JSC Annual Report 2015Financial statem
ents 97 KazMunaiGas Exploration Production JSC Annual Report 2015

8. Investments in joint ventures and receivable from a jointly controlled entity continuedUGLOn April 15, 2011 the Company acquired from Exploration Venture Limited (EVL) 50% of the common shares of UGL. UGL holds 100% equity interest in Ural Oil and Gas LLP (UOG), which is involved in oil and gas exploration in west Kazakhstan. In April 2015 UOG transferred to a production license from an exploration license for the Rozhkovskoye field. The production license is valid for 25 years.
The following table illustrates the summarized financial information of UGL ref lecting equity method accounting adjustments:
2015 2014
Cash and cash equivalents 921 214Other current assets 54 17 Non-current assets 207,323 105,155
208,298 105,386 Current liabilities 3,118 515Non-current financial liabilities 53,901 49,942Non-current liabilities 9,877 2,680
66,896 53,137Net assets 141,402 52,249Proportion of the company’s ownership 50% 50%Carrying value of the investment 70,701 26,125Revenues 16 88Operating expenses (8,787) (1,920)Loss from operations (8,771) (1,832)Finance income 11 8Finance cost (1,079) (613)Loss before tax (9,839) (2,437)Income tax benefit/(expense) 8 (17)Loss and other comprehensive loss for the year (9,831) (2,454)Company’s share of the comprehensive loss for the year (4,916) (1,227)
During 2015 the Company provided interest free loans in the amount of 15,250 thousand US dollars (3,389 million Tenge) to UGL (2014: 6,100 thousand US dollars or 1,093 million Tenge). On initial recognition the loans were recognised at the fair value of 4,478 thousand US dollars (995 million Tenge) determined by discounting future cash f lows. Investments in UGL were adjusted accordingly to recognize effect of discounting.
During 2015 the Company reviewed its expectations with respect to the repayment of the loans from UGL. As a result of the review the payback period of the loans was extended to 2020-2024 from 2015-2018. This extension resulted in a decrease of the carrying amount of these loans by 14,174 million Tenge. Carrying value of the loans from UGL totaled 82,309 thousand US dollars (27,941 million Tenge) at December 31, 2015 (2014: 141,149 thousand US dollars or 25,738 million Tenge).
The fair value on initial and additional shareholder loans, which are given on an interest free basis, is determined by discounting future cash f lows for the loan using a discount rate of 15%.
Receivable from jointly controlled entity CITIC Canada Energy Limited (‘CCEL’)In 2007 the Company purchased a 50% interest in a jointly controlled entity, CCEL, whose investments are involved in oil and natural gas production in western Kazakhstan, from its co-investor, State Alliance Holdings Limited, a holding company ultimately belonging to CITIC Group, a company listed on the Hong Kong Stock Exchange.
CCEL is contractually obliged to declare dividends on an annual basis based on available distributable equity. At the same time, for the period until 2020 the Company is contractually obliged to transfer any dividends received from CCEL, in excess of a Guaranteed Amount, to CITIC, up to the Total Maximum Amount, which amounts to 515.5 million US dollars (174,994 million Tenge) as at December 31, 2015 (2014: 509.5 million US dollars or 92,912 million Tenge). The Total Maximum Amount represents the balance of the Company’s share of the original purchase price funded by CITIC plus accrued interest. The Company has no obligation to pay amounts to CITIC unless it receives an equivalent amount from CCEL. Accordingly, the Company recognizes in its statement of financial position only the right to receive dividends from CCEL in the Guaranteed Amount on an annual basis until 2020, plus the right to retain any dividends in excess of the total Maximum Guaranteed Amount. The carrying amount of this receivable at December 31, 2015 amounted to 89.3 million US dollars (30,314 million Tenge) (2014: 100.5 million US dollars or 18,331 million Tenge) net of unamortized transaction costs.
8. Investments in joint ventures and receivable from a jointly controlled entity continuedAdditionally, the Company has the right, subject to certain conditions precedent, to exercise a put option and return the investment to CITIC in exchange for 150 million US dollars plus annual interest of 8% less the cumulative amount of the guaranteed payments received.
On November 17, 2008, the annual Guaranteed Amount has been increased from 26.2 million US dollars to 26.9 million US dollars, payable in two equal installments not later than June 12 and December 12 of each year. After the above amendment the effective interest rate on the receivable from CCEL is 15% per annum.
9. Investments in associateOwnership share 2015 2014
Interest in Petrokazakhstan Inc. (‘PKI’) 33% 154,241 116,054
PKI is a non-listed company and there is no quoted market price available for its shares. PKI is involved in field exploration, and development, oil and gas production, acquisition of oil fields and selling of crude oil and oil products. PKI’s main oil and natural gas production assets are located in south central Kazakhstan. The Company acquired a 33 percent stake in PKI in December 2009.
The associate’s reporting period of the financial statements is the same as Company’s reporting period.
Movement in investment in associate during the reporting period:
2015 2014
Carrying amount at January 1 116,054 107,095Share of the total comprehensive (loss)/income (40,467) 18,738Dividends received − (29,981)Foreign currency translation difference 78,654 20,202 Carrying amount at December 31 154,241 116,054
The following table illustrates the summarized financial information of PKI, based on its IFRS financial statements, and reconciliation with the Company’s carrying value of investment:
2015 2014
Cash and cash equivalents 48,568 23,371Other current assets 78,268 73,831Non-current assets 556,382 416,493
683,218 513,695 Current liabilities 132,525 86,751Non-current liabilities 83,297 75,266
215,822 162,017 Net assets 467,396 351,678Proportion of the company’s ownership 33% 33%Carrying value of the investment 154,241 116,054Revenues 127,768 263,445Operating expenses (158,803) (174,633) – including depreciation and amortization (38,348) (36,002) – including equity method accounting adjustments (22,082) (17,273)(Loss)/profit from operations (31,035) 88,812Share in (loss)/profit of joint ventures (12,909) 32,527Finance income 234 690Finance cost (6,050) (4,065)(Loss)/profit before tax (49,760) 117,964Income tax expense (4,098) (52,100)(Loss)/profit for the year (53,858) 65,864Other comprehensive loss (68,770) (9,084)Total comprehensive (loss)/income for the year (122,628) 56,780Company’s share of the comprehensive (loss)/income for the year (40,467) 18,738
Financial statements
Notes to the Consolidated Financial Statements continued
98 KazMunaiGas Exploration Production JSC Annual Report 2015Financial statem
ents 99 KazMunaiGas Exploration Production JSC Annual Report 2015

10. Inventories2015 2014
Crude oil 9,218 12,574Materials 13,884 13,783
23,102 26,357
As at December 31, 2015 the Company had 266,022 tons (2014: 324,311 tons) of crude oil in storage and transit.
11. Share capitalShares outstanding
Number of shares Tenge million
As at January 1, 2014 68,159,309 162,969Reduction of treasury stock due to exercise of share options 3,326 35As at December 31, 2014 68,162,635 163,004Reduction of treasury stock due to exercise of share options − −As at December 31, 2015 68,162,635 163,004
11.1 Share capitalAuthorized sharesThe total number of authorized shares is 74,357,042 (2014: 74,357,042). 70,220,935 of authorized shares are ordinary shares (2014: 70,220,935) and 4,136,107 are non-redeemable preference shares (2014: 4,136,107). 43,087,006 of the outstanding shares are owned by the Parent Company as at December 31, 2015 (2014: 43,087,006). The shares of the Company have no par value.
DividendsIn accordance with Kazakhstan legislation, dividends may not be declared if the Company has negative equity in its Kazakh statutory financial statements or if the payment of dividends would result in negative equity in the statutory financial statements. Total dividends per share recognised as distributions to equity holders during 2015 amounted to 440 Tenge per share (2014: 1,976 Tenge per share) for both the outstanding ordinary and preferred shares as at June 1, 2015, the date of record.
11.2 Employee share option plansThe expense recognised for share option plans related to employee services received during the year is 1,598 million Tenge (2014: nil).
Employee option plansUnder the employee option plan 1 (‘EOP 1’), an award of global depositary receipt (‘GDR’) options with an exercise price equal to the market value of GDRs at the time of award was made to executives. The exercise of options is not subject to performance conditions and vests 1/3 each year over 3 years and is exercisable till the fifth anniversary from the vesting date.
Under the employee option plan 2 (‘EOP 2’), share options are granted to incentivize and reward key employees, senior executives and members of the Board of Directors of the Company, except for independent directors. The exercise price of the options is equal to the market price of GDRs on the date of grant. The exercise of these options is not subject to the attainment of performance conditions. Options granted on or after July 1, 2007 vest on the third anniversary of the date of the grant and are exercisable till the fifth anniversary from the vesting date.
Under the employee option plan 3 (‘EOP 3’) GDR options are granted to key employees and senior executives of the Company. The exercise price of the options is equal to zero. Options were granted on December 25, 2015, vested on December 31, 2015 and are exercisable before December 31, 2020.
11. Share capital continued11.2 Employee share option plans continuedMovement in the yearThe following table illustrates the number of GDR’s (No.) and weighted average exercise prices in US dollars per GDR (WAEP) of and movements in share options during the year:
2015 2014No. WAEP No. WAEP
Outstanding at January 1 1,136,523 19.54 1,354,307 19.61Granted during the year 677,231 − − −Exercised during the year − − (19,954) 14.16Forfeited during the year (78,214) 17.79 (197,830) 20.51Expired during the year (177,980) 26.47 − −Outstanding at December 31 1,557,560 10.34 1,136,523 19.54Exercisable at December 31 1,557,560 10.34 1,136,523 19.54
The weighted average remaining contractual life for share options outstanding as at December 31, 2015 is 3.46 years (2014: 2.87 years). The range of exercise price for options outstanding at December 31, 2015 was 0.00 US Dollars − 26.10 US dollars per GDR (2014: 13.00 US Dollars − 26.47 US Dollars). The EOP 1, EOP 2 and EOP 3 are equity settled plans and the fair value is measured at the grant date.
11.3 Kazakhstan Stock Exchange disclosure requirementThe Kazakhstan Stock Exchange enacted on October 11, 2010 a requirement for disclosure of the total equity less other intangible assets (Note 6) per shares outstanding as at year end. As at December 31, 2015 the amount per share outstanding is 26,544 Tenge (December 31, 2014: 19,598 Tenge).
12. Earnings per share2015 2014
Weighted average number of all shares outstanding 68,162,635 68,160,405Profit for the year 243,669 47,038Basic and diluted earnings per share 3.57 0.69
The above presentation includes both ordinary and preferred shares as preferred shareholders equally share distributable profits, which results in identical earnings per share for both classes of shares.
Financial statements
Notes to the Consolidated Financial Statements continued
100 KazMunaiGas Exploration Production JSC Annual Report 2015Financial statem
ents 101 KazMunaiGas Exploration Production JSC Annual Report 2015

13. Provisions
Environmentalremediation
Taxes andrelated
fines andpenalties
Assetretirementobligation Other Total
At January 1, 2014 17,520 14,625 16,195 5,930 54,270Additional provisions − 1,481 422 2,928 4,831Unused amounts reversed − − (64) − (64) Unwinding of discount 1,097 − 1,268 − 2,365Changes in estimate 1,110 − (284) − 826Used during the year (2,277) (15,174) (924) (637) (19,012)At December 31, 2014 17,450 932 16,613 8,221 43,216Current portion 5,912 932 502 941 8,287Non-current portion 11,538 − 16,111 7,280 34,929
Additional provisions − 60,086 165 9,049 69,300Unwinding of discount 1,267 − 1,317 − 2,584Changes in estimate 127 − 3,599 − 3,726Used during the year (1,234) (932) (372) (1,014) (3,552)At December 31, 2015 17,610 60,086 21,322 16,256 115,274Current portion 8,270 60,086 556 1,098 70,010Non-current portion 9,340 − 20,766 15,158 45,264
As at December 31, 2015 tax provision includes 32,240 million Tenge related to the 2009-2012 Comprehensive Tax audit comprising of 16,125 million Tenge of principal and 16,115 million Tenge of fines and penalties. In addition, the Company has undertaken a review of its tax accounts from the period covered by the audit to the date of these financial statements and has made an additional provision of 27,846 million Tenge for amounts that are believed to be more likely than not to be ultimately paid. This amount comprises of 22,380 million Tenge of principal and 5,466 million of penalties. The Company’s management believes its interpretations of the tax legislation are appropriate and that the Company has justifiable arguments for its tax positions, but in light of the current environment (Note 24) and recent court outcomes management has modified its estimate as to the ultimate amount of tax charges.
14. Revenue2015 2014
Export: Crude oil 364,484 706,940 Gas products 891 2,586Domestic (Note 24): Crude oil 145,285 109,169 Gas products 6,498 10,993 Refined products 1,394 2,863Other sales and services 11,260 13,219
529,812 845,770
15. Production expenses2015 2014
Employee benefits 153,928 130,367Repairs and maintenance 20,206 26,781Energy 18,389 16,706Materials and supplies 18,357 20,050Transportation services 5,345 5,875Change in crude oil balance 3,356 1,373Processing expenses 1,109 1,205Change in estimate of environmental remediation obligation (Note 13) 127 1,110Decrease in asset retirement obligation in excess of capitalized asset (1,686) –Other 5,918 8,433 225,049 211,900
16. Selling, general and administrative expenses2015 2014
Transportation expenses 66,637 68,687Fines and penalties (Note 13) 24,737 3,592Employee benefits 19,364 16,758Consulting and audit services 1,889 2,188Repairs and maintenance 1,026 1,023Sponsorship 726 933Management fees and commissions − 4,451Other 4,222 4,936 118,601 102,568
17. Taxes other than on income2015 2014
Mineral extraction tax 67,160 89,840Export customs duty 65,588 74,227Rent tax 39,838 151,861Property tax 6,265 6,204Other taxes 2,650 6,079 181,501 328,211
18. Impairment of property, plant and equipment2015 2014
Impairment of oil and gas assets (Notes 4, 5) − 255,375Social objects impairment 4,358 942Other − 366
4,358 256,683
Financial statements
Notes to the Consolidated Financial Statements continued
102 KazMunaiGas Exploration Production JSC Annual Report 2015Financial statem
ents 103 KazMunaiGas Exploration Production JSC Annual Report 2015

19. Finance income/costs19.1 Finance income
2015 2014
Interest income on deposits with banks 15,719 13,499Interest income on receivable from joint ventures and jointly controlled entities 7,265 7,108Unwinding of discount on long-term VAT recoverable (Note 24) 1,860 −Other 1,250 155
26,094 20,762
19.2 Finance costs2015 2014
Valuation allowance on loan to KS EP (Note 8) 11,017 −Unwinding of discount on asset retirement obligation 1,317 1,083Unwinding of discount on ecology remediation obligation 1,267 1,097Recognition of discount on long-term VAT recoverable (Note 24) 1,051 5,036Interest expense 347 1,626Other − 110
14,999 8,952
20. Income taxesIncome tax expense comprised the following for the years ended December 31:
2015 2014
Corporate income tax 109,124 52,727Excess profit tax 6,563 11,831Current income tax 115,687 64,558Corporate income tax 8,847 (49,152)Excess profit tax 2,987 (871)Deferred income tax 11,834 (50,023)Income tax expense 127,521 14,535
The following table provides a reconciliation of the Kazakhstan income tax rate to the effective tax rate of the Company on profit before tax.
2015 2014
Profit before tax 371,190 61,573Income tax 127,521 14,535Effective tax rate 34% 24%Statutory income tax 20% 20% Increase/(decrease) resulting from Withholding tax 1% 2% Excess profit tax 1% 5% Income tax of prior years 7% 15% Share of result of associate and joint ventures (1%) (20%) Non-taxable income (2%) (1%) Asset retirement obligation and environmental remediation − (11%) Allowance for VAT recoverable 3% − Non-deductible expenses 5% 14%Effective tax rate 34% 24%
20. Income taxes continuedThe movements in the deferred tax assets and liabilities relating to CIT and EPT were as follows:
Deferred tax assetsFixed and
Intangible assets Provisions Taxes Other Total
At January 1, 2014 14,885 928 13,623 4,920 34,356Recognised in the statement of comprehensive income 48,171 7,337 (5,754) (43) 49,711At December 31, 2014 63,056 8,265 7,869 4,877 84,067Recognised in the statement of comprehensive income (13,033) 5,368 (3,413) (1,085) (12,163)At December 31, 2015 50,023 13,633 4,456 3,792 71,904
Deferred tax liabilitiesFixed and
Intangible assets Provisions Taxes Other Total
At January 1, 2014 (943) 68 1 (7) (881)Recognised in the statement of comprehensive income 305 1 1 5 312At December 31, 2014 (638) 69 2 (2) (569)Recognised in the statement of comprehensive income 398 (69) (2) 2 329At December 31, 2015 (240) − − − (240)
The Company offsets tax assets and liabilities if and only if it has a legally enforceable right to set off current tax assets and current tax liabilities and the deferred tax assets and deferred tax liabilities relate to income taxes levied by the same tax authority.
21. Related party transactionsThe category ‘entities under common control’ comprises entities controlled by the Parent Company. The category ‘other state controlled entities’ comprises entities controlled by Samruk-Kazyna SWF.
Sales and purchases with related parties during the twelve months ended December 31, 2015 and 2014 and the balances with related parties at December 31, 2015 and December 31, 2014 are as follows:
2015 2014
Revenue and other income Entities under common control 535,105 849,240Other state controlled entities 31 45Associate 29 23Parent company − 155Joint ventures 4,973 6,023Purchases of goods and services Entities under common control 40,316 39,882Other state controlled entities 18,410 18,069Parent Company − 4,451Joint ventures 57 71Interest earned on financial assetsInterest earned on loans to Joint ventures 4,323 4,084Average interest rate on loans to Joint ventures 1.04% 1.11%Valuation allowance on financial assetsJoint ventures 11,017 −Salaries and other short-term benefitsMembers of the Board of Directors 179 157Members of the Management Board 473 337Share-based paymentsMembers of the Management Board 331 −
Financial statements
Notes to the Consolidated Financial Statements continued
104 KazMunaiGas Exploration Production JSC Annual Report 2015Financial statem
ents 105 KazMunaiGas Exploration Production JSC Annual Report 2015

21. Related party transactions continued2015 2014
Trade and other receivables Entities under common control 95,516 58,305Joint ventures 72,306 52,677Other state controlled entities 2,796 2,274Associate 7 15Trade payablesEntities under common control 2,530 1,907Other state controlled entities 327 454Joint ventures 28 −
Sales and receivablesSales to related parties comprise mainly export and domestic sales of crude oil and oil products to subsidiaries of NC KMG. Export sales to related parties represented 4,646,981 tons of crude oil in 2015 (2014: 5,571,211 tons). The sales of crude oil are priced by reference to Platt’s index quotations and adjusted for freight, trader’s margin and quality differentials. For these exports of crude oil the Company received an average price per ton of approximately 81,046 Tenge in 2015 (2014: 130,608 Tenge).
In addition, the Company supplies crude oil and gas products to the local market through JSC ‘KazMunaiGas Refinery and Marketing’, a subsidiary of the Parent Company, at the directive of the Kazakhstan government, the ultimate controlling shareholder of the Parent Company. Those supplies to the domestic market represented 2,680,244 tons of crude oil production in 2015 (2014: 1,912,000 tons). Prices for the local market sales are determined by agreement with the Parent Company (Note 24). For deliveries to the local market in 2015 the Company received an average price per produced crude oil ton of around 37,000 Tenge (2014: 48,000 Tenge).
Sales to ‘entities under common control’ also include revenue from counter sale of 916,300 tons of crude oil (2014: 447,000 tons) to the Russian Federation (Note 24) through JSC ‘KazMunaiGas Refinery and Marketing’. The sales of crude oil are priced by reference to Platt’s index quotations and adjusted for spreads between Brent and Urals and reduced by Russian export customs duty, trader’s margin, differential and difference between transportation expenses to Russia-Belarus border and the Russia-Kazakhstan border. For these counter deliveries of crude oil the Company received an average price per ton of approximately 50,289 Tenge in 2015 (2014: 38,871 Tenge).
Purchases and payablesManagement fees to the Parent Company amounted to nil in 2015 (2014: 4,451 million Tenge). Transportation services related to the shipment of 6,467,528 tons of crude oil (2014: 6,033,932 tons) and transshipment of 1,849,985 tons of crude oil to Caspian Pipeline Consortium collection point in 2015 (2014: 1,991,256 tons) were purchased from a subsidiary of the Parent Company for 33,727 million Tenge in 2015 (2014: 32,472 million Tenge). The remaining services purchased from subsidiaries of NC KMG include primarily payments for security services and processing.
Share based payments to members of the Management BoardShare based payments to members of the Management Board represents the amortization of share based payments over the vesting period. During 2015 the Company granted 140,259 options to the members of the Management Board (2014: nil).
22. Financial risk management objective and policiesThe Company has various financial liabilities such as borrowings, trade and other payables. The Company also has various financial assets such as trade receivables, short and long-term deposits and cash and cash equivalents.
The Company is exposed to interest rate risk, foreign currency risk, credit risk, liquidity risk and commodity price risk. The Company’s Finance Committee assists management in the oversight of the monitoring and where it is deemed appropriate, mitigation of these risks in accordance with approved policies such as the treasury policy.
Interest rate riskAs of December 31, 2015 the Company has no f loating interest rate borrowings and no exposure to interest rate risk.
Foreign currency riskThe following table demonstrates the sensitivity of the Company’s profit before tax to a reasonably possible change in the US dollar exchange rate, with all other variables held constant (due to changes in the fair value of monetary assets and liabilities).
Increase/decreasein Tenge to US dollar
exchange rateEffect on profit
before tax
2015US dollar +20.00% 174,285US dollar -5.00% (43,571) 2014US dollar +25.00% 150,804US dollar -5.00% (30,161)
Credit riskThe Company is exposed to credit risk in relation to its trade receivables. The Company’s vast majority of sales are made to an affiliate of the Parent and the Company has a significant concentration risk of the receivable from this affiliate (Notes 7, 21). An additional number of minor receivables are grouped into homogeneous groups and assessed for impairment collectively on an ongoing basis with the result that the Company’s exposure to bad debts is not significant.
The Company is also exposed to credit risk in relation to its investing activities. The Company places deposits with Kazakhstan and foreign banks.
Credit risk from balances with financial institutions is managed by the Company’s treasury department in accordance with the Company’s treasury policy, which is approved by the Company’s Board of Directors. The Company’s maximum exposure to credit risk arising from default of the financial institutions is equal to the carrying amounts of these financial assets.
The table below shows the balances of the financial assets held in banks at the reporting date using Standard and Poor’s credit ratings, unless otherwise stated.
LocationRating 1
2015Rating 1
2014 2015 2014
Halyk Bank Kazakhstan BB+ (negative) BB+ (stable) 294,748 134,632BNP Paribas UK A+ (negative) A+ (negative) 170,156 88,756Deutsche Bank UK BBB+ (stable) A (negative) 170,097 110,518ING Bank Netherlands A (stable) A (negative) 144,901 61,177Citi Bank N.A. UK branch A (positive) A (stable) 100,390 81,378Kazkommertsbank Kazakhstan B- (negative) B (stable) 99,394 83,245HSBC Plc UK A (stable) A A- (negative) 62,230 33,186Credit Suisse Switzerland BBB+ (stable) A (negative) 30,301 11,439ATF Bank (Fitch) Kazakhstan B- (stable) B- (stable) 18,229 12,309Eurasian Bank Kazakhstan B (stable) B+ (positive) 11,231 47,623Sberbank Kazakhstan BB+ (negative) Ba2 (negative) 100 19,603RBS NV UK BBB- (negative) Baa2 (negative) 2,790 1,571BankCenterCredit (Moody’s) Kazakhstan B2 (stable) B2 (stable) 37 79Citi Bank Kazakhstan Kazakhstan Not available Not available 6 12,104Tsesna Bank Kazakhstan B+ (stable) B+ (stable) − 36,578Other 372 127
1,104,982 734,325
1 Source: official sites of the banks and rating agencies as at December 31 of the respective year.
Financial statements
Notes to the Consolidated Financial Statements continued
106 KazMunaiGas Exploration Production JSC Annual Report 2015Financial statem
ents 107 KazMunaiGas Exploration Production JSC Annual Report 2015

22. Financial risk management objective and policies continuedLiquidity risk The Company monitors its liquidity risk using a liquidity planning tool. This tool considers the maturity of both its financial investments and financial assets (e.g. accounts receivables and other financial assets) and projected cash f lows from operations.
The Company’s objective is to maintain a balance between continuity of funding and f lexibility through the use of short and long-term deposits in local banks.
The table below summarizes the maturity profile of the Company’s financial liabilities at December 31, 2015 based on contractual undiscounted payments:
At December 31, 2014 On demandLess than3 months 3-12 months 1-5 years
more than5 years Total
Borrowings − 361 2,944 4,752 778 8,835Trade and other payables 59,514 − − − − 59,514
59,514 361 2,944 4,752 778 68,349
At December 31, 2015 On demandLess than3 months 3-12 months 1-5 years
more than5 years Total
Borrowings − 601 4,913 6,468 1,494 13,476Trade and other payables 49,549 − − − − 49,549
49,549 601 4,913 6,468 1,494 63,025
Commodity price riskThe Company is exposed to the effect of f luctuations in the price of crude oil, which is quoted in US dollars on international markets. The Company prepares annual budgets and periodic forecasts including sensitivity analyses in respect of various levels of crude oil prices in the future.
Capital managementCapital includes total equity. The primary objective of the Company’s capital management is to ensure that it maintains a strong credit rating and available funds to support its business and strategic objectives.
As at December 31, 2015 the Company had a strong financial position and a conservative capital structure. Going forward, the Company intends to maintain a capital structure which allows it the f lexibility to take advantage of growth opportunities as and when they arise.
The Company manages its capital structure and makes adjustments to it, in light of changes in economic conditions. To maintain or adjust the capital structure, the Company may adjust the dividend payment to shareholders, return capital to shareholders or issue new shares. No changes were made in the objectives, policy or processes during the years ended December 31, 2015 and 2014.
23. Financial instrumentsFair values of financial instruments such as receivables from jointly controlled entity and joint ventures, short-term trade receivables, trade payables and fixed interest rate borrowing approximate their carrying value.
24. Commitments and contingenciesOperating environmentKazakhstan continues economic reforms and development of its legal, tax and regulatory frameworks as required by a market economy. The future stability of the Kazakhstan economy is largely dependent upon these reforms and developments and the effectiveness of economic, financial and monetary measures undertaken by the government.
The National Bank of the Republic of Kazakhstan shifted to inf lation targeting policy on August 20, 2015. As a result of implementation of the policy the official exchange rate went up from 188.38 Tenge per 1 US Dollar to 339.47 Tenge per 1 US Dollar as at 31 December 2015.
In 2015, the Kazakhstan economy was negatively impacted by a significant drop in crude oil prices and a significant devaluation of the Kazakhstan Tenge. The combination of the above resulted in reduced access to capital, a higher cost of capital, increased inf lation and uncertainty regarding economic growth, which could negatively affect the Group’s future financial position, results of operations and business prospects. Management believes it is taking appropriate measures to support the sustainability of the Group’s business in the current circumstances.
24. Commitments and contingencies continuedRussian Federation market obligationAccording to an inter-governmental agreement between Kazakhstan and the Russian Federation, Kazakhstan fulfills counter deliveries to the Russian Federation. JSC ‘KazMunaiGas Refinery and Marketing’, a related party, was determined as an operator and the Company was determined as one of the suppliers through governmental quotas. Based on this inter-governmental agreement in September 2014 the Company has concluded a contract with JSC ‘KazMunaiGas Refinery and Marketing’ to supply crude oil to the Russian Federation (Note 21). The contract was valid till December 31, 2014 without pre-determined volumes. In March 2015 the Company concluded an additional contract for 2015. During 2015 the Company has counter delivered 916 thousand tons of crude oil (2014: 447 thousand tons). These supplies are additional to the obligation of the Company to supply crude oil to the local market and were completed in August of 2015.
Local market obligationThe Kazakhstan government requires oil producers to supply a portion of their crude oil production to meet domestic energy requirements. The price for such supplies of crude oil is subject to agreement with the Parent Company and price may be materially below international market prices. If the Government does require additional crude oil to be delivered over and above the quantities currently supplied by the Company, such supplies will take precedence over market sales and will generate substantially less revenue than crude oil sold on the export market, which may materially and adversely affect the Company’s business, prospects, financial condition and results of operations.
The Company supplies oil and gas products to the local market by selling to JSC ‘KazMunaiGas Refinery and Marketing’, a subsidiary of the Parent Company. Prices for local market sales are determined through an annual negotiation process with JSC ‘KazMunaiGas Refinery and Marketing’ and the Parent Company. These prices are finally approved by the Independent Non-Executive Directors of the Company (‘INEDs’), as required by the Charter of the Company.
During 2015, per instructions from NC KMG, for crude oil supplied to Atyrau Oil Refinery Plant (‘ANPZ’) and to Pavlodar Oil Refinery Plant (‘PNHZ’) the Company was paid by JSC ‘KazMunaiGas Refinery and Marketing’ an average price of approximately 21,288 Tenge and 32,923 Tenge per ton, respectively. These prices were disputed by the Company and its INEDs and were not formally agreed.
In the fourth quarter of 2015 an agreement was reached whereby for all volumes shipped to ANPZ and PNHZ in 2015 the Company was to receive 37,000 Tenge per ton. These financial statements have been adjusted in the fourth quarter to ref lect the agreed price.
During 2015 the Company’s subsidiaries delivered 2,754,459 tons of oil (2014: 2,014,377 tons) to the domestic market. The Company’s share in the delivery of oil to the domestic market of its joint venture Kazgermunai comprised 1,051,000 tons in 2015 (2014: 971,250 tons). The Company’s share in the delivery of oil to the domestic market of its associate PetroKazakhstan Inc. comprised 925,389 tons in 2015 (2014: 946,081 tons).
TaxationKazakhstan’s tax legislation and regulations are subject to ongoing changes and varying interpretations. Instances of inconsistent opinions between local, regional and national tax authorities are not unusual. The current regime of penalties and interest related to reported and discovered violations of Kazakhstan’s tax laws are severe. Because of the uncertainties associated with Kazakhstan’s tax system, the ultimate amount of taxes, penalties and interest, if any, may be in excess of the amount expensed to date and accrued at December 31, 2015.
The Company’s management believes its interpretations of the tax legislation are appropriate and that the Company has justifiable arguments for its tax positions.
2009-2012 Comprehensive tax auditOn September 2, 2015 the Company received the final tax assessment related to the 2009-2012 Comprehensive tax audit for 38,511 million Tenge (Note 13), including additional taxes of 18,620 million Tenge, 9,697 million Tenge penalty and 10,194 million Tenge of fine. As of September 28, 2015 as per the decision of the Committee of the State Revenues, fines were reduced from 10,194 million Tenge to 9,306 million Tenge. The Company does not agree with the results of the tax audit and has sent an appeal of the additional charges to the Committee of the State Revenues on September 7, 2015. Pending the results of the appeal management will consider further actions including but not limited to appealing to the appropriate courts.
Value-added-tax (VAT) recoverabilityTotal VAT claim related to the Company’s sale of assets to JSC ‘Ozenmunaigas’ and JSC ‘Embamunaigas’ in 2012 amounted to 46,558 million Tenge. The tax authorities have conducted various audits and have repeatedly denied the Company’s requests to have these VAT amounts recognised as recoverable. During 9 months of 2015 the amount was classified as a long term in the financial statements and discounted at 7.93% over the period ending December 31, 2016.
As at September 30, 2015 discounted amount comprised 42,306 million Tenge. In the fourth quarter of 2015 the Company reassessed its tax position regarding VAT and believes that it is more probable than not that it will ultimately be unsuccessful in its claim and consequently created a valuation allowance for the amount of 42,306 million Tenge.
During 2015 the Tax authorities carried out VAT tax audits of JSC ‘Ozenmunaigas’ and JSC ‘Embamunaigas’ covering period of 2013 and 2014. As a result of these audits nonrecoverable VAT amounted to 4,447 million Tenge, which was provided for in these financial statements.
The Companies disagrees with the tax authorities’ position and will continue to defend its interest in courts.
Financial statements
Notes to the Consolidated Financial Statements continued
108 KazMunaiGas Exploration Production JSC Annual Report 2015Financial statem
ents 109 KazMunaiGas Exploration Production JSC Annual Report 2015

24. Commitments and contingencies continuedEnvironmentEnvironmental regulation in Kazakhstan is evolving and subject to ongoing changes. Penalties for violations of Kazakhstan’s environmental laws can be severe. Other than those amounts provided for in provisions (Note 13) management believes that there are no probable environmental liabilities, which could have a material adverse effect on the Company’s financial position, statement of comprehensive income or cash f lows.
Oilfield licensesThe Company is subject to periodic reviews of its activities by governmental authorities with respect to the requirements of its oilfield licenses and related subsoil use contracts. Management cooperates with governmental authorities to agree on remedial actions necessary to resolve any findings resulting from these reviews. Failure to comply with the terms of a license could result in fines, penalties, license limitation, suspension or revocation. The Company’s management believes that any issues of non-compliance will be resolved through negotiations or corrective actions without any material effect on the Company’s financial position, statement of income or cash f lows.
The Company’s oil and gas fields are located on land belonging to the Mangistau and Atyrau regional administrations. Licenses are issued by the Ministry of Oil and Gas of Kazakhstan and the Company pays mineral extraction and excess profits tax to explore and produce oil and gas from these fields.
The principle licenses of the Company and their expiry dates are:
Field Contract Expiry Date
Uzen (8 fields) No. 40 2036Emba (1 field) No. 37 2041Emba (1 field) No. 61 2048Emba (23 fields) No. 211 2037Emba (15 fields) No. 413 2043
Commitments arising from oilfield and exploration licenses
YearCapital
expendituresOperational
expenditures
2016 81,218 4,1242017 4,700 4,0442018 2,504 4,0442019 2,036 3,5292020-2048 − 5,315
90,458 21,056
Crude oil supply commitments The Company has obligations to supply oil and oil products to the local market under government directives (Note 21).
Commitments of KazgermunaiThe Company’s share in the commitments of Kazgermunai is as follows as at December 31, 2015:
YearCapital
expendituresOperational
expenditures
2016 5,737 5,200
Commitments of UGLThe Company’s share in the commitments of UGL is as follows as at December 31, 2015:
YearCapital
expendituresOperational
expenditures
2016 3,504 780
Commitments of PKIThe Company’s share in the commitments of PKI is as follows as at December 31, 2015:
YearCapital
expenditures
2016 1,376
These consolidated financial statements have been signed below by the following persons on behalf of the Company and in the capacities indicated on February 23, 2016:
Iskaziyev K.O. Chief Executive Officer
Drader S., CA Financial Director-Financial Controller
Abdulgafarov D.Y. Chief Financial Officer
Zainelova A. A., CPA Chief Accountant
Financial statements
Notes to the Consolidated Financial Statements continued
110 KazMunaiGas Exploration Production JSC Annual Report 2015Financial statem
ents 111 KazMunaiGas Exploration Production JSC Annual Report 2015

114 Information for Shareholders
115 Contact information
116 Reference information
Appendices 113 KazMunaiGas Exploration Production JSC Annual Report 2015112 KazMunaiGas Exploration Production JSC Annual Report 2015
Appendices
Appendices

Annual General Meeting of ShareholdersThe Annual General Meeting of shareholders was held on 24 May 2016 at 10:00 AM at 15 Kabanbay batyra street, Hilton Garden Inn Astana hotel, Garden conference hall, 1st f loor, Astana, 010000, Kazakhstan.
WebsiteInformation about the Company, including details of activities, press releases and annual and interim reports, is available on the Company’s website www.kmgep.kz.
Shareholders’ RequestsThe Company’s shareholders may request information about absentee voting, dividends, notices concerning changes in personal data and other similar matters from the Company’s registrar/depositary:• Holders of ordinary and preference shares:
AO “Ediny registrator tsennykh bumag” Ul. Satpaeva 30A/3, Almaty, 050040 Republic of Kazakhstan Tel.: +7 (727) 272 4760
• Holders of Global Depositary Receipts (GDRs): Deutsche Bank Trust Company Americas Depositary Receipts Group 60 Wall Street, New York, NY, 10005, USA Tel.: +1 (121) 250 9100 Fax: +1 (732) 544 6346 Email: [email protected]
Number of Shares in Issue
OrdinaryShares
PreferenceShares
TotalIssued
Capital 2
Number of issued shares1 70,220,935 4,136,107 74,357,042
1 Includes the redeemed GDRs for completion of the option programme of the Company and being held in trust (as of 31.12.2015: 9,560,401 GDRs), and also shares, bought back in accordance with the own share buy-back programme (as of 31.12.2015: 2,527,860 ordinary shares and 2,073,147 preference shares).
2 Shares of the Company are in circulation on the Kazakh Stock Exchange, whereas the global depositary receipts are in circulation on the London Stock Exchange. One GDR corresponds to 1/6 of an ordinary share.
Company’s registered officeJSC KazMunaiGas Exploration Production• Kabanbai Batyra Street 17,
Astana 010000 Republic of Kazakhstan Tel.: +7 (717) 297 79 12 Fax: +7 (717) 297 74 26
Public relationsYelena Pak• Tel.: +7 (717) 297 79 08
e-mail: [email protected]
Corporate secretaryAidar Zhexenbiyev• Tel.: +7 (717) 297 54 08, +7 (717) 297 54 09
e-mail: [email protected], [email protected]
Investor relations (queries from institutional investors)Saken Shoshanov• Tel.: +7 (717) 297 54 33
e-mail: [email protected]
AuditorsLLP Ernst & Young Kazakhstan• Al-Farabi ave., 77/7
Esentai Tower Almaty, 050060 Republic of Kazakhstan Tel.: +7 (727) 258 59 60 Fax: +7 (727) 258 59 61
RegistrarJSC “Ediny registrator tsennykh bumag”• Ul. Satpayeva 30 A/3,
Almaty 050040 Republic of Kazakhstan Tel.: +7 (727) 272 47 60
Depositary bankDeutsche Bank Trust Company Americas • Depositary Receipts Group
60 Wall Street New York, NY, 10005 USA Tel.: +1 (121) 250 9100 Fax: +1(732) 544 6346 e-mail: [email protected]
114 KazMunaiGas Exploration Production JSC Annual Report 2015
Appendices
Appendices 115 KazMunaiGas Exploration Production JSC Annual Report 2015
Appendices
Information for Shareholders Contact information
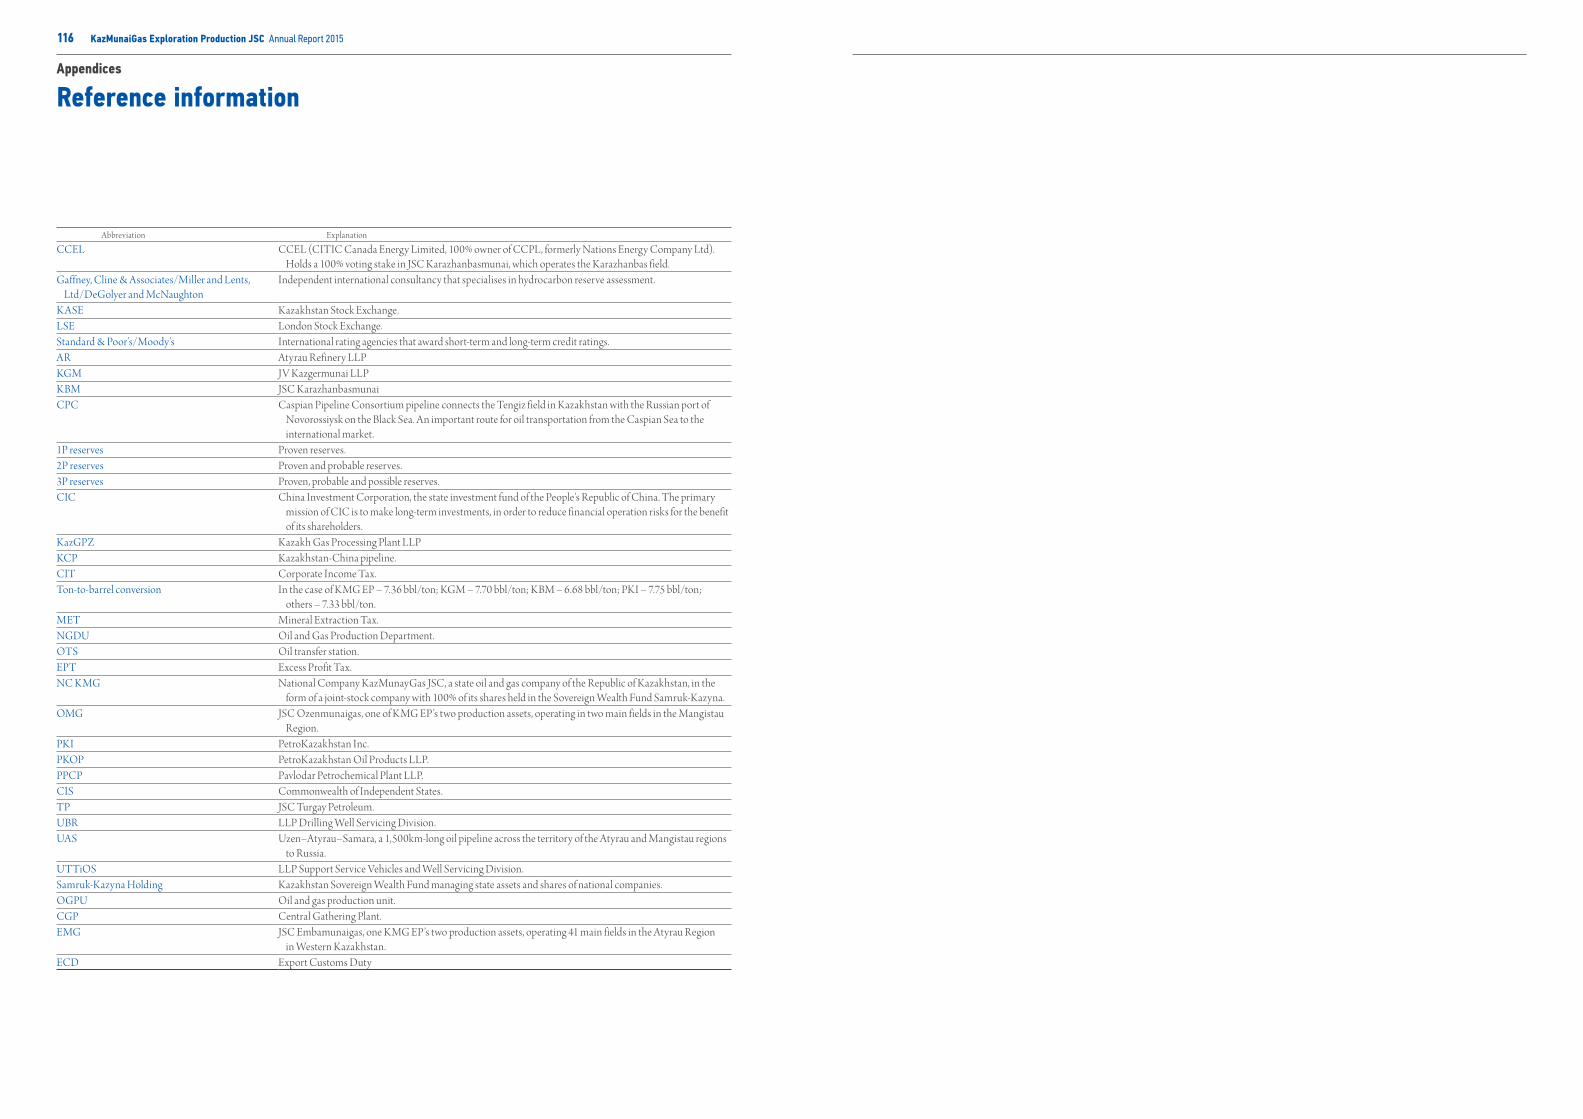
Abbreviation Explanation
CCEL CCEL (CITIC Canada Energy Limited, 100% owner of CCPL, formerly Nations Energy Company Ltd). Holds a 100% voting stake in JSC Karazhanbasmunai, which operates the Karazhanbas field.
Gaffney, Cline & Associates/Miller and Lents, Ltd/DeGolyer and McNaughton
Independent international consultancy that specialises in hydrocarbon reserve assessment.
K ASE Kazakhstan Stock Exchange.LSE London Stock Exchange.Standard & Poor’s/Moody’s International rating agencies that award short-term and long-term credit ratings.AR Atyrau Refinery LLPKGM JV Kazgermunai LLPKBM JSC KarazhanbasmunaiCPC Caspian Pipeline Consortium pipeline connects the Tengiz field in Kazakhstan with the Russian port of
Novorossiysk on the Black Sea. An important route for oil transportation from the Caspian Sea to the international market.
1Р reserves Proven reserves.2Р reserves Proven and probable reserves.3Р reserves Proven, probable and possible reserves.CIC China Investment Corporation, the state investment fund of the People’s Republic of China. The primary
mission of CIC is to make long-term investments, in order to reduce financial operation risks for the benefit of its shareholders.
KazGPZ Kazakh Gas Processing Plant LLPKCP Kazakhstan-China pipeline.CIT Corporate Income Tax.Ton-to-barrel conversion In the case of KMG EP – 7.36 bbl/ton; KGM – 7.70 bbl/ton; KBM – 6.68 bbl/ton; PKI – 7.75 bbl/ton;
others – 7.33 bbl/ton.MET Mineral Extraction Tax.NGDU Oil and Gas Production Department.OTS Oil transfer station.EPT Excess Profit Tax.NC KMG National Company KazMunayGas JSC, a state oil and gas company of the Republic of Kazakhstan, in the
form of a joint-stock company with 100% of its shares held in the Sovereign Wealth Fund Samruk-Kazyna.OMG JSC Ozenmunaigas, one of KMG EP’s two production assets, operating in two main fields in the Mangistau
Region.PKI PetroKazakhstan Inc.PKOP PetroKazakhstan Oil Products LLP.PPCP Pavlodar Petrochemical Plant LLP.CIS Commonwealth of Independent States.TP JSC Turgay Petroleum.UBR LLP Drilling Well Servicing Division.UAS Uzen–Atyrau–Samara, a 1,500km-long oil pipeline across the territory of the Atyrau and Mangistau regions
to Russia.UTTiOS LLP Support Service Vehicles and Well Servicing Division.Samruk-Kazyna Holding Kazakhstan Sovereign Wealth Fund managing state assets and shares of national companies.OGPU Oil and gas production unit.CGP Central Gathering Plant.EMG JSC Embamunaigas, one KMG EP’s two production assets, operating 41 main fields in the Atyrau Region
in Western Kazakhstan.ECD Export Customs Duty
116 KazMunaiGas Exploration Production JSC Annual Report 2015
Appendices
Reference information