Deliverable Title: Report on the Associations between ... · the title of this report: Report on...
53
This project has received funding from the European Union’s, Horizon 2020 research and innovation programme under grant agreement No. 693989. ENLIVEN- Encouraging Lifelong Learning for an Inclusive and Vibrant Europe Horizon 2020, H2020- YOUNG-SOCIETY-2015, YOUNG-3-2105, Lifelong Learning for young adults: better policies for growth and inclusion in Europe Duration: 1 October 2016-30 September 2019 Deliverable: D4.2 Deliverable Title: Report on the Associations between System Characteristics and Participation in Learning Activities based on Work Status, Educational Levels, Goal and Field of Learning Activity Deliverable type/version Report Dissemination level For peer review only Month & date of delivery 12/9/2019 Associated Work Package (WP) 4 Lead Beneficiary KU Leuven WP Leader Sofie Cabus Authors Sofie Cabus - KU Leuven, Research Institute for Work and Society (HIVA), Education and the Labour Market, Belgium, Email: [email protected] Petya Ilieva- Trichkova - Institute for the Study of Societies and Knowledge, Bulgarian Academy of Sciences, Bulgaria; Email: [email protected] Miroslav Štefánik - Institute of Economic Research/Centre of Social and Psychological Sciences; Slovak Academy of Sciences, Slovakia; Email: [email protected] Project URL https://h2020enliven.org/
Transcript of Deliverable Title: Report on the Associations between ... · the title of this report: Report on...

This project has received funding from the European Union’s, Horizon 2020 research and innovation programme under grant agreement No. 693989.
ENLIVEN- Encouraging Lifelong Learning for an Inclusive and Vibrant Europe
Horizon 2020, H2020- YOUNG-SOCIETY-2015, YOUNG-3-2105, Lifelong Learning for young adults: better policies for growth and inclusion in Europe Duration: 1 October 2016-30 September 2019
Deliverable: D4.2
Deliverable Title: Report on the Associations between System Characteristics and
Participation in Learning Activities based on Work Status, Educational Levels, Goal and
Field of Learning Activity
Deliverable type/version
Report
Dissemination level
For peer review only
Month & date of delivery
12/9/2019
Associated Work Package (WP)
4
Lead Beneficiary
KU Leuven
WP Leader
Sofie Cabus
Authors
Sofie Cabus - KU Leuven, Research Institute for Work and Society (HIVA), Education and the Labour Market, Belgium, Email: [email protected]
Petya Ilieva- Trichkova - Institute for the Study of Societies and Knowledge, Bulgarian Academy of Sciences, Bulgaria; Email: [email protected]
Miroslav Štefánik - Institute of Economic Research/Centre of Social and Psychological Sciences; Slovak Academy of Sciences, Slovakia; Email: [email protected]
Project URL
https://h2020enliven.org/

2

3
Foreword
Encouraging Lifelong Learning for an Inclusive & Vibrant Europe What’s gone awry in Europe’s lifelong learning markets? Although it has been a central EU policy priority since 1993, and the European Union’s mechanisms for multinational policy co-ordination and measurement in lifelong learning are world-leading, one in every five Europeans under 25 is now unemployed. Many are not in employment, education or training. According to the High Level Group on Literacy, one in five 15-year olds lack the literacy skills required to function successfully in a modern society; 73 million EU adults have low levels of education and literacy; while achieving the current EU benchmark of functional literacy for 85% of 15-year-olds would increase lifetime GDP – lifetime earnings – by €21 trillion. Clearly Europe’s educational markets are failing to ensure that our citizens – particularly our younger citizens – have the education and training they need for their own economic prosperity and social welfare. They are also failing European society as a whole. Social exclusion, disaffection and the long-term “scarring” effects of unemployment are clear dangers to economic competitiveness, to social cohesion, and to the European project as a whole. This is the starting point for ENLIVEN – Encouraging Lifelong Learning for an Inclusive & Vibrant Europe – a three-year research project (2016-2019) funded by the European Union’s Horizon 2020 programme. The ENLIVEN research explores these challenges in several ways. First, we are exploring and modelling how policy interventions in adult education markets can become more effective. We bring together state-of-the-art methodologies and theorisations (e.g. Case-Based Reasoning methodology in artificial intelligence, bounded agency in adult learning) to develop and evaluate an innovative Intelligent Decision Support System (IDSS) to provide a new and more scientific underpinning for policy debate and decision-making about adult learning, especially for young adults. For this, we are drawing on findings from research conducted by European and international agencies and research projects, as well as findings from ENLIVEN research itself. The IDSS is intended to enable policy-makers at EU, national and organizational levels to enhance the provision and take-up of learning opportunities for adults, leading to a more productive and innovative workforce, and reduced social exclusion. The IDSS work organised in two workpackages (WPs 8-9). Second, we are investigating programmes, governance and policies in EU adult learning. By looking at the multi-dimensional nature of social exclusion and disadvantage, and the role of public and private markets in reversing – or reproducing – inequalities across Europe, we aim to provide a more holistic understanding of policies, their rationales, operationalization, and role in enhancing growth and inclusion. Beginning with the main European policies and funding schemes for adult learning aimed at tackling disadvantage, inequality and social exclusion, we are identifying the different ways in which social inequality is expressed, constructed as a policy goal, and legitimized by discourses at the European level, and nationally. Combining policy diffusion studies with studies of multilevel governance that map the relations between various adult learning stakeholders and decision makers, their conceptualizations of the purpose of adult learning and their priorities, we are identifying the main barriers and enablers for access and participation in adult learning in Europe at the programme and subnational levels. This work is organised in three work packages (WPs1-3). Third, we are examining “system characteristics” to explain country/region-level variation in lifelong learning participation rates – particularly among disadvantaged and at-risk groups, and young people. The “markets” for adult education are complex, with fuzzy boundaries, and the reasons why adults

4
learn vary. Drawing on Labour Force Survey, Adult Education Survey, EU-SILC, and European Social Survey datasets, we use multilevel regression analysis and construct a pseudo-panel to address questions such as which system characteristics explain country and region-level variations in participation rates (overall, and among disadvantaged groups and youth at risk of exclusion), and how government policy can be most effective in promoting participation. This research is organised in Work Package 4.
Underlying the ENLIVEN research is the need for a reconstruction of adult educational policy-formation in Europe. Currently there are two particular problems. On the one hand, the principal beneficiaries of adult education (across Europe as elsewhere) are the relatively more privileged: those who have received better initial education, those in employment, and (among the employed) those in better-paid, more secure and more highly-skilled jobs. The adults who are (arguably) most in need of education and training, such as young, unemployed, low skilled, disabled and vulnerable workers, receive less of it. On the other hand, in contrast to the education of children, adult education is by and large financed by individual students (‘learners’), their families, and/or their employers. Though this is partly the outcome of public policy – in particular the desire to reduce public spending (or restrict its growth), and to utilise the efficiencies inherent in market-based allocation systems – it limits the policy tools available to governments and state agencies. A central feature of public policy is therefore to influence the behaviour of citizens and enterprises, encouraging them to invest in lifelong learning for themselves and their workers. Finally, we are examining the operation and effectiveness of young adults’ learning at and for work. The availability and quality of work for young adults differs by institutional setting across EU member states. We are undertaking institutional-level case studies on attempts to craft or to change the institutions which govern young adults’ early careers, workplace learning and participation in innovation activities, comparing countries with similar or diverging institutional frameworks. This is the focus of three work packages (WPs 5-7). John Holford Co-ordinator, ENLIVEN University of Nottingham [email protected]

Report on the Associations between System Characteristics and Participation in Learning Activities based on Work Status, Educational Levels, Goal and Field of Learning Activity
Occupational Change due to Technological Progress and its Effects
on Participation in Adult Education and Training
Executive summary
Rates of participation in adult education and training (E&T) show large differences across European
countries [EUROSTAT; sdg_04_60]. There are several reasons underlying this. These are reflected in
the title of this report: ‘Report on the associations between system-level characteristics and
participation in learning activities based on work status, educational levels, goal and field of learning
activity.’ (Deliverable 4.2.) The extent to which adult learning takes place is highly dispersed across
educational levels and work status. In particular, as shown in D4.1, high-educated people are more
likely to participate than low-educated; and, if adult learning takes place, it is mostly for job-related
reasons. Further, job-related adult learning may serve different reasons, varying from continuous
professional development, or upskilling, to ‘simply’ meeting job entry requirements (goal and field of
learning activity). These different reasons may stem from the fact that some occupations need entry
requirements, other occupations are influenced by (continuous) change, while yet others face both
entry requirements and change. The combination of all of these elements in one analysis is empirically
challenging. However, in the light of current debates on the changing needs for skills on the labour
market, and how it impacts adults from very different backgrounds differently, it all seems driven by
technical progress and its impact on occupational change. We have reflected this in the sub-title:
‘occupational change due to technical progress and its effect on participation in adult education and
training.’
Deliverable D4.2 is the second report that arises from work package 4 in the ENLIVEN project. It
follows naturally from the work done in D4.1, where it has been argued that lifelong learning “has
become a recognized EU-28 education priority in response to fast-paced technological
transformations.” However, while D4.1 focused on participation rates and on the inequalities in
participation in adult E&T between socioeconomic groups, this deliverable explores the effects of
technological transformations on participation in adult E&T across different job typologies. Hereby,
this report adheres to previous work of ENLIVEN colleagues Boeren & Holford (2016); and Saar & Räis
(2017); who discussed the relationship between job-related learning in response to demand-sided
shifts on the labour market.
In particular, it has been argued in the previous literature that technological transformations lead
to automation of jobs with a high level of routine-tasks. At the same time, technological
transformations boost the demand for workers in non-routine complex jobs. From these workers it is
expected that they invent ways to automate (routine-) tasks, often as a way to increase productive
efficiency. From the data we argue that professionals, who produce and invent new information (and
communication) technologies (ICT) increase their share in the labour force relative to other
professions.
But non-routine non-complex jobs seem hard to automate (e.g. a barber) due to its "human
component" which robots still cannot takeover. The demand for personal service and personal care
6
(PSPC) workers, when controlled for the business cycle, rather depends on demographic ageing and
welfare in the region, than on technical change. This means that fast-paced technological
transformations do not seem to impact, at least not directly, the demand for PSPC workers.
However, it is not entirely clear what occupational change means for participation in adult E&T. If,
the relative share for ICT professionals increase in a regional labour market, then one expects a rise in
participation in adult E&T as a way to meet local labor needs. Adult E&T then serves as a tool to
educate and train workers with the skills necessary to perform an ICT profession. Further, adult E&T
can also be used by ICT professionals for continuous professional development in a fast-changing
profession. At the same time, if the relative share of PSPC workers increase in a regional labour market,
then one expects that adult E&T will solely be used as to adopt the skills necessary to enter the
profession. It is less clear whether adult E&T will be used for continuous professional development.
The deliverable D4.1 indicates that the likelihood to participate in adult E&T is lower for the low-
educated than for the high-educated. (And PSPC workers are lower educated workers than ICT
professionals.) Low-educated persons have generally more negative feelings towards education than
high-educated, because of past experiences in compulsory education like grade retention and
academic failure. Further, low-educated receive fewer chances on the labour market in terms of
educational leave paid by the employer or support from their close environment.
As such, it is expected that the goal and field of the learning activity substantially differ across job
typologies, because: (1) different job typologies are differently influenced by external forces that play
a significant role for changing job contents and tasks; and (2) different job typologies attract different
types of workers (and deliverable D4.1 shows that worker characteristics matter for participation in
adult learning across varying institutional contexts).
This deliverable D4.2 explores the extent to which job typologies matter from the perspective of the
occupational change observed in a digital era. Doings so, we try as much as possible to claim causal
effects of occupational change on participation in adult E&T by using carefully selected empirical
strategies. Furthermore, we assess occupational change by its quantitative aspects, looking at
employment dynamics, and by its qualitative aspects, looking at (shifts in) skill demand within
occupations.
A first empirical strategy uses the size of the firm within a firm fixed effects model. Fixed effects
models allow us to control for time invariant country-level and regional-level system-characteristics,
while taking advantage of variance in the level of employment and provision of adult learning by firm
size. The results from the fixed effects models indicate a positive and significant relationship between
observed employment dynamics in the respective ICT and PSPC sectors and participation in adult E&T.
In particular, we estimate that a 100 percent increase in the level of employment of ICT professionals
is associated with a 7.2 percent more uptake of job-related courses. And an increase in the level of
employment of PSPC workers with 100 percent, is associated with a 4.5 percent more on-the-job E&T.
Further evidence suggests that, while there is no universal increase in participation in adult E&T,
regions further advanced in occupational change show an increased intensity in adult learning.
Second, we exploit varying skill demand across different job typologies in a mediation analysis. It is
then argued that observed employment dynamics influence adult E&T (and particularly so, workplace
learning) through changes in skill demand across firms on the regional labour market. Workplace
learning follows labour demand rather than the reverse. The results from the mediation analysis
indicate that participation in job-related courses is indeed significantly mediated by the effective skill
demand by firms, in particular, among ICT professionals, and to lesser extent among PSPC workers. In
line with aforementioned different goals and field of learning activity across job typologies, we argue

7
that job-related courses are offered to PSPC workers as to start working in the job (e.g. as a result of
active labour market policies), while ICT professionals engage in adult learning as a way of upskilling
their skills (i.e. stimuli for continuous professional development).
To conclude with, deliverable D4.2 contains rich analyses and data that allows us to identity
important labour market movements that may thoroughly challenge the way we organize labour
nowadays, namely: as within fixed contours of (often a small) firm that operates in a well-defined
region. For example, we find evidence of an ongoing interdependency between regions of the
European Union, and forecast a rise in geographical mismatch between supply and demand of labour
in response to lacking cross-border mobility. These forecasts arise from the observation of further
regional specialization in the organisation of job typologies. If, for example, Belgium would specialize
in ICT professions (due to its high-educated labour force and strong focus on R&D policy and
innovation), and if the demand for PSPC workers remains constant (or steadily increases) over time,
then Belgium increasingly becomes depended on neighbouring regions in order to meet the demand
for PSPC workers. Even though considered beyond the scope of this report, our forecasts imply that
adult E&T is not only a national matter. On the contrary, it justifies the inclusion of adult E&T on the
European Union agenda.

Table of Contents
Foreword ................................................................................................................................................. 3
Executive summary ................................................................................................................................. 5
1 Introduction ................................................................................................................................... 13
2 Literature ....................................................................................................................................... 15
2.1 Technology Driven Occupational Change ............................................................................ 15
2.2 Lifelong Learning as a Policy Response ............................................................................... 17
3 Empirical Strategy ........................................................................................................................ 18
3.1 Fixed Effects Models ............................................................................................................ 18
3.2 Mediation Analysis ............................................................................................................... 20
4 Data ............................................................................................................................................... 21
4.1 Regional Level and Firm Level Data .................................................................................... 21
4.2 Key variables ........................................................................................................................ 23
4.2.a Level of Employment ........................................................................................................ 23
4.2.b Participation in Job-Related Courses ............................................................................ 24
4.2.c Skill Demand ................................................................................................................. 26
4.2.d Automation of Jobs ....................................................................................................... 27
4.3 Control Variables ................................................................................................................... 28
4.3.a Share of Dominant Industry .............................................................................................. 28
4.3.b Educational attainment .................................................................................................. 29
4.3.c Flexibility of the Labour Market ................................................................................... 30
4.3.d Union Density ............................................................................................................... 30
5 Employment Dynamics in the European Region .......................................................................... 31
5.1 Automation of Jobs and Employment ................................................................................... 31
5.2 Employment Protection and Employment ............................................................................ 32
5.3 Regional Specialisation and Demand for Skills .................................................................... 32
5.4 Adult E&T ............................................................................................................................ 35
6 Estimates ....................................................................................................................................... 35
6.1 Fixed Effects Models ............................................................................................................ 35
6.2 Mediation Analysis ............................................................................................................... 37
6.2.a Skill Demand and Employment Dynamics ................................................................... 37
6.2.b Skill Demand and Adult Education & Training ............................................................ 39
6.2.c Employment Growth and Adult Education & Training ................................................ 39
7 Conclusion .................................................................................................................................... 41

10
8 Policy Implications ....................................................................................................................... 41
8.1 Trade-off in Policy Choices .................................................................................................. 41
8.2 Policymaking towards Small and Medium-Sized Enterprises .............................................. 43
8.3 Adult E&T on the European Agenda .................................................................................... 43
9 List of Abbreviations .................................................................................................................... 44
10 References ................................................................................................................................. 44
11 Appendix A ............................................................................................................................... 49

11
List of tables Table 1: Total Number of Hours Worked by ICT Professionals and by PSPC Workers Relative to the
Total Number of Hours Worked by 1000 Workers in the Labour Force (Employment) ........................ 24
Table 2: Total Number of Hours Spend on Job-Related Courses in Last Four Weeks by ICT
Professionals and PSPC Workers Relative to the Total Number of Hours Spend on Job-Related Courses
by 1000 Workers in the Labour Force (Adult Education & Training).................................................... 25
Table 3: Automation Risk (%) by Firm Size ............................................................................................ 28
Table 4: Indicators of Labour Market Flexibility (%) by Firm Size ......................................................... 30
Table 5: Fixed Effects Models on Employment Dynamics and Participation in Adult E&T ................... 36
Table 6: Estimates on Skill Demand and Employment Dynamics (First-Stage Regressions) ................. 38
Table 7: Estimates on Skill Demand and Participation in Adult E&T (Reduced-Form Regressions) ...... 38
Table 8: Estimates on Employment Dynamics and Participation in Adult E&T (Second-Stage
Regressions) .......................................................................................................................................... 40
Table 9: Summary Statistics of Key Variables by Country ..................................................................... 49
Table 10: Main Employer by Firm Size (%) ............................................................................................ 50
Table 11: Union Density, Part-Time Contracts and Temporary Employment by Country and Firm Size
.............................................................................................................................................................. 51
Table 12: Skill Demand (max. 500 points) by Country and Firm Size .................................................... 52

12
List of figures Figure 1: Distribution of workers across firms in 20 European countries by size of the firm ................ 22
Figure 2: Ratio of Hours Spend on Job-Related Courses and Hours Worked per 1000 Workers ........... 26
Figure 3: Skill Demand by Year and Firm Size ....................................................................................... 27
Figure 4: Union Density by Country and Firm Size ................................................................................ 31
Figure 5: Likelihood of Automation of Jobs and Employment of ICT Professionals (Left-Hand Side) and
PSPC Workers (Right-Hand Side) in the Labour Force over the Period 2011-2016 ............................... 31
Figure 6: Relationship between Union Density and the Level of Employment of ICT Professionals (Left-
Hand Side) and PSPC Workers (Right-Hand Side) ................................................................................. 32
Figure 7: The Demand for Analytical Skills and Employment of ICT Professionals (Left-Hand Side) and
PSPC Workers (Right-Hand Side) in the Labour Force over the period 2011-2016 ............................... 33
Figure 8: Trade-off between ICT Professionals and PSPC Workers in 2016 .......................................... 34
Figure 9: Demand for Analytical Skills and Educational Attainment of Workers by Region and Firm
Size ........................................................................................................................................................ 34
Figure 10: Hours Spend on Job-Related Courses in Last Four Weeks per 1000 Workers and
Employment of ICT Professionals (Left-Hand Side) and PSPC Workers (Right-Hand Side) in the Labour
Force over the period 2011-2016 .......................................................................................................... 35
Figure 11: Change in the Demand for Analytical Skills and Intramural Investments in R&D................ 42
Figure 12: Hard to Fill Vacancies in IT and Intramural Investments in R&D ......................................... 42

1 Introduction
Job-related adult learning may serve different reasons or purposes, varying from continuous
professional development, or upskilling, to ‘simply’ meeting job entry requirements (goal and field of
learning activity). These different reasons are reflected in the title of this report: ‘Report on the
associations between system-level characteristics and participation in learning activities based on
work status, educational levels, goal and field of learning activity.’ The combination of all of these
elements reflected in the title in one analysis is empirically challenging. In the light of current debates
on the changing needs for skills on the labour market, and how it impacts adults from very different
backgrounds differently, however, it all seems driven by technical progress and its impact on
occupational change. We have reflected this in the sub-title: ‘occupational change due to technical
progress and its effect on participation in adult education and training.’
With advanced technologies being introduced in the workplace, the structure of employment and
its associated occupational organisation is changing. Such occupational change often implies a shift in
the demand for skills and, in turn, may impact the intensity of participation in adult E&T. This paper
aims at estimating the impact of occupational change on the intensity of participation in adult E&T.
Hereto, we identify two labour market segments on which technological advancements and
associated occupational changes may have a different impact, namely: ICT professionals and personal
service and personal care (PSPC) workers. The reasons to consider these two occupations are clear-
cut. Technological change over the past century is in favour of the provision of goods and services
related to information and communications technology (ICT). It nearly took 62 years to go from the
introduction of the Whirlwind Machine with RAM and real-time graphics in 1955 by MIT, over the first
IBM personal computer in 1981 with 16 kb of memory, and to the next generation personal computers
with 16 GB of memory in 2017. This evolution has changed societies into post-industrial service
economies, which increases the need for ICT skills, in particular, and tertiary education, in general
(OECD, 2013).1 Correspondingly, employment of ICT professionals, as a relative share of the total
workforce, substantially increased over time. Only looking at past 10 years, this relative share
increased with 36.1 percent. This increase corresponds to an average share of ICT professionals in the
workforce of 4 percent in 2017 in EU-28 (Eurostat, consulted in February 2019).2 At the same time,
the demand for PSPC workers, upon controlling for the business cycle, is fairly constant, at least, in
the short- to medium-run. Expectations are that in the long-run the demand for PSPC workers will
1 The OECD Skills Outlook reports on the result of the PIAAC project, and includes a Survey of Adult Skills of 22 OECD countries and two partner countries, Russia and Cyprus. 2 Finland, Sweden, Estonia, the United Kingdom and Luxembourg are frontrunners in the employment of ICT professionals, followed by the Netherlands, Belgium, Denmark, Ireland and Austria (Eurostat, consulted in February 2019).

14
increase as a result of demographic ageing. As such, the demand for PSPC workers rather depends on
the population structure and welfare in the region, than on technical change.
While observable trends in employment in ICT and PSPC sectors are clear-cut, the impact of these
trends on participation in adult E&T is still not well-understood. Boeren & Holford (2016) argue in
this respect that the country wherein adults live is a far stronger determinant of participation in job-
related adult E&T than individual-level characteristics. An empirical analysis of the impact of
occupational change on adult learning, as a means to meet skill demand, therefore, should isolate
system-level characteristics from aggregate participation rates in adult learning. We contribute in this
report to the previous literature by proposing a rather innovative empirical approach in order to
estimate the impact of occupational change on participation in adult E&T. The empirical approach
consists of two parts. First, we use the natural influences of firm size on the volume of labour hours
and on successfully organising adult E&T on-the-job. With regard to firm size, evidence increasingly
indicates that smaller firms suffer from financial and personnel restrictions in order to (sufficiently)
organise non-formal job-related courses at the workplace, or training in formal education (Kyndt &
Baert, 2013; EASME & DG GROW, 2019). We take advantage of this fact in the empirical application
by computing the hours of participation in job-related courses and the volume of labour employed by
micro-sized, small-sized and medium to large-sized enterprises. Then, we estimate fixed effects
models that control for invariant country-level and regional-level (unobserved) information; such that
the only variation in hours of labour employed and participation in job-related training exists at the
level of the firm size. Second, we exploit features of firms’ effective skill demand. Hereto, we conduct
a mediation analysis in order to explore the extent to which the effects of occupational change on
participation in adult E&T is driven by the demand for different types of skills within an occupation. It
is then argued that the increasing demand for analytical skills, among other things, due to
digitalisation, and trends of globalisation, may play an important role in participation in job-related
courses. For example, ICT professionals may engage in adult learning in order to stay in touch with the
latest techniques (i.e. upskilling). And PSPC workers need adult learning in order to train them to get
acquainted with the job (i.e. activation).
The second contribution of this report to previous literature deals with the data. In particular, we
have created a new pseudo-panel dataset that captures information on 21 European countries, which
represent over 170 regions, over the period 2011 to 2016. The dataset is unique in that it allows us
for the first time to conduct analysis at the level of the regions instead of the country. We use the
microdata from the European Union Labour Force Survey (EU LFS) for the computation of volume of
labour employed and adult E&T in job-related courses and for the calculation of several key variables.

15
Further, the microdata capture information on firm size, an essential component for the empirical
strategy.
This report proceeds as follows. Section 2 presents the literature. In Section 3, we explain the
methods used in order to estimate the impact of occupational change on participation in adult E&T.
Section 4 presents the data and the key variables. Then, in Section 5 we present the observed
employment dynamics in Europe. Estimates on the impact of occupational change on participation in
job-related learning are presented in Section 6. Section 7 concludes. Implications for policymaking are
discussed in Section 8.
2 Literature
2.1 Technology Driven Occupational Change
The speed of innovation in products and processes and the intelligence of new technologies have
consequences for employers’ skill demand. However, technological change is not uniformly affecting
the demand for labour through the whole skills or occupational spectrum. Instead, the change in the
demand for labour, driven by technological change, is biased towards the high-educated. It is,
therefore, often referred to in previous literature as the skill-biased technological change (originally
introduced as early as in Tinbergen, 1974). This bias leads to differences in employment dynamics
between various skills, or occupational groups; and we refer to this as technology driven occupational
change.
In the attempts to explain the observable occupational change, an influential stream of empirical
studies successfully tested the concept of the skills-biased technological change on data for the US
(Autor, 2002; Autor et al., 1998) or Western Europe (Berman et al., 1994). However, a more recent
wave of studies shows that the change in the demand for labour, observable since the Nineties, is not
a straightforward shift towards more skilled labour (among others, Goos et al., 2009, 2014; Acemoglu
& Author, 2011; David & Dorn, 2013). In fact, increased employment growth can also be observed for
workers employed in low-skilled occupations. In reaction to the U-shaped trend in the change of
demand for labour, Goos & Manning (2007) have formulated the job polarisation hypothesis. There is
an ongoing polarization of the industry wage structure in both the US (David et al. 2008; David & Dorn,
2013) and Europe (Goos et al., 2010): employment growth and wage increase is observable at the
bottom and at the top of the wage distribution (i.e. the distribution of lowest to highest paying jobs),
but remain stable or decline in the middle of it.
Literature provides evidence on the increasing level of employment in high-skilled complex jobs
owing to technical change (European Commission, 2019). At the same time, Autor et al. (2003) and

16
Goos et al. (2009, 2014) argue that low-skilled non-routine jobs are not at-risk of destruction due to
this observed technical change, because: (1) these jobs are not easily replaced by robots or computers;
and (2) people persistently demand care and services from workers in these non-routine jobs. High-
skilled complex jobs are found in the knowledge intensive, high-tech industries, while low-skilled non-
routine jobs in the less knowledge intensive, low-tech industries. These two aforementioned
employment dynamics have been referred to as the job polarization hypothesis (e.g. Goos & Manning,
2007, Goos et al., 2014).
The main driving force of job polarization is ‘automation’, namely: replacing manual tasks by
machinery. Looking at the occupational distribution, the automation risk is highest among: office
clerks; plant operators, transportation workers, assemblers or cleaners. Contrary, the automation risk
is lowest among healthcare practitioners (e.g. personal and protective service workers and personal
care workers) or in education, arts or computer engineering (e.g. ICT professionals and corporate
managers) (Frey & Osborne 2017; Nedelkoska & Qintini 2018).
Considering the updated evidence, Autor et al. (2003) have rephrased the hypothesis of skill-biased
technological change to the routine-biased technological change.3 They claim that routine tasks or
jobs get destructed because of the advancements in automation and robotics, while non-routine,
problem-solving, or complex communication tasks are not easily replaced by digital tools. Empirical
work points towards evidence of the routine-biased technological change. However, it also provides
evidence that, although high-skills are associated with more favourable prospects, not all high-skilled
employees benefit an equally high return to their education. Field of study, rather than level of
education, seems to be of growing importance in predicting observed returns to schooling (Altonji et
al., 2016). In particular, workers that combine analytical-technical skills with social skills have the best
labour market prospects (Deming et al., 2016; Deming, 2017). Professionals, who engineer products
and services in ICT, can be used as a particular example of those type of workers. At the same time, in
line with the job polarisation hypothesis, employment growth is also observed in the segment of less
complex occupations. Particularly those in less complex, but non-routine jobs, which involve complex
communication with other persons (Autor, 2003) and require social intelligence (Frey & Osborne 2017,
p. 266); such as personal care and personal (health) service workers.
The routine biased technological change hypothesis, and job polarisation hypothesis, are both trying
to explain the occupational change observed since the Nineties. In this report we are not trying to
explain the dynamics behind the occupational change. Instead we empirically test whether we are
3 The innovativeness of their approach lies in attracting the attention to the level of tasks rather than whole occupations. A stream of empirical studies testing the routine-based technological change on US and European data, confirmed that non-routine tasks are distributed across the occupational spectrum (for an overview, see: Lago Raquel & Biagi, 2018).

17
able to observe influences of the occupational change on participation in adult E&T. Such influences
are often assumed in strategic (supra-) national policy documents emphasising the importance of
adult learning.
2.2 Lifelong Learning as a Policy Response
Policymaking at the European level (European Commission, 2019), but also wider at the OECD level
(OECD, 2017; ILO, 2019), is concerned by the changes in the future of work, to a substantial extent
driven by technological progress. There is an agreement that continuous, whole-career, (adult)
learning becomes even more a necessity. The same applies, when considering the support of adult
E&T through public policies. The ILO (2019) calls for “lifelong learning for all”. The European Council
launched an initiative of Upskilling Pathways.4 And the European Pillar of Social Rights argues for a
universal right for quality and inclusive education, training, and lifelong learning.5 All of this initiatives
are a reaction to the changing world of work and aim at preparing individuals to fare better in future
labour market transitions. However, there are at least two reasons that call for a critical report.
First, job polarisation and the routine-biased technological change have implications for the demand
for adult E&T in order to meet labour demand. Evidence on population skills upgrading in reaction to
the routine-biased technological change is relatively more explored (Golding & Katz, 2007; Spitz,
2008)6. However, implications for adult learning remain not well-understood. If educational level is an
important predictor of the increase in adult E&T, then one may expect more adult E&T at the top of
the educational distribution, and only few at the bottom of it. As education enhances individual´s
ability to receive, decode and understand information (Nelson & Phelps, 1966), it becomes
increasingly important in environments where new technologies and innovations are being introduced
(such as the workplace) (Nedelkoska & Quintini, 2018). Occupations related to the provision of ICT
products and services generally require workers able to adapt to new technologies in order to meet
the needs on the labour market. Participation in adult E&T is perceived as an important route to
support people in undertaking this challenge (Boeren 2016, 2017). However, sectors with high
demand for workers in less complex, but non-routine jobs are usually intense of job-specific skills,
which may require on-the-job training, for example, in an internship, prior to full-time employment.
The demand for adult E&T may then depend on employment dynamics in these occupations that are
unrelated to observed trends in our digital era.
4 Besides the ENLIVEN work done on Upskilling Pathways, more information can be retrieved at: https://ec.europa.eu/social/main.jsp?catId=1224. 5 Information on the 20 main principles of the European Pillar of Social Rights can be retrieved at: https://ec.europa.eu/commission/priorities/deeper-and-fairer-economic-and-monetary-union/european-pillar-social-rights/european-pillar-social-rights-20-principles_en. 6 Exploring German longitudinal data Spitz (2005) claims that changes in the occupational content account for about 50 percent of the recent educational upgrading in employment.

18
Second, previous research shows that adults pursue different goals in life through participating in
learning activities. Boeren & Holford (2016) mention that the need to survive in a knowledge-based
economy (e.g. by gaining higher or more skills), and the need to live together (i.e. it has to do with the
social cohesion), are the two main reasons why adults nowadays participate in E&T. They also add that
people do participate in such activities as to achieve personal development. Delors (1996, 2013)
distinguish between four types of learning goals: ‘learning to know’, ‘learning to do’, ‘learning to be’
and ‘learning to live together’; which also can be reduced to the two goals of Boeren & Holford (2016):
the economic and the social ones. This implies that learning activities are heterogeneous.7 In order to
better understand how different system characteristics (such as job polarization) influence adult
learning, and given the aforementioned differential impact of the technological change across
different occupational dimensions, we have found it relevant for the present study to focus on adult
job-related non-formal E&T.
3 Empirical Strategy
3.1 Fixed Effects Models
We wish to estimate the effects of changes in the employment structure owing to technical
advancements (short: occupational change) on participation in adult E&T. Before going to the
technical part of this section, it is worth mentioning that occupational change implies quantitative and
qualitative aspects. The quantitative aspect relates to the rise (of new) and fall (of old) occupations
due to technical change. It deals with numbers rather than with contents. The qualitative aspects of
an occupational change deals with job contents (or tasks).
We assess quantitative aspects of occupational change by looking at medium-run employment
dynamics on the regional labour market. In particular, we propose to explore the employment
dynamics for two types of occupations that capture the high-skilled complex jobs and the low-skilled
non-routine jobs. With regard to the former type of occupations, we look at the provision of products
and services related to ICT (short: ICT professionals). And with regard to the latter type of occupations,
we look at the provision of personal care and personal (health) services (short: PSPC workers).
However, our report also contains an analysis of qualitative aspects of occupational change by
looking at skill demand in Section 3.2. Here it is acknowledged that changes in job contents (or tasks)
influence the skills needed to execute a job. In the event that the job contents drastically change, so
7 A European Commission’s work on the European Lifelong Learning Index, highlights that different types of learning activities belong to different dimensions of the Delors (1996, 2013) classification (Hoskins & Crick, 2010). This study shows that ‘adult participation rates in formal education and training’ has been fitted into the category ‘learning to know’, while ‘participation in job-related non-formal education and training’, have been assigned to ‘learning to do’.

19
that a new profession arises, the qualitative and quantitative aspects of occupational change are much
intertwined.
In order to define ICT professionals and PSPC workers in EU LFS, we follow the International Standard
Classification of Occupations (ISCO-08) manual. ISCO-88 was particularly out of date with respect to
occupations involved in the provision of goods and services related to ICT. Specified in ISCO-08 manual
(ICT professionals): Sub-major groups 25 and 35 (information and communication technology
professionals & information and communication technicians). Other unit groups that primarily involve
the production of ICT goods and services (e.g. Information and Communications Technology Services
Managers; Electronics Engineers; Telecommunications Engineers;…). PSPC workers are found in sub-
major groups 51 (travel attendants, cooks, waiters and bartenders, hairdressers, or building and
housekeeping supervisors); and 53 (child care workers and teachers’ aides, personal care workers in
health services).
In order to estimate the impact of occupational change on adult E&T, we may write:
ln(𝑌𝑐𝑟𝑡) = 𝛼0 + 𝛽0 ln(𝐸𝑐𝑟𝑓𝑡) + 𝛿0(𝑌𝑒𝑎𝑟 𝑡𝑟𝑒𝑛𝑑𝑡) + 𝜅0𝐺𝐷𝑃 𝑟𝑎𝑡𝑒𝑐𝑟𝑡 + ∑ 𝜇𝑗𝑋𝑗,𝑐𝑟𝑓𝑡 +
(𝜐𝑟 + 휀𝑐), for each type of occupation ∈ {PSPC;ICT} (1)
The variable 𝑌𝑐𝑟𝑡 denotes the level of participation in adult E&T in country 𝑐 ∈ {1,2, … ,21} and region
of work 𝑟 ∈ {1,2, … ,182} at time 𝑡. We express the outcome variable in the logarithm of the total of
hours spend on job-related courses in the last four weeks per 1000 workers in the labour force. At the
right-hand side of equation (1), we include the level of employment (𝐸𝑐𝑟𝑓𝑡) in country 𝑐 and region of
work 𝑟 and firm size 𝑓 ∈ {𝑚𝑖𝑐𝑟𝑜, 𝑠𝑚𝑎𝑙𝑙, 𝑚𝑒𝑑𝑖𝑢𝑚} in time period 𝑡. Similar as in Goos et al. (2009),
the variable indicates the total number of hours worked in the respective professions of ICT and PSPC
per 1000 workers. We also take the logarithm of the level of employment. Then, we include a year
trend, and an indicator for economic growth (GDP rate) as to control for the effects of economic
contraction and revival on the situation on the labour market. 𝑋𝑗,𝑐𝑟𝑓 is a set of control variables that
include the share of dominant industry, educational attainment of the regional pool of employed
individuals, two indicators for flexibility on the labour market, and union density. The reasons to
include these variables and their definitions are carefully explained in Section 4. 𝜐𝑟 denotes a
parameter that captures unobserved regional-level information, and 휀𝑐 is the standard error.
The variable 𝐸𝑐𝑟𝑓 is likely endogenous owing to system-level characteristics. Therefore, we consider
fixed effects models that allow us to control for time invariant country-level and regional-level system-
characteristics. Doing so, we take advantage of variance in the level of employment by firm size,

20
whereas micro-sized firms have larger financial and organisational constraints in employment and the
provision of adult E&T than medium to large-sized firms (among others, see: Westhead , Storey, 1997;
Johnson, 2002; Panagiotakopoulos, 2011; Kyndt , Baert, 2013). Controlling for country-level and
regional-level unobserved information on system-level characteristics by using fixed effects models,
the financial and organisational constraints remain a source of variation in manpower planning and
offering learning opportunities to employees. Further, firm size influences the likelihood to participate
in job-related courses, while we do not expect that the provision of workplace learning influence firm
size. The effect runs then from firm size to participation in adult E&T, and not reversed, which allow
us to come closer to causal claims.
3.2 Mediation Analysis
Besides fixed effects models in combination with variation in firm size, we also consider other
estimation specifications. From the literature it is argued that technical change particularly increases
the need for analytical skills, and leads to job creation in knowledge intensive industries (Arntz &
Zierahn, 2016; Frey & Osborne, 2017; Nedelkoska & Quintini, 2018). Skill demand can then be
considered as important driver of job creation (and destruction) for particular sectors, and, therefore,
skill demand can act as an important mediator for the level of employment in the respective ICT and
PSPC professions. As a robustness analysis for the main specifications using fixed effects models, we
wish to explore the mediation effects of skill demand in the relationship between the level of
employment and participation in adult E&T. Or else, we wish to explore the question: If, changes in
the employment structure due to technical advancements have important effects on participation in
adult E&T in the respective ICT and PSPC professions, are these effects then driven by skill demand by
firms? In this respect, we may write:
ln(𝐸𝑐𝑟𝑓𝑡) = 𝛼1 + 𝛾1𝑠𝑘𝑖𝑙𝑙 𝑑𝑒𝑚𝑎𝑛𝑑𝑐𝑟𝑓 + 𝛿1(𝑌𝑒𝑎𝑟 𝑡𝑟𝑒𝑛𝑑𝑡) + 𝜅1𝐺𝐷𝑃 𝑟𝑎𝑡𝑒𝑐𝑟𝑡 + (𝜐𝑟 + 휀𝑐),
for each type of occupation ∈ {PSPC;ICT} (2)
Skill demand is the indicator explained in Section 4.2.c. Using skill demand in a mediation analysis,
in fact, we conduct an instrumental variables analysis, where Equation (2) is the so-called first-stage
regression. An important assumption underlying instrumental variables is the exclusion restriction
(Angrist et al., 1996). This assumption implies that skill demand may only impact participation in adult
E&T through its effects on the level of employment. The need for particular skills in a firm can drive
the provision of adult E&T on-the-job. It is less likely that workplace learning directly increases the
number of jobs in a firm that demand for analytical skills. The literature indicates that job-related
courses are mostly offered to equip professionals or workers with the skills necessary to perform on
the job (Garavan et al., 2010; Kyndt & Baert, 2013). Workplace learning follows labour demand rather

21
than the reverse. However, it is worthwhile to explore the relationship between skill demand and
participation in adult E&T by estimating a reduced-form regression:
ln(𝑌𝑐𝑟𝑡) = 𝛼2 + 𝛾2𝑠𝑘𝑖𝑙𝑙 𝑑𝑒𝑚𝑎𝑛𝑑𝑐𝑟𝑓𝑡 + 𝛿2(𝑌𝑒𝑎𝑟 𝑡𝑟𝑒𝑛𝑑𝑡) + 𝜅2𝐺𝐷𝑃 𝑟𝑎𝑡𝑒𝑐𝑟𝑡 + (𝜐𝑟 + 휀𝑐) ,
for each type of occupation ∈ {PSPC;ICT} (3)
Finally, we write the second-stage equation as follows:
ln(𝑌𝑐𝑟𝑡) = 𝛼3 + 𝛽3 ln(�̂�𝑐𝑟𝑓𝑡) + 𝛿3(𝑌𝑒𝑎𝑟 𝑡𝑟𝑒𝑛𝑑𝑡) + 𝜅3𝐺𝐷𝑃 𝑟𝑎𝑡𝑒𝑐𝑟𝑡 + (𝜐𝑟 + 휀𝑐) ,
for each type of occupation ∈ {PSPC;ICT} (4)
The estimate of interest is 𝛽3, which denotes the effects (mediated by skill demand) of employment
dynamics on participation in adult E&T among ICT professionals and PSPC workers. All of the estimates
in the first-stage, the second-stage and reduced-form regressions, are controlled for invariant country-
level and regional-level system characteristics.
4 Data
4.1 Regional Level and Firm Level Data
The empirical basis of our analyses is the European Union Labour Force Survey (EU LFS). The survey
covers EU-28 countries and Norway, Iceland, and Switzerland. Moreover, the data collected at
regional level, and for the time periods 2011 to 2016, count enough observations in order to remain
representative. In fact, the EU LFS has the most observations among EU wide surveys administrated
by Eurostat. Furthermore, the data can be disaggregated by firm size. Doing so, we look at the EU LFS
question on size of the firm of the respondents’ main job. They could answer micro-sized (<10
employees), small-sized (10-49 employees), or medium to large-sized (≥ 50 employees). The share of
respondents by size of the firm is visualized in Figure 1. From this figure it is clear that a substantial
share of employees (almost 60 percent) work in small to micro-sized firms. However, there is variation
between countries. Table 10 in the Appendix shows that for Cyprus, Estonia, Finland and the United
Kingdom, the share of adults employed in medium to large-sized firms exceeds 50 percent. In
Switzerland, Latvia and Lithuania, the majority of adults are employed in small-sized enterprises,
whereas Italy is the only country where the majority of the adults is employed in micro-sized firms
(43.1 percent).

22
Figure 1: Distribution of workers across firms in 20 European countries by size of the firm
Source: Own computations by using EU-LFS 2011-2016.
A final important feature of the pooled dataset using the EU LFS, is that we take the goal of the most
recent learning activity into account. The EU LFS is the only statistical survey measuring participation
in adult E&T at regional level and in a European context. It allows us to retrieve information on the
reasons of why adults participate in learning, namely: for social reasons or for job-related reasons.
Recall that this report focusses on the job-related participation in adult learning (see discussion in
Section 1). In particular, we look at information on hours spend on job-related courses, and leave
information on courses done for social reasons aside. This decision implies that we only keep
employed adults aged 25-64 in the data. It is argued that employment dynamics may have largest
effects on participation in job-related courses, while their effect on other type of courses is unclear.
Information on goal of the learning activity was available only for 21 countries, namely: Austria,
Belgium, Croatia, Cyprus, Estonia, Finland, France, Germany, Greece, Hungary, Iceland, Ireland, Italy,
Latvia, Lithuania, Luxembourg, the Netherlands, the Slovak Republic, Spain, Switzerland, and the
United Kingdom.8 These 21 countries represent 173 regions (NUTS-II9). Thus, the selection of these
countries in the analysis is solely based on having information on participation in job-related courses.
Appendix A (Tables 9 to 12) presents summary statistics of key variables for further analyses.
In sum, we have constructed a pooled dataset including the EU LFS surveys from 2011 to 2016 in
order to explore the effects of employment dynamics on the regional labour market on participation
in adult E&T. These aggregated data account for the level of the region, the country, and firm size, and
all variables that we have constructed from the EU LFS are weighted by using the survey weights
provided by EU LFS.
8 It is acknowledged that Romania also has information on goal of the learning activity. However, we had to drop this country from analysis due to small sample size in cells when disaggregating the data to regional level and firm size level. 9 NUTS is the abbreviation of the nomenclature of territorial units for statistics. NUTS-II are the basic regions for the application of regional policies. (DOI: https://ec.europa.eu/eurostat/web/nuts/background)

23
4.2 Key variables
4.2.a Level of Employment
Table 1 presents the total number of hours worked by ICT professionals and by PSPC workers relative
to the total number of hours worked by 1000 workers in the labour force. This measure for level of
employment is calculated for each region (within each country) in the data. As such, the observed
mean and standard deviation reflect the differences in volume of labour employed by region and
country. Further, it accounts for the level of employment generated by a firm according to its size.
There are two contrasting tendencies which persist over time. First, medium to large-size firms
generally create more employment for ICT professionals than smaller firms. Further, it appears from
the data that in the aftermath of the financial crisis and the government debt crisis a lot of
employment among ICT professionals shifted from smaller to larger firms.10 While smaller firms faced
bankruptcy, larger firms increasingly attracted ICT professionals. In line with this evidence the overall
employment level of ICT professionals increased between 2011 and 2016 in the European region.
Second, in the case of the PSPC workers, smaller firms tend to create more employment for PSPC
workers than larger firms. It also observed that the share of hours worked by PSPC workers in the
labour force decreased between 2011 and 2014, but then started recovery in the years 2015 and 2016.
Labour demand for workers in the field of personal services and personal care follows the features of
a derived demand (Goos et al., 2014). This means that consumers spend less on personal services and
personal care in times of an economic downturn, which impact profit, and which generate a negative
impact on the level of employment in that sector.
10 There is evidence from the United States of America in this respect that larger, more capital-intensive firms accelerated innovation in these difficult years in order to survive on a competitive labour market (Hershbein and Kahn, 2016).

24
Table 1: Total Number of Hours Worked by ICT Professionals and by PSPC Workers Relative to the Total Number of Hours Worked by 1000 Workers in the
Labour Force (Employment)
Micro-sized Small-sized Medium to large-sized
mean std.dev. mean std.dev. mean std.dev.
ICT professionals
2011 38.7 23.2 52.4 23.3 61.7 30.5
2012 39.5 24.3 53.0 20.8 65.1 31.8
2013 39.8 23.6 55.7 22.9 67.6 33.6
2014 42.9 25.3 55.0 24.1 68.0 35.3
2015 43.2 26.3 53.8 24.0 68.8 34.5
2016 43.3 28.2 55.3 25.3 70.2 35.2
PSPC workers
2011 129.5 104.2 78.5 31.3 54.6 29.8
2012 130.9 110.4 78.3 30.7 51.9 26.3
2013 121.4 44.6 75.4 33.2 50.6 24.2
2014 122.5 46.3 75.2 30.7 48.6 23.6
2015 123.8 47.3 77.4 34.8 50.2 25.4
2016 129.7 46.9 80.0 36.9 48.2 21.1
Source: Own computations by using EU-LFS 2011-2016.
4.2.b Participation in Job-Related Courses
Table 2 presents the total number of hours spend on job-related education and training by ICT
professionals and by PSPC workers relative to the total number of hours spend on job-related
education and training by 1000 workers in the labour force.
The figure is again calculated for each region (within a country), and it accounts for participation in
adult E&T in a given firm where the ICT professionals and PSPC workers are employed according to its
size. There is evidence that larger firms offer more opportunities to employees to participate in job-
related courses, whereas they are more capital-intensive to finance it. Further, larger firms can more
easily counter productivity loss when an employee is learning instead of working (CEDEFOP, 2010).

25
Table 2: Total Number of Hours Spend on Job-Related Courses in Last Four Weeks by ICT Professionals and PSPC Workers Relative to the Total Number of Hours
Spend on Job-Related Courses by 1000 Workers in the Labour Force (Adult Education & Training)
Micro-sized Small-sized Medium to large-sized
mean std.dev. mean std.dev. mean std.dev.
ICT professionals
2011 89.8 155.4 114.2 147.6 87.7 81.2
2012 80.6 118.5 86.3 77.5 85.4 64.6
2013 75.6 96.9 79.7 60.6 86.7 62.6
2014 75.7 116.9 69.0 62.5 82.9 58.4
2015 74.5 113.1 63.5 51.3 86.4 60.0
2016 74.3 99.3 81.2 72.6 92.9 65.4
PSPC workers
2011 129.9 179.6 97.7 91.6 65.7 105.9
2012 102.9 145.2 79.7 81.6 56.4 63.7
2013 96.8 102.0 74.2 115.4 52.5 61.3
2014 97.7 89.7 78.8 69.3 42.6 39.5
2015 103.2 113.2 70.1 64.9 38.5 46.4
2016 92.5 79.2 77.6 88.4 49.5 56.3
Source: Own computations by using EU-LFS 2011-2016.
Hours of learning by ICT professionals for job-related reasons generally do not vary a lot by firm size,
while it seems that PSPC workers have more opportunities to learn in smaller than in larger firms. In
the case of PSPC workers, this is in line with the observation of higher levels of employment in smaller
firms. In fact, the nature of job-related education and training for PSPC workers is expected to be quite
different than the nature of learning among ICT professionals. While PSPC workers have to follow
education or training in order to start as an employee in the sector (i.a. activation), ICT professionals
more often engage in learning activities in order know about the latest advances (i.e. upskilling). The
ICT sector seems to be more prone to continuous improvement from which learning activities follow.
Figure 2 confirms, and indicates that in the year 2011 ICT professionals spend almost two times more
hours in job-related courses than PSPC workers. The gap between these two professions slightly
reduced in 2012 to 1.5 times and stayed unchanged till 2016.
In line with hours worked in the previous section, we observe negative influences of the 2008
financial crisis and subsequent government debt crisis on the hours of spend on job-related courses.
For both ICT professionals and PSPC workers, participation in adult learning on-the-job decreased in
2012, 2013 and 2014. Signs of recovery are present in 2015 and 2016, but the hours are increasing
with a different speed in the last years of study by firm size and by sector of employment.

26
Figure 2: Ratio of Hours Spend on Job-Related Courses and Hours Worked per 1000 Workers
Source: Own computations by using EU-LFS 2011-2016.
4.2.c Skill Demand
We estimate the demand for skills by using the American O*NET surveys.11 By using the skill surveys,
we retrieve information on the skills necessary to successfully perform in a job. Then, the skill
information per occupation (Standard Occupational Classification; 2010-SOC) from the O*NET surveys
are merged to three digit ISCO-08 occupations.12 In this way we have information on skill demand for
436 occupations in ISCO-08. Several other studies have done a similar exercise (Goos et al., 2014;
Hardy et al., 2018; Nedelkoska & Quintini 2018).13
Box 1: The Demand for Analytical Skills; the Demand for Social Skills; and the Demand for Physical Skills
(Reliability Statistics between Brackets)
Analytical skills (Complex problem solving, Mathematics, Operations analysis, Programming, Science,
Systems analysis, Systems evaluation (cronbach’s alpha: 0.8775))
Social skills (Active listening, Coordination, Instructing, Negotiation, Persuasion, Service orientation,
Social perceptiveness, Time management (cronbach’s alpha: 0.9583))
Physical skills (Equipment maintenance, Equipment selection, Installation, Operation monitoring,
Operation and control, Repairing, Troubleshooting (cronbach’s alpha: 0.9416))
In particular, we construct three measures of skill demand, namely: the demand for analytical skills;
the demand for social skills; and the demand for physical skills. Box 1 summarizes the underlying
variables measuring the concepts. These underlying variables are measured by independent job
analysts (or job incumbents) on a five-point Likert-scale. The average score on, for example, the
11 Further information can be obtained at: https://www.onetonline.org/). 12 In order to merge 2010-SOC with ISCO-08, a readily available open access crosswalk at http://ibs.org.pl/en/resources/occupation-classifications-crosswalks-from-onet-soc-to-isco/ has been used. 13 CEDEFOP 2013 explored the similarities between O*NET and multiple European surveys pointing at a high correlation between the categories used (0.8).

27
demand for analytical skills is then multiplied by 100, so that the maximum score on the scale is 500,
because an increase with 0.1 on a 5-point Likert scale represents a significant increase in the demand
for analytical skills. By multiplying by 100, we wish to account for this.
Figure 3: Skill Demand by Year and Firm Size
Source: Own computations by using EU-LFS 2011-2016. Skill
demand is derived from the O*NET skill surveys.
In Figure 3, we present skill demand by type of skill, year and firm size. This figure indicates that
social skills are persistently at the highest demand in firms regardless of their size, whereas physical
skills are at the lowest demand. Table 12 in the appendix shows that the demand for social skills is
highest in all 20 countries. The table also indicates that the demand for social skills is most tangible in
the case of medium to large-sized enterprises.
4.2.d Automation of Jobs
Firms face a shift in production modes from routine, less complex tasks at the workplace to non-
routine, more complex tasks that require a mixture of analytical and social skills (Deming, 2017).
Despite that routine tasks are distributed across occupations and sectors, they are less omnipresent
in complex jobs. Frey & Osborne (2017) argue that the complexity of occupations is negatively
associated with the susceptibility to computerisation.14 In support of this claim, Arntz et al., (2016,
p.14) find that the risk of automation of jobs “[…] is lower in jobs with high educational job
requirements or jobs which require cooperation with other employees or where people spend more
time on influencing others.” It is then argued that automation risk is considered as an important driver
of the demand for analytical skills. Section 5.1 explores this relationship. In order to estimate the
likelihood of the automation of jobs, we follow the methodology as described in Frey & Osborne
(2017). Similarly as for skill demand, the US database of job descriptions O*NET is underlying the
construction of the variable. In particular, Frey & Osborne (2017) estimate the occupation specific
14 Frey and Osborne (2017) assess in their study the occupation specific susceptibility to computerisation in the digital era.
28
probabilities of computerization for each occupation in O*NET, by looking at the expected advances
in machine learning and robotics. Then, these occupation specific probabilities are merged to
occupations (ISCO-08) in the EU LFS. The variable automation risk has variance at the level of the
region (within a country), and also accounts for differences between firms.
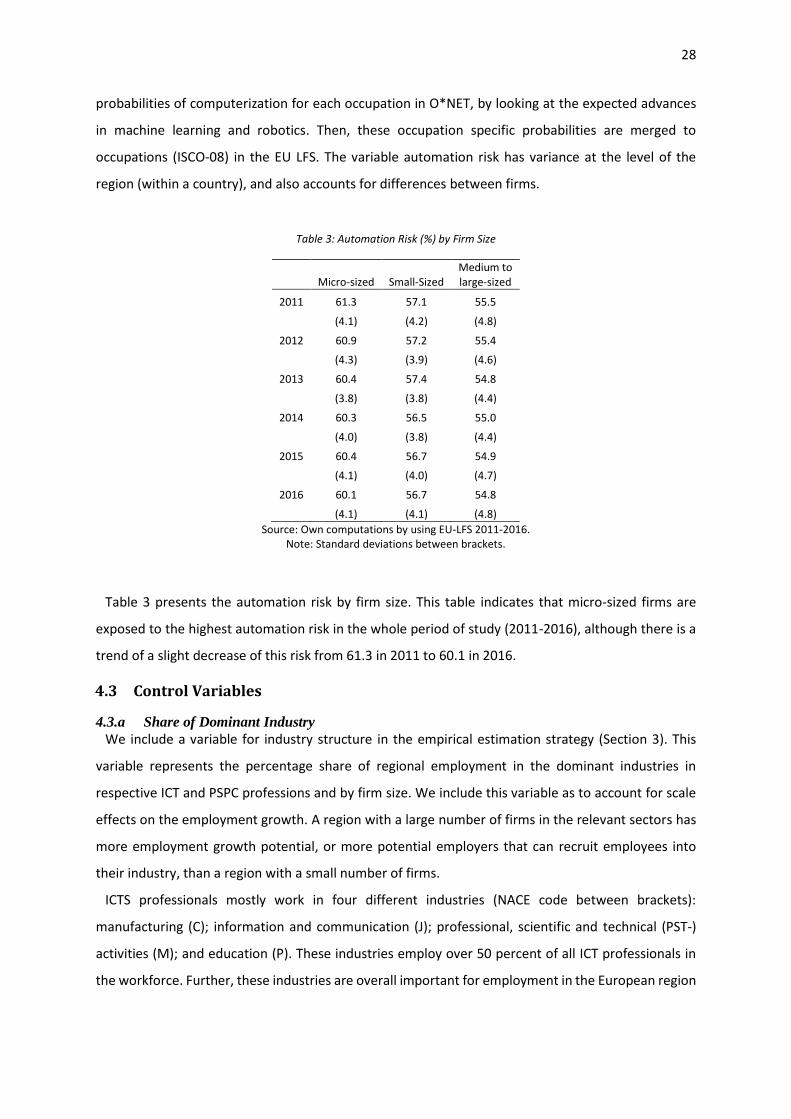
Table 3: Automation Risk (%) by Firm Size
Micro-sized Small-Sized Medium to large-sized
2011 61.3 57.1 55.5
(4.1) (4.2) (4.8)
2012 60.9 57.2 55.4
(4.3) (3.9) (4.6)
2013 60.4 57.4 54.8
(3.8) (3.8) (4.4)
2014 60.3 56.5 55.0
(4.0) (3.8) (4.4)
2015 60.4 56.7 54.9
(4.1) (4.0) (4.7)
2016 60.1 56.7 54.8
(4.1) (4.1) (4.8)
Source: Own computations by using EU-LFS 2011-2016. Note: Standard deviations between brackets.
Table 3 presents the automation risk by firm size. This table indicates that micro-sized firms are
exposed to the highest automation risk in the whole period of study (2011-2016), although there is a
trend of a slight decrease of this risk from 61.3 in 2011 to 60.1 in 2016.
4.3 Control Variables
4.3.a Share of Dominant Industry
We include a variable for industry structure in the empirical estimation strategy (Section 3). This
variable represents the percentage share of regional employment in the dominant industries in
respective ICT and PSPC professions and by firm size. We include this variable as to account for scale
effects on the employment growth. A region with a large number of firms in the relevant sectors has
more employment growth potential, or more potential employers that can recruit employees into
their industry, than a region with a small number of firms.
ICTS professionals mostly work in four different industries (NACE code between brackets):
manufacturing (C); information and communication (J); professional, scientific and technical (PST-)
activities (M); and education (P). These industries employ over 50 percent of all ICT professionals in
the workforce. Further, these industries are overall important for employment in the European region
29
with nearly 18 percent of workers employed in manufacturing; over 8 percent in education; 5 percent
in PST-activities; and 3 percent in information and communication.
Personal service and personal care (PSPC) workers work in two dominant industries: accommodation
and food service activities (I); and human health and social work activities (Q). These two industries
alone cover almost 65 percent of the total of personal service and personal care workers.
However, the share of the industries that employ over 50 percent of all ICT professionals in the
workforce varies considerably by European country. More specifically, this share ranges from 28.7
percent in Luxembourg to 51.5 percent in Croatia. This country gap is even higher when it comes to
the industries where the PSPC workers mainly work: from 10 percent in Cyprus to 40.8 percent in
Croatia.
4.3.b Educational attainment
The rising need for analytical skills can be better met in job markets with a larger pool of
professionals with tertiary education. At the same time, educational attainment plays a key role in
adult E&T (Cabus et al., 2018). Therefore, we include the level of educational attainment of the
regional pool of workers as a control variable. The variable is constructed by using the EU LFS, and also
accounts for differences in educational attainment by firm size.
In particular, we can distinguish between the share of low-educated employees (ISCED 0-2)across
regions and by firm size; medium-educated (ISCED 3-4); and high-educated (ISCED 5 and higher).
Appendix A (Table 9) summarizes the share of employees by educational attainment by country. The
share of low-educated in the employed regional labour force is highest in Iceland (14.1 percent); the
Netherlands (13.5 percent); Italy (12.8 percent); Spain (12.3 percent); and Luxembourg (10.2 percent).
On the contrary, countries with a lot of tertiary educated employees in the labour force are: Lithuania
(79.2 percent); Cyprus (75.3 percent); Greece (71.8 percent); Spain (69.5 percent); and Ireland (69.5
percent). Interestingly, the country of Spain has a lot of low- and high-educated employees, and only
a small pool of employees with only a secondary education diploma. Therefore, it appears twice in the
list of top 5 countries with a lot of low- and high-educated employees above. Another important
observation, is that a lot of low-educated individuals are unemployed, for example, like in Greece.
Therefore, we observe in Appendix A (Table 9) only a small amount of employed workers in Greece
with less than a secondary diploma, while a lot of workers with tertiary education in the regional
labour force. The observation that employees with tertiary educational attainment have higher
employment rates, is valid for most of 20 European countries. Only few countries, like the
Netherlands, and the Slovak Republic, have an almost equal share of medium- and high-educated
employees in the regional labour force. And further, in Austria, Italy and the Slovak Republic, the share
of medium-educated employees is highest.

30
4.3.c Flexibility of the Labour Market
We have constructed two additional indicators that reflect the flexibility of the labour market,
namely: the share of part-time contracts and the share of temporary jobs. Table 4 shows that micro-
sized firms are the most flexible ones when it comes to part-time contracts, but the least flexible when
it comes to temporary employment. However, the share of part-time contracts increased slightly
between 2011 and 2016 in all three types of enterprises. On the contrary, an increase in the share of
temporary employment in the regional labour force occurred in the same period only in medium to
large-sized enterprises. A slight decrease in temporary employment is present in the case of small-
sized enterprises.
Appendix A (Table 11) summarizes the share of part-time contracts and temporary employment by
country and size of the firm. It is observed that the Netherlands has highest share of employees with
a part-time contract. About 50 percent of employees working in micro-sized firms has this type of
contract; 43.1 percent in small-sized firms; and 38.6 percent in medium to large-sized firms.
Temporary employment is also common in the Netherlands, but as common as in Spain, Croatia,
Hungary, and Finland, where the percent share of individuals in temporary employment exceeds 10
percent for all types of enterprises.
Table 4: Indicators of Labour Market Flexibility (%) by Firm Size
Part-time contracts Temporary employment
Micro-sized Small-Sized Medium to large-sized
Micro-sized Small-Sized
Medium to large-sized
2011 21.6 16.6 12.6 8.0 10.2 9.1
(12.5) (12.4) (10.1) (8.2) (8.8) (7.7)
2012 23.5 19.2 13.4 7.3 9.7 8.6
(11.1) (11.2) (8.9) (5.9) (6.8) (5.5)
2013 25.6 18.9 14.4 7.4 10.2 9.3
(11.1) (11.5) (8.4) (6.8) (9.5) (6.3)
2014 25.2 19.5 14.3 8.1 9.5 8.9
(10.3) (12.1) (8.3) (7.7) (6.5) (5.4)
2015 25.5 18.8 14.0 8.3 9.6 9.7
(11.5) (12.2) (8.8) (8.1) (8.3) (6.4)
2016 25.8 19.8 14.5 8.1 9.4 9.5
(11.1) (12.5) (8.9) (6.6) (7.9) (6.2)
Source: Own computations by using EU-LFS 2011-2016. Note: Standard deviations between brackets
4.3.d Union Density
Employment protection on the regional labour market can be reflected in the percent share of firms
with union representation. Union density by country and firm size was derived from the European
Social Survey. Figure 4 illustrates that there are considerable differences in union density across

31
European countries, being highest in Iceland and Finland and lowest in Hungary and Estonia. It also
demonstrates that with few exceptions (Belgium, Luxembourg, Romania, Germany and Latvia), the
higher the size of the firm, the higher is the union density.
Figure 4: Union Density by Country and Firm Size
Source: Own computations by using the European Social Survey (2010-2016).
Figure 5: Likelihood of Automation of Jobs and Employment of ICT Professionals (Left-Hand Side) and PSPC
Workers (Right-Hand Side) in the Labour Force over the Period 2011-2016
Source: Own computations by using EU-LFS 2011-2016. The risk for automation of jobs follows the
methodology of Frey and Osborne (2017).
5 Employment Dynamics in the European Region
5.1 Automation of Jobs and Employment
In this section we explore the extent to which employment dynamics, among jobs at the bottom and
at the top of the wage distributions, are influenced by automation of jobs. A summary of skill demand
across countries and firm size can be found in Appendix A (Table 12). Figure 5 plots the likelihood of
automation of jobs (X-axis) and the logarithm of the level of employment in the respective ICT and
PSPC professions (Y-axis). There is a significant negative association between automation of jobs and

32
the level of employment of ICT professionals in the figure on the left-hand side. It is a matter of fact
that societies that automate (routinized) jobs are in need of ICT professionals for the development
and implementation of the technology underling this process of automation.
On the contrary, we do not find a significant relationship between automation of jobs and the level
of employment of PSPC workers. This finding confirms that these low-skilled jobs are not destructed
by technical change, most likely because of the non-routine nature of PSPC professions, and as
suggested by the job polarization hypothesis.
5.2 Employment Protection and Employment
Figure 6 presents the bivariate associations between union density and the level of employment of
ICT professionals and PSPC workers. It illustrates that the level of employment is substantially higher
in countries where the union density is higher. However, in the case of ICT professionals, the
association between employment and union density is stronger in comparison to the PSPC workers.
These findings are in line with the results of Gebel & Giesecke (2016). The authors argued that union
power, as measured by collective bargaining coverage, reduces the risks of being unemployed, in
particular among low educated young women. We retain from these figures that labour market
system characteristics have important influences on the level of employment.
Figure 6: Relationship between Union Density and the Level of Employment of ICT Professionals (Left-Hand Side) and PSPC Workers (Right-Hand Side)
Source: Own computations by using EU-LFS 2011-2016. Union density by firm
size is a variable derived from the European Social Survey (2010-2016).
5.3 Regional Specialisation and Demand for Skills
We plot the level of employment on the Y-axis and the demand for analytical skills on the X-axis in
Figure 7. The left-hand side presents the level of employment of ICT professionals, and the right-hand
side the level of employment of PSPC workers.
The demand for analytical skills is positively associated with the level of employment of ICT
professionals, and negatively associated with the level of employment of PSPC workers. These figures

33
indicate regional specialisation. Further, these figures point out that polarization between high-tech
(analytical) jobs and non-routine (physical intense) jobs happens at the regional-level. It appears that
regions with an increase in demand for analytical skills attract more professionals into the high-tech
ICT industry, and, at the same time, reduce employment for PSPC workers. The increase in the demand
for analytical skills is, therefore, considered as an important driver of regional specialisation in skills.
Figure 7: The Demand for Analytical Skills and Employment of ICT Professionals (Left-Hand Side) and PSPC Workers (Right-Hand Side) in the Labour Force over the period 2011-2016
Source: Own computations by using EU-LFS 2011-2016. The demand for analytical skills is derived from the
O*NET skill surveys.
This is confirmed in Figure 8 where we observe a significant trade-off in the year 2016 between ICT
professionals and PSPC workers. Further analyses (not shown in this report) indicate that a significant
share of the variance in Figure 8 can be explained by country differences in the educational level of
the workforce (i.e. the human capital stock). The higher the stock of human capital, the more likely a
country (region) specialises in employment of ICT professionals, and the less likely in employment of
PSPC workers. This pattern (specialisation in ICT at the cost of PSPC) is particularly (but not uniformly)
observed for countries at the top end of the educational distribution across Europe; with the most
prominent examples Estonia and the Netherlands.

34
Figure 8: Trade-off between ICT Professionals and PSPC Workers in 2016
Our data also provide evidence on the skill-biased technological change in Figure 9. The increase in
demand of analytical skills is positively associated with a regional pool of workers with tertiary
educational attainment, and negatively associated with secondary and lower than secondary
educational attainment.
Figure 9: Demand for Analytical Skills and Educational Attainment of Workers by Region and Firm Size
Source: Own computations by using EU-LFS 2011-2016. The demand for analytical skills is derived from the
O*NET skill surveys.

35
5.4 Adult E&T
We plot participation in adult E&T and the level of employment of ICT professionals and PSPC
workers in Figure 10. For both professions we observe a positive association between the hours spend
on job-related courses and the level of employment in the respective professions. These figures are
suggestive on the positive and significant relationship between employment dynamics and adult
learning for job-related reasons in the respective ICT professions (R²=0.16) and PSPC professions
(R²=0.08). However, they also suggest that this relationship is stronger for ICT professionals than for
PSPC workers. In the next Section 6 we estimate these relationships again, but then controlling for as
much as possible unobserved country level and regional level system characteristics.
Figure 10: Hours Spend on Job-Related Courses in Last Four Weeks per 1000 Workers and Employment of ICT Professionals (Left-Hand Side) and PSPC Workers (Right-Hand Side) in the Labour Force over the period 2011-2016
Source: Own computations by using EU-LFS 2011-2016.
6 Estimates
6.1 Fixed Effects Models
This section presents the main results on the effects of employment dynamics on participation in
job-related education and training. Table 5 summarizes the results. Six models in total are presented,
or three models for each type of occupation. Each model is controlled for invariant country-level and
regional-level information by using fixed effects estimation techniques. The regressions includes 20
countries that represent 173 regions for ICT professionals, and 172 regions for PSPC workers.15
The results of Model 1 indicates a positive and significant relationship between the level of
employment and participation in adult E&T. In particular, we estimate that a 100 percent increase in
the level of employment of ICT professionals is associated with a 7.2 percent more uptake of job-
related courses. Controlling for features of regional labour supply, such as the availability of
15 Due to small sample size for one region, there is one region less for the PSPC workers.

36
educational attainment, and the share of dominant industry wherein ICT professionals work, reduces
the estimate to 6.0 percent significant at 10 percent-level (Model 2). Tertiary educational attainment
in the regional labour force leads to an increase in adult learning with 5 percent. Cabus et al. (2018)
already indicated that high-educated have an increased likelihood to engage in adult learning than
low-educated. However, we also observe in Model 2 that regions with a higher share of low-educated
have higher participation in training. This finding is in line with features of the job polarization and
routine biased technological change hypotheses: middle class jobs are disappearing owing to
automation. Persons with at most upper secondary education are more often engaged in middle class
jobs. This may then explain the reduced hours spend on job-related courses among medium-educated
(for a discussion, see also the skills forecast of CEDEFOP (2016) and the ESJS (2014)).16
Table 5: Fixed Effects Models on Employment Dynamics and Participation in Adult E&T
ICT professionals PSPC workers
Model 1 Model 2 Model 3 Model 1 Model 2 Model 3
Ln(Employment) 0.072 *** 0.060 * 0.090 ** 0.045 *** 0.043 * 0.042
(0.025) (0.031) (0.038) (0.014) (0.025) (0.033)
Year trend 0.010 0.011 0.008 -0.008 -0.006 -0.006
(0.013) (0.013) (0.013) (0.015) (0.015) (0.017)
GDP rate -0.017 ** -0.017 ** -0.019 ** 0.001 0.000 -0.001
(0.008) (0.008) (0.008) (0.010) (0.010) (0.010)
Dominant industry 0.000 0.000 0.002 * 0.002
(0.001) (0.001) (0.001) (0.002)
Low-educated 0.006 * 0.007 ** 0.005 0.005
(0.003) (0.003) (0.003) (0.004)
High-Educated 0.003 ** 0.005 *** -0.002 -0.003
(0.002) (0.002) (0.002) (0.002)
Part-time contract 0.000 0.001
(0.002) (0.002)
Temporary job -0.005 ** 0.003
(0.002) (0.003)
Union density -0.004 *** 0.001
(0.001) (0.001)
Constant -16.057 -17.582 -12.963 19.497 14.774 16.393
(25.281) (25.166) (26.180) (30.833) (31.130) (34.294)
Obs. 2,406 2,406 2,070 2,397 2,397 2,097
Clusters 173 173 170 172 172 167
Note: All models have been estimated using regional-level and country-level fixed effects.
16 Information can be retrieved at: https://www.cedefop.europa.eu/en/publications-and-resources/data-visualisations/skills-forecast and https://www.cedefop.europa.eu/en/events-and-projects/projects/european-skills-and-jobs-esj-survey.

37
In Model 3, we additionally control for indicators of flexibility of the labour market. We find that a
100 percent increase in the level of employment of ICT professionals is significantly associated with 9
percent more uptake of job-related courses. As such, this estimate is fairly close to the estimate of
Model 1. The estimates on the share of temporary employment (-0.5 percent) and union density (-0.4
percent) are also significant. The sign of the estimates are negative. As such, more temporary
employment and more firms with union representatives in the region of work leads to less time spend
on adult learning. It is intuitive that employers will invest less financial resources in employees that
are only temporary in the firm. However, the results on union density are more difficult to understand.
It may be the case that regions with a lot of union representations have a higher level of employment,
and, therefore, more hours of work (Section 5.2), which leads to fewer time left for adult learning. If,
this reasoning would hold, then this would also indicate that unions have less influence on the learning
opportunities of the workers they represent.
Across all three models estimated for ICT professionals, the variable GDP rate is negatively
associated with the hours spend on job-related courses. The estimate is equal to -1.7 percent
significant at 5 percent-level in Model 1 and Model 2, and further increases in magnitude to -1.9
percent in Model 3. These estimates indicate that economic growth reduces the total number of hours
spend on job-related courses relative to adult learning in the total labour force per 1000 workers. One
possible reason for this may well be that during times of economic revival, ICT professionals spend
more time working, leading to fewer hours available for learning. When looking at the estimates of
the PSPC workers, this conclusion on GDP rate does not hold.
Further, we estimate that an increase in the level of employment of PSPC workers with 100 percent
is associated with a 4.5 percent more on-the-job E&T. This finding is robust to including control
variables with regard to educational attainment, however, it is not robust to including the indicators
of labour market flexibility. In fact, in the final Model 3, we cannot identify a single variable with a
significant relationship with adult learning for job-related reasons. A likely explanation for this
observation is that PSPC workers engage in adult learning in order to start in the job, and learn all
necessary competences for doing the job right, rather than as a means for upskilling while already on
the job. However, this explanation is difficult to test with our data, because it would require
information on the share of public resources directly spend on PSPC workers, for example, within the
scope of active labour market policy.
6.2 Mediation Analysis
6.2.a Skill Demand and Employment Dynamics
Table 6 presents the first-stage estimates (see Equation (2) in Section 3.2). Each model is controlled
for invariant country-level and regional-level information by using fixed effects.

38
Table 6: Estimates on Skill Demand and Employment Dynamics (First-Stage Regressions)
ICT professionals PSPC workers
(Ref. Physical skills)
Analytical skills 0.189 *** -0.310 ***
(0.019) (0.018)
Social skills 0.001 0.038
(0.020) (0.029)
Year trend 0.019 *** 0.013 ***
(0.004) (0.004)
GDP rate 0.000 0.000
(0.001) (0.002)
Constant -38.46 *** -16.39 ***
(8.483) (8.327)
Obs. 2,406 2,397
Clusters 173 172
Note: Robust standard errors are in parentheses.
Significance denoted at 1%-level (***); (%-level (**); and
10%-level (*). All models control for regional-level and
country-level fixed effects.
Table 7: Estimates on Skill Demand and Participation in Adult E&T (Reduced-Form Regressions)
ICT professionals PSPC workers
(Ref. Physical skills)
Analytical skills 0.032 *** -0.013
(0.012) (0.013)
Social skills -0.015 -0.030
(0.021) (0.021)
Year trend 0.011 -0.007
(0.012) (0.015)
GDP rate -0.017 ** 0.001
(0.008) (0.010)
Constant -18.55 19.96
25.01 30.81
Obs. 2,406 2,397
Clusters 173 172
Note: Robust standard errors are in parentheses.
Significance denoted at 1%-level (***); (%-level (**);
and 10%-level (*). All models control for regional-level
and country-level fixed effects.

39
The results indicate that the demand for analytical skills is positively associated with the level of
employment of ICT professionals, and negatively associated with the level of employment of PSPC
workers. These findings are in line with the evidence presented in Section 5 on regional specialisation.
There seems to be a trade-off between specialisation at the regional level in ICT-related products and
services on the one hand, and offering personal service and personal care, on the other hand.
Estimates on the demand for social skills present a positive sign, however, these estimates are not
significant. It is argued that analytical skills and social skills in ICT-intense occupations move together
(Deming, 2017). With regard to the PSPC workers, we also do not find a significant relationship
between the demand for social skills and employment. This finding may seem surprising, but in fact,
when looking at the underlying variables of social skills in Section 4.2.c, then we see that managerial
skills, like time management, or negotiation, are also accounted for. These skills are much less present
among PSPC workers.
It is further acknowledged that in the case of the variable on yearly trend a statistically significant
and positive association was estimated in the regression on employment dynamics. This suggests a
steady trend in employment growth during the investigated post-crisis period (2011-2016).
Interestingly, despite a steady growth in employment, participation in job-related adult learning did
not show such a growing trend. Therefore, it is argued that the increase in work-related E&T is not
due to an absolute increase in the level of employment. This is confirmed in Section 6.2.c, where we
show that it is the change in the employment structure (moderated through the change in the demand
for skills) that is driving job-related adult E&T upwards.
6.2.b Skill Demand and Adult Education & Training
Table 7 presents estimates of the reduced-form regression (see Equation (3) in Section 3.2). Again
we control for invariant country-level and regional-level information.
We find that the demand for analytical skills are positively associated with adult E&T among ICT
professionals. If, the demand for analytical skills would rise with 10 points on a scale of 500, then
participation in job-related courses significantly increases with 3.2 percent. We do not find a
relationship between social skills and participation in adult E&T for ICT professionals. With regard to
PSPC workers, the results indicate that there are no significant relationships between the demand for
analytical or the demand for social skills and hours spend on job-related courses. These estimates
confirm that effective skill demand by firms has no (direct) impact on adult learning among PSPC
workers.
6.2.c Employment Growth and Adult Education & Training
Table 8 summarizes the results of a parametric two-stage least squares regression using the demand
for skill demand as an instrumental variable. In this way we can analyse whether the demand for

40
analytical skills mediates the effects of occupational change on participation in adult E&T for the
respective ICT and PSPC professions. The second-stage regression also accounts for invariant country-
level and regional-level information.
Table 8: Estimates on Employment Dynamics and Participation in Adult E&T (Second-Stage Regressions)
ICT professionals PSPC workers
Ln(Employment) [ln(�̂�𝑐𝑟𝑓𝑡)] 0.146 ** 0.077 *
(0.066) (0.041)
Year trend 0.009 -0.008
(0.013) (0.015)
GDP rate -0.017 ** 0.001
(0.008) (0.010)
Constant -13.61 19.87
(25.711) (30.784)
Obs. 2,406 2,397
Clusters 173 172
Note: Robust standard errors are in parentheses. Significance
denoted at 1%-level (***); (%-level (**); and 10%-level (*). All
models control for regional-level and country-level fixed effects.
The estimate of the instrumented (or mediated) level of employment of ICT professionals is equal to
14.6 percent significant at 5 percent-level. For PSPC workers, this estimate is equal to 7.7 percent
significant at 10 percent level. From the estimations, we conclude that the effects of the employment
dynamics on participation in job-related courses is indeed significantly mediated by the effective skill
demand by firms, in particular, among ICT professionals. The relationship is weaker for PSPC workers
than for ICT professionals.
Although the overall participation rate in adult E&T did not increase in the post-crisis period (Table
2), the participation rate increases with a relative increase in regional employment in the selected
occupational segments; the ICT professionals and the PSPC workers. Furthermore, from Table 6 we
observe a significant increase in the level of employment of the respective professions over time, while
there is no significant year trend in participation in adult E&T in Table 7. From these year trends we
argue that it is not just higher overall employment across the EU in ICT and PSPC sectors that goes
hand in hand with more adult learning in these sectors. In fact, we can conclude that regions further
advanced in occupational change show an increased intensity in adult learning. If these segments are
indicative of the expected occupational change driven by technological progress, then the widely
adopted assumption of technology driven occupational change resulting in more work-related adult
E&T has empirical support.

41
7 Conclusion
In this report we have estimated the impact of changes in the employment structure due to technical
advancements on participation in adult E&T. This question was operationalized by looking at the
influences of employment dynamics in complex non-routine ICT occupations on participation in adult
E&T, on the one hand, and the influences of employment dynamics in non-complex non-routine PSPC
occupations on participation in adult E&T, on the other hand.
Our findings indicated a positive and significant relationship between the level of employment and
participation in adult E&T. In particular, we estimate that a 100 percent increase in the level of
employment of ICT professionals is associated with a 7.2 percent more uptake of job-related courses.
And an increase in the level of employment of PSPC workers with 100 percent, is associated with a 4.5
percent more on-the-job E&T.
Then, we have analysed whether the demand for analytical skills mediates the effects of
employment dynamics on participation in adult E&T for the respective ICT and PSPC professions. Our
findings indicate that the effects of the employment dynamics on participation in job-related courses
is indeed significantly mediated by the effective skill demand by firms, in particular, among ICT
professionals, and to lesser extent among PSPC workers. One possible explanation for this finding is
that job-related courses are offered to PSPC workers as to start working in the job (i.e. activation),
while ICT professionals engage in adult learning as a way of upskilling their skills (i.e. upskilling).
Further qualitative evidence should investigate this argument in the field.
8 Policy Implications
8.1 Trade-off in Policy Choices
There are at least three important implications for policymaking worth mentioning. First, we wish to
discuss the trade-off in policy choices between investment in R&D, on the one hand, and investments
in (lifelong) adult learning, on the other hand. From Figure 11 it is argued that there is an important
relationship between R&D policy and the changing demand for analytical skills on the job market. We
observe that several countries, like Austria, Belgium, Denmark, Germany, Finland, and Sweden are
frontrunners with regard to intramural investments in R&D. At the same time, these countries face
highest shift in the demand for analytical skills on the job market. Whereas the changing demand can
only be explained through job creation in knowledge intensive industries, because of the way the
variable is constructed (Section 4.2.c), we can conclude that R&D and the demand for analytical skills
move together.
Then, in Figure 12 it is observed that in particular these countries face difficulties with filling in
vacancies that deal with ICT professions. The volume of labour supplied by analytically strong persons
cannot follow the rapid pace of the demand for analytical skills, which appears to be reinforced by

42
R&D policy. In this respect, we wish to refer to Griffith et al. (1995, p.26) arguing that: “Skilled workers
are generally in short supply, and it is doubtful whether increasing their demand through increased
R&D is desirable without first addressing the apparent failures in the training and education systems.”
Figure 11: Change in the Demand for Analytical Skills and Intramural Investments in R&D
Source: Own computations by using EU-LFS 2011-2016. R&D is the average per
country calculated over the period 2011-2016. The demand for analytical skills is
derived from the O*NET skill surveys.
Figure 12: Hard to Fill Vacancies in IT and Intramural Investments in R&D
Source: The variable ‘hard to fill vacancies’ is extracted from Eurostat
[isoc_ske_itrcrn2]; and the variable intramural investments in R&D is
extracted from Eurostat [tgs00042].

43
8.2 Policymaking towards Small and Medium-Sized Enterprises
Our results above suggest that recruiting bottlenecks in ICT are reinforced by R&D policy. Kyndt &
Baert (2013) argue that, in order to boost adult E&T, learning opportunities should be readily available
within the firm along with a supportive organizational context. The authors indicate in this respect
that larger firms more often engage with (higher education) institutions in order to offer their
employees formal education trajectories. However, these trajectories are costly and require that
employees spend productive time on E&T. These elements are difficult to encounter by the smaller
firms, that have limited financial resources, and a limited volume of productive hours (i.e. less staff
available to do the job). Whereas our empirical strategy takes advantage from natural constraints in
the organization of learning opportunities on- and for-the-job, we can confirm that larger firms boost
the level of participation in job-related E&T by offering courses to employees, while smaller firms
often lag behind. In order to formulate an answer to this challenge of the smaller forms, expert
workshops have explored the possibilities to provide employees online learning opportunities (EASME
& DG GROW, 2019; European Commission, 2019). These workshop point towards the utility of online
(or digital) learning. For example, MOOCs seems promising with regard to offering learning
opportunities to adults while being on-the-job. However, student dropout rates seem fairly high, and
small firms lack financial capacity to work together with higher education institutions in order to
construct a course fitted to their workers. A readily available solution to the problem, still has to be
researched and confirmed.
8.3 Adult E&T on the European Agenda
Change in the effective skill demand is an important driver for all types of firms to offer learning
opportunities to employees. For example, we have exploited the example of ICT professionals in order
to indicate the relationship between effective skill demand, job creation in knowledge-intensive
industries, and participation in adult E&T. With the advancements in automation and artificial
intelligence, massive restructuring of European labour markets is expected. Reshaping of the existing
structure is going to be driven by various factors; among them the skills structure of available labour
force is going to play a central role. Evidence presented here, shows that the dynamics in employment
of ICT professionals (i.e. the quantitative aspects of occupational change) is closely associated with
the development of the demand for analytical skills (i.e. the qualitative aspects of occupational
change). Moreover, reshaping of the employment structure towards ICT professionals is linked with
an increase in participation in adult E&T. In our empirics we look at these changes at the level of
European regions. Regional labour markets tend to specialize in occupations that involve particular
type of skills, which is driven by the availability of educational attainment in the regional pool of
workers. Firms that produce ICT-related products and services are more likely to settle in regions when

44
there is sufficient supply of employees with tertiary (bachelor or master) degrees. This finding means
that regions, frontrunner in the provision of ICT-related products and services, and with sufficient
supply of tertiary educational attainment, will enforce their position in the coming years. Other
regions will (have to) specialize in the less complex (non-routine) jobs. Assuming that routine tasks are
disappearing through the whole occupational distribution, less-educated regions are going to be left
with the less-complex but still not automatable tasks and occupations; and additionally less rewarded
jobs in terms of labour earnings . For this segment, we specifically identify the occupational segment
of PSPC workers. We find that the demand for analytical skills negatively influences the level of
employment of PSPC workers, while, in fact, the level of employment of PSPC workers in the European
region, corrected for the effects of the business cycle, is fairly constant over the period 2011-2016.
The consequences are twofold: (1) given that demographic ageing increasingly will put pressure on
PSPC professions, there will be an ongoing interdependency between regions of the European Union
in the long-run; and/or (2) geographical mismatch between supply and demand of labour will rise in
response to lacking cross-border mobility. Even though considered beyond the scope of this report,
these two consequences indicate that adult E&T is not only a national matter. On the contrary, it
justifies the inclusion of adult E&T on the European Union agenda.
9 List of Abbreviations
Adult E&T Adult Education and Training
EU European Union
FE Fixed effects models
ICT Information and Communication Technology
IV Instrumental variables
NUTS Nomenclature of territorial units for statistics
PSPC Personal Service and Personal Care
10 References
Acemoglu, D., & Autor, D. (2011). Skills, tasks and technologies: Implications for employment and earnings. In Handbook of labor economics (Vol. 4, pp. 1043-1171). Elsevier.
Altonji, J. G., Arcidiacono, P., & Maurel, A. (2016). The analysis of field choice in college and graduate school: Determinants and wage effects. In Handbook of the Economics of Education (Vol. 5, pp. 305-396). Elsevier.
Angrist, J. D., Imbens, G. W., & Rubin, D. B. (1996). Identification of causal effects using instrumental variables. Journal of the American statistical Association, 91(434), 444-455.
Arntz, M., Gregory, T., & Zierahn, U. (2016). The risk of automation for jobs in OECD countries. OECD Social, Employment and Migration Working Reports, 2016, No. 189, OECD Publishing, Paris. http://dx.doi.org/10.1787/5jlz9h56dvq7-en.
Arntz, M., Gregory, T., & Zierahn, U. (2017). Revisiting the risk of automation. Economics Letters, 159, 157-160.

45
Autor, D. (2002). Skill Biased Technical Change and Rising Inequality: What is the Evidence? What are the Alternatives?. Class Notes, MIT.
Autor, D. H., Levy, F., & Murnane, R. J. (2003). The skill content of recent technological change: An empirical exploration. The Quarterly journal of economics, 118(4), 1279-1333.
Autor, D. H., Katz, L. F., & Krueger, A. B. (1998). Computing inequality: have computers changed the labor market?. The Quarterly journal of economics, 113(4), 1169-1213.
Berman, E., Bound, J., & Griliches, Z. (1994). Changes in the demand for skilled labor within US manufacturing: evidence from the annual survey of manufactures. The Quarterly Journal of Economics, 109(2), 367-397.
Brynjolfsson, E., & McAfee, A. (2014). The second machine age: Work, progress, and prosperity in a time of brilliant technologies. WW Norton & Company.
Boeren, E. (2016). Lifelong Learning Participation in a Changing Policy Context: An Interdisciplinary
Theory, New York: Palgrave Macmillan.
Boeren, E. (2017). Understanding adult lifelong learning participation as a layered problem, Studies in
Continuing Education, 39: 2, 161-175, DOI: 10.1080/0158037X.2017.1310096
Boeren, E., & Holford, J. (2016). Vocationalism varies (a lot) A 12-country multivariate analysis of participation in formal adult learning. Adult education quarterly, 66(2), 120-142.
Cabus, S.J., Ilievat, P. and Stefanik, M. (2018). Analytical report on the associations between system characteristics and lifelong learning participation with particular concern for disadvantaged groups and youth at risk of exclusion. H2020 Report ENLIVEN, KULeuven, Research Institute for Work and Society.
CEDEFOP (2010) Employer-provided vocational training in Europe - Evaluation and interpretation of the third continuing vocational training survey, Luxembourg: Publications Office of the European Union, 2010, Online: https://www.cedefop.europa.eu/files/5502_en.pdf
CEDEFOP (2013) Quantifying skill needs in Europe. Occupational skills profiles: methodology and application. Luxembourg: Publications Office of the European Union. http://www.cedefop.europa.eu/files/5530_en.pdf
Deming, D. J., Yuchtman, N., Abulafi, A., Goldin, C., & Katz, L. F. (2016). The value of postsecondary credentials in the labor market: An experimental study. American Economic Review, 106(3), 778-806.
Deming, D. J. (2017). The growing importance of social skills in the labor market. The Quarterly Journal of Economics, 132(4), 1593-1640.
David, H., Katz, L. F., & Kearney, M. S. (2008). Trends in US Wage Inequality: Re-Assessing the Revisionists. Review of Economics and Statistics, 90 (2), 300–323.
David, H., & Dorn, D. (2013). The growth of low-skill service jobs and the polarization of the US labor market. American Economic Review, 103(5), 1553-97.
Delors J. et al. (1996). L’Éducation. Un trésor est caché dedans. Paris: Éditions UNESCO – Odile Jacob. The English version of this report, often referred to as “the Delors report” is entitled Learning: The treasure within. Report to UNESCO of the international commission on education for the twenty-first century. Paris: UNESCO.
Delors, J. (2013). The treasure within: Learning to know, learning to do, learning to live together and learning to be. What is the value of that treasure 15 years after its publication?. International Review of Education, 59(3), 319-330.
EASME & DG GROW (2019) Promoting Online Training Opportunities for the Workforce in Europe. Expert workshop “Towards an efficient learning ecosystem for European SMEs: Fully exploiting the potential of online training”, Brussels, Belgium (contract nr. EASME/COSME/2017/001).
European Commission (2019). Report of the High-Level Expert Group on Impact of the Digital Transformation on EU Labour Markets. Directorate-General for Communication Networks, Content and Technology, and Directorate-General for Employment, Social Affairs and Inclusion, European Commission: Brussels.

46
Frey, C. B., & Osborne, M. A. (2017). The future of employment: how susceptible are jobs to computerisation?. Technological forecasting and social change, 114, 254-280.
Garavan, T. N., Carbery, R., O'Malley, G., & O'Donnell, D. (2010). Understanding participation in e‐learning in organizations: a large‐scale empirical study of employees. International Journal of Training and Development, 14(3), 155-168.
Gebel, M. & Giesecke, J. (2016). Does Deregulation Help? The Impact of Employment Protection Reforms on Youths’ Unemployment and Temporary Employment Risks in Europe. European Sociological Review, 32(4), 486–500, https://doi.org/10.1093/esr/jcw022.
Goldin, C., & Katz, L. F. (2007). The race between education and technology: the evolution of US educational wage differentials, 1890 to 2005 (No. w12984). National Bureau of Economic Research.
Goos, M., & Manning, A. (2007). Lousy and lovely jobs: The rising polarization of work in Britain. The review of economics and statistics, 89(1), 118-133.
Goos, M., Manning, A., & Salomons, A. (2009). Job polarization in Europe. American economic review, 99(2), 58-63.
Goos, M., Manning, A., & Salomons, A. (2014). Explaining job polarization: Routine-biased technological change and offshoring. American Economic Review, 104(8), 2509-26.
Hardy, W., Keister, R., & Lewandowski, P. (2018). Educational upgrading, structural change and the task composition of jobs in Europe. Economics of Transition, 26(2), 201-231.
Hershbein, B., & Kahn, L. B. (2018). Do recessions accelerate routine-biased technological change? Evidence from vacancy postings. American Economic Review, 108(7), 1737-72.
Hoskins, B., Cartwright, F., & Schoof, U. (2010). Making lifelong learning tangible: the ELLI index Europe 2010. Gutersloh: Bertelsmann Stiftung.
ILO (2019) Work for a brighter future – Global Commission on the Future of Work, International Labour Office – Geneva: ILO, 2019, ISBN 978-92-2-132796-7
Johnson, S. (2002). Lifelong learning and SMEs: issues for research and policy. Journal of Small Business and Enterprise Development, 9(3), 285-295.
Kyndt, E., & Baert, H. (2013). Antecedents of employees’ involvement in work-related learning: A systematic review. Review of Educational Research, 83(2), 273-313.
Lago Raquel, S., & Biagi, F. (2018). The Routine Biased Technical Change hypothesis: a critical review (No. JRC113174). Joint Research Centre (Seville site).
Nedelkoska, L., & Quintini, G. (2018). Automation, skills use and training. OECD Social, Employment and Migration Working Reports, 2018, No. 202, OECD Publishing, Paris. http://dx.doi.org/10.1787/2e2f4eea-en.
Nelson, R. R., & Phelps, E. S. (1966). Investment in humans, technological diffusion, and economic growth. The American economic review, 56(1/2), 69-75.
OECD. (2013). OECD Skills Outlook 2013: first results from the survey of adult skills. Paris: OECD.Panagiotakopoulos, A. (2011). Barriers to employee training and learning in small and medium-sized enterprises (SMEs). Development and Learning in Organizations: An International Journal, 25(3), 15-18.
OECD (2017). Future of Work and Skills. Paper presented at the 2nd Meeting of the G20 Employment Working Group 15-17 February 2017, Hamburg Germany, Online: https://www.oecd.org/els/emp/wcms_556984.pdf
Panagiotakopoulos, A. (2011). Barriers to employee training and learning in small and medium-sized enterprises (SMEs). Development and Learning in Organizations: An International Journal, 25(3), 15-18.
Saar, E., & Räis, M. L. (2017). Participation in job-related training in European countries: the impact of skill supply and demand characteristics. Journal of Education and Work, 30(5), 531-551.
Tinbergen, J. (1974). Substitution of graduate by other labour. Kyklos: international review for social sciences.

47
Storey, D. J., & Westhead, P. (1997). Management training in small firms–a case of market failure?. Human resource management journal, 7(2), 61-71.


49
11 Appendix A
Table 9: Summary Statistics of Key Variables by Country
ICT professionals PSPC workers Skill Demand Share Industry (%) Share Skill Supply (%)
Country Obs. Empl. Courses Empl. Courses Analytical Social Physical NACE(C;J,M;P) NACE(I;Q) L M H
Austria 162 48.9 68.3 79.7 65.3 235.8 319.4 158.3 37.4 19.7 4.3 50.4 45.4
Belgium 153 62.6 99.4 61.5 47.6 245.1 324.2 155.9 37.0 19.8 6.4 25.4 68.2
Croatia 10 37.3 138.8 139.0 146.9 260.2 324.9 154.3 51.5 40.8 2.6 29.8 67.5
Cyprus 18 44.7 70.0 60.4 20.6 240.3 322.5 144.0 41.7 10.0 3.0 21.7 75.3
Estonia 18 54.0 91.8 51.9 34.1 248.4 327.7 152.7 40.7 10.2 2.1 30.0 67.9
Finland 80 102.9 126.1 117.1 81.6 241.0 319.1 163.3 35.1 25.4 5.4 34.5 60.1
France 284 47.6 68.2 114.2 76.5 232.6 314.8 164.2 32.6 23.3 9.3 39.2 51.4
Germany 523 54.2 77.1 54.8 34.7 243.8 323.2 158.4 35.2 27.2 2.3 44.6 53.1
Greece 47 40.8 163.1 110.0 100.8 244.4 328.5 149.1 49.6 23.0 3.1 25.1 71.8
Hungary 94 38.4 54.2 50.5 53.8 232.2 312.3 169.3 39.1 15.6 7.9 45.8 46.3
Iceland 18 77.7 107.1 62.8 36.4 244.6 326.9 154.1 41.3 15.8 14.1 28.9 57.0
Ireland 34 41.6 52.8 93.9 120.2 237.0 321.3 157.6 36.8 28.4 7.8 24.0 68.3
Italy 348 35.5 57.1 82.8 60.4 233.3 317.9 157.7 37.8 19.9 12.8 48.4 38.8
Latvia 18 32.4 53.8 59.2 43.4 247.3 328.4 154.8 36.0 12.5 2.5 31.6 65.9
Lithuania 12 62.6 61.1 50.5 23.2 254.6 333.0 145.4 39.2 10.3 0.1 20.6 79.2
Luxembourg 18 67.7 102.9 62.1 50.6 238.8 318.5 148.5 28.7 16.7 10.2 34.2 55.7
Netherlands 16 84.8 115.2 71.4 61.5 237.5 317.4 158.8 32.1 24.1 13.5 40.5 46.0
Slovak Republic 55 43.0 73.1 77.4 25.0 238.3 316.3 169.4 44.9 11.4 0.7 51.8 47.5
Spain 230 45.1 79.4 107.5 86.5 235.6 319.7 160.8 37.2 19.8 12.3 18.2 69.5
Switzerland 126 71.4 88.3 77.5 48.3 244.5 323.1 159.1 34.8 19.9 3.3 41.8 54.8
United Kingdom 181 91.6 138.2 94.9 115.0 238.9 321.6 155.6 32.4 29.1 9.6 35.1 55.4
Notes: Employment and participation in job-related courses are expressed in hours. Skills demand is a scale with max. 500 points. Share of dominant industry with NACE(C;J,M;P) are for ICT
professionals and NACE(I;Q) for PSPC workers. Skill supply denotes low (L), medium (M), or high-educated (H).

50
Table 10: Main Employer by Firm Size (%)
Country Micro-sized Small-sized Medium to large-sized
Austria 28.0% 30.3% 41.7%
Belgium 19.6% 30.8% 49.7%
Croatia 26.3% 27.5% 46.2%
Cyprus 22.9% 24.4% 52.8%
Estonia 20.2% 24.6% 55.2%
Finland 20.3% 27.2% 52.6%
France 24.6% 30.7% 44.7%
Germany 34.3% 31.9% 33.8%
Greece 31.5% 30.3% 38.2%
Hungary 28.7% 27.7% 43.6%
Iceland 29.7% 27.2% 43.1%
Ireland 32.3% 27.3% 40.4%
Italy 43.1% 33.8% 23.1%
Latvia 23.8% 41.5% 34.7%
Lithuania 30.9% 39.5% 29.6%
Luxembourg 35.2% 27.5% 37.3%
Netherlands 28.9% 34.4% 36.7%
Slovak Republic 26.5% 34.4% 39.0%
Spain 29.6% 34.1% 36.4%
Switzerland 25.8% 40.6% 33.5%
United Kingdom 19.6% 27.1% 53.3%
Note: Averages over the period 2011-2016 per country.

51
Table 11: Union Density, Part-Time Contracts and Temporary Employment by Country and Firm Size
Union density Part-time contracts Temporary employment
Country Micro-sized Small-sized Medium to large-sized Micro-sized Small-sized
Medium to large-sized Micro-sized Small-sized
Medium to large-sized
Austria 11.0% 23.7% 42.2% 38.5% 26.8% 21.1% 4.6% 5.6% 7.9%
Belgium 25.5% 60.4% 57.2% 20.0% 26.6% 22.7% 4.8% 7.3% 6.3%
Croatia 20.2% 22.8% 41.0% 9.0% 3.3% 0.0% 14.0% 19.5% 24.5%
Cyprus 20.7% 39.1% 57.9% 12.7% 4.1% 2.3% 8.4% 9.9% 12.1%
Estonia 3.9% 6.6% 11.0% 12.6% 8.4% 5.9% 1.5% 2.1% 1.2%
Finland 49.8% 65.2% 80.6% 13.8% 8.8% 6.3% 11.9% 12.5% 12.0%
France 11.0% 11.9% 15.5% 34.2% 16.1% 13.2% 6.5% 9.1% 8.6%
Germany 17.9% 12.5% 14.2% 27.7% 24.0% 16.9% 5.2% 8.0% 9.6%
Greece 7.7% 9.1% 12.7% 7.4% 1.4% 0.9% 8.2% 8.5% 8.6%
Hungary 2.2% 7.8% 11.1% 8.8% 5.2% 2.5% 13.8% 16.7% 14.7%
Iceland 76.1% 91.6% 94.6% 17.1% 17.9% 11.2% 7.9% 8.2% 6.7%
Ireland 10.4% 26.0% 46.5% 35.1% 17.4% 10.8% 10.6% 7.4% 6.3%
Italy 0.9% 8.0% 26.9% 21.2% 11.6% 8.4% 8.4% 10.5% 7.1%
Latvia 13.3% 13.3% 13.3% 15.8% 3.4% 4.1% 3.5% 2.4% 2.2%
Lithuania 3.8% 4.8% 11.6% 12.2% 5.1% 3.3% 0.9% 0.7% 0.7%
Luxembourg 33.3% 33.3% 33.3% 24.0% 19.7% 12.8% 4.6% 6.3% 6.5%
Netherlands 16.7% 25.8% 27.1% 50.4% 43.1% 38.6% 9.7% 11.3% 10.1%
Slovak Republic 4.2% 18.2% 21.5% 3.4% 1.8% 0.5% 5.8% 4.5% 4.0%
Spain 6.6% 16.9% 25.7% 21.7% 10.3% 7.3% 21.0% 22.1% 20.8%
Switzerland 14.9% 15.9% 18.2% 40.8% 39.7% 30.2% 4.1% 6.3% 7.9%
United Kingdom 5.6% 13.8% 33.0% 31.1% 25.3% 18.4% 5.5% 5.1% 5.3%
Note: Averages over the period 2011-2016 per country.

52
Table 12: Skill Demand (max. 500 points) by Country and Firm Size
Analytical skills Social skills Physical skills
country Micro-sized Small-sized Medium to large-sized Micro-sized Small-sized
Medium to large-sized Micro-sized Small-sized
Medium to large-sized
Austria 226.9 236.5 244.1 314.1 325.0 318.9 158.2 153.2 163.6
Belgium 243.1 242.3 248.6 324.5 325.3 323.1 151.9 154.1 160.0
Croatia 287.4 238.6 250.2 325.3 341.3 321.9 156.2 141.8 155.4
Cyprus 230.9 240.5 249.5 317.5 325.3 324.7 147.6 140.5 143.9
Estonia 247.9 246.1 251.3 325.2 331.8 325.9 154.1 149.7 154.5
Finland 230.5 239.3 252.1 314.3 323.6 319.5 164.8 158.6 166.3
France 223.2 231.4 238.1 312.6 317.2 313.9 160.3 160.1 169.6
Germany 242.9 238.9 248.6 321.0 325.9 322.6 157.6 154.8 161.9
Greece 236.6 246.4 254.0 322.4 336.8 325.0 156.6 140.1 151.4
Hungary 229.2 229.3 236.2 310.8 317.1 309.8 163.1 166.9 174.8
Iceland 240.4 242.5 251.0 320.6 331.6 328.5 159.8 148.5 154.1
Ireland 227.9 235.3 247.4 319.1 326.3 319.2 156.0 150.9 164.8
Italy 226.7 231.4 241.1 311.3 320.5 321.4 160.4 153.6 159.4
Latvia 247.5 243.6 250.9 330.0 330.1 324.9 156.1 150.9 157.3
Lithuania 256.6 249.8 257.3 331.4 334.1 333.5 148.8 141.8 145.6
Luxembourg 232.6 235.8 248.0 314.2 322.3 319.2 150.8 147.7 147.0
Netherlands 232.5 234.1 244.3 313.8 319.3 318.0 153.6 160.5 160.4
Slovak Republic 240.4 236.5 238.3 321.0 318.4 310.5 158.8 166.5 180.6
Spain 225.1 236.6 243.3 313.9 326.6 318.8 161.8 154.1 165.6
Switzerland 237.7 243.2 252.7 318.1 326.7 324.5 163.1 154.3 159.8
United Kingdom 236.3 232.9 247.2 318.8 322.9 322.8 156.9 153.1 156.8
Note: Averages over the period 2011-2016 per country.