DELIVERABLE 2 - · PDF file0.4 Problems encountered ... JUSTIFICATION THEREOF ... conducted....
41
TIP4-CT-2005-516420 Page 1 of 41 QCITY issued: 29-11-06 D2.8.doc DELIVERABLE 2.8 CONTRACT N° TIP4-CT-2005-516420 PROJECT N° FP6-516420 ACRONYM QCITY TITLE Quiet City Transport Subproject 2 Perception of Vehicle Noise Sources Work Package 2.2 Subjective Perception of Noise Sources Ranking of Noise Sources with Respect to Noise Perception Written by Sebastian Rossberg HAC Date of issue of this report 02.08.2006 PROJECT CO-ORDINATOR Acoustic Control ACL SE PARTNERS Accon ACC DE Akron AKR BE Amec Spie Rail AMEC FR Alfa Products & Technologies APT BE Banverket BAN SE Composite Damping Material CDM BE Havenbedrijf Oostende HOOS BE Frateur de Pourcq FDP BE Goodyear GOOD LU Head Acoustics HAC SE Heijmans Infra HEIJ BE Royal Institute of Technology KTH SE Vlaamse Vervoersmaatschappij DE LIJN LIJN BE Lucchini Sidermeccanica LUC IT NCC Roads NCC SE Stockholm Environmental & Health Administration SEA SE Société des Transports Intercommunaux de Bruxelles STIB BE Netherlands Organisation for Applied Scientific Research TNO NL Trafikkontoret Göteborg TRAF SE Tram SA TRAM GR TT&E Consultants TTE GR University of Cambridge UCAM UK University of Thessaly UTH GR Voestalpine Schienen VAS AU Zbloc Norden ZBN SE Union of European Railway Industries UNIFE BE PROJECT START DATE February 1, 2005 DURATION 48 months Project funded by the European Community under the SIXTH FRAMEWORK PROGRAMME PRIORITY 6 Sustainable development, global change & ecosystems
Transcript of DELIVERABLE 2 - · PDF file0.4 Problems encountered ... JUSTIFICATION THEREOF ... conducted....

TIP4-CT-2005-516420 Page 1 of 41 QCITY issued: 29-11-06
D2.8.doc
DELIVERABLE 2.8
CONTRACT N° TIP4-CT-2005-516420
PROJECT N° FP6-516420
ACRONYM QCITY
TITLE Quiet City Transport
Subproject 2 Perception of Vehicle Noise Sources
Work
Package
2.2 Subjective Perception of Noise Sources
Ranking of Noise Sources with Respect to
Noise Perception
Written by Sebastian Rossberg HAC
Date of issue of this
report
02.08.2006
PROJECT CO-ORDINATOR Acoustic Control ACL SE PARTNERS Accon ACC DE
Akron AKR BE Amec Spie Rail AMEC FR Alfa Products & Technologies APT BE Banverket BAN SE Composite Damping Material CDM BE Havenbedrijf Oostende HOOS BE Frateur de Pourcq FDP BE Goodyear GOOD LU Head Acoustics HAC SE Heijmans Infra HEIJ BE Royal Institute of Technology KTH SE Vlaamse Vervoersmaatschappij DE LIJN LIJN BE Lucchini Sidermeccanica LUC IT NCC Roads NCC SE Stockholm Environmental & Health Administration SEA SE Société des Transports Intercommunaux de Bruxelles STIB BE Netherlands Organisation for Applied Scientific Research TNO NL Trafikkontoret Göteborg TRAF SE Tram SA TRAM GR TT&E Consultants TTE GR University of Cambridge UCAM UK University of Thessaly UTH GR Voestalpine Schienen VAS AU Zbloc Norden ZBN SE Union of European Railway Industries UNIFE BE
PROJECT START DATE February 1, 2005
DURATION 48 months
Project funded by the European Community under the
SIXTH FRAMEWORK PROGRAMME
PRIORITY 6
Sustainable development, global change & ecosystems
Nils-Åke
Ny stämpel

TIP4-CT-2005-516420 Page 2 of 41 QCITY issued: 29-11-06
D2.8.doc
T A B L E O F CON T E N T S 0 Executive Summary .............................................................................................3 0.1 Objective of the deliverable..............................................................................3 0.2 Strategy used and/or a description of the methods (techniques) used
with the justification thereof...............................................................................3 0.3 Background info available and the innovative elements which were
developed ............................................................................................................4 0.4 Problems encountered .......................................................................................4 0.5 Partners involved and their contribution..........................................................4 0.6 Conclusions...........................................................................................................4 0.7 Relation with the other deliverables (input/output/timing) ..........................5
1 Introduction ..........................................................................................................6
2 Listening Tests........................................................................................................9 2.1 Test Procedure......................................................................................................9 2.2 Evaluation item “Annoyance”.........................................................................15 2.3 Sound Sets...........................................................................................................15 2.4 Statistics ...............................................................................................................17
3 Sound Analyses ..................................................................................................20 4 Principal Component Analysis.........................................................................26 4.1 Theory ..................................................................................................................26 4.2 Application .........................................................................................................27
5 Evaluation Index EI.............................................................................................31 5.1 Results of the PCA..............................................................................................31 5.2 Creating the Evaluation Index.........................................................................32 5.3 Bonus / Malus......................................................................................................38
6 Conclusion and outlook ...................................................................................40

TIP4-CT-2005-516420 Page 3 of 41 QCITY issued: 29-11-06
D2.8.doc
0 E X E C U T I V E S UMMA R Y
0.1 OBJECTIVE OF THE DELIVERABLE
The following report describes the work done and results gained in WP 2.2.2
during the months 13 to 18 of QCITY.
The main objective was the assessment of the subjective perception of single
pass-by sounds to gain a further evaluation method of sounds beside the dB(A).
The perception data was used to develop an quantitative description of the
annoyance effect of single pass-by noise and it was tried to define an dB(A)
equivalent (bonus / malus) for the difference in annoyance between certain
vehicle groups (e.g. vehicles with otto or diesel engines).
This deliverable describes the generation of the quantitative annoyance
description including listening tests, sound analyses, statistical analyses and
validation. Further, preliminary results of the bonus / malus considerations are
presented.
0.2 STRATEGY USED AND/OR A DESCRIPTION OF THE METHODS (TECHNIQUES) USED WITH THE
JUSTIFICATION THEREOF
For the assessment of the subjective perception listening tests had to be
conducted. A combined scaling and ranking method was chosen for the
design of the listening tests, since it is very convenient for the test individuals (TI)
and generates stable and reliable evaluations. Unfortunately, large numbers of
sounds cannot be evaluated together with this design; for those cases the
classical single scaling was applied. The evaluation scale is derived from the
Rohrmann intensity scale.
The selection of the relevant acoustic parameters was done with focus on the
objective description of sound characteristics influencing the subjective
perception. Therefore, the comments of the TI1 were used to identify important
sound characteristics and acoustic parameters representing these
characteristics were compiled. Further, typical parameters like SPL and SPLmax
were considered too.
The evaluation data was analysed applying the principal component analysis
(PCA) which is a statistical method for dimensionality reduction. It can identify
common factors influencing the evaluations of the TI. To relate these factors to
the selected acoustic parameters correlation analyses were conducted
between the factor values and the sound parameters. Parameters highly and
often correlated with the first or second factor calculated by the PCA were
selected for the quantitative description of the annoyance. Based on the factor
1 TI … test individual / test individuals, this abbreviation is used for the singular as well as for the plural form

TIP4-CT-2005-516420 Page 4 of 41 QCITY issued: 29-11-06
D2.8.doc
weightings and linear regression calculations the weighting of the parameters
was optimized.
Additional listening tests were conducted for validation purposes.
0.3 BACKGROUND INFO AVAILABLE AND THE INNOVATIVE ELEMENTS WHICH WERE DEVELOPED
A method for the calculation of an evaluation index (EI) was developed. The EI
represents the subjective annoyance of pass-by noise of a single vehicle at a
distance of 7.5 m. It can be applied to any time signal complying with these
demands. Acoustic parameters influencing the EI are
- Relative Approach (RA): assessing diesel and engine noise by evaluating
time and frequency patterns as well as tonal components
- 5% percentile of the loudness (N5): assessing the subjective loudness of the
pass-by vehicle noise
- 5% percentile of the sharpness (S5): assessing annoying characteristics in
the high frequency range, e.g. tire hissing
0.4 PROBLEMS ENCOUNTERED
The development of a bonus / malus system for certain vehicle groups proved
to be too extensive when single pass-by sounds are considered. The
investigations will be continued within WP5.12 where it is possible to evaluate
and analyses traffic scenarios with specific mixtures of the vehicle groups.
0.5 PARTNERS INVOLVED AND THEIR CONTRIBUTION
HEAD acoustics (HAC) conducted the listening tests, analysed the sounds and
performed the statistical calculations.
The final creation of the EI was also done by HAC.
0.6 CONCLUSIONS
It was possible to create a qualitative description of the subjective annoyance
of pass-by sounds based on psychoacoustic parameters. These parameters are
- Relative Approach (RA): representing diesel and engine noise
- 5% percentile of the loudness (N5): representing the subjective loudness
- 5% percentile of the sharpness (S5): representing annoying characteristics
in the high frequency range, e.g. tire hissing
It is more reasonable to carry out investigations about bonus / malus relations
within 5.12 using traffic scenarios with vehicle groups rather than comparing
pass-by sounds of single vehicles.

TIP4-CT-2005-516420 Page 5 of 41 QCITY issued: 29-11-06
D2.8.doc
0.7 RELATION WITH THE OTHER DELIVERABLES (INPUT/OUTPUT/TIMING)
D2.1: Usage of compiled database
D2.2: Usage of compiled database
D2.9: Input of evaluation data
D2.10: Input of evaluation data
TrafficNoiseSynthesizer (WP2.2.3 & WP5.12): Input of calculation method for EI

TIP4-CT-2005-516420 Page 6 of 41 QCITY issued: 29-11-06
D2.8.doc
1 I N T R OD UC T I O N
In WP2.1 a database for exterior pass-by noise of different transportation means
– mainly passenger cars – was compiled during the first 12 months of QCITY2. This
report describes the assessment and analysis of the subjective perception of the
compiled pass-by sounds.
The psychoacoustic testing has two aims:
• the determination of quantitative interrelations between the annoyance
of pass-by sounds and their psychoacoustic parameters
• the definition of bonus/malus values in dB for specific vehicle groups
regarding their differences in annoyance
The principle procedure to gain the raw data for the analysis is very much the
same. Selected pass-by sounds are presented to test individuals (TI), which have
to evaluate the sounds regarding their annoyance. The assessed annoyance
scores form the basis for all further analysis. The selection and combination of
the pass-by sounds for the evaluation is done with respect to the two testing
objectives respectively.
Quantification of annoyance
It is assumed that the annoyance of different driving situations depend on
several different parameters. The annoyance of tire noise will depend on
different parameters as the one of engine noise, since they are characterised
by different time and frequency features. Therefore, the annoyance
quantification of idle noise and pass-by noise at 50 km/h will be described
differently also. The same applies for the comparison of vehicles, since their
pass-by noise does not composes of tire and engine noise in the same way.
Furthermore, the engine type probably affects the main acoustic parameters of
its noise.
Bonus/Malus Values
To identify a dB(A) equivalent for the annoyance effect of different vehicle
groups pass-by sounds of selected vehicles are presented at their original dB(A)
level and – in an additional test set – at a adjusted dB(A) level. In a first step this
adjustment is made rather arbitrarily, since yet no well-founded assumption
about the bonus/malus values can be made. It is decided to adjust the dB(A)
level to an equal level. Thus, a certain range of changes in level is realized and
the data can also be used for the annoyance quantification.
2 The measurements were performed in accordance to the ISO 362 at 7.5 m distance and 1.2m height. For
further details about the data acquisition for the database see D2.1 and D2.2.
TIP4-CT-2005-516420 Page 7 of 41 QCITY issued: 29-11-06
D2.8.doc
The annoyance evaluations will be analysed in terms of the dB(A) changes and
different vehicle groups. Using the results of this analysis it will be possible to
perform further listening test with selected level adjustments for defining the
bonus/malus values.
Procedure
To assess the parameters for the driving situations and the vehicle types different
test sets are composed:
• sets of one specific driving condition of different vehicles to compare the
vehicle types and find descriptors for the respective driving situation
• sets of one specific vehicle in different driving situations to compare the
driving situations and find descriptors for the respective vehicle
• sets of different vehicles in different driving situations for a analysis
independent of vehicle and situation and for validation
The acquired data is statistically evaluated regarding the validity of the data.
Therefore, the answers of the TI are compared by applying cluster analysis to the
ranks and annoying scores. Hereby, outliers and the formation of groups can be
identified. The samples of TI for the single test sets can be compared using the t-
test method for independent samples.
The further analysis includes cluster analysis and principle component analysis
(PCA). The calculated scores of the PCA are correlated with selected acoustic
and psychoacoustic parameters to identify the main parameters influencing the
subjective evaluations of the driving situations / single vehicles. With this, the
evaluations of the single vehicles / driving situations could be explained in more
detail, e.g. why a certain car was rated high or low.
Primarily, the acoustic parameters identified as relevant are used to create a
calculation method for the representation of the subjective annoyance of
pass-by sounds. Therefore, the acoustic parameters have to be combined in a
way that reflects the influence of their perceptive equivalents on the
evaluations. The final equation will calculate an evaluation index (EI) that
provides information about the annoyance of a single pass-by noise without the
necessity of listening tests. Hereby, the annoyance effect of vehicles or driving
conditions can conveniently be analysed and compared.
In WP5.12 the gained experiences and knowledge about the perception of
pass-by noise will be used to enhance and adapt the EI for filtered pass-by
sounds (e.g. representing pass-by noise in flats or behind screenings) as well as
traffic flow noise. This enhancement will give the possibility to evaluate urban
traffic noise as it is present in cities and as it is perceived by residents and
pedestrians.
The bonus / malus investigations give only preliminary results; therefore further
investigations within WP5.12 are necessary. There it will be possible to analyse
the differences of specific vehicle groups in the context of traffic flow noise as it

TIP4-CT-2005-516420 Page 8 of 41 QCITY issued: 29-11-06
D2.8.doc
occurs in urban cities. The advantage is that the comparison of specific vehicle
mixtures is not as extensive as the one by one comparison of single vehicles.
The bonus / malus results gained within WP5.12 can be combined with the EI.
Rules for the application of the bonus / malus will be defined also in relation to
the EI or its components.

TIP4-CT-2005-516420 Page 9 of 41 QCITY issued: 29-11-06
D2.8.doc
2 L I S T E N I N G T E S T S
The design and execution of listening tests is one part of the psychoacoustic
data acquisition. Therefore an adequate test procedure has to be developed
and pass-by sounds have to be selected for the evaluation.
2.1 TEST PROCEDURE
As mentioned before, the test procedure for the two aims of the psychoacoustic
evaluation is identical. Only the pass-by sounds have to be selected
accordingly to the specific aim. But it is possible to reduce the effort by
constructing test stets, that can provide input data for both tasks.
To keep the demands towards the TI rather low, the test procedure is designed
in a way, that no specific skills are needed. The well known method of scoring
on a perception scale and the possibility to listen to the pass-by sounds
repeatedly facilitates the evaluation task for the TI3. The most important
requirement a TI must fulfil is the criterion of sufficient hearing ability. That is, no
more than 20 dB HL (hearing loss) at any frequency.
The complete test procedure consists of five steps:
1. Greeting and introduction
2. Audiometry
3. Instructions
4. Test
5. Interview
a. Feedback
b. Questionnaire
This test procedure is carried out with one TI at a time. Depending on the
evaluation behaviour of the test person a complete test takes 30 to 45 minutes
in total.
2.1.1 Greeting and Introduction
The TI is welcomed in a friendly manner to ensure a high level of open-
mindedness. Nevertheless, the interaction with the TI should always be serious
3 TI … test individual / test individuals, this abbreviation is used for the singular as well as for the plural form

TIP4-CT-2005-516420 Page 10 of 41 QCITY issued: 29-11-06
D2.8.doc
and professional to avoid distractions from the test focus and unwanted
“demand characteristics”4.
At the beginning, the motivation of the test is described in connection with the
EU project QCITY, the EU noise directive and the improvement of the noise
situation in cities. By showing the positive aim and involving the TI into it, the
motivation of the TI should be increased.
2.1.2 Audiometry
The test starts with a conventional audiometry carried out with the
HEADAudiometer software of HEAD acoustics. The TI listen to discrete
frequencies. The software slowly increases the intensity of the stimuli. If the TI is
able to hear the sound, he presses a mouse button. The threshold for every
frequency has to be confirmed during a second stimulus increase. Afterwards,
the software changes the frequency and the procedure is repeated. The
procedure has to be carried out twice, once for the TI’s left and once for his or
her right ear. After the audiometry the audiogram is shown and explained to the
TI. All this is also explained to the TI before the audiometry starts.
To participate in the listening test the TI have to fulfil the criterion of a hearing
loss less than 20 dB at any testing frequency. Thereby, the audiometry
guarantees that only TI with a sufficient hearing ability take part in the
investigation.
2.1.3 Instructions
After the audiometry the TI are instructed about the test procedure and their
evaluation task. For gaining significant results it is essential that the TI understand
all details and all questions have been clarified before the actual test. Therefore,
the instructions are given in written and oral form. At first, the written instruction is
handed to the TI for careful reading. Afterwards, the oral instruction starts with
answering the questions of the TI concerning the written instructions. Then the
test procedure is discussed in detail step by step. The TI are encouraged to ask
without hesitation, if questions should arise.
The hypothetical situation of an open bus stop with vehicles passing by is
described to form a common context for the TI. Their task is to evaluate the
pass-by sounds regarding their annoyance effect.
A 9-point scale with the German verbal allocations of the Rohrmann scale for
intensities is used for the evaluations. Figure 1 shows an English translation of this
scale. The TI has to decide which of the nine categories represents its
perception best. A category scaling is chosen since the applied SQuare
software of HEAD acoustics does not allow continuous scales. The advantage of
4 « Demand characteristics » describe the tendency of TI to change their behaviour because of being in a
test situation, e.g. by presenting themselves in a special manner or by giving answers with respect to a imagined test objective.

TIP4-CT-2005-516420 Page 11 of 41 QCITY issued: 29-11-06
D2.8.doc
the SQuare software is that the test procedure can be carried out easily and
interactively by the TI on a computer screen using a computer mouse. The
results are directly available and can be further processed with adequate
software.
Figure 1: Evaluation scale
The pass-by sounds are presented in groups or sets. Mostly the evaluations
method “category test with sorting” is used. Hereby, the sounds of one set are
presented together and the TI can listen to the sounds arbitrarily often and
compare them among one another. The annoyance evaluation is given on the
corresponding 9-point scale. The software sorts automatically the sounds by the
rating. Additionally, the order of the sounds can be changed with arrow
buttons, especially if several sounds fall into one category and the TI wants to
sort them. Figure 2 depicts the computer screen of the SQuare software for the
method of category scaling with sorting. This method offers a high convenience
for the TI by giving the opportunity to verify the own judgements. The results are
more stable, use a wide range of the scale and are unaffected by
representation sequences. As the evaluations will be given in relation to the
sounds of the respective set, the comparability between the sets is limited and
has to be considered separately.
To check the results of the “category test with sorting” some sound sets were
retested with a pure category test, where the sounds are presented separately
and no comparisons among them are possible.
A complete version of a listening test consists of four to six sound sets. The first
one usually serves as a training sequence to familiarize the TI with the sounds
and the evaluation method. After this training sequence the TI has the possibility
to ask further questions, which occurred during the first evaluation.
Between the sets it is always possible for the TI to take a short break before
continuing. This shall optimize the concentration and motivation of the TI for
every single evaluation. There is no time limit for the evaluation. It is made clear,
that it is crucial that the final evaluations represent the individual perception of
the sounds. There are no right or wrong answers – only the individual perception.
very quite moderately a little not at all
1 2 3 5 6 7 8 4 9
How much do you feel annoyed?

TIP4-CT-2005-516420 Page 12 of 41 QCITY issued: 29-11-06
D2.8.doc
Figure 2: Evaluation screen of HEAD acoustics’ SQuare software for the category test with sorting
During the test the TI has always the possibility to communicate with the
investigator via a microphone placed in the testing room.
2.1.4 Test
The listening test itself takes place in a small noise-reduced chamber (see Figure
4). The investigator monitors the whole test from an anteroom where he can
watch the TI judgements on a second computer screen and listen to the
microphone placed in the testing room. Hereby, he can immediately intervene
if any problems or maloperation occurs.

TIP4-CT-2005-516420 Page 13 of 41 QCITY issued: 29-11-06
D2.8.doc
Figure 3: Experimental set-up
The TI carries out the listening test as described in the instructions. Mostly, no
interference of the investigator is necessary during the evaluation.
After the evaluation is finished, the investigator joins the TI in the testing room
and interviews the TI about the test and some personal data.
Figure 4: Testing room
LAN
Audiometry headphone Sennheiser HDA 200
Evaluation headphone Sennheiser HD 600
PEQ V Headphone equalizer
SQuare Master PC HEADAudiometer PC SQuare Terminal PC
Monitoring of listening test Listening Tests
TIP4-CT-2005-516420 Page 14 of 41 QCITY issued: 29-11-06
D2.8.doc
2.1.5 Interview: Feedback and Questionnaire
During the interview the TI have the opportunity to express their feelings with
regard to the test.
The first part of the interview deals with the test itself and how it was
experienced by the TI.
Question: What do you think, what influenced your evaluations?
Question: How did you do your evaluations (e.g. first rating then comparing
or first sorting then rating)?
These two questions about the individual evaluation method of the TI shall give
hints about the evaluation background, give hints for the latter choice of
psychoacoustic descriptors and can be used for the comparison of the TI.
Question: How difficult did you experience your evaluation task?
Question: Did you encounter any problems or irritation during the test?
Question: Would you participate in such a test again?
The answers to the three questions above give information about the demands
of the evaluation task on the TI and thereby the quality of the ratings. But more
important they give a feedback about the quality of the listening test. If the test
is too difficult or irritating for the TI the results will not be reliable. In this case, the
test design has to be modified accordingly. If the last question is answered with
“No.” it can be assumed that the motivation of the TI during the test was very
low. This can be due to a way too long test, very annoying sounds, very difficult
evaluations/comparisons, etc. Then the test design has to be changed
fundamentally. Fortunately, this did not happen here.
The second part of the interview uses a small questionnaire to assess some
personal data for statistical use. This questionnaire involves the following
questions:
• How old are you?
• What is your gender?
• Do you have children? If yes, how many?
• Would you call yourself sensitive to noise?
• Do you feel annoyed by noise in your everyday life (e.g. at home or at
work)?
• Are there any important noise sources in your neighbourhood / at your
working place? If yes, what are they?
• Do you use regularly your car?
The answers are used to ensure a heterogeneous TI clientele. Additionally, it can
be tried to relate certain evaluation patterns to individual parameters and noise
history.
TIP4-CT-2005-516420 Page 15 of 41 QCITY issued: 29-11-06
D2.8.doc
2.2 EVALUATION ITEM “ANNOYANCE”
The item “annoyance” is chosen for the sound evaluation because annoyance
is the perception traffic noise provokes for residents and affected people. It is a
relevant term concerning environmental noise.
The assessment of annoyance in the laboratory has yet to be questioned
critically. It is a potential problem to evaluate the annoyance of a sound, when
the evaluation and therefore the sound is within your main focus of attention. In
general, things are annoying if they distract you from other activities or focuses.
It would be possible to assess the pleasantness/unpleasantness of sounds,
because here the focus of attention can be the sound. But such an evaluation
item aims on a different dimension of perception compared to annoyance. The
quality of the sound will be evaluated and not its annoying effect.
The instructions of the test procedure form a common context for the
evaluation. It is a context every TI is familiar to and which can be related to the
term annoyance for every TI. By this, it is possible to leave the sterile laboratory
setting and evaluate the sound within an imaginary but realistic context.
After all, there is no negative feedback on the term “annoyance” or on the
constructed context from the TI. This indicates that the TI are able to relate a
meaning to the term ‘annoyance’ regarding the instructed setting.
2.3 SOUND SETS
During the planning of the listening tests it occurred that about 20 sound sets
had to be conducted to get a sufficient data basis. The evaluation of all sets
(with up to 13 sounds in each set) in one session cannot be expected by a TI.
Therefore, the sets are arranged into so-called “versions” of the listening test.
Each test version contains four to six sets. Hereby, the test length is kept below 30
minutes, which ensures a reasonable strain on the TI. Five versions – V1 to V5 –
are applied. The configuration is listed in Table 1.
TIP4-CT-2005-516420 Page 16 of 41 QCITY issued: 29-11-06
D2.8.doc
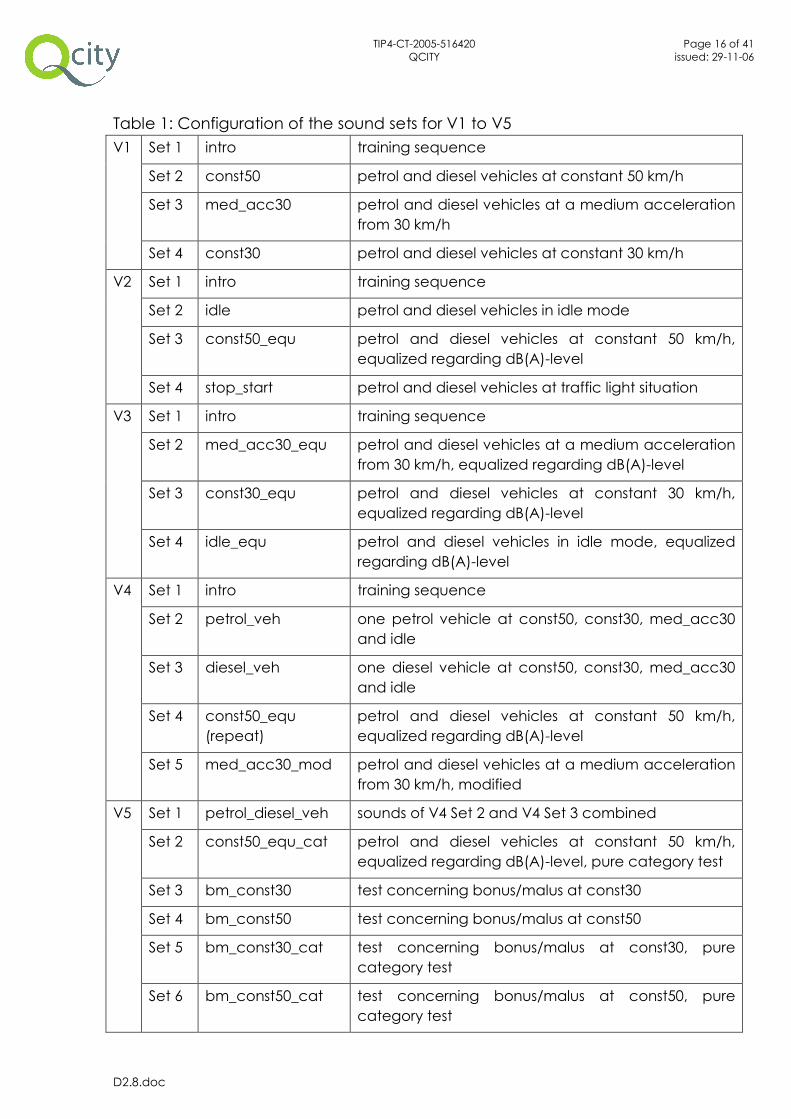
Table 1: Configuration of the sound sets for V1 to V5
Set 1 intro training sequence
Set 2 const50 petrol and diesel vehicles at constant 50 km/h
Set 3 med_acc30 petrol and diesel vehicles at a medium acceleration
from 30 km/h
V1
Set 4 const30 petrol and diesel vehicles at constant 30 km/h
Set 1 intro training sequence
Set 2 idle petrol and diesel vehicles in idle mode
Set 3 const50_equ petrol and diesel vehicles at constant 50 km/h,
equalized regarding dB(A)-level
V2
Set 4 stop_start petrol and diesel vehicles at traffic light situation
Set 1 intro training sequence
Set 2 med_acc30_equ petrol and diesel vehicles at a medium acceleration
from 30 km/h, equalized regarding dB(A)-level
Set 3 const30_equ petrol and diesel vehicles at constant 30 km/h,
equalized regarding dB(A)-level
V3
Set 4 idle_equ petrol and diesel vehicles in idle mode, equalized
regarding dB(A)-level
Set 1 intro training sequence
Set 2 petrol_veh one petrol vehicle at const50, const30, med_acc30
and idle
Set 3 diesel_veh one diesel vehicle at const50, const30, med_acc30
and idle
Set 4 const50_equ
(repeat)
petrol and diesel vehicles at constant 50 km/h,
equalized regarding dB(A)-level
V4
Set 5 med_acc30_mod petrol and diesel vehicles at a medium acceleration
from 30 km/h, modified
Set 1 petrol_diesel_veh sounds of V4 Set 2 and V4 Set 3 combined
Set 2 const50_equ_cat petrol and diesel vehicles at constant 50 km/h,
equalized regarding dB(A)-level, pure category test
Set 3 bm_const30 test concerning bonus/malus at const30
Set 4 bm_const50 test concerning bonus/malus at const50
Set 5 bm_const30_cat test concerning bonus/malus at const30, pure
category test
V5
Set 6 bm_const50_cat test concerning bonus/malus at const50, pure
category test

TIP4-CT-2005-516420 Page 17 of 41 QCITY issued: 29-11-06
D2.8.doc
There are four different topics which the sound sets can be assigned to.
1. Weighting of vehicles
To gain insights about the differences of various vehicles at the same
driving condition, the exterior noise of six to eight gasoline or diesel
vehicles is subject to evaluation. The considered driving conditions are
const30, const50, med_acc30, idle and stop_start.
2. Weighting of driving situations
Two sound sets compile the pass-by sounds of the four driving conditions
const30, const50, med_acc30 and idle for a single vehicle respectively –
one gasoline vehicle and one diesel vehicle.
3. Weighting of parameters
Selected pass-by sounds are subject to specific acoustic modifications to
evaluate the influence of single acoustic parameters. These modifications
concern the dB(A)-level (for the bonus-malus-considerations), the
sharpness and the low frequency share of the sounds.
4. Weighting, independent of the dB(A)-level
The compilation of sounds is copied from “Weighting of vehicles”, but the
dB(A) levels of the sounds are adjusted to the same value. The evaluations
are used for the bonus-malus-considerations and illustrate the influence of
the dB(A) on the perception.
2.4 STATISTICS
Each of the six versions is evaluated by up to 17 TI (minimum 11 TI). Each TI is
subject to an audiometry to test their hearing ability. Thereby it is ensured that
only persons with an “normal” hearing ability, which means no hearing loss
higher than 20 dB for any testing frequency.
The average age of the TI is 35 years (minimum: 26 years, maximum: 56 years).
30 % of the TI are female, 70 % are male. One third of the TI has one or two
children.
The majority of the TI (54 %) describe themselves as sensitive to noise, whereas
only 22 % negate this question. 24 % of the TI called themselves a little or
sometimes sensitive to noise. This is also mirrored by the answers to the question
about regularly noise annoyance. 57 % find themselves annoyed by noise in
their everyday life, 11 % sometimes, 32 % do not. More than half (60 %) of the
noise annoyances are caused by traffic noise/vehicle noise. The second
important noise source is domestic noise (18 %).
84 % of the TI state that they are using their car regularly.
About 80 % of the TI consider the evaluation task as not difficult or easy and
about 20 % as difficult but feasible. Especially the evaluation of the stop_start
situation and the comparison of the idle sound with other pass-by sounds
TIP4-CT-2005-516420 Page 18 of 41 QCITY issued: 29-11-06
D2.8.doc
(petrol_veh, diesel_veh) evoke such comments. Concerning the stop-start
situation the TI has to summarize the perception of three or four different and
partly very dynamic situations (approach/deceleration/idle/drive away). This
seems to be a very demanding task. The same applies to the comparison of a
very static sound, like the idle sound, with sounds, that are very dynamic, like
pass-by sounds.
20 % of the TI encounter problems or irritation during the test. These irritations are
mainly related to the software handling or the evaluation task. They could all be
solved directly at their occurrence during the test. The other 80 % encounter no
problems during the test. Everyone agrees that he would eventually participate
again in such a test.
The short feedback about what influenced the evaluations gives indications on
subjective evaluation parameters. The TI mostly describe acoustic phenomena
which they perceive as annoying. Frequently named items are:
- diesel knocking,
- hissing,
- rumble,
- an even sound is better,
- whistling,
- unpleasant high frequencies,
- humming,
- diesel crackle.
Furthermore, the TI named properties that generally influenced their evaluations,
e.g.:
- rolling noise / engine noise,
- loudness,
- acceleration.
These comments give valuable information about the sound properties that
should be considered during the development of a quantitative description of
the annoyance of pass-by sounds. Therefore, the qualitative comments have to
be translated into acoustic parameters to allow statistical analyses.
The average standard deviation for the evaluation of a single sound is 1.15
categories. Interestingly, the standard deviation for the sound sets with
unmodified sounds is only 1.03 categories, whereas for the sound sets
concerning bonus / malus considerations it goes up to 1.30 categories.
The cluster analyses of the TI do not detect outliers. The Ward method shows
almost always a typical grouping of two main clusters without imbalance. The
cluster affiliation of the TI can also be found in the factor weightings of the PCA.

TIP4-CT-2005-516420 Page 19 of 41 QCITY issued: 29-11-06
D2.8.doc
The comparison of the intro sound sets is done with the t-test method for
independent samples. No significant differences between the sound sets can
be found. This means that the TI show a high reliability over the different listening
test versions. The same applies for the comparison of the two const50_equ
sound sets.
Further the evaluations of the two test designs “category test with sorting” and
“category test” are compared using the const50_equ sounds. Here also no
significant differences are detected. Nevertheless, it appears that the TI use a
slightly wider range of the scale if they are doing the category test with sorting.
TIP4-CT-2005-516420 Page 20 of 41 QCITY issued: 29-11-06
D2.8.doc
3 S O U ND A NA L Y S E S
For the objective description of the annoyance of the sounds selected for the
listening test acoustic parameters have to be found that mirror sound properties
influencing the perception. The selection of these parameters bases on existing
knowledge (found in literature and former research) as well as an additional
search for appropriate descriptions of specific sound features, that are found
important (by the TI or researchers).
Naturally, usually applied analyses like the SPL (sound pressure level) or loudness
are considered.
SPL
The A-weighted SPL is the generally used and most common parameter for the
evaluation of environmental noise. It is used for legal limits, in noise maps and
international norms. The usage is often deduced from dosage-effect-relations
describing the harmful effect of noise.
Therefore it is compulsory to include dB(A)-values in the analysis of the
annoyance evaluations of the TI. The analysis will show if the A-weighted SPL is
applicable for the description of annoyance.
In analogy to the Lmax of the ISO 362 and the Lden of the noise maps the
maximum and average SPL is selected.
Loudness
The Loudness is the psycho-acoustic equivalent to the A-weighted SPL. The
parameter Loudness represents the perceived loudness of a sound. It is a
subjective measure. The calculation method is described within the ISO 532.
There are a wide range of publications that prove the loudness one of the most
important parameters regarding noise annoyance (see Fastl, Mellert, Berglund,
etc.). Concerning vehicle noise it has shown that high correlations exist between
annoyance evaluations and the specific loudness percentiles – particularly the
5% percentile (N5, see e.g. Patsouras).
The N5 Loudness percentile is selected for the analysis as well as the maximum
value and the N1, N10 and N50 percentiles.
Diesel / Engine Noise
The most frequent answer to the question about sound features influencing the
evaluation is “the sound of the engine”. Especially the typical sound of a diesel
engine was described as very annoying.

TIP4-CT-2005-516420 Page 21 of 41 QCITY issued: 29-11-06
D2.8.doc
A strong engine sound is characterized by its dominating engine orders in the
low frequency range. The diesel sound has additionally a typical knocking
pattern in the mid and high frequency range.
For the detection of these sound properties the analysis Relative Approach (RA)
is used. The RA is capable of the detection of tonal components, frequency and
time patterns within a sound. The RA was already successfully applied in former
investigations about diesel knocking.
The RA simulates the adaptivity of the human hearing. The human hearing is
very sensitive to patterns in the frequency and time domain. Monotonous signals
cause a very fast adaptation, whereas permanently changing sounds and
sounds with dominant patterns consistently attract attention (and can cause
annoyance). The RA separates sound parts with and without pattern and
thereby evaluates the contained patterns. An estimated signal – based on the
previous values – is constantly compared with the actual signal. High differences
are interpreted as dominant patterns. The capability of detecting diesel
knocking is illustrated in Figure 5.
Figure 5: Relative Approach 3D. Example for a gasoline engine (top) and a diesel engine (bottom)
It is possible to apply the RA only to frequency patterns (RA(f)) or time patterns
(RA(t)) or both (RA(f+t)). For the further analysis these three possibilities are

TIP4-CT-2005-516420 Page 22 of 41 QCITY issued: 29-11-06
D2.8.doc
selected. Additionally, the RA(f) analysis is combined with a low pass filter at
300 Hz for a better detection of the engine orders, and the RA(t) is combined
with a band pass filter between 750 Hz and 5 kHz for a better detection of the
diesel knocking pattern.
High Frequencies
Another typical sound feature that can cause annoyance by listeners is a high
content of high frequencies in the frequency spectrum of a sound. Concerning
pass-by sounds this can be caused by high levels of rolling noise. The
consideration of this feature is also suggested by the TI comments. Besides the
direct mentioning of rolling noise, terms like “hissing” indicate essential shares in
the high frequency range.
The psycho-acoustic parameter for the assessment of this sound feature is the
sharpness. Sharpness is a measure of the high frequency share of a sound. The
greater the share of high frequencies the ‘sharper’ the sound is perceived. The
calculation bases on the loudness calculation method described in ISO 532. The
spectral loudness composition is then specifically weighted. Here the method of
von Bismarck is applied. The sharpness unit is acum. Figure 6 depicts the spectral
loudness composition for two vehicles with different sharpness.
Figure 6: Specific Loudness. Example for a car with high content (top) and low content (bottom) of high frequencies and their respective sharpness value

TIP4-CT-2005-516420 Page 23 of 41 QCITY issued: 29-11-06
D2.8.doc
In analogy to the loudness analysis the S1, S5, S10 and S50 percentiles are
calculated for each sound file as well as the average sharpness.
Tonal Components
The occurrence of tonal components influences the perception. This relation is
stated in literature (Zwicker, Aures. etc.), has influenced standardisation (ANSI
S1.13, DIN 45681) and is also proved by the comments of the TI.
Besides the frequency and time patterns, the Relative Approach analysis
assesses also the tonal components of a sound. But for the sole detection of
tonal components the tonality analysis is considered too. Again, the four
percentiles 1%, 5%, 10% and 50% are selected.
Low Frequencies
Dominant low frequencies emitted by the power train can cause high
annoyance. They are described by the TI as “unpleasant humming noise”.
Again, the Relative Approach is also considering frequency patterns in the low
frequency range within its analysis. For an isolated assessment of the low
frequency content a calculation method for a booming index was developed5.
The principal idea of the booming index is the consideration of the loudness
content below 250 Hz, inspired by the outcome of the EU project SVEN.
Therefore, a parameter named “Booming1” is calculated as the absolute
loudness below 250 Hz (unit: sone). Furthermore, a second parameter named
“Booming2” relates this loudness content to the overall loudness of the sound; it
describes the low-frequent share of the sound. Booming2 can be considered to
be the opposite of the parameter of sharpness.
5 The application of this index was preferred to an existing calculation method for a booming index (see
Russell, Sung-Hwan) due to better handling and suitability.
TIP4-CT-2005-516420 Page 24 of 41 QCITY issued: 29-11-06
D2.8.doc
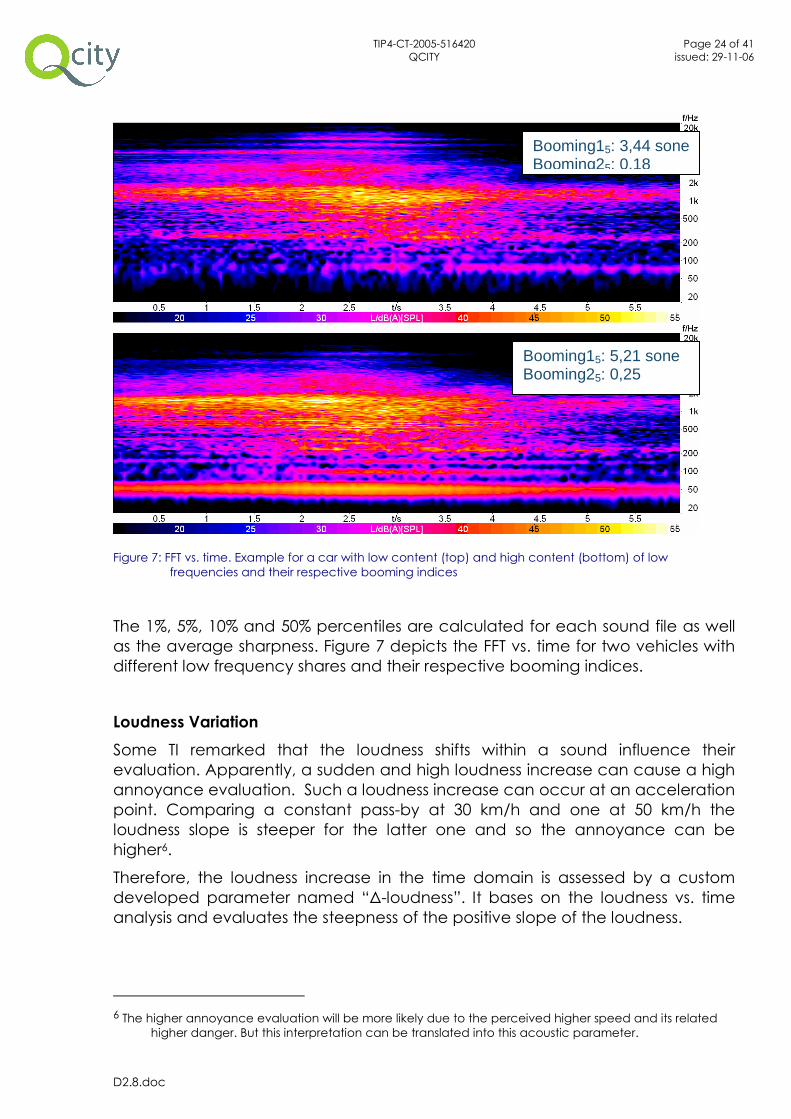
Figure 7: FFT vs. time. Example for a car with low content (top) and high content (bottom) of low frequencies and their respective booming indices
The 1%, 5%, 10% and 50% percentiles are calculated for each sound file as well
as the average sharpness. Figure 7 depicts the FFT vs. time for two vehicles with
different low frequency shares and their respective booming indices.
Loudness Variation
Some TI remarked that the loudness shifts within a sound influence their
evaluation. Apparently, a sudden and high loudness increase can cause a high
annoyance evaluation. Such a loudness increase can occur at an acceleration
point. Comparing a constant pass-by at 30 km/h and one at 50 km/h the
loudness slope is steeper for the latter one and so the annoyance can be
higher6.
Therefore, the loudness increase in the time domain is assessed by a custom
developed parameter named “∆-loudness”. It bases on the loudness vs. time
analysis and evaluates the steepness of the positive slope of the loudness.
6 The higher annoyance evaluation will be more likely due to the perceived higher speed and its related
higher danger. But this interpretation can be translated into this acoustic parameter.
Booming15: 3,44 sone Booming25: 0,18
Booming15: 5,21 sone Booming25: 0,25

TIP4-CT-2005-516420 Page 25 of 41 QCITY issued: 29-11-06
D2.8.doc
Ratio of High and Low Frequencies
The TI often mention the content of high or low frequencies in the sounds. Based
on this, the idea is developed that the shares of the low and high frequencies
should contribute to the sound at an adequate ratio, since if one of these is too
dominating the sound will be rejected.
This ratio is calculated using the 5% percentiles of the parameters sharpness and
Booming2. As a reference sound with an assumed optimal ratio of 9.2 serves
pink noise. Other calculated values are referenced to this value. The assumption
is that the bigger the difference the higher is the annoyance of the specific
sound.

TIP4-CT-2005-516420 Page 26 of 41 QCITY issued: 29-11-06
D2.8.doc
4 P R I N C I P A L COM PON E N T A N A L Y S I S
The principal component analysis (PCA) is applied to the evaluations for every
sound set. It enables the determination of common factors that underlie the
single evaluations.
4.1 THEORY
The evaluation of a sound set with m different sounds by n different TI produces
a n x m evaluation matrix. The single evaluations of the TI will more or less differ
from one another. It is now assumed that a few specific common evaluations
factors are responsible for the evaluations and their different weighting for each
TI causes the variations between the evaluations7.
In the first step, the PCA tries to find a set of m evaluation values that has the
maximum correlation with all the single evaluations of the n TI. This set of
evaluation values owns also the maximum explanation for the variations8
between the single evaluations of the n TI. It represents the first factor, which is
characterized by its factor values (here the evaluation values for the sounds)
and its factor loading representing the share of explained variation. The second
factor is determined using the residual variations. This procedure is repeated until
the determined factors together explain the total variation. This point is reached
at latest with the factor number n.
The percentage of variation explanation and therefore the importance of a
factor decreases with every iteration. There are different methods to determine
the number of factors produced by a PCA relevant for the respective results.
Here the Kaiser-Guttman-Criterion is chosen. This means, that only factors are
considered that explain more than an evaluation of a single TI itself; factors with
a lower explanation produce no further data reduction. This is mathematically
expressed by the requirement of an eigenvalue higher than one for each factor
to be considered relevant.
A typical result for a PCA will be the determination of two or three relevant
factors that explain more than 80 % of the variations. So the initial n x m
evaluation matrix is now represented by a 3 x m factor matrix. That explains also
7 Example: A psychological test assesses the arithmetic capability as well as the spatial sense of a TI. The
final result of each TI will base on these two factors and the variations between the results on the different individual capabilities regarding the two factors.
8 Regarding the example, the total variation between the final results of the TI can be explained by their different individual capabilities. If the differences between the individual arithmetic capabilities are the same as the differences between the final results, this factor is explaining the total variation. Hence, the spatial sense has no influence on the differences of the final results; all TI perform equally concerning this factor. Typically, one factor is explaining only a certain fraction of the variations (this is a certain correlation between the differences) and the next factor explains a certain fraction of the residual variation and so on.
TIP4-CT-2005-516420 Page 27 of 41 QCITY issued: 29-11-06
D2.8.doc
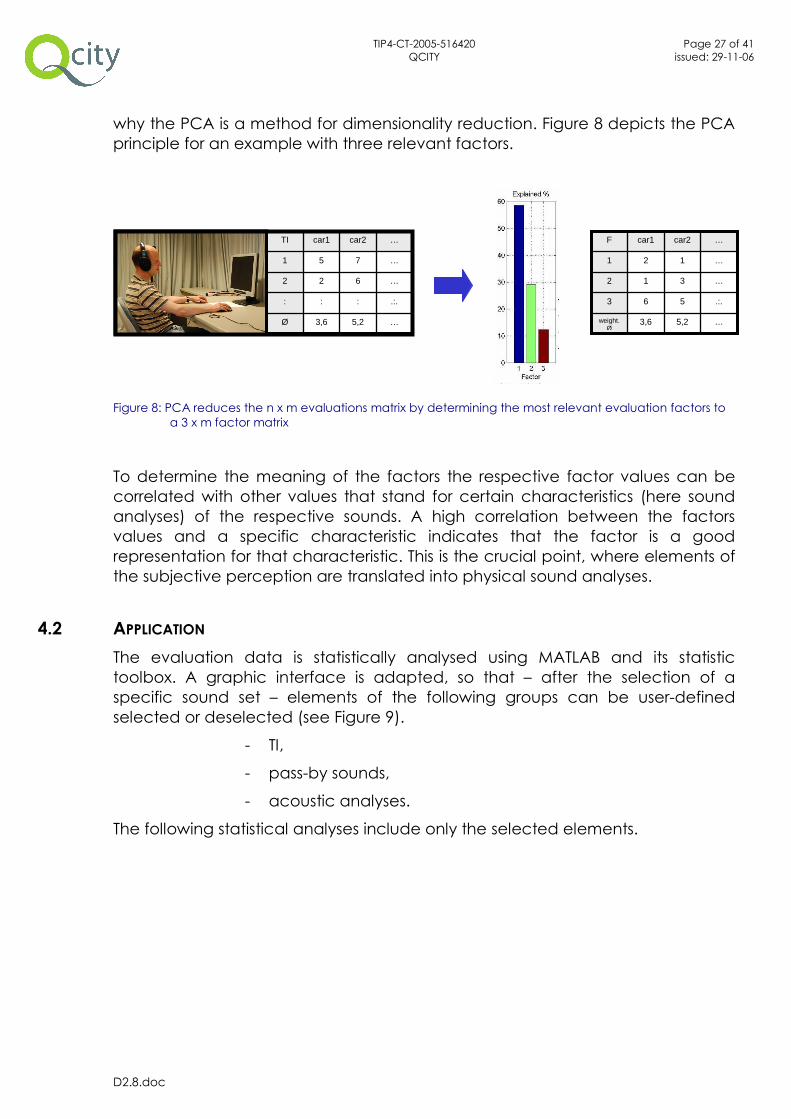
why the PCA is a method for dimensionality reduction. Figure 8 depicts the PCA
principle for an example with three relevant factors.
Figure 8: PCA reduces the n x m evaluations matrix by determining the most relevant evaluation factors to a 3 x m factor matrix
To determine the meaning of the factors the respective factor values can be
correlated with other values that stand for certain characteristics (here sound
analyses) of the respective sounds. A high correlation between the factors
values and a specific characteristic indicates that the factor is a good
representation for that characteristic. This is the crucial point, where elements of
the subjective perception are translated into physical sound analyses.
4.2 APPLICATION
The evaluation data is statistically analysed using MATLAB and its statistic
toolbox. A graphic interface is adapted, so that – after the selection of a
specific sound set – elements of the following groups can be user-defined
selected or deselected (see Figure 9).
- TI,
- pass-by sounds,
- acoustic analyses.
The following statistical analyses include only the selected elements.
… 5,2 3,6 Ø
.:. : : :
… 6 2 2
… 7 5 1
… car2 car1 TI
… 5,2 3,6 weight. Ø
.:. 5 6 3
… 3 1 2
… 1 2 1
… car2 car1 F

TIP4-CT-2005-516420 Page 28 of 41 QCITY issued: 29-11-06
D2.8.doc
Figure 9: Interface for the statistical analysis of the evaluation data
Within this interface it is possible to define the eigenvalue criterion for the factor
selection. As stated above, here a value of 1 is chosen according to the Kaiser-
Guttmann-criterion.
Furthermore, cluster analyses for the TI or the sounds can be calculated and
displayed in diagrams. Thereby, the variations between the evaluations of the TI
and the sounds can be checked and outliers can be identified. The cluster
analysis are performed according to the Ward method (tends to form evenly
distributed clusters) and the average linkage method (tends to identify outliers
better). Figure 10 depicts an example of the created diagrams. Every analysis
produces a dendrogram as well as the curve of the increase of the square error
sum with every clustering step.

TIP4-CT-2005-516420 Page 29 of 41 QCITY issued: 29-11-06
D2.8.doc
Figure 10: Cluster analyses of the sounds (left) and of the TI (right) using the Ward method (top) and the average linkage method (bottom)
It is possible to display the sounds using their new calculated factor values. Such
a diagram showing graphically the distribution of the sounds over the factors
can support the interpretation of the factors. Figure 11 depicts an example for
such a diagram. Here the main factor (Factor 1) separates car 1and 2 from car
4 and 5. The comparison of these cars can hint on the meaning of Factor 1.
Figure 11: Diagram displaying the distribution of the sounds within the identified factors
TIP4-CT-2005-516420 Page 30 of 41 QCITY issued: 29-11-06
D2.8.doc
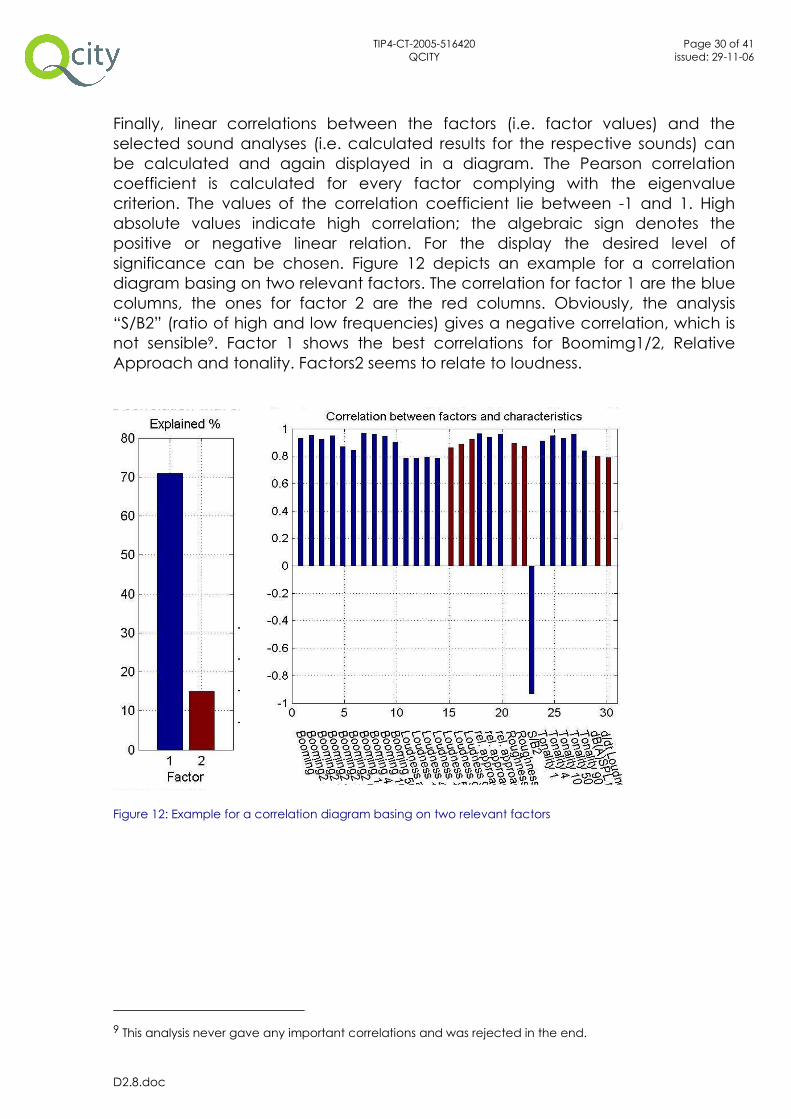
Finally, linear correlations between the factors (i.e. factor values) and the
selected sound analyses (i.e. calculated results for the respective sounds) can
be calculated and again displayed in a diagram. The Pearson correlation
coefficient is calculated for every factor complying with the eigenvalue
criterion. The values of the correlation coefficient lie between -1 and 1. High
absolute values indicate high correlation; the algebraic sign denotes the
positive or negative linear relation. For the display the desired level of
significance can be chosen. Figure 12 depicts an example for a correlation
diagram basing on two relevant factors. The correlation for factor 1 are the blue
columns, the ones for factor 2 are the red columns. Obviously, the analysis
“S/B2” (ratio of high and low frequencies) gives a negative correlation, which is
not sensible9. Factor 1 shows the best correlations for Boomimg1/2, Relative
Approach and tonality. Factors2 seems to relate to loudness.
Figure 12: Example for a correlation diagram basing on two relevant factors
9 This analysis never gave any important correlations and was rejected in the end.

TIP4-CT-2005-516420 Page 31 of 41 QCITY issued: 29-11-06
D2.8.doc
5 E V A L U A T I ON I N D E X E I
The results of the PCA and correlation calculations between factors and
acoustic analyses describe the evaluation pattern of the TI and identify relevant
parameters.
5.1 RESULTS OF THE PCA
The PCA of the 23 sound sets produce always one dominating factor with an
explained variation between 60 % and 90 %. Looking at the diagrams displaying
the distribution of the sound concerning this first factor it can be seen, that the
factor clearly separates the diesel vehicles from the vehicles with otto engines.
Figure 13 depicts the distribution of the sound for three sound sets. The vehicles
with strong diesel engines (here: VW Caddy, Skoda Octavia) are on one end of
the factor 1 axis and the low-key otto engines (here: MB E350, Opel Meriva) are
on the other.
Figure 13: Distribution of the sounds over the first factor for the sound sets med_acc30, const30 and const50; the strong diesel engines (VW Caddy, Skoda Octavia) and the soft otto engines (MB E350, Opel Meriva) are clearly separated
med_acc30 const30 const50

TIP4-CT-2005-516420 Page 32 of 41 QCITY issued: 29-11-06
D2.8.doc
The correlation calculations also prove this relation. The respective factor values
correlate almost always with the RA(f) values at least with an correlation
coefficient of 0.7 (see Figure 14 for two examples). The only exceptions are the
sound sets idle_equ, med_acc30_equ and diesel_veh10.
Figure 14: Two examples for the identified factors and their correlation with the RA(f), RA(f) with low pass filter and RA(f+t); left: intro (V1), right: const50_equ_cat (negative correlation due to orientation of the factor)
Therefore, it can be concluded that the evaluations are mainly influenced by
the power train noise including diesel knocking and tonal components (mainly
coming from the engine orders). The acoustic parameter RA(f) and RA(t) are
describing these features and especially the RA(f) is considered to be a good
representation of the first factor influencing the evaluations of the TI.
Further acoustic parameters that showed frequently high correlation with the first
or second factor of the sound sets are the 5% percentile of the loudness N5 and
the 5% percentile of Boomimg1. That the evaluations are influenced by the
loudness of the sounds has been expected, as it is a common accepted
relation. Additionally, the amount of the low frequency content seems to be a
decisive parameter for the TI.
5.2 CREATING THE EVALUATION INDEX
Starting from these results a first approach for the evaluation index is created. It
should give a high explanation for all sound sets, because ideally it should
describe the perception of a single pass-by independent of car type or driving
situation. Since a high inter-correlation exists between the RA(f) and the
Booming15, Booming15 is not included in the first approach for the evaluation
index. So, the considered parameters are the RA(f) and the N5:
10 Possible reasons for these outliers are discussed further below.
TIP4-CT-2005-516420 Page 33 of 41 QCITY issued: 29-11-06
D2.8.doc
EI1st Approach = Relative Approach (f) + 0.6 � N5
This equation weights the parameter at a ratio of 5 : 2 11. The weighting of the
two parameters is based on the average weighting of the first and second
factor calculated for every sound set, but is optimised for maximum correlation
with the evaluations of the TI.
These correlations reach good and very good values between 0.71 and 0.99 for
almost all sound sets.
The two exceptions idle_equ and diesel_veh can be explained with the different
perception of an idle sound compared to a pass-by sound. Especially the idle
sounds of strong diesel engines are much louder than these of moderate otto
engines – that is why the index worked for the unmodified idle sounds. But at an
unrealistic moderate sound level the repetitive pattern of the diesel knocking
can be perceived as less annoying, since one can get accustomed to that
pattern. For the diesel_veh set the TI often stated that it was difficult to compare
the static idle sound to the dynamic pass-by sounds. The contexts for these
sounds differ strongly. The idle sound indicates a vehicle that is not moving and
will remain in front of the listener, whereas a pass-by sound belongs to vehicle
that is moving – and maybe very fast – but passes by and disappears. Due to
these differences in the evaluation context the results of the sound sets
diesel_veh and consequently also otto_veh are discarded.
For a refinement of the first approach an additional test version V6 is designed.
The main aim is the acquisition of evaluation data concerning the comparison
of different driving situation (since the already evaluated sound sets cannot be
used as stated above). Furthermore, it was tried to consider the whole range of
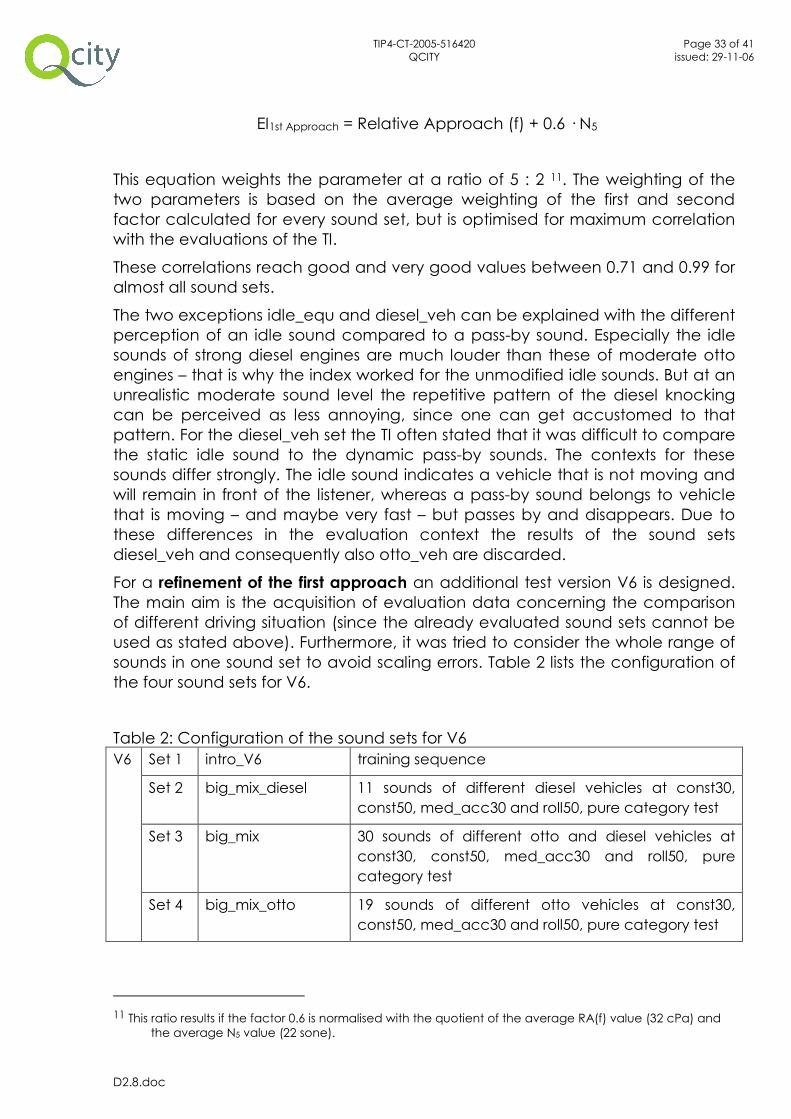
sounds in one sound set to avoid scaling errors. Table 2 lists the configuration of
the four sound sets for V6.
Table 2: Configuration of the sound sets for V6
Set 1 intro_V6 training sequence
Set 2 big_mix_diesel 11 sounds of different diesel vehicles at const30,
const50, med_acc30 and roll50, pure category test
Set 3 big_mix 30 sounds of different otto and diesel vehicles at
const30, const50, med_acc30 and roll50, pure
category test
V6
Set 4 big_mix_otto 19 sounds of different otto vehicles at const30,
const50, med_acc30 and roll50, pure category test
11 This ratio results if the factor 0.6 is normalised with the quotient of the average RA(f) value (32 cPa) and
the average N5 value (22 sone).

TIP4-CT-2005-516420 Page 34 of 41 QCITY issued: 29-11-06
D2.8.doc
The analysis of the V6 evaluations together with the former results lead to the
consideration of the 5 % percentile of the sharpness S5 and the RA(t) for the
evaluation index. The sound features these two parameters are assigned to (e.g.
high frequency tire noise or time patterns; see chapter 3) are named frequently
by the TI and therefore should be integrated into the evaluation index.
Furthermore, different sound sets show good correlation between S5 or RA(t)
respectively and their second factor of the PCA. The improved equation is
EI = RA(f) + RA(t) + 0.4 � N5 + 10 � S5
This corresponds to a weighting of 1 : 0.25 : 0.35 : 0.45. The improvements
concerning the correlation of evaluation and index values affect primarily sets
without artificially modified sounds and without idle sounds, which are the most
relevant sound sets for the EI. Table 3 lists the correlation coefficients for these
sound sets (intro_V1-V4 combines the evaluations of the intro sound sets of V1 –
V4).
Table 3: Correlation coefficient between evaluation values and EI values for
relevant sound sets
Set Evaluation ~ EI
Intro_V1-V4 0.99
const30 0.90
const50 0.92
med_acc30 0.91
idle 0.89
stop_start 0.81
intro_V6 0.97
big_mix_diesel 0.90
big_mix_otto 0.87
big_mix 0.93
It can be seen that the EI works very well for these sound sets. Nevertheless, the
linear regression between evaluation and index shows that the sound sets idle
and stop_start are relating very differently to the EI than the other sound sets.
Therefore, sound sets containing idle sounds are excluded from the further
considerations. The EI is developed for real pass-by sounds.
TIP4-CT-2005-516420 Page 35 of 41 QCITY issued: 29-11-06
D2.8.doc
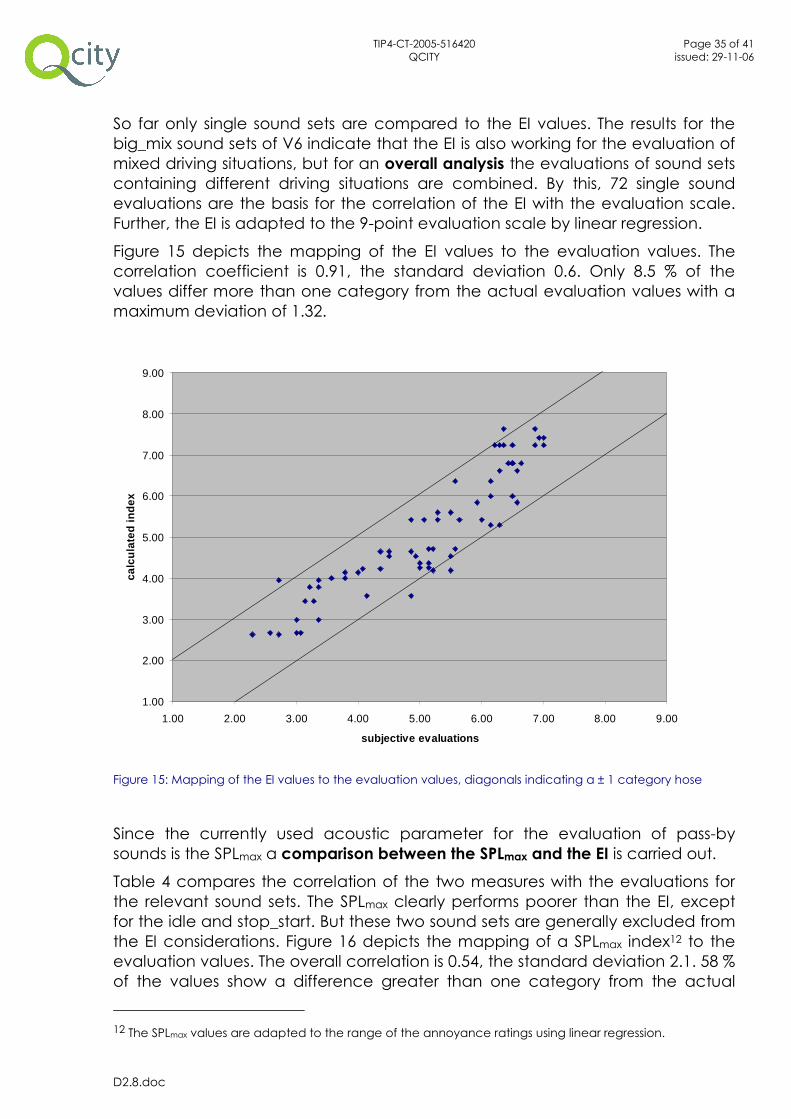
So far only single sound sets are compared to the EI values. The results for the
big_mix sound sets of V6 indicate that the EI is also working for the evaluation of
mixed driving situations, but for an overall analysis the evaluations of sound sets
containing different driving situations are combined. By this, 72 single sound
evaluations are the basis for the correlation of the EI with the evaluation scale.
Further, the EI is adapted to the 9-point evaluation scale by linear regression.
Figure 15 depicts the mapping of the EI values to the evaluation values. The
correlation coefficient is 0.91, the standard deviation 0.6. Only 8.5 % of the
values differ more than one category from the actual evaluation values with a
maximum deviation of 1.32.
1.00
2.00
3.00
4.00
5.00
6.00
7.00
8.00
9.00
1.00 2.00 3.00 4.00 5.00 6.00 7.00 8.00 9.00
subjective evaluations
calc
ula
ted
ind
ex
Figure 15: Mapping of the EI values to the evaluation values, diagonals indicating a ± 1 category hose
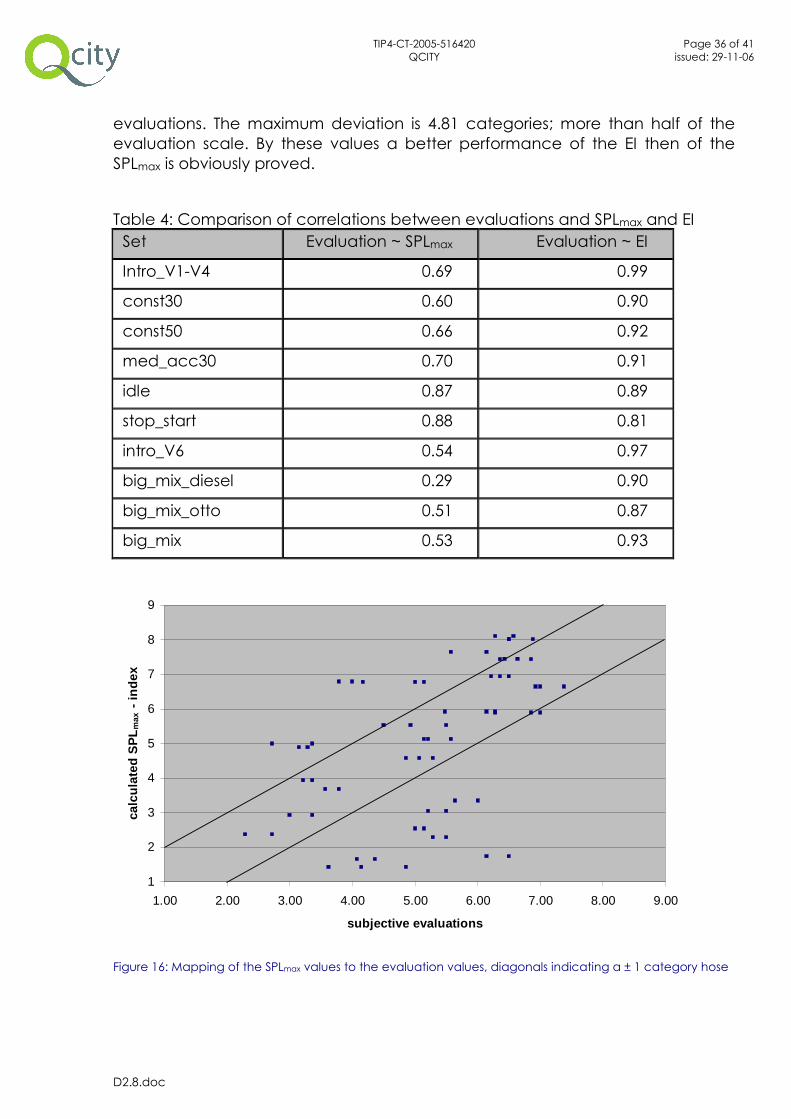
Since the currently used acoustic parameter for the evaluation of pass-by
sounds is the SPLmax a comparison between the SPLmax and the EI is carried out.
Table 4 compares the correlation of the two measures with the evaluations for
the relevant sound sets. The SPLmax clearly performs poorer than the EI, except
for the idle and stop_start. But these two sound sets are generally excluded from
the EI considerations. Figure 16 depicts the mapping of a SPLmax index12 to the
evaluation values. The overall correlation is 0.54, the standard deviation 2.1. 58 %
of the values show a difference greater than one category from the actual
12 The SPLmax values are adapted to the range of the annoyance ratings using linear regression.
TIP4-CT-2005-516420 Page 36 of 41 QCITY issued: 29-11-06
D2.8.doc
evaluations. The maximum deviation is 4.81 categories; more than half of the
evaluation scale. By these values a better performance of the EI then of the
SPLmax is obviously proved.
Table 4: Comparison of correlations between evaluations and SPLmax and EI
Set Evaluation ~ SPLmax Evaluation ~ EI
Intro_V1-V4 0.69 0.99
const30 0.60 0.90
const50 0.66 0.92
med_acc30 0.70 0.91
idle 0.87 0.89
stop_start 0.88 0.81
intro_V6 0.54 0.97
big_mix_diesel 0.29 0.90
big_mix_otto 0.51 0.87
big_mix 0.53 0.93
1
2
3
4
5
6
7
8
9
1.00 2.00 3.00 4.00 5.00 6.00 7.00 8.00 9.00
subjective evaluations
calc
ula
ted
SP
Lm
ax -
ind
ex
Figure 16: Mapping of the SPLmax values to the evaluation values, diagonals indicating a ± 1 category hose

TIP4-CT-2005-516420 Page 37 of 41 QCITY issued: 29-11-06
D2.8.doc
The last step is the adaptation of the EI to a common 10-point scale (applied
e.g. in the VDI 2563). The specific demands to this scale are
- 10 point scale from 1 (very annoying) to 10 (not at all
annoying)
- no values below 1 or above 10 are possible
The reasoning for the last point is that if an unbearable sound is made e.g.
louder it will not become “more unbearable” but remain unbearable. The same
applies for not annoying sounds that are made quieter. So, the last point shall
ensure that the EI analysis of sounds with extreme parameter values (e.g. very
loud or very quiet sounds) does not produce values outside the specified range.
This risk is given by applying a simple linear relation.
For the construction of this scale an adaptation function basing on an
exponential function with a cubic argument is applied upon the current EI
formula. Figure 17 depicts the course of the transformation function between
the two scales. The actual evaluation values between 1 and 9 are mapped to
the linear range of this function.
Figure 17: Transformation of the EI scale from “1 – 9” evaluations to “10 – 1” scale
Very annoying sounds that would create EI values higher than 9 cannot
produce values lower than 1 on the new scale, and the values of very quiet
sounds go asymptotically against 10. The transformation has a negligible effect
on the quality of the correlation.
0
2
4
6
8
10
-7 -3 1 5 9 13
EI "1 - 9"
EI
"10
- 1"
TIP4-CT-2005-516420 Page 38 of 41 QCITY issued: 29-11-06
D2.8.doc
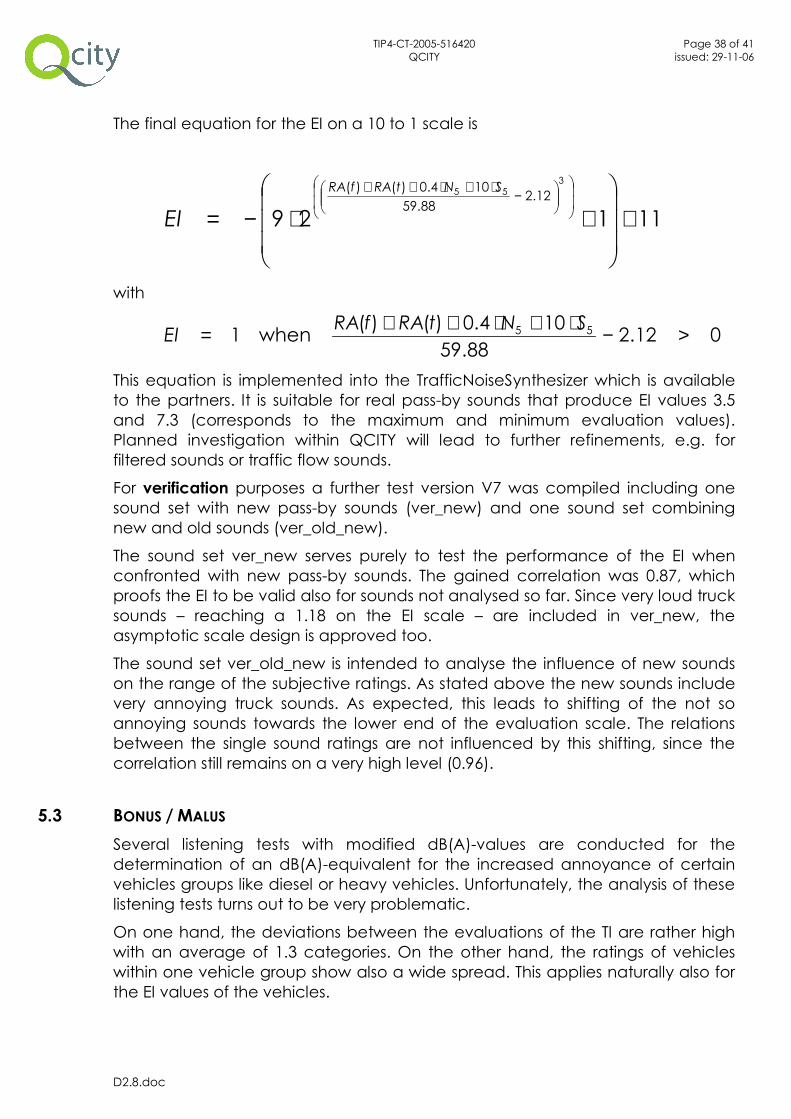
The final equation for the EI on a 10 to 1 scale is
11129
355 12.2
88.59
104.0)()(
+
+⋅−=
−⋅+⋅++ SNtRAfRA
EI
with
012.288.59
104.0)()(when1 55 >−⋅+⋅++= SNtRAfRA
EI
This equation is implemented into the TrafficNoiseSynthesizer which is available
to the partners. It is suitable for real pass-by sounds that produce EI values 3.5
and 7.3 (corresponds to the maximum and minimum evaluation values).
Planned investigation within QCITY will lead to further refinements, e.g. for
filtered sounds or traffic flow sounds.
For verification purposes a further test version V7 was compiled including one
sound set with new pass-by sounds (ver_new) and one sound set combining
new and old sounds (ver_old_new).
The sound set ver_new serves purely to test the performance of the EI when
confronted with new pass-by sounds. The gained correlation was 0.87, which
proofs the EI to be valid also for sounds not analysed so far. Since very loud truck
sounds – reaching a 1.18 on the EI scale – are included in ver_new, the
asymptotic scale design is approved too.
The sound set ver_old_new is intended to analyse the influence of new sounds
on the range of the subjective ratings. As stated above the new sounds include
very annoying truck sounds. As expected, this leads to shifting of the not so
annoying sounds towards the lower end of the evaluation scale. The relations
between the single sound ratings are not influenced by this shifting, since the
correlation still remains on a very high level (0.96).
5.3 BONUS / MALUS
Several listening tests with modified dB(A)-values are conducted for the
determination of an dB(A)-equivalent for the increased annoyance of certain
vehicles groups like diesel or heavy vehicles. Unfortunately, the analysis of these
listening tests turns out to be very problematic.
On one hand, the deviations between the evaluations of the TI are rather high
with an average of 1.3 categories. On the other hand, the ratings of vehicles
within one vehicle group show also a wide spread. This applies naturally also for
the EI values of the vehicles.

TIP4-CT-2005-516420 Page 39 of 41 QCITY issued: 29-11-06
D2.8.doc
Nevertheless, some preliminary results can be obtained. It seems that a dB(A)-
equivalent depends on the respective driving situation. For instance, the
differences between vehicles with loud diesel engines and the ones with otto
engines emerge more clearly with rising speed. The estimated bonus / malus
values for these two vehicle groups are about 4 dB at const30 and 5 dB at
const50.
But, for an averaging of the differences between two vehicles groups it would
be necessary to identify the dB(A)-equivalent for each possible sound pair out of
these two groups. Due to the high deviations mentioned above this procedure
can give inaccurate results.
It is much more reasonable to perform further investigations concerning the
bonus / malus with traffic flow noise, where specific combinations of vehicles
within one group or out of two groups can be realized. The implementation of
such a feature into the TrafficNoiseSynthesizer software will be made within
WP5.12. So, the investigation will be continued within WP5.12. There, the listening
test to be conducted will serve also as a first quality and acceptance test for the
synthesized traffic scenarios.
Together with the EI – which will also be subject to refinement within WP5.12 – it
will be possible to define rules for the application of the bonus / malus. The
simplest solution is the principle application for e.g. diesel vehicles. But if the
assumption is true, that the bonus / malus value depends on factors like driving
situation or general annoyance level, other application methods have to be
found. One possibility for the combination of the bonus / malus and the EI is the
definition of a threshold value derived from the EI or its components.
Alternatively, the bonus / malus could be applied progressively if it is possible to
define an EI-dB(A)-relation or something similar for these cases.
TIP4-CT-2005-516420 Page 40 of 41 QCITY issued: 29-11-06
D2.8.doc
6 CONC L U S I ON A N D O U T L OO K
The pass-by sounds compiled during the first twelve months of WP2.1 (see D2.1
and D2.2) were analysed regarding their perception and psychoacoustic
characteristics. The two aims were to find a quantitative description for their
subjective annoyance effect and a dB-equivalent for the different annoyance
effect of different vehicle groups (bonus / malus), like vehicle with diesel and
otto engines.
On one hand, extensive listening tests were carried out for the psychoacoustic
evaluation. Thereby, traffic noise is evaluated by test individuals (TI) regarding its
annoyance and not only in terms of the SPL / dB(A). On the other hand, different
psychoacoustic parameters were calculated for these sounds. The selection of
the psychoacoustic parameters was carried out with respect to psychoacoustic
measures commonly used when analysing the perception of vehicle noise as
well as respect to the comments of the TI and own considerations about pass-by
sounds of single vehicles.
The principal component analysis (PCA) was applied to the TI ratings of the
listening tests. Hereby, similarities between the single evaluations of the TI could
be discovered and common factors influencing the evaluations could be
determined. Comparison and correlation of these factors with the calculated
psychoacoustic parameters identified parameters that can represent the
evaluation factors.
The most important factor was highly correlated with the Relative Approach
analysis (RA). The RA simulates the adaptivity of the human hearing and is able
to detect time and/or frequency patterns within the sound the human hearing is
very sensitive to. Here it identifies the noise of diesel engine or strong engine
noise in general. This fits also the comments of the TI, which described the
characteristic diesel knocking or typical diesel engine noise as very decisive. The
second important parameter was the 5 % percentile of the loudness N5. This was
not surprising, since in literature it is often related to annoyance
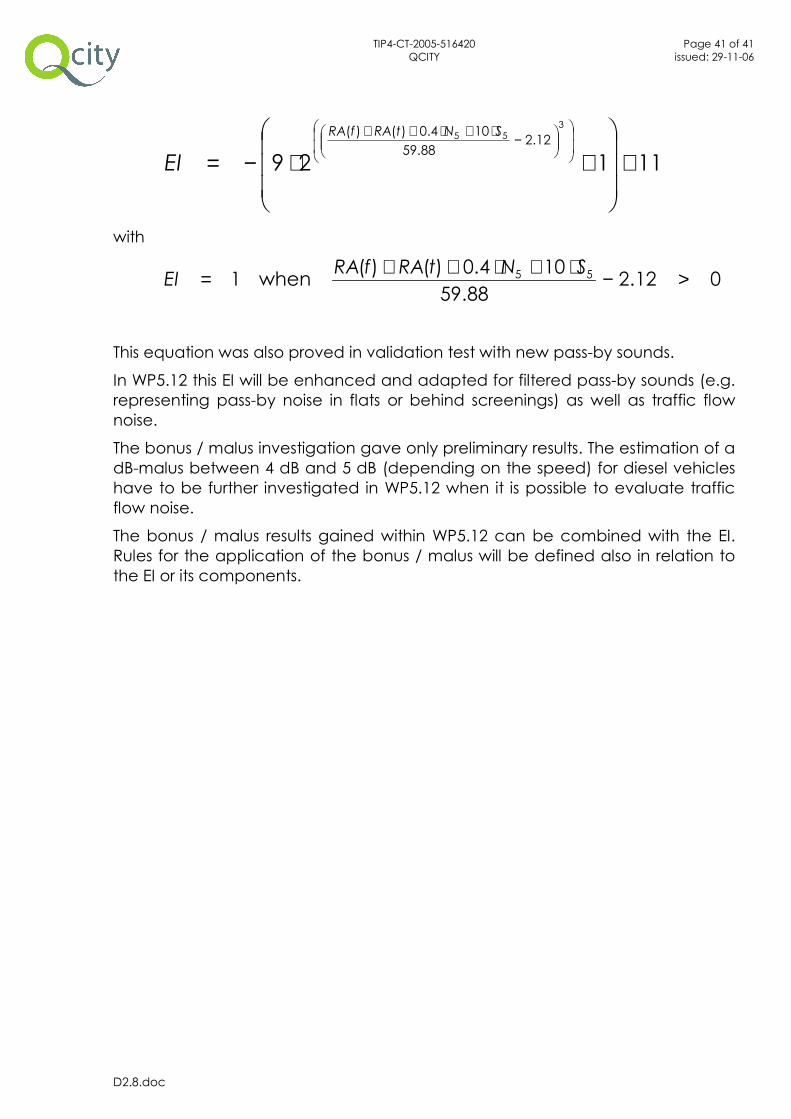
After further considerations and listening tests the list of relevant parameters was
extended by the 5 % percentile of the sharpness (relating to TI comments like
“high frequency tire noise). The gained equation for the evaluation index EI
representing the evaluation ratings of the TI was fitted to a 1 (not at all
annoying) to 10 (very annoying) scale:
TIP4-CT-2005-516420 Page 41 of 41 QCITY issued: 29-11-06
D2.8.doc
11129
355 12.2
88.59
104.0)()(
+
+⋅−=
−⋅+⋅++ SNtRAfRA
EI
with
012.288.59
104.0)()(when1 55 >−⋅+⋅++= SNtRAfRA
EI
This equation was also proved in validation test with new pass-by sounds.
In WP5.12 this EI will be enhanced and adapted for filtered pass-by sounds (e.g.
representing pass-by noise in flats or behind screenings) as well as traffic flow
noise.
The bonus / malus investigation gave only preliminary results. The estimation of a
dB-malus between 4 dB and 5 dB (depending on the speed) for diesel vehicles
have to be further investigated in WP5.12 when it is possible to evaluate traffic
flow noise.
The bonus / malus results gained within WP5.12 can be combined with the EI.
Rules for the application of the bonus / malus will be defined also in relation to
the EI or its components.