
Delft University of Technology Synthesis of Aero ...
26
Delft University of Technology Synthesis of Aero-Propulsive Interaction Studies Applied to Conceptual Hybrid-Electric Aircraft Design Hoogreef, Maurice; de Vries, Reynard; Sinnige, Tomas; Vos, Roelof DOI 10.2514/6.2020-0503 Publication date 2020 Document Version Final published version Published in AIAA Scitech 2020 Forum Citation (APA) Hoogreef, M., de Vries, R., Sinnige, T., & Vos, R. (2020). Synthesis of Aero-Propulsive Interaction Studies Applied to Conceptual Hybrid-Electric Aircraft Design. In AIAA Scitech 2020 Forum: 6-10 January 2020, Orlando, FL [AIAA 2020-0503] (AIAA Scitech 2020 Forum; Vol. 1 PartF). American Institute of Aeronautics and Astronautics Inc. (AIAA). https://doi.org/10.2514/6.2020-0503 Important note To cite this publication, please use the final published version (if applicable). Please check the document version above. Copyright Other than for strictly personal use, it is not permitted to download, forward or distribute the text or part of it, without the consent of the author(s) and/or copyright holder(s), unless the work is under an open content license such as Creative Commons. Takedown policy Please contact us and provide details if you believe this document breaches copyrights. We will remove access to the work immediately and investigate your claim. This work is downloaded from Delft University of Technology. For technical reasons the number of authors shown on this cover page is limited to a maximum of 10.
Transcript of Delft University of Technology Synthesis of Aero ...

Delft University of Technology
Synthesis of Aero-Propulsive Interaction Studies Applied to Conceptual Hybrid-ElectricAircraft Design
Hoogreef, Maurice; de Vries, Reynard; Sinnige, Tomas; Vos, Roelof
DOI10.2514/6.2020-0503Publication date2020Document VersionFinal published versionPublished inAIAA Scitech 2020 Forum
Citation (APA)Hoogreef, M., de Vries, R., Sinnige, T., & Vos, R. (2020). Synthesis of Aero-Propulsive Interaction StudiesApplied to Conceptual Hybrid-Electric Aircraft Design. In AIAA Scitech 2020 Forum: 6-10 January 2020,Orlando, FL [AIAA 2020-0503] (AIAA Scitech 2020 Forum; Vol. 1 PartF). American Institute of Aeronauticsand Astronautics Inc. (AIAA). https://doi.org/10.2514/6.2020-0503Important noteTo cite this publication, please use the final published version (if applicable).Please check the document version above.
CopyrightOther than for strictly personal use, it is not permitted to download, forward or distribute the text or part of it, without the consentof the author(s) and/or copyright holder(s), unless the work is under an open content license such as Creative Commons.
Takedown policyPlease contact us and provide details if you believe this document breaches copyrights.We will remove access to the work immediately and investigate your claim.
This work is downloaded from Delft University of Technology.For technical reasons the number of authors shown on this cover page is limited to a maximum of 10.

Synthesis of Aero-Propulsive Interaction Studies Applied toConceptual Hybrid-Electric Aircraft Design
Maurice F. M. Hoogreef∗, Reynard de Vries†, Tomas Sinnige‡ and Roelof Vos§
Delft University of Technology, Faculty of Aerospace Engineering, Delft, the Netherlands
This paper presents a synthesis of aero-propulsive interaction studies performed at DelftUniversity of Technology, applied to conceptual aircraft designs with distributed hybrid-electricpropulsion (DHEP). The studied aero-propulsive interactions include tip-mounted propulsion,wing leading-edge distributed propulsion and boundary-layer ingestion, combined with dif-ferent primary propulsion-system arrangements. This paper starts with a description of theapplied design framework and an overview of the aero-propulsive interactions. Subsequently,the different aircraft configurations are sized for a set of top-level requirements covering therange between regional turboprop to typical narrow-body turbofan aircraft. Results indicatethat lower shaft power ratios show better performance, with the unoptimized DHEP con-cepts showing values of maximum take-off mass (MTOM) and payload-range energy efficiency(PREE) comparable to their reference aircraft. It was shown that beyond 20% shaft powerratio, the PREE decreases and MTOM increases much more than between 10% and 20%,indicating a possible local optimum between these values since even lower values did not yieldany significant improvements. The benefits of tip-mounted propulsion are found to be con-strained by the propeller blade tip Mach number in this particular analysis for the selectedreference blade loading distribution. At the high range case for Mach 0.5, it can be seen thatthe distributed propulsion systems show the largest improvement.
Nomenclature
Latin Symbols𝐴𝑅 = Aspect ratio (∼)𝐴 = Cable cross-sectional area (m2)𝐶𝐷 = Drag coefficient (∼)𝐶𝐿 = Lift coefficient (∼)𝐶𝐿𝛼 = Lift curve slope (Rad−1)𝐼 = Current (A)𝐽 = Advance Ratio (∼)𝑀 = Mach number (∼)𝑃 = Power (W)𝑇 = Thrust (N)𝑇𝐶 = Thrust Coefficient 𝑇
𝜌 ·𝑉 inf 2 ·𝑑2 (∼)𝑆 = Wing area (m2)𝑉 = Velocity (m/s)𝑊 = Weight (N)𝑏 = Span (m)𝑑 = Diameter (m)𝑙 = Length (m)𝑚 = Mass (kg)
Greek Symbols𝛼 = Wing angle of attack (deg)𝛼𝑝 = Propeller incidence angle (deg)𝜂𝑝 = Propulsive efficiency (∼)Λ = Sweep angle (deg)𝜆 = Taper ratio (∼)𝜉 = Gas turbine throttle (∼)𝜓 = Supplied power ratio (∼)𝜑 = Shaft power ratio (∼)
AcronymsBC = Business classBLI = Boundary layer ingestionCG = Center of gravityDHEP = Distributed hybrid electric propulsionDOC = Direct operating costESP = Equivalent specific powerFEM = Finite element methodFL = Flight LevelFMDP = Fuselage-mounted ducted propellerHEP = Hybrid electric propulsion
∗Assistant Professor, Flight Performance and Propulsion, Kluyverweg 1, 2629HS Delft, [email protected], AIAA Member†PhD candidate, Flight Performance and Propulsion, Kluyverweg 1, 2629HS Delft, AIAA Member‡Assistant Professor, Flight Performance and Propulsion, Kluyverweg 1, 2629HS Delft, AIAA Member§Assistant Professor, Flight Performance and Propulsion, Kluyverweg 1, 2629HS Delft, AIAA Associate Fellow
1
Dow
nloa
ded
by T
U D
EL
FT o
n Ja
nuar
y 6,
202
0 | h
ttp://
arc.
aiaa
.org
| D
OI:
10.
2514
/6.2
020-
0503
AIAA Scitech 2020 Forum
6-10 January 2020, Orlando, FL
10.2514/6.2020-0503
Copyright © 2020 by Maurice F.
M. Hoogreef, Reynard de Vries, Tomas Sinnige and Roelof Vos. Published by the American Institute of Aeronautics and Astronautics, Inc., with permission.
AIAA SciTech Forum

HTMP = Horizontal tail mounted propellerICA = Initial cruise altitudeISA = International standard atmosphereKCAS = Knots calibrated airspeedKPI = Key performance indicatorLE = leading-edge
LLM = Lifting-line modelLPA = Large passenger aircraftMLM = Maximum landing massMTOM = Maximum take-off massNASA = National Aeronautics and
Space Administration
OEI = One engine inoperativeOEM = Operational empty massSL = Sea-levelT/O = Take-offPIV = Particle image velocimetryPREE = Payload range energy efficiencyTLAR = Top level aircraft requirementWI = Wake ingestionWMP = Wing-mounted propellerTOFL = Take-off field lengthTT = Time to climbYC = Economy class
I. Introduction
Modern day aviation’s climate impact is one of the key focus areas of research efforts in pursuit of, for example,the goals identified by the Air Transport Action Group∗ or the European Commission in its Flightpath 2050 [1]
vision on aviation. Significant research is being performed in the area of distributed propulsion and hybrid-electricpropulsion, aimed at exploiting their potential synergistic benefits (e.g. [2–15]). The versatility offered by electricalsystems allows distribution of powertrain components along the airframe, potentially resulting in beneficial aero-propulsive interactions. The latter is important, as these must outweigh any mass penalties introduced by electrificationof the powertrains.
Over the past years, significant effort has been spent at Delft University of Technology to experimentally andcomputationally assess the performance of highly integrated propulsion systems. Among these are leading-edge[16, 17] and over-the-wing distributed propulsion systems[16, 18], tip-mounted propellers [19, 20], tail-mountedpropellers [21–23] and Boundary Layer Ingestion (BLI) or wake-filling of aft-mounted propulsors [24, 25]. However,so far models derived from subsystem studies of aero-propulsive interaction effects have only been coupled to theconceptual design of aircraft to a limited extent (e.g. [4, 13, 14, 26]), but no systematic study has been performedcomparing the different distributed-propulsion architectures. Especially for distributed propulsion, these effects canhave a large impact on the design points (i.e. wing loading, power loading, mass, etc.). Therefore, a new generic sizingmethod for DHEP aircraft that includes these effects was developed by de Vries et al. [27] The original sizing methodfocused on leading-edge and over-the-wing propulsion; this article presents an extension of this sizing method to theaforementioned aero-propulsive interaction studies. This development has been performed under the umbrella of theEU project NOVAIR. NOVAIR is part of work package 1.6.1.4 of the Clean Sky 2 program targeting Large PassengerAircraft (LPA). The goal of NOVAIR is to investigate what synergistic effects between the propulsion system andairframe can be exploited in future aircraft and what their impact is on key performance metrics such as overall energyconsumption and mass.
This paper presents the preliminary findings for conceptual hybrid-electric propulsion (HEP) aircraft designs,fitted with a partial turbo-electric powertrain, evaluated for a set of top-level aircraft requirements (TLAR), variabletechnology scenarios and different shaft power ratios. These include a design payload of 20 metric tons for 150passengers, a harmonic range of 1100 to 2000 nmi and a cruise Mach number ranging from 0.5 to 0.6. The powertrainarchitecture and mission requirements are based on the findings of sensitivity studies carried out previously [13, 28].To this end, the sizing method [27] has been extended and coupled to the in-house developed Aircraft Design Initiator(or simply Initiator), a conceptual design tool synthesizing aircraft for given TLARs using a predefined convergenceloop [29]. The sizing tool is described in Sec. II, while the aero-propulsive models that were integrated in the tool arebriefly discussed in Sec. III. Section IV then presents the results of the reference aircraft, while Sec. V analyzes theresults for the different HEP concepts and mission requirements.
II. Aircraft sizing processThe conceptual aircaftdesign of the different aircraft configurations is performed using the "Initiator" design tool.
This software tool performs a design convergence over several disciplinary analyses, including handbook methods,∗Air transport action group, Facts & Figures, May 2016, https://www.atag.org/facts-figures.html, visited on 7 June 2018
2
Dow
nloa
ded
by T
U D
EL
FT o
n Ja
nuar
y 6,
202
0 | h
ttp://
arc.
aiaa
.org
| D
OI:
10.
2514
/6.2
020-
0503

empirical data and physics-based methods. The process flow of the Initiator is shown schematically in Figure 1. TheInitiator itself can be used to assess the impact of small and large changes to the aircraft on so-called key performanceindicators (KPIs) in the conceptual design of CS-25 aircraft. It supports propeller-powered and turbofan-poweredaircraft, as well as conventional tube-and-wing aircraft and (to some degree) blended-wing-body aircraft, three-surfaceaircraft, and box-wing aircraft. A description of the Initiator can be found in Elmendorp et al. [29]. Furthermore,the Initiator uses a convergence process for the synthesis, in which the design variables are altered iteratively untila predefined set of KPIs converge below a certain threshold. In other words, the Initiator uses a process of design“feasilization” [30], rather than optimization. Therefore, constraints are not exposed to an optimizer and no explicitdesign variables exist that are under control of an optimizer.
Fig. 1 Illustration of the Initiator process flow for the design of DHEP aircraft.
Figure 1 only shows the process flow at an aggregated level; many of the analysis or sizing modules representdifferent smaller modules. For example, the "Geometry Estimation" contains more than 20 individual modulesdimensioning aircraft geometry. Many modules have a dependency on other modules. For example, when only themodule "Class-II Weight Estimation" is triggered, it first evaluates all the preceding modules, including the Class-Iconvergence.
The "Class-II.5 weight estimation" includes a semi-analytical fuselage weight estimation method ([31–33]) and afinite-element (FEM) based wing weight estimation [34] to incorporate the effects of distributed propulsion on wingstructure. This includes 2.5G landing loads, 2.5G pull-up at maximum zero fuel weight, as well as a 2.5G pull-up atmaximum take-off weight. All wing-mounted masses (engines, generators, fuel tanks, etc.) are considered as eitherdistributed masses or point-masses and are included as loads on the structure.
The convergence loop for the DHEP aircraft design actually consists of multiple convergences; one on Class-I andmission analysis, one on the Class-II weight estimation, one Class-II.5 weight estimation and an overarching loop onthe start of the process and the outcomes of the Class-II and Class-II.5 loops. The latter converges on the maximumtake-off mass (MTOM). Modifications have been made to the existing Initiator modules to accommodate the sizing ofDHEP aircraft, such as mass estimations of electric motors and batteries.
3
Dow
nloa
ded
by T
U D
EL
FT o
n Ja
nuar
y 6,
202
0 | h
ttp://
arc.
aiaa
.org
| D
OI:
10.
2514
/6.2
020-
0503

A. Preliminary sizing - wing/power loading diagramThe first convergence loop starts with extracting data from a database of reference aircraft. With this information,
an estimate of MTOM is made. In the subsequent module, the required power and wing size are computed basedon a user-specified set of top level aircraft requirements (TLARs) in addition to performance requirements stemmingfrom regulations (FAR/CS 25). The sizing methodology that is followed is illustrated graphically in Figure 2; thefull description of the Class-I DHEP sizing method can be found in Ref. [27] The hybrid electric preliminary sizingmethod developed by de Vries et al. [27] has been compared to another sizing approach as developed by Finger et al.[35]; the comparison of both methods in Finger et al. [36] shows good agreement between results.
Sizing for
power
Sizing for
energy
Conventional
design parameters
(CD0, AR, CLmax…)
Additional HEP
design parameters
(N, hybridization,
serial/parallel, …)
A. Modified wing
loading diagram
(Constraint analysis)
B. Modified mission
analysis
W/S, W/Pshaft,
W/Pmotor, W/Pbat…
Ebat, Efuel, MTOW, S, Pmotor…
Include aero-propulsive
interactions!
Fig. 2 Schematic flow of conceptual sizing for power and energy.
A key feature of this method is that it considers the aircraft as a point mass, balancing forces and accelerations foreach performance requirement. For the representation of the powertrain a simplified model is used, following the sixtypes of layouts proposed by Felder [2] and later adopted by the National Academy of Sciences [37]: conventional,series, parallel, turbo-electric, partial turbo-electric and series/parallel partial hybrid. Additionally, three power controlsare included in the model: Gas turbine throttle (𝜉), Supplied power ratio (𝜓) and Shaft power ratio (𝜑).
Moreover, the method allows including aero-propulsive effects in the assessment of different constraints in thedesign-point diagram. Such constraints are, for example, related to take-off and cruise performance or climb perfor-mance in one-engine-inoperative scenarios. Normally, these constraints are decoupled from propulsive influences.However, especially for distributed propulsion systems, these effects can be beneficial in terms of wing sizing (if aprimary propulsion source provides thrust). As such, lift and drag for equilibrium flight become coupled to thrust:
𝐶𝐿total = 𝐶𝐿isolated + Δ𝐶𝐿thrust-induced (1)
𝐶𝐷total = 𝐶𝐷0 + 𝐶𝐷lift-induced + Δ𝐶𝐷thrust-induced (2)
These contributions are also included in the drag polar of the aircraft in the mission analysis. Additionally, thesubsystems are modeled as separate point-masses in the Class-II and Class-II.5 weight estimations, such that theirinfluences on aircraft MTOM and energy consumption are considered, as well as the impact on the structural wingmass in the FEM weight estimation.
In the present study, the main propulsion system will be coupled to additional propulsion chains including a hybrid-electric powertrain (partial turbo-electric architecture) for the aforementioned cases. The main engine locations aresimilar to those reported in [26]: conventional wing-mounted propellers (WMP), horizontal-tail-mounted propellers(HTMP) as studied by [21, 22] and fuselage-mounted ducted propellers (FMDP) as studied by [23]. The modelingof the propulsive empennage of the FDMP configuration is reported by Vos and Hoogreef [26]. Stabilizer mountedpropellers have also been studied in the Clean Sky 2 project IRON†.
†IRON - Innovative turbopROp configuratioN, Clean Sky 2, IADP Regional, topic: JTI-CS2-CPW02-REG-01-03
4
Dow
nloa
ded
by T
U D
EL
FT o
n Ja
nuar
y 6,
202
0 | h
ttp://
arc.
aiaa
.org
| D
OI:
10.
2514
/6.2
020-
0503

B. Mass estimations of components related to hybrid-electric powertrainsThis Section explains how the additional components present in a hybrid-electric powertrain are included in the com-ponent weight estimation methods.
Electromotors, generators, inverters, power electronics and coolingThe mass estimation of all components of the electrical drivetrain (electromotors, generators, inverters and powerelectronics) follows the approach of a “combined specific power” based on the specific power (SP) of each componentas presented in de Vries et al. [28]. Here a distinction between motors and generators is made in the mass estimation,and an “equivalent specific power” which combines the electrical machine and associated transformer is used:
ESP ≈𝑛∑𝑖=1
1(1/SP𝑖)
. (3)
This provides a “black box” approach, suitable for conceptual sizing that provides a simplified, top-level understandingof the effects of powertrain technology levels, that is independent of the particular design of the electrical system, asit does not require information regarding every component in the powertrain. Table 1 presents the ESP computedfor the three hypothetical technology scenarios. The electrical drivetrain is assumed to consist of electrical machines(generators and motors) and power converters (rectifiers and inverters). An additional 30% mass penalty is added toaccount for additional power distribution and cooling aspects.
Table 1 ESP for three hypothetical technology scenarios from [28].
Scenario Electrical machines Power converters PMAD/coolingSP [kW/kg] SP [kW/kg] weight penalty ESP [kW/kg]
Near-term 9 13 30% → 3.7Mid-term 13 19 30% → 5.4Long-term 22 32 30% → 9.1
The shaft power ratio is used to characterize the power share between the primary and secondary propulsion system:
𝜑 =𝑃s2
𝑃s1 + 𝑃s2. (4)
For the design studies, this share will be varied to study the effects on aircraft level of subtracting more or less powerfrom the turbomachinery, which is used by the distributed electric propulsors. While the aero-propulsive benefit mayincrease for larger power shares (larger secondary propulsors), their mass penalty will also increase. Therefore, a sweepshould indicate when the mass increase becomes the dominating effect.
CablesTo estimate the mass of additional electrical cables required to transmit power between motors and generators, a veryrudimentary estimation is made for the distance between all electromotors (on one side of the aircraft) and a generatoron the same side of the aircraft. The generator itself is always assumed to be located at the turbine. The distancebetween the components (i.e. required cable length) is estimated as the sum of the difference between respective x, yand z coordinates:
𝑙cable = Σ(|𝑥generator − 𝑥motor | + |𝑦generator − 𝑦motor | + |𝑧generator − 𝑧motor |) (5)
This cable length is then summed for all motors on one side and multiplied by two to get the total mass. Every cableis assumed to consist of three wires; hence the total length is multiplied by three. For the BLI fan, it is assumed that acable runs to both generators. This cable length is split between a component inside the wing and a component insidethe fuselage, to be properly accounted as a distributed mass (both for CG and FEM weight estimation). Redundancy isincluded through a safety factor of two.
The average power over a cable is used to determine the current assuming a 3kV system. The area of copperrequired is then estimated according to the formula by Stückl [38]:
𝐴copper = 0.0144 · 𝐼1.4642 (6)
5
Dow
nloa
ded
by T
U D
EL
FT o
n Ja
nuar
y 6,
202
0 | h
ttp://
arc.
aiaa
.org
| D
OI:
10.
2514
/6.2
020-
0503

To estimate the mass of these electric cables, a regression is made between data available from the reinforced sheathedhigh temperature, extra flexible power cables FLAMEX SI EN 50382-2 Type FXZăfrom Nexans‡. For differentcross-sectional areas and a maximum temperature in use of 150deg Celsius, the following data is available:
Table 2 Cable data for FLAMEX SI EN 50382-2 Type FXZ
Area (𝑚𝑚2) Mass (𝑘𝑔/𝑘𝑚)25 37135 43850 57970 93595 980120 1480150 1505185 2240
Based on the information from Table 2 a linear regression (with an R2 of 0.96) can be made, resulting in thefollowing expression for cable mass per kilometer as a function of cross-sectional area in squared millimeter:
𝑚𝑐𝑎𝑏𝑙𝑒 [𝑘𝑔/𝑘𝑚] = 58.196 + 11.044 · 𝐴𝑐𝑎𝑏𝑙𝑒 [𝑚𝑚2] (7)
III. Aero-propulsive modeling for conceptual aircraft designThe use of novel propulsion systems affects both the aerodynamic performance and the weight estimation of
hybrid-electric aircraft. For the preliminary sizing process, the changes in lift, drag, and propulsive efficiency due toaero-propulsive interaction must be estimated and incorporated in the point performance equations of the aircraft, asdiscussed in the previous section. This section describes how the aero-propulsive effects were computed for conventionaltractor propellers, leading-edge distributed propellers, tip-mounted propellers, and boundary-layer-ingesting propellers.
A. Wing-Mounted tractor propellers (conventional, distributed, tip-mounted)Interactions between tractor-mounted propellers and a wing occur on aircraft with a conventional turboprop layout,
but also on configurations with distributed leading-edge propellers for high-lift augmentation, or tip-mounted propellersfor induced-drag reduction. The downstream interaction between such tractor propellers and the wing was modeledusing a lifting-line model (LLM). In this LLM, the propellers are represented by actuator disks. Realistic disk loadingdistributions are obtained by scaling a normalized blade loading distribution (thrust and tangential force) from areference propeller with the known thrust level of the propellers in the present study. The thrust and tangential-forcedistributions are then used to compute both axial and tangential induced velocities at the position of the lifting line usingclassic momentum theory. In this process, a slipstream contraction model is used to account for the axial separationbetween the propeller plane and the wing leading-edge.
The propeller-induced velocities are included as additional induced velocities at the lifting line, thus modifying thewing’s circulation distribution. Because of the finite propeller slipstream height, a correction needs to be applied tothe local section lift coefficients. For this purpose, the model by Ting [39, 40] was used. The implementation of thiscorrection into the lifting line approach will be explained in more detail in a future publication. With the known sectionlift distributions and induced angles of attack, the wing lift and induced drag can be computed directly. The slipstreaminteraction generally increases lift (due to increased dynamic pressure and swirl in the slipstream), and decreasesinduced drag (due to a swirl-induced forward tilting of the lift vector) in case of inboard-up rotating propellers [16].Besides modifying lift and induced drag, the propeller slipstream interaction also affects the skin-friction drag of thedownstream wing. This was accounted for using an approximate method. The skin-friction coefficient was computedassuming a flat-plate turbulent boundary layer. This coefficient was then converted into a skin-friction drag coefficientusing a form factor proposed by Torenbeek [41].
‡https://www.nexans.nl/eservice/Netherlands-nl_NL/navigate_346195/FLAMEX_SI_EN_50382_2_Type_FXZ_3_6_6kV.html
6
Dow
nloa
ded
by T
U D
EL
FT o
n Ja
nuar
y 6,
202
0 | h
ttp://
arc.
aiaa
.org
| D
OI:
10.
2514
/6.2
020-
0503

The lifting-line model was used to compute the impact of a main propeller and distributed propellers on the winglift and drag coefficients. The upstream effect of the wing on the propellers was ignored. Figure 3 provides a sketch ofthe considered propeller-wing layout, including an overview of some of the most relevant parameters.
0.0 0.1 0.2 0.3 0.4 0.5
Spanwise coordinate y / b
−0.10
−0.05
0.00
0.05
0.10
Ver
tica
l co
ord
inat
e z
/ b
1 main propeller N distributed propellers
Fuse-
lage
R /bfus D /bmain
dy /bfus dy /btipdy /Ddistr
y /bdistr
Jmain
TCmain
Jdistr
TCdistr
Fig. 3 Sketch of layout used in lifting-line analysis of wing-mounted tractor propellers.
Ten variables were used in the analyses. These variables are gathered in Table 3, together with the minimum andmaximum values evaluated. In this table, 𝑦free is the wingspan available for distributed propellers, taking into accountthe presence of the fuselage and main propeller, as well as clearances. The diameter of the distributed propellers followsfrom the selection of number of propellers, propeller-propeller spacing, and overall span of distributed propellers.Besides the selected design variables, a series of geometrical parameters were kept constant throughout the model inorder to limit the number of dimensions. These parameters are shown in Table 4.
Table 3 Design variables evaluated in the lifting-line model.
Variable Min MaxWing angle of attack, 𝛼 [deg] -5 30Wing aspect ratio, AR 8 16Diameter-to-span ratio of main propulsor, 𝐷main/𝑏 0 0.2Thrust coefficient of main propulsor, 𝑇𝐶main 0 1Advance ratio of main propulsor, 𝐽main 0.25 2.5Number of distributed propulsor(s) per semi-wing, 𝑁distr 0 10Thrust coefficient of distributed propulsor(s), 𝑇𝐶distr 0 1Advance ratio of distributed propulsor(s), 𝐽distr 0.25 2.5Fraction of available span used for distributed propulsor(s), 𝑦distr/𝑦free 0 1Tip-offset of most outboard distributed propulsor, 𝑑𝑦tip/𝑦free 0 0.5
Before starting the aircraft design process, the overall lift and drag coefficients of the wing with propellers werecomputed for a wide range of configurations. Since the number of distributed propellers 𝑁distr is a discrete variable, aLatin-hypercube sampling of 33,000 points was created for the remaining nine design variables, for each of the elevenpossible 𝑁distr values (see Table 3). The lifting-line model was applied for each sampling point, and the results from thedifferent function evaluations were compared to the equivalent propeller-off solution, thus providing the lift and dragdeltas (Δ𝐶𝐿 and Δ𝐶𝐷) due to aero-propulsive interaction. To decrease runtime and ensure smooth results, a surrogatemodel was created based on these data points for both Δ𝐶𝐿 and Δ𝐶𝐷 for each number of distributed propellers.Each surrogate model consists of a nine-dimensional, fourth-order polynomial fit, obtained using a linear-least-squaresalgorithm. In the fitting process, 95% (31,350) of the points were used to construct the model, and the remainingrandomly selected 5% (1,650) was used to evaluate the quality of the fit. The mean deviation of the fit over the 1,650test points was found to be below 0.05% in all cases, although a maximum deviation in the order of 20% was foundin some cases. However, such large deviations were only observed for outlying data points, and thus it was concludedthat the fit was accurate for realistic combinations of input variables.
7
Dow
nloa
ded
by T
U D
EL
FT o
n Ja
nuar
y 6,
202
0 | h
ttp://
arc.
aiaa
.org
| D
OI:
10.
2514
/6.2
020-
0503

Table 4 Design parameters that were kept constant in the lifting-line model.
Parameter ValueWing sweep angle, Λ [deg] 0Wing taper ratio, 𝜆 1Fuselage diameter with respect to wing span, 𝑅fus/𝑏 0.05Spacing between fuselage edge and tip of main propeller, d𝑦fus/𝑏 0.025Lateral spacing between propellers, d𝑦distr/𝐷 0.05Axial separation between propeller plane(s) and wing leading-edge, d𝑥/𝐷 0.5Vertical offset of propellers with respect to wing chord, d𝑧/𝐷 0Propeller incidence angle, 𝛼props [deg] 0
B. Boundary-layer ingestionThere are multiple ways to analyze the aerodynamic interaction that occurs between a boundary-layer-ingesting
propulsor and an upstream body [42]. However, to evaluate the impact of boundary-layer ingestion (BLI) in thepreliminary sizing phase, highly simplified approaches are required, which model the impact on aircraft performancein terms of parameters such as the aircraft drag coefficient, or the propulsive efficiency of the propeller or fan [27].While several expressions have been derived which estimate the effect of BLI on “propulsive efficiency” [43, 44], theseapproaches are not formulated in terms of typical Class-I aircraft design parameters, and present no explicit formulationfor the impact of the propeller on fuselage drag. Therefore, a simplified approach is taken which considers an actuatordisk located at the end of an axisymmetric body, as depicted in Figure 4. Although the method will be described moreexhaustively in future publications, a brief overview is provided in the following paragraphs.
−3.0 −1.5 0 1.5Axial coordinate x/Dfus [-]
Geo
met
rirca
lde
scrip
tion
Influ
ence
of
actu
ator
dis
k Δv
Δp
L1 L2 L3
δ99
uedgeActuator disk of diameter Dp
Dfus D2
Fig. 4 Sketch of the simplified model used to estimate the impact of a fuselage-mounted boundary-layer-ingesting propeller.
In this approach, the effect of the propeller on the fuselage and vice versa are evaluated independently, and noiterative dependencies are considered. Since the problem is assumed to be axisymmetric, the influence of the wing,empennage, or tail-cone upsweep are not considered. Moreover, the flow on the fuselage is assumed to be attached. Thefuselage geometry is simplified and discretized into three sections: the “main” tail-cone of the fuselage, of length 𝐿1,a cylindrical segment of length 𝐿2 and diameter 𝐷2—at the end of which the propeller of diameter 𝐷p is located—anda final conical section of length 𝐿3, which represents the spinner behind the propeller. The dimensions, shown in thetop half of Figure 4, must be chosen by the designer and expressed as a fraction of the fuselage diameter 𝐷fus, since inthe conceptual design process the actual dimensions of the aircraft are unknown.
8
Dow
nloa
ded
by T
U D
EL
FT o
n Ja
nuar
y 6,
202
0 | h
ttp://
arc.
aiaa
.org
| D
OI:
10.
2514
/6.2
020-
0503

The effect of BLI on propeller performance is estimated by introducing the concept of an isolated (i.e., uninstalled)equivalent freestream actuator, operating at a uniform inflow velocity 𝑉eq and freestream static pressure 𝑝∞. Theequivalent velocity 𝑉eq is computed taking into account two contributions: the average inflow velocity at the locationof the (installed) actuator disk, and the average static pressure at that same location. The first is computed by assuminga boundary-layer velocity profile 𝑉 (𝑟)/𝑉edge = 𝑓 (𝑟/𝛿99) and taking the mean over the propeller disk by integratingthis profile over cylindrical coordinates. The second, determined by the pressure coefficient at the end of the fuselage,is translated into an effective velocity increase at the actuator disk by assuming that the increased static pressure atthe upstream end of the actuator’s stream tube is isentropically expanded to ambient pressure. The edge velocity ofthe boundary layer 𝑉edge, the boundary layer thickness 𝛿99, and the pressure coefficient at the fuselage trailing edge(which is directly related to the edge velocity), are estimated using the data presented in Refs. [45, 46] The boundarylayer profile is based on experimental data obtained by Della Corte in the CENTRELINE§ research project (see e.g.Ref. [47]), using the experimental setup used by Lv et al. [25] The propulsive efficiency of the equivalent freestreamactuator is then compared to an actuator disk producing the same thrust in ambient conditions (𝑉∞, 𝑝∞) to computethe effective change in propulsive efficiency due to BLI, Δ𝜂p.
Finally, the effect of the propeller on fuselage drag is estimated taking into account two contributions. The firstis the change in pressure drag on the fuselage tail-cone due to the propeller-induced static pressure field. The secondis the change in friction drag due to the increased shear in the boundary layer near the fuselage surface, as a result ofthe propeller-induced velocity increase. It is assumed that the propeller—which is uniformly loaded—does not affectthe shape or thickness of the boundary layer, but simply scales the velocities near the surface as if the edge velocitywere scaled with a factor (𝑉edge + Δ𝑉)/𝑉edge. Therefore, the change in pressure drag due to a reduced boundary-layerthickness, or the change in friction drag due to a change in the boundary-layer profile, are not considered. The changesin velocity (Δ𝑉) and static pressure (Δ 𝑝) upstream of the propeller are notionally indicated in the bottom half ofFigure 4, and are estimated using actuator-disk theory. These variations are then integrated over the tail-cone surfaceto obtain the total change in drag. This drag increase is then included as a change in zero-lift drag coefficient, Δ𝐶𝐷0,in the aircraft design process.
IV. Reference aircraft and case study definitionsAs reference configurations, conventional tube and wing aircraft with wing-mounted propellers were designed
using the Initiator. Validation studies of the design software have been performed for both an ATR-72 and Fokker50, as presented by Schouten et al. [48]. These designs are repeated for the current design exercise, given the slightlydifferent sizing process.
A. Comparison to reference dataThe resulting performance, dimensions and weights are compared to values found in open literature, with the aim
to demonstrate that the aircraft design process results in conceptual aircraft designs that are relatively close to existingaircraft. The top-level aircraft requirements (TLARs) for these designs have been derived from publicly availabledata¶‖∗∗ and are summarized in Table 5.Figure 5 presents the geometry of converged aircraft produced by the Initiator for the TLARS in Table 5. A morequantitative comparison on some of the overall vehicle characteristics is presented in Table 6. It can also be seen thatthe maximum take-off mass (MTOM) of both aircraft is within 5% of the reference values.The difference in OEM for the ATR is related to the large over-estimation of maximum power in one-engine-inoperative(OEI) conditions; the OEM difference in the case of the F50 is related to a combination of slightly overestimated enginesize as well as underestimated wing area. The simplified engine model also leads to an underestimation of the missionfuel. The differences are within the range of variations typically seen for conceptual aircraft design, but should benoted when comparing results of various configurations between each other.
§CENTRELINE - ConcEpt validatioN sTudy foR fusElage wakefilLIng propulsioN integration, EU Horizon 2020 project Grant Agreement No.723242
¶https://janes.ihs.com/JAWADevelopmentProduction‖www.flyfokker.com
∗∗www.atraircraft.com
9
Dow
nloa
ded
by T
U D
EL
FT o
n Ja
nuar
y 6,
202
0 | h
ttp://
arc.
aiaa
.org
| D
OI:
10.
2514
/6.2
020-
0503

Table 5 TLARs for reference aircraft. Data from Jane’s and Fokker/ATR documentation.
Spec. Unit ATR-72 (alternative mission) F-50 (alternative mission)Harmonic range km 926 (1530) 1089 (1675)Structural payload kg 7500 (6650) 5500 (4850)Passengers - 70 50Cruise altitude m 7000 7620Cruise Mach - 0.41 0.46Take-off distance m 1333 1095Approach speed m/s 58.1 51.4
(a) ATR 72-600(I) (b) Fokker 50(I)
Fig. 5 Isometric view of aircraft designs produced by the Initiator.
Table 6 Comparison of Initiator results to published data of the ATR 72-600 and Fokker 50. Data from Jane’s,ATR and Fokker.
ATR 72-600 Fokker 50unit Reference Initiator Difference Reference Initiator Difference
MTOM t 22.8 22.9 0.5% 19.9 18.9 -5.0%OEM t 13.3 14.1 6.0% 12.5 12.4 -1.0%Total 𝑃max kW 4100 4597 12.1% 3720 3813 2.5%𝑊max/𝑃max N/kW 54.6 48.6 -11% 51.2 48.7 -4.9%𝑊/𝑆w N/m2 3670 3690 4.3% 2795 2995 7.2%𝑆w m2 61 60.5 -1.0% 70 62 -11.4%𝑏w m 27 27 0.0% 29 27.3 -5.8%𝑙f m 27.2 28.8 5.9% 25 23 -8.0%𝑑f m 2.9 2.8 -3.4% 2.7 2.8 3.7%𝑑p m 3.9 4.1 5.1% 3.7 3.9 5.4%
B. Top-Level Aircraft Requirements for DHEP studyA set of top-level aircraft requirements (TLARs) has been defined for LPA WP1.6.1.4. These TLARs are roughlybased on an Airbus A320, with some modifications in terms of range, cruise speed and altitude, based on the findingsof Refs.[13, 28] These requirements are listed in Table 7.To cover a broader area in the design space, the design studies presented in this article cover harmonic ranges of both1100nmi and 2000nmi and a variety of cruise Mach numbers, ranging from 0.6 down to 0.5. All aircraft are assessed fordifferent (10 to 30%) shaft power ratios (𝜑) and “technology scenarios” (low, medium, high) for powertrain componentsas presented in Table 8.
10
Dow
nloa
ded
by T
U D
EL
FT o
n Ja
nuar
y 6,
202
0 | h
ttp://
arc.
aiaa
.org
| D
OI:
10.
2514
/6.2
020-
0503

Table 7 Top-level aircraft requirements for hybrid electric aircraft as defined in LPA WP1.6.1.4.
Parameter Unit Required Value ConditionHarmonic range nmi 1100Maximum payload kg 20000DOC mission nmi 800DOC payload kg 15000Diversion range nmi 250 𝑀 = 0.45; ℎ = FL150(Initial) Cruise Mach number - 0.6Initial Cruise Altitude (ICA) ft 25000 after T/O @ MTOM, ISA+10◦
Time-to-climb from 1500 ft. to ICA (TT) min 35 after T/O @ MTOM, ISA+10◦
Take-off Field Length (TOFL) m 2200 @ SL, ISA+15◦
Approach speed (landing) KCAS 138Wing span limit m 52One-engine-out (OEI) net ceiling ft 15000Loiter time min 30MLM (% MTOM) - 100BC/YC - 12/138Service life/cycles - 100,000
Table 8 Hypothetical technology scenarios for powertrain components, with constant transmission efficiencies.
Scenario Electrical machines Gas turbinesESP [kW/kg] SP [kW/kg]
Low 3.7 3.5Med 5.4 7.0High 9.1 10.5
C. Reference aircraftBased on the TLARs presented in Table 7, three reference configurations are generated using the Initiator design
process. These aircraft (for the low technology scenario) are shown in Figure 6 and represent the three propulsionsystem layouts without distributed electric propulsion. The WMP, HTMP and FMDP configurations are in line withthose presented by Vos and Hoogreef [26]. They are used here to identify what benefits DHEP can bring to moreunconventional aircraft concepts and to verify whether a benefit/penalty of any secondary propulsion system is actuallyrelated to the layout of the primary propulsion system. All these reference aircraft will be shown in the analysis ofresults, where they will be designed according to the same technology levels as those with DHEP.
(a) WMP reference aircraft (b) HTMP reference aircraft (c) FMDP reference aircraft
Fig. 6 Isometric views of three reference aircraft designs produced by the Initiator.
11
Dow
nloa
ded
by T
U D
EL
FT o
n Ja
nuar
y 6,
202
0 | h
ttp://
arc.
aiaa
.org
| D
OI:
10.
2514
/6.2
020-
0503

An overview of some quantitative vehicle characteristics of the aircraft shown in Figure 6 is presented in Table 9,where it is immediately clear that the WMP outperforms the other two aircraft. These results are in line with thosefound in [26], although the TLARs are slightly different and a stability/controllability assessment is not included inthe current design process. Still, the aft-located CG of HTMP and FMDP concepts has a significant influence on theoverall aerodynamic performance of the aircraft (due to trimming) and overall weight. The higher wing loading of theWMP can be attributed to the use of the lifting line model for the (beneficial) aero-propulsive interaction of the twomain, wing-mounted, propellers.
Table 9 Initiator results for the WMP, HTMP and FMDP reference aircraft without distributed electricpropulsion, with conventional powertrain and low technology scenario gas turbine performance, includingaero-propulsive effects of wing-mounted main engines.
Unit WMP HTMP FDMPMTOM t 58.9 65.5 69.2OEM t 33.5 39.1 42.9Total 𝑃max MW 13.9 16.5 17.1𝑊max/𝑃max N/kW 41.5 38.9 39.8𝑊/𝑆w N/m2 5857 5510 5510𝑆w m2 98.7 116.6 123.1𝑏w m 34.4 37.4 38.4𝑙f m 37.7 37.7 37.7𝑑f m 3.9 3.9 3.9𝑑p m 4.3 4.8 5.0
D. Aircraft configurations with distributed propulsionAll envisioned aircraft configurations shown in Figure 6 are combined with a secondary set of propulsors, in
addition to a primary propulsive device with the aim of leveraging beneficial aero-propulsive interaction effects. Allthese configurations use a partial turbo-electric architecture (i.e. without batteries), have a constant span fractionfor DHEP (per type of secondary propulsors), constant shaft power ratio over all mission phases and a constrainedhelicoidal tip Mach number for the propellers. Figures 7, 8 and 9 illustrate all the different layouts that have beenevaluated: tip-mounted propellers, eight and ten LE distributed propellers (covering the same span fraction) and a BLIfan for the WMP case (as it is not considered effective for the other primary propulsion chain layouts due to the locationof the engines).
V. Analysis of resultsOver 600 Initiator design convergence studies were performed, for different cruise Mach numbers and harmonic
ranges. For the baseline requirements, some additional studies were made for larger tip-mounted propellers, even bettertechnologies for the electrical machines and even lower shaft power ratio (5%) to confirm some of the convergencebehavior. It should be noted that not all combinations yielded feasible results due to limitations of the range of thesurrogate models used for the aero-propulsive interactions (lower Mach numbers were tested, but did not provide feasibleresults) and due to the fact that the configurations are not optimized. Therefore, the results should be treated carefullyand should be used to set a directive for future studies on aircraft system level (more optimal aircraft setup/TLAR forDHEP), necessary high-fidelity detail studies (to enrich the surrogate models) and necessary inclusions of additional(inter-)disciplinary effects. It is important to remember that the configurations as such are a direct consequence of theselected DHEP technology (BLI, LE distributed or tip-mounted propulsion) and the resulting concepts are feasible,but not optimal, designs. Thus, conclusions can be made on interesting application areas of technology, rather than onresulting aircraft concepts.
At aircraft level, two output parameters are of primary interest: maximum take-off mass (MTOM) and payload-range energy efficiency (PREE) [13, 49]. The latter is used as figure-of-merit, representing the overall energy efficiencyof the aircraft in transporting payload over a certain range. It can be written in non-dimensional form and is inversely
12
Dow
nloa
ded
by T
U D
EL
FT o
n Ja
nuar
y 6,
202
0 | h
ttp://
arc.
aiaa
.org
| D
OI:
10.
2514
/6.2
020-
0503

proportional to the amount of energy consumed for a given mission segment (in this case only the harmonic missionexcluding reserves):
PREE =𝑊PL𝑅
𝐸miss. (8)
(a) WMP with tip-mounted propellers (b) WMP with 8 LE-mounted propellers
(c) WMP with 10 LE-mounted propellers (d) WMP with wake-ingesting (BLI) fan
Fig. 7 Isometric views of WMP aircraft with different forms of partial turbo-electric distributed propulsionas produced by the Initiator. Note that only landing gear position (not length) is shown.
(a) HTMP with tip-mounted propellers (b) HTMP with 8 LE-mounted propellers (c) HTMP with 10 LE-mounted propellers
Fig. 8 Isometric views of HTMP aircraft with different forms of partial turbo-electric distributed propulsionas produced by the Initiator. Note that only landing gear position (not length) is shown.
(a) FMDP with tip-mounted propellers (b) FMDP with 8 LE-mounted propellers (c) FMDP with 10 LE-mounted propellers
Fig. 9 Isometric views of FMDP aircraft with different forms of partial turbo-electric distributed propulsionas produced by the Initiator. Note that only landing gear position (not length) is shown.
13
Dow
nloa
ded
by T
U D
EL
FT o
n Ja
nuar
y 6,
202
0 | h
ttp://
arc.
aiaa
.org
| D
OI:
10.
2514
/6.2
020-
0503

A. Effect of shaft power ratio and technology scenarioThe baseline mission according to the TLARs of Table 7 specifies a harmonic range of 1100nmi and a cruise Mach
number of 0.6. For this mission, 99 different aircraft were synthesized for different technology scenarios and differentshaft power ratios (𝜑). The results are presented in Figure 10 according to their PREE and MTOM, where different𝜑-values are represented by a different color shade. The reference aircraft have always been evaluated for the sametechnology level as the DHEP configurations.
50 55 60 65 70 75 80
MTOM [t]
0.8
1
1.2
1.4
1.6
1.8
2
PR
EE
[-]
FMDP HTMP WMPBLI
LE10LE8RefTip
Fig. 10 Overview of PREE vs MTOM for 10-30% 𝜑 and technology scenarios for R = 1100nmi and M = 0.6.Lighter color shades indicate lower 𝜑.
Figure 10 shows a large spread in both PREE and MTOM, with in general the same trends for MTOM as wascalculated for the reference aircraft. It is immediately obvious that the lower shaft power ratios show better results,with both higher PREE and lower MTOM. The BLI aircraft seem to be able to achieve a slightly higher PREE, at thecost of a slight increase in MTOM (due to the additional powertrain components). The other DHEP technologies seemto approach a PREE close to that of their respective reference, yet also at higher MTOMs. It is important to note thatthere is significant room for improving the setup of the DHEP configurations that were tested as well as their operatingaltitude. As shown in [13], this can have a significant impact on the results.
The large difference between eight and ten leading-edge distributed propellers is unexpected. Although it isexpected that more smaller propellers perform worse than fewer larger ones for the same wingspan covered, this largedifference was not expected. As will be shown later, aircraft with ten distributed propellers have significantly higherpowertrain masses. In addition, their operating point is far from optimal, leading to high advance ratios and lowaero-propulsive benefits..
The BLI configuration seems to perform particularly well, though only at very low shaft-power ratios. This benefitconfirms the potential of BLI, and thus additional higher-fidelity studies of this configuration are required.
To better illustrate the separate effects of technology scenario and 𝜑, Figure 11 and Figure 12 present the resultingPREE and MTOM for a sweep of technology scenarios and a sweep of shaft power ratios, respectively. It can be seenfrom these figures that the influence of technology scenario is mostly on MTOM (in fact, powertrain mass) of theaircraft, which to a lesser extent influences PREE. The shaft power ratio has a significant effect on both PREE andMTOM, showing that beyond 20% shaft power ratio, PREE decreases and MTOM increases much more than between10% and 20%. The higher shaft power ratio has of course a large effect on powertrain mass, which incurs a cycliceffect on MTOM. However, as will be shown in sub-Section V.C, there is also a decrease in aero-propulsive efficiency.
The low performance of the tip-mounted propulsion system was not expected and further investigations showedthat at the high cruise Mach number of 0.6, the advance ratio of the tip-mounted system was constrained by the tipMach number. For the selected reference blade loading distribution, this resulted in high advance ratios and low thrustcoefficients, which led to a small (friction) drag penalty.
14
Dow
nloa
ded
by T
U D
EL
FT o
n Ja
nuar
y 6,
202
0 | h
ttp://
arc.
aiaa
.org
| D
OI:
10.
2514
/6.2
020-
0503

50 55 60 65 70 75 80
MTOM [t]
0.8
1
1.2
1.4
1.6
1.8
2
PR
EE
[-]
FMDP HTMP WMPBLI
LE10LE8RefTip
Fig. 11 Overview of PREE vs MTOM for 10% 𝜑 and variable technology scenarios for R = 1100nmi and M =0.6. Lighter color shades indicate lower technology scenarios.
50 55 60 65 70 75 80
MTOM [t]
0.8
1
1.2
1.4
1.6
1.8
2
PR
EE
[-]
FMDP HTMP WMPBLI
LE10LE8RefTip
Fig. 12 Overview of PREE vs MTOM for 10-30% 𝜑 and high technology scenario for R = 1100nmi and M =0.6. Lighter color shades indicate lower 𝜑.
Similar to the shaft power ratio, the difference between higher and lower technology scenarios is larger between lowand medium than medium and high, even though the step in improved component specific power is smaller! Figures 13and 14 show the results of additional investigations into the effects of even larger specific powers (technology scenario)and an even lower shaft power ratio.
From Figure 13 it is clear that, obviously, the improved technology has more effect on larger shaft power ratios.However, similar to the trends in Figure 11, an extreme improvement on the specific power of the powertrain componentsdoes not yield an as-extreme improvement on aircraft level. This can be explained by the fact that the fraction of thepowertrain mass of the OEM becomes smaller with improving powertrain technology. Therefore, a further improvementhas even less of an impact with respect to the other parts that make up the OEM (and MTOM). As such, the medium
15
Dow
nloa
ded
by T
U D
EL
FT o
n Ja
nuar
y 6,
202
0 | h
ttp://
arc.
aiaa
.org
| D
OI:
10.
2514
/6.2
020-
0503

technology scenario of Table 8 appears to yield results that should be obtainable in the near future, though ideallycombined with a low 𝜑.
50 55 60 65 70 75 80
MTOM [t]
0.8
1
1.2
1.4
1.6
1.8
2
PR
EE
[-]
FMDP HTMP WMPBLI
LE10LE8RefTip
Fig. 13 Overview of PREE vs MTOM for 10-30% 𝜑 and extra high (12.4 kW/kg) electromotor technology forR = 1100nmi and M = 0.6. Lighter color shades indicate lower 𝜑.
An even lower shaft power ratio, as shown in Figure 14, shows a (very) small improvement for the two aircraftlayouts with aft-mounted main propulsors. However, importantly, for the more conventional layout with wing-mountedmain propulsors, little to no benefit is achieved. Likely, this is caused by the fact that the secondary propulsors are sosmall that they do impose a mass penalty yet yield no aero-propulsive benefit.
50 55 60 65 70 75 80
MTOM [t]
0.8
1
1.2
1.4
1.6
1.8
2
PR
EE
[-]
FMDP HTMP WMPBLI
LE10LE8RefTip
Fig. 14 Overview of PREE vs MTOM for 5 and 10% 𝜑 and high technology scenario for R = 1100nmi and M= 0.6. Lighter color shades indicate lower 𝜑.
16
Dow
nloa
ded
by T
U D
EL
FT o
n Ja
nuar
y 6,
202
0 | h
ttp://
arc.
aiaa
.org
| D
OI:
10.
2514
/6.2
020-
0503

B. Effect of altitude and rangeFigure 15 presents the results for the same aircraft configurations designed for varying harmonic range (1100 and
2000 nmi) and varying cruise Mach number (0.5 and 0.6). The results shown here are limited to the high technologyscenario and 𝜑 = 10%. It must be noted that for the long-range case at low speed, the FMDP aircraft showed convergenceissues. The results show that in general a longer range leads to a higher PREE, especially for those aircraft with asecondary powertrain as the beneficial aero-propulsive effects can act over a longer duration, to overcome the increasedmass due to the secondary propulsion system. Similarly, at lower speeds all aircraft are more efficient thanks to theaero-propulsive interactions (tip speed limited) being more favorable at lower speeds. Particularly the case with ten LEdistributed propellers seems to benefit from the change from Mach 0.6 to Mach 0.5. At the high range case for Mach0.5, it can be seen that the distributed propulsion systems show the largest improvement.
50 55 60 65 70 75 80
MTOM [t]
1.4
1.6
1.8
2
PR
EE
[-]
FMDP HTMP WMPBLI
LE10LE8RefTip
(a) Mach 0.6, 1100nmi harmonic range
50 55 60 65 70 75 80
MTOM [t]
1.4
1.6
1.8
2
PR
EE
[-]
FMDP HTMP WMPBLI
LE10LE8RefTip
(b) Mach 0.6, 2000nmi harmonic range
50 55 60 65 70 75 80
MTOM [t]
1.4
1.6
1.8
2
PR
EE
[-]
FMDP HTMP WMPBLI
LE10LE8RefTip
(c) Mach 0.5, 1100nmi harmonic range
50 55 60 65 70 75 80
MTOM [t]
1.4
1.6
1.8
2
PR
EE
[-]
HTMP WMPBLILE10
LE8RefTip
(d) Mach 0.5, 2000nmi harmonic range
Fig. 15 Illustration of effects of harmonic range and cruise Mach number on PREE and MTOM for hightechnology scenario and 10% 𝜑.
C. Aero-propulsive efficiencyThe PREE is largely influenced by the aero-propulsive efficiency of the aircraft, which can be expressed as (𝜂p ·L/D),
where 𝜂p is calculated as the weighted average between the two propulsion chains for their respective power share.Figure 16 illustrates the resulting aero-propulsive efficiency for the baseline mission requirements and varying shaftpower ratio. The results show that, except for the tip-mounted cases and concepts with ten LE distributed propellers, theDHEP configurations perform well with respect to the reference aircraft, confirming that they perform better on longerranges. The slightly worse performance of the tip-mounted propellers is again attributed to the high advance ratio, for
17
Dow
nloa
ded
by T
U D
EL
FT o
n Ja
nuar
y 6,
202
0 | h
ttp://
arc.
aiaa
.org
| D
OI:
10.
2514
/6.2
020-
0503
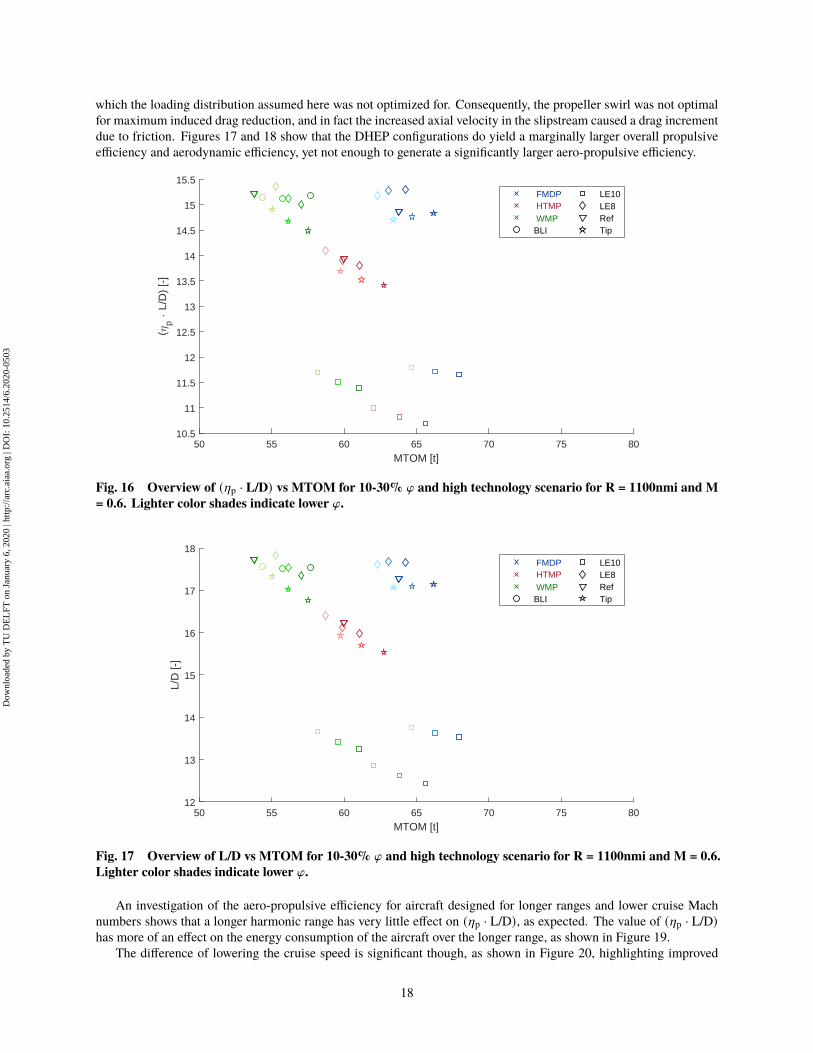
which the loading distribution assumed here was not optimized for. Consequently, the propeller swirl was not optimalfor maximum induced drag reduction, and in fact the increased axial velocity in the slipstream caused a drag incrementdue to friction. Figures 17 and 18 show that the DHEP configurations do yield a marginally larger overall propulsiveefficiency and aerodynamic efficiency, yet not enough to generate a significantly larger aero-propulsive efficiency.
50 55 60 65 70 75 80
MTOM [t]
10.5
11
11.5
12
12.5
13
13.5
14
14.5
15
15.5
(p
L/D
) [-
]
FMDP HTMP WMPBLI
LE10LE8RefTip
Fig. 16 Overview of (𝜂p · L/D) vs MTOM for 10-30% 𝜑 and high technology scenario for R = 1100nmi and M= 0.6. Lighter color shades indicate lower 𝜑.
50 55 60 65 70 75 80
MTOM [t]
12
13
14
15
16
17
18
L/D
[-]
FMDP HTMP WMPBLI
LE10LE8RefTip
Fig. 17 Overview of L/D vs MTOM for 10-30% 𝜑 and high technology scenario for R = 1100nmi and M = 0.6.Lighter color shades indicate lower 𝜑.
An investigation of the aero-propulsive efficiency for aircraft designed for longer ranges and lower cruise Machnumbers shows that a longer harmonic range has very little effect on (𝜂p · L/D), as expected. The value of (𝜂p · L/D)has more of an effect on the energy consumption of the aircraft over the longer range, as shown in Figure 19.
The difference of lowering the cruise speed is significant though, as shown in Figure 20, highlighting improved
18
Dow
nloa
ded
by T
U D
EL
FT o
n Ja
nuar
y 6,
202
0 | h
ttp://
arc.
aiaa
.org
| D
OI:
10.
2514
/6.2
020-
0503

50 55 60 65 70 75 80
MTOM [t]
0.854
0.856
0.858
0.86
0.862
0.864
0.866
0.868
p [-
]
FMDP HTMP WMPBLI
LE10LE8RefTip
Fig. 18 Overview of 𝜂p vs MTOM for 10-30% 𝜑 and high technology scenario for R = 1100nmi and M = 0.6.Lighter color shades indicate lower 𝜑.
50 55 60 65 70 75 80 85 90 95 100
MTOM [t]
11
11.5
12
12.5
13
13.5
14
14.5
15
15.5
16
(p
L/D
) [-
]
FMDP HTMP WMPBLI
LE10LE8RefTip
Fig. 19 Overview of (𝜂p · L/D) vs MTOM for 10-30% 𝜑 and high technology scenario for R = 2000nmi and M= 0.6. Lighter color shades indicate lower 𝜑.
performance for the DHEP configurations. Again, the effect on MTOM of the different shaft power ratios is largelyrelated to the additional powertrain mass.
D. Effect on weight breakdownIn terms of structure, the installation of multiple propellers on the wing can have both a beneficial effect (wing
bending relief) and a negative effect (additional masses amount to additional required structure in unloaded conditions),it is interesting to investigate the effects of DHEP on the wing mass for varying shaft power ratios. Note that the wingmass does not include the distributed propulsion system or cables themselves. In Figure 21, it can be seen that the
19
Dow
nloa
ded
by T
U D
EL
FT o
n Ja
nuar
y 6,
202
0 | h
ttp://
arc.
aiaa
.org
| D
OI:
10.
2514
/6.2
020-
0503

50 55 60 65 70 75 80
MTOM [t]
14
14.5
15
15.5
16
16.5
17
17.5
(p
L/D
) [-
]
FMDP HTMP WMPBLI
LE10LE8RefTip
Fig. 20 Overview of (𝜂p · L/D) vs MTOM for 10-30% 𝜑 and high technology scenario for R = 1100nmi and M= 0.5. Lighter color shades indicate lower 𝜑.
influence of higher shaft power ratios is present on the wing mass, but not dominating. The large difference betweenFMDP and HTMP is due to a combination of wing position an overall MTOM.
3 4 5 6 7 8 9 10
mwing
[t]
10.5
11
11.5
12
12.5
13
13.5
14
14.5
15
15.5
(p
L/D
) [-
]
FMDP HTMP WMPBLI
LE10LE8RefTip
Fig. 21 Overview of (𝜂p · L/D) vs wing mass for 10-30% 𝜑 and high technology scenario for R = 1100nmi andM = 0.6. Lighter color shades indicate lower 𝜑.
In fact, when studying Figure 22, it can be seen that the powertrain mass is significantly more influenced. A furtherinvestigation of the wing mass estimation performed by the FEM wing weight tool inside the Initiator design loopshows that multiple distributed masses lead to lower primary structure masses. However, the mass penalty associatedwith additional pylons and mounting points for multiple propellers leads to a higher overall wing mass. This penaltyis empirical and should be further investigated.
From Figures 21 and 22 it can also be seen that for the BLI configuration, the wing mass increases much more
20
Dow
nloa
ded
by T
U D
EL
FT o
n Ja
nuar
y 6,
202
0 | h
ttp://
arc.
aiaa
.org
| D
OI:
10.
2514
/6.2
020-
0503
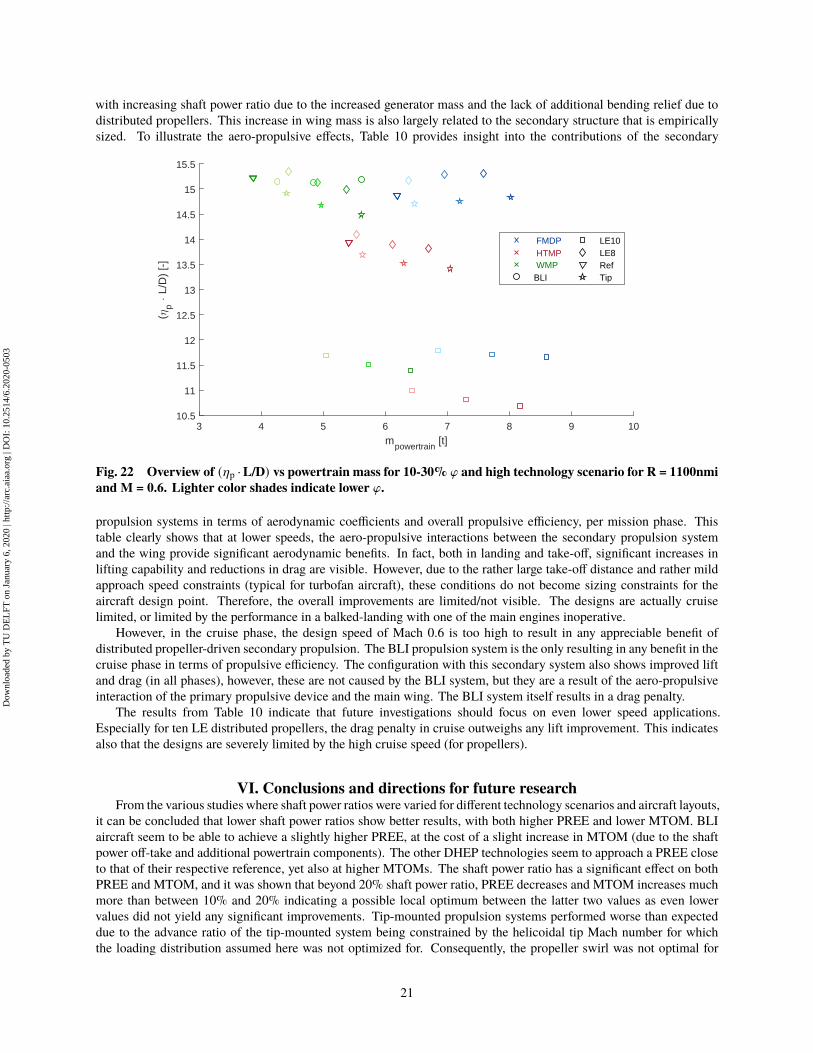
with increasing shaft power ratio due to the increased generator mass and the lack of additional bending relief due todistributed propellers. This increase in wing mass is also largely related to the secondary structure that is empiricallysized. To illustrate the aero-propulsive effects, Table 10 provides insight into the contributions of the secondary
3 4 5 6 7 8 9 10
mpowertrain
[t]
10.5
11
11.5
12
12.5
13
13.5
14
14.5
15
15.5(
p L
/D)
[-]
FMDP HTMP WMPBLI
LE10LE8RefTip
Fig. 22 Overview of (𝜂p ·L/D) vs powertrain mass for 10-30% 𝜑 and high technology scenario for R = 1100nmiand M = 0.6. Lighter color shades indicate lower 𝜑.
propulsion systems in terms of aerodynamic coefficients and overall propulsive efficiency, per mission phase. Thistable clearly shows that at lower speeds, the aero-propulsive interactions between the secondary propulsion systemand the wing provide significant aerodynamic benefits. In fact, both in landing and take-off, significant increases inlifting capability and reductions in drag are visible. However, due to the rather large take-off distance and rather mildapproach speed constraints (typical for turbofan aircraft), these conditions do not become sizing constraints for theaircraft design point. Therefore, the overall improvements are limited/not visible. The designs are actually cruiselimited, or limited by the performance in a balked-landing with one of the main engines inoperative.
However, in the cruise phase, the design speed of Mach 0.6 is too high to result in any appreciable benefit ofdistributed propeller-driven secondary propulsion. The BLI propulsion system is the only resulting in any benefit in thecruise phase in terms of propulsive efficiency. The configuration with this secondary system also shows improved liftand drag (in all phases), however, these are not caused by the BLI system, but they are a result of the aero-propulsiveinteraction of the primary propulsive device and the main wing. The BLI system itself results in a drag penalty.
The results from Table 10 indicate that future investigations should focus on even lower speed applications.Especially for ten LE distributed propellers, the drag penalty in cruise outweighs any lift improvement. This indicatesalso that the designs are severely limited by the high cruise speed (for propellers).
VI. Conclusions and directions for future researchFrom the various studies where shaft power ratios were varied for different technology scenarios and aircraft layouts,
it can be concluded that lower shaft power ratios show better results, with both higher PREE and lower MTOM. BLIaircraft seem to be able to achieve a slightly higher PREE, at the cost of a slight increase in MTOM (due to the shaftpower off-take and additional powertrain components). The other DHEP technologies seem to approach a PREE closeto that of their respective reference, yet also at higher MTOMs. The shaft power ratio has a significant effect on bothPREE and MTOM, and it was shown that beyond 20% shaft power ratio, PREE decreases and MTOM increases muchmore than between 10% and 20% indicating a possible local optimum between the latter two values as even lowervalues did not yield any significant improvements. Tip-mounted propulsion systems performed worse than expecteddue to the advance ratio of the tip-mounted system being constrained by the helicoidal tip Mach number for whichthe loading distribution assumed here was not optimized for. Consequently, the propeller swirl was not optimal for
21
Dow
nloa
ded
by T
U D
EL
FT o
n Ja
nuar
y 6,
202
0 | h
ttp://
arc.
aiaa
.org
| D
OI:
10.
2514
/6.2
020-
0503

Table 10 Initiator results for the WMP with high technology scenario and 10% 𝜑, showing the aero-propulsiveimpact for cruise, take-off and landing phases for aircraft designed for 1100nmi and M0.6. Delta values for liftand drag coefficient with respect to isolated wing case, 𝜂𝑝 computed as weighted average. 1 drag count = 0.0001,1 lift count = 0.01
Phase Parameter Unit WMP + BLI WMP + LE10 WMP + LE8 WMP + TipCruise Δ𝐶𝐷𝑖
counts 0 86 -8 1Δ𝐶𝐿 counts 0.30 0.85 1.1 0.29𝜂𝑝 % 90.3% 85.8% 86.3% 86.1%𝐿/𝐷iso - 17.5 17.3 17.0 17.3𝐿/𝐷 - 17.6 13.7 17.8 17.3
Landing Δ𝐶𝐷𝑖counts -88 -168 -66 -140
Δ𝐶𝐿 counts 16 18 18 19𝜂𝑝 % 74.0% 76.2% 76.0% 75.1%𝐿/𝐷iso - 9.6 9.5 9.5 9.6𝐿/𝐷 - 10.5 10.8 10.4 10.7
Take-off Δ𝐶𝐷𝑖counts -63 -90 -57 -74
Δ𝐶𝐿 counts 11 14 13 14𝜂𝑝 % 75.0% 75.0% 75.0% 73.9%𝐿/𝐷iso - 13.1 13.0 13.0 13.0𝐿/𝐷 - 14.6 15.1 14.6 14.9
maximum induced drag reduction, and in fact the increased axial velocity in the slipstream caused a drag incrementdue to friction. It can be concluded that in general longer ranges lead to a higher PREE, especially for those aircraftwith a secondary powertrain when take-off and landing are not limiting constraints. The beneficial aero-propulsiveeffects can act over a longer duration to overcome their mass penalties. Additionally, DHEP can be beneficial in lowspeed applications in case take-off distance or landing are constraining the design. At the long-range case for Mach 0.5,the distributed propulsion systems show the largest improvement. Overall, the DHEP aircraft (in their unoptimizedform) seem to perform similar as their reference cases. As the references are well understood, their inputs are moreoptimal and, as shown in other works, the cruise altitude has a significant impact on the performance of DHEP aircraft.Therefore, future investigations with relatively low shaft power ratios, and even medium technology scenarios shouldfocus on more optimal layout for DHEP aircraft concepts to target improvements in terms of PREE, at the cost of someMTOM penalty.
More detailed investigations are required into the installation effects of distributed (wing-mounted) propulsion,incorporating both aero-elastic effects as well as the effects of propeller installation angle with respect to the mainwing. At present, this is a limitation of the LLM model that was implemented for these studies, leading to a likelyunderprediction of the increments in lift coefficient due to the distributed leading-edge propellers. The current LLMsurrogate model is conservative, when compared to e.g. the deltas computed in Ref.[27] Additionally, noise aspectsshould be considered in the conceptual aircraft design, which also calls for an investigation of ducted propellers andtheir performance. Duct design can be critical in terms of propeller performance as well as incurred mass penalty.The conceptual design should also include to-be-developed methods for low-speed high-lift conditions of distributed(wing-mounted) propulsion, including their effect on pitching moment. This is also key to allow the necessary inclusionof stability and control assessments (directional, lateral and longitudinal). A further investigation of the wing masspenalty associated with additional pylons and mounting points (secondary structure) is required, as the sizing of thesecomponents is currently based on empirical methods.
AcknowledgmentsThis work was partially funded by the European Union Horizon 2020 program, as part of the Clean Sky 2 program,Large Passenger Aircraft (CS2-LPA-GAM-2018-2019-01). The authors would like to thank all Clean Sky 2 WP1.6.1.4
22
Dow
nloa
ded
by T
U D
EL
FT o
n Ja
nuar
y 6,
202
0 | h
ttp://
arc.
aiaa
.org
| D
OI:
10.
2514
/6.2
020-
0503

partners for their feedback, discussions and technical insight. Furthermore, we would like to thank Nando van Arnhem,Tom Stokkermans, Biagio Della Corte, Martijn van Sluis, Peijian Lv, Tarik Hartuc and Leo Veldhuis (all Delft Universityof Technology) for their contributions to the used aero-propulsive models, as well as Reno Elmendorp and MartijnRoelofs (also Delft University of Technology) for their developments of the Class-II.5 weight estimations.
References[1] Anonymous, “Flightpath 2050: Europe’s Vision for Aviation. Report of the High Level Group on Aviation Research,” , 2011.
[2] Felder, J. L., “NASA electric propulsion system studies,” 2015.
[3] Borer, N. K., Patterson, M. D., Viken, J. K., Moore, M. D., Clarke, S., Redifer, M. E., Christie, R. J., Stoll, A. M.,Dubois, A., Bevirt, J. B., Gibson, A. R., Foster, T. J., and Osterkamp, P. G., “Design and Performance of the NASASCEPTOR Distributed Electric Propulsion Flight Demonstrator,” 16th AIAA Aviation Technology, Integration, and OperationsConference, Washington, DC, USA, American Institute of Aeronautics and Astronautics, American Institute of Aeronauticsand Astronautics, 2016. doi:10.2514/6.2016-3920.
[4] Antcliff, K. R., and Capristan, F. M., “Conceptual Design of the Parallel Electric-Gas Architecture with Synergistic UtilizationScheme (PEGASUS) Concept,” 18th AIAA/ISSMO Multidisciplinary Analysis and Optimization Conference, Denver, Colorado,USA, American Institute of Aeronautics and Astronautics, American Institute of Aeronautics and Astronautics, 2017. doi:10.2514/6.2017-4001.
[5] Rothhaar, P. M., Murphy, P. C., Bacon, B. J., Gregory, I. M., Grauer, J. A., Busan, R. C., and Croom, M. A., “NASAlangley distributed propulsion VTOL tilt-wing aircraft testing, modeling, simulation, control, and flight test development,”Proceedings of the 14th AIAA Aviation Technology, Integration, and Operations Conference, Atlanta, GA, USA, AmericanInstitute of Aeronautics and Astronautics, American Institute of Aeronautics and Astronautics, 2014. doi:10.2514/6.2014-2999.
[6] Schiltgen, B. T., and Freeman, J., “Aeropropulsive interaction and thermal system integration within the ECO-150: aturboelectric distributed propulsion airliner with conventional electric machines,” 16th AIAA Aviation Technology, Integration,and Operations Conference, Washington, DC, USA, American Institute of Aeronautics and Astronautics, 2016. doi:10.2514/6.2016-4064.
[7] Hermetz, J., Ridel, M., and Döll, C., “Distributed electric propulsion for small business aircraft: A concept-plane for key-technologies investigations,” Proceedings of the 30th Congress of the International Council of the Aeronautical Sciences,Daejeon, South Korea, International Council of the Aeronautical Sciences, 2016.
[8] Stoll, A. M., and Mikić, G. V., “Design Studies of Thin-Haul Commuter Aircraft with Distributed Electric Propulsion,” 16thAIAA Aviation Technology, Integration and Operations Conference, Washington, DC, USA, American Institute of Aeronauticsand Astronautics, American Institute of Aeronautics and Astronautics, 2016. doi:10.2514/6.2016-3765.
[9] Jansen, R. H., Bowman, C., Jankovsky, A., Dyson, R., and Felder, J., “Overview of NASA Electrified Aircraft PropulsionResearch for Large Subsonic Transports,” 53rd AIAA/SAE/ASEE Joint Propulsion Conference, Atlanta, GA, USA, AmericanInstitute of Aeronautics and Astronautics, American Institute of Aeronautics and Astronautics, 2017. doi:10.2514/6.2017-4701.
[10] Sgueglia, A., Schmollgruber, P., Bartoli, N., Atinault, O., Benard, E., and Morlier, J., “Exploration and Sizing of a LargePassenger Aircraft with Distributed Ducted Electric Fans,” 2018 AIAA Aerospace Sciences Meeting, American Institute ofAeronautics and Astronautics, 2018. doi:10.2514/6.2018-1745.
[11] Steiner, H. J., Seitz, A., Wieczorek, K., Plötner, K., Iskiveren, A. T., and Hornung, M., “Multi-disciplinary design andfeasibility study of distributed propulsion systems,” Proceedings of the 28th ICAS Congress, Brisbane, Australia, InternationalCouncil of the Aeronautical Sciences, 2012.
[12] Voskuijl, M., van Bogaert, J., and Rao, A. G., “Analysis and design of hybrid electric regional turboprop aircraft,” CEASAeronautical Journal, Vol. 9, No. 1, 2018, pp. 15–25.
[13] de Vries, R., Hoogreef, M. F. M., and Vos, R., “Preliminary Sizing of a Hybrid-Electric Passenger Aircraft Featuring Over-the-Wing Distributed-Propulsion,” AIAA Scitech 2019 Forum, American Institute of Aeronautics and Astronautics, 2019.doi:10.2514/6.2019-1811.
[14] Hoogreef, M. F. M., Vos, R., de Vries, R., and Veldhuis, L. L. M., “Conceptual Assessment of Hybrid Electric Aircraft withDistributed Propulsion and Boosted Turbofans,” AIAA Scitech 2019 Forum, American Institute of Aeronautics and Astronautics,2019. doi:10.2514/6.2019-1807.
23
Dow
nloa
ded
by T
U D
EL
FT o
n Ja
nuar
y 6,
202
0 | h
ttp://
arc.
aiaa
.org
| D
OI:
10.
2514
/6.2
020-
0503

[15] Zamboni, J., Vos, R., Emeneth, M., and Schneegans, A., “A method for the conceptual design of hybrid electric aircraft,” AIAAScitech 2019 Forum, American Institute of Aeronautics and Astronautics, 2019. doi:10.2514/6.2019-1587.
[16] Veldhuis, L. L. M., “Propeller wing aerodynamic interference,” Dissertation, Delft University of Technology, July 2005. ISBN:90-9019537-8.
[17] de Vries, R., Brown, M. T., and Vos, R., “A Preliminary Sizing Method for Hybrid-Electric Aircraft Including Aero-PropulsiveInteraction Effects,” 2018 Aviation Technology, Integration, and Operations Conference, American Institute of Aeronauticsand Astronautics, 2018. doi:10.2514/6.2018-4228.
[18] Marcus, E. A., de Vries, R., Kulkarni, A. R., and Veldhuis, L. L. M., “Aerodynamic Investigation of an Over-the-Wing Propellerfor Distributed Propulsion,” 2018 AIAA Aerospace Sciences Meeting, American Institute of Aeronautics and Astronautics,2018. doi:10.2514/6.2018-2053.
[19] Stokkermans, T. C. A., van Arnhem, N., Sinnige, T., and Veldhuis, L. L. M., “Validation and Comparison of RANS PropellerModeling Methods for Tip-Mounted Applications,” AIAA Journal, Vol. 57, No. 2, 2019, pp. 566–580. doi:10.2514/1.J057398.
[20] Sinnige, T., van Arnhem, N., Stokkermans, T. C. A., Eitelberg, G., and Veldhuis, L. L. M., “Wingtip-Mounted Propellers:Aerodynamic Analysis of Interaction Effects and Comparison with Conventional Layout,” Journal of Aircraft, Vol. 56, No. 1,2018, pp. 295–312. doi:10.2514/1.c034978.
[21] van Arnhem, N., Sinnige, T., Stokkermans, T. C. A., Eitelberg, G., and Veldhuis, L. L. M., “Aerodynamic Interaction Effectsof Tip-Mounted Propellers Installed on the Horizontal Tailplane,” 2018 AIAA Aerospace Sciences Meeting, American Instituteof Aeronautics and Astronautics, 2018. doi:10.2514/6.2018-2052.
[22] van Arnhem, N., Vos, R., and Veldhuis, L. L. M., “Aerodynamic Loads on an Aft-Mounted Propeller Induced by the WingWake,” AIAA Scitech 2019 Forum, American Institute of Aeronautics and Astronautics, 2019. doi:10.2514/6.2019-3036.
[23] Harinarain, V., “Aerodynamic Performance Study on Ducted Propeller System for Propulsion and Control and StabilityApplications,” Master’s thesis, 2017.
[24] Lv, P., Rao, A. G., Ragni, D., and Veldhuis, L. L. M., “Performance Analysis of Wake and Boundary-Layer Ingestion forAircraft Design,” Journal of Aircraft, Vol. 53, No. 5, 2017, pp. 1517–1526. doi:10.2514/1.c033395.
[25] Lv, P., Ragni, D., Hartuc, T., Veldhuis, L. L. M., and Rao, A. G., “Experimental investigation of the flow mechanismsassociated with a wake-ingesting propulsor,” AIAA Journal, Vol. 55, No. 4, 2017, pp. 1332–1342. doi:10.2514/1.j055292.
[26] Vos, R., and Hoogreef, M. F. M., “System-level assessment of tail-mounted propellers for regional aircraft,” Proceedings ofthe 31st Congress of the International Council of Aeronautical Sciences, 2018.
[27] de Vries, R., Brown, M., and Vos, R., “Preliminary Sizing Method for Hybrid-Electric Distributed-Propulsion Aircraft,”Journal of Aircraft, Vol. 56, No. 6, 2019, pp. 1–17. doi:10.2514/1.c035388.
[28] de Vries, R., Hoogreef, M. F. M., and Vos, R., “Aeropropulsive Efficiency Requirements for Turboelectric Transport Aircraft,”AIAA Scitech 2020 Forum, 2020.
[29] Elmendorp, R. J. M., Vos, R., and La Rocca, G., “A conceptual design and analysis method for conventional and unconventionalairplanes,” ICAS 2014: Proceedings of the 29th Congress of the International Council of the Aeronautical Sciences, St.Petersburg, Russia, 7-12 September 2014, International Council of Aeronautical Sciences, 2014.
[30] Schut, J., and van Tooren, M. J. L., “Design" Feasilization" Using Knowledge-Based Engineering and Optimization Tech-niques,” Journal of Aircraft, Vol. 44, No. 6, 2007, pp. 1776–1786. doi:10.2514/1.24688.
[31] Vos, R., and Hoogreef, M. F. M., “Semi-analytical weight estimation method for fuselages with oval cross-section,” 54thAIAA/ASME/ASCE/AHS/ASC Structures, Structural Dynamics, and Materials Conference, American Institute of Aeronauticsand Astronautics, 2013. doi:10.2514/6.2013-1719.
[32] Schmidt, K., and Vos, R., “A semi-analytical weight estimation method for oval fuselages in conventional and novel aircraft,”52nd Aerospace Sciences Meeting, American Institute of Aeronautics and Astronautics, 2014. doi:10.2514/6.2014-0026.
[33] Roelofs, M., and Vos, R., “Semi-analytical composite oval fuselage weight estimation,” 55th AIAA Aerospace Sciences Meeting,American Institute of Aeronautics and Astronautics, 2017. doi:10.2514/6.2017-0466.
[34] Elmendorp, R. J. M., and La Rocca, G., “Comparitive Design & Sensitivity Studies on Box-Wing Airplanes,” ItalianAssociation of Aeronautics and Astronautics - XXV International Congress, 2019.
24
Dow
nloa
ded
by T
U D
EL
FT o
n Ja
nuar
y 6,
202
0 | h
ttp://
arc.
aiaa
.org
| D
OI:
10.
2514
/6.2
020-
0503

[35] Finger, D. F., Braun, C., and Bil, C., “An initial sizing methodology for hybrid-electric light aircraft,” 2018 Aviation Technology,Integration, and Operations Conference, American Institute of Aeronautics and Astronautics, 2018. doi:10.2514/6.2018-4229.
[36] Finger, D. F., de Vries, R., Braun, C., Vos, R., and Bil, C., “A Comparison of Hybrid-Electric Aircraft Sizing Methods,” AIAAScitech 2020 Forum, 2020.
[37] Anonymous, Commercial aircraft propulsion and energy systems research: reducing global carbon emissions, NationalAcademies Press, 2016. National Academies of Sciences, Engineering, and Medicine; Division on Engineering and PhysicalSciences; Aeronautics and Space Engineering Board; Committee on Propulsion and Energy Systems to Reduce CommercialAviation Carbon Emissions.
[38] Stückl, S., “Methods for the Design and Evaluation of Future Aircraft Concepts Utilizing Electric Propulsion Systems,” Ph.D.thesis, Technische Universität München, 2016.
[39] Ting, L., and Liu, C. H., “Thin Airfoil in Nonuniform Parallel Stream,” Journal of Aircraft, Vol. 6, No. 2, 1969, pp. 173–175.doi:10.2514/3.44030.
[40] Ting, L., Liu, C. H., and Kleinstein, G., “Interference of Wing and Multipropellers,” AIAA Journal, Vol. 10, No. 7, 1972, pp.906–914. doi:10.2514/3.50244.
[41] Torenbeek, E., Synthesis of subsonic airplane design, Delft University Press, 1982.
[42] Habermann, A. L., Bijewitz, J., Seitz, A., and Hornung, M., “Performance Bookkeeping for Aircraft Configurations withFuselage Wake-Filling Propulsion Integration,” Deutscher Luft- und Raumfahrtkongress (DLRK) 2018, 46 September 2018.
[43] Smith Jr., L. H., “Wake Ingestion Propulsion Benefit,” Journal of Propulsion and Power, Vol. 9 (No. 1), No. 1, 1993, pp.74–83. doi:10.2514/3.11487.
[44] Mikić, G. V., Stoll, A. M., Bevirt, J., Grah, R., and Moore, M. D., “Fuselage Boundary Layer Ingestion Propulsion Appliedto a Thin Haul Commuter Aircraft for Optimal Efficiency,” 16th AIAA Aviation Technology, Integration, and OperationsConference, American Institute of Aeronautics and Astronautics, 2016. doi:10.2514/6.2016-3764.
[45] ESDU, “The influence of body geometry and flow conditions on axisymmetric velocity distributions at subcritical Machnumbers,” ESDU 78037, 1978.
[46] ESDU, “The influence of body geometry and flow conditions on axisymmetric boundary layers at subcritical Mach numbers,”ESDU 79020, 1979.
[47] Seitz, A., Peter, F., Bijewitz, J., Habermann, A., Goraj, Z., Kowalski, M., Castillo, A., Meller, F., Merkler, R., Samuelsson,S., et al., “Concept Validation Study for Fuselage Wake-Filling Propulsion Integration,” 31st Congress of the InternationalCouncil of the Aeronautical Sciences, 2018, pp. 09–14.
[48] Schouten, T., Hoogreef, M. F. M., and Vos, R., “Effect of Propeller Installation on Performance Indicators of RegionalTurboprop Aircraft,” AIAA Scitech 2019 Forum, American Institute of Aeronautics and Astronautics, 2019. doi:10.2514/6.2019-1306.
[49] Bijewitz, J., Seitz, A., Isikveren, A. T., and Hornung, M., “Progress in optimizing the propulsive fuselage aircraft concept,”54th AIAA Aerospace Sciences Meeting, American Institute of Aeronautics and Astronautics, 2016. doi:10.2514/6.2016-0767.
25
Dow
nloa
ded
by T
U D
EL
FT o
n Ja
nuar
y 6,
202
0 | h
ttp://
arc.
aiaa
.org
| D
OI:
10.
2514
/6.2
020-
0503