The Irradiation Performance and Microstructural Evolution ...

Delft University of Technology
Microstructural evolution of white and brown etching layers in pearlitic rail steels
Kumar, Ankit; Agarwal, G.; Petrov, R.; Goto, S.; Sietsma, J.; Herbig, M.
DOI10.1016/j.actamat.2019.04.012Publication date2019Document VersionAccepted author manuscriptPublished inActa Materialia
Citation (APA)Kumar, A., Agarwal, G., Petrov, R., Goto, S., Sietsma, J., & Herbig, M. (2019). Microstructural evolution ofwhite and brown etching layers in pearlitic rail steels. Acta Materialia, 171, 48-64.https://doi.org/10.1016/j.actamat.2019.04.012
Important noteTo cite this publication, please use the final published version (if applicable).Please check the document version above.
CopyrightOther than for strictly personal use, it is not permitted to download, forward or distribute the text or part of it, without the consentof the author(s) and/or copyright holder(s), unless the work is under an open content license such as Creative Commons.
Takedown policyPlease contact us and provide details if you believe this document breaches copyrights.We will remove access to the work immediately and investigate your claim.
This work is downloaded from Delft University of Technology.For technical reasons the number of authors shown on this cover page is limited to a maximum of 10.

Microstructural evolution of white and brown etching layers in pearlitic rail steels
A. Kumara,b*, G. Agarwala, R. Petrova,c, S. Gotod, J. Sietsmaa,c, M. Herbigb*
a Delft University of Technology, Department of Materials Science and Engineering, Mekelweg 2, 2628CD Delft, The Netherlands
b Max-Planck-Institut für Eisenforschung GmbH, Max-Planck-Str. 1, 40237 Düsseldorf, Germany
c Ghent University, Department of Electrical Energy, Metals, Mechanical Constructions & Systems, Technologiepark 903 Ghent, Belgium
dAkita University, Tegata Gakuencho, Akita 010-8502, Japan * Correspondence to – [email protected], [email protected]
Abstract
The formation of White (WEL) and Brown Etching Layers (BEL) on rail raceways during
service causes the initiation of microcracks which finally leads to failure. Detailed
characterization of the WEL and the BEL in a pearlitic rail steel is carried out from
micrometer to atomic scale to understand their microstructural evolution. A microstructural
gradient is observed along the rail depth including martensite, austenite and partially
dissolved parent cementite in the WEL and tempered martensite, ultrafine/nanocrystalline
martensite/austenite, carbon saturated ferrite and partially dissolved parent cementite in the
BEL. Plastic deformation in combination with a temperature rise during wheel-rail contact
was found to be responsible for the initial formation and further microstructural evolution of
these layers. The presence of austenite in the WEL/BEL proves experimentally that
temperatures rise into the austenite range during wheel-rail contact. This is in agreement with
finite element modelling results. Each wheel-rail contact must be considered as an individual
short but intense deformation and heat treatment cycle that cumulatively forms the final
microstructure, as shown by diffusion length calculations of C and Mn. The presence of
secondary carbides in the BEL indicates that the temperature in the BEL during individual
loading cycles reaches levels where martensite tempering occurs. Partially fragmented
primary cementite laths, enriched in Mn, depleted in Si, and surrounded by a C-gradient and
dislocations were found in the BEL. The initial step in the formation of BEL and WEL is the
defect- and diffusion-assisted decomposition of the original microstructure.
1
© 2019 Manuscript version made available under CC-BY-NC-ND 4.0 license https://creativecommons.org/licenses/by-nc-nd/4.0/

Keywords: White etching layer (WEL) and Brown etching layer (BEL); Pearlitic rail steels;
Electron channeling contrast imaging (ECCI); Electron Backscatter Diffraction (EBSD);
Atom Probe tomography (APT).
1. Introduction The loading conditions in curved tracks and switches of rails are more severe than in straight
tracks, causing more irregular wear, severe rail corrugation and accumulated plastic
deformation, which lead to in-service defects of these highly loaded parts [1,2]. Therefore, for
the curved tracks, pearlitic steels with fine cementite laths (20-40 nm) and small interlamellar
spacing (150-200 nm), also known as “heat treated pearlitic steels” or R350HT, are used.
These steels possess mechanical properties that are superior over the conventional pearlitic
steels (R260), which are used in straight tracks [3]. One of the main causes of microcracking
in the rails of pearlitic steel is the formation of White Etching Layers (WEL) at the rail
raceways [4–7]. Research shows that the microcracks are generally initiated because of the
brittle fracture or delamination of these layers [2,4–7]. The WELs in curved tracks are 3-4
times thicker (100-120 μm) than the ones in the straight tracks (25-40 μm) [8,9].
Consequently, cracks in the WEL of curved tracks are deeper with correspondingly higher
local stress intensity factors and faster fatigue crack propagation, as compared to the case of
straight tracks. Therefore, there is a higher safety concern due to the WEL formation in
curved tracks.
In the past, studies have been carried out for understanding the formation mechanism of WEL
in conventional pearlitic steels employed for straight tracks [8–17]. Some of these studies
[8,9,12,16] concluded that WEL form due to the austenitization under rapid frictional heating
and subsequent fast cooling, leading to martensite formation. In contradiction with the above
mechanism, some studies [10,11,17] claim that heavy plastic deformation is responsible for
the formation of the WEL. According to this proposed mechanism, the plastic deformation
causes stress-assisted cementite dissolution leading to the formation of nanocrystalline ferrite
in the WEL microstructure. Pyzalla et al. [13] and Wang et al. [14] found strong texture
components in martensite and austenite in the WEL and proposed rapid heating with
subsequent cooling in combination with heavy loading as the formation mechanism of the
WEL. However, these studies focus mainly on the microstructural alteration and residual
stress measurements at the rail surface and do not provide in depth microstructural analysis of
the evolution of the WELs. Zhang et al. [15] showed the formation of nanocrystalline
martensite, severely deformed pearlite lamellae, austenite and cementite in the WEL on the
2
rail surface. Al-Juboori et al. [2] found two different WELs, one containing fine martensite
and the other having austenite and martensite. The existence of the former WEL was
explained due to severe plastic deformation while the presence of latter was attributed to
either thermal or thermomechanical conditions. Ahlstrӧm et al. [18] argued that the cooling
rates in the WEL can allow the formation of fresh pearlite from austenite and ferrite
precipitation at the grain boundaries. Thus, the microstructural evolution and formation
mechanism of WEL are still a matter of debate and hence the topic requires further
investigation. Moreover, most of the aforementioned studies of WEL focus on the
microstructural alterations at the rail surface only. Additionally, the particularities of the
formation of the WEL in R350HT steels have so far not been investigated.
Another microstructural alteration called the Brown Etching Layers (BEL) in the pearlitic
steels was first reported by Li et al. [19] in corrugated rails of straight tracks close to the rail
raceway. The BEL and the WEL show brown and white contrast, respectively, in optical
microscopy after etching with 2-4 vol.% Nital. Li et al. [19] proposed that the BELs primarily
consists of tempered martensite and form after the WELs formation. Contrary to this, Al-
Juboori et al. [20] proposed that the BELs are the precursor stage of the WELs. Another study
by Messaadi et al. [21] claimed the formation of globular bainite in the BEL microstructure.
Thus, there exists a discrepancy in the understanding of the microstructural evolution of the
BELs.
Studies have shown that the formation of microstructures identical to those observed in WEL
can be simulated using laboratory experiments such as rapid heating and cooling, machining,
dry sliding wear testing, cold rolling in combination with heating with laser pulses and hard
tuning [12,22–24]. Carroll et al. [6] demonstrated the formation of the WEL using spot
welding and twin disk testing. However, these simulated microstructures are significantly
different from the WEL microstructure formed on rail raceways. Therefore, there is a need to
study the formation mechanism of WEL directly from the in-field loaded rails.
The current work aims at contributing to a better understanding of the microstructural
evolution and formation mechanisms of the WEL and the BEL in rails in general, with a focus
on the particularities of the R350HT alloy employed in curved tracks. We use experimental
techniques such as Electron Channelling Contrast Imaging (ECCI), Electron Back Scatter
Diffraction (EBSD), Atom Probe Tomography (APT), Transmission Electron Microscopy
(TEM) and Scanning Electron Microscopy (SEM) to investigate the microstructure of the
WEL and the BEL in terms of crystallography and chemistry. The results are compared with
3

the thermodynamic and Finite Element Method (FEM) simulations. Based on this, the
formation steps of the WEL and the BEL are reconstructed, which is summarized in
schematic drawings.
2. Material and Methods
2.1 Material
R350HT pearlitic rail steels were produced by hot rolling the steel slabs at 1000 °C into the
shape of a rail, followed by annealing at 900 °C for 3 hours and cooling in accelerated air
flow which yields a fine pearlitic microstructure. A specimen of R350HT pearlitic steel
containing the WEL patches was cut from a curved track with 400 m radius that was exposed
to service conditions in the Netherlands. The approximate load passage was 200 Mt with an
axial load ranging from 12 t to 18 t. The exact loading history is unknown because of a large
number of undefined variables that can vary with each train or wagon such as speed,
acceleration, sinusoidal motion of wheel, wheel profile, lubrication conditions, and axle loads,
etc.[8]. The chemical composition of the R350HT steel studied here is Fe-0.72C-1.1Mn-
0.56Si-0.11Cr (in wt.%), or Fe-3.23C-1.09Si-1.1Mn-0.11Cr (in at.%). Fig. 1(a) shows a
photograph of the sample extracted from the curved track with WEL patches on the raceway
after etching with 2 vol.% Nital. The specimen on which the characterization of the WEL and
the BEL was performed was extracted at around 5 mm distance towards the gauge side from
the center of the running band (Fig. 1(b)).
Fig. 1. (a) Rail specimen from a curved track with WEL patches along the running band, (b) Magnified view of
the rail surface containing WEL patches. The region marked in red shows the location of the specimen selected
for further cross-sectional characterization.
4

2.2 Simulations
The temperature rise and mechanical stress in the rails during wheel-rail contact was
simulated using finite element modelling. An analytical model suggested by Fischer et al. [25]
is used for calculating the maximum temperature rise at the rail raceway. This model
calculates the asperity flash temperature rise on the rail raceway by taking into account the
frictional heating and heating due to plastic deformation [25]. The model also considers the
surface roughness of the contact body together with pressure intensification by local surface
asperities during wheel-rail contact and the relative slip in between wheel and rail. We assess
the temperature changes over time for different depths below the rail raceway by coupling the
analytical model with a 3-D transient heat transfer finite element simulation using COMSOL-
Multiphysics [26]. The calculations were conducted assuming a friction coefficient of 0.5,
1500 MPa maximum pressure, 30 m/s train speed and a slip of 10%. The physical material
properties were taken from the pearlitic rail steel module in COMSOL-Multiphysics, viz.
thermal diffusivity 1.317 x 10⁻⁵ m2/s, thermal conductivity 50.2 W/mK, density 7850 Kg/m3
and specific heat capacity 485.5 J/kgK. These properties were assumed to be constant over the
entire temperature range. The friction coefficient, train speed and slip assumed in this
simulation represent typical wheel-rail contact conditions and relatively milder/harsher
conditions may also exist. The effect of plastic deformation along the rail depth below the
raceway, considering an isotropic hardening material model for pearlitic steels, was assessed
using the mesoscale finite element simulation in ANSYS/LS-DYNA 14.0 [1]. To achieve
high accuracy with reasonable computing time, the moving elliptical contact patch with
Hertzian load distribution [1] was defined in a simple 5 x 5 mm2 square geometry with a mesh
size of 100 µm. A friction coefficient of 0.5 was used for the calculations. Thermodynamic
calculations were performed using the Thermo-Calc software with the TCFE9 database.
2.3 Microstructure characterization
The microstructure of the base material, the WEL and the BEL was characterized in the cross-
sectional plane perpendicular to the traffic direction. After standard metallographic sample
preparation, specimens were etched using 2 vol. % Nital solution to investigate them in the
Keyence VHX 6000 light optical microscope. Vickers microhardness measurements were
performed on a Dura scan 70 (Struers) hardness tester, using a load of 0.25 N for 10 s.
The ECCI measurements on the WEL, the BEL and the deformed pearlite region were
performed on a Zeiss Merlin SEM equipped with a Gemini-type field emission gun using an
accelerating voltage of 30 kV, a probe current of 3 nA and a working distance of 9.7 mm. The
5

High Resolution EBSD (HR-EBSD) scans were conducted using a JEOL JSM 6500F SEM
with a Schottky field emission gun SEM. The HR-EBSD scans were carried out at an
accelerating voltage of 15 kV, a working distance of 18 mm and a step size of 40 nm using a
hexagonal scan grid. The EBSD data was analysed using TSL-OIM (Orientation Image
Microscopy) software. The HR-EBSD data was used to quantify the phase fractions, grain
size distributions, intra-grain crystallographic misorientations, orientation relationships and
the distribution of high angle and low angle grain boundary (HAGB and LAGB) fractions
along the depth of the WEL and the BEL.
The 3D distribution of alloying elements at the near-atomic scale, at different depths below
the rail raceway, was quantified using APT. The specimens were prepared by Focused Ion
Beam (FIB) milling in a FEI Helios Nanolab 600i dual beam FIB/SEM. The APT
measurements were performed using a LEAP 3000X HR in voltage mode, using a set-point
temperature of 65 K, a pulse fraction of 15% and a pulse frequency of 200 kHz. Data
reconstruction following the procedure of Vurpillot et al. [27] and data analysis were done
using the IVAS software. The alloy element partitioning was mainly investigated using
proximity histograms (also called “Proxigrams”) [28]. TEM and APT were performed on the
same APT specimen with an experimental approach as described by Herbig et al. [29,30].
TEM analysis was carried out in a Jeol JEM-2200FS FEG-TEM operated at 200 kV.
The specimen was further imaged in Secondary Electron (SE) mode in a Zeiss Merlin SEM
after etching with 2 vol. % Nital. An accelerating voltage of 30 kV, a probe current of 2.5 nA
and a working distance of 9.8 mm was used for the SE imaging. The ECCI, EBSD, APT
results in combination with SE imaging on the same location enabled classifying the etching
behavior of the WEL and the BEL.
3. Results and discussion
3.1 Thermodynamic considerations
Fig. 2 shows the dependence of the phase fraction of austenite, ferrite and cementite on
temperature in the R350HT pearlitic steels in thermodynamic equilibrium. The plot was
calculated for atmospheric pressure using the Thermo-Calc software. During heating the
cementite starts to dissolve at 715 °C and the microstructure completely transforms into
austenite at 730 °C. In the intermediate temperature range, cementite, ferrite and austenite
coexist. According to these calculations, only if the temperature exceeds 715 °C austenite can
form in this fully pearlitic steel. At an elevated pressure of 2 GPa, assumed to be
6

representative for the moment of wheel-rail contact in curved tracks [31], the austenite start
and finish temperatures are shifted slightly to 675 and 815 °C, respectively (see
supplementary material).
Fig. 2. Plot of phase fractions as a function of temperature at atmospheric pressure in R350HT generated using
Thermo-Calc.
3.2 Temperature and contact stresses at the wheel-rail interface
The interpretation of the WEL and the BEL microstructure requires an assessment of the
temperature changes and stress distribution at the wheel-rail interfaces. According to finite
element modelling by Vo et al. [32] the temperature at the rail raceway can reach 624 °C. Ertz
et al. [33] also calculated a temperature rise of 630 °C at the rail surface in straight tracks.
However, Takahashi et al. [8] estimated (using a FEM approach detailed in [34]) a
temperature rise close to 1400 °C at the rail raceway. The peak temperature rise was also
estimated by diffusion length calculations of Mn in the WEL and a rise of 1300-1400 °C was
predicted at a depth of 2 μm below the rail raceway. There are thus pronounced variations in
the estimations of the temperature rise at the wheel-rail interface in the literature. Such
variations can be attributed to differences in the selected values of the parameters such as
friction coefficient, train velocity, axle load, wheel/rail roughness, traction forces, slip rate
and maximum shear stresses etc.
Our simulations allow an estimation of the temperature rise and plastic deformation for the
given case of the curved tracks (Fig. 3). Fig. 3(a) shows the finite element modelling
estimations of the temperature changes at the rail raceway and at different depths (20, 40, 60
and 80 μm) over time. According to the simulation results, the temperature at the rail raceway
reaches 1228 °C with a heating rate of 5 x 10⁶ °C/s. In 20 and 40 µm depth (the region where
we observe the WEL (Fig. 4)), the temperature reaches 982 °C and 737 °C respectively,
where austenite formation is possible (Fig. 2). In the BEL at 60 µm and 80 µm below the rail
7
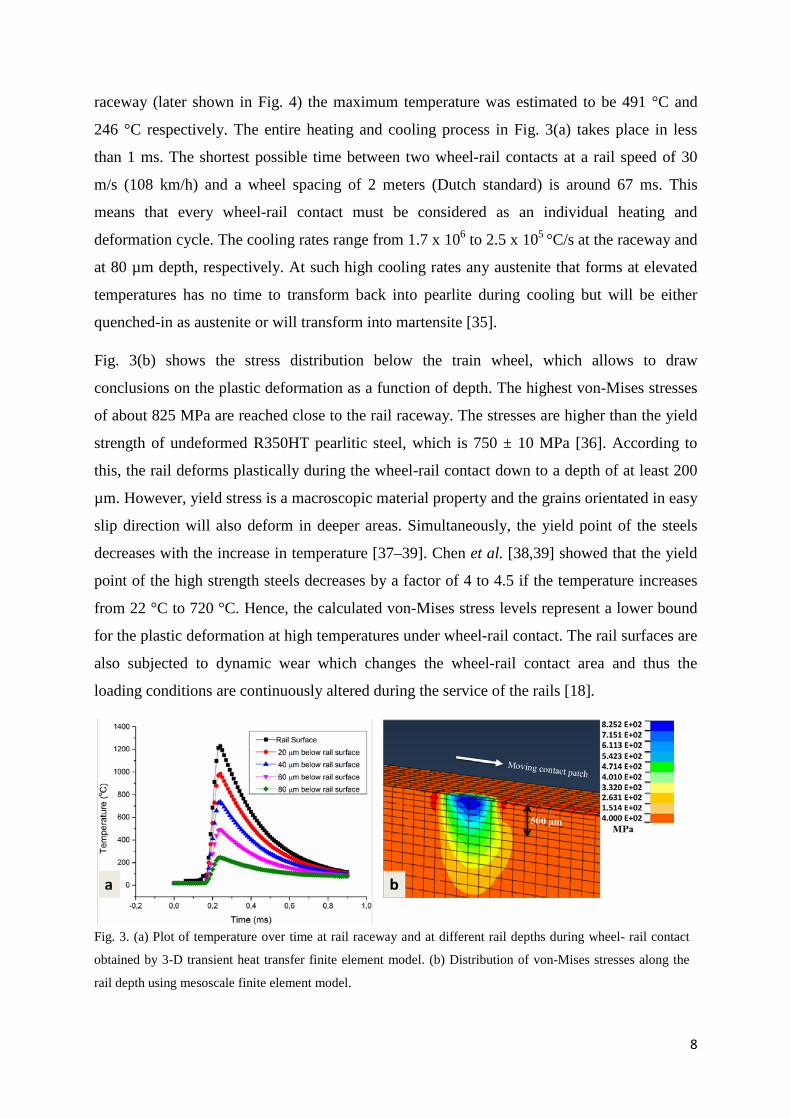
raceway (later shown in Fig. 4) the maximum temperature was estimated to be 491 °C and
246 °C respectively. The entire heating and cooling process in Fig. 3(a) takes place in less
than 1 ms. The shortest possible time between two wheel-rail contacts at a rail speed of 30
m/s (108 km/h) and a wheel spacing of 2 meters (Dutch standard) is around 67 ms. This
means that every wheel-rail contact must be considered as an individual heating and
deformation cycle. The cooling rates range from 1.7 x 10⁶ to 2.5 x 10⁵ °C/s at the raceway and
at 80 µm depth, respectively. At such high cooling rates any austenite that forms at elevated
temperatures has no time to transform back into pearlite during cooling but will be either
quenched-in as austenite or will transform into martensite [35].
Fig. 3(b) shows the stress distribution below the train wheel, which allows to draw
conclusions on the plastic deformation as a function of depth. The highest von-Mises stresses
of about 825 MPa are reached close to the rail raceway. The stresses are higher than the yield
strength of undeformed R350HT pearlitic steel, which is 750 ± 10 MPa [36]. According to
this, the rail deforms plastically during the wheel-rail contact down to a depth of at least 200
µm. However, yield stress is a macroscopic material property and the grains orientated in easy
slip direction will also deform in deeper areas. Simultaneously, the yield point of the steels
decreases with the increase in temperature [37–39]. Chen et al. [38,39] showed that the yield
point of the high strength steels decreases by a factor of 4 to 4.5 if the temperature increases
from 22 °C to 720 °C. Hence, the calculated von-Mises stress levels represent a lower bound
for the plastic deformation at high temperatures under wheel-rail contact. The rail surfaces are
also subjected to dynamic wear which changes the wheel-rail contact area and thus the
loading conditions are continuously altered during the service of the rails [18].
Fig. 3. (a) Plot of temperature over time at rail raceway and at different rail depths during wheel- rail contact
obtained by 3-D transient heat transfer finite element model. (b) Distribution of von-Mises stresses along the
rail depth using mesoscale finite element model.
8
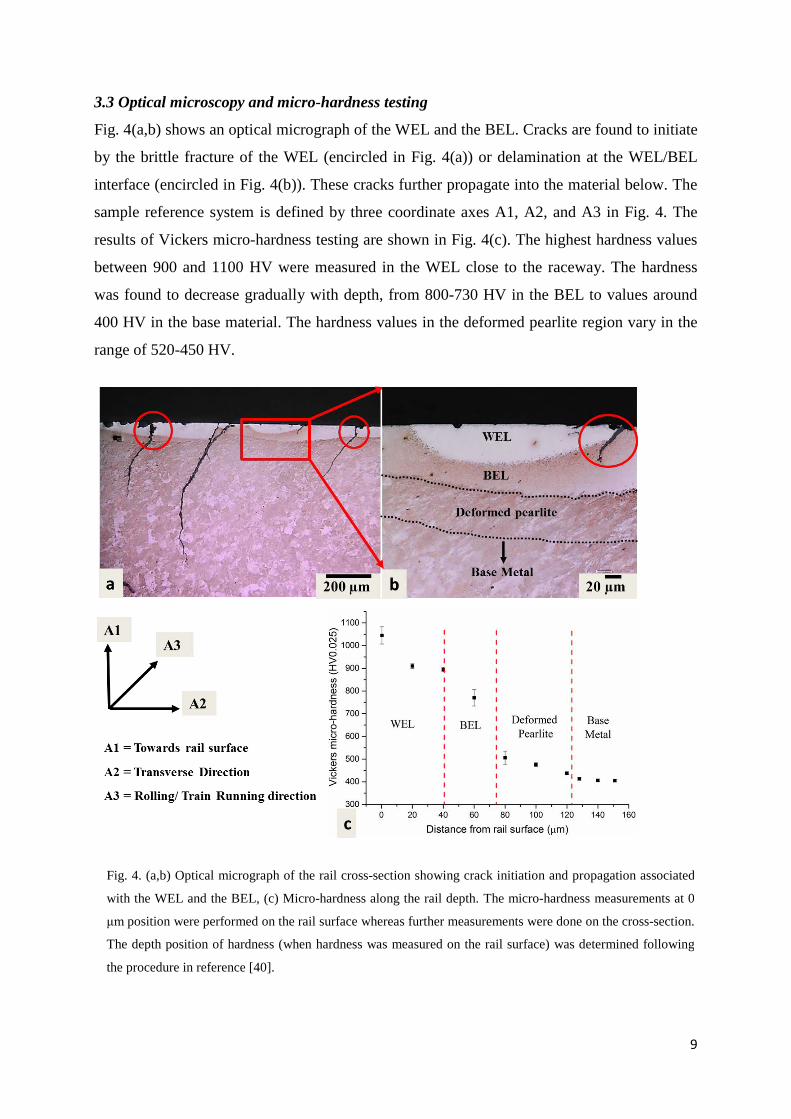
3.3 Optical microscopy and micro-hardness testing
Fig. 4(a,b) shows an optical micrograph of the WEL and the BEL. Cracks are found to initiate
by the brittle fracture of the WEL (encircled in Fig. 4(a)) or delamination at the WEL/BEL
interface (encircled in Fig. 4(b)). These cracks further propagate into the material below. The
sample reference system is defined by three coordinate axes A1, A2, and A3 in Fig. 4. The
results of Vickers micro-hardness testing are shown in Fig. 4(c). The highest hardness values
between 900 and 1100 HV were measured in the WEL close to the raceway. The hardness
was found to decrease gradually with depth, from 800-730 HV in the BEL to values around
400 HV in the base material. The hardness values in the deformed pearlite region vary in the
range of 520-450 HV.
Fig. 4. (a,b) Optical micrograph of the rail cross-section showing crack initiation and propagation associated
with the WEL and the BEL, (c) Micro-hardness along the rail depth. The micro-hardness measurements at 0
μm position were performed on the rail surface whereas further measurements were done on the cross-section.
The depth position of hardness (when hardness was measured on the rail surface) was determined following
the procedure in reference [40].
9

3.4 Study of microstructure evolution using ECCI
ECCI is a powerful technique for observing crystal defects such as dislocations, stacking
faults, twinning and grain boundaries in the SEM [41,42]. The ECCI micrograph shown in
Fig. 5(a) is taken from the same area as that of the optical micrograph in Fig. 4(a). Fig. 5(b-e)
show magnified subregions from Fig. 5(a). The WEL, the BEL and the deformed pearlite can
be distinguished in ECCI according to their average backscattering intensities. A pronounced
contrast difference between the WEL and the BEL is observed. The WEL appears brightest,
the BEL darker and the deformed pearlite region the darkest (Fig. 5(a)). Additionally, the
BEL also shows an intensity gradient along the depth (Fig. 5(a)).
The backscattering contrast, as a first order approximation, depends on the mass density, grain
orientation and defect density [41]. The overall composition in the WEL and the BEL is
equal; therefore there are no contrast changes related to mass density at the scale of Fig. 5.
Also, there is no pronounced difference in the texture between the WEL, the BEL and the
deformed pearlite region (see supplementary material) that could give rise to a contrast
change related to the average grain orientation. Thus, it can be concluded that the different
average ECCI intensities mainly represent different densities of defects, i.e. dislocations and
grain boundaries, being present in these regions. The WEL has the highest defect density
giving rise to more backscattering and thus shows high brightness (Fig. 5(a)). The high defect
densities present in the WEL are in good agreement with the high von-Mises stresses
calculated for this region (Fig. 3(b)). The transition between the top and the bottom of the
BEL shows an intensity gradient from dark to bright (Fig. 5(a)), which represents a gradient
of increasing defect densities. At first view, this is in disagreement with the gradient of the
von-Mises stresses (Fig. 3(b)). However, this point is experimentally confirmed by EBSD and
will be discussed later.
The transition between the BEL and its adjacent regions is not sharp but appears like zones
comprised of a mixture of patches belonging to each side (Fig. 5(b, e)). In the deformed
pearlite region, ferrite (α) and cementite (θ) can be clearly distinguished (Fig. 5(e,f)). In these
figures, shear bending and partial fragmentation of the cementite laths and an accumulation of
dislocations within ferrite, especially at the ferrite/cementite interface, is observed. This
indicates the onset of cementite decomposition under heat and plastic deformation, which is
the first step that takes place in the formation process of WEL/BEL. The ferrite grains in this
area are in the transition process to become part of the surrounding BEL. The ferrite/cementite
10

islands that remain in the matrix of the BEL are mostly oriented parallel to the rail raceway
(Fig. 5(e)), indicating the orientation-dependent microstructural decomposition of pearlite.
Fig. 5. ECCI micrographs of the region depicted in Fig 4(a). (a) Overview image showing the WEL, the
BEL and the deformed pearlite region with different ECCI contrast, (b-d) Magnified subregions 1-3 from
(a), (e,f) ECCI images at the interface of the BEL and the deformed pearlite region from subregion 4 in (a)
showing breaking and shear bending of cementite (θ) laths.
11

3.5 Microstructural insight using electron backscatter diffraction
EBSD scans were performed in an area marked in Fig. 6(a), covering the entire depth from
the WEL over the BEL down to the deformed pearlite region (Fig. 6(b,c)). From the EBSD
measurement, a phase map and a Kernel Average Misorientation (KAM) map were extracted
(Fig. 6(b,c)). The black pixels in Fig. 6(b,c) represent measurement points with Confidence
Index (CI) < 0.1 that were removed before the data analysis. The WEL, the BEL and the
deformed pearlite region can be clearly distinguished in the EBSD maps (Fig. 6(b,c)). The
EBSD phase map depicted in Fig. 6(b) shows the presence of austenite (in green) in the WEL
and the BEL but not in the deformed pearlite region. The presence of austenite provides
evidence that temperatures of about 700 °C (A1 temperature in Fig. 2) and above are reached
in the WEL and the BEL, during the wheel-rail contact. The KAM map depicted in Fig. 6(c)
plots the average misorientation to the second nearest neighboring pixels considering a
maximum misorientation angle of 5 degrees. High KAM values represent high Geometrically
Necessary Dislocation (GND) densities. The results show high, intermediate and low KAM
values/GND densities in the WEL, the BEL and the deformed pearlite region, respectively,
and thus confirm our interpretation of the ECCI micrograph in Fig. 5.
12

In order to quantify and further discuss the microstructural alterations from the rail surface
into the depth, the EBSD data depicted in Fig. 6 was segmented into 1 µm thick slices along
the depth, which were statistically analyzed. The austenite fraction, the fraction of HAGBs
and LAGBs, the KAM values and the average grain size are plotted from the rail surface into
the depth and are depicted together with representative subregions of the EBSD map (Fig.
7(a,b)) and Fig. 8 (a-c). The origin of these subregions is marked by the rectangular boxes in
Fig. 6(c). An additional subregion 6 containing undeformed pearlite/base material is also
plotted in Fig. 7(a,b) and Fig. 8(a,c) for comparison with the WEL/BEL/deformed pearlite.
Fig. 7(a) shows the distribution of the austenite area fraction in the WEL, the BEL, the
deformed pearlite and the base material. The fraction of the austenite phase in subregion 1 in
the WEL is 0.25-2%, and increases towards the WEL/BEL interface (Fig. 7(a)). The austenite
fraction within the WEL reaches its maximum value of 9-11 % at a depth of 30-35 µm below
the rail raceway. The austenite fraction in the BEL varies in the range of 0.5-2.5 % which is
significantly lower than in the WEL. The higher austenite fraction in the WEL indicates that
the WEL witnesses a higher temperature than the BEL, which is in agreement with the
thermal simulations shown in Fig. 3(a). The austenite fraction decreases from 2.5 % at the
WEL/BEL interface to approximately 0.5-0.7 % at the BEL/deformed pearlite interface (Fig.
7(a)). No austenite phase is detected in the deformed pearlite and undeformed pearlite region.
Fig. 7(b) shows the distribution of HAGB (15-65° misorientation) and LAGBs (5-15°
misorientation) fractions from the rail raceway to the undeformed pearlite. The plot does not
include boundaries with misorientations in the 0-5° range. The HAGBs and LAGBs are
highlighted by blue and red lines, respectively, in the corresponding EBSD maps in Fig. 7(b).
The WEL shows a low fraction of HAGBs (0.5-0.6) close to the rail raceway, which increases
to a value of 0.82 at the WEL/BEL interface. The low HAGBs fraction close to the rail
raceway is attributed to substantial grain growth of austenite in the WEL, which leads to an
average martensite grain size of 0.7±0.4 µm, as shown in corresponding EBSD map in Fig.
7(b). The increase in the HAGBs fraction from the rail raceway to the WEL/BEL interface is
due to the decrease in grain size in the WEL along the rail depth (Fig. 7(b)). The LAGBs
fraction is found to be almost constant around 0.05 in the WEL. The fraction of HAGBs and
LAGBs further increases in the BEL to a value of 0.8 and 0.1, respectively, indicating the
presence of finer grains in the BEL (with an average grain size of 0.30 ± 0.15 µm) than in the
Fig. 6. (a) Optical micrograph showing the WEL, the BEL and the Deformed Pearlite (DP) region, (b) EBSD
phase map and (c) EBSD-KAM map from the rectangular region marked in (a). The transition between the
WEL and the BEL is marked with dashed lines.
13
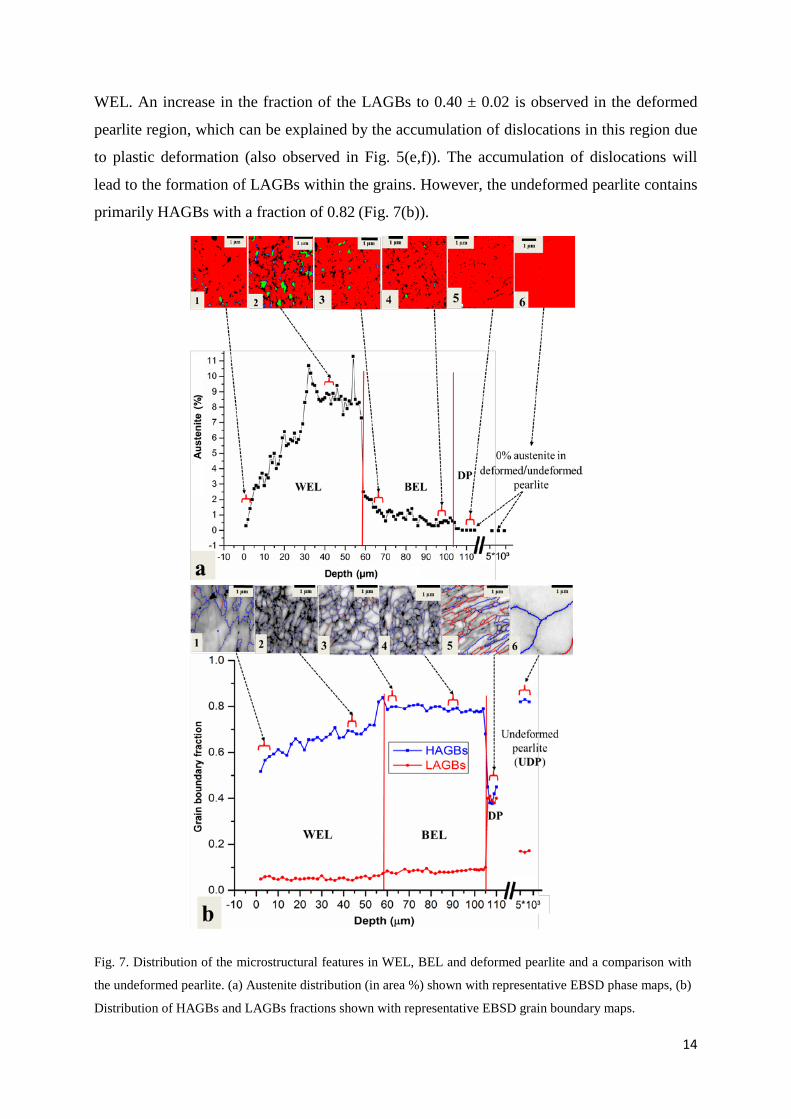
WEL. An increase in the fraction of the LAGBs to 0.40 ± 0.02 is observed in the deformed
pearlite region, which can be explained by the accumulation of dislocations in this region due
to plastic deformation (also observed in Fig. 5(e,f)). The accumulation of dislocations will
lead to the formation of LAGBs within the grains. However, the undeformed pearlite contains
primarily HAGBs with a fraction of 0.82 (Fig. 7(b)).
Fig. 7. Distribution of the microstructural features in WEL, BEL and deformed pearlite and a comparison with
the undeformed pearlite. (a) Austenite distribution (in area %) shown with representative EBSD phase maps, (b)
Distribution of HAGBs and LAGBs fractions shown with representative EBSD grain boundary maps.
14
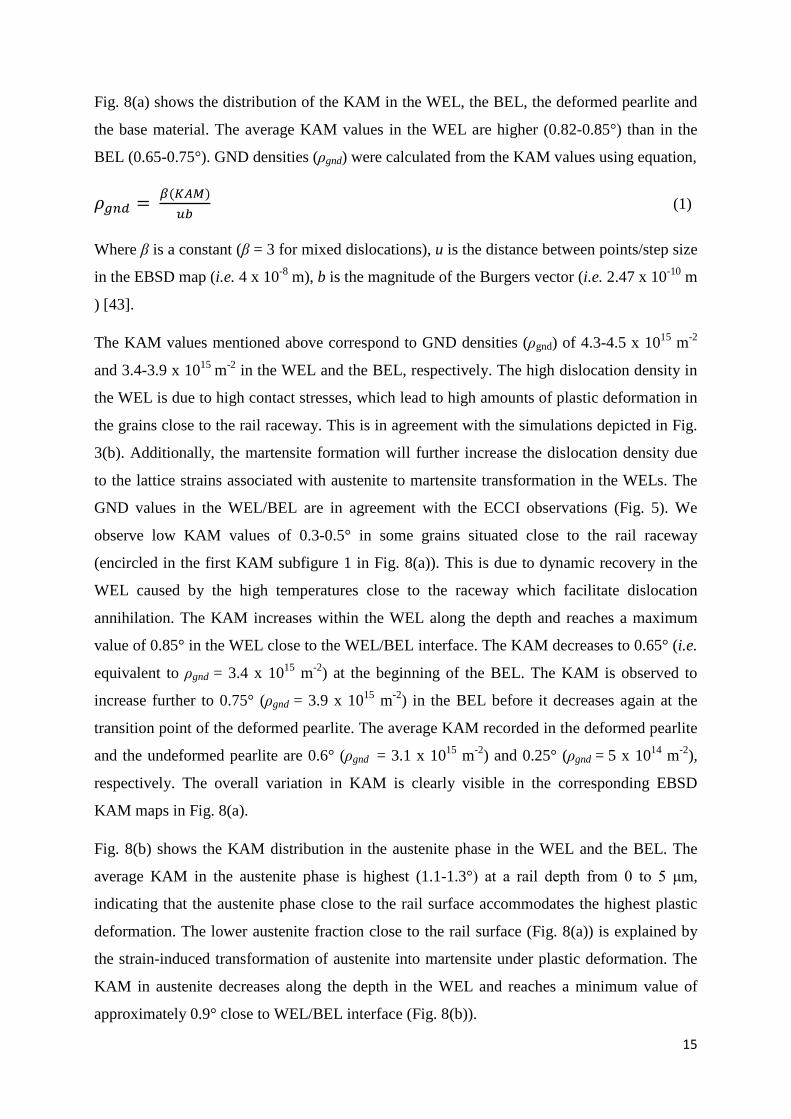
Fig. 8(a) shows the distribution of the KAM in the WEL, the BEL, the deformed pearlite and
the base material. The average KAM values in the WEL are higher (0.82-0.85°) than in the
BEL (0.65-0.75°). GND densities (ρgnd) were calculated from the KAM values using equation,
𝜌𝜌𝑔𝑔𝑔𝑔𝑔𝑔 = 𝛽𝛽(𝐾𝐾𝐾𝐾𝐾𝐾)𝑢𝑢𝑢𝑢
(1)
Where β is a constant (β = 3 for mixed dislocations), u is the distance between points/step size
in the EBSD map (i.e. 4 x 10⁻⁸ m), b is the magnitude of the Burgers vector (i.e. 2.47 x 10⁻¹⁰ m
) [43].
The KAM values mentioned above correspond to GND densities (ρgnd) of 4.3-4.5 x 10¹⁵ m-2
and 3.4-3.9 x 10¹⁵ m-2 in the WEL and the BEL, respectively. The high dislocation density in
the WEL is due to high contact stresses, which lead to high amounts of plastic deformation in
the grains close to the rail raceway. This is in agreement with the simulations depicted in Fig.
3(b). Additionally, the martensite formation will further increase the dislocation density due
to the lattice strains associated with austenite to martensite transformation in the WELs. The
GND values in the WEL/BEL are in agreement with the ECCI observations (Fig. 5). We
observe low KAM values of 0.3-0.5° in some grains situated close to the rail raceway
(encircled in the first KAM subfigure 1 in Fig. 8(a)). This is due to dynamic recovery in the
WEL caused by the high temperatures close to the raceway which facilitate dislocation
annihilation. The KAM increases within the WEL along the depth and reaches a maximum
value of 0.85° in the WEL close to the WEL/BEL interface. The KAM decreases to 0.65° (i.e.
equivalent to ρgnd = 3.4 x 10¹⁵ m-2) at the beginning of the BEL. The KAM is observed to
increase further to 0.75° (ρgnd = 3.9 x 10¹⁵ m-2) in the BEL before it decreases again at the
transition point of the deformed pearlite. The average KAM recorded in the deformed pearlite
and the undeformed pearlite are 0.6° (ρgnd = 3.1 x 10¹⁵ m-2) and 0.25° (ρgnd = 5 x 10¹⁴ m-2),
respectively. The overall variation in KAM is clearly visible in the corresponding EBSD
KAM maps in Fig. 8(a).
Fig. 8(b) shows the KAM distribution in the austenite phase in the WEL and the BEL. The
average KAM in the austenite phase is highest (1.1-1.3°) at a rail depth from 0 to 5 μm,
indicating that the austenite phase close to the rail surface accommodates the highest plastic
deformation. The lower austenite fraction close to the rail surface (Fig. 8(a)) is explained by
the strain-induced transformation of austenite into martensite under plastic deformation. The
KAM in austenite decreases along the depth in the WEL and reaches a minimum value of
approximately 0.9° close to WEL/BEL interface (Fig. 8(b)).
15
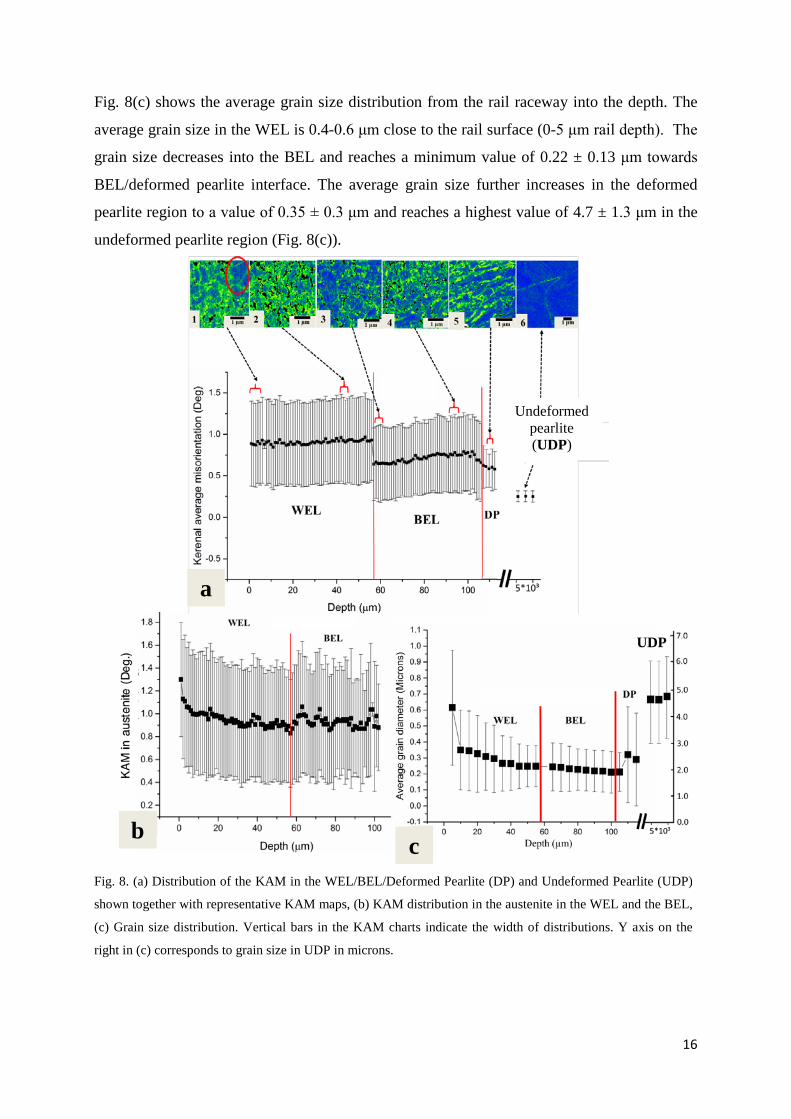
Fig. 8(c) shows the average grain size distribution from the rail raceway into the depth. The
average grain size in the WEL is 0.4-0.6 μm close to the rail surface (0-5 μm rail depth). The
grain size decreases into the BEL and reaches a minimum value of 0.22 ± 0.13 μm towards
BEL/deformed pearlite interface. The average grain size further increases in the deformed
pearlite region to a value of 0.35 ± 0.3 μm and reaches a highest value of 4.7 ± 1.3 μm in the
undeformed pearlite region (Fig. 8(c)).
Fig. 8. (a) Distribution of the KAM in the WEL/BEL/Deformed Pearlite (DP) and Undeformed Pearlite (UDP)
shown together with representative KAM maps, (b) KAM distribution in the austenite in the WEL and the BEL,
(c) Grain size distribution. Vertical bars in the KAM charts indicate the width of distributions. Y axis on the
right in (c) corresponds to grain size in UDP in microns.
Undeformed pearlite (UDP)
UDP
a
b c
16

3.6 Atomic scale characterization of the WEL, the BEL and the undeformed base material
In order to further understand the formation mechanism of the WELs and the BELs, APT
measurements were performed at various depths in the WEL and the BEL and compared with
the undeformed pearlite as depicted in Fig. 9. Fig. 9(a) is a reference ECCI image showing
four regions (in rectangles) where the APT measurements were performed. These regions are:
the WEL at (1) 5 µm and (2) 30 µm below the rail raceway, (3) the BEL at 5 µm below the
WEL/BEL interface and (4) the BEL at 10 µm above the BEL/deformed pearlite interface.
Fig. 9(c-f) shows the APT results from the regions 1-4, respectively.
Fig. 9(b) depicts the C atom map from the undeformed pearlite that contains a cementite lath
surrounded by ferrite. A proximity histogram (‘proxigram’) showing the compositional
transition between ferrite and cementite is depicted below the C atom map. The proxigram
was generated based on a 25 at.% C iso-concentration surface in the Region of Interest (ROI)
marked with a rectangle. The size of the cementite lath in Fig. 9(b) is in the range of 25 to 40
nm. The proxigram in Fig. 9(b) shows the partitioning of C and Mn into the cementite and of
Si out of the cementite. The cementite has a C content of up to 25 at.%, Mn of up to 4 at.%
and Si of around 0.0012 at.%. The C in ferrite is found in the equilibrium concentration (at
room temperature) i.e. 0.0046 at.% with a Si and Mn concentration of 1.29 at.% and 1.1 at.%,
respectively.
In the WEL from region 1, grain boundary segregation of C is observed as shown in C atom
map in Fig. 9(c). The C concentration at the grain boundary is 12-13 at.% as per proxigram
analysis conducted with a 7 at.% C iso-concentration surfaces. The average C content in the
matrix is found to be 3.25 ± 0.10 at.%. This indicates the presence of martensitic phase in the
WEL in region 1. Additionally, many nanosized regions are observed within the martensitic
matrix, with a high C concentration (> 7 at.%). These regions are shown by the arrows in the
C atom map overlapped with 7 at.% C iso-concentration surfaces (in green) in Fig. 9(c).
These regions can be attributed to C segregation at the dislocations in martensitic matrix. Mn
and Si are found to be uniformly distributed in the WEL in region 1.
Fig. 9(d) shows a representative APT result from region 2. The result shows the segregation
of C atoms at the grain boundary and the dislocations (shown by arrows) in the C atom map
with 7 at.% C iso-concentration (in green). A cementite particle with a spherical morphology
is observed in this region (in the rectangle in Fig. 9(d)). A proxigram analysis in Fig. 9(d)
shows a C content of up to 25 at.%, an enrichment of Mn and the depletion of Si in this
cementite particle. This indicates that the particle is the remainder of the parent cementite
17

laths. The average C concentration in the cementite particle decreases from 25 at.% to 3.0 ±
0.2 at.% in the matrix. The high C concentration in the matrix indicates the presence of the
martensitic phase. Additionally, the smaller size of remnant cementite particles and C
enrichment in the surrounding matrix indicate that the cementite is undergoing dissolution.
Fig. 9(e) shows the APT analysis of the BEL in region 3. Nanosized spherical carbide
precipitates (indicated by arrows) are observed in the C atom map in Fig. 9(e). A proxigram
analysis in the ROI (shown by a rectangle in Fig. 9(e)) shows that these carbides contain C up
to 25 at.% but do not show partitioning of Mn and Si. Therefore, these carbides are cementite
precipitates, which are not from the parent pearlitic microstructure but rather form due to the
tempering of the martensitic matrix. The matrix in the vicinity of these carbides shows a C
concentration of up to 1 at.%, which is lower than the C concentration in the WEL (regions 1
and 2). The temperature simulations in Fig. 3(a) indicate that the peak temperature in this
region (can) reach around 500 °C, which can explain the tempering of the martensitic matrix.
However, the temperature calculations in the BEL do not explain the martensitic
transformation and the presence of austenite in the BEL (Fig. 7(a)). We conclude that the
current simulations underestimate the peak temperature in this zone. It should be noted that
that the temperature profiles in Fig. 3(a) strongly depend on the selected wheel-rail contact
conditions. A higher- slip rate, friction coefficient, axle load, train speed, and smaller contact
patch will result in an increase in the peak temperatures [8] at the rail surface/subsurface,
which can explain the microstructural observations in the BEL. Some wheel-rail contacts in
this depth can lead to temperatures above A1 followed by the ones where only tempering
occurs.
Fig. 9(f) shows the APT result from region 4. The APT tip was first imaged using BF-STEM
and the same tip was then analyzed using APT by the correlative method discussed in sec. 2.3.
The overlay of the C atom map and the TEM image (Fig. 9(f)) is in good agreement. A
cementite particle with lath morphology similar to the base pearlite material is present (Fig.
9(b)). However, the size of this cementite is around 10 nm, which is less than the size of a
cementite lath in the undeformed pearlite (25-40 nm) (Fig. 9(b)). A proxigram analysis with
25 at.% C iso-concentration surface in the ROI shows C enrichment of up to 25 at.% in
cementite accompanied by Mn enrichment and Si depletion (Fig. 9(f)). The cementite lath is
thus the remainder of the parent cementite from the original pearlite. The matrix in the
vicinity of this cementite contains 1.6 ± 0.2 at.% C (Fig. 9(f)), which is far higher than the
equilibrium concentration in ferrite (Fig. 9(b)) and lower than the C concentration in
18

martensite in the WEL (Fig. 9(c,d)). The above observations of the cementite size and C
enrichment in the ferrite matrix show evidence of parent cementite undergoing dissolution.
This is in agreement with the ECCI results in Fig. 5(f) where the onset of cementite
decomposition is captured.
Fig. 9. (a) ECCI image showing regions 1-4 where APT specimens were prepared from, (b) C atom map from
the base material showing a ferritic (α) grain and a part of a cementite (θ) lath with a proxigram based on a 25
at.% C iso-concentration surface in the ROI, (c) C atom map of the WEL (region 1), the same C atom map
with 7 at.% C iso-concentration surfaces (in green) and a proxigram from the ROI, (d) C atom map (region 2)
and the same map with 7 at.% C iso-concentration surfaces, (e) the C atom map (region 3) and a proxigram
taken with 25 at.% C interface in the ROI, (f) Correlative BF-STEM image and C atom map (region 4) along
with a proxigram based on a 25 at.% C interface in the ROI. All ROIs are marked by the rectangles.
19

3.7 Microstructural observations in the WEL and the BEL on etched samples using SE
imaging
To further investigate the role of C in the overall microstructural evolution in WEL/BEL,
similar areas as depicted in Fig. 5 were etched and imaged in SE mode (Fig. 10(b-e)). The
information gathered by light microscopy, EBSD and APT allows understanding the
differences in the etching behavior of the WEL and the BEL. The etching behavior of
polycrystalline alloys depends on various microstructural features such as crystal structure,
crystallographic orientation, chemical composition, grain boundary energy, and grain
boundary area etc. [44]. Nital attacks preferentially at the grain boundaries and primarily
dissolves the ferrite phase in the pearlite, leaving the cementite phase intact [44,45]. This
etching behavior is shown in the SE image of the undeformed pearlite in Fig. 10(f). Nital
hardly attacts austenite and martensite phases in the steel microstructures [44].
The SE image in Fig. 10(b) from subregion 1 (rectangle within the ECCI image in Fig. 10(a))
shows weak SE contrast in the WEL due to the homogeneous and insufficient response to the
etchant. This is due to the presence of martensite, austenite and nanosized cementite
precipitates in the WEL and a homogenous distribution of C, Si and Mn in the martensitic
matrix of the WEL (sec. 3.5 and 3.6). Additionally, the C segregation at the grain boundaries
in the WEL (Fig. 9(c,d)) can also affect their etching behavior as C segregation reduces the
free energy of the system and promotes grain boundary cohesion [46]. Thus the chemical
reactivity of the grain boundaries in the martensitic matrix of the WEL is reduced [47].
Aforementioned arguments also explain the white contrast of the WEL under the light optical
microscope (Fig. 4(a,b)).
A pronounced etching heterogeneity observed in the BEL in Fig. 10(b-e) results in more
pronounced SE contrast. The magnified SE image in Fig. 10(c), shows the presence of a
complex microstructure in the BEL. The microstructure consists of ferrite (α), Partially
Dissolved parent Cementite (PDC), Tempered Martensite (TM) with Secondary Carbides
(SCs) and freshly formed (not tempered) martensite/austenite (M/ϒ) islands. The presence of
tempered martensite in this region is in agreement with our APT observations in Fig. 9(e).
This also confirms our ECCI and EBSD KAM interpretation about the dislocation densities
(section 3.4 and 3.5) as tempering leads to relaxation of lattice strains reducing the dislocation
density in martensite. The ferrite phase in Fig. 10(c) is etched deeply whereas partially
dissolved parent cementite and martensite/austenite phases remain intact. The tempered
martensite shows slightly lower etching resistance than the fresh martensite/austenite due to a
20

lower C concentration, which results from the precipitation of secondary carbides in tempered
martensite (Fig. 9(e) and Fig. 10(c)). Thus, the heterogeneous distribution of the C in the BEL
results in etching heterogeneity which produces brown contrast under the light optical
microscope (Fig. 4(a,b)).
The SE image of the BEL in Fig. 10(d) (taken from subregion 2 in Fig. 10(a)) shows the
presence of deformed pearlite colonies with partially dissolved parent cementite, ferrite and
ultrafine/nanocrystalline martensite/austenite islands. The average grain diameter of
martensite/austenite islands is 210 ± 80 nm. The dissolution of cementite is clearly observed
in this region, as cementite laths are smaller and thinner than the cementite laths in the
undeformed pearlite (Fig. 10(f)). A similar microstructure with partially dissolved parent
cementite in deformed pearlite colonies and ultrafine/nanocrystalline martensite/austenite
islands are also observed in the subregion 3 of the BEL (Fig. 10(e)). The area fraction of the
ultrafine/nanocrystalline martensite/austenite islands in subregion 2 and 3 varies in the range
of 8-10%. This indicates that austenite forms partially in the BEL leading to a low
martensite/austenite fraction on subsequent cooling (Fig. 10(d,e)). High dislocation density
exists in martensite due to shear induced diffusionless transformation. Since, the WEL
contains martensite as a primary phase, the dislocation density due to martensitic
transformation will be higher in the WEL than in the BEL, which contains only 8-10%
martensite. Hence, high dislocation density in the WEL (section 3.5) is not only due to high
contact stresses (Fig. 3(b)) but also due to high martensite fractions.
The ultrafine/nanocrystalline martensite/austenite islands and partially dissolved parent
cementite in subregion 2 and 3 are hardly etched by Nital. Additionally, the ferrite phase
present in these regions (Fig. 10(d,e)) is not as deeply etched as in case of undeformed
pearlite in Fig. 10(f)). The strong etching resistance of ferrite in the BEL is most likely due to
its C enrichment by partial dissolution of cementite via defect assisted thermal diffusion (Fig.
9(f)).
21

Before proceeding to the discussion on the WEL/BEL formation, the microstructural features
of the WEL, BEL, deformed pearlite and the base material from different characterization
methods are compared and summarized in Table A.1 (see appendix).
3.8 Decomposition of cementite
The cementite decomposition in pearlitic steels has been a point of debate in the steel research
community and various mechanisms have been proposed to explain the decomposition as a
consequence of plastic deformation, heating or both [48–55]. Takahashi et al. [48] have
proposed a mechanism where temperature rise leads to the diffusion of C atoms from
cementite to the excessive amounts of vacancies formed in ferrite during plastic deformation.
This is because the vacancies in steels have a high interaction energy with the C atoms (i.e.
0.85 eV/atom) [55]. The second proposed mechanism is based on the strong interaction forces
between C atoms and dislocations in the ferrite. The binding energy of C to the dislocations in
ferrite (i.e. 0.8 eV/atom) is higher than the binding energy of C in cementite (i.e. 0.5 eV/atom)
[48,56]. Hence, if dislocations are available in ferrite there is a thermodynamic driving force
for C to leave cementite. Therefore, even temperatures below A1 can lead to the
decomposition of cementite if the microstructure is plastically deformed.
Fig. 10. (a) ECCI image repeated from Fig. 5(a) and Fig. 9(a) showing the positions (1-3) where SE images (b-
e) were acquired after etching, (b-e) SE images of WEL, BEL and deformed pearlite, (f) SE image of original
pearlite. Different phases such as ferrite (α), cementite (θ), Partially Dissolved parent Cementite (PDC),
Martensite/Austenite (M/ϒ), Tempered Martensite (TM) and Secondary Carbide (SCs) are marked in the
figures.
22
The third mechanism is based on the Gibbs-Thomson effect in which the fragmentation of
cementite (as shown in Fig. 5(e,f)) increases their free energy to an extent that the cementite
becomes unstable and starts dissolving into ferrite [48–50]. The fragmentation of cementite in
the BELs/deformed pearlite regions can further be explained by the large difference in the
yield strength of ferrite and cementite, which generates strain incompatibility under severe
plastic deformation. As a result, the dislocations nucleate from the ferrite/cementite interfaces
[51] (Fig. 5(f)) and their density in ferrite phase increases with further deformation. The
motion of these dislocations is blocked by neighboring cementite laths forming tangled and
jogged dislocations at the ferrite/cementite interfaces, which leads to the fragmentation of the
cementite. Umemoto et al. [52] observed similar fragmentation, bending, cleavage fracture
and shear cracking of the cementite in pearlite under the plastic deformation.
The fourth mechanism reported to cause cementite dissolution in pearlitic steels is the “C drag
effect” where moving dislocations under plastic deformation can carry the C atoms from
cementite to the ferrite phase [53,54]. In this mechanism, C atoms are trapped inside
dislocations due to strong interaction forces between C atoms and the dislocations. However,
this mechanism is only valid when the “diffusional rate of C atoms in ferrite” (dαʹ) is of the
same order of magnitude or faster than the “dislocation velocity” (𝑣𝑣) under wheel-rail contact
[54]. In order to check the applicability of this mechanism, the dislocation velocity (𝑣𝑣) is
calculated by the relation, 𝑣𝑣 = 𝜀𝜀̇/𝑏𝑏𝜌𝜌 [57], where 𝜀𝜀̇ is the strain rate, b is the magnitude of the
Burgers vector and ρ is the density of mobile dislocations in ferrite. The dislocation velocity
varies from 1.4x10⁻⁵ - 8x10⁻⁵ m/s, if 𝜀𝜀̇ = 1.0-6.0/s during wheel-rail contact [58], b = 2.47x10-
10 m and ρ = 3x10¹⁴ m-2 are used.
The diffusion rate of C in ferrite (dαʹ) is calculated by dαʹ = √(Df /t) where Dα is the diffusivity
of C atom in ferrite and t is the average time at the elevated temperature as per thermal cycle
in Fig. 3(a) (i.e. 1.6x10⁻⁴ s). The diffusivity of C in ferrite (Dα) is expressed as
𝐷𝐷𝛼𝛼 = 𝐷𝐷0 exp �− 𝑄𝑄𝑅𝑅𝑅𝑅 � (2)
where D0 = 1.67x10⁻⁷ m2/s is the diffusion pre-factor for ferrite, Q = 80 kJ/mol is the
activation energy for C diffusion in ferrite [54,59]. The diffusion rate of C in ferrite (dαʹ)
varies from 1.4x10⁻⁵-8x10⁻⁵ m/sec for the temperature range of 348-535°C, respectively.
Thus, the temperatures necessary for C drag by dislocations are reached during wheel-rail
contact and thus this mechanism is also expected to be active for the formation of WEL/BEL.
23

3.9 Formation mechanism of the WEL
The EBSD investigation in section 3.5 shows the presence of austenite in the WEL (Fig. 6(c)),
whereas the microstructure before any loading cycle was fully pearlitic. The formation of
austenite requires a temperature rise above the austenitization temperature (A1) (i.e. 715 °C
for the present composition (Fig. 2)) followed by rapid cooling that prevents the
transformation back into pearlite1. This implies that during the wheel-rail contact in curved
tracks, the temperature in the WEL must have exceeded A1. However, for complete
austenization, the temperature must rise above the A3 temperature (730 °C ). Our simulations,
depicted in Fig. 3(a) are in agreement with the observed microstrcutural features in the WEL.
The equilibrium C concentration in austenite formed above 715 °C is about 0.7 wt.%
(calculated via Thermo-Calc). Hence, C partitioning is required for austenite to form in the
pearlitic microstructure via diffusional transformation2. Austenite will nucleate at the
cementite/ferrite interfaces, because the cementite provides the C necessary for austenite
formation. After austenite nucleation occurs, futher austenite growth requires the diffusion of
C from cementite through austenite to the austenite/ferrite phase boundary, which is much
slower than the diffusion through ferrite. As a result, the diffusion of C in the austenite phase
is a limiting factor, controlling the austenite growth kinetics in the parent pearlite. In general,
the austenite/ferrite interface mobility needs to be considered for transformation simulations.
However, the lack of mobility data limits the calculation capability. Therefore, we neglect
interface mobility and assume that the growth rate of austenite only depends on the average
diffusion length of C in austenite. Estimation of average diffusion length of C in austenite is
carried out based on the temperature simulations. The diffusivity of C in austenite (Dϒ) is
expressed as,
𝐷𝐷ϒ = 𝐷𝐷0 exp �− 𝑄𝑄𝑅𝑅𝑅𝑅 � (3)
where D0 = 2.34 x 10⁻⁵ m2/sec is the diffusion pre-factor for austenite, Q = 147.81 kJ/mol [8]
is the activation energy for C diffusion in austenite, R = 8.31 x 10⁻³ kJ mol-1 K-1 is the gas
constant and T is the temperature in Kelvin.
The average diffusion distance of C in austenite phase (Lϒ) is calculated using
1 High heating rates during wheel-rail contact (section 3.2) can lead to an increase in the austenitization temperatures (A1/A3) [61], but this cannot be taken into account quantitatively. As a consequence, the effect of heating rates is not considered here. 2 The solute drag of C from cementite into the ferrite matrix would also affect the austenite formation, although this effect cannot be accurately quantified. The solute drag mechanism is discussed earlier in section 3.8.
24

𝐿𝐿ϒ = �𝐷𝐷ϒ𝑡𝑡 (4)
where t is the diffusion time within the austenitic zone.
The diffusional calculations are performed for the thermal profiles (Fig. 3(a)) at 0, 20 and 40
μm rail depth. Only temperatures above A1 (i.e. 715 °C) are taken into account for the
calculations. In order to achieve reasonable accuracy, each thermal profile is subdivided into
18 equal intervals. The average diffusion distance for each individual interval is calculated
and is integrated over the entire thermal profile. Following this procedure, the average
diffusional length of C in austenite during a single loading cycle (i.e. one wheel contact) at 0,
20 and 40 μm rail depth is calculated to be about 85, 30 and 8 nm, respectively. The average
interlamellar spacing of the undeformed pearlite is between 150-200 nm (Fig. 10(f)), which
means that the C diffusion length required for complete austenite formation is between 75-100
nm (C diffuses through austenite from the two neighboring ferrite/cementite interfaces).
Complete austenization is therefore only possible at 0 μm rail depth in a single wheel-rail
contact. However, at rail depths of 20 and 40 μm, multiple wheel-rail contacts are required for
complete austenitization. Therefore, considering the WEL as a single entity (rail depth up to
40 μm), multiple thermal cycles (Fig. 3(a)) are needed for its formation.
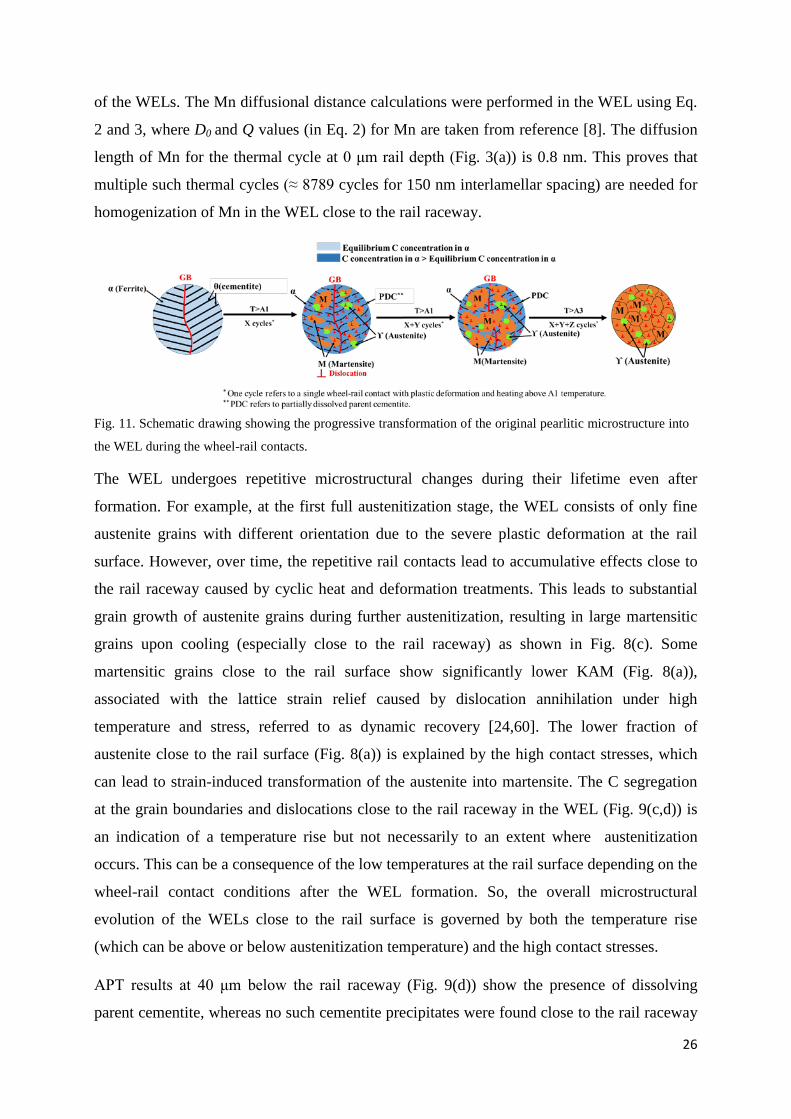
Fig. 11 shows a schematic for the formation mechanism of the WEL where a progressive
martensitic transformation is shown within multiple thermal cycles above A1/A3. During the
initial heating cycles (T > A1), austenite begins to form in the pearlitic microstructure. A
fraction of the formed austenite transforms into martensite during cooling and the rest remains
as austenite. Concurrently, cementite undergoes dissolution due to both, the plastic
deformation and the temperature rise. Due to repeated heating cycles (T > A1), the martensite
and austenite areas grow progressively to form large austenitic areas. Simultaneously, during
each cooling step (at the end of each wheel contact), part of the austenite transforms into
martensite while another part remains as austenite. However, for the complete dissolution of
cementite and the formation of martensite and austenite in the WEL microstructure, complete
austenitization is needed which will require multiple thermal cycles of T > A33.
APT investigations show that the Mn is uniformly distributed in the WEL close to the rail
raceway (Fig. 9(c)), whereas Mn partitioning is observed in the undeformed pearlite (Fig.
9(b)). Thus, the Mn diffusion calculation also provides insight into the formation mechanism
3 Even after the final stage (shown in Fig. 11) is reached, the microstructure is repetitively changed. Thus, the final microstructure must be considered as being in dynamic equilibrium.
25
of the WELs. The Mn diffusional distance calculations were performed in the WEL using Eq.
2 and 3, where D0 and Q values (in Eq. 2) for Mn are taken from reference [8]. The diffusion
length of Mn for the thermal cycle at 0 μm rail depth (Fig. 3(a)) is 0.8 nm. This proves that
multiple such thermal cycles (≈ 8789 cycles for 150 nm interlamellar spacing) are needed for
homogenization of Mn in the WEL close to the rail raceway.
The WEL undergoes repetitive microstructural changes during their lifetime even after
formation. For example, at the first full austenitization stage, the WEL consists of only fine
austenite grains with different orientation due to the severe plastic deformation at the rail
surface. However, over time, the repetitive rail contacts lead to accumulative effects close to
the rail raceway caused by cyclic heat and deformation treatments. This leads to substantial
grain growth of austenite grains during further austenitization, resulting in large martensitic
grains upon cooling (especially close to the rail raceway) as shown in Fig. 8(c). Some
martensitic grains close to the rail surface show significantly lower KAM (Fig. 8(a)),
associated with the lattice strain relief caused by dislocation annihilation under high
temperature and stress, referred to as dynamic recovery [24,60]. The lower fraction of
austenite close to the rail surface (Fig. 8(a)) is explained by the high contact stresses, which
can lead to strain-induced transformation of the austenite into martensite. The C segregation
at the grain boundaries and dislocations close to the rail raceway in the WEL (Fig. 9(c,d)) is
an indication of a temperature rise but not necessarily to an extent where austenitization
occurs. This can be a consequence of the low temperatures at the rail surface depending on the
wheel-rail contact conditions after the WEL formation. So, the overall microstructural
evolution of the WELs close to the rail surface is governed by both the temperature rise
(which can be above or below austenitization temperature) and the high contact stresses.
APT results at 40 μm below the rail raceway (Fig. 9(d)) show the presence of dissolving
parent cementite, whereas no such cementite precipitates were found close to the rail raceway
Fig. 11. Schematic drawing showing the progressive transformation of the original pearlitic microstructure into
the WEL during the wheel-rail contacts.
26

(Fig. 9(c)). The presence of such cementite precipitates can be explained by the lower
temperature rise in the subsurface than the rail surface. It is concluded that the time and
temperature at the rail subsurface (e.g. region 2) in the WELs were not sufficient to dissolve
all parent cementite particles into the martensitic matrix.
3.10 Formation mechanism of the BEL
Fig. 12 illustrates the formation mechanism of the BEL in detail. The microstructure of the
BEL can evolve in different ways. Two possible routes that can explain our experimental
findings are marked by black (route 1) and green (route 2) arrows. In the first stage of route 1,
the original pearlite microstructure can undergo multiple cycles of severe plastic deformation
and temperature rise below the A1 temperature. The plastic deformation below the hard WEL
causes the fragmentation of the parent cementite laths in the BEL. Concurrently, the plastic
deformation and the moderate temperature rise that stays below A1 leads to the partial
dissolution of the cementite laths, resulting in their refinement (Fig. 12). The partial
dissolution of cementite laths also enriches the surrounding ferrite phase in C higher than the
equilibrium C concentration in ferrite. The C concentration from these cementite laths
towards the ferrite matrix varies gradually (Fig. 9(f)), confirming the partial dissolution of
cementite laths.
Stage 1
Route 1
Route 2
Stage 2
Stage 1
Stage 2
27
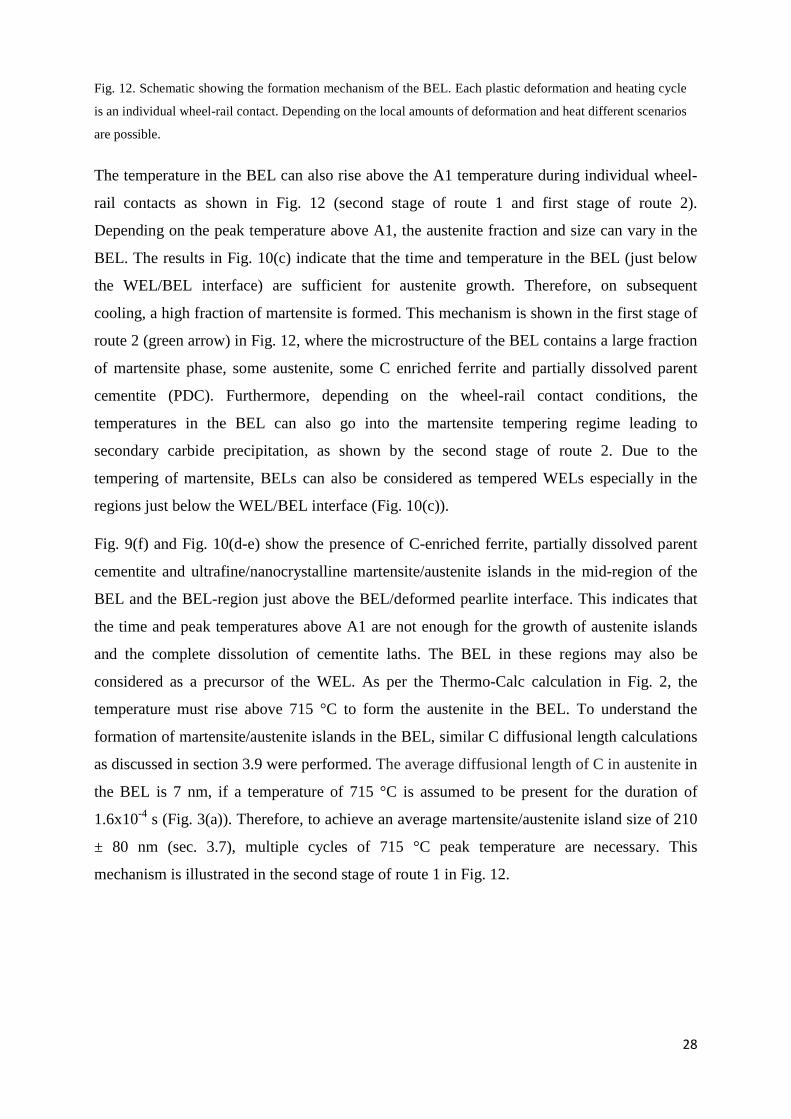
The temperature in the BEL can also rise above the A1 temperature during individual wheel-
rail contacts as shown in Fig. 12 (second stage of route 1 and first stage of route 2).
Depending on the peak temperature above A1, the austenite fraction and size can vary in the
BEL. The results in Fig. 10(c) indicate that the time and temperature in the BEL (just below
the WEL/BEL interface) are sufficient for austenite growth. Therefore, on subsequent
cooling, a high fraction of martensite is formed. This mechanism is shown in the first stage of
route 2 (green arrow) in Fig. 12, where the microstructure of the BEL contains a large fraction
of martensite phase, some austenite, some C enriched ferrite and partially dissolved parent
cementite (PDC). Furthermore, depending on the wheel-rail contact conditions, the
temperatures in the BEL can also go into the martensite tempering regime leading to
secondary carbide precipitation, as shown by the second stage of route 2. Due to the
tempering of martensite, BELs can also be considered as tempered WELs especially in the
regions just below the WEL/BEL interface (Fig. 10(c)).
Fig. 9(f) and Fig. 10(d-e) show the presence of C-enriched ferrite, partially dissolved parent
cementite and ultrafine/nanocrystalline martensite/austenite islands in the mid-region of the
BEL and the BEL-region just above the BEL/deformed pearlite interface. This indicates that
the time and peak temperatures above A1 are not enough for the growth of austenite islands
and the complete dissolution of cementite laths. The BEL in these regions may also be
considered as a precursor of the WEL. As per the Thermo-Calc calculation in Fig. 2, the
temperature must rise above 715 °C to form the austenite in the BEL. To understand the
formation of martensite/austenite islands in the BEL, similar C diffusional length calculations
as discussed in section 3.9 were performed. The average diffusional length of C in austenite in
the BEL is 7 nm, if a temperature of 715 °C is assumed to be present for the duration of
1.6x10⁻⁴ s (Fig. 3(a)). Therefore, to achieve an average martensite/austenite island size of 210
± 80 nm (sec. 3.7), multiple cycles of 715 °C peak temperature are necessary. This
mechanism is illustrated in the second stage of route 1 in Fig. 12.
Fig. 12. Schematic showing the formation mechanism of the BEL. Each plastic deformation and heating cycle
is an individual wheel-rail contact. Depending on the local amounts of deformation and heat different scenarios
are possible.
28

4. Conclusions According to our findings, the WEL and the BEL are formed by repetitive/multiple wheel-rail
contacts, where each wheel represents an individual thermomechanical treatment. Following
conclusions are drawn from this study:
1. The microstructure of the WELs at the surface consists of martensite and austenite.
This proves that temperature must have risen above the A1 here. A lower austenite
content at the surface than at the subsurface exists due to the strain-induced
transformation of austenite into martensite.
2. Besides frictional heat, plastic deformation also plays a significant role in the
microstructural evolution of the WEL. The WEL undergoes dynamic alteration with
each wheel contact. Nonetheless, these continuous alterations cause a ‘steady-state’
microstructure with characteristic features such as a certain ratio between phases,
dislocation densities, grain sizes, etc. that is representative for the temperature and
deformation conditions.
3. The parent cementite is completely dissolved in the WEL at the rail surface whereas
partially dissolved parent cementite particles are found at the subsurface. The presence
of the parent cementite particles at the subsurface results in a lower C concentration in
the martensitic matrix than at the rail surface.
4. Cyclic plastic deformation during wheel-rail contacts increases the defect density
(dislocations and vacancies) in ferrite. High interaction energy between C and these
defects facilitates cementite dissolution to form WELs/BELs. The temperature rise
also promotes defect-assisted thermal diffusion of C from cementite to the dislocations
in ferrite. Simultaneously, the “C drag effect” can also contribute to the cementite
dissolution.
5. The temperature in the BEL is in general lower than in the WEL. The presence of
austenite in the BEL shows that peak temperatures of 715 °C and above should be
reached in some wheel-rail contacts. However, the cumulative heat and plastic
deformation in the BEL is not sufficient for full austenitization and complete
dissolution of parent cementite.
29

Acknowledgements
This research was carried out under project number F91.10.12475b in the framework of the Partnership Program of the Materials innovation institute M2i (www.m2i.nl) and the Foundation for Fundamental Research on Matter (FOM) (www.fom.nl), which is part of the Netherlands Organisation for Scientific Research (www.nwo.nl). We would like express our gratitude to Dr. B. Gault, Max-Planck-Institut für Eisenforschung GmbH for fruitful discussion about atom probe tomography analysis. We are also thankful to Mr. O. Hazijad, TU Delft for useful discussion about finite element modelling. ProRail is acknowledged for the financial support in the project. MH acknowledges funding by the German Federal Ministry of Education and Research (BMBF) through grant 03SF0535.
Appendix
Table A.1. Summary of the microstructural features in the WEL, BEL, deformed pearlite and undeformed pearlite.
Region
/
Criteria
WEL BEL Deformed Pearlite Base material
Region close to rail surface (subregion 1)
WEL above the WEL-
BEL interface
(subregion 2)
BEL just below the WEL-BEL interface
(subregion 3)
BEL just above
deformed pearlite
(subregion 4)
Subregion 5 Subregion 6
Micro-hardness
(HV0.025) ≈ 1045 ≈ 910 ≈ 895 ≈ 770 ≈ 475 ≈ 400
ECCI
Weak orientation
contrast (light grey
appearance)
Weak orientation
contrast
Strong orientation
contrast
Weak orientation
contrast
Strong orientation
contrast with dislocation nucleation
and pinning at the ferrite-
cementite interfaces and
cementite undergoing dissolution
Intact cementite laths and
ferrite matrix
SE imaging in
etched
Weak SE contrast
Weak SE contrast
Presence of martensite & austenite +
Nanocrystalline/Ultrafine martensite +
Fragmentation of
cementite
Intact cementite laths and
30

sample tempered martensite +
partially dissolved
parent cementite
surrounded by C saturated
ferrite
partially dissolved
parent cementite in
pearlitic colonies
laths in deformed pearlite
ferrite matrix
EBSD
Austenite fraction
(%) ≈ 0.5-2 ≈ 9-10% ≈ 1-2% ≈ 0-0.5% No Austenite No austenite
Grain Size (μm) ≈ 0.4-0.6 ≈ 0.3 ≈ 0.25 ≈ 0.2 ≈ 0.2-0.7 ≈ 0.5-1.0
Fraction HAGBsi ≈ 0.5-0.6 ≈ 0.7 ≈ 0.8 ≈ 0.8 ≈ 0.45 ≈ 0.82
Fraction HAGBsii ≈ 0.05 ≈ 0.05 ≈ 0.1 ≈ 0.1 ≈ 0.4 ≈ 0.17
KAM (ferrite
+austenite) (°)
≈ 0.82 ≈ 0.85 ≈ 0.65 ≈ 0.75 ≈ 0.6 ≈ 0.25
GND density (/m2)
≈ 4.35 x 10¹⁵ ≈ 4.5 x 10¹⁵ ≈ 3.4 x 10¹⁵ ≈ 3.9 x10¹⁵ ≈ 3.1 x 10¹⁵ ≈ 5 x 10¹⁴
KAM (austenite)
(°) ≈ 1.1-1.3 ≈ 0.9 ≈ 0.9 ≈ 0.9 - -
APT
C segregation at
the grain boundaries ≈ 12-13 at.% & 3.25 at.% C in the matrix
C segregation at the grain
boundaries ≈ 7-8 at.% & 3 at.% C in the
matrix
Low C in ferritic matrix
≈ 1 at.%
C in ferritic matrix
≈ 1.6 at.% - C in ferrite
≈ 0.004 at.%
31

No primary or secondary cementite and uniform Mn
& Si
Partially dissolved
parent cementite
with spherical
morphology (≈ 25 at.% C at the center
+ partitioning of Mn & Si )
Secondary carbides
formed due to tempering of martensite (≈ 25 at.% C at the center +
no partitioning of
Mn & Si )
Partially dissolved
parent cementite with lath
morphology (≈ 25 at.% C at the center
+ partitioning
of Mn & Si )
-
Cementite lath (20-40 nm) with 25 at.% C and
clear Mn & Si partitioning
References [1] K.D. Vo, H.T. Zhu, A.K. Tieu, P.. Kosasih, FE method to predict damage formation on curved track for
various worn status of wheel/rail profiles, Wear. 322–323 (2015) 61–75. doi:10.1016/J.WEAR.2014.10.015.
[2] A. Al-Juboori, D. Wexler, H. Li, H. Zhu, C. Lu, A. McCusker, J. McLeod, S. Pannil, Z. Wang, Squat formation and the occurrence of two distinct classes of white etching layer on the surface of rail steel, Int. J. Fatigue. 104 (2017) 52–60. doi:10.1016/J.IJFATIGUE.2017.07.005.
[3] H. Yahyaoui, H. Sidhom, C. Braham, A. Baczmanski, Effect of interlamellar spacing on the elastoplastic behavior of C70 pearlitic steel: Experimental results and self-consistent modeling, Mater. Des. 55 (2014) 888–897. doi:10.1016/J.MATDES.2013.10.062.
[4] M. Steenbergen, R. Dollevoet, On the mechanism of squat formation on train rails – Part I: Origination, Int. J. Fatigue. 47 (2013) 361–372. doi:10.1016/J.IJFATIGUE.2012.04.023.
[5] M. Steenbergen, R. Dollevoet, On the mechanism of squat formation on train rails – Part II: Growth, Int. J. Fatigue. 47 (2013) 373–381. doi:10.1016/J.IJFATIGUE.2012.04.019.
[6] R.I. Carroll, J.H. Beynon, Rolling contact fatigue of white etching layer: Part 1: Crack morphology, Wear. 262 (2007) 1253–1266. doi:10.1016/J.WEAR.2007.01.003.
[7] R.I. Carroll, J.H. Beynon, Rolling contact fatigue of white etching layer: Part 2. Numerical results, Wear. 262 (2007) 1267–1273. doi:10.1016/J.WEAR.2007.01.002.
[8] J. Takahashi, K. Kawakami, M. Ueda, Atom probe tomography analysis of the white etching layer in a rail track surface, Acta Mater. 58 (2010) 3602–3612. doi:10.1016/J.ACTAMAT.2010.02.030.
[9] J. Wu, R.H. Petrov, S. Kölling, P. Koenraad, L. Malet, S. Godet, J. Sietsma, Micro and Nanoscale Characterization of Complex Multilayer-Structured White Etching Layer in Rails, Met. . 8 (2018). doi:10.3390/met8100749.
[10] S.B. Newcomb, W.M. Stobbs, A transmission electron microscopy study of the white-etching layer on a rail head, Mater. Sci. Eng. 66 (1984) 195–204. doi:10.1016/0025-5416(84)90180-0.
[11] G. Baumann, H.J. Fecht, S. Liebelt, Formation of white-etching layers on rail treads, Wear. 191 (1996) 133–140. doi:10.1016/0043-1648(95)06733-7.
[12] J. Wu, R.H. Petrov, M. Naeimi, Z. Li, R. Dollevoet, J. Sietsma, Laboratory simulation of martensite formation of white etching layer in rail steel, Int. J. Fatigue. 91 (2016) 11–20. doi:10.1016/J.IJFATIGUE.2016.05.016.
[13] A. Pyzalla, L. Wang, E. Wild, T. Wroblewski, Changes in microstructure, texture and residual stresses on the surface of a rail resulting from friction and wear, Wear. 251 (2001) 901–907. doi:10.1016/S0043-1648(01)00748-7.
[14] L. Wang, A. Pyzalla, W. Stadlbauer, E.. Werner, Microstructure features on rolling surfaces of railway
32

rails subjected to heavy loading, Mater. Sci. Eng. A. 359 (2003) 31–43. doi:10.1016/S0921-5093(03)00327-7.
[15] H.W. Zhang, S. Ohsaki, S. Mitao, M. Ohnuma, K. Hono, Microstructural investigation of white etching layer on pearlite steel rail, Mater. Sci. Eng. A. 421 (2006) 191–199. doi:10.1016/J.MSEA.2006.01.033.
[16] W. Österle, H. Rooch, A. Pyzalla, L. Wang, Investigation of white etching layers on rails by optical microscopy, electron microscopy, X-ray and synchrotron X-ray diffraction, Mater. Sci. Eng. A. 303 (2001) 150–157. doi:10.1016/S0921-5093(00)01842-6.
[17] W. Lojkowski, M. Djahanbakhsh, G. Bürkle, S. Gierlotka, W. Zielinski, H.-J. Fecht, Nanostructure formation on the surface of railway tracks, Mater. Sci. Eng. A. 303 (2001) 197–208. doi:10.1016/S0921-5093(00)01947-X.
[18] J. Ahlström, B. Karlsson, Microstructural evaluation and interpretation of the mechanically and thermally affected zone under railway wheel flats, Wear. 232 (1999) 1–14. doi:10.1016/S0043-1648(99)00166-0.
[19] S. Li, J. Wu, R.H. Petrov, Z. Li, R. Dollevoet, J. Sietsma, “Brown etching layer”: A possible new insight into the crack initiation of rolling contact fatigue in rail steels?, Eng. Fail. Anal. 66 (2016) 8–18. doi:10.1016/J.ENGFAILANAL.2016.03.019.
[20] A. Al-Juboori, H. Zhu, D. Wexler, H. Li, C. Lu, A. McCusker, J. McLeod, S. Pannila, J. Barnes, Evolution of rail surface degradation in the tunnel: The role of water on squat growth under service conditions, Eng. Fract. Mech. 209 (2019) 32–47. doi:10.1016/J.ENGFRACMECH.2019.01.018.
[21] M. Messaadi, M. Steenbergen, Stratified surface layers on rails, Wear. 414–415 (2018) 151–162. doi:10.1016/J.WEAR.2018.07.019.
[22] R.S. Tahany Ibrahim El-Wardany, Sergei F. Burlatsky, Changsheng GuoWayde, Control of white-etched layer during machining, US7827661B2, 2008. https://patents.google.com/patent/US7827661.
[23] Y. V Ivanisenko, R.Z. Valiev, W. Lojkowski, A. Grob, H.-J. Fecht, Nanostructure Formation and Carbides Dissolution in Rail Steel Deformed by High Pressure Torsion, Ultrafine Grained Mater. II. (2013). doi:doi:10.1002/9781118804537.ch6.
[24] S.B. Hosseini, U. Klement, Y. Yao, K. Ryttberg, Formation mechanisms of white layers induced by hard turning of AISI 52100 steel, Acta Mater. 89 (2015) 258–267. doi:10.1016/J.ACTAMAT.2015.01.075.
[25] F.D. Fischer, W. Daves, E.A. Werner, On the temperature in the wheel–rail rolling contact, Fatigue Fract. Eng. Mater. Struct. 26 (2003) 999–1006.
[26] J.-M. Bergheau, R. Fortunier, Finite element simulation of heat transfer, John Wiley & Sons, 2013.
[27] F. Vurpillot, B. Gault, B.P. Geiser, D.J. Larson, Reconstructing atom probe data: A review, Ultramicroscopy. 132 (2013) 19–30. doi:10.1016/j.ultramic.2013.03.010.
[28] B. Gault, M.P. Moody, J.M. Cairney, S.P. Ringer, Atom probe microscopy, Springer Science & Business Media, 2012.
[29] M. Herbig, P. Choi, D. Raabe, Combining structural and chemical information at the nanometer scale by correlative transmission electron microscopy and atom probe tomography, Ultramicroscopy. 153 (2015) 32–39. doi:10.1016/J.ULTRAMIC.2015.02.003.
[30] M. Herbig, Spatially correlated electron microscopy and atom probe tomography: Current possibilities and future perspectives, Scr. Mater. 148 (2018) 98–105. doi:10.1016/J.SCRIPTAMAT.2017.03.017.
[31] A. Rovira, A. Roda, M.B. Marshall, H. Brunskill, R. Lewis, Experimental and numerical modelling of wheel–rail contact and wear, Wear. 271 (2011) 911–924. doi:10.1016/J.WEAR.2011.03.024.
[32] & P.B.K. K. D. Vo, A. K. Tieu, H. T. Zhu, A Tool To Estimate The Wheel/rail Contact And Temperature Rising Under Dry, Wet And Oily Conditions, WIT Press, 2014. doi:http://dx.doi.org/10.2495/CR140151.
[33] M. Ertz, K. Knothe, A comparison of analytical and numerical methods for the calculation of temperatures in wheel/rail contact, Wear. 253 (2002) 498–508. doi:10.1016/S0043-1648(02)00120-5.
33

[34] F.D. Fischer, E. Werner, K. Knothe, The Surface Temperature of a Halfplane Heated by Friction and Cooled by Convection, ZAMM - J. Appl. Math. Mech. / Zeitschrift Für Angew. Math. Und Mech. 81 (2001) 75–81. doi:10.1002/1521-4001(200102)81:2<75::AID-ZAMM75>3.0.CO;2-H.
[35] E.B. Hawbolt, B. Chau, J.K. Brimacombe, Kinetics of austenite-pearlite transformation in eutectoid carbon steel, Metall. Trans. A. 14 (1983) 1803–1815. doi:10.1007/BF02645550.
[36] J. Pacyna, The microstructure and properties of the new bainitic rail steels, J. Achiev. Mater. Manuf. Eng. 28 (2008) 19–22.
[37] W. Wei-yong, L. Bing, K. Venkatesh, Effect of Temperature on Strength and Elastic Modulus of High-Strength Steel, J. Mater. Civ. Eng. 25 (2013) 174–182. doi:10.1061/(ASCE)MT.1943-5533.0000600.
[38] C. Ju, Y. Ben, U. Brian, Behavior of High Strength Structural Steel at Elevated Temperatures, J. Struct. Eng. 132 (2006) 1948–1954. doi:10.1061/(ASCE)0733-9445(2006)132:12(1948).
[39] J. Chen, B. Young, Design of high strength steel columns at elevated temperatures, J. Constr. Steel Res. 64 (2008) 689–703. doi:10.1016/J.JCSR.2007.09.004.
[40] J. Takahashi, Y. Kobayashi, M. Ueda, T. Miyazaki, K. Kawakami, Nanoscale characterisation of rolling contact wear surface of pearlitic steel, Mater. Sci. Technol. 29 (2013) 1212–1218. doi:10.1179/1743284713Y.0000000256.
[41] S. Zaefferer, N.-N. Elhami, Theory and application of electron channelling contrast imaging under controlled diffraction conditions, Acta Mater. 75 (2014) 20–50. doi:10.1016/J.ACTAMAT.2014.04.018.
[42] S.K. Makineni, A. Kumar, M. Lenz, P. Kontis, T. Meiners, C. Zenk, S. Zaefferer, G. Eggeler, S. Neumeier, E. Spiecker, D. Raabe, B. Gault, On the diffusive phase transformation mechanism assisted by extended dislocations during creep of a single crystal CoNi-based superalloy, Acta Mater. 155 (2018) 362–371. doi:10.1016/J.ACTAMAT.2018.05.074.
[43] Q. Liu, D. Juul Jensen, N. Hansen, Effect of grain orientation on deformation structure in cold-rolled polycrystalline aluminium, Acta Mater. 46 (1998) 5819–5838. doi:10.1016/S1359-6454(98)00229-8.
[44] E. Girault, P. Jacques, P. Harlet, K. Mols, J. Van Humbeeck, E. Aernoudt, F. Delannay, Metallographic Methods for Revealing the Multiphase Microstructure of TRIP-Assisted Steels, Mater. Charact. 40 (1998) 111–118. doi:10.1016/S1044-5803(97)00154-X.
[45] G.F. Vander Voort, E.P. Manilova, Hints for Imaging Phases in Steels-How-to article covers ways to improve the visibility and identification of" white-etching phases"--Ferrite, delta ferrite, cementite, and retained austenite--, Adv. Mater. Process. 163 (2005) 32–38.
[46] R. Wu, A.J. Freeman, G.B. Olson, Effects of carbon on Fe-grain-boundary cohesion: First-principles determination, Phys. Rev. B. 53 (1996) 7504.
[47] P. Lejček, S. Hofmann, Thermodynamics and structural aspects of grain boundary segregation, Crit. Rev. Solid State Mater. Sci. 20 (1995) 1–85. doi:10.1080/10408439508243544.
[48] J. Takahashi, M. Kosaka, K. Kawakami, T. Tarui, Change in carbon state by low-temperature aging in heavily drawn pearlitic steel wires, Acta Mater. 60 (2012) 387–395. doi:10.1016/J.ACTAMAT.2011.09.014.
[49] J. Languillaume, G. Kapelski, B. Baudelet, Cementite dissolution in heavily cold drawn pearlitic steel wires, Acta Mater. 45 (1997) 1201–1212. doi:10.1016/S1359-6454(96)00216-9.
[50] X. Sauvage, J. Copreaux, F. Danoix, D. Blavette, Atomic-scale observation and modelling of cementite dissolution in heavily deformed pearlitic steels, Philos. Mag. A. 80 (2000) 781–796. doi:10.1080/01418610008212082.
[51] L. Zhou, G. Liu, X.L. Ma, K. Lu, Strain-induced refinement in a steel with spheroidal cementite subjected to surface mechanical attrition treatment, Acta Mater. 56 (2008) 78–87. doi:10.1016/J.ACTAMAT.2007.09.003.
[52] M. Umemoto, Y. Todaka, K. Tsuchiya, Mechanical Properties of Cementite and Fabrication of Artificial Pearlite, Mater. Sci. Forum. 426–432 (2003) 859–864. doi:10.4028/www.scientific.net/MSF.426-432.859.
34
[53] A.V. Korznikov, Y.V. Ivanisenko, D.V. Laptionok, I.M. Safarov, V.P. Pilyugin, R.Z. Valiev, Influence of severe plastic deformation on structure and phase composition of carbon steel, Nanostructured Mater. 4 (1994) 159–167. doi:10.1016/0965-9773(94)90075-2.
[54] G.A. Nematollahi, B. Grabowski, D. Raabe, J. Neugebauer, Multiscale description of carbon-supersaturated ferrite in severely drawn pearlitic wires, Acta Mater. 111 (2016) 321–334. doi:10.1016/J.ACTAMAT.2016.03.052.
[55] A. Vehanen, P. Hautojärvi, J. Johansson, J. Yli-Kauppila, P. Moser, Vacancies and carbon impurities in $\ensuremath{\alpha}$- iron: Electron irradiation, Phys. Rev. B. 25 (1982) 762–780. doi:10.1103/PhysRevB.25.762.
[56] A.H. Cottrell, B.A. Bilby, Dislocation theory of yielding and strain ageing of iron, Proc. Phys. Soc. Sect. A. 62 (1949) 49.
[57] W.G. Johnston, D.F. Stein, Stress dependence of dislocation velocity inferred from strain rate sensitivity, Acta Metall. 11 (1963) 317–318.
[58] X. Jiang, X. Li, X. Li, S. Cao, Rail fatigue crack propagation in high-speed wheel/rail rolling contact, J. Mod. Transp. 25 (2017) 178–184. doi:10.1007/s40534-017-0138-6.
[59] J.R.G. da Silva, R.B. McLellan, Diffusion of carbon and nitrogen in B.C.C. iron, Mater. Sci. Eng. 26 (1976) 83–87. doi:10.1016/0025-5416(76)90229-9.
[60] F.J. Humphreys, A unified theory of recovery, recrystallization and grain growth, based on the stability and growth of cellular microstructures—I. The basic model, Acta Mater. 45 (1997) 4231–4240. doi:10.1016/S1359-6454(97)00070-0.
[61] A. Danon, C. Servant, A. Alamo, J.. Brachet, Heterogeneous austenite grain growth in 9Cr martensitic steels: influence of the heating rate and the austenitization temperature, Mater. Sci. Eng. A. 348 (2003) 122–132. doi:10.1016/S0921-5093(02)00632-9.
35