Delft University of Technology Consumer Heterogeneity...
117
Delft University of Technology Consumer Heterogeneity, Transport and the Environment Araghi, Yashar DOI 10.4233/uuid:f943d71a-148d-4bb4-804c-a7a9904ed4bb Publication date 2017 Document Version Final published version Citation (APA) Araghi, Y. (2017). Consumer Heterogeneity, Transport and the Environment. https://doi.org/10.4233/uuid:f943d71a-148d-4bb4-804c-a7a9904ed4bb Important note To cite this publication, please use the final published version (if applicable). Please check the document version above. Copyright Other than for strictly personal use, it is not permitted to download, forward or distribute the text or part of it, without the consent of the author(s) and/or copyright holder(s), unless the work is under an open content license such as Creative Commons. Takedown policy Please contact us and provide details if you believe this document breaches copyrights. We will remove access to the work immediately and investigate your claim. This work is downloaded from Delft University of Technology. For technical reasons the number of authors shown on this cover page is limited to a maximum of 10.
Transcript of Delft University of Technology Consumer Heterogeneity...

Delft University of Technology
Consumer Heterogeneity, Transport and the Environment
Araghi, Yashar
DOI10.4233/uuid:f943d71a-148d-4bb4-804c-a7a9904ed4bbPublication date2017Document VersionFinal published version
Citation (APA)Araghi, Y. (2017). Consumer Heterogeneity, Transport and the Environment.https://doi.org/10.4233/uuid:f943d71a-148d-4bb4-804c-a7a9904ed4bb
Important noteTo cite this publication, please use the final published version (if applicable).Please check the document version above.
CopyrightOther than for strictly personal use, it is not permitted to download, forward or distribute the text or part of it, without the consentof the author(s) and/or copyright holder(s), unless the work is under an open content license such as Creative Commons.
Takedown policyPlease contact us and provide details if you believe this document breaches copyrights.We will remove access to the work immediately and investigate your claim.
This work is downloaded from Delft University of Technology.For technical reasons the number of authors shown on this cover page is limited to a maximum of 10.

Consumer Heterogeneity, Transport and the
Environment
Yashar Araghi
Delft University of Technology

Cover illustration by Ian Alexander

Consumer Heterogeneity, Transport and the
Environment
Proefschrift
ter verkrijging van de graad van doctor
aan de Technische Universiteit Delft,
op gezag van de Rector Magnificus Prof. ir. K.C.A.M. Luyben,
voorzitter van het College voor Promoties,
in het openbaar te verdedigen op maandag 29 mei 2017 om 15:00 uur
door
Yashar ARAGHI
Ingenieur Technische Bestuurskunde,
Technische Universiteit Delft,
geboren te Zanjan, Iran.

Dit proefschrift is goedgekeurd door de:
Promotor: Prof. dr. G.P. van Wee
Copromotor: Dr. ir. M. Kroesen
Samenstelling van de promotiecommissie:
Rector Magnificus chairperson
Prof. dr. G.P. van Wee promotor
Dr. ir. M. Kroesen copromotor
Onafhankelijke leden:
Prof. dr. ir. P.M. Herder TU Delft
Prof. dr. ir. W.A.H. Thissen TU Delft
Prof. dr. H.J. Meurs Radboud Universiteit
Prof. dr. C.C. Koopmans VU University Amsterdam
Dr. G. Burghouwt University of Amsterdam
TRAIL Thesis Series no. T2017/5, the Netherlands Research School TRAIL
TRAIL
P.O. Box 5017
2600 GA Delft
The Netherlands
E-mail: [email protected]
ISBN: 978-90-5584-223-0
Copyright © 2017 by Yashar Araghi
All rights reserved. No part of the material protected by this copyright notice may be
reproduced or utilized in any form or by any means, electronic or mechanical, including
photocopying, recording or by any information storage and retrieval system, without written
permission from the author.
Printed in the Netherlands

Dedicated to Vahideh,
my beloved wife (and companion). Without her support and encouragements this work would not have existed!


i
Preface
The journey of a PhD candidate is a long and often vague one. From the first day nothings is
fully defined or planned. But having a good supervising team is the part that the candidates
can really benefit from to help steer through the unchartered waters. I thankfully had that
supervisory team and I enjoyed working with Maarten Kroesen and Bert van Wee during my
PhD years. Bert and Maarten, I will never forget your support, intellectual backing,
availability and fast responses to my questions and requests.
Writing journal papers and getting the papers accepted is another task for PhD candidates,
which has its own unwritten “rules of the game”. Again, getting fast responses from the
reviewers and the journal editors is very helpful to cruise through the PhD journey faster. I
would like to thank those anonymous reviewers that helped to upgrade the journal articles.
Finally, writing a thesis based on bundle of journal papers is by itself a challenge, since
making a consistent story out of the articles can be difficult. In my case, this was even harder
because I had investigated two cases from two different transport sectors. Therefore, putting
together this thesis does give me a sense of achievement, given the mentioned difficulties and
challenges.
I am grateful for the support of many people who played a role in my research. I would like to
start by thanking Eric Molin with his kind intentions to upgrade the quality of my work and
for his precision. We collaborated on two papers together. I benefitted from comments and
criticism of Caspar Chorus in the choice modelling parts.
During these years I enjoyed working alongside colleagues from Transport & Logistics
section as well as Energy & Industry section. I would like to express my sincere appreciation
to Lori, Diana, Fanchao, Niek, Sander, Jafar, Masoud, Srirama, Esther, Jan Anne, Emile,
Sobhan, Hamed, Bashir and Binod. You all made work and life in TPM better and more
appealing. Next, I want to thank the efficient and friendly secretaries of TLO and TRAIL
research school, Ellen, Betty, Conchita and Esther. You all helped me with various

ii Consumer heterogeneity, transport and the environment
administrative issues and also patiently talked in Dutch with me (upon my request!) to help
me to use the language with more confidence.
Hereby, I want to remember and pay my respect to Gerard Dijkema for his trust in me and
providing research projects that challenged my ability to put the methods I learned, into
practice. This really helped me gain valuable work experience. I am truly sad that we lost him
so early and I pray for his soul to rest in peace. Afterwards, I was supported by Paulien and
she kindly provided the means for the continuation of my research work, I am really thankful
for her leadership.
My parents, Fatemeh and Mohammad, brother Peyman and sister Sanaz, you were always
supportive and you encouraged me to continue my education and obtain this prestigious
degree. I thank you for your support throughout all these years and I wish health and joy for
you all.
Last but certainly not least, my dear Amineh (who I call at home Vahideh), I cannot express
how much I appreciate your support and your companionship. During these years you gave
high priority to my research and you shared many invaluable experiences of your own PhD
journey with me. Your presence and your great thoughts and deep insights into different
matters in life is always heart-warming and I cherish your great wisdom and spirit!
Yashar Araghi
Delft, May 2017

iii
Content
1. Introduction ............................................................................................................................ 1
1.1. Background on transport related emissions .............................................................................................. 1
1.2. Research focus and knowledge gaps ........................................................................................................ 2
1.3 The societal and policy relevance ............................................................................................................. 5
1.3.1 Passenger airline industry ....................................................................................................................... 5
1.3.2. Historic road vehicles ............................................................................................................................ 5
1.4. Research objectives .................................................................................................................................. 6
1.5. Research questions ................................................................................................................................... 7
1.6. Methods and theories ............................................................................................................................... 8
References ..................................................................................................................................................... 10
2. Do social norms regarding carbon offsetting affect individual preferences towards this
policy? Results from a stated choice experiment ..................................................................... 13
Abstract ......................................................................................................................................................... 13
2.1. Introduction ............................................................................................................................................ 14
2.2. Research background ............................................................................................................................. 15
2.2.1. Social norms and behaviour ................................................................................................................ 15
2.2.2. Airline environmental policies ............................................................................................................ 15
2.3. Methodology .......................................................................................................................................... 16
2.3.1. Survey and experimental design .......................................................................................................... 16
2.3.2. Respondents ........................................................................................................................................ 18
2.3.3. Estimation procedure ........................................................................................................................... 19
2.4. Results .................................................................................................................................................... 19
2.5. Practical implications ............................................................................................................................. 21
Acknowledgement ......................................................................................................................................... 22
References ..................................................................................................................................................... 22
3. Revealing heterogeneity in air travellers’ responses to passenger-oriented environmental
policies: a discrete-choice latent class model ........................................................................... 25
Abstract ......................................................................................................................................................... 25
3.1. Introduction ............................................................................................................................................ 26
3.2. Modelling approach ................................................................................................................................ 26
3.3. Data and model estimation ..................................................................................................................... 28
3.3.1.The survey ............................................................................................................................................ 28

iv Consumer heterogeneity, transport and the environment
3.3.2. Participants .......................................................................................................................................... 29
3.3.3. Model estimation ................................................................................................................................. 30
3.4. Results .................................................................................................................................................... 30
3.4.1. The baseline (multinomial logit) model .............................................................................................. 30
3.4.2. The discrete-choice LCM .................................................................................................................... 31
3.5. Discussion and policy implications ........................................................................................................ 35
3.6. Conclusion .............................................................................................................................................. 36
References ..................................................................................................................................................... 37
4. Historic vehicles: an overview from a transport policy perspective .................................. 41
Abstract ......................................................................................................................................................... 41
4.1. Introduction ............................................................................................................................................ 41
4.2. Definition of HVs, trends in supply and demand, and the policy discourse on HVs ............................. 43
4.2.1. Definition ............................................................................................................................................ 43
4.2.2. Trends in supply .................................................................................................................................. 43
4.2.3. The policy discourse ............................................................................................................................ 44
4.3. Methodology in obtaining the sources of data .................................................................................... 44
4.4. HV numbers, types and year of manufacture ..................................................................................... 45
4.4.1. HVs in numbers ................................................................................................................................... 45
4.4.2. Breakdown of HVs by type ................................................................................................................. 46
4.4.3. Breakdown HVs by year of manufacture ............................................................................................ 46
4.5. HV use .................................................................................................................................................... 47
4.5.1. Average Kilometres driven by HVs (mileage) .................................................................................... 47
4.5.2. The share of older vehicles still in use ............................................................................................... 48
4.6. Environmental impacts of HVs .............................................................................................................. 49
4.6.1. Vehicle Emissions ............................................................................................................................... 49
4.6.2. Noise ................................................................................................................................................... 52
4.7. Safety impacts .................................................................................................................................... 52
4.8. Congestion impacts ............................................................................................................................ 54
4.9. Positive effects of HVs ....................................................................................................................... 54
4.9.1. Social effects ...................................................................................................................................... 54
4.9.2. Economic effects ................................................................................................................................. 55
4.10. Conclusion and gaps in literature ....................................................................................................... 55
4.10.1. Conclusions ................................................................................................................................. 55
4.10.2. Direction for future research ........................................................................................................ 57
Acknowledgment .......................................................................................................................................... 58
References ..................................................................................................................................................... 58
5. Identifying reasons for historic car ownership and use and policy implications: an
explorative latent class analysis ............................................................................................... 61
Abstract ......................................................................................................................................................... 61
5.1. Introduction ............................................................................................................................................ 62
5.2. Brief literature overview ........................................................................................................................ 63

Content v
5.3. Methodology .......................................................................................................................................... 65
5.4.1. Descriptive statistics ............................................................................................................................ 66
5.4.2. The latent class model ......................................................................................................................... 68
5.5. Discussion and conclusion ..................................................................................................................... 71
Acknowledgement ......................................................................................................................................... 73
References ..................................................................................................................................................... 73
6. Conclusion, policy recommendation and avenue for future research .................................. 75
6.1. Answers to research questions ............................................................................................................... 75
6.2. Policy recommendation .......................................................................................................................... 80
6.3. Avenues for future research ................................................................................................................... 81
6.3.1. Application of follow-up methods on consumer heterogeneity .......................................................... 82
6.3.2. Revealing user heterogeneity on transport and non-transport studies ................................................. 82
6.4. Reflections .............................................................................................................................................. 83
References ..................................................................................................................................................... 83
Summary .................................................................................................................................. 85
References ..................................................................................................................................................... 90
Samenvatting ............................................................................................................................ 93
Referenties ..................................................................................................................................................... 99
About the author ..................................................................................................................... 101
TRAIL Thesis Series .............................................................................................................. 103

vi Consumer heterogeneity, transport and the environment

1
1. Introduction
1.1 . Background on transport related emissions
Transport is a crucial aspect of every society. Transport enables the movements of passengers,
goods and services to destinations. An efficient and reliable transport system is associated
with low travel times and costs, which increases productivity and ultimately contributes to
economic growth (Mačiulis et al., 2009). However, there are downsides to transport, such as:
CO2 and non-CO2 (polluting) emissions, noise emissions, casualties from accidents and
changes of landscapes due to transport infrastructure, to name a few.
In 2015, the International Energy Agency (IEA) announced that 23% of the global CO2
emissions were related to transport, making it the second largest contributor after electricity
and heat generation. Transport related emission growth has been very significant over the past
25 years, despite numerous attempts to mitigate it. In 1990, a total of 4.6 GtCO2 was produced
by various transport modes. This figure rose to 7.5 GtCO2 in 2013, a sizable 63% growth in
CO2 emissions over this period (IEA, 2015a). Moreover, the emissions are not confined to
CO2. The polluting substances emitted by transport modes include: nitrogen oxides, sulphur
compounds and unburnt hydrocarbons (reducing ozone O3), methane (CH4), and particulate
matter (e.g. soot) among the well-known ones (Lee et al., 2010; Burkhardt & Kärcher, 2011;
Krammer et al., 2013).
In a world where the trend is towards stabilization of CO2 emissions, growing transport
related emissions mean that this sector will have an ever larger share in global discharge of
CO2 (and other harmful products). One of the underlying reasons is the heavy dependence of
transport on fossil based fuels. For instance, 92% of energy required for US transport is
obtained from fossil fuel products (Davis et al., 2015) and 75% of the transport related
emissions come from road transport, meanwhile, the stock of electric vehicles for passenger
transport was only 0.08% in 2015 (IEA, 2015b).

2 Consumer heterogeneity, transport and the environment
With respect to civil aviation, CO2 emissions in EU alone, have increased by 85% between
1990 and 2004. Moreover, other pollutants such as nitrogen oxides, sulphur dioxide, soot and
water vapour have been increasingly emitted to the atmosphere with little known impacts on
the climate (Anger, 2010b). However, there are only very few alternatives in aviation to
replace fossil fuel based aircraft engines. There are talks about hydrogen fuels and electric
powered planes (see further references in an article by Kivits et al., 2010), but the only
practical replacement for fossil based jet fuel is bio-fuel, which is currently used
experimentally in test flights and is not close to mass consumption by commercial airliners
(Köhler et al. 2014; Cremonez et al. 2015). Even if bio-fuels would be used at a large scale in
aviation, they are not totally emission free and to some extend contribute to emissions as well.
Therefore, these alternatives do not genuinely count as a true clean alternative for aviation
(Sims et al. 2010).
Thus, one of the important dilemmas facing the decision makers in transport sector is to
reduce the increasing share of transport related emissions, while minimizing unintended
economic impacts.
1.2. Research focus and knowledge gaps
In the absence of comprehensive measures that would cover all transport modes (Hoen et al.,
2014), policy analysts and scholars have tried various (top-down) policy measures to reduce
the CO2 emission of transport. A few examples can be given such as: the introduction of
emissions trade schemes in the European aviation sector, or air pollution tax on road transport
(Tiwari & Mohan, 2016), emission regulations issued by (inter)national governments (e.g. EU
commission, US or UK transport departments), increased spending on public transport, etc.
However, the rapid growth of transport has outperformed mitigating policies and in current
times we observe even higher CO2 emissions compared with past decades (Pietzcker et al.,
2014).
To stabilize the CO2 emissions there is the need for transport operators (e.g. air carriers, road
forwarders, shippers, train operators, etc.) and vehicle manufacturers (e.g. auto manufacturers,
aircraft makers and shipbuilders) to comply with mitigating policies as well as their clients:
the passengers and private vehicles owners. In this thesis, I will focus on the latter category,
the passenger and private owner side. I will investigate which emission mitigation policies
may have better chance of compliance and thus offer attractive options for reduction of
emissions.
To test the success factors of mitigating policies among transport consumers, one needs to
appreciate the heterogeneity among them and apprehend their preferences regarding the
selected policies. Thus revealing heterogeneity and understanding the preferences among
people enables the analyst to understand motivational constructs underlying behaviour
(Boxall & Adamowicz, 2002; Swait, 1994). This notion paves the way to develop (tailored)
policies that offer higher probability for people’s compliance and ultimately higher impact on
emission mitigation. Burnett and Hanson (1982) argue that designing policies for passengers
require tailored policies, targeted at subgroups of people with relevant common preferences
and characteristics. Hence, designing suitable and effective policies primarily requires dealing
with heterogeneity among users of transport modes.
On a further note, Anable (2005), inspired by marketing research, claims that there is no use
in revealing “average consumer” preferences on issues such as car dependence or determining

Chapter 1 – Introduction 3
the “general attitude” on a specific transport policy. Instead, she recommends that “different
people must be treated in different ways because they are motivated by different factors and
are affected in different ways by policy” (Anable, 2005; pp 66).
The main passenger transport modes are: cars, trains, ships and aircrafts. As discussed above,
the core of this thesis is to investigate transport-related emissions from a passenger
perspective. Rail transport is one of the least polluting modes of transport (per passenger
kilometre) (Hoen et al., 2014; Chapman, 2007). On the other hand, passenger transport via air
has been growing rapidly in recent decades; see figures below. The fierce competition among
airlines has resulted in lower airfares and this has stimulated growth. Consequently, air travel
emissions are becoming highly concerning. What is more alarming is that the impact of
aircraft emissions in upper layers of atmosphere is significantly worse in comparison with
emissions of road transport on land (Lee et al., 2009). Another reason is that aviation has
fewer technological options to become less polluting (citation). Due to the urgency and
importance of air travel emissions I choose to study this transport mode and possible
contributions from passengers’ side.
The other remaining mode of transport is the car. It is the mode with the highest absolute
emissions among the main transport modes. Transport policy academics have consequently
and extensively addressed the emission problems caused by road transport (Johansson, 2003;
Potter, 2003; Chapman, 2007). However, historic vehicles as a growing part of road transport,
still remains as one of the category of vehicles (within road transport) that has received hardly
any attention in the transport literature. Therefore, HVs were included as the other domain
topic to be investigated under the main theme of this thesis.
Civil air transport has grown rapidly due to large demand pull (for instance a 38% growth in
passenger traffic between 2000 to 2007 (Lee et al., 2009)) and falling oil prices which makes
air travel even more affordable. The strong growth in passenger numbers (5.3 % based on
IATA figures in 2016) in air transport is also related closely to the more interconnected global
economy. Figure 1.1 shows the revenue passenger kilometre (RPK1) in previous decade up to
2015, estimated by the International Civil Aviation Organization (ICAO), which is specialized
agency of United Nations for managing the administration and governance of the Convention
1 Revenue passenger kilometre is a standard measure, frequently used in airline industry, that reflects on the volume of passengers carried
and the distance travelled.
Figure 1.1 RPK growth in last decade up to 2015, source: ICAO (2015)

4 Consumer heterogeneity, transport and the environment
on International Civil Aviation. RPK is the common determinant of the passenger growth rate
in the aviation industry (ICAO, 2015).
The Industry has responded to this demand by increasing the capacity and frequency of
flights. As a consequence, over the past 20 years, the global CO2 emission from civil aviation
has increased by more than 50% (Sgouridis et al., 2011). This rapid increase of air transport
emissions has occurred despite the fact that new aircrafts emit significantly less emissions
than those built 20 years ago (see Figure 1.2).
The literature on environmental policies for air transport covers mainly carbon offsetting
policies, reduction of emission in airline operations (by designing new flight routes), and
technological advancements in aircraft design (e.g. Anger & Köhler, 2010a; Lee et al, 2009;
Sgouridis et al., 2011). Only limited attention has been given to the passenger preferences in
airline industry with respect to carbon offsetting policies (e.g. Gössling et al., 2009;
MacKerron et al., 2009; Lu & Shon, 2012), but identifying heterogeneity among passengers
with respect to airline environmental policies is a clear gap in the literature that will be
covered in this thesis.
Figure 1.2 Reduction in fuel consumption per 100 RPK since 1987 until 2030, source:
Nygren (2009)
Historic vehicles (HVs2) are the heritage of road transport. Transport literature has extensively
covered the impact of road transport on the environment (see Spellerberg, (1998) and
Chapman, (2007) for literature reviews). Road vehicles emit 75% of total transport related
CO2 emissions worldwide (IEA, 2015a). However, most mitigating policies and regulatory
measures apply to new vehicles entering the market and there is hardly any policy attention
paid to vehicles once they are in use. The need to design policies for used vehicles is
especially more necessary for those that live longer and become historic vehicles.
The current policy discourse on historic vehicles is lacking substance in addressing the main
environmental concerns and existing policies are sometimes contradictory, as we will see later
(chapter 4). The lack of available scholarly material in the field of historic vehicles presents a
clear gap in literature. Furthermore, the potential societal problems and benefits of historic
road vehicles have not been addressed in the literature, which will also be discussed in this
2 Throughout this thesis I abbreviate historic vehicles as HVs and historic vehicle as HV.

Chapter 1 – Introduction 5
thesis (chapter 4). Furthermore, by empirically identifying the existing heterogeneity among
HV users, I discuss the potential environmental policy relevance of specific sub-segments
among HV users.
1.3 The societal and policy relevance
On the societal and policy front a common objective is followed throughout the thesis for the
two sectors, namely to contribute to the design of policies aimed at reducing or mitigating
environmental impacts by understanding (heterogeneity in) consumers’ preferences and
behaviours. Below, I will further discuss the societal and policy relevance of the topic of this
thesis.
1.3.1 Passenger airline industry
The aviation industry can play a great role in moving freights and passengers faster and safer,
contributing to economic and social benefits. Despite these advantages, the airline industry is
polluting the atmosphere and the local environment because of noise, polluting, and
greenhouse gas emissions. Thus, finding tangible solutions for emission problems has become
an important social issue.
The airline policy literature has mainly emphasized on schemes such as Voluntary Carbon
Offsetting (VCO) and EU Emission Trade System (EU ETS) to deal with airline pollution
problems. In this research, I try to assess alternative policies which provide additional
possibilities in reduction of emissions in the aviation industry.
Beside VCO policy, at least two policies can potentially offer credible reductions in airline
emissions, namely: a) the introduction of effective airline efficiency labelling systems and b)
voluntary reduction of luggage by offering discounts on ticket prices. I focus on the attitudes
and preferences of passengers to devise successful and practical policies with high chance of
passenger compliance in the airline industry.
1.3.2. Historic road vehicles
HVs resemble the cultural heritage of road transport. Many enthusiasts enjoy watching,
collecting and driving them (Tam-Scott, 2009). HVs have beneficial economic impact by
creating revenues for various businesses and providing jobs (Frost & Hart, 2006).
Furthermore, HVs play a noticeable and symbolic role in social gatherings (e.g. wedding
ceremonies) and monumental events (e.g. national days). However, the significantly higher air
pollution emissions of older vehicles (Zachariadis, Ntziachristos, & Samaras, 2001) and lower
safety records (Robertson, 1981) compared with modern vehicles often compel policy makers
to take action against the use of HVs. This approach by policy makers can threaten the future
existence of HVs.
Given the conflicting views of public and policy makers towards HVs, they are an interesting
category of vehicles to be studied in policy research perspective. Nevertheless, HVs have
hardly received research attention from scholars (Koshar, 2004), and only sporadically from
interest groups.

6 Consumer heterogeneity, transport and the environment
Steg (2005) reports several motives for car use and ownership and emphasises the importance
of identifying these motives of different “specific target groups” in society. She recommends
designing transport policies based on revealed motives of user groups in society. In this way,
policy measures would have more impact on socially relevant goals (Steg, 2005). Based on
these recommendations, and the fact that motives for HV owners have not yet been studied, I
aim to identify them in this thesis.
1.4. Research objectives
Above, I discussed the importance of revealing heterogeneity among transport users. This
would provide input for tailored policy designs. Consumer heterogeneity, however, is not
studied well in transport. Congestion pricing (Small & Yan, 2001), valuing of time
(Brownstone et al., 2005) and road pricing (van den Berg, & Verhoef, 2011) are examples of
areas in which heterogeneity of consumers has been studied frequently and results emphasise
its importance for evaluating policies.
In the past, socio-demographic variables have been used to reveal heterogeneity. However,
Anable (2005) and Haustein (2012) are among scholars that argue socio-demographic
variables alone do not provide enough input for distinguishing different types of relevant
consumer profiles. They suggest that attitudinal variables must be used in addition to socio-
demographic variables to provide more meaningful segments, which are actionable from a
policy perspective.
In the airline related study, I explore the choices of airline passengers on several airline
environmental policies, namely: voluntary carbon offsetting (VCO) policy, baggage
allowance policy and airline eco-efficiency index. Previous works primarily focus on VCO
schemes and passengers’ willingness to pay for offsetting emissions caused by their air travel.
In practice, however, offsetting policy has not gained much popularity among passengers
since the participation rates are only in the range of two to ten percent (Gössling et al., 2009;
Mair, 2011).
Here I test the idea that the collective participation rate in carbon offsetting may positively
influences passengers’ willingness to participate in such schemes. Participation rate at VCO
policy is introduced to passengers as a social norm. The aim is to test if people’s willing to
contribute is impacted if others comply as well. In a broader sense and following Nyborg and
Rege (2003), I aim to estimate how socially desired behaviour could affect the collective
participation in VCO policy. I also estimate people’s stated preferences regarding baggage
allowances and an airline eco-efficiency label policy, which are novel policies and rarely
studied in the literature.
In previous decades transport planners were mainly interested in predicting aggregate
passenger’s travel behaviour (Handy, 2012). However, in recent years the attention has been
shifted to understanding individual behaviour. Handy (2012), recommends researchers and
policy makers to aim to understand transport requirements, travel choices, intentions and
preferences of specific segments of population. Following this approach, I focus on airline
passengers and identify segments among them based on their preferences and attitude towards
the three airline environmental policies.

Chapter 1 – Introduction 7
To sum up, the essential items that will be investigated in this thesis with respect to the airline
part are:
Capturing passenger preferences on the three airline environmental policies
Estimating the impact of social norms on passenger preferences towards VCO policy
Revealing the heterogeneity among passengers based on preference and attitude
towards environmental policies
With respect to the historic vehicles, little is known about their contribution to emissions and
other impacts. This lack of knowledge calls for further research. Second, the literature on
assessing heterogeneity among the users of both sectors is not well developed. The benefits of
revealing heterogeneity among users of these two transport modes (and generally in every
transport mode) is to obtain insights into common behavioural aspects and preferences of
subgroups of users. Based on commonalities that are found in our study we can provide
recommendation for emissions mitigation policies.
In the case of historic vehicles, the academic literature is scars in general and (to the best of
our knowledge) non-existent when it comes to transport policy making on such types of
vehicles. Initially, I try to open an avenue in the literature by providing an overview on HVs
in general with a transport policy focus. First, I will provide some estimates on the number of
HVs available (in European context) and HV mileages on current roads. Then I aim to capture
the existing knowledge regarding historic vehicles on environmental, safety and congestion
issues and assess their possible impacts on the society.
Furthermore I aim to provide a first exploration on reasons for historic vehicle ownership and
use and its policy implications. Given the relevance of historic vehicles from multiple
perspectives such as: cultural heritage, economic, non-instrumental benefits to owners (and
also to the general public) and the environmental concerns for citizens transport policy
makers, it is surprising that there is hardly any academic literature addressing the
heterogeneity among HV enthusiast. In short, with respect to historic vehicle, this thesis aims
to contribute to the literature by focusing on the following issues:
Providing an overview and synthesis on what has been investigated so far on HVs,
focusing on the main transport policy concerns: environment, safety and congestion.
Revealing different types of HV owners and also investigate HV’s contribution to
emissions.
The knowledge generated in the two domains of the thesis provides insights about people’s
behaviour and preferences and the existing differences among segments of the population.
However how to use this knowledge that was generated in the thesis in the context of policy
making or applying to the real world is the ultimate objective of the study.
1.5. Research questions
The research objectives mentioned in previous section brings us to the research questions that
will be addressed in different chapters of this thesis. Some questions deal with the airline
related chapters and some deal with the historic vehicle part. However, the main (principal)
research question (and the answer to it) binds different parts of the thesis together, and will
also convey the fundamental focus of the thesis.

8 Consumer heterogeneity, transport and the environment
The main research question which acts as the overarching topic of this thesis is as follows:
Which segments exist in the two transport domains (airline and historic vehicles) that
are informative with respect to environmental policy making?
With respect to the airline study, I will consider the following sub-questions:
1. What are the preferences of passengers towards airline environmental policies?
2. How do social norms influence individual preferences regarding VCO programs?
3. Which segments regarding airline environmental policies can be identified among
airline passengers?
4. To what extent do attitudes and preferences of airline passengers influence the
membership of the segments?
Regarding the historic vehicles study, the following will be the research sub-questions:
5. What are the impacts of HVs on the environment, safety and congestion?
6. What empirical segments exist among HV owners, leading to environmental policies?
1.6. Methods and theories
To answer the research questions, I take an empirical approach and therefore conduct three
empirical studies and one literature review. The first empirical study addresses questions 1
and 2. In this chapter, I use random utility maximising theory to test the reactions of airline
passengers on environmental policies. This theory is main stream in the transport related
discrete choice literature as described extensively by scholars such as: Ben Akiva et al.
(1985), Louviere et al. (2000), Train (2009) and others.
Previous studies on airline environmental policies primarily focus on willingness to pay for
carbon offsetting. However I will utilise the collective actions and social norms theory,
discussed extensively by Ostrom (2014) among others, and include social pressure and norms
to assess the impact of social norms on utility derived from offsetting. Here I will assess the
idea that the collective participation rate in carbon offsetting may influence passengers’
willingness to participate in such schemes.
The second empirical study addresses questions 3 and 4. This study is (partly) based on same
data as the first study. But attitudes and preferences are included simultaneously to identify
passenger heterogeneity, in this chapter. Previous research (e.g. Pollack and Wales 1992)
have included sociodemographic indicators into the utility function to estimate the preference
heterogeneity among consumer. However, perceptions, attitudes and even social influences
could be sources of heterogeneity. Detecting these heterogeneities and including them in
choices and preferences of consumers (Boxall & Adamowicz, 2002) would be a promising
avenue not only in the economic studies but also in the policy making as well.
Furthermore, following Swait (1994), I include passenger psychometric and attitudinal
indicators as covariates in the class membership function of discrete choice latent class model
(LCM). These models enable me to capture (choice-based) preference heterogeneity and to
provide a richer interpretation of the segments. This is more informative and relevant from a
policy making perspective. Thus, in the case of air transport I purpose to combine stated

Chapter 1 – Introduction 9
preferences of airline passengers on environmental policies with attitudinal indicators on
(carbon) emissions associated with air travel.
Previous airline related studies which use latent class methodology for passenger
segmentation, focus on airline marketing and operations aspects. For instance, Wen & Lai
(2010), and Rezaei et al., (2011) focus on segmenting airline passengers based on their
preferences on service attribute of flight such as: airfare, schedule time difference, flight
frequency, on-time performance, check-in service, in-flight seat space, and cabin crew
service, catering, ground handling, frequent flyer schemes , trip purpose, tour package status
etc. However, I segment passengers based on their preferences and attitudes towards
environmental policy measures which has nothing to do with airline marketing or inflight
catering or services. With this experiment, I try to provide empirical underpinnings to
quantitatively reveal heterogeneity existing among passengers with respect to their approach
on the environmental issues of air travel.
The third study is a literature review of historic vehicles in the context of three main transport
policy issues: congestion, safety and pollution. This will answer the fifth research question.
The significantly higher emissions of older vehicles (Zachariadis, Ntziachristos, & Samaras,
2001) and lower safety records (Robertson, 1981) compared with modern vehicles may
compel policy makers to take action against the use of HVs, which threatens their future
existence. However, historic vehicle are the heritage of road transport and according to EU
directives (e.g. DIRECTIVE 2014/45/EU), should be preserved. In addition, these vehicles do
have economic and cultural benefits to the society which I will cover in this chapter.
The fourth study answers the last (sixth) research question. In this chapter, This chapter
presents an explorative study on a sample of HV owners. Latent class cluster analysis will be
used to explore owners’ heterogeneity to discover segments amongst them with similar
characteristics within each segment and varying characteristics between segments. The
segments will be determined quantitatively, which are based on empirical evidence drawn
from a survey among historic car owners. They will help us identify common characteristics
among different owners in terms of vehicle use and ownership and reveal various motives
behind historic car use, which is an important criterion from a policy perspective.
When the motives, attitudes and user behaviour of the owners are determined then policy
analyst can better determine if any of the segments potentially present environmental
concerns. This type of segmentation can provide guideline for further policy interventions
regarding the use of HVs and possible environmental concerns.
The organization of the thesis is as follows: in chapter 2, I look at the impact of social norms
on airline passenger preferences towards environmental policies. In chapter 3, I reveal the
heterogeneity of passenger on airline environmental policies. In chapter 4, I overview the
literature on historic vehicle from the perspective of environmental issues and safety and
congestion concerns, and in chapter 5, I study the existing heterogeneity among historic
vehicle owners and its implication for environmental policies. Finally, I conclude the thesis
and provide policy recommendations in chapter 6.
10 Consumer heterogeneity, transport and the environment
References
Anable, J. (2005). ‘Complacent car addicts’ or ‘aspiring environmentalists’? Identifying travel
behaviour segments using attitude theory. Transport Policy, 12(1), 65-78.
Anger, A., & Köhler, J. (2010a). Including aviation emissions in the EU ETS: Much ado
about nothing? A review. Transport Policy, 17(1), 38-46.
Anger, A. (2010b). Including aviation in the European emissions trading scheme: impacts on
the industry, CO 2 emissions and macroeconomic activity in the EU. Journal of Air Transport
Management, 16(2), 100-105.
Ben-Akiva, M. E., & Lerman, S. R. (1985). Discrete choice analysis: theory and application
to travel demand (Vol. 9). MIT press.
Boxall, P. C., & Adamowicz, W. L. (2002). Understanding heterogeneous preferences in
random utility models: a latent class approach. Environmental and resource economics, 23(4),
421-446.
Brownstone, D., & Small, K. A. (2005). Valuing time and reliability: assessing the evidence
from road pricing demonstrations. Transportation Research Part A: Policy and Practice, 39(4),
279-293.
Burkhardt, U., & Kärcher, B. (2011). Global radiative forcing from contrail cirrus. Nature
climate change, 1(1), 54-58.
Burnett, P. and Hanson, S. 1982. The analysis of travel as an example of complex human
behavior in spatially-constrained situations: definition and measurement issues..
Transportation Research Part A, 16: 87–102.
Chapman, L. (2007). Transport and climate change: a review. Journal of transport geography,
15(5), 354-367.
Cremonez, P. A., Feroldi, M., de Araújo, A. V., Borges, M. N., Meier, T. W., Feiden, A., &
Teleken, J. G. (2015). Biofuels in Brazilian aviation: Current scenario and prospects.
Renewable and Sustainable Energy Reviews, 43, 1063-1072.
Davis, S. C., Diegel, S. W., & Boundy, R. G. (2015). Transportation energy data book:
Edition 34: United States. Department of Energy.
Frost, P., & Hart, C. (2006). The historic vehicle movement in Europe maintaining our mobile
transport heritage. The Fédération Internationale des Véhicules Anciens (FIVA)(First
Edition). Brussels: FIVA.
Gössling, S., Haglund, L., Kallgren, H., Revahl, M., & Hultman, J. (2009). Swedish air
travellers and voluntary carbon offsets: towards the co-creation of environmental value?.
Current Issues in Tourism, 12(1), 1-19.
Handy, S. (2012). A Review of “Auto motives; Understanding car use behaviours” Karen
Lucas, Evelyn Blumenberg, and Rachel Weinberger (Eds.).(2011). Bingley, UK: Emerald
Publishing Group Limited. Journal of the American Planning Association, 78(3), 344-345.
Haustein, S. (2012). Mobility behavior of the elderly: an attitude-based segmentation
approach for a heterogeneous target group. Transportation, 39(6), 1079-1103.
Hoen, K. M. R., Tan, T., Fransoo, J. C., & van Houtum, G. J. (2014). Effect of carbon
emission regulations on transport mode selection under stochastic demand. Flexible Services
and Manufacturing Journal, 26(1-2), 170-195.

Chapter 1 – Introduction 11
IATA, (2016). Demand for Air Travel in 2015 Surges to Strongest Result in Five Years. Press
Release No.: 4, 4 February 2016, http://www.iata.org/pressroom/pr/Pages/2016-02-04-
01.aspx.
ICAO, (2015). Annual Report 2015 on The World of Air Transport in 2015, from
http://www.icao.int/annual-report-2015/Pages/the-world-of-air-transport-in-2015.aspx.
IEA (2015a). CO2 EMISSIONS FROM FUEL COMBUSTION- HIGHLIGHTS, from
https://www.iea.org/publications/freepublications/publication/CO2EmissionsFromFuelCombu
stionHighlights2015.pdf. OECD/IEA, 9 rue de la Fédération, 75739 Paris Cedex 15, France.
IEA (2015b). Global EV Outlook 2015 (GEO 2015) from http://www.iea.org/evi/Global-EV-
Outlook-2015-Update_1page.pdf. OECD/IEA, 9 rue de la Fédération, 75739 Paris Cedex 15,
France.
Johansson, B. (2003). Transportation fuels–a system perspective. In Handbook of Transport
and the Environment (pp. 141-157). Emerald Group Publishing Limited.
Kivits, R., Charles, M. B., & Ryan, N. (2010). A post-carbon aviation future: Airports and the
transition to a cleaner aviation sector. Futures, 42(3), 199-211.
Koshar, R. (2004). Cars and Nations Anglo-German Perspectives on Automobility between
the World Wars. Theory, Culture & Society, 21(4-5), 121-144. doi:
10.1177/0263276404046064.
Köhler, J., Walz, R., Marscheder-Weidemann, F., & Thedieck, B. (2014). Lead markets in
2nd generation biofuels for aviation: A comparison of Germany, Brazil and the USA.
Environmental Innovation and Societal Transitions, 10, 59-76.
Krammer, P., Dray, L., & Köhler, M. O. (2013). Climate-neutrality versus carbon-neutrality
for aviation biofuel policy. Transportation Research Part D: Transport and Environment, 23,
64-72.
Lee, D. S., Pitari, G., Grewe, V., Gierens, K., Penner, J. E., Petzold, A., ... & Iachetti, D.
(2010). Transport impacts on atmosphere and climate: Aviation.Atmospheric
Environment, 44(37), 4678-4734.
Louvier, Jordan, H. David, and S. Joffre. "Stated choice methods." Analysis and Application.
Cambridge University press (2000).
Lu, J. L., & Shon, Z. Y. (2012). Exploring airline passengers’ willingness to pay for carbon
offsets. Transportation Research Part D: Transport and Environment, 17(2), 124-128.
Mačiulis, A., Vasiliauskas, A. V., & Jakubauskas, G. (2009). The impact of transport on the
competitiveness of national economy. Transport, 24(2), 93-99.
MacKerron, G. J., Egerton, C., Gaskell, C., Parpia, A., & Mourato, S. (2009). Willingness to
pay for carbon offset certification and co-benefits among (high-) flying young adults in the
UK. Energy policy, 37(4), 1372-1381.
Nyborg, K., Rege, M., 2003. On social norms: the evolution of considerate smoking behavior.
Journal of Economic Behavior and Organization 52, 323–340.
Nygren, E., Aleklett, K., & Höök, M. (2009). Aviation fuel and future oil production
scenarios. Energy Policy, 37(10), 4003-4010.
Ostrom, E. (2014). Collective action and the evolution of social norms. Journal of Natural
Resources Policy Research, 6(4), 235-252.

12 Consumer heterogeneity, transport and the environment
Pietzcker, R. C., Longden, T., Chen, W., Fu, S., Kriegler, E., Kyle, P., & Luderer, G. (2014).
Long-term transport energy demand and climate policy: alternative visions on transport
decarbonization in energy-economy models. Energy, 64, 95-108.
Pollack, R. A. and T. J. Wales (1992), Demand System Specification and Estimation. New
York, NY:Oxford University Press.
Potter, S. (2003). Transport energy and emissions: urban public transport. In Handbook of
Transport and the Environment (pp. 247-262). Emerald Group Publishing Limited.
Rezaei, A., Puckett, S., & Nassiri, H. (2011). Heterogeneity in Preferences of Air Travel
Itinerary in a Low-Frequency Market. Transportation Research Record: Journal of the
Transportation Research Board, (2214), 10-19.
Robertson, L. S. (1981). Automobile safety regulations and death reductions in the United
States. American Journal of Public Health, 71(8), 818-822. doi: 10.2105/AJPH.71.8.818.
Sgouridis, S., Bonnefoy, P. A., & Hansman, R. J. (2011). Air transportation in a carbon
constrained world: Long-term dynamics of policies and strategies for mitigating the carbon
footprint of commercial aviation. Transportation Research Part A: Policy and Practice,
45(10), 1077-1091.
Sims, R. E., Mabee, W., Saddler, J. N., & Taylor, M. (2010). An overview of second
generation biofuel technologies. Bioresource technology, 101(6), 1570-1580.
Spellerberg, I. A. N. (1998). Ecological effects of roads and traffic: a literature review. Global
Ecology and Biogeography, 7(5), 317-333.
Small, K. A., & Yan, J. (2001). The value of “value pricing” of roads: Second-best pricing
and product differentiation. Journal of Urban Economics, 49(2), 310-336.
Steg, L. (2005). Car use: lust and must. Instrumental, symbolic and affective motives for car
use. Transportation Research Part A: Policy and Practice, 39(2), 147-162.
Swait, J. (1994). A structural equation model of latent segmentation and product choice for
cross-sectional revealed preference choice data. Journal of retailing and consumer services,
1(2), 77-89.
Tam-Scott, D. (2009). Rationalizing the Lunatic Fringe: Bases of Classic Car Enthusiasm.
Intersect: The Stanford Journal of Science, Technology and Society, 2(1), 104-125.
Tiwari, G., & Mohan, D. (2016). Public Transport and Safety. Transport Planning and Traffic
Safety: Making Cities, Roads, and Vehicles Safer, 285.
Train, K. E. (2009). Discrete choice methods with simulation. Cambridge university press.
van den Berg, V., & Verhoef, E. T. (2011). Winning or losing from dynamic bottleneck
congestion pricing?: The distributional effects of road pricing with heterogeneity in values of
time and schedule delay. Journal of Public Economics, 95(7), 983-992.
Wen, C. H., & Lai, S. C. (2010). Latent class models of international air carrier
choice. Transportation Research Part E: Logistics and Transportation Review, 46(2), 211-221.
Zachariadis, T., Ntziachristos, L., & Samaras, Z. (2001). The effect of age and technological
change on motor vehicle emissions. Transportation Research Part D: Transport and
Environment, 6(3), 221-227. doi: 10.1016/S1361-9209(00)00025-0.

13
2. Do social norms regarding carbon offsetting
affect individual preferences towards this policy?
Results from a stated choice experiment
This chapter is based on3:
Araghi, Y., Kroesen, M., Molin, E., & van Wee, B. (2014). Do social norms regarding carbon
offsetting affect individual preferences towards this policy? Results from a stated choice
experiment. Transportation Research Part D: Transport and Environment, 26, 42-46.
doi:10.1016/j.trd.2013.10.008
Abstract
The main aim of the present study is to quantitatively investigate the idea that people’s
willingness to offset flight-related carbon emissions is a function of the collective
participation rate, which can be regarded as a social norm, towards carbon offsetting.
Additionally, the secondary aim is to reveal people’s preferences toward two other
environmental policies, namely a baggage allowance and airline eco-efficiency index. To
achieve both aims a discrete choice experiment was designed and administrated among a
sample of air travelers. In line with previous research, the results indicate that respondents
gained utility from carbon offsetting. As expected, people gained more utility from carbon
offsetting when the collective participation rate in offsetting was high (reflecting a strong
social norm). This effect, however, did not reach statistical significance. Additionally, it was
found that the baggage allowance and the eco-efficiency index strongly influenced
respondents’ airline choices. People also became (significantly) more sensitivity towards a
baggage allowance and the eco-efficiency label, when the collective offsetting rate was high.
The article concludes with several policy implications.
3 Some explanatory paragraphs have been added to this chapter, which were removed by the journal in the final version of the article. These
paragraphs have explanatory purpose and do not impact the results in anyway.

14 Consumer heterogeneity, transport and the environment
2.1. Introduction
Despite continuing improvements in aircraft technology the expected growth of air travel will
likely lead to increasing emissions to the environment (Dubois & Ceron, 2006). To reduce or
mitigate adverse impacts of aviation emissions, various polices can be implemented. These
range from measures that focus on airlines, such as the European Emission Trading System
(EU ETS), to individual-based measures which directly target air travelers, such as Voluntary
Carbon Offsetting (VCO) schemes. Since the success of the latter type of policies depend on
the degree of voluntary participation or compliance of passengers, knowledge about people’s
preferences towards such policies is necessary.
Previous studies in this respect have primarily focused on people’s willingness to pay for
carbon offsetting (MacKerron et al., 2009, Brouwer et al., 2008; Lu and Shon, 2012). While
these studies conclude that people generally gain utility from offsetting their emissions, this is
not reflected in reality where actual offsetting rates are generally reported to be low (in the
range of 2-10%, Gössling et al., 2009; Mair, 2011).
It has been argued that this discrepancy (i.e. willingness to pay for offsetting with actual
contribution rates) may be explained by the notion that people are only willing to contribute if
others contribute as well (Brouwer et al., 2008), which would be indicative of a social norm
towards offsetting. Indeed, MacKerron et al. (2009) as well as Brouwer et al. (2008) report
that several respondents indicated that they would only be willing to pay or participate if they
knew that other fellow passengers would also participate.
Given this background the present study has two objectives. The first is to quantitatively test
the idea that the collective participation rate in carbon offsetting, which is reflective of the
prevailing social norm towards carbon offsetting, positively influences passengers’
willingness to participate in such schemes. Secondly, besides looking at carbon offsetting
which has been core focus of other studies, the present work aims to exhibit people’s (stated)
preferences towards two other environmental policies, namely a baggage allowance and an
airline eco-efficiency label. Knowledge about these policies can additionally help airlines and
governments in deciding which environmental policies to implement.
To achieve these two aims a choice experiment (CE) is designed and administrated among a
sample of air travelers at two Dutch airports. While CEs have advantages as well as
disadvantages compared to other valuation methods such as contingent valuation (Hanley et
al., 2001), an important advantage in the present context is that they allow a valuation of
several attributes at the same time. Since we are interested in respondents’ preferences
towards multiple policy measures, this advantage has been decisive in our choice to conduct a
CE.
The organization of the remainder of this chapter is as follows. The next section (2.2.) will
review previous research on social norms and their relation to (individual) behaviour and
introduce the three environmental policies that are investigated in this study. The third section
(2.3.) describes the experimental design, the sample and estimation procedure. The fourth
section (2.4.) presents and discusses the results. Finally, the last section (2.5.) summarizes the
conclusions and presents several policy implications.
Chapter 2 – Impact of social norms on passenger preferences 15
2.2. Research background
2.2.1. Social norms and behaviour
There are many empirical studies which indicate that social norms can strongly influence
people’s behaviour. Especially experimental field studies, like the one of Goldstein et al.
(2008), provide compelling evidence. In this particular experiment people were shown to be
much more likely to reuse their towel during a hotel stay when confronted with a social norm
(e.g., “the majority of guests reuse their towels”) than with traditional appeals that focused on
environmental protection. Such descriptive social norms (i.e. reflecting the behaviour of
relevant referents) have also been shown to be effective in decreasing households’ energy use
(see Abrahamse et al. (2005) for an overview).
Much theoretical work on how social norms may influence behaviour has been done by
Nyborg and colleagues. Nyborg & Rege (2003a), for example, identify various mechanisms
(formalised in mathematical models) through which moral or norm-based motivations may
influence utility and subsequent behaviour. An important implication of this line of research is
that multiple points may exist at which aggregate behaviour is in equilibrium, namely in those
situations in which (almost) nobody or (almost) everybody performs the behaviour in
question. At these points the norm (in favour or against the behaviour) reinforces itself.
Additionally, Nyborg & Rege (2003b) argue that policy may move the population from a no-
norm equilibrium to a norm equilibrium. Because of the self-reinforcing tendency of norms,
this new equilibrium may prevail even after the initial policy is abolished.
The present study introduces the concept of a social norm in the context of a choice
experiment, which, as far as the authors’ are aware, has not been previously done. Similar to
experimental field studies like the one of Goldstein (2008), a (hypothetical) descriptive norm
is introduced to respondents, reflecting the actual (carbon-offsetting) behaviour of people in
the reference group (other air travellers). Instead of presenting respondents with only two
contexts (a norm or no-norm situation), however, three social norm conditions are considered:
one in which the collective participation rate reflects the current no-norm situation (in which
5% of the population offsets their emissions) and two hypothetical scenarios where 50% and
90% of the air passengers are offsetting their emissions. In effect, it could be assessed whether
the (individual) preference for carbon offsetting increases linearly with increasing collective
participation rates, which would be congruent with the research of Nyborg & Rege (2003b).
Specifically, the preference towards (individual) carbon offsetting should be negatively
affected when the collective offsetting rate is low (5%) (when the social norm is
unfavourable), not affected when the rate is 50% (when there is no particular norm), and
positively affected when the rate is high (90%) (when the norm is favourable).
2.2.2. Airline environmental policies
Three environmental policies are selected for inclusion in the choice experiment: voluntary
carbon offsetting, a baggage allowance and airline eco-efficiency index. These policies are
briefly described below.
Voluntary carbon-offset
By implementing a VCO policy, airlines provide an opportunity for passengers to voluntarily
offset the carbon emissions associated with their flight. The offsetting costs are usually

16 Consumer heterogeneity, transport and the environment
calculated by multiplying the (estimated) CO2 emitted during the particular flight by a (fixed)
price for a ton of CO2 emissions. The funds raised by offsetting can be used to finance
initiatives that are known as ‘sink’ projects, such as afforestation and reforestation projects, or
emissions-saving projects, such as fuel substitution and energy-efficiency projects (Gössling
et al., 2007).
While VCO schemes are increasingly popular, academics have generally adopted a critical
position towards carbon offsetting. Concerns have been expresses on limited potential and
temporary nature of afforestation (i.e. much space would need to be reserved for an indefinite
time to compensate annual emissions) and the lack of transparency of offsetting schemes due
to large differences in existing calculation and accreditation methods (Gössling et al., 2007;
Mair, 2011). In addition, VCO schemes have been objected on moral grounds, since offsetting
can be seen as a simple solution to alleviate one’s guilt and detract people from real solutions
like flying less (Gössling et al., 2007; Mair, 2011). Nevertheless, as noted by McKerron et al.
(2009), well-managed VCO schemes may reduce greenhouse gas emissions, raise public
awareness about climate change, demonstrate people’s support for environmental measures to
policy makers, and (given the flexibility of the voluntary market) help channel investment
into innovative and high-risk environmentally beneficial projects. Hence, provided that
certain conditions are met, VCO schemes can play a significant role in reducing aviation
emissions.
A baggage allowance
A substantial amount of loads carried by airlines is in the form of passenger luggage. Fuel
efficiency and consequently lower emission rates can be achieved by reducing the luggage
carried by passengers (Lee et al., 2009). In this respect, Filippone (2008) has estimated that if
the baggage allowance would be reduced from 20 to 15 kilogram for a B737-500 flight over
1500 nautical miles, the reduction in CO2 would be around 3.5 kilogram per person which is
equivalent to 1.5% of the total emissions for each passenger for such a flight.
An airline eco-efficiency label
Gössling et al. (2009) argue that if environmental efficiency of airlines is determined and
communicated to air travelers in a transparent way, passengers may integrate this information
in their choice for an airline. In the end, it is hoped that, through air travelers choices, the
implementation of an eco-efficiency indexing system will stimulate airline efficiency.
There have been some attempts to create a (standard) airline efficiency indexing system. For
example, the Atmosfair Airline Index (Atmosfair, 2012) is a recognized labeling system
which ranks airlines according to their efficiency using input on the types of aircraft used, the
seating capacities and the load factors. Flybe is an example airline that has adopted eco-labels.
2.3. Methodology
2.3.1. Survey and experimental design
The empirical part of this study was based on a choice experiment (CE), which was
introduced to respondents as follows. Respondents were first asked to imagine taking a
transatlantic flight from Amsterdam to New York. Next, the social norm towards carbon

Chapter 2 – Impact of social norms on passenger preferences 17
offsetting was introduced. Each respondent was randomly assigned to only one experimental
condition, i.e. one of the three collective offsetting rates (5%, 50% or 90%).
Then the choice experiment was introduced to them with different unlabeled flight options.
The options varied on four attributes, namely ticket price and the three environmental
policies. Ticket price was varied over the range from €505 to €545, which reflects prevailing
airline prices for economy class tickets on the Amsterdam-New York route. For the individual
carbon offsetting attribute, three levels were considered: no offsetting of the current flight
(0%), partial offsetting of current flight (50%) and full offsetting of current flight (100%).
Respondents were informed that the costs of carbon offsetting were included in the ticket
price. For the baggage allowance policy, passengers where offered to carry 10, 15 or 20
kilograms of luggage for free. These weights have been chosen based on typical weights
provided by airlines for passengers to carry luggage without having to pay any extra charges.
For the eco-efficiency index system, a simple labeling system was introduced to respondents,
whereby airline efficiency varied over three levels: A (green airline), B (average airline) and
C (grey airline). Table 2.1 summarizes the attributes and their levels used in the choice
experiment.
Table 2.1 Attributes, and corresponding levels used in the choice experiment
Attribute Levels
Ticket price €505 €525 €545
Individual CO2 offset compensation 0% 50% 100%
Baggage allowance 10kg 15kg 20kg
Eco-efficiency label of the airline A B C
Each respondents was presented with 9 choice situations (choice sets). They were instructed
to choose one flight option from each choice set. Table 2.2 shows an example of a choice set.
Table 2.2 Example of a choice set
Flight 1 Flight 2 Flight 3
Ticket price €545 €505 €525
CO2 offset contribution 50% 100% 0%
Baggage allowance 15 kg 20 kg 15 kg
Eco-efficiency label of the airline B C A
Your Choice ○ ○ ○
Ngene software (ChoiceMetrics Pty Ltd) was used to constructed the choice sets and the
software was coded to use efficient designs. Efficient experimental designs are preferred to
the traditional orthogonal designs since they minimize the elements of asymptomatic
variance-covariance (AVC) matrix resulting in smaller standard errors and increasing
reliability of parameters estimated by the outcome of a choice experiment (Bliemer et al.
2009). To generate an efficient design, some preliminary (estimated) values of coefficients are
required. These initial values were taken from an earlier pilot study performed by Araghi
(2012) with a sample size of 80 respondents.

18 Consumer heterogeneity, transport and the environment
2.3.2. Respondents
To attain a representative sample of air travelers, the survey was conducted among people at
Rotterdam and Schiphol airports in the Netherlands in May 2013 and led to 261 useable
responses. The survey was conducted at arrivals and departures of both airports and the
respondents were chosen randomly at equal time intervals during the day. Rotterdam Airport
serves mainly to regional European destinations, whereas Amsterdam Airport Schiphol serves
as hub for intercontinental flights as well as serving European destinations.
The final sample was slightly skewed towards younger age groups, with more than 49% of the
respondents being between 20 to 40 of age. This figure conforms nicely though with available
population figures at these airports, which indicate that 46% of the total passengers fall within
this range (Schiphol Group, 2012). Highly educated people were also strongly present in the
sample; 74.3% either had a college or university degree. Again, this is in line with the general
composition of passengers at these airports, with 75.5% having a form of higher education
(Schiphol Media, 2011). Finally, the ratio of men and women was also in accordance with the
population figures obtained from the airports (a 6 to 4 ratio). It can be concluded that, with
respect to these social-demographic characteristics, the sample conforms nicely to the general
population of air travelers.
87% of the respondents in the sample had undertaken at least one return flight in the past year
and 2.7% were frequent flyers (i.e. passengers who flew more than 20 times in the preceding
year). In total, 6.5% of the respondents indicated that they previously offsetted their carbon
emissions, a rate which is in line with the results of previous studies (Gössling et al., 2009;
Mair, 2011). Table 2.3 summarizes the descriptive statistics of the sample.
Table 2.3 Descriptive statistics (N=261)
Variable %
Gender Male 58.6
Female 41.4
<20 5.3
Age 20-40 49.0
41-60 27.0
>61 18.6
Education level
High school 14.5
Professional training 11.2
College or university 74.3
Number of return
flights in the
past year
Less than 3 46.3
3-5 26.7
6-10 9.5
>10 5.5
Missing 12.0
Ever purchased a VCO in the past
No 89.3
Yes 6.5
Missing 4.2

Chapter 2 – Impact of social norms on passenger preferences 19
2.3.3. Estimation procedure
To model the relationships between the attributes and people's choices a multi-nomial logit
(MNL) model was estimated. The effects of the attributes were assumed to be linear. The
software package BIOGEME was used for model estimation (Bierlaire, 2003).
Two indicator variables were constructed using an effect coding scheme (see Table 2.4), to
assess the influence of collective offsetting rates on respondents’ choices. These indicators
were interacted with each of the four main effects (i.e. the four attributes), leading to 8
additional interaction effects. Substantively, this means that the effect of each attribute on
respondents' choices may be different for each contextual condition (representing the different
collective offsetting rates). In turn, such differences would imply differences in preferences
towards the environmental policies across the different social norms towards carbon
offsetting.
Table 2.4 The effect coding scheme used for the context effect
Contextual condition Indicator 1 Indicator 2
Context 1 (collective offsetting rate = 5%) 1 0
Context 2 (collective offsetting rate = 50%) 0 1
Context 3 (collective offsetting rate = 90%) -1 -1
2.4. Results
Before estimating the full model (with main and interaction effects), an initial model was
estimated which included only the main effects. Comparison of this model with the full model
via a likelihood-ratio test indicated that full model fitted the data significantly better than the
initial main effect model (χ2=88.6, d.f.=8, p<0.00). Hence, on a whole, the context indicators
interacted significantly with the four attributes.
Table 2.5 shows the estimates of the full model which includes both main and interaction
effects. All four main effects were significant. The results indicate that the baggage allowance
has the strongest positive effect on people's utility (judged by the t-value). The ticket price is
the next most important factor with an expected negative effect on utility. The eco-efficiency
index and passengers' carbon offsets also have significant effects, but are somewhat less
strong. As expected, when the eco-efficiency of the airline decreases (going from A to C)
people will, on average, lose utility. The effect of the CO2 offset contribution was positive.
Hence, in line with the results of previous studies (MacKerron et al., 2009; Brouwer et al.,
2008), people gain utility from offsetting their emissions.
The interaction effects indicate that respondents’ utility gain from individual offsetting is only
marginally affected by the first context (when the collective offsetting rate is 5%) and
positively affected by the third context (when the collective offsetting rate is 90%). The utility
gain of (individual) offsetting becomes lower in the second context when the collective
offsetting rate is 50%. While it was expected that the preference towards offsetting would
increase linearly with the collective offsetting rate, it seems that the actual relationship is
curvilinear. Hence, people gain most from offsetting in the third context (with a high
collective offsetting rate), which we expected, but the second context has a negative effect on
the slope of offsetting. It may be contemplated that the 50% offsetting rate in this context is

20 Consumer heterogeneity, transport and the environment
indicative of strong controversy over offsetting, leading respondents to withdraw and attach
less value to offsetting. It should be noted, however, that the interactions between the context
indicators and the offsetting attribute are not significant. Hence, these results can, in any case,
not be generalized to the population.
Unexpectedly, the contexts do significantly interact with the baggage allowance and the
airline eco-efficiency label. Similar to the interaction with the offsetting attribute, curvilinear
relationships can be observed in the baggage attribute. Hence, with respect to the baggage
allowance, the first context has a positive effect on the utility slope, the second context has a
negative effect and the third, again, has a positive effect. It may be speculated that a collective
offsetting rate of 50% positively triggers people’s environmental consciousness, making them
less sensitive towards restrictions on the amount of luggage one is allowed to carry. When the
collective offsetting rate reaches 90%, however, people may be inclined to think that
environmental concerns are sufficiently addressed by the fact that the majority of the
passengers are offsetting their emissions, in effect, making them more sensitive towards a
baggage allowance.
The interactions of the context indicators with the third policy (the eco-efficiency label) are
also somewhat surprising. The first context has no significant effect on the utility slope of the
eco-efficiency label. For the second context (when the collective offsetting rate is 50%), the
slope of the eco-efficiency label is positively (and significantly) affected, however, meaning
that people in this context are less sensitive towards an eco-labeling scheme. It is considered
that, similar to the interaction with the carbon offsetting attribute, the ambivalence of the
social norm in this context causes people to attach less weight to environmental
considerations. This would be consistent with the finding that when the offsetting rate is 90%,
reflecting an uncontroversial positive environmental norm, people attach more weight to the
eco-efficiency label.
Finally, the slope of the price-attribute is also significantly affected by the various contexts.
Again, a curve-linear effect can be observed with a positive effect on the slope of the ticket
price in the second context and a negative effect on this slope in the third context. This means
that, when the collective offsetting rate is 50%, people become less sensitive towards the
ticket price and, when the collective offsetting rate is 90%, people become more sensitive
towards the ticket price. One possible explanation is that when the collective offsetting rate is
high (90%), people feel morally obliged to pay extra attention to environmental
considerations (as reflected in the interactions with carbon offsetting and the eco-efficiency
label), but, at the same time, try to compensate for this by being extra critical towards the
ticket price.
Overall, it can be concluded that, in line with previous research, people (on average) gain
utility from carbon offsetting. As expected, the utility slope of carbon offsetting also increases
when the collective offsetting rate is high (reflecting a strong social norm). However, this
effect was not statistically significant. In addition, contrary to our expectations, the results
seem to suggest that the neutral/ambivalent norm (when the collective offsetting rate is 50%)
has a negative effect on people’s willingness to contribute to CO2 compensation. This result
contrasts with the predictions derived from the work of Nyborg & Rege (2003b), which
suggested that the preference towards carbon offsetting would be negatively affected when
the norm is unfavorable (when most do not contribute), not affected when the norm is
neutral/ambivalent (when 50% contributes) and positively when the norm is favorable (when

Chapter 2 – Impact of social norms on passenger preferences 21
most contribute). This may be due to the fact that a 50% participation rate signals controversy,
which, in turn, leads people to withdraw from environmental considerations.
Table 2.5 The parameter estimates of the full MNL model
Main effects Estimate t-value
Ticket price -0.0306 -18.83
CO2 offset contribution 0.0055 11.35
Baggage allowance 0.1310 21.89
Eco-efficiency index of the airline -0.1990 -7.75
Interaction effects
Ticket price * context 1 (5%) 0.0000 0.01
Ticket price * context 2 (50%) 0.0092 4.09
Ticket price * context 3 (90%) -0.0092
CO2 offset contribution * context 1 (5%) 0.0002 0.35
CO2 offset contribution * context 2 (50%) -0.0011 -1.61
CO2 offset contribution * context 3 (90%) 0.0009
Baggage allowance * context 1 (5%) 0.0127 1.48
Baggage allowance * context 2 (50%) -0.0176 -2.10
Baggage allowance * context 3 (90%) 0.0049
Eco-efficiency label * context 1 (5%) -0.0077 -0.21
Eco-efficiency label * context 2 (50%) 0.0775 2.12
Eco-efficiency label * context 3 (90%) -0.0698
Model fit
Initial log-likelihood -2581.7
Final log-likelihood -2158.1
Rho-square
0.164
2.5. Practical implications
Several practical implications may be inferred from this study. Firstly, reducing the baggage
allowance is unlikely to be a viable strategy for airlines, given that people attach much
importance to this attribute. Secondly, as suggested by several previous researchers, our
experiment showed that people indeed integrate information about the eco-efficiency of
airlines into their flight choice, indicating that an indexing system can be successful in
stimulating the use of more efficient airlines and aircrafts. The results of the present analysis
also indicate that such a labeling system may turn out to be even more important if carbon
offsetting would become more popular. Thirdly, the results suggest (although not
conclusively) that people may gain more utility from carbon offsetting when other passengers
also offset their emissions. If this notion can be supported in future research, it would be
important that a high collective offsetting rate is reached, since carbon offsetting may be more
likely to self-sustain itself in such a situation. Finally, should the notion that a 50%
participation rate signals controversy and causes withdrawal prove correct (which would
require additional research to investigate), a fourth practical implication would be that, in
going from a situation with an unfavorable offsetting norm towards one with a favorable
offsetting norm, the ‘middle-state of controversy’ may represent an additional hurdle to
overcome.

22 Consumer heterogeneity, transport and the environment
Acknowledgement
We thank Paul Peeters from NHTV Breda University of Applied Sciences for his insightful
feedback and comments. We also thank the anonymous reviewers for their insightful
comments.
References
Abrahamse, W., Steg, L., Vlek, C., & Rothengatter, T. (2005). A review of intervention
studies aimed at household energy conservation. Journal of Environmental Psychology, 25(3),
273-291.
Araghi, Y., 2012. Consumers Preferences on Airline Environmental Policies. Master’s thesis.
Faculty of Technology, Policy and Management, Delft University of Technology.
Atmosfair 2012. Atmosfair Airline Index 2012. Available online:
http://www.atmosfair.de/fileadmin/user_upload/Airline_Index/Airline_Index_2012_EN.pdf
(accessed August 2013).
Bierlaire, M. 2003. BIOGEME: A free package for the estimation of discrete choice models.
Proceedings of the 3rd Swiss Transportation Research Conference, Ascona, Switzerland.
Bliemer, M., Rose, J., Hensher, D., 2009. Efficient stated choice experiments for
estimating nested logit models. Transportation Research Part B: Methodological 43, 19–35.
Brouwer, R., Brander, L., Van Beukering, P., 2008. A convenient truth: air travel passengers’
willingness to pay to offset their CO2 emissions. Climatic Change 90, 299–313.
Dubois, G., & Ceron, J. P. (2006). Tourism and climate change: Proposals for a research
agenda. Journal of Sustainable Tourism, 14(4), 399-415.
Filippone, A. 2008. Analysis of Carbon-Dioxide Emissions from Transport Aircraft. Journal
of Aircraft, 45(1), 185-197.
Goldstein, N. J., Cialdini, R. B., & Griskevicius, V. (2008). A room with a viewpoint: Using
social norms to motivate environmental conservation in hotels. Journal of Consumer
Research, 35(3), 472-482.
Gössling, S., Broderick, J., Upham, P., Ceron, J., Dubois, G., Peeters, P., Strasdas, W., 2007.
Voluntary carbon offsetting schemes for aviation: Efficiency, credibility and sustainable
tourism. Journal of Sustainable tourism 15, 223–248.
Gössling, S., Haglund, L., Kallgren, H., Revahl, M., Hultman, J., 2009. Swedish air travellers
and voluntary carbon offsets: towards the co-creation of environmental value? Current Issues
in Tourism 12, 1–19.
Hanley, N., Mourato, S. and Wright, R.E. 2001. Choice Modelling Approaches: A Superior
Alternative for Environmental Valuation? Journal of Economic Surveys, 15(3), 435–462.
Lee, D., Fahey, D., Forster, P., Newton, P., Wit, R., Lim, L., Owen, B., Sausen, R., 2009.
Aviation and global climate change in the 21st century. Atmospheric Environment 43, 3520–
3537.
Lu, J., Shon, Z., 2012. Exploring airline passengers willingness to pay for carbon offsets.
Transportation Research Part D: Transport and Environment 17, 124–128.

Chapter 2 – Impact of social norms on passenger preferences 23
MacKerron, G., Egerton, C., Gaskell, C., Parpia, A., Mourato, S., 2009. Willingness to pay
for carbon offset certification and co-benefits among (high-) flying young adults in the UK.
Energy Policy 37, 1372–1381.
Mair, J., 2011. Exploring air travellers voluntary carbon-offsetting behaviour. Journal of
Sustainable Tourism 19, 215–230.
Nyborg, K., & Rege, M. (2003a). Does public policy crowd out private contributions to public
goods. Public Choice, 115(3-4), 397-418.
Nyborg, K., & Rege, M. (2003b). On social norms: the evolution of considerate smoking
behavior. Journal of economic behavior & organization, 52(3), 323-340.
Schiphol Media 2011. In Facts & Figures. Available online:
http://www.schiphol.nl/SchipholGroup/Company1/Statistics/FactsFigures.htm (accessed
September 2013).
Schiphol Group 2012. In Facts & Figures. Available online:
http://www.schiphol.nl/SchipholGroup/Company1/Statistics/FactsFigures.htm (accessed
September 2013).

24 Consumer heterogeneity, transport and the environment

25
3. Revealing heterogeneity in air travellers’
responses to passenger-oriented environmental
policies: a discrete-choice latent class model
Araghi, Y., Kroesen, M., Molin, E., & Van Wee, B. (2016). Revealing heterogeneity in air
travelers' responses to passenger-oriented environmental policies: A discrete-choice latent
class model. International Journal of Sustainable Transportation, 10(9), 765-772. doi:
10.1080/15568318.2016.1149645
Abstract
Adverse environmental impacts caused by increasing air travel put pressure on governments
and the airline industry to take mitigating actions. However, taking effective actions that are
accepted by airline passengers requires an understanding of air travelers’ preferences. To
reach this understanding, a stated choice experiment is conducted among Dutch air travelers.
The survey is appended with measures of attitudes towards air travel and climate change. The
heterogeneity in passengers’ preferences is revealed by estimating a discrete-choice latent
class model, which aims to identify classes in the population that are homogeneous in their
preferences. The attitudinal constructs are additionally included in the model to predict class
membership. Three classes are identified: price hunters, luggage lovers and eco-flyers.
Overall, the study indicates that a considerable portion of the air travelers derive utility from
passenger-oriented environmental policies. Based on the revealed passenger segments,
specific policy measures are proposed.
26 Consumer heterogeneity, transport and the environment
3.1. Introduction
Forecasts by the International Air Transport Association indicate that the demand for air
travel is expected to grow 4.1% annually (IATA, 2014). The growth of the aviation industry is
associated with economic and social benefits. Regarding the economic benefits, a study
conducted jointly by Oxford Economics and Air Transport Action Group reports that the
impact of aviation on the global economy amounts to $2.4 trillion from direct, indirect and the
tourism related activities (ATAG, 2014). As for the social benefits, aviation allows for more
interaction between cultures, ‘intercultural tourism’, which is considered as a driver for global
peace (Edgell, 1990). Moreover, aviation provides rapid response to disasters, evacuations,
and medical aid (Caves, 2003).
Despite economic and social merits, the emissions caused by the airline industry impose a
direct societal cost. Over the past 20 years, the CO2 emissions from civil aviation have
increased by more than 50% (Sgouridis et al., 2011). Several measures have been designed to
tackle the increasing share of the airline industry to global CO2 emissions, which are
discussed in detail in a report published by International Civil Aviation Organization (ICAO,
2007). These measures target different parts of the airline industry. An important category of
policies are those that are focused on the consumers, i.e. the air travellers. Effectiveness of
such types of policies require passengers’ acceptance and collaboration with airlines, in order
to have significant impact on reducing airline emissions. However, passengers have different
characteristics, preferences and attitudes. Burnett and Hanson (1982) argue that planning
suitable policies for travellers require tailored policies, targeted at subgroups of people with
relevant common preferences and characteristics. Hence, designing suitable and effective
policies primarily requires a method that deals with heterogeneity among air travellers.
In this chapter, we disclose passenger heterogeneity based on common characteristics that are
revealed by a discrete-choice latent class model (LCM). This method simultaneously
incorporates people’s attitudes and stated preferences, and using this information, categorizes
subjects into subgroups (i.e. latent classes). When the latent classes are identified, it is
possible to reflect on the features recognized in each latent segment. Furthermore, based on
the preferences of respondents of each class it is possible to design policies suitably tailored to
target the latent segments.
3.2. Modelling approach
In previous studies, researchers have used choice experiments to reveal air travellers’ stated
preferences on various environmental policies in the air travel domain (e.g., Brouwer et al.,
2008; MacKerron et al., 2009; Mair, 2011; Lu and Shon, 2012). Others have studied
travellers’ attitudes towards emissions caused by air travel (e.g., Becken, 2004; Hares et al.,
2010; Higham and Cohen, 2011; Kroesen, 2013). In this paper, we follow the approach
originally proposed by McFad¬den (1986) and later developed by Kamakura and Russell
(1989), Swait (1994) and Boxall and Adamowicz (2002) and incorporate both pillars, i.e.
stated preferences and attitudes. This approach allows us to reveal heterogeneity among air
passengers in their airline choice, while also taking into account their attitudes towards air
travel.
The approach is based on the discrete-choice latent class model (LCM), which, in the present
application, consists of the following two parts. The first part deals with the probability that
an individual chooses a flight from a set of alternative flight options. This part of the model is

Chapter 3 – Revealing heterogeneity of passenger on environmental policies 27
based on random utility maximization theory, which assumes that individuals choose the
flight with the highest utility. The second part of the discrete-choice LCM deals with the
probability that an individual belongs to a specific latent class, the so-called class membership
function. It is assumed that a limited number of latent classes exist and that each has a
different set of taste parameters (Swait, 1994; Boxall and Adamowicz, 2002). Individuals are
assigned to segments. Hence, each individual has a certain probability to belong to each of the
specified latent classes.
The discrete choice LCM is ideally suited to simultaneously capture and explain
heterogeneity. Hence, similar to the mixed logit model it is a method to capture heterogeneity
in taste parameters. However, instead of assuming (a) continuous distribution(s) for the taste
parameter(s) (e.g. normal, log-normal), a discrete distribution is assumed with a fixed number
of discrete mass points. In addition, respondents are probabilistically assigned to these mass
points representing the latent classes. By capturing heterogeneity in this way (via latent
classes), the model allows the researcher to predict class membership using additional
explanatory variables, such a psychometric characteristics (air travellers’ attitudes). By
entering such constructs as covariates in the class membership function, the heterogeneity
captured by the discrete choice latent class model (LCM) may be explained. This allows a
better understanding of the (choice-based) preference heterogeneity. In addition, by providing
a richer interpretation of the classes, the segments may also become more actionable and
relevant from a managerial perspective. In essence, the discrete-choice latent class model can
effectively achieve two objectives, namely (1) to reveal sources of heterogeneity among
subjects, and (2) to gain better behavioural underpinnings that reflect the intentions behind
people’s choices (McFadden, 1986).
To estimate the discrete-choice latent class model (LCM) we set up a discrete choice
experiment. This experiment included three passenger-oriented policies focused on emission
mitigation, namely (1) a carbon offsetting scheme, (2) a luggage allowance and (3) an airline
eco-efficiency label. In previous work, Araghi et al. (2014) have studied how these policies
affect passengers’ choices of alternative airlines, focusing on the role of social norms on
passengers’ responses to these policies. This paper considers the same three policies, but
focuses on revealing latent passenger segments by incorporating air travellers’ attitudes into
the model.
From the three environmental polices investigated in this paper, two policies, namely the
luggage allowance and the airline eco-efficiency label, are relatively new and have not
received much attention in the academic literature. The carbon offsetting scheme, on the other
hand, has been the focus of several prior studies in the domain of sustainable aviation
(Gössling et al., 2007; Mair, 2011; McKerron, Egerton, Gaskell, Parpia, & Mourato 2009).
Gössling et al. (2007) mention a number of organizations that offer voluntary carbon
offsetting schemes, specifically designed to offset aviation CO2 emissions and discuss some
criteria to validate and verify the credibility of such schemes.
Several other studies in the airline carbon offsetting domain have specifically focused on
assessing air travellers’ willingness to pay for offsetting CO2 emissions (MacKerron et al.,
2009; Brouwer et al., 2008; Lu and Shon, 2012). A common finding from these studies is that
air travellers generally gain utility from offsetting. It is noteworthy, however, that this finding
is not consistent with prevalent offsetting rates, which are generally reported to be very low
(Gössling et al., 2009; Mair, 2011).

28 Consumer heterogeneity, transport and the environment
The luggage allowance policy is considered as a relevant passenger-oriented policy, since
reductions in the amount of luggage carried by passengers result in improved fuel efficiency
and thus lower emissions (Lee et al., 2009). According to Filippone (2008), if passengers of a
short haul flight reduced their luggage with just 5 kg (i.e. from 20 to 15 kg) on a B737-500
flight over 1500 nautical miles, 1.5% of overall emissions would be saved. This is equivalent
to CO2 reduction of around 3.5 kg per person.
With respect to the third policy, the airline eco-efficiency label, several labelling systems have
already been designed to rank airlines based on their environmental efficiency. Examples
include the Atmosfair index (Atmosfair, 2014) and the eco-labelling program conducted by
Flybe airlines. It is unknown, however, to what extent passengers truly take information from
such schemes into account when booking a flight and/or which segments in the population are
particularly susceptible to this information. The present study aims to fill this knowledge gap.
3.3. Data and model estimation
3.3.1.The survey
To estimate the model, data was gathered via a survey among Dutch air passengers. The
survey consisted of three parts. First, information about respondents’ socio-demographic
background was assessed including their age, gender and education level. Also, as an
additional background characteristic, each respondent was requested to indicate whether (s)he
ever contributed to an airline carbon offsetting scheme in the past.
The second part presented the discrete-choice experiment. In the choice experiment
respondents were requested to imagine booking a return flight from Schiphol Airport,
Amsterdam to John F. Kennedy airport at New York for a one-week trip. This specific
destination was chosen because it represents one of the most popular intercontinental
destinations for Dutch travellers. In choosing a popular destination, we hoped that
respondents were generally able to imagine taking such a trip.
Respondents were then presented with 9 choice sets, each with three alternative (unlabelled)
flight options. The alternative flight options contained four attributes, one attribute for ticket
price and three attributes relating to the three passenger-oriented policies. The ticket price
attribute was varied over three levels, namely €505, €525 and €545. The levels were chosen
such that they appear within the range of an economy class flight on the considered route. The
second attribute represented the carbon offsetting scheme and was also varied over three
levels. Passengers could choose to offset 0%, 50% or 100% of the carbon emissions caused by
their hypothetical flight. The third attribute related to the luggage weight allowance. Again,
this attribute was varied over three levels, namely 10, 15 and 20 kilogram. The fourth attribute
represented the airline eco-efficiency label. Here, the choice was made to introduce a simple
ABC-labelling scheme, whereby ‘A’ was denoted as a ‘green airline’, ‘B’ as an ‘average fuel-
efficient’ airline and ‘C’ as a ‘grey airline’. We assumed that the concept behind this attribute
would be relatively evident, since people are frequently exposed to different types of labelling
schemes concerning the efficiency of their dwellings and/or household appliances (e.g.
refrigerators, washing machines). Table 3.1 demonstrates an example choice set that was used
in our survey.

Chapter 3 – Revealing heterogeneity of passenger on environmental policies 29
Table 3.1 An example choice set
Attributes Flight 1 Flight 2 Flight 3
Ticket Price (€) € 525 € 505 € 545
CO2 offsetting contribution (percentage) 100% 0% 50%
Luggage allowance (kilogram) 15 kg 15 kg 20 kg
Eco-efficiency label C A B
Which flight would you choose?
The choice sets were based on an efficient design , which was constructed using the Ngene
software (ChoiceMetrics, Pty. Ltd). These designs are developed to ‘minimize the elements of
the AVC [asymptomatic variance-covariance] ma¬trix for the design, and hence maximizing
the asymptotic t-ratios for each of the parameter estimates’ (Rose & Bliemer, 2009, p. 611),
thus, they are preferred to the traditional orthogonal designs. To generate an efficient design,
so called priors are needed, which are preliminary (estimated) values of the coef¬ficients
(Rose, Bliemer, Hensher, & Collins, 2008). These were taken from an earlier pilot study
performed by Araghi (2012) with a sample size of 80 respondents.
Finally, in the third part of the survey, respondents’ attitudes towards air travel, CO2
emissions and climate change were assessed using 12 statements. Respondent were asked to
indicate their agreement with these statements by ranking them on a 7-point Likert scales
ranging from (1) ‘strongly disagree’ to (7) ‘strongly agree’. The statements were selected
from a study conducted by Kroesen (2013). In Kroesen’s study, 36 statements were used to
explore people’s viewpoints on air travel and climate change. To keep the length of the survey
within acceptable limits only 12 statements were selected. These 12 statements figured most
prominently within people’s viewpoints on air travel and climate change (Kroesen, 2013).
3.3.2. Participants
Respondents in our survey were recruited by randomly approaching passengers at Schiphol
and Rotterdam airport, which are the two largest airports in the Netherlands. The survey was
conducted in May 2013. In a fixed location in public areas of both airports (not specific for
business or first class travellers), passing passengers were asked to complete the survey,
which was in pen and paper format. The questionnaires were delivered to respondents
followed by a short instruction of a research assistant. The respondents were selected
randomly and only one person at a time completed the questionnaire under the supervision of
the research assistant. This way, we ensured that respondents understood how to correctly fill
in the choice based questionnaire. In total, 275 passengers took part in the survey, resulting in
261 fully completed questionnaires, which were used in the analysis.
Overall, the sample distributions of the socio-demographic characteristics were consistent
with the available population figures at both airports (Schiphol Group, 2012; De Witt, 2011).
58% of the sample was male and 74% had completed a form of higher education (college or
university). Regarding age, 49% of the sample was between 20 to 40 years of age and 40%
percent was between 40 to 70 years. Only 4.6% of respondents had ever contributed to
offsetting schemes before, a figure which is in line with the 2% to 10% range mentioned by
Mair (2011).

30 Consumer heterogeneity, transport and the environment
3.3.3. Model estimation
The software package NLOGIT (Greene, 2007) was used to estimate the discrete-choice
LCM. To determine the optimal number of latent classes, we relied on the ρ2 values and the
values for the Akaike Information Criterion (AIC) and the Bayesian Information Criterion
(BIC). These information criteria take both model fit and model parsimony into account
(Swait, 1994). Apart from these statistical criteria, we also took the interpretability of the
results into account.
3.4. Results
3.4.1. The baseline (multinomial logit) model
We estimated a standard multinomial logit model to first get a general idea to what extent the
four attributes influence air travellers’ choices for a specific flight alternative. In the context
of the present analysis, this model may be regarded as a special form of the discrete-choice
LCM with only a single class (segment). Table 3.2 shows the estimated logit coefficients of
the multinomial logit model.
Table 3.2 Coefficients of the multinomial logit model
Attribute Estimate t-value RI (%) Willingness-
to-pay (€)
Ticket price -0.034 -20.3 35.3
CO2 offset contribution 0.006 12.1 15.5 0.18
Luggage allowance 0.140 23.0 36.8 4.12
Eco-efficiency label -0.235 -9.1 12.4 -6.91
Model fit
Log-likelihood -2103.34
Adjusted R2 0.17
RI = relative importance
All four attributes are highly significant (p<0.01) and the signs of the estimates are in line
with expectations. The negative sign of the coefficient for ticket price means that the more
expensive the tickets are, the less utility is obtained, assuming everything else remains equal.
The coefficient for the CO2 offsetting scheme is positive, indicating that respondents derive
utility by offsetting their carbon emissions. This outcome is in agreement with Brouwer et al.
(2008) and MacKerron et al. (2009). The positive coefficient for the third attribute indicates
that passengers prefer higher luggage weight allowances. Finally, the negative sign of the eco-
label indicates that passengers prefer to fly with an airline with an A-label and lose utility as
the eco-label decreases from ‘A’ to ‘C’.
To get a sense for the relative importance of the attributes, each estimate was multiplied by
the range over which it varied in the experiment. These figures were summed to get the total
variation in utility as a result of the experimental conditions. The relative importance of each
attribute was then calculated by dividing the range in utility points for that attribute by this
total (see also Vermunt & Magidson, 2005, p. 53). These figures are presented in the third
column of Table 3.2 It can be observed that, in the sample as a whole, the ticket price and the
luggage allowance are the most important attributes (both around 35%), while the CO2

Chapter 3 – Revealing heterogeneity of passenger on environmental policies 31
offsetting scheme and the eco-efficiency label are relatively less important (16 and 12%
respectively).
By dividing each parameter by the ticket price parameter, we calculated the willing-to-pay
(WTP) values associated with changes in respective attribute levels. These values are
presented in the final column of Table 3.2. The results indicate that air travellers are willing to
pay ₵18 (Eurocents) for each percentage of carbon off-setting. Hence, to entirely offset the
carbon emissions (100%) air travellers are willing to pay €18 on average. This figure is in line
with the amount estimated by Brouwer et al. (2008), MacKerron et al. (2009), and slightly
lower than the estimates of Lu and Shon (2012) and also with the amount offsetting schemes
would typically charge for a long-haul flight (Gössling et al., 2007).
3.4.2. The discrete-choice LCM
In line with the approach of Boxall and Adamowicz (2002), the 12 statements were factor
analysed in order to obtain estimates of the latent attitudinal constructs to be entered into the
class membership function. Principal component analysis with varimax rotation was used to
this end. Components were extracted until eigenvalues were less than or equal to 1.0. Based
on this criterion we arrived at four factors as presented in Table 3.3.
Table 3.3 Rotated component matrix (loadings below 0.5 are not presented on the table)
Statements Components
1 2 3 4
I never really thought about the effects of my flying behaviour on the climate. 0.766
I know what the contribution of my air travel behaviour is on the total
carbon emission associated with my consumption. -0.668
I do not include considerations with respect to climate in my decision to fly. 0.640
I fly very little (or not at all). For me it is easier to save in other areas. 0.800
visiting countries far away is part of my lifestyle. -0.790
The government should set a maximum quota for the number of flights
a person is allowed to make each year. 0.779
My philosophy is in conflict with my flying behaviour. 0.630
The Netherlands already is a clean and environmentally friendly country.
Other countries can still achieve a lot in reducing their CO2 emissions. 0.679
Flying is the only option to cover large distances. 0.663
Flying will probably become more expensive in the future.
We should enjoy it while we still can. 0.581
I believe the climate changes under the influence of man. *
I like flying. *
* No component loading reached above 0.5 for this statement.
Factor 1 was called ‘ignorant about the link between air travel and emissions’, representing
the degree in which individuals fail to consider the impacts of air travel on the atmosphere.
Factor 2 was termed ‘flying not part of lifestyle’, expressing an adverse attitude towards
flying and visiting countries far away. Factor 3 was identified as ‘cognitive dissonance’,
reflecting the extent to which individuals feel that their behaviour is inconsistent with the
personal philosophy and the extent to which they think the government should restrain
personal behaviour. Finally, factor 4 was labelled ‘flying is the only option’, reflecting an
attitude that there is no alternative to flying and that we should enjoy before it becomes too

32 Consumer heterogeneity, transport and the environment
expensive. Scores for the four factors were calculated for each individual in the sample and
entered in the class membership function.
Consecutive models were estimated to decide on the optimal number of latent classes, starting
with a model with 1 class up to a model with 5 classes. Table 3.4 presents the fit indices of the
estimated models. According to the BIC criterion the 4-class solution is optimal, while the
AIC values indicate that the optimal model is one with at least 5 or more latent classes.
Looking at the parameter estimates of the various models, it was found that the estimates of
the 4-class model could not be meaningfully be interpreted. Specifically, the price parameter
estimate of the 4th class had an unexpected positive sign. Therefore, we decided to opt for the
3-class model. As indicated by the ρ2 values the gains in explanatory power after the 3-class
model are relatively minor, which also supports the choice for the more parsimonious 3-class
model.
Table 3.4 presents the parameter estimates of the 3-class model and the model fit (adjusted
rho-square). The rho-square value of the latent class model (0.33) was found to be
substantially greater than the rho-square of the multinomial logit model (0.17) (Table 3.2),
indicating that there is considerable heterogeneity among air travellers in the way they value
the four attributes.
Table 3.4 Outcomes of latent class model with increasing number of segments
Number
of
segments
No. of
para-
meters
log likelihood
at
convergence
(LL)
log likelihood
at 0 (LL(0))
R2a
Akaike
information
criterion (AIC)
Bayesian
information
criterion (BIC)
1 4 -2103.34 -2560.7 0.17 1.80 1.81
2 13 -1912.73 -2560.7 0.25 1.65 1.68
3 22 -1718.01 -2560.7 0.33 1.49 1.54
4 31 -1625.53 -2560.7 0.37 1.42 1.49
5 40 -1596.56 -2560.7 0.38 1.40 1.49 a R
2 is calculated as 1-(LL)/LL(0)
Parameter estimates and model fit of the discrete-choice latent class model are presented in
Table 3.5. Overall, the three classes are well-interpretable. Air travellers belonging to the first
class (24% of the sample) can be identified as ‘price hunters’. The members of this class lose
most utility with ticket price in comparison to the two other segments. The relative
importance of ticket price is the highest for this class of passengers (72%). In addition, they
derive no utility from carbon offsetting and comparatively little utility from the eco-efficiency
label. The WTP for complete carbon offsetting (i.e. 100% of the CO2 emissions) of this group
is equivalent to €1. In addition, respondents are willing to pay ₵80 (Eurocents) for an
additional kg of luggage allowance and €3 for a higher eco-efficiency level of the airline.
Respondents assigned to the second class (36% of the sample) were termed ‘luggage lovers’,
because they gain most utility from increases in the luggage allowance. The relative
importance of the luggage allowance attribute is 58%. To some extent these passenger are
also price sensitive. Similar to members of the first class, they derive little utility from carbon
offsetting and the eco-efficiency label. However, the estimate for the carbon offsetting
scheme is significant in this class. The associated WTP value indicates that air travellers in
this class are willing to pay €7 to fully offset their emissions and around €3 for an upgrade in
eco-efficiency of the airline. Finally, passengers who belong to this profile are willing to pay
as much as €7.4 for each kilogram increase in the luggage allowance.

Chapter 3 – Revealing heterogeneity of passenger on environmental policies 33
Finally, members of the third class (41% of the sample) are identified as ‘eco-flyers’.
Travellers in this class derive most utility from carbon offsetting (with a relative importance
of 52%) and the eco-efficiency label (with a relative importance of 26%). In addition, they
derive utility from being allowed to carry more luggage, and the price attribute is insignificant
for members of this class. Given that the price parameter estimate is not significant, WTP
value could not be calculated for the members in this class.
Table 3.5 Parameter estimates and model fit of the discrete-choice latent class model
Class 1:
Class 1: Price hunters (24%)
Attribute Estimate t-value RI (%) Willingness-
to-pay (€)
Ticket price -0.100** -15.7 72.2
CO2 offset contribution 0.001 0.8 1.8 0.01
Luggage allowance 0.083** 4.0 15.0 0.83
Eco-efficiency label -0.306** -3.2 11.0 -3.06
Attitudinal constructs
Factor 1 0.739** 3.7
Factor 2 -0.347* -1.8
Factor 3 -0.255 -1.4
Factor 4 -0.117 -0.6
Class 2: Luggage lovers (36%)
Attribute Estimate t-value RI (%) Willingness-
to-pay (€)
Ticket price -0.054** -16.4 31.5
CO2 offset contribution 0.004** 5.1 5.8 0.07
Luggage allowance 0.399** 27.0 58.2 7.39
Eco-efficiency label -0.154** -3.3 4.5 -2.85
Attitudinal constructs
Factor 1 0.867** 4.6
Factor 2 -0.311* -1.8
Factor 3 -0.267 -1.5
Factor 4 0.142 0.8
Class 3: Eco-flyers (41%)
Attribute Estimate t-value RI (%) Willingness-
to-pay (€)a
Ticket price -0.001 -0.6 1.5
CO2 offset contribution 0.014** 24.0 52.0 -
Luggage allowance 0.054** 8.2 20.1 -
Eco-efficiency label -0.356** -11.8 26.4 -
Attitudinal constructs
Factor 1 Fixed at 0
Factor 2 Fixed at 0
Factor 3 Fixed at 0
Factor 4 Fixed at 0
RI = relative importance
** significant at P < 0.05
* significant at P < 0.10 a for the eco-flyers WTP values could not be calculated due to the insignificance of the price parameter estimate.
Regarding the attitudinal constructs, it can be observed that the first two factors significantly
affect class membership (at the 5% and 10% significance level respectively). As people are
more ignorant of the link between air travel and climate change (factor 1), they have a higher

34 Consumer heterogeneity, transport and the environment
chance of belonging to either the first or the second class (at the expense of the third class)
and as people consider flying as less part of their lifestyle (factor 2) they have a higher chance
of belonging to the third class (at the expense of the first and second class). While the signs of
the estimates of the third factor are in line with the specific attribute parameters of each class,
the estimates are not significant. Overall, it can be concluded that the influences of the factors
are consistent with the labels of each class.
To further characterise and profile of the three classes, we contrasted class membership with
the background characteristics of the respondents. To this end, respondents’ demographic
characteristics were weighted by the posterior membership probabilities that they belong to
the various classes. Table 3.6 presents these weighted averages.
The first class (price hunters) is dominated by men and has the highest number of young
travellers. Since young travellers have fewer financial resources, this can explain why
passengers belonging to this group have the highest sensitivity to price and do not participate
in carbon offsetting. The majority of the members of the second class (luggage lovers) is also
young. In addition, similar to the first class, participation in carbon offsetting is low. In the
third class (eco-flyers) middle-aged passengers are most strongly represented. Around 11% of
the passengers in this class have participated in carbon offsetting schemes, which is much
more than the participation of the other two classes and also more than the average figures
reported by previous studies (e.g. Gössling et al., 2009; Mair, 2011). Overall, the three classes
do not differ strongly with respect to the distribution of education level. This finding is
somewhat surprising since education level has previously been shown to positively influence
environmental behaviour (Olli, Grendstad, & Wollebaek, 2001).
Table 3.6 Cross tabulation of class membership with the background characteristics
Variable
Class 1
Price hunters
(24%)
Class 2
Luggage lovers
(36%)
Class 3
Eco-flyers
(41%)
Gender (%) Male 68 57 55
Female 32 43 45
Age (%)
15-30 71 50 33
31-60 24 38 54
>60 5 12 13
Education level (%)
High school 16 12 16
College 7 14 11
Higher Education 78 74 73
Ever engaged in
carbon
offsetting (%)
No 94 93 83
Yes 2 5 11
Missing 5 2 6
Finally, to explore the possibility that the background characteristics indirectly affected latent
class membership via the latent factors, we regressed the factors scores of the significant
factors in the discrete-choice LCM (factors 1 and 2) on the background characteristics. With
respect to the first factor (‘ignorance’), the results showed that (given ceteris paribus)
younger, lower educated and respondents not previously engaged in carbon offsetting scored,
on average, significantly higher on this factor (at the 5% significance level). With respect to
the second factor (‘flying not part of lifestyle’), the result indicated that age had a significant
positive effect on this factor. Hence, the background characteristics do seem to have some
plausible indirect effects on latent class membership. Overall the effects were not very strong

Chapter 3 – Revealing heterogeneity of passenger on environmental policies 35
though, as indicated by the proportions of explained variance of the two regressions (9.1%
and 3.6% for the regression of factor 1 and 2 respectively).
3.5. Discussion and policy implications
An interesting and relevant overall finding of the present study is that a considerable portion
of the air travellers (41%) derive utility from passenger-oriented environmental policies.
Hence, in general, there seems to be scope for such policies to be embraced by air travellers
and consequently to be successful. The results thereby suggest that participation in carbon
offsetting may be expected to increase in the future, as the current participation rate is much
lower than the portion of the population that derives utility from carbon offsetting.
That being said, the majority of the sample do not derive (much) utility from the considered
environmental policies. In this respect, the discrete-choice latent class model can also provide
an explanation for the inconsistency between the reported finding that air travellers on
average derive utility from carbon offsetting (MacKerron et al., 2009; Brouwer et al., 2008;
Lu and Shon, 2012), and the fact that actual participation rates are low. In this study too, air
travellers on average derive utility from carbon offsetting (see Table 3.2), but when the
heterogeneity in tastes among passengers is revealed (Table 3.6), only a minority of the
sample is actually found to gain utility from carbon offsetting. Hence, by revealing the latent
segments a more accurate estimate can be obtained with respect to share of the population
which is actually willing to pay for carbon offsetting schemes. Another possible explanation
is that respondents in the experiment provided socially desirable answers. It is widely known
that in conventional stated preference studies people tend to support socially desirable policies
more often than they actually do in the real-world choices (see also Fujii & Gärling, 2003).
Based on the findings provided by the discrete-choice LCM, policy measures may be
formulated that take the specific preferences of the members of each group into account. This
is done below.
Price hunters - To motivate this group to engage in more sustainable travel behaviour the best
way would be to internalise the external costs of flying into the price of travel. In this respect,
governments could impose extra emission taxes on ‘C labelled’ airlines or introduce taxes on
kerosene. In this way, the price sensitive passengers are implicitly directed to the cleaner
airlines. Airlines may also approach this group with positive price incentives, for example, by
offering discounts in exchange for a reduction in the amount of baggage the passenger is
allowed to carry. This discount can be offered on the basis of the amount of fuel saved (i.e.
reduced operating costs).
Luggage lovers - The passengers in this latent group are highly sensitive to luggage
allowances and moderately sensitive to ticket prices. Discovering a group that is so sensitive
to baggage allowances was unexpected, but a relevant finding as it suggest that compulsory
reduction of the prevailing luggage allowances would simply dis-incentivize these passengers
and motivate them to switch airlines. Instead, luggage reduction strategies should ideally be
based on monetary incentives (as discussed above) or disincentives.
Eco-flyers - this group of travellers gains utility from carbon offsetting and will take
information from eco-efficiency labels into consideration when booking a flight. To increase
participation in carbon off-setting, current schemes could be enriched by offering passengers
a CO2 offset account and providing them with credits each time they offset their emissions.
36 Consumer heterogeneity, transport and the environment
Based on the credits earned, passengers can be offered exclusive services at airports, such as
faster inspection and customs checks. By making carbon offsetting ‘visible’ at airports other
potential contributors may be reached more effectively.
Secondly, via the CO2 offset account passengers can be constantly updated about the latest
eco-efficiency ranking of airlines and airports via trusted sources. This information can help
environmentally concerned passengers to identify more environmentally efficient airlines and
choose them for their future travels. This would steer passengers towards a less polluting way
of air travel as opposed to the current situation, where there are hardly any kind of
mechanisms to inform the eco-flyers about the choices that are available to fly in a less
polluting manner.
3.6. Conclusion
By means of choice experiment we revealed air travellers’ preferences towards three
passenger-oriented policies focusing on emission mitigation, namely a carbon offsetting
scheme, a luggage allowance and an airline eco-efficiency label. Based on the estimated
discrete-choice latent class model three latent segments are identified: price hunters, luggage
lovers and eco-flyers. These segments support various specific policy measures. Overall, the
results indicate that a considerable portion of the air travellers derive utility from passenger-
oriented environmental policies, but that the majority of the air travellers are highly sensitive
to the price of air travel.
Although this study revealed heterogeneity among Dutch air passengers in format of three
classes, we believe that conducting a broader survey in multiple European countries may
deliver needed insights for policy makers at the level of the European Union. Needless to say,
studies in other geographical areas (e.g. Asia, America) with different passenger
characteristics may suggest other specific policies.
Secondly, the attitudes towards air travel and associated (carbon) emissions, which were used
to predict class membership, were drawn from an exploratory study (Kroesen, 2013). As such,
they do not represent thoroughly validated and high reliable scales. While generic
environmental scales are available (e.g. the New Ecological Paradigm (Dunlap et al., 2000))
are available, as of yet, no specific scales are available to measures people’s environment
consciousness with respect to air travel.
Thirdly, since the present study has aimed to provide a generic overview of groups of air
travellers with similar (unobserved) tastes, structural segments in the population have not
been explicitly considered. For example, one important grouping variable is the travel
purpose, business versus leisure. It is likely that these groups have different preferences. For
example, business travellers are not likely to care for a high luggage allowances, given that
they are not likely to reach the set limits anyway.
The last limitation relates to the complexity of the choice experiment. To make sure the
choice task was understandable, we tried to keep the number of attributes to a minimum. The
attributes were therefore focused on environmental policies and did not consider other
attributes which are likely important with respect to airline choice (e.g. time of departure,
flight length, legroom). Consequently, there is a risk that the importance of environment
concerns was inflated. In future research, experiments may be expanded and include more

Chapter 3 – Revealing heterogeneity of passenger on environmental policies 37
attributes. This would also allow an assessment of the relative importance of the
environmental policies vis-à-vis the traditional determinants of the airline choice.
On a final note, the introduction of technologically-oriented means to reduce emissions (e.g.
bio-fuels), may raise doubts regarding the necessity of introducing passenger–oriented
environmental policies. Yet, even with wide use of new technologies, there likely remains a
need for behaviourally-oriented policies to compensate for the continuous increase in the
demand for air travel.
References
Araghi, Y. (2012). Consumers Preferences on Airline Environmental Policies. Master’s thesis.
Faculty of Technology, Policy and Management, Delft University of Technology, Delft, The
Netherlands.
Araghi, Y., Kroesen, M., Molin, E., & van Wee, B. (2014). Do social norms regarding carbon
offsetting affect individual preferences towards this policy? Results from a stated choice
experiment. Transportation Research Part D: Transport and Environment, 26, 42-46.
ATAG (2014). Aviation Benefits Beyond Borders 2014 Report. Air Transport Action Group,
Geneva.
Atmosfair (2014). Atmosfair Airline Index 2014. Atmosfair, Berlin.
Becken, S. (2004). How tourists and tourism experts perceive climate change and carbon-
offsetting schemes. Journal of Sustainable Tourism, 12(4), 332-45.
Bliemer, M. C., Rose, J. M., & Hensher, D. A. (2009). Efficient stated choice experiments for
estimating nested logit models. Transportation Research Part B: Methodological, 43(1), 19-
35.
Boxall, P. C., & Adamowicz, W. L. (2002). Understanding heterogeneous preferences in
random utility models: a latent class approach. Environmental and resource economics, 23(4),
421-446.
Brouwer, R., Brander, L., & Van Beukering, P. (2008). “A convenient truth”: air travel
passengers’ willingness to pay to offset their CO2 emissions. Climatic Change, 90(3), 299-
313.
Burnett, P., & Hanson, S. (1982). The analysis of travel as an example of complex human
behavior in spatially-constrained situations: Definition and measurement issues.
Transportation Research Part A: Policy and Practice, 16(2), 87-102.
Caves, R. (2003). The social and economic benefits of aviation. Towards Sustainable
Aviation. London: Earthscan, pp. 36-47.
De Witt, A. (2011). The future traveller: a model based approach to determine passenger
demand at Amsterdam Airport Schiphol. Doctoral dissertation, TU Delft, Delft.
Dunlap, R., Liere, K. V., Mertig, A., & Jones, R. E. (2000). Measuring endorsement of the
new ecological paradigm: A revised NEP scale. Journal of social issues, 56(3), 425-442.
Edgell Sr, D. L. (1990) International tourism policy. Van Nostrand Reinhol.
Filippone, A. (2008). Analysis of carbon-dioxide emissions from transport aircraft. Journal of
Aircraft, 45(1), 185-197.

38 Consumer heterogeneity, transport and the environment
Fujii, S., & Gärling, T. (2003). Application of attitude theory for improved predictive
accuracy of stated preference methods in travel demand analysis. Transportation Research
Part A: Policy and Practice, 37(4), 389-402.
Gössling, S., Broderick, J., Upham, P., Ceron, J. P., Dubois, G., Peeters, P., & Strasdas, W.
(2007). Voluntary carbon offsetting schemes for aviation: Efficiency, credibility and
sustainable tourism. Journal of Sustainable tourism, 15(3), 223-248.
Gössling, S., Haglund, L., Kallgren, H., Revahl, M., & Hultman, J. (2009). Swedish air
travellers and voluntary carbon offsets: towards the co-creation of environmental value?
Current Issues in Tourism, 12(1), 1-19.
Greene, W. (2007). Nlogit version 4 reference guide. Econometric Software Inc. Plainview,
New York.
Hares, A., Dickinson, J., & Wilkes, K. (2010). Climate change and the air travel decisions of
UK tourists. Journal of Transport Geography, 18(3), 466-473.
Higham, J. E., & Cohen, S. A. (2011). Canary in the coalmine: Norwegian attitudes towards
climate change and extreme long-haul air travel to Aotearoa/New Zealand. Tourism
Management, 32(1), 98-105.
IATA, (2014). New IATA Passenger Forecast Reveals Fast-Growing Markets of the Future.
Press Release No.: 57, 16 October 2014, http://www.iata.org/pressroom/pr/pages/2014-10-16-
01.aspx.
ICAO (2007). Annual report of the council. International Civil Aviation Organization
(ICAO). Montréal, Quebec, Canada.
Kamakura, W. A., & Russell, G. (1989). A probabilistic choice model for market
segmentation and elasticity structure. Journal of Marketing Research, 26, 379-390.
Kroesen, M. (2013). Exploring people's viewpoints on air travel and climate change:
Understanding inconsistencies. Journal of Sustainable Tourism, 21(2), 271-290.
Lee, D. S., Fahey, D. W., Forster, P. M., Newton, P. J., Wit, R. C., Lim, L. L., … & Sausen,
R. (2009). Aviation and global climate change in the 21st century. Atmospheric Environment,
43(22), 3520-3537.
Lu, J. L., & Shon, Z. Y. (2012). Exploring airline passengers’ willingness to pay for carbon
offsets. Transportation Research Part D: Transport and Environment, 17(2), 124-128.
MacKerron, G. J., Egerton, C., Gaskell, C., Parpia, A., & Mourato, S. (2009). Willingness to
pay for carbon offset certification and co-benefits among (high-) flying young adults in the
UK. Energy Policy, 37(4), 1372-1381.
Mair, J. (2011). Exploring air travellers’ voluntary carbon-offsetting behaviour. Journal of
Sustainable Tourism, 19(2), 215-230.
McFadden, D. (1986). The choice theory approach to market research. Marketing science,
5(4), 275-297.
Olli, E., Grendstad, G., & Wollebaek, D. (2001). Correlates of environmental behaviors
bringing back social context. Environment and behavior, 33(2), 181-208.
Rose, J. M., & Bliemer, M. C. (2009). Constructing efficient stated choice experimental
designs. Transport Reviews, 29(5), 587-617.

Chapter 3 – Revealing heterogeneity of passenger on environmental policies 39
Rose, J. M., Bliemer, M. C., Hensher, D. A., & Collins, A. T. (2008). Designing efficient
stated choice experiments in the presence of reference alternatives. Transportation Research
Part B: Methodological, 42(4), 395-406.
Schiphol Group (2012). In Facts and Figures. Retrieved from
http://www.schiphol.nl/SchipholGroup/Company1/Statistics/FactsFigures.htm.
Sgouridis, S., Bonnefoy, P. A., & Hansman, R. J. (2011). Air transportation in a carbon
constrained world: Long-term dynamics of policies and strategies for mitigating the carbon
footprint of commercial aviation. Transportation Research Part A: Policy and Practice,
45(10), 1077-1091.
Swait, J. (1994). A structural equation model of latent segmentation and product choice for
cross-sectional revealed preference choice data. Journal of retailing and consumer services,
1(2), 77-89.
Vermunt, J. K., & Magidson, J. (2005). Latent GOLD® choice 4.0 user's manual. Statistical
Innovations Inc., Belmont, MA.

40 Consumer heterogeneity, transport and the environment

41
4. Historic vehicles: an overview from a transport
policy perspective
Araghi, Y., Van Wee, B., & Kroesen, M. (2017). Historic vehicles: an overview from a
transport policy perspective. Transport Reviews, 1-19. doi: 10.1080/01441647.2016.1273275
Abstract
Historic vehicles are the heritage of road transport that have surprisingly received little
attention in the academic literature. This study presents an overview of the literature on
historic vehicles, focusing on the three topics that dominate the policy debate on transport:
environmental, safety, and congestion impacts. We observed that polluting emissions of HVs
are per kilometre much higher (often a factor 5 or more) than those of moderns vehicles. The
annual average mileage per vehicle per year of historic vehicles is much lower than other
vehicles. The lower active and passive safety levels of historic vehicles are compensated by
the way these vehicles are driven, resulting in the risk factors per kilometre being roughly
equal or lower. The contribution of historic vehicles to congestion is negligible. However, the
transport policy discourse is divided on the topic of historic vehicles. More comprehensive
and effective laws and regulation are needed to protect this aspect of the heritage of road
transport whilst concurrently avoiding or limiting the problems caused by them.
4.1. Introduction
Historic vehicles (HVs) are the heritage of road transport. They represent the origins of
(motorized) vehicles and show society how far (motorized) vehicles have evolved since their
inception in the nineteenth century.

42 Consumer heterogeneity, transport and the environment
HVs not only convey cultural heritage, but also enjoy large and diverse support from
enthusiasts within the HV movement (Tam-Scott, 2009). HVs have a modest beneficial
economic impact by creating revenues for various private businesses and providing jobs
(Frost & Hart, 2006). Furthermore, HVs play a noticeable and symbolic role in social
gatherings (e.g. wedding ceremonies) and monumental events (e.g. national days).
However, the significantly higher air pollution emissions of older vehicles (Zachariadis,
Ntziachristos, & Samaras, 2001) and lower safety records (Robertson, 1981) compared with
modern vehicles may compel policy makers to take action against the use of HVs which may
threaten their future existence. The increasingly higher penetration of vehicles with relatively
low emissions (for instance internal combustion engine vehicles, electric and hybrid vehicles)
increases the relative share of emissions of HVs4. Therefore, from a policy perspective HVs
are an interesting category of vehicles.
Nevertheless, there is hardly any research into HVs by scholars (Koshar, 2004), and only
sporadic attention from interest groups. The Fédération Internationale des Véhicules Anciens
(FIVA) is one of the main organisations that has contributed to publishing reports (in
collaboration with the University of Brighton) mainly on the economic and cultural aspects of
HVs and related events (Frost & Hart, 2006; Frost, Hart, & Kaminski, 2011; Kaminski,
Smith, & Frost, 2013a), whereas some academic publications have looked at peripheral
aspects of historic vehicles. These HV-related studies cover a variety of topics such as the
historic development of the car culture, the technological and design development of cars and
the evolution of consumer demand and manufacturers’ response in shaping consumer
expectations (Foster, 2003; Gartman, 1994; Koshar, 2004; Schafer & Victor, 1997). Other
studies have focused on the environmental impact of scrapping old cars (see Van Wee, De
Jong, & Nijland, 2011 for a review of the literature).
Finally, some studies have focused on classic car enthusiasts (Dannefer, 1980; Tam-Scott,
2009). Delyser and Greenstein (2015), two HV enthusiasts themselves, follow a classic car
from being abandoned to becoming a fully restored car, while theorise on the processes of
restoring a classic car.
The fact that in academic research little attention has been paid to HVs does not reflect their
societal and policy relevance. In addition, due to the increasing numbers of historic vehicles,
the topic will become more important in the future. Given this background, the aim of this
paper is to reduce the gap in academic literature on HVs by focussing on three important
research questions: 1) What information on HV ownership and use is available from reliable
sources?, 2) what is the relative and absolute impact of HVs to environmental, safety and
congestion problems (three areas that heavily dominate the policy debate on transport)? and 3)
What are the contributions of HVs to the economy and society?
We answer these questions by studying available material including the academic literature,
policy documents and government reports, plus exploring available data sources. We include
these policy reports and explore databases because of the scarcity of academic studies in this
area. Note that some of the studies published in non-academic literature were written by
4 Here we would like to emphasise that there is a clear difference between the problems and benefits of HVs that relate to the period of
production, and the problems or benefits caused by the ageing effects of modern vehicles, used as a regular means of transport . The first
problems and benefits relate to the specific characteristics of the vehicles, regardless of their age, such as design and technologies used (and implications for environmental pressure and safety). The second problems and benefits relate to the ageing of the vehicles. Zachariadis et al.
(2001) and Faiz et al. (1995) discuss that as the age of the modern vehicle increases their emissions also increase, which requires inspection
and maintenance programmes put in place by individual countries.

Chapter 4 – Historic vehicles overview & transport policy 43
scholars. The sources in some cases only provide information for passenger cars, not for other
vehicles. We have made this explicit throughout the study.
In section 4.2. we provide definitions for HVs, and discuss trends in the supply of HVs, and
the relevant policy discourse. Our methodology in gathering the material for this overview
study is described in section 4.3. HV ownership and use in several countries is discussed in
sections 4.4. and 4.5. respectively. The environmental, safety and congestion impacts are
discussed in sections 4.6. to 4.8., followed by the social appeal and economic effects of HVs
in section 4.9. Section 4.10. offers a concluding discussion and future research perspectives.
4.2. Definition of HVs, trends in supply and demand, and the policy
discourse on HVs
4.2.1. Definition
According to FIVA, historic vehicles are “mechanically propelled road vehicles which are:
- at least 30 years old;
- preserved and maintained in a historically correct condition;
- not used as means of daily transport;
therefore are part of our technical and cultural heritage.” (FIVA, 2014; p.3)
In 2009, the European Parliament officially endorsed HVs as vehicles of “historic interest”
under Directive: 2009/40/EC and in 2014, modified its previous directive and recognised a
vehicle as an HV if it had the following characteristics:
- It was manufactured or registered for the first time at least 30 years ago;
- Its specific type, as defined in the relevant union or national law, is no longer in production;
- It is historically preserved and maintained in its original state and has not undergone
substantial changes in the technical characteristics of its main components. (DIRECTIVE
2014/45/EU-page 57)
The definitions above indicate that not every ageing vehicle is eligible to be defined as
‘historic’. However, it is often impossible to check and verify the characteristics of vehicles
mentioned in other studies and reports to distinguish historic vehicles from other vehicles over
30 years old. Therefore in this study we assume that all vehicles over 30 years are HVs.
Moreover, it should be mentioned that it is difficult to distinguish old vehicles in operation
due to poverty and those HVs kept for their historic and heritage purposes. In this study we
chose to only apply an age criterion. This may impact the findings, such as the applicable HV
statistic in our analysis.
4.2.2. Trends in supply
On the supply side, an important factor leading to the current availability of HVs is the
number of automobiles manufactured more than three decades ago. Most information is
available for passenger cars, which in numbers represent the dominant category of HVs.
Based on figures from the Worldwatch Institute (Worldwatch, 2015) and also from Rodrigue,
Comtois, and Slack (2013), the worldwide auto (cars) production rate started to grow
gradually from the early 1950s (estimated to be 8 million auto productions annually). This
pace became more rapid in the 1960s (reaching approximately 20 million by the second half
of the 1960s) and 1970s when the annual auto production reached 31 million in 1979 (Renner,

44 Consumer heterogeneity, transport and the environment
2003). The increasing trend continues today with production increasing from 41 million in
2000 to 67 million in 2014 (Statista, 2015). With more autos being produced, more vehicles
will over time become historic vehicles.
A further increase in HVs can be expected due to the increasing survival rates of vehicles.
According to statistics from the US, in the 1990s, the average survival rate for cars above 30
years was 6.6% (trucks 45.1 %), whereas this figure was 0.8% in the 80s and 0.4% in the
1970s (trucks 20.7 %)(Davis, Diegel, & Boundy, 2014). Combining both effects, the number
of HVs can be expected to grow in the future.
4.2.3. The policy discourse
Policy makers face a dilemma with respect to historic vehicles. On the one hand, HVs are
gaining in popularity and have become more relevant from an economic point of view. On the
other hand, HVs are often the subject of environmental and safety concerns, since more
recently manufactured vehicles are cleaner and safer (mainly due to the regulations and
improvements made by vehicle manufacturers). The consequence of this dilemma results in
policies that can be supportive or discouraging for HVs in several countries. We provide some
examples in here.
In some countries, policy makers have taken measures to encourage scrapping old vehicles for
environmental concerns and economic motives such as helping the car industry (Van Wee et
al. , 2011), while in other countries (e.g. Sweden and UK) car owners were motivated to
increase the lifespan of vehicles for a more sustainable car consumption culture
(Nieuwenhuis, 2008). Note, that the mentioned policies do not distinguish between HVs (e.g.
based on the EU or FIVA definitions) and other vehicles over 30 years.
Another example relates to the emissions caused by HVs. In several EU countries, local
municipalities have introduced regulations to ban older vehicles from their (inner) city areas,
to reduce local air pollution. These areas are normally referred as “Low Emission Zones” 5.
However, in some other cities, HVs were exempted from such regulations. Examples are
London and several German cities. Moreover, in some countries, like Germany, UK and the
Netherlands, HVs have road tax benefits.
4.3. Methodology in obtaining the sources of data
A search using the keywords “historic”, “classic”, “vintage” combined with “vehicle” or “car”
or “auto” in the well-known academic databases – Scopus, Web Of Science (WOS), and
Google Scholar –revealed hardly any relevant results, indicating the scarcity of published
research in this field. Therefore, as explained in the introduction, we also considered
government reports and non-academic literature. We included only those sources that had
verifiable findings or were published by (independent) research institutes, excluding
documents without references or a description of the methodology as well as documents
published by interest groups.
In addition we used databases such as the “Transportation Energy” data book (edition 33) by
Davis et al. (2014) published annually in the US since 1981, and databases by Eurostat that
are regularly published by the European Commission. In some instances, we performed our
5 These areas can be found at the official website affiliated to EU commission: urbanaccessregulations.eu

Chapter 4 – Historic vehicles overview & transport policy 45
own calculations, estimations or inferences by cross-checking different reports, tables and
graphs. Finally, we sometimes relied on our own experience 6 and on results from discussions
with experts in the field of historic vehicles (several discussions with FIVA members and
other HV experts).
4.4. HV numbers, types and year of manufacture
4.4.1. HVs in numbers
We first look at the numbers of HVs because these numbers are related to the use of the
vehicles and the economic (insurances, taxes, restoration costs, etc.) and wider societal
impacts. According to FIVA, in 2006 there were 1,950,000 HVs in the EU, of which almost
80% were roadworthy (Frost & Hart, 2006). The total fleet of vehicles in the EU in 2006 was
255 million, thus HVs constituted almost 1% of the total EU fleet of vehicles in year 2006
(Nieuwenhuis, 2008).
From more recent sources available to us, we were able to establish a limited inventory of the
overall number of registered historic vehicles and the total number of the entire vehicle fleet
(modern and old) of a few European countries as presented in Table 4.1. The selection of
these countries was based on data availability and verifiability from independent sources. This
small sample of EU countries includes countries from different regions of the continent,
although we do not claim these countries to be representative of their neighbouring nations or
Europe in general. Table 4.1 displays the numbers of HVs and their share in the total fleet of
vehicles differ among these countries, ranging from below 0.6% in Germany to almost 6% in
Greece. Adding up the HVs of these six countries, they constitute of about 1.8% of the total
number of vehicles in the selected countries.
Table 4.1 Total HV and overall vehicle fleet sizes in some EU countries (data include all
vehicle categories)
Country Year No. of HVs
( >30 years)
Total
fleet
(million)
HV % to total
fleet of
vehicles
Source
UK 2010 805,588 35.50 2.27 Driver and Vehicle Licensing Agency
(DVLA) for the UK
Germany 2013 313,815 53.00 0.59** Kraftfahrt-Bundesamt (KBA), which is the
German federal motor transport authority
Denmark* 2012 79,055 2.20 3.59 Centralregisteret for motorkøretøjer
(CRM), which is the Danish central
registry for motor vehicles
Netherlands 2005 280,000 8.60 3.25 Centraal Bureau voor de Statistiek (CBS),
which is the Dutch institute for statistics
Greece 2012 402,932 6.75 5.97 Car Importers Association Representatives
(CIAR) of Greece
Sweden* 2013 213,363 5.37 3.97 Motorhistoriska Riksförbundet (MHRF),
which is the Swedish national federation
for historic vehicles
* Tractors were excluded from the total vehicle figures. For further explanation see section 4.2.
** This figure is for registered vehicles older than 30 years. The percentage of all historic vehicle (registered and
unregistered) adds up to 0.97% of all vehicle fleet.
6 The second author of this paper has three historic cars, and has been a member of the vintage air-cooled VW club Holland since 1983.

46 Consumer heterogeneity, transport and the environment
However, the data in table 4.1 should be treated with caution. According to the sources there
are cases where a vehicle was not de-registered when scrapped, or simply not used anymore.
This makes the data sources less reliable and results in an overestimation of the number of
HVs. Moreover, standards for statistics vary between countries, so it is difficult to compare
the aggregate numbers across countries. For example, statistics may or may not include some
categories of vehicles and non-roadworthy vehicles. We contacted members of the HV
community in some countries to verify the statistics. Based on their comments we conclude
that Table 4.1 probably presents some overestimations.
4.4.2. Breakdown of HVs by type
The numbers of HVs can be broken down by vehicle type. In 2011 in the UK, around 90% of
the HVs were passenger cars and motorbikes, 5% buses, coaches and trucks, 2% military
vehicles and the rest agricultural and steam vehicles (Frost et al., 2011). A dataset from the
German Association of the Automotive Industry (Verband der Automobilindustrie [VDA])
for 2013 reveals that around 92% of HVs were cars, 2.5% motorbikes, less than 0.1% buses,
3% trucks and 2.1% tractors.
More recently, a FIVA survey conducted in 2014 among a sample of 19,432 HV owners
across 15 EU countries (Araghi et al., 2016) provides a more accurate picture. This sample of
owners registered the information of 43,612 HVs from which 72.6% were cars or vans and
19.7% motorbikes and scooters. This is not in line with the figures above on the composition
of different type of vehicles in the HV fleet.
4.4.3. Breakdown HVs by year of manufacture
HVs can be further categorised according to their year of manufacture. This decomposition is
potentially relevant to transport policy, since environmental and safety characteristics are
greatly dependent on the year of manufacture. The FIVA survey in 2006 revealed that 30% of
HVs in EU member states were pre 1940, 30% were built between 1940 and 1960, and the
rest (40%) were built between 1960 and 1975. Note that 1975 was the most recent year for a
vehicle to be considered as HV in the 2006 FIVA survey.
Table 4.2 Historic Vehicle categorization in Germany by age (Source: VDA, 2013)
Year of manufacture Percentage of total HVs
1930 - 1934 19.6
1935 - 1939 19.8
1940 - 1944 24.8
1945 - 1949 16.0
1950 - 1959 14.5
1960 to later 5.3
More recently, the German Association of the Automotive Industry (VDA) provided a
breakdown of HVs by the year of manufacturing in Germany up to the end of 2013. Table 4.2
displays this breakdown in five-year incremental steps, categorizing all vehicles made after
1960 in one group. One can see that the VDA data (shown in Table 4.2) are not consistent
with the FIVA (2006) data. In Germany the share of historic vehicles produced between 1940

Chapter 4 – Historic vehicles overview & transport policy 47
and 1960 is over 55%, whereas in the FIVA data, this is 30%. In the FIVA data, the relative
numbers of vehicles produced after 1960 is much higher (40%) compared to the VDA data
(5%). A side note on the comparison of these two data sets: in general the age of HVs in
Germany is skewed more towards the first half of the twentieth century, whereas the FIVA
figures (depicting the EU-wide picture) is skewed to the second half.
Table 4.3 presents the breakdown by age from the recent FIVA survey in 2014 (Araghi et al.,
2016), where 7.6% of HVs were manufactured pre-1940, 25.5% between 1940 and 1960 and
66.9% of the vehicles were made after 1960. The age of the vehicles in the recent survey
(2014) is skewed towards vehicles of less than 50 years of age. Again the age composition of
HVs at the EU level contradicts the age composition of HVs in Germany. This may be an
indication that in some countries there is a tendency to preserve vehicles longer than the rest,
probably due to cultural differences. An alternative explanation is that the response rates vary
between countries, depending on the age of vehicles, e.g. because of the way in which country
approaches HV owners.
Table 4.3 HV age categories in FIVA 2014 sample
Year of manufacture % of total HVs
1886 - 1900 0.6
1901 - 1920 0.7
1921 - 1940 6.3
1941 - 1960 25.5
1961 - 1983 66.9
4.5. HV use
In this section we present data for the annual mileage and the number of HVs in use. These
two indicators are of paramount importance when it comes to assessing their potential impact
on the environment, safety and congestion. In addition to these policy relevant criteria, HV
use is relevant for HV-related businesses (e.g. insurance, maintenance and restoration
companies). For mileage we consider both yearly use and HVs’ share in the fleet mileage.
4.5.1. Average Kilometres driven by HVs (mileage)
The average distance driven by HVs can be calculated under two scenarios: 1) for active
vehicles only, 2) for all HVs, including non-active vehicles. For each of these scenarios
different average mileages are derived. For instance in the case of Netherlands, in 2006,
average yearly mileage was 1950 kilometres for active HVs only, and 1050 km for all HVs,
active and non-active (Rijkeboer, 2008).
Rijkeboer (2008) estimated the average annual mileage for HVs in the EU to be 2100 km.
Furthermore, these data showed that around 50% of HVs were used for less than 500 km per
year and that only 7% were used for more than 3500 km per year. Frost et al. (2011) report
comparable figures in the UK for 2011, in which more than 50% of HVs were driven less than
800 km per year and only 18% were used at least weekly.

48 Consumer heterogeneity, transport and the environment
A more recent Dutch study of the historic vehicle association (FEHAC) revealed that 45% of
HVs are used for less than 500 km per year (FEHAC, 2012), confirming the results of
previous reports. Moreover, average mileage per HV decreased from 1950 km/year in 2006 to
1700 km/year in 2012 (a reduction of 13%). Finally, the 2014 FIVA survey showed that, on
average, classic cars (72% of all HVs in the sample) were driven around 2500 km per year.
Figure 4.1 shows the relationship between the age of a vehicle and annual mileage in the
Netherlands (Rijkeboer, 2008). Yearly use drops from 25,000 km for vehicles up to one year
old, to below 5000 km for vehicles 22 years old. At this stage the trend plateaus, suggesting
that vehicle use per year becomes almost constant. It can be speculated that those vehicles
which are not dismantled after the first 25 years of age are normally owned by enthusiasts and
are kept in relatively suitable conditions for prolonged use. These vehicles are driven less than
4500 km per year (Rijkeboer, 2008).
Figure 4.1 Annual vehicle usage against age, Note: CBS stands for Dutch bureau of
statistics. Source: Rijkeboer (2008)
Data from the Transportation Energy Data Book - edition 33 (Davis et al., 2014) show that in
the USA 60% of all cars over 20 years old 7 are driven less than 9600 km annually and 30%
of these cars are driven less than 3200 km. These data confirm decreasing use with age, as in
the Netherlands.
A study conducted by the Dutch Planbureau voor de Leefomgeving8 (PBL) found that in 2011
in the Netherlands cars manufactured in the 1970s were driven around 2000 – 2200 km/year,
whereas those in the early 1980s were driven over 4000 km/year (Hoen et al., 2012),
suggesting a decrease of yearly use with age, also within the category of historic cars.
4.5.2. The share of older vehicles still in use
Here we explore the share of HVs mileage among the whole fleet of vehicles. Using a report
from the Driver and Vehicle Licensing Agency (DVLA), Frost et al. (2011) conclude that in
2010 in the UK the total vehicle miles driven was around 308 billion miles (493 billion km),
and HVs drove around 750 million miles (1200 million km), implying HVs have a share of
0.24% of the total distance travelled by all vehicles on UK roads. In an earlier report Frost and
Hart (2006) also provide figures at the EU level; the total distance travelled by modern
vehicles was equal to 2.2 trillion km. For HVs the distance was 1.4 billion km, accounting for
7 The data book reports data for all cars over 20 years together, no disaggregation by age class for these data is provided.
8 Netherlands Environmental Assessment Agency

Chapter 4 – Historic vehicles overview & transport policy 49
0.06 % of the total distance travelled by all vehicles. The UK's higher proportion of HV
kilometres is probably accounted for by the UK's reputation for having a relatively long
standing HV culture.
Hoen et al. (2012) reported somewhat different figures for the year 2011 for the Netherlands.
They conclude that cars manufactured in 1986 or before (by then: over 25 years old) had a
share of 1.5% of the total distance travelled by all cars in the Netherlands. Note that this
number also includes cars that are 25-30 years old. One possible explanation for this high
percentage is that in the years preceding 2011 many cars older than 25 years were imported to
the Netherlands, at least partly because of tax exemptions (Hoen et al., 2012). However, this
trend has recently been reversed due to new tax rules in the Netherlands and as a result many
cars over 25 years old are now being exported (Stolk, 2014).
We conclude that there is hardly any information on the share of HVs in the overall use of
vehicles, and results show strongly diverging shares. The share in total use of vehicles older
than 30 years is very likely below 1%. Moreover, the number of cars active in road transport
declines rapidly with age.
4.6. Environmental impacts of HVs
Motorized vehicles produce various air pollutants such as PM10, NOx and HC 9 emissions,
which are generally considered to have a negative impact on health (Chapman, 2007). HVs
come with old technology, which are relatively more polluting (Kim, Keoleian, Grande, &
Bean, 2003; Zachariadis et al., 2001). In this section we report on the literature on the
environmental impacts of HVs.
4.6.1. Vehicle Emissions
Over the course of years and often due to emissions regulations, vehicle manufacturers have
introduced new innovations in engines, car aerodynamics and exhausts to produce cleaner,
quieter and more fuel efficient vehicles. This means HVs have become relatively polluting
compared to modern vehicles. On the other hand, the driving behaviour of HV enthusiasts
might compensate some of the differences in per kilometre emissions. We did not find any
source of information on the driving behaviour of HV users. However, assuming that HVs are
driven relatively carefully (see section 7 on HV safety) and with lower than average speeds,
this might result in lower emissions compared to situations in which these vehicles would be
driven as if they were modern vehicles. There are studies such as Kean, Harley, and Kendall
(2003) which confirm that lower vehicle speeds result in lower emissions.
In this study we only focus on the share of passenger cars (among all HV categories) for total
emissions, firstly because of the availability of sources, and secondly because this category
constitutes the majority of HVs.
Non-CO2 Emissions
Rijkeboer (2008) investigated several scenarios regarding the use of cars above 25 years old
for the Netherlands. An emission calculation model was used to estimate CO, HC, NOx, and
PM as emission factors, under different scenarios. The model, based on data from Statistics
Netherlands (CBS), distributes kilometres driven over age classes, and has age class specific
9 HC stands for hydrocarbons and refers to emissions from various unburned mixtures of hydrogen and carbon in fuel and rarely, oil.
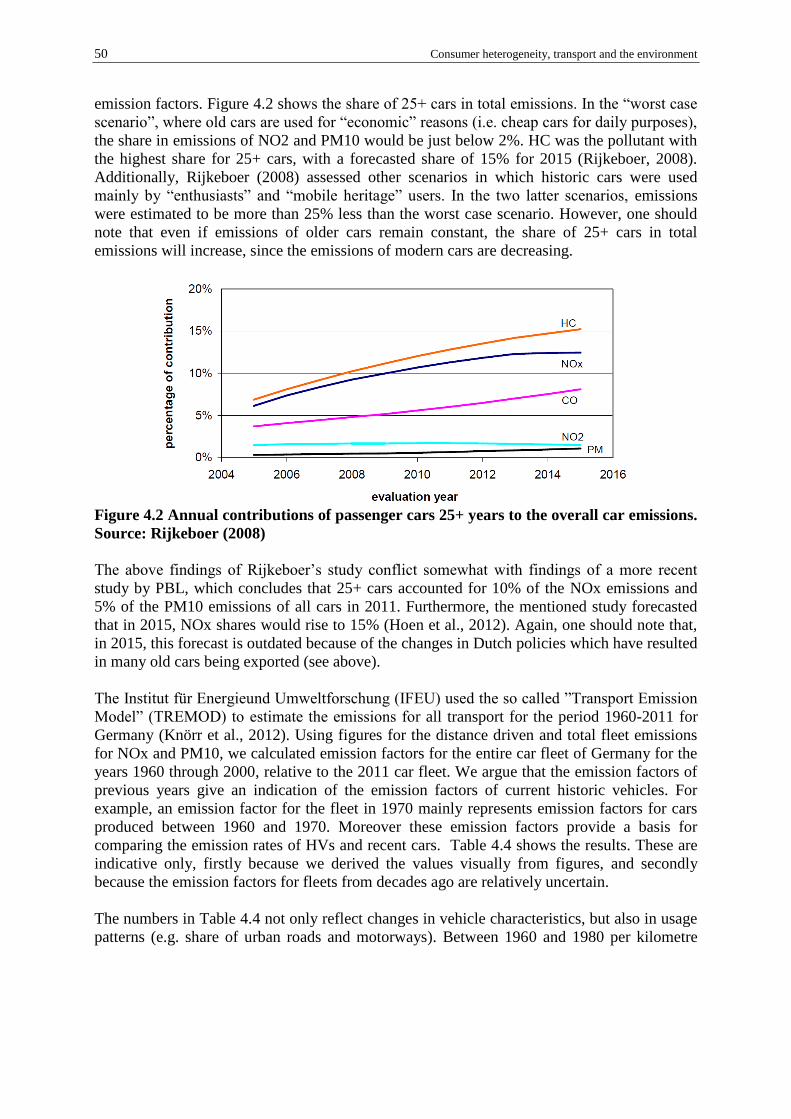
50 Consumer heterogeneity, transport and the environment
emission factors. Figure 4.2 shows the share of 25+ cars in total emissions. In the “worst case
scenario”, where old cars are used for “economic” reasons (i.e. cheap cars for daily purposes),
the share in emissions of NO2 and PM10 would be just below 2%. HC was the pollutant with
the highest share for 25+ cars, with a forecasted share of 15% for 2015 (Rijkeboer, 2008).
Additionally, Rijkeboer (2008) assessed other scenarios in which historic cars were used
mainly by “enthusiasts” and “mobile heritage” users. In the two latter scenarios, emissions
were estimated to be more than 25% less than the worst case scenario. However, one should
note that even if emissions of older cars remain constant, the share of 25+ cars in total
emissions will increase, since the emissions of modern cars are decreasing.
Figure 4.2 Annual contributions of passenger cars 25+ years to the overall car emissions.
Source: Rijkeboer (2008)
The above findings of Rijkeboer’s study conflict somewhat with findings of a more recent
study by PBL, which concludes that 25+ cars accounted for 10% of the NOx emissions and
5% of the PM10 emissions of all cars in 2011. Furthermore, the mentioned study forecasted
that in 2015, NOx shares would rise to 15% (Hoen et al., 2012). Again, one should note that,
in 2015, this forecast is outdated because of the changes in Dutch policies which have resulted
in many old cars being exported (see above).
The Institut für Energieund Umweltforschung (IFEU) used the so called ”Transport Emission
Model” (TREMOD) to estimate the emissions for all transport for the period 1960-2011 for
Germany (Knörr et al., 2012). Using figures for the distance driven and total fleet emissions
for NOx and PM10, we calculated emission factors for the entire car fleet of Germany for the
years 1960 through 2000, relative to the 2011 car fleet. We argue that the emission factors of
previous years give an indication of the emission factors of current historic vehicles. For
example, an emission factor for the fleet in 1970 mainly represents emission factors for cars
produced between 1960 and 1970. Moreover these emission factors provide a basis for
comparing the emission rates of HVs and recent cars. Table 4.4 shows the results. These are
indicative only, firstly because we derived the values visually from figures, and secondly
because the emission factors for fleets from decades ago are relatively uncertain.
The numbers in Table 4.4 not only reflect changes in vehicle characteristics, but also in usage
patterns (e.g. share of urban roads and motorways). Between 1960 and 1980 per kilometre

Chapter 4 – Historic vehicles overview & transport policy 51
emissions of NOx remained quite stable. But from 1980 we observe a reduction 10
in NOx to
about one sixth of those in 1960-1980.
Between 1960 and 1990 per km emissions of PM11
increased, but then dropped by 60%
between 1990 and 2011. It is important to realize that these are average emission factors for
the entire fleet, not for new cars. New cars in 2011 have much lower emission factors than
those of the whole car fleet.
Table 4.4 Fleet average emission factors of passenger car for NOx and PM10, in
Germany, 1960-2011. Own calculations based on Knörr et al., (2012)
Year NOx PM10
index 2011=100
1960 583 163
1970 585 166
1980 611 197
1990 434 251
2000 178 212
2011 100 100
CO2 emissions
Unlike for PMx, NOx, CO and HC, there are no per kilometre emission standards for vehicles
for CO2. Nevertheless, the EU did implement CO2 policies (European Commission 2012 -
IP/12/771) to reduce CO2 emissions by new cars and vans to 130 (gr/km) by 2015 and to (on
average, and measured under test conditions) 95 (gr/km) by 2020, compared with an average
of 137.5 (gr/km) in 2011. The USA target for 2025 is to reduce CO2 emissions to 143
(gr/mile) (Davis et al., 2014), which is approximately 90 (gr/km).
An important question is: How do the CO2 emissions of HVs per kilometre relate to modern
vehicles? There is hardly any literature on this topic for all HVs but Knörr et al., (2012) offers
some information on passenger cars. Implementing the same technique that was used to
derive table 4.4, we calculated indicative emission factors for CO2. Table 4.5 shows that
between 1960 and 1980, CO2 emissions per km per car increased by about 10% in Germany.
Since then, these emission decreased by about 20% up until 2011. Again, these figures relate
to fleet averages in real world conditions, and not to new cars under test conditions.
10 NOx vehicle emissions are a mixture of nitrogen monoxide (NO), which is not a risk for health, and nitrogen dioxide (NO2), which is a
health risk. Before the introduction of three way catalytic converters on new petrol cars (starting around 1987, with a share of 100% since
1993) the share of NO2 in total NOx emissions was relatively low (5-10%). Cars with a three way catalytic converter have a share of NO2 of up to 55%. We conclude that the difference in NOx emission factors between historic petrol cars and modern cars is much larger than the
difference in NO2 factors. Consequently the decrease in the harmful NO2 emissions is much less than the decrease in NOx emissions (Hoen et
al., 2012). 11 There is another issue about PM that we need to point out in here. Older diesel engine vehicles emit more PM than newer engines (Twigg,
2007), but modern vehicles have a higher share of ultra-small particulates (e.g. PM2.5) in total PM emissions, and these particulates have a
relatively more negative impact on human health than PM10 (Gertler, Gillies, & Pierson, 2000).

52 Consumer heterogeneity, transport and the environment
Table 4.5 Fleet average emission factors of passenger car fleet for CO2, Germany, 1960-
2011. Own calculations based on Knörr et al., (2012)
Year CO2
(index 2011=100)
1960 114
1970 122
1980 126
1990 119
2000 110
2011 100
Based on Table 4.5, and assuming that historic cars are driven more carefully than average
(see section 7), we conclude that the CO2 emissions of HVs per km are somewhat higher (10-
20%) than those of the current car fleet. Since the order of magnitude of the decrease in CO2
emissions per km and the share of production-related CO2 emissions in total emissions are
about equal (Van Wee et al., 2000), we conclude that on a life cycle basis the CO2 emission
per km of historic cars is in the same order of magnitude as those of modern cars . Moreover,
since historic cars have a much lower yearly mileage, it follows that annual CO2 emissions
per car are much lower than those of modern cars.
4.6.2. Noise
Germany is one of the first countries to implement regulations for vehicle noise: the first
regulations date back to 1937 and were updated in 1953, 1957 and 1966. However,
international actions to control or lower vehicle noise levels did not come into effect until the
1970s (for motorcycles this was as late as 1980). Initial EU regulations for the noise
emissions of cars were introduced in 1970 (Mais, 2014). Since then, noise emission standards
have been periodically updated. Test conditions were also modified, which resulted in
strongly reducing the potential effects of more tight standards.
In addition, the share of noisier diesel cars in the EU auto fleet has increased significantly
over past decades. In practice between the mid-1980s and mid-2000s, the noise emissions of
new cars per kilometre in the Netherlands did not decrease significantly, and those of lorries
decreased by only 3-4 dB(A), much less than the change in maximum noise emissions under
test conditions (Mais, 2014). Consequently, we conclude that although the test standards have
been updated, the differences in noise emissions per km of historic cars and more recently
built cars would be small or in other words HVs are only slightly louder than modern diesel
cars.
4.7. Safety impacts
Both the active (e.g. brakes, handling) and passive safety features (crash worthiness) of cars,
vans and lorries have improved significantly since the 1940s. This was partly in response to
regulations, but also because of ‘autonomous’ (not policy-induced) improvements made by
the auto industry to enhance the safety features of vehicles, the introduction of crash zones

Chapter 4 – Historic vehicles overview & transport policy 53
and seat belts by Volvo and others being well known examples (Norin, Carlsson, & Korner,
1984).
The 2014 FIVA survey showed that 20 HV owners out of 19,432 were involved in an accident
which resulted in casualties. Among these accidents 17 cases involved personal damage
suffered by a driver or passenger(s) (0.08%) and 3 cases involved personal damage to third
persons (0.01%). Note that if a HV owner was killed in an accident, s/he was not included in
the study, leading to a potential (small) bias. The respondents in the FIVA survey reported
58.71 million kilometres in which 20 cases of accidents involving injuries occurred, resulting
in 34 accidents involving injuries per 100 million vehicle kilometres.
To put these numbers into perspective, in the year 2013 in the UK, there were 183,670 cases
of casualties due to road accidents (Mais, 2014). That year there were approximately 35
million vehicles in the UK (Grove, 2014), which on average drove approximately 12,640
kilometres (7900 miles) per year (Melbourne, 2014). This equals a total of 442 billion
kilometres travelled by vehicles, which results in an average of 41.5 injuries per 100 million
vehicle kilometres. This means that the accident rates of HV owners from the sample of 15
EU member states is around 20% less than the accident rate in the UK, which has one of the
lowest number of fatalities and injuries per 100 million vehicle kilometres of all European
countries (Wegman, 2013, based on OECD/ITF data). Thus, one may conclude that, although
HVs have a lower safety level (crash worthiness, handling), per km HV casualties and
fatalities are below the UK average.
How can we explain this contradiction? Again no previously published literature was found
on this topic, so we refer to several contacts with HV enthusiasts and own expertise. The
explanation is probably in the way historic cars are used. To protect their cars, HV owners
drive more often than average in favourable weather conditions – they do not want to expose
their vehicles to bad weather. Convertible historic cars generally leak water, making them less
attractive to drive under rainy conditions. Moreover, HVs are hardly used in the winter and
therefore they are rarely exposed to slippery conditions.
The importance of driving behaviour for accidents is confirmed by Martens (2014) referring
to Rumar (1985), where it is concluded that the driver contributes fully or partly to 94% of all
accidents and the malfunctioning vehicle to only 12%. There is an overlap because some
accidents have multiple causes (Martens, 2014) and even if the driver is the cause, the severity
of a crash is influenced by vehicle characteristics.
There is another indication that underpins our conclusion that HVs seem to have lower
accident rates than modern vehicles, which is the existence of special and very cheap
insurance for HV owners. For instance, in the Netherlands several companies offer insurances
for as little as 50 euros (roughly $57 USD) per year for older cars (e.g.,
http://deoldtimerverzekering.nl/). The low premium set by market-based insurance companies
expresses the low accident rates per vehicle basis, but not necessarily on a per km basis, since
HVs are used less than modern vehicles. However, one caution worth noting is that driver
characteristics also influence accident rates and insurance premiums, which is not the focus of
this study.
54 Consumer heterogeneity, transport and the environment
4.8. Congestion impacts
Providing and improving accessibility is one of the crucial goals of transport policy making.
One way to improve accessibility is by reducing congestion, both at the urban and inter-urban
level. An important question from the perspective of this study is: what is the impact of HVs
on congestion? We can provide a discussion for this topic only theoretically, due to a lack of
literature.
If we assume the share of HVs in overall vehicle kilometres to be around 0.24% (based on
UK figures from 2010; see section 5.2), a first rough estimate would be that HVs have a share
of 0.24% in congestion. However, we think the share is probably (much) lower, for several
reasons. First of all, many owners do not use their HVs on a daily basis. For instance, in the
FEHAC survey less than 10% of respondents reported daily use which was defined as more
than 3 times per week (FEHAC, 2012) and in the 2014 FIVA survey this number was around
2.4%. In addition, HV owners use their vehicles relatively frequently for events (see section
9), which are generally organized during the weekend.
Secondly, based on expert judgments, most owners have a modern vehicle available for daily
use. Thirdly, many owners mainly (or exclusively) drive under conditions of good weather,
whereas bad weather contributes to congestion (Koetse & Rietveld, 2009). Fourth, many HVs
do not have a cooling system that is adequate for conditions of severe congestion, which
discourages owners from driving under congested conditions. Combining these arguments,
one can conclude that it is likely that the share of HVs in congestion is lower than 0.24% and
therefore negligible.
4.9. Positive effects of HVs
This section discusses the positive effects derived from HVs. We categorize these into two
groups: a) social and b) economic effects of HVs.
4.9.1. Social effects
The European Union (DIRECTIVE 2014/45/EU) mentions that classic vehicles are preserved
for “heritage” purposes and represent an era or the historical period in which they were
manufactured. This means that HVs, as with historic buildings or anything preserved in a
museum, help to keep memories alive and thus have a societal impact. Most literature is
limited to the social benefits of the owners and users only.
Tam-Scott (2009) and Dannefer (1980) extensively discuss the emotional bond between HVs,
their owners and amongst enthusiasts themselves. The emotional relationship between owners
and their vehicles results in enhanced durability of the vehicle thus guaranteeing prolonged
usage of the vehicle (Nieuwenhuis, 2008). In the same article, 1669 readers of a popular UK-
based classic car magazine were asked about reasons for the popularity of HVs. The
prevailing reason was the “enjoyment” of owning an “unusual car”. The second reason was:
“Having the satisfaction of being able to fix the car” and the third reason was about “finally”
owning and driving the car that they dreamed of in childhood.
In the 2014 FIVA survey, respondents were asked about the most important aspect of HV
ownership. The top three reasons were: “Recreational touring, taking part in events and
shows” (41.6%), “Nostalgia” (27.1%) and “Doing maintenance and repairs” (19.9%). Both

Chapter 4 – Historic vehicles overview & transport policy 55
surveys show that enjoyment and recreational reasons are highly important when it comes to
owning HVs.
4.9.2. Economic effects
The economic benefits of HVs occur in the form of purchasing spare parts, paying for
services and maintenance, spending on related magazines, local clubs and so on, mainly by
HV enthusiasts.
The 2014 FIVA survey revealed that each HV owner on average had spent €2335 on
restoration costs, €840 on maintenance and repairs and €607 on purchasing accessories in the
preceding year. These add up to a total of €3782 (note that this excludes purchasing vehicles,
taxes and fuel costs). Assuming that there were around 1.5 million HV owners in the EU and
multiplying these two figures, it would result in €5.7 billion in HV-related expenditure, of
which 98% occurred within EU. Given that each job would cost the employer around
€50,000 annually, the expenditure of HV owners could generate 114,000 jobs in EU.
However, without HVs, enthusiasts would probably spend their money on other goods and
services, so this estimated number of jobs does not entirely add to all jobs in EU.
Furthermore, one should consider that these estimates were based on studies conducted on
behalf of HV interest groups. In addition, it is important to note that turnover has a limited
value for assessing the economic benefits.
Next we provide the results of two case studies. Researchers at the University of Brighton in
collaboration with The Federation of British Historic Vehicle Clubs (FBHVC) have
conducted a series of studies on a few HV-related events focusing on the economic benefits
obtained from these events. Two key cases studied are the Goodwood Revival event and the
Beaulieu International Autojumble. The first event has been held in Chichester (UK) since
1998. It is visited by more than 145,000 people per day. In 2012, the event generated over £12
million (approximately €15 million in 2012) revenue for the local community and £36
million gross turnover for the UK economy (Kaminski, Smith, & Frost, 2013b).
The second example is Beaulieu International Autojumble, held near Southampton, UK in
2012. This event generated nearly £3 million for the local economy and overall provided £11
million turnover for the national economy (Kaminski et al., 2013a).
4.10. Conclusion and gaps in literature
4.10.1. Conclusions
The aim of this study was to obtain an overview of the available literature discussing historic
vehicles, in a field where academic articles hardly exist. We answered our three research
questions by: a) looking at the trend of vehicles potentially becoming HVs (supply) and the
policy discourse on HVs, b) providing information on HV use (i.e. annual mileage) and HV
numbers, and furthermore discussing the effects of HVs on the environment, safety and
congestion, as these are the most relevant effects from a policy viewpoint, and c) evaluating
the societal and economic benefits associated with HVs. In this section, we first summarise
our findings in table 4.6 and later present topics that require further research.

56 Consumer heterogeneity, transport and the environment
Table 4.6 Summary of topics discussed and the findings and level of certainty on each
topic Topic What is known Types of sources Level of
certainty
Non-CO2
emissions
CO, HC, NOx, and PM are the most
critical pollutants
Share of historic cars:
- NOx is 2% to 10%
- PM10 is 2% to 5%
- HC is 15%
Emissions of NOx & PM10 are 5 & 2.5
times modern cars (respectively)
Independent research institutes
i.e. PBL, IFEU, TNO
Moderate
CO2
emissions
CO2 emissions by historic cars is 10% -
20% more than modern cars Independent research institutes
i.e. IFEU
Moderate
Noise Noise emissions of HVs per km has
probably small difference with more
recently build cars
Authors’ reasoning based on
EU noise test standards and
regulations
Low
Safety historic vehicles are less safe than modern
ones but driving behaviour might
compensate for this to some extent
Accident rates by a sample of HV owners
from 15 EU states was around 20% less
than the accident rate in the UK
Based on empirical evidence
from a large survey and
literature on driving behaviour
High
Congestion 2.5% - 10% of HV owners use daily
HV mileage in UK was 0.24% of vehicle
traffic thus the same share in congestion
could be assumed
Empirical evidence
Expert opinion Moderate
Social emotional bonding between HVs and
their owners
main reason for HV ownership:
“enjoying”, “Recreational touring”
Academic literature and
empirical evidence
High
Economics €5.7 billion spent on HV restoration and
repairs by owners (potentially generating
114000 jobs in EU)
Other HV related economic benefits:
participation in events, lodging, selling
parts, charity events, ceremonies
Based on empirical evidence
from a large survey
Several accounts and reports
by interest groups on HV
related events
High
Low
By examining the literature and available data, the evidence shows that the number of
vehicles over 30 years old is growing (again we continue to assume that all vehicles over 30
years old are HVs). This increases the relevance of historic vehicles from a policy
perspective. However, statistics on HVs (which are needed for adequate estimates of social
impacts) are poor.
Roughly, HVs comprise 1% of vehicle fleets across the EU. About 90% of HVs are either
passenger cars or motorbikes. The share of HVs in country-specific vehicle fleets differs
strongly (indication of the range: 0.6% to 6%).
The share of HVs in total mileage is approximately less than one percent, but again there is a
range. One report from the Netherlands estimates the share of total mileage of vehicles that
are 25 years and older to be around 1.5%.
NOx and PM10 are proportionally the highest emissions associated with historic cars (note
that in this part of the study information is only provided for cars). They represent a few
percent in car-related emissions of those pollutants (see section 6 for details). The CO2
emissions of the modern car fleet per kilometre is 10-20% lower than that of 30+ year-old

Chapter 4 – Historic vehicles overview & transport policy 57
cars. On a life cycle basis, the CO2 emissions per km of 30+ cars will be about equal to the
fleet average.
Technically, historic vehicles are less safe than modern ones. However, it seems that this is
more than compensated for by driving behaviour and the weather conditions during which
HVs are most often used, resulting in lower accidents/fatality rates per kilometre driven
compared to fleet average values.
Given the use behaviour along with recent data from HV owners, we expect the contribution
of HVs to congestion to be less than the estimated 0.24% share of these vehicles in total
kilometres driven.
HV-related expenditure has economic benefits, but there is hardly any useful literature to
express this in terms of the share in GDP or employment. We estimate that the expenditure of
the HV enthusiast generates 114,000 jobs, EU wide. In addition, HVs have so-called external
benefits for the wider public: people who do not pay for HVs meanwhile enjoy the cultural
heritage of vehicles and viewing them.
After discussing the different aspects of HVs (such as: numbers of HVs active today, heritage
and cultural values of HVs, safety concerns, environmental implications), we think that
conducting more academic research by means of cost-benefit analysis (CBA) of HVs in
general, or specific policies addressing HVs may be useful for getting an overall picture of the
pros and cons of HVs for society or of specific policies. Such CBAs could also be used by the
public and decision makers’ to form an opinion regarding policy.
In this study, we attempt to contribute to a better understanding of the societal implications of
HVs through providing the facts and figures about the advantages and disadvantages of HVs
which are available to researchers, decision makers and wider society. We hope that future
studies will provide independent information on the societal impacts of HVs. We also believe
that there is a need to develop methods for the valuation of the emotional aspects of HVs for
the wider society and maybe also vehicle owners.
To conclude, although the transport policy discourse is divided on the topic of historic
vehicles, more comprehensive and effective laws and regulation are needed to protect the
heritage of road transport whilst at the same time avoiding or limiting the problems caused by
historic vehicles.
4.10.2. Direction for future research
During our review process, we sometimes faced contradictory statistics and data, which made
it difficult to draw general conclusion on some topics. In such cases, we have opted to report
the ranges of data on key issues such as HV ownership, usage and HV emissions. On the
topics of safety, congestion, noise hardly any sources of data were available.
This brings us to possible further research areas. To estimate the share of HVs in congestion,
safety and pollution, more reliable data on HV ownership (active and passive fleet) and HV
use needs to be collected. Better estimations of real world emissions of air pollutants plus
noise will enable decision makers to make informed decisions regarding the exclusion or
inclusion of HVs in environmental zones. Finally, it is important to evaluate ex-ante the pros

58 Consumer heterogeneity, transport and the environment
and cons of several HV-related policies, to be able to design policies that reduce societal
impacts without jeopardizing the positive societal impacts of HVs.
Acknowledgment
We would like to thank the Fédération Internationale des Véhicules Anciens (FIVA) for
providing some of the data and documents used in this study. We also would like to
acknowledge the contribution of Deirdre Casella, carefully and delicately edited the text and
last but certainly not least the three anonymous reviewers who provided many constructive
and useful comments.
References
Araghi, Y., Kroesen, M., & van Wee, B. (2016). Historic vehicle ownership and use: an
explorative study among car owners. Manuscript submitted for publication.
Chapman, L. (2007). Transport and climate change: a review. Journal of transport geography,
15(5), 354-367. doi: 10.1016/j.jtrangeo.2006.11.008.
Dannefer, D. (1980). Rationality and passion in private experience: Modern consciousness
and the social world of old-car collectors. Social Problems, 27(4), 392-412. doi:
10.2307/800167.
Davis, S. C., Diegel, S. W., & Boundy, R. G. (2014). Transportation energy data book:
Edition 33. United States: Department of Energy.
Delyser, D., & Greenstein, P. (2015). “Follow That Car!” Motilities of Enthusiasm in a Rare
Car's Restoration. The Professional Geographer, 67(2), 255-268. doi:
10.1080/00330124.2014.922019.
Faiz, A., Gautam, S., & Burki, E. (1995). Air pollution from motor vehicles: issues and
options for Latin American countries. Science of the total environment, 169(1), 303-310.
doi:10.1016/0048-9697(95)04662-K.
FEHAC. (2012). FEHAC Nationale Oldtimer Enquête 2012-2013. Netherlands: Federatie
Historische Automobiel- en Motorfietsclubs .
FIVA. (2014). FIVA technical code 2015. FIVA ( FIVA technical commission). Brussels:
FIVA.
Foster, M. S. (2003). A nation on wheels: The automobile culture in America since 1945.
California: Thomson, Wadsworth.
Frost, P., & Hart, C. (2006). The historic vehicle movement in Europe maintaining our mobile
transport heritage. The Fédération Internationale des Véhicules Anciens (FIVA)(First
Edition). Brussels: FIVA.
Frost, P., Hart, C., & Kaminski, J. (2011). The British historic vehicle movement a £4 billion
hobby. Wallingford: The Federation of British Historic Vehicle Clubs.
Gartman, D. (1994). Auto opium: a social history of American automobile design.
Psychology Press. London: Routledge.
Gertler, A., Gillies, J., & Pierson, W. (2000). An assessment of the mobile source contribution
to PM10 and PM2. 5 in the United States. Water, air, and soil pollution, 123(1-4), 203-214.
doi:10.1023/A:1005263220659.

Chapter 4 – Historic vehicles overview & transport policy 59
Grove, J. (2014). Vehicle Licensing Statistics: 2013. The UK: Department for Transport.
Hoen, A., Traa, M., Geilenkirchen, G., Hilbers, H., Ligterink, N., & Kuiper, E. (2012).
Milieueffecten Van Oldtimers. The Hague: Planbureau voor de Leefomgeving.
Kaminski, J., Smith, G. A., & Frost, P. (2013a). Economic impact of the Beaulieu
international auto jumble on the new forest area. The Federation of British Historic Vehicle
Clubs in collaboration with The University of Brighton.
Kaminski, J., Smith, G. A., & Frost, P. (2013b). Economic impact of the Goodwood revival
on the surrounding area. Wallingford : The Federation of British Historic Vehicle Clubs.
Kean, A. J., Harley, R. A., & Kendall, G. R. (2003). Effects of vehicle speed and engine load
on motor vehicle emissions. Environmental Science & Technology, 37(17), 3739-3746. doi:
10.1021/es0263588.
Kim, H. C., Keoleian, G. A., Grande, D. E., & Bean, J. C. (2003). Life cycle optimization of
automobile replacement: model and application. Environmental science & technology,
37(23), 5407-5413. doi: 10.1021/es0345221.
Knörr, W., Heidt, C., & Schacht, A. (2012). Aktualisierung “Daten-und Rechenmodell:
Energieverbrauch und Schadstoffemissionen des motorisierten Verkehrs in Deutschland
1960–2030”(TREMOD, Version 5.3) für die Emissionsberichtserstattung 2013
(Berichtsperiode 1990–2011). Heidelberg, Germany: Endbericht, ifeu Institut.
Koetse, M. J., & Rietveld, P. (2009). The impact of climate change and weather on transport:
An overview of empirical findings. Transportation Research Part D: Transport and
Environment, 14(3), 205-221. doi: 10.1016/j.trd.2008.12.004.
Koshar, R. (2004). Cars and Nations Anglo-German Perspectives on Automobility between
the World Wars. Theory, Culture & Society, 21(4-5), 121-144. doi:
10.1177/0263276404046064.
Mais, D. (2014). Reported Road Casualties in Great Britain: Main Results 2013. Retrieved
from
https://www.gov.uk/government/uploads/system/uploads/attachment_data/file/324580/rrcgb-
main-results-2013.pdf.
Martens, M. (2014). ITS en human factors: op de grens tussen mens en techniek. Retrieved
from http://doc.utwente.nl/91790/1/oratieboekje-Martens.pdf.
Melbourne, L. (2014). National Travel Survey: England 2013. Retrieved from
https://www.gov.uk/government/uploads/system/uploads/attachment_data/file/342160/nts201
3-01.pdf.
Nieuwenhuis, P. (2008). From banger to classic–a model for sustainable car consumption?
International Journal of Consumer Studies, 32(6), 648-655. doi: 10.1111/j.1470-
6431.2008.00721.x.
Norin, H., Carlsson, G., & Korner, J. (1984). Seat belt usage in Sweden and its injury
reducing effect (No. 840194). SAE Technical Paper. doi: 10.4271/840194.
Renner, M. (2003). Vehicle Production Inches Up. Vital Signs. Retrieved from
http://www.worldwatch.org/brain/media/pdf/pubs/vs/2003_cars.pdf.
Rijkeboer, R. C. (2008). Concerning the development of the calculation model amoeba for the
determination of the exhaust emissions of historic vehicles part 1: Description of the Model.
Voorburg.
60 Consumer heterogeneity, transport and the environment
Robertson, L. S. (1981). Automobile safety regulations and death reductions in the United
States. American Journal of Public Health, 71(8), 818-822. doi: 10.2105/AJPH.71.8.818.
Rodrigue, J.-P., Comtois, C., & Slack, B. (2013). The geography of transport systems.
Abingdon: Routledge.
Rumar, K. (1985). The role of perceptual and cognitive filters in observed behavior. In
Human behavior and traffic safety ( pp. 151-170). US: Springer.
Schafer, A., & Victor, D. (1997). The past and future of global mobility. Scientific American,
277(4).
Statista (2015). Worldwide automobile production from 2000 to 2014 (in million vehicles).
Retrieved from http://www.statista.com/statistics/262747/worldwide-automobile-production-
since-2000/.
Stolk, N. (2014). Export oldtimers verdubbeld door afschaffen van vrijstelling. Elsevier.
Retrieved from http://www.elsevier.nl/nederland/news/2014/01/export-oldtimers-verdubbeld-
door-afschaffen-van-vrijstelling-1438181W/.
Tam-Scott, D. (2009). Rationalizing the Lunatic Fringe: Bases of Classic Car Enthusiasm.
Intersect: The Stanford Journal of Science, Technology and Society, 2(1), 104-125. Retrieved
from http://ojs.stanford.edu/ojs/index.php/intersect/article/view/105/31.
Twigg, M. V. (2007). Progress and future challenges in controlling automotive exhaust gas
emissions. Applied Catalysis B: Environmental, 70(1), 2-15. doi:
10.1016/j.apcatb.2006.02.029.
Van Wee, B., De Jong, G., & Nijland, H. (2011). Accelerating car scrappage: A review of
research into the environmental impacts. Transport Reviews, 31(5), 549-569. doi:
10.1080/01441647.2011.564331.
Van Wee, B., Moll, H. C., & Dirks, J. (2000). Environmental impact of scrapping old cars.
Transportation Research Part D: Transport and Environment, 5(2), 137-143. doi:
10.1016/S1361-9209(99)00030-9.
Worldwatch. (2015). Vehicle Production Rises, But Few Cars Are "Green". Worldwatch
Institute. Retrieved from http://www.worldwatch.org/node/5461.
Zachariadis, T., Ntziachristos, L., & Samaras, Z. (2001). The effect of age and technological
change on motor vehicle emissions. Transportation Research Part D: Transport and
Environment, 6(3), 221-227. doi: 10.1016/S1361-9209(00)00025-0.

61
5. Identifying reasons for historic car ownership and
use and policy implications: an explorative latent
class analysis
Araghi, Y., Kroesen, M., & van Wee, B. (2017). Identifying reasons for historic car ownership
and use and policy implications: An explorative latent class analysis. Transport Policy, 56,
12-18. doi.org/10.1016/j.tranpol.2017.02.008
Abstract
The number of historic vehicles is steadily increasing. Although, these vehicles are part of our
cultural heritage with respect to road transport and mobility, they present (future)
environmental concerns, which is a relevant development from policy perspective. Yet, as far
as the authors are aware, there is hardly any academic literature addressing this issue. This
study aims to provide a first exploration of historic cars and reasons for ownership and use
and policy implications. To this end, a large explorative survey is conducted among HV
owners of 15 European countries. Focusing on passenger car owners only, a latent class
analysis is performed to identify possible segments among historic car owners. Seven latent
classes are identified: recreational owners, reserved owners, repair men, die-hard fans, next
generation fans, frequent drivers and collectors. Overall, the results indicate that there is large
diversity in the ownership and use of historic cars and the reasons behind ownership.
However, in general, historic cars are used much less than modern cars. Only the group of
‘frequent drivers’ (8% of the sample) represent a potential concern regarding emissions from
a policy perspective. Finally, policy recommendations are provided for decision makers
regarding historic cars.

62 Consumer heterogeneity, transport and the environment
5.1. Introduction
Historic vehicles12
(HVs) form a specific category of transport, either on-road or in preserved
off-road conditions that represent a historic era in the evolution of the vehicle industry. HVs
are becoming increasingly popular among owners, enthusiasts and also the wider public,
which makes the area of historic vehicles relevant from a social, cultural (heritage) and
economic point of view (Tam-Scott, 2009).
Based on a broad survey among individual enthusiasts, traders and HV clubs, Frost et al.
(2006) conclude that, within the European Union, there are roughly 786,000 club members,
belonging to nearly 2000 clubs and owning some 1,950,000 historic vehicles (Frost et al.
2006). In addition, Frost et al. (2006) estimate that over 55,000 people earn some or all their
living serving the historic vehicle movement and that historic vehicle related activities are
worth over €16 billion to the EU annually. This latter figure refers to the quantifiable benefits
of these vehicles and does not include the non-monetary and non-instrumental gains for
individuals resulting from owning, repairing, driving and/or admiring historic vehicles.
The number of HVs (1.9 million) accounts for only a small percentage, roughly 1%, of all
vehicles registered in the EU (Frost et al., 2006). Furthermore, HVs account for an even
smaller percentage (0.07%) of the total distance travelled by all vehicles (Frost et al., 2006).
However, the number of HVs can be expected to rise for at least two reasons: a) increasing
numbers of cars are being manufactured, globally. Car production has increased from 41
million in 2000 to 67 million in 2014 (Statista, 2015) and b) the average life expectancy of
cars is also increasing. For example, in the EU, the average age of cars has increased from 8.4
years in 2006 to 9.7 in 2014 (ACEA, 2015).
While in terms of CO2 emissions the (relative) impacts of HVs are (still) rather low, older cars
are generally more polluting in terms of other pollutants, in particular hydrocarbons, nitrogen
oxides and particulate matter (PM). For example, in terms of particulate matter, the emissions
(per kilometre driven) of cars manufactured before the introduction of the Euro 1 norm,
introduced in 1992 in the EU, may be at least 30 times higher than a new car with a Euro 6
norm (Dieselnet, 2015). Motivated by the goal to improve local air quality, authorities in a
number of European cities have implemented regulations to ban older vehicles from their
(inner) city areas. These areas are normally referred to as “Low Emission Zones”13
. However,
policies across different countries regarding HV admission to urban areas have not been
always congruent. For example, in London, HVs are exempted from paying the extra charges
for entering the ‘Ultra Low Emission Zone’. Also with respect to road taxation, exemptions
for older cars are sometimes made. For example, in the Netherlands cars older than 40 years
are exempted from paying road taxes.
Given the relevance of HVs from the perspective of cultural heritage, the economic and non-
instrumental benefits to owners and the general public and also (future) environmental
concerns for transport policy makers, it is surprising that there is hardly any academic
literature addressing this topic.
Moreover, some studies (Steg, 2005; Schwanen and Lucas, 2011) discusses non-instrumental
factors such as feeling of sensation or showing status, emotions or even attitudes for car use.
12 In this paper, historic vehicles are defined as vehicles older than 30 years. Historic vehicles are sometimes called ‘classic vehicles’,
however, we stay with the term historic rather than classic, since latter can entail broader meanings for a vehicle. 13 These areas can be found at the official website affiliated to EU commission: http://urbanaccessregulations.eu/

Chapter 5 – Reasons for historic car ownership and use 63
However, this mentioned literature mainly considers modern cars and not HVs. Given that
HV ownership and use could be an expensive hobby and considering that these vehicles have
lower safety and handling performance than modern ones, it is expected that non-instrumental
factors play an important role in HV ownership and use, which requires further exploration.
The primary aim of this study is to provide a first exploration on the policy issues regarding
pollution caused by historic cars14
and in addition, investigate the non-instrumental factors
influencing ownership of such cars. These two objectives are approached empirically, in this
study. Specifically, we aim to answer the following questions: What kind of people own
historic cars? How many cars do they own on average? To what extent do they use their car(s)
for regular transport (and thus contribute to air pollution)? What are their motivations to own
historic cars? To what extent are they member of HV clubs? To what extent are they engaged
in attending historic vehicle events? How much do they spend on the ownership and
maintenance of their cars? Which non-instrumental factors are relevant for historic car use
and ownership? The answers to these questions provide some indications on the role of non-
instrumental factors in owning and using historic vehicles as well as an assessment of the
extent in which historic vehicles (indeed) represent a relevant target group for environmental
policies.
To answer the formulated research questions, a large survey is conducted among HV owners
of 15 European countries. Using the data from this survey, we apply an explorative
probabilistic clustering technique, namely latent class analysis (Vermunt & Magidson, 2002),
to identify distinct segments in the population of HV owners. We use the total mileage on
historic passenger car(s) and other indicators to reveal the shared characteristics of each latent
class. The environmental impacts of HVs form the main concern for policy makers in terms of
setting regulations in use or restrictions on HVs. Therefore, we use the annual mileage as an
approximate determinant of the pollution emitted by HVs.
The remainder of this chapter is structured as follows. In section 5.2. we provide a brief
literature review on the topic of HVs. Section 5.3. discusses the method and data and section
5.4. presents the outcomes of the latent class analysis. Finally, section 5.5. summarizes the
conclusions and discusses several policy outcomes and practical implications.
5.2. Brief literature overview
As mentioned in the introduction, the literature on motivations of HV ownership is scarce. As
far as the authors are aware, there are only a handful of papers addressing the topic of historic
vehicles. They generally adopt a qualitative research methodology and focus on the question
why owners are so passionate about their historic cars.
One of the earliest investigations is the study of Dannefer (1980). Dannefer adopts a
sociological approach to understand owners’ passionate commitment to historic cars.
According to Dannefer the logic of the car enthusiast resembles Weber’s notion of
wertrationalitat (value-rationality). Hence, the car is no longer a way to achieve an end (e.g.
getting from A to B) which would reflect the idea of zweckrationalitat (instrumental
rationality), but has become an end, something to be valued in itself. In this respect, it is
interesting to note that, while enthusiasts differ in their specific motivations of owning
14 In this study, we will consider historic passenger cars rather than all types of HVs, since they are by far the most common type of historic
vehicles.

64 Consumer heterogeneity, transport and the environment
historic car(s), many owners prefer the car to be in original condition, or to be restored to its
original specifications. It is this common goal that creates a sense of community (Dannefer,
1980).
That being said, the specific motivations to own a historic car may differ strongly and can
even contradict. For example, some primarily own such vehicles to participate in shows and
events. Such use of the car may conflict with the purpose of touring with the car, which
generally negatively affects its presentation (Dannefer,1980). Still others mainly own these
vehicles to restore them or to build up a collection.
Tam-Scott (2009) draws attention to the sustainability aspects of HV ownership. According to
this author, the passionate commitment to a car means that owners tend to keep and maintain
the car(s) for prolonged periods, which reduces negative environmental impacts. According to
Tam-Scott (2009, p. 124),” the permanent and enduring relationship of classic car owners
with their vehicle is an example of how should people redefine their consumption patterns
when it comes to durable products such as cars.”
Nieuwenhuis (2008) adopts a similar perspective. According to Nieuwenhuis (2008), the
ownership/use of historic vehicles should be seen as a form of sustainable consumption. This
means that consumers go beyond the intended lifetime of the products (such as cars) by
consuming the products responsively, thus reversing unsustainable consumption behaviours.
Not only driving cars but also producing cars consumes energy. Based on literature Van Wee
et al (2000) conclude that about 15 to 20% of the life-cycle energy requirement of new cars in
the Netherlands (1990 – 1994) relates to car production, maintenance and disposal. Probably,
production and disposal is by far the largest category within those 15-20 %. In the case of
HVs, the additional (marginal) energy use for production and disposal approaches zero. On
the other hand, HVs are less fuel efficient than modern cars. Regarding the CO2 emissions of
historic vehicles compared to modern vehicles, based on data from the German car fleet
between 1960 and 2011 as published in Knörr et al. (2012), Araghi & Van Wee (2015)
conclude that during these years the CO2 emissions have declined by 10%-20%. Therefore,
they conclude that the additional energy use per kilometre due to the lower energy efficiency
of HVs is in the same order of magnitude as the reduction in the energy use due to production
and disposal. Note that the reduction of emissions of pollutants such as NOx and PM10 are
considerably larger, in order of 6 times and 2.5 times respectively (see: Araghi & Van Wee,
2015).
Finally, it has been argued that historic vehicles help to create “contextual ties” between
people and their culture and social identity. The difference in technology and appearance of
German, British or Italian historic vehicles are sometimes used to point out subtle differences
between people of these nations and explain some social constructs of these societies; for
example: German cars being “well-built” and “reliable” and Italian cars being “expressive”
and “temperamental” (Tam-Scott, 2009, p.120-121).
To summarize, unlike the general literature on car ownership, which primarily focuses on the
instrumental use of the car, the limited literature on HVs mainly focuses on social, cultural
and sustainability aspects of HV ownership. According to Steg (2005) and Anable et al.
(2005), non-instrumental and affective motivations play an important role in car use and
ownership. However, with respect to historic cars, little empirical evidence is available related
to these motivations. Based on the studies reported above, it can be expected that these non-
Chapter 5 – Reasons for historic car ownership and use 65
instrumental motives even play a stronger role in HV ownership and use. The present study
aims to fill this knowledge gap and explore motives that play a role in vehicle ownership and
use across various types of historic car owners.
5.3. Methodology
Latent class cluster analysis is used in this study to explore heterogeneity among historic car
owners. This explorative analysis will produce segments amongst owners with similar
characteristics within each segment and varying characteristics between segments. These
segments are determined quantitatively based on empirical evidence drawn from a survey
among historic car owners. This classification will help us identify common characteristics
among different owners in terms of vehicle use and ownership. It can reveal which motives
are behind historic car use and whether owners in segments use their car differently in terms
of mileage which is an important criterion from a policy perspective.
The main idea of latent class cluster analysis is that a discrete latent variable can account for
the observed associations between a set of indicators, such that, conditional on the latent class
variable, these associations become insignificant. This is generally called the assumption of
local independence (Magidson and Vermunt, 2004). The goal is to find the most parsimonious
model, i.e. with the smallest number of latent classes, which can adequately describe the
associations between the indicators.
While cluster research in the transport domain often relies on the deterministic classification
method of cluster analysis to identify homogeneous clusters, latent class cluster analysis is a
model-based clustering technique which probabilistically assigns individuals to classes or
clusters. This reduces misclassification biases. Additional benefits over deterministic cluster
analysis are that (1) statistical criteria can be used to judge the optimal number of classes, (2)
the significance of the model parameters can be computed and assessed and (3) variables of
mixed-scale type can be accommodated (hence, there is also no need to standardize variables)
(Vermunt and Magidson, 2013).
Since this study is the first to identify latent clusters among historic car owners, there is no
prior information on how many classes may exist or what these classes may represent. Hence,
we conduct an exploratory latent class analysis where the number of latent classes is not
known a priori. We use the Bayesian Information Criterion (BIC) to determine the optimal
number of latent classes for our sample of respondents (Schwarz, 1978). This evaluation
criterion weighs both model fit and model parsimony (the number of parameters) and has
been shown to perform well in the context of mixture modelling by Nylund et al. (2007).
When assessing latent class models with different segment numbers (but similar input
variable), the model which has the lowest BIC value is the most prefered one, given that the
segments found by the model have interpretable grounds.
The data for the model were provided by the Fédération Internationale des Véhicules Anciens
(FIVA) and collected by GFK15. These data were collected in a cross-sectional survey
conducted in April and May 2014. The objective of the survey was to obtain a general
overview on HV enthusiasts and their level of activities and participations with the HV
movement. The survey was distributed among FIVA’s member organizations in 15 EU
countries (Austria, Belgium, Czech Republic, Denmark, France, Germany, Greece, Ireland,
15 GFK is one of the leading institutes offering market research (see: http://www.gfk.com).

66 Consumer heterogeneity, transport and the environment
Italy, Luxembourg, the Netherlands, Poland, Spain, Sweden and the United Kingdom). These
countries have active federations for HVs, resembling various historic vehicle clubs and
communities. FIVA maintains regular contact with these federations in each of these countries
and conducts surveys to obtain updated information on historic vehicle ownership, usage, and
related activities. The questionnaires of the survey were either disseminated by GFK (on
behalf of FIVA) among car owners in paper format, via clubs or via an internet-based link.
The survey contained questions on various issues, such as the number of vehicles owned, the
number of kilometres driven in the previous calendar year, technical information about each
vehicle, the number of accidents with historic vehicles, the amount of expenditure on
vehicles, the membership to HV clubs and the participation in HV related events. The survey
included all types of historic vehicles: passenger cars, motor cycles, mopeds and scooters,
tractors, and commercial vehicles. However, for this study we only consider those
respondents that owned at least one or more historic passenger car(s). This is done to reduce
the complexity involved with the diversity in vehicle types and the fact that majority of the
sample (83%) involved passenger cars owners (at least owning one passenger car).
For the LCA model in this study we selected five indicators: historic car ownership (out of 5
possible to report), mileage in kilometres per year, membership to clubs, the most important
motivation behind historic car ownership and the participation in HV events. With some
initial model runs, we concluded that these five measured variables summarize the main
characteristics of the enthusiasts well. Four demographic characteristics were included in the
model as predictors of class membership (so-called active covariates), namely age, the
residential area, income and the employment status (Lanza and Rhoades, 2013).
Finally, one inactive covariate was considered as well, namely the expenditure on HVs. This
variable was not included as a class indicator, because the reported expenditures related to all
HVs and therefore may also relate to other historic vehicles (in addition to passenger cars).
However, to still take this variable into account, it was included as an inactive covariate. This
means that this variable is not part of the model, but that after estimation, the distribution of
this variable is calculated for the various classes (using the model’s posterior probabilities).
(Vermunt and Magidson, 2002).
5.4. Results
5.4.1. Descriptive statistics
Altogether 19432 HV owners and enthusiasts successfully completed the survey throughout
the 15 EU countries. From this, 16052 respondents, who owned at least one historic passenger
car was selected. Note that these respondents may have owned other types of historic vehicles
(e.g. motor cycles, trucks or even buses). However, they must have reported at least one
passenger car. To keep the data set to a reasonable size, each respondent was allowed to
register up to 5 vehicles in each category (i.e. 5 trucks, 5 buses etc.).
Table 5.1 shows the number of historic cars registered per person in the survey. In total the
information of 30941 historic passenger cars were registered. On average, 1.93 cars were
reported per owner with a variance of 1.4 cars and most owners indicated to have only one car
(51.5%).

Chapter 5 – Reasons for historic car ownership and use 67
Table 5.1 Number of historic passenger cars registered per owner in the survey
No. of cars Frequency %
1 8268 51.5
2 3849 24.0
3 1842 11.5
4 1016 6.3
5 1077 6.7
Total 16052 100.0
Table 5.2 presents the response rate per country. Some countries such as France, Germany,
Netherlands and Sweden were strongly present in the survey and some not. This could be
partly routed to the population of those countries and partly to activeness of the historic
vehicle federation and its level of contact with the owners.
Table 5.3 provides the socio-demographic distributions of the sample. The dominant presence
of male respondents (97.5%) is striking. This finding is in line with previous studies
(Dannefer, 1980; Delyser and Greenstein, 2015) and also the observations of FIVA’s own
previous survey, conducted in 2006 (Frost and Hart, 2006). Moreover, people from various
age and income groups were present among the owners of historic vehicles. An exception,
however, is group younger than 30 which has a very low share (3.7%). The 50 to 70 years old
owners constitute the majority of the sample (57.9%). This group corresponds with the age of
baby-boomers in the EU and US (1946-1964). This confirms the claims of Sass16
(2014), who
concludes that 58% of the 5 million classic car owners in US are in this age category and soon
will be considering selling off their collection of classic cars due to retirement.
Table 5.2 Distribution of respondents per country
Country Participants
of ow
%
(Price
hunters) Austria 643 3.97
Belgium 1130 6.97
Czech
Republic 90 0.56
Denmark 919 5.67
France 3054 18.85
Germany 2435 15.03
Greece 355 2.19
Ireland 206 1.27
Italy 513 3.17
Luxembourg 140 0.86
Netherlands 2506 15.47
Poland 451 2.78
Spain 268 1.65
Sweden 2586 15.96
UK 905 5.59
16 http://www.caranddriver.com/features/baby-boomers-created-the-classic-car-marketand-could-crash-it-feature (accessed: Nov 2016)
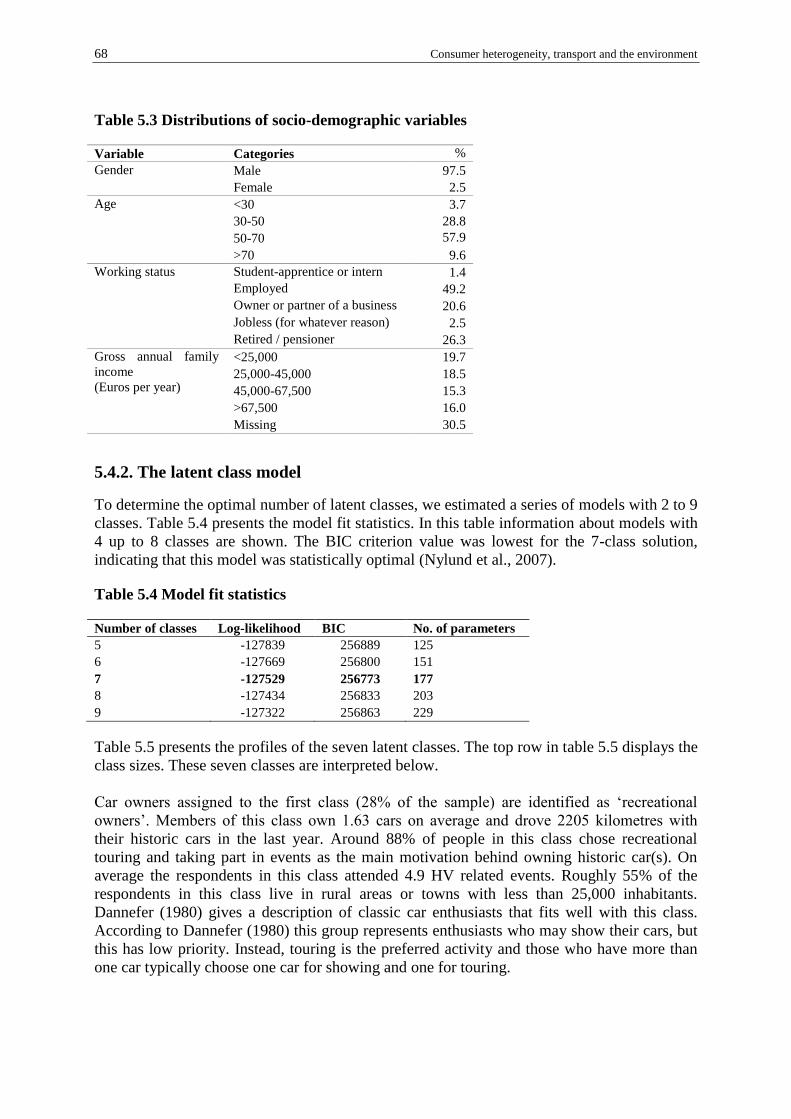
68 Consumer heterogeneity, transport and the environment
Table 5.3 Distributions of socio-demographic variables
Variable Categories %
(Price
hunters) Gender Male 97.5
Female 2.5
Age <30 3.7
30-50 28.8
50-70 57.9
>70 9.6
Working status Student-apprentice or intern 1.4
Employed 49.2
Owner or partner of a business 20.6
Jobless (for whatever reason) 2.5
Retired / pensioner 26.3
Gross annual family
income
(Euros per year)
<25,000 19.7
25,000-45,000 18.5
45,000-67,500 15.3
>67,500 16.0
Missing 30.5
5.4.2. The latent class model
To determine the optimal number of latent classes, we estimated a series of models with 2 to 9
classes. Table 5.4 presents the model fit statistics. In this table information about models with
4 up to 8 classes are shown. The BIC criterion value was lowest for the 7-class solution,
indicating that this model was statistically optimal (Nylund et al., 2007).
Table 5.4 Model fit statistics
Number of classes Log-likelihood BIC No. of parameters
5 -127839 256889 125
6 -127669 256800 151
7 -127529 256773 177
8 -127434 256833 203
9 -127322 256863 229
Table 5.5 presents the profiles of the seven latent classes. The top row in table 5.5 displays the
class sizes. These seven classes are interpreted below.
Car owners assigned to the first class (28% of the sample) are identified as ‘recreational
owners’. Members of this class own 1.63 cars on average and drove 2205 kilometres with
their historic cars in the last year. Around 88% of people in this class chose recreational
touring and taking part in events as the main motivation behind owning historic car(s). On
average the respondents in this class attended 4.9 HV related events. Roughly 55% of the
respondents in this class live in rural areas or towns with less than 25,000 inhabitants.
Dannefer (1980) gives a description of classic car enthusiasts that fits well with this class.
According to Dannefer (1980) this group represents enthusiasts who may show their cars, but
this has low priority. Instead, touring is the preferred activity and those who have more than
one car typically choose one car for showing and one for touring.

Chapter 5 – Reasons for historic car ownership and use 69
Table 5.5 Latent class sizes and profiles
Class 1
Recreational
owners
Class 2
reserved
owners
Class 3
Repair men
Class 4
Die-hard
fans
Class 5
Next gen.
HV fans
Class 6 Frequent drivers
Class 7
Collectors
Class Size (%) 0.28 0.21 0.15 0.13 0.09 0.08 0.05
Latent class indicators
HV ownership (out of 5 possible to report) 1.63 1.42 2.15 2.97 1.87 1.68 2.80
HV use in kilometres (kilometre per year per HV) 2205.7 464.1 1057.4 3028.8 1865.5 5660.9 2551.2
Member of HV clubs (number) 1.45 0.97 1.86 2.30 0.91 0.80 1.58
The most important
motivation behind HV
ownership
(%)
Doing maintenance, repairs, restoration jobs 0.00 0.22 0.44 0.18 0.40 0.19 0.13
Recreational touring, taking part in events and shows 0.88 0.23 0.00 0.53 0.30 0.22 0.31
Taking part in rallies or race events 0.06 0.01 0.03 0.12 0.02 0.01 0.16
Use for daily transport 0.00 0.01 0.00 0.03 0.04 0.16 0.01
Nostalgia 0.06 0.48 0.49 0.13 0.18 0.39 0.15
Build-up of a collection 0.00 0.03 0.04 0.02 0.07 0.00 0.20
Investment (expected value increase) 0.00 0.02 0.00 0.01 0.01 0.03 0.05
Participation in HV events in the last year (number) 4.93 1.27 4.65 6.53 4.15 1.70 3.76
Active covariates
Year of birth (mean) 1957 1960 1955 1957 1974 1963 1960
Spatial area of living,
number of inhabitants
(%)
>500,000 0.13 0.16 0.10 0.12 0.11 0.19 0.21
100,000 – 500,000 0.12 0.13 0.11 0.11 0.10 0.16 0.18
50,000 - 100,000 0.09 0.09 0.10 0.08 0.08 0.10 0.07
25,000 - 50,000 0.11 0.10 0.10 0.08 0.08 0.09 0.07
10,000 - 25,000 0.15 0.12 0.11 0.12 0.13 0.12 0.06
<10,000 0.21 0.18 0.18 0.24 0.24 0.16 0.19
Rural area (outside built-up area) 0.19 0.21 0.29 0.25 0.25 0.17 0.24
Family income (in euros) 56198 57185 57429 62134 49800 57778 97814
Status in 2013
(%) Student, apprentice or intern 0.00 0.01 0.00 0.01 0.08 0.02 0.00
Employed by a company 0.39 0.35 0.36 0.28 0.62 0.37 0.08
Employed as a civil servant 0.07 0.10 0.10 0.07 0.11 0.08 0.00
Employed non-profit organization, in healthcare, education 0.03 0.03 0.02 0.02 0.01 0.07 0.01
Employed by a type of organization, not mentioned earlier 0.02 0.02 0.02 0.01 0.02 0.02 0.01
Owner or partner of a business, or other self-employed work 0.15 0.21 0.11 0.24 0.11 0.22 0.82
Jobless (for whatever reason) 0.02 0.03 0.02 0.02 0.04 0.03 0.01
Retired / pensioner 0.32 0.24 0.36 0.35 0.00 0.19 0.07
Inactive covariate Last year’s expenditure per car (euro) 2231 1770 1862 2387 1939 2236 3148

70 Consumer heterogeneity, transport and the environment
Members of the second class (21% of the sample) are termed ‘reserved owners’, because
respondents in this group drive only 464 kilometres per year per historic car. People in this
class own the least number of cars (1.42 on average) compared to the other classes. Members
of this class also report the lowest participation in HV events (1.27) and lowest average
spending related to their historic car (€ 1770 per car per year). Members of the class mainly
seem motivated by nostalgic reasons to own a historic car, and therefore we conclude that this
type of owners reserved their interests towards keeping the heritage and memories of historic
vehicles alive and perhaps like to preserve HVs for future generations.
The respondents assigned to the third class (15% of the sample) are labelled as ‘repair men’,
since they mention maintenance, repair and restoration as one of the main motivations behind
their HV ownership. Dannefer (1980) acknowledges restoration of historic vehicles as a major
activity of HV fans. While members of the third class enjoy HVs mainly for reasons of
maintenance and restoration, they also mention nostalgia as a reason for their enthusiasm for
historic cars. 58% of the respondents in this class live in towns under 25,000 inhabitants or in
rural areas. Compared to the other classes relatively many people in this class are retired
(36%).
Members of the fourth class (13% of the sample) are termed ‘die-hard fans’, because they
own on average 2.97 cars and also drive second most (3,028 km per year). On average, they
are member of 2.3 HV related clubs and have attended 6.53 events during the last year (both
figures are highest across the clusters), which makes them the most active enthusiasts in the
sample. Again, over one third of the members of this class are retired or pensioners, with an
average annual income which is second highest compared to the other groups.
The members of the fifth class (9% of the sample) are labelled as the ‘next generation of HV
fans’. Respondents assigned to this cluster are the youngest with an average age of 32 (~15
years lower than the other clusters). Their income is also lowest of all. In addition, members
of this class are more often students/interns or employed by a company as opposed to being
unemployed or being retired. This group of owners drive each one of their cars 1865 km per
year. Surprisingly, 62% of the members of this cluster live in rural areas or towns smaller than
25,000 inhabitants. The percentage of population living in the rural areas in Europe in this age
range (around 40 years old) is about 23% (de Beer et al., 2014), which is not consistent with
our observation. A potential explanation could be the availability of space to stall historic cars
in the rural areas giving rise to large number of owners being present in rural areas.
The members of the sixth class (8% of the sample) are identified as ‘frequent drivers’. This
label relates to the fact that they have driven the most in the past year (5,461 kilometres).
More than one third of the respondents in this class live in towns with 100,000 inhabitants or
more. Around 16% specifically mentioned daily transport as the main motivation behind
owning a historic car, which is the highest compared to the other classes, but still relatively
low. The members of this class report the lowest (average) membership of HV clubs (0.8).
Finally, respondents assigned to the seventh class (5% of the sample) are identified as
‘collectors’, since respondents in this class own on average 2.8 cars. 20% of members of this
class mention the build-up of a collection as the main motivation for owning a historic car and
another 5% regard their HV as an investment, expecting an increase in value over time. This
class represents the smallest group in the sample including only 5% of the respondents. In line
with the collector profile, the annual income of the members of this class is the highest

Chapter 5 – Reasons for historic car ownership and use 71
compared to the other classes. Dannefer (1980) mentions collecting (historic cars or related
objects) as one of the important activities of enthusiasts but also acknowledges that not a lot
of them have the financial means of building a collection. For this subgroup of enthusiast
‘locating and acquiring the object’ is the most enjoyable part of being a collector (Dannefer,
1980, p. 402). Tam-Scott (2009) also recognizes the existence of this subgroup among the HV
enthusiasts.
Looking at the expenditures (as presented in the last row of Table 5.5), the ‘die-hard fans’ and
the ‘collectors’ have spent the highest on their cars. This may be a reflection of their level of
activity and commitment to the HV movement. Members of the second class, the ‘reserved
owners’, spend the least, which stems from their low level of activity (i.e. participation in
events and gatherings) and low mileages which means less expenditure on fuel, maintenance
and spare parts. The third class ‘repair men’ spend second least on their historic cars. It may
be speculated that people in this class attempt to repair and restore the vehicles themselves
and thus spend less for restoration and maintenance services. ‘Frequent drivers’ also spend a
relatively high amount, which is in line with their heavy use of their car(s).
Regarding the living area of the historic car owner, the majority (67%) lives in small towns
and rural areas (i.e. less than 50,000 residents), though this figure is less for the ‘frequent
driver’ (54%) and the ‘collector’ groups (56%). Given the residential locations of enthusiasts,
these vehicles are mainly driven outside congested and polluted areas.
5.5. Discussion and conclusion
This study has revealed seven distinguishable classes of historic passenger car owners, using
data from a large survey among HV owners. The results indicate there is large heterogeneity
in the ownership and use of historic cars and the reasons behind ownership. Some enthusiasts
seldom drive their cars, whereas others drive quite a lot. Some car owners very actively
participate in HV related clubs and attend events whereas others enjoy repairing and
maintaining their historic cars. These findings may be of interest for historic car organizations
such as FIVA or for HV clubs, which may want to know what the main motivations of their
members are by HV ownership and use. Subsequently, customized events and shows or
workshops can be organized targeting different sub-groups of HV enthusiast. The companies
which provide technical support (maintenance, repairs, and restauration) and spare parts for
enthusiasts may be willing to know what the level of ownership, annual mileage and also the
amount of expenditure by these groups of owners is.
Looking at the results, in general, one can observe that historic car owners drive much less
than modern car owners. On average, owners in our sample drove a distance of 2404
kilometres in the year prior to the survey. Among the seven classes of owners, the highest
mileage per car was measured in class 6 “frequent drivers”, who drove on average 5660 km
per car per year. This class only constitutes 8% of the respondent in the sample. The global
average distance travelled with a passenger car per year is estimated to be around 13000
kilometres (Holmberg et al., 2012). This is 5.4 times more than the average distance travelled
for the overall sample of owners and also 2.3 times higher than members of “frequent drivers”
class.
Looking at the affective reasons of owning historic cars, we observed that recreation and
showing off the car(s) at events was strongly indicated by at least two segments of owners
(class 1 and class 4). This could be loosely compared with the feeling of “arousal” and

72 Consumer heterogeneity, transport and the environment
“superiority” defined by Steg (2005). Owners in class 7 referred to “building up of a
collection” as the second most important aspect of historic car ownership (and the highest
among all other segment). This could also refer to the feeling of status and superiority.
Alternatively, three segments namely class 2, 3 and 6 indicated “nostalgia” as the main reason
of owning historic vehicles, which can be related to emotional reasons of vintage car
ownership. Schwanen and Lucas (2011) found emotional motivations among the non-
instrumental reasons of (modern) car use.
From a policy perspective, the environmental impacts of the historic vehicles play a major
role in regulations regarding historic cars. Although historic car owners drive much less than
average modern car owners (according to our sample), the pollution emitted per kilometre by
historic cars is much higher. At this point, the outcomes of this study can provide some
insights for policy makers.
Our study reveals that there are significant differences in annual mileage between various
types of owners. If we assume emissions to be proportional to the distance travelled, then
from the 7 types of owners, the frequent drivers (class 6) could be the most important target
group for environmental policies, given that the owners in this segment drive 2.3 times more
than the average mileages of the entire sample.
To reduce the environmental impact of HVs we believe a system of ‘charging per kilometre’
would be an elegant option. Such a system will be a disincentive for frequent users, which is
not only good for the environment, but also for the preservation of HVs. And it avoids
infrequent users to suffer from generic policies such as the introduction of environmental
zones, forbidding all older vehicles to drive in that zone.
An alternative could be ‘charging based on a quota’. This quota can be based on the emission
levels of each historic vehicle. This is not difficult to estimate for historic vehicles, given the
type, the year of manufacturing and some technical details. Based on such a policy, each
historic car receives a limited number of kilometres per year as a quota. If the owner drives
within this quota, there will be no penalties. If the driver exceeds this quota, then there could
be a sort of environmental tax levied on the owner, which varies based on the emission levels
of the vehicle. The basis of this quota system can be based on two items: a) technical features
of the vehicle and b) the average distances driven by the majority of the historic car owners
(for instance in our sample 73% of the car owners drive less than 2205 kilometres per year).
We made a rough calculation on the magnitude of the impact of this policy on CO2 emissions.
Assuming that there are approximately 2 million HVs in the EU (Frost et al., 2006), and that
about 80% (1.6 million) of these are historic passenger cars, and that 8% of these HVs is used
frequently by class 6 type owners (“Frequent drivers”) as estimated in our LCA analysis (see
Table 5.5), then the “charging based on quota” will force these drivers to either drive under
the 2200 km/year limit or pay the penalties. If these drivers choose to stay under the 2200
km/year borderline, this reduces the kilometres driven by 443 million km/year. An average
car (e.g. Ford Focus made in the year 2006) emits 170 gr CO2/km (based on UK department
of transport emission calculator17). According to Knörr et al. (2012) an average historic car
manufactured after 1960s emits 20% more CO2 emissions (205 gr CO2/km). In total the 443
million km/year driven less by historic passenger cars would be equivalent to roughly 91,000
tons of CO2 emission reduction in the EU. This is corresponding to the emissions of
17 http://carfueldata.dft.gov.uk/ (accessed: Nov 2016)

Chapter 5 – Reasons for historic car ownership and use 73
approximately 54,000 new cars driving 14,000 km/year, or equivalent to the to the total CO2
emission of cars of a medium sized city with 110,000 inhabitants in EU (based on average car
ownership figures of Eurostat18 of 490 cars per 1000 inhabitants in EU). It may not seem a
drastic reduction in total emissions of road vehicles in the EU, however, given the limited
mileage of HVs in general, this could be a significant reduction on the use of HVs by the
frequent users.
In general, an important challenge for policy makers is to find the right balance between
restricting the use of HVs for environmental reasons and, on the other hand, not imposing too
many restriction on users that hardly cause any emissions due to their very limited mileages.
As a finale note, since this is one of the first academic studies in the field, there is a need for
more research to be conducted related to this growing category of road transport. Besides
concerns about air pollution, there is the issue of safety and also noise which requires more in-
depth analysis in the case of historic vehicles.
A limitation of the present study is that the sample for this survey was gathered from HV
enthusiasts who were either members of HV clubs or were in contact with the historic vehicle
movement. As a result, we cannot claim that this sample is representative for all HV owners.
It is likely that people who use their historic car solely for daily transport are
underrepresented.
Acknowledgement
This research has been partly financed by a grant of the Fédération Internationale des
Véhicules Anciens (FIVA).
References
ACEA. (2015). Average age of the EU car fleet. from
http://www.acea.be/statistics/tag/category/average-vehicle-age.
Anable, J., & Gatersleben, B. (2005). All work and no play? The role of instrumental and
affective factors in work and leisure journeys by different travel modes. Transportation
Research Part A: Policy and Practice, 39(2), 163-181.
Araghi, Y., & Van Wee, G. P. (2015). Old vehicles under new glance: A literature review and
advanced data analysis on historic vehicles. Delft University of Technology.
Dannefer, D. (1980). Rationality and passion in private experience: Modern consciousness
and the social world of old-car collectors. Social Problems, 27(4), 392-412.
de Beer, J., van der Erf, R., & van der Gaag, N. (2014). New classification of urban and rural
NUTS 2 regions in Europe. The Hague: Netherlands Interdisciplinary Demographic Institute
(NIDI).
Delyser, D., Greenstein, P. (2015) “Follow That Car!” Mobilities of Enthusiasm in a Rare
Car's Restoration. The Professional Geographer, 67, 255-268.
Dieselnet. (2015). Emission Standards of Cars and Light Trucks (European Union). From
https://www.dieselnet.com/standards/eu/ld.php.
18 http://ec.europa.eu/eurostat/statistics-explained/images/b/ba/Passenger_cars_in_the_EU.png (accessed: Nov 2016)

74 Consumer heterogeneity, transport and the environment
Frost, P., Hart, C., Kaminski, J. (2011) The British historic vehicle movement a £4 billion
hobby. The Federation of British Historic Vehicle Clubs.
Frost, P., Hart, C., Smith, G., & Edmunds, I. (2006). The historic vehicle movement in
Europe; maintaining our mobile transport heritage. Steeple Aston, UK: Fédération
Internationale des Véhicules Anciens (FIVA).
Holmberg, K., Andersson, P., Erdemir, A. (2012) Global energy consumption due to friction
in passenger cars. Tribology International 47, 221-234.
Knörr, W., Heidt, C., & Schacht, A. (2012). Aktualisierung “Daten-und Rechenmodell:
Energieverbrauch und Schadstoffemissionen des motorisierten Verkehrs in Deutschland
1960–2030”(TREMOD, Version 5.3) für die Emissionsberichtserstattung 2013
(Berichtsperiode 1990–2011). Heidelberg, Germany: Endbericht, ifeu Institut.
Lanza, S.T., Rhoades, B.L. (2013) Latent class analysis: an alternative perspective on
subgroup analysis in prevention and treatment. Prevention Science 14, 157-168.
Magidson, J., Vermunt, J.K. (2004) Latent class models. The Sage handbook of quantitative
methodology for the social sciences ed Kaplan, D. Sage Publications, Thousand Oakes, CA,
pp. 175-198.
Nieuwenhuis, P. (2008) From banger to classic–a model for sustainable car consumption?
International Journal of Consumer Studies 32, 648-655.
Nylund, K.L., Asparouhov, T., Muthén, B.O. (2007) Deciding on the number of classes in
latent class analysis and growth mixture modeling: A Monte Carlo simulation study.
Structural equation modeling 14, 535-569.
Sass, R. (2014, 2). How Baby Boomers Created Today's Classic-Car Market—and How They
Could Crash It. Retrieved 1 22, 2016, from car and driver:
http://www.caranddriver.com/features/baby-boomers-created-the-classic-car-marketand-
could-crash-it-feature.
Schwanen, T., & Lucas, K. (2011). Understanding auto motives. In: Lucas, K., Blumenberg,
E., Weinberger, R. (eds.) Auto Motives: Understanding Car UseBehaviors. Bingley: Emerald,
3-38.
Schwarz, G. (1978) Estimating the dimension of a model. The Annals of Statistics 6 (2), 461–
464.
Statista (2015). Worldwide automobile production from 2000 to 2014 (in million vehicles)
from http://www.statista.com/statistics/262747/worldwide-automobile-production-since-2000/
Steg, L. (2005). Car use: lust and must. Instrumental, symbolic and affective motives for car
use. Transportation Research Part A: Policy and Practice, 39(2), 147-162.
Tam-Scott, D. (2009). Rationalizing the Lunatic Fringe: Bases of Classic Car Enthusiasm.
Intersect: The Stanford Journal of Science, Technology and Society, 2(1), 104-125.
Vermunt, J.K., Magidson, J. (2002) Latent class cluster analysis. Applied latent class analysis
11, 89-106.
Vermunt, J.K., Magidson, J. (2013) Technical Guide for Latent GOLD 5.0: Basic, Advanced,
and Syntax. Statistical Innovations Inc, Belmont Massachusetts.

75
6. Conclusion, policy recommendation and avenue
for future research
In the absence of comprehensive measures in overall transport modes (Hoen et al., 2014),
policy analysts and scholars have suggested various top-down policy measures to tackle the
emission problem in transport.
To stabilize the emissions there is the need for transport operators and vehicle manufacturers
to comply with mitigating policies but passengers and private vehicles owners must do their
part as well. In this thesis, I have focused on the passenger and private owner side. I focused
on emission mitigation policies and assessed which one have better chance of compliance by
the consumers.
To test the effectiveness of mitigating policies addressing transport consumers, I directed my
efforts on the issue of the heterogeneity among consumers and apprehend their preferences
regarding the selected policies. Revealing heterogeneity and understanding the preferences
among people enables the analyst to understand motivational constructs underlying behaviour
(Boxall & Adamowicz, 2002; Swait, 1994). This notion paves the way to develop (tailored)
policies that offer higher probability for people’s compliance and ultimately higher impact on
emission mitigation.
6.1. Answers to research questions
In this section, I bring together the findings of the preceding chapters under the main theme of
this thesis. Chapters 2 to 5 each provide different perspectives on the issues of consumer
preferences and heterogeneity on environmental policy making in transport. Thereby, I intend
to look back at the research questions mentioned in the introduction chapter and reflect on the
substantive findings of different chapters.

76 Consumer heterogeneity, transport and the environment
In chapter 2, we were interested in the influence of social norms on airline passengers’
preferences. Two research questions were formulated in chapter 2, and in this chapter I
present and discuss the findings.
What are the preferences of passengers towards airline environmental policies?
Three environmental policies in the civil airline industry were selected for inclusion in our
empirical study, namely: 1) voluntary carbon offsetting (VCO), 2) baggage allowance and, 3)
airline eco-efficiency index. The substantive outcome of the study indicated that the impact of
VCO policy was slightly positive on passengers’ utility, meaning that airlines passengers’
utility increased slightly when deciding to offset their carbon emissions. Passengers also
gained utility considerably when their baggage allowances were increased. On average,
passengers lost utility when the eco-efficiency of the airline decreased from A (green) to C
(grey).
Given these empirical findings, we can draw the following conclusion: VCO policies do not
introduce large utility gains and passengers were almost indifferent towards policy. This
finding reflects the lack of large scale contributions from the passenger side to such programs
in the real world. On the contrary, the concept behind eco-efficiency policy was well
understood and incorporated in the decision making of the passengers, when choosing an
airline. This indicates a potential for being an effective policy, if implemented. Passengers did
not like the baggage allowance policy, and therefor this policy will likely fail or hardly have
any impact, if adopted by the airlines.
How do social norms influence individual preferences regarding airline environmental
programs?
I examined the impact of social norms on airline environmental policies by offering three
arbitrary scenarios to airline passengers: low, medium and high collective rate of carbon
offsetting by passengers. Then, I observed the impact of such scenarios on passengers’
choices on the three airline polices. The results indicate that when the collective offsetting rate
is 5% (i.e. social norm context indicator was low), passengers gain marginal (almost
negligible) utility from VCO program. Contrarily, when the collective offsetting rate is 90%
(i.e. social norm context indicator was high), the gain in utility is also high. Nevertheless, the
utility gain of VCO becomes lower when the collective offsetting rate is 50% (i.e. social norm
context indicator was medium).
While it was expected that the preference for VCO would increase linearly with the collective
offsetting rate, it seems that the actual relationship is curvilinear. It can be contemplated that
the 50% offsetting rate is indicative of strong controversy over offsetting program, leading
respondents to withdraw and attach less value to VCO19.
Unexpectedly, the social norms do significantly impact the baggage allowance policy and the
airline eco-efficiency labelling scheme. Similar to the previous case, this impact was
curvilinear in the baggage allowance policy. Again, a plausible explanation could be that a
collective offsetting rate of 50% positively triggers people’s environmental consciousness,
making them less sensitive towards restrictions on the amount of luggage one is allowed to
carry. When the collective offsetting rate reaches 90%, however, people may be inclined to
19 It should be noted, however, that the interactions between the context indicators and the VCO are not significant. Hence, these results can,
in any case, not be generalized to the population.

Chapter 6 – Conclusion 77
think that environmental concerns are sufficiently addressed by the fact that the majority of
the passengers are offsetting their emissions, in effect, making them more sensitive towards a
reduction in baggage allowance.
Finally, the eco-efficiency labeling policy had significant and positive interaction with the
social norm indicator, meaning that people become less sensitive towards an eco-labeling
scheme and attach less weight to environmental considerations. However, when an
uncontroversial positive environmental norm is demonstrated (i.e. the offsetting rate is 90%)
people attach more weight to the eco-efficiency label.
From these findings, I conclude that the social norm tested in this experiment does indeed
impact consumers’ preferences but it appears not be a straightforward and simple linear
effect. It can be a curvilinear effect or any other complex form, which can be estimated
empirically.
In chapter 3, I introduce passenger attitudes on air travel and emissions plus their preferences,
to create empirical latent segments. These latent segments are later used to assess the
effectiveness of the three airline environmental policies on each segment. So, two research
questions were formulated as below:
Which segments regarding airline environmental policies can be identified among
airline passengers?
To what extent do attitudes and preferences of airline passengers influence the
membership of the segments?
Here, the attitude of airline passengers towards air travel, CO2 emissions and climate change
were assessed using 12 statements. Four attitudinal constructs were extracted (see chapter 3
for details) and incorporated into the class membership functions as covariates. This allowed
for segmenting passengers based on their preference and attitudes. The results indicate that
three segments can be extracted, which we named as: price hunters, luggage lovers and eco-
flyers.
In general, since 41% of our sample of air travellers obtained utility form the environmental
policies, there seems to be room for implementing such policies. Previous studies, up to now,
presented their findings based on the average estimates derived from their whole sample,
which is only partially insightful for decision makers. While, in this study we focus on sub-
segments of our sample to identify which policy is supported by which group of travellers and
thus tailor a better fit policy for that portion of the society.
In chapters 4 and 5, I focus on historic vehicles which are insufficiently studied among road
transport related research. So before being able to look at the heterogeneity of the historic
vehicle owners, I was inclined to ask more fundamental transport policy related question
regarding these vehicles, which is as follows:
What is the impact of HVs on the environment, safety and congestion?
Researchers in transport policy studies usually deal with three main categorized of problem
domains: environmental impact (such as climate change, air and noise pollution), safety, and
congestion (Rienstra et al., 1999). Consequently, transport planners and decision makers tend

78 Consumer heterogeneity, transport and the environment
to tackle these three issues in their actions and long and short term measures. For instance, the
latest white paper issued by the EU commission on transport (Commission, 2011), focuses on
innovative ways to remove congestion and facilitate efficient and safe movement of people
and goods in a more sustainable manner.
In this thesis, I have taken a similar approach, while studying HVs. I have looked at the
contribution of these vehicles regarding each of the three domains. The First and foremost
issue was the contribution of HVs in emissions to the environment.
HVs’ impact on environment was divided in three categories, CO2 emissions, non- CO2
emissions and Noise. Per kilometre, HVs emit non- CO2 emissions such as CO, HC, NOx,
and PMx much more than modern vehicles due to their old technology. CO2 emissions are,
however, only 10 to 20% more than modern vehicles. On a life cycle basis, the CO2 emissions
per km of HVs will be about equal to the modern fleet average.
Given the revealed HV users behaviour patterns, it is also possible to conclude that these
vehicles are often used less frequently (estimated 0.24% share in total kilometres driven) and
driven in favourable weather conditions and in less congested regions, due to technical
difficulties that HVs have. Therefore, in this respect it is less likely that these vehicles cause a
more than marginal impact to the congestion problem.
Regarding the safety consideration, both active safety features (e.g. brakes, handling) and
passive safety features (crash worthiness) of cars, vans and lorries of modern fleet are better
than HVs. However, HV owners empirically have demonstrated safe driving behaviour. Since
94% of accidents are caused fully or partially by human error, the safe driving performance of
HV owners compensates the relatively unsafe features of HVs.
Other than the three fundamental transport policy topics, in chapter 4, I further discussed
social benefits of HV ownership and HV use in the current society. HV owners develop
emotional bonds with their vehicles and enjoy driving them. This can be considered a positive
social effect of HVs. The presence of HVs in symbolic social gatherings, public events,
charity events can be also an indicator of public support towards presence of such vehicles in
the society. Moreover, HVs as the heritage of road vehicles represent the origins of road
transport, thus providing educational and historic benefits. Additionally, in chapter 4, I
discuss some economic benefits obtained from HVs. Maintenance and repair workshops and
spare parts supply chain earn a reasonable amount due to the expenditure of HV owners
(estimated to be around €3782 per owner per year, excluding fuel and tax costs). Moreover,
recreational activities and HV related events provide a reasonable source of income for local
businesses during HV related events and fairs. These, altogether, could support an estimated
114,000 jobs in EU alone.
After overviewing the available knowledge (academic and non-academic) on HVs, I continue
with the main theme of the thesis and explore the heterogeneity among HV owners or users.
Here, I identify consumers as HV owners (or HV users) and look at the reasons of HV
ownership and use and answer the following research question:
What empirical segments exist among HV owners leading to environmental policies?
This part of research was done based on exploring a large data set of 19,432 HV owners from
15 EU nations. There were many types of vehicles present in the data set (e.g. trucks, busses,

Chapter 6 – Conclusion 79
mopeds, tractors, passenger cars and so on). For simplifying the analytical phase, I chose
historic passenger cars, which was the largest type of vehicle in the data set (83% of the
sample).
Steg (2005) and Anable (2005) have already claimed that non-instrumental and affective
motivations play an important role in passenger car use. However, I wanted to see if these
claims hold for the case of HV owners and if so what (non-instrumental) factors can we
identified. By implementing an explorative latent class model on the data set, I used statistical
criteria (LCA methods) to segment HV owners. This method assesses the answers of owners
to the survey and objectively extracts latent groups that have similar characteristics.
Seven latent classes were extracted: 1) recreational owners (28%), 2) reserved owners (21%),
3) repair men (15%), 4) die-hard fans (13%), 5) next generation fans (9%), 6) frequent drivers
(8%) and 7) collectors (5%). The existence of seven, statistically significant, segments was
insightful. In chapter 5, I describe in detail about the common characteristics identified among
the members of each segment/class and hence the label of each segment.
Next, in chapter 5, I discuss the policy implications of these findings, limiting myself to
environmental policies because these are by far the most important for transport planners (see
above). Firstly, it is important to notice that only 8% of the historic passenger car owners
drive their cars ‘frequently’. On the other hand, emission factors of HVs are much higher than
those of modern cars. Therefore, in chapter 5, I propose two policies: ‘charging per kilometre’
and ‘charging based on a quota’.
I conclude that by identifying heterogeneity among historic car owners (and probably this can
be extrapolated to all HV owners), we obtain insights into common characteristics of these
people, and we can also learn that from all these seven groups only one group (8%) may pose
a significant environmental threat. The two policy instrument that I propose in chapter 5, can
be used to target the polluters and not to penalise those that have very limited mileages per
year.
Based on above discussions, now I answer the main research question, as formulated in here:
Which segments exist in the two transport domains (airline and historic vehicles)
that are informative with respect to environmental policy making?
In the marketing literature, McFadden (1986) argues that detecting heterogeneity by
integrating attitudinal, socio-economic and perceptual latent variables for predicting consumer
choices or market behaviour is more superior compared to the traditional consumer demand
models (McFadden, 1986). Boxall & Adamowicz (2002), later, confirm that user
heterogeneity can provide much insightful information on decisions of consumers and also on
the outcomes of policies.
At the introduction chapter, we saw that environmental policy making in transport requires
much needed consumer collaboration and contribution in order to curb transport related
emissions (second biggest after energy sector). In this thesis, I am focusing on user
heterogeneity in the realm of transport (two sectors in here) and its possible outcomes for
emission mitigation policies. I tried to detect heterogeneity using latent classes or latent
construct. Following Swait (1994) and Boxall & Adamowicz (2002), I have incorporated
attitudes and preferences of transport users. Given our empirical findings in chapters 2 to 5,

80 Consumer heterogeneity, transport and the environment
we were able to show that it is possible to estimate the choices of passenger regarding
environmental policies in the case of airline passengers. In the case of road transport, where
HV users were in the focus, our findings showed that identifying different segments of HV
users indicates that not all HV users are environmentally hazardous, given the very limited
mileage they drive.
My conclusion from chapters 2-5 of this thesis would be to inform policy makers that they
should take into consideration that the effect of environmental policies may be impacted
(positively or negatively), at some stages, by changing norms (e.g. the willingness to offset
carbon emissions from air travel). Norms are important and dynamic societal factors that need
to be recognised by policy makers and transport planners. This calls for flexibility in adapting
the policies based on the emerging norms in the society.
Overall, I conclude that designing effective policies for mitigating environmental impacts of
transport starts from clearly identifying the users’ preferences and attitudes and then
appropriately (scientifically) segmenting them into groups (latent classes). This should be
done by applying not just socio-demographic (e.g. Gupta & Chintagunta, 1994) but also by
including attitudinal and perceptual indicators. After that, tailored policies should be designed
in order to suite these sub-segments of transport users to effectively target them and obtain
their collaboration with these policies. Next, I provide some tailored policy recommendation
based on my explorations of user heterogeneity in this thesis.
6.2. Policy recommendation
The insights gained in people’s (consumers/passengers) behaviour and preferences and the
differences among segments of the population can be used to achieve the objective that was
formulated in the introduction chapter (section 1.4) and ultimately could be used for providing
tailored policy recommendations for transport planners and policy makers.
I consider such methods of identifying user heterogeneities to lead to better understanding of
choices and preferences of users per segment rather than considering the “average consumer”.
Once, the policy makers are better able to predict the possible outcomes of policy measures
on different segments of the targeted population of users, they are in a favourable position to
propose tailored policies (or provide various policy options) that are more effective and will
receive more support from the targeted population.
In the analysis towards segmenting air passengers, the price sensitive passengers can be
targeted with eco-labelling policy, where the airlines with higher emissions are ranked by a
standard metric and communicated with the air travellers. In this way passengers are able to
choose airlines based on their pollution levels, and in this way stimulate airlines to become
less polluting.
Setting a compulsory baggage allowance policy or alternatively baggage reduction policy was
revealed to be essentially undesirable by passengers. Instead, a hybrid policy in the form of a
discount on tickets, if passengers voluntarily reduce their baggage weight could be a way
forward. In this way, the baggage reduction target could be approached on a voluntary basis
and potentially attracts price sensitive travellers.

Chapter 6 – Conclusion 81
Finally, those passengers that are comparatively sensitive to the emissions caused by air travel
can be approached by offering more information. Minton & Rose (1997) have also found
environmentally conscious groups based on attitudes and behaviour and further emphasize the
importance of access to relevant information for these groups to enhance their ability to
choose the most environmentally friendly product. In the case of air travel, it is likely that
environmentally conscious passengers appreciate information on eco-efficiency of airlines.
Given that airline effectively communicate these relevant information to the passengers, they
can provide an opportunity for conscious passengers to make an impact by making conscious
choices or adjusting their air travel behaviour based on the available information.
The policy recommendations addressed above are some initial indications of future measures
and need further refinement before large scale implementation in the aviation industry. We
need more economic, and social feasibility studies to be able to design adequate policy
measures for air passengers.
Regarding the HV user community, a balanced approach is to protect the interest of HV
drivers and owners and simultaneously reduce environmental impacts of these vehicles. I
expect these policies to be superior and more effective than the current policies related to
restricted environmental zones, which do not consider the diversity among HV users and do
not offer any flexibility.
To reduce the environmental impact of HVs, I believe the two proposed policies: ‘charging
per kilometre’ policy and ‘charging based on a quota’ policy would be elegant options. These
policies have different technical approaches, but in essence both policies allow HV owners
continue driving their vehicles and only enforce barriers to those who drive HVs
exceptionally more than the rest. Basically, these policies are designed in a way that targets
frequent HV users and provide dis-incentives for them to heavily drive HVs for everyday
activities. Additionally, these policies are designed to help to reduce HV related emissions
and also help to preserve HVs.
On the other hand, these policies provide some form of comfort for the general HV owners
and enthusiasts (who do not drive their vehicles frequently) by allowing them to drive their
cherished HVs, knowing that they are penalised if they overuse their vehicles.
6.3. Avenues for future research
One of the key messages of this thesis is to emphasis on the importance of revealing
heterogeneity among consumers and its potential importance for effective policy making
purposes. Future transport related research can follow this line of study by identifying
heterogeneity among passengers/users of various transport modes. An option could be to
select focus group and within these groups, a control group could be treated with generic
policies and other groups treated with tailored policies to see to what extend considering the
heterogeneity performs better or worse than the generic policy making. The results may have
additional insights and possibly the outcomes may policy relevance as well.
Furthermore, there are several other avenues that I can recommend for further research, which
I divide into two main categories: a) application of follow-up methods on consumer
heterogeneity (which was studied in this thesis) in the area of transport and b) application of
the approach taken in this thesis to domains other than transport, such as energy related
research. Next, I will briefly discuss these two categories.
82 Consumer heterogeneity, transport and the environment
6.3.1. Application of follow-up methods on consumer heterogeneity
This thesis had an empirical focus and is based on econometric models. I use cross sectional
data derived from a sample of respondents. One way for further research could be to study
dynamics between respondents in form of computer based simulations. Social science
literature refers to such computer based simulation as agent based models (ABM).
These ABMs simulate the environment where people (which are represented as agents)
interact with each other and with other agents or institution in their environment and their
emergent behaviour are investigated under different policy scenarios. In the context of this
thesis, for instance, our sample of passengers could be simulated with agents, where agents
have demographic information, preferences and attitudes. Agents could be tested with various
policy measures or with hypothetical sceneries and their reaction in different dynamic
environment could be investigated.
In such ABMs studies agents need to make certain decision making which requires
theoretically established mechanism. Finding suitable decision making mechanisms is a
much-debated topic among social science scholars who develop ABMs. Some researchers
have used the belief–desire–intention framework for decision making process of agents (e.g.
Dia, 2002). Others used theory of planned behaviour to represents decision making process in
ABMs (e.g. Zhang & Nuttall , 2007).
More recently, researchers have incorporated utility maximization theories and more specially
used discrete choice models (DCM) as a basis for decision making process of agents in ABMs
(Mueller and de Haan, 2009; Han et al., 2011; Zhang et al., 2011; Brown, 2013). Since
discrete choice models have also been used in this thesis, I find ABMs equipped with discrete
choice models as a potential continuation (follow-up) of this research.
Developing ABMs while introducing empirically based choice experiment into ABM could
be a novel way to study the preferences and choices of airline passengers regarding future
environmental policies, not just in the airline industry but on other transport domains as well.
An agent based model allows for empirical data (real world people/passengers) to be applied
for simulation environment and to consequently observe emerging patterns when different
policies are introduced. Such studies (ABM + DCM) may help us to understand how agents
may react in complex situations with varying policy features, market changes and dynamic
social norms. Ultimately, the emergent behaviour of agents can be studied to assess how
dynamic conditions and environment affect the policy adoption behaviour of agents.
6.3.2. Revealing user heterogeneity on transport and non-transport studies
Although top-down policies for emissions (EU regulations, and comparable regulations in, for
example, the USA, Japan and Australia) have been very successful, however, increasing
transport related emissions worldwide indicates that there is room for much more action. The
demand for transport is increasing which outperforms the gains achieved by current
environmental policies, hence the net CO2 emissions from transport increases. Without
passenger contributions, governments will not be successful in further reducing the transport
related emissions just by imposing top-down policies.
This thesis discusses that tailor made environmental policies for specific sub-groups of
passengers have better effects than the conventional uniform policies. Revealing the

Chapter 6 – Conclusion 83
heterogeneity of passengers becomes an important element for transport policy making. This
thesis has focused on revealing the heterogeneity of users of two modes of transport (air
transport and HVs in road transport category). Given the sharp rise of emissions from global
transport, there is a need to increase the effectiveness of environmental policies for every
mode (i.e. road, rail, water and air).
Revealing heterogeneity of passengers’ (e.g. rail passengers, ferry passengers, modern car
users) based on their attitude and preferences may help to design more effective
environmental policies.
I propose researchers in non-transport domains, such as the energy sector (since it produces
very large amounts of emissions), to also consider the importance of revealing consumer
heterogeneity and understanding the consumer preferences and attitude towards
environmental policies.
Subsequently, when heterogeneity studies are conducted in different sectors (e.g. in transport,
energy, ICT) and the sub-groups (latent classes) of consumers/users in each sector are
detected, there is the opportunity to compare the characteristics of sub-groups of users
between sectors.
6.4. Reflections
The consumer/passenger related approaches and solutions provided in this thesis should not
provide a tool for “window dressing” the environmental issues by the policy makers and
transport planners. They should not postpone developing or practicing the hard policy
approaches for the fact that passenger based environmental policies are implemented. Hard
approaches such as taxing the polluters or implementing functioning ETS systems are difficult
and often unpopular but have important effect on mitigating emissions and benefiting the
environment. Sometimes hard policies may have stronger effect even in changing the
behaviour of people, and example could be increasing fuel taxes that gives incentive for
people to buy fuel efficient cars.
All in all, both hard and soft policies should be implemented simultaneously and in a way that
they do not contradict or neglect each other but instead reinforce each other. For instance, the
ETS policy that provides incentives for airlines to use less polluting aircrafts may be well
aligned with the eco-labeling policy (mentioned in this thesis) that is designed to inform
passengers. ETS policy drives airlines to go for cleaner aircrafts and eco-labeling policy
drives passengers to go for cleaner airlines, thus they may have reinforcing effect.
References
Anable, J. (2005). ‘Complacent car addicts’ or ‘aspiring environmentalists’? Identifying travel
behaviour segments using attitude theory. Transport Policy, 12(1), 65-78.
Boxall, P. C., & Adamowicz, W. L. (2002). Understanding heterogeneous preferences in
random utility models: a latent class approach. Environmental and resource economics, 23(4),
421-446.

84 Consumer heterogeneity, transport and the environment
Brown, M. (2013). Catching the PHEVer: simulating electric vehicle diffusion with an agent-
based mixed logit model of vehicle choice. Journal of Artificial Societies and Social
Simulation, 16(2), 5.
Commission, E. E. (2011). WHITE PAPER roadmap to a single European transport area
towards a competitive and resource efficient transport system. COM (2011), 144.
de Haan, P., Mueller, M. G., & Scholz, R. W. (2009). How much do incentives affect car
purchase? Agent-based microsimulation of consumer choice of new cars—Part II: Forecasting
effects of feebates based on energy-efficiency. Energy Policy, 37(3), 1083-1094.
Dia, H. (2002). An agent-based approach to modelling driver route choice behaviour under
the influence of real-time information. Transportation Research Part C: Emerging
Technologies, 10(5), 331-349.
Gupta, S. and P. K. Chintagunta (1994), ‘On Using Demographic Variables to Determine
Segment Membership in Logit Mixture Models’, Journal of Marketing Research 31, 128–136.
Han, Q., Arentze, T., Timmermans, H., Janssens, D., & Wets, G. (2011). The effects of social
networks on choice set dynamics: Results of numerical simulations using an agent-based
approach. Transportation Research Part A: Policy and Practice, 45(4), 310-322.
McFadden, D. (1986), ‘The Choice Theory Approach to Market Research’, Marketing
Science 5, 275–297.
Minton, A. P., & Rose, R. L. (1997). The effects of environmental concern on
environmentally friendly consumer behavior: An exploratory study. Journal of Business
Research, 40(1), 37-48.
Rienstra, S. A., Rietveld, P., & Verhoef, E. T. (1999). The social support for policy measures
in passenger transport.: A statistical analysis for the Netherlands. Transportation Research
Part D: Transport and Environment, 4(3), 181-200.
Steg, L. (2005). Car use: lust and must. Instrumental, symbolic and affective motives for car
use. Transportation Research Part A: Policy and Practice, 39(2), 147-162.
Swait, J. (1994). A structural equation model of latent segmentation and product choice for
cross-sectional revealed preference choice data. Journal of retailing and consumer services,
1(2), 77-89.

85
Summary
Background
While transport is essential for the functioning of the economy of each country, it is also
contributing to CO2 emissions and other externalities, like safety risks and noise exposure.
According to the Internal Energy Agency, around 23% of global CO2 emissions is related to
the transport sector in 2015, making it second largest emitter after the energy sector (IEA,
2015).
The energy sector has long started to stabilize its emissions through the large scale
introduction of renewable and clean energy sources. If the transport sector continues to
develop as before, this will make this sector perform even worse in terms of its relative
emission contribution.
Although top-down emission policies have been successful (for example, regulations
regarding particulate filters), the increasing transport related emissions worldwide indicates
that there is a need for more action. While regulations and technological innovations may
decreased emissions, but not enough to reduce emissions to acceptable levels; behavioural
change is also necessary (Bristow et al., 2008; Hickman & Banister, 2007). However,
imposing behavioural restrictions may be associated with economic costs. Therefore, the
existing dilemma is how to reduce the share of transport in global emissions while minimizing
unfavourable economic implications.

86 Consumer heterogeneity, transport and the environment
Research objectives
Regarding the emission mitigation efforts in transport, the main policy focus has been to force
vehicle manufacturers (i.e. manufacturers of cars, trains, ships and aircrafts) to reduce
emissions, through technological innovations. However, there has been less attention given to
transport consumer (i.e. passengers, car owners, transport users, etc.); their contribution to
emission mitigation has been limited. In the thesis, I have focused on revealing heterogeneity
among transport passengers/users regarding environmental policies. By understanding
heterogeneity among transport users, the aim is to contribute to the design of passenger-
oriented policies aimed at reducing transport emissions. Since transport sector is very broad, I
have focused my research to investigate the users of two sectors in transport: 1) civil air
transport as the fastest growing transport mode and 2) historic vehicles as part of road
transport that has received hardly any attention in the transport literature.
With regard to air passenger travel, annual growth rates of passenger numbers over the past
years have been more than 5%, despite the recession. This means more flights and
consequently more emissions. Looking at the consumer side, I have investigated passengers’
attitudes and preferences with respect to three environmental policies in the airline industry,
namely: 1) a voluntary carbon offsetting (VCO) scheme 2) an airline eco-efficiency label and
3) a baggage allowance policy. The latter two policy measures are relatively new policies and
rarely studied in the literature.
In previous decades, transport planners were mainly interested in predicting aggregate
passenger’s travel behaviour (Handy, 2012). However, in recent years the attention has been
shifted to understanding individual behaviour. To develop effective policies, Handy (2012)
recommends researchers and policy makers to aim to understand transport requirements,
travel choices, intentions and preferences of specific segments of population. Following this
approach, I have focused on airline passengers and identified the various segments among
them based on their preferences and attitudes towards the three airline environmental policies.
Additionally, I tested the impact of social norms on air passengers’ behaviour. The collective
participation rate in carbon offsetting schemes was introduced as a form of social norm to the
respondents in order to assess whether and to what extent it influenced passengers’
willingness to participate in such schemes. In a broader sense, and following Nyborg and
Rege (2003), I investigated how socially desired behaviour could affect the participation in
VCO policy.
With respect to the second case studied in this thesis (i.e. historic vehicles), it can be
concluded that academic literature has extensively discussed the impact of road transport on
the environment since road vehicles emit 75% of total transport related CO2 emissions
worldwide (IEA, 2015). However, most mitigating policies focus on the new vehicles entering
the market and there is hardly any attention paid to vehicles already in the market. Historic
vehicles are the heritage of road transport. The current policy discourse on historic vehicles
does not address the main environmental concerns and existing policies are sometimes
contradictory. The lack of available scholarly material in the field of historic vehicles presents
a clear gap in literature. Furthermore, the potential societal costs and benefits of historic road
vehicles have not been addressed in the literature.
According to Steg (2005), there are several motives for car use and ownership and it is highly
valuable to identify motives of different “specific target groups” in society. She recommends

Summary 87
designing transport policies based on motives of user groups in society. In this way, policy
measures would have more impact on socially relevant goals (Steg, 2005). Based on this
recommendation, and the fact that motives for HV owners have not yet been studied, I
conducted an empirical study on historic vehicle owners to reveal the heterogeneity among
them, thereby filling this important knowledge gap. Based on the results, the policy relevance
(in terms of environmental impact) of each specific HV owner segment is discussed.
Methods
To answer the research questions formulated in this thesis, I have primary taken an empirical
approach. In total, I have conducted three empirical studies (studies 1, 2 and 4) and one
literature review (study 3).
In the first and second empirical study, I assessed airline passengers’ responses to
environmental policies within the discrete choice modelling framework. In the first study, I
additionally assessed the impact of social norms on the utility derived from environmental
policies. In the second study, I used passengers’ psychometric and attitudinal data to reveal
different segments of airline passengers.
The third study concerns a literature review on historic vehicles, which is performed by
assessing the available academic studies and also non-academic material (such as policy
reports etc.). Three main transport policy impacts are considered in the review: congestion,
safety and pollution.
Finally, in the third empirical study, latent class cluster analysis is used to explore historic
vehicle owners’ heterogeneity and reveal the varying characteristics of different segments of
HV owners.
Findings
Study 1: airline environmental policies and the role of social norms
Three environmental policies in the civil airline industry were selected for inclusion in our
empirical study, namely: 1) a voluntary carbon offsetting (VCO) scheme 2) an airline eco-
efficiency label and 3) a baggage allowance policy. The results indicated that the impact of
voluntary carbon offsetting on passengers’ utility was slightly positive. Passengers gained
considerable utility when their baggage allowances were increased. Thirdly, as expected,
passengers lost utility when the eco-efficiency of the airline decreased from A (green) to C
(grey).
Given the empirical findings, I conclude that VCO policies do not introduce large utility
gains, reflecting the lack of large scale contributions from the passenger side to such programs
in the real world. Passengers respond strongly negative to limits on the available luggage, and
therefore this policy will lack support and likely fail or hardly have any impact, if adopted by
the airlines. However, the concept behind eco-efficiency policy was well understood and
incorporated in the decision making of the passengers when choosing an airline. This
indicates a potential for being an effective policy.
Regarding the impacts of social norms, several significant effects were found. The results
indicate that increasing collective offsetting rates (the social norm) increases utility (of

88 Consumer heterogeneity, transport and the environment
offsetting), but contrary to expectations in a non-linear way. When the collective offsetting
rate is 5%, passengers gain a marginal utility from contributing to the VCO program. When
the collective offsetting rate is 90%, the gain in utility is also high (as expected). However, the
utility gain of VCO becomes negative when the collective offsetting rate is 50%. Hence,
passengers loose utility from offsetting at this collective offsetting rate. While it was expected
that the preference for VCO would increase linearly with the collective offsetting rate, it
seems that the actual relationship is curvilinear. It can be speculated that the 50% offsetting
rate is indicative of strong controversy over the offsetting program, leading respondents to
withdraw and attach less value to VCO.
Unexpectedly, the social norms also impact respondents’ sensitivity towards the baggage
allowance policy and the airline eco-efficiency labelling scheme. Similar to the carbon
offsetting, this impact was curvilinear for the baggage allowance. The eco-efficiency labeling
policy had a significant and positive interaction with the social norm indicator, meaning that
when a high social norm is demonstrated (i.e. a collective offsetting rate of 90%) passengers
attach more weight to the eco-efficiency label.
Overall, I conclude that the social norm tested in this experiment does indeed impact
consumers’ preferences but it appears not be a straightforward and simple linear effect. In
addition, the social norm does not only influence the preference towards carbon offsetting but
also the preferences towards the other two policy measures.
Study 2: revealing heterogeneity among airline passengers
To reveal the heterogeneity of passengers towards airline environmental policies, passengers’
attitudes towards 12 statements were measured. From these statements four attitudinal
constructs were extracted, which, in combination with the specification of a latent class choice
model, allowed for segmenting passengers based on both their preferences (choices) and
attitudes. The results indicated that three segments could be extracted: price hunters, luggage
lovers and eco-flyers.
41% of our sample was assigned to the eco-flyer segment, indicating that a substantial portion
of the passengers obtained utility from the environmental policies. In general, there seems
scope for implementing such policies. Most previous studies to date presented their findings
based on the average estimates derived from their whole sample, which is only partially
insightful for decision makers. In this study I instead focused on the different segments of
passengers to identify which policy is supported by which group and propose some tailored
policies, as possible examples.
Study 3: review of effects of HVs
To assess the effects of historic vehicles on emissions, safety, and congestion, I conducted a
literature review, which I also complemented by own calculations based on the data obtained
from the review.
HVs’ impact on environment was divided in three categories, namely CO2 emissions, non-
CO2 emissions and noise. Per kilometre, HVs emit much more non-CO2 emissions such as
CO, HC, NOx, and PMx than modern vehicles due to their old technology. Per kilometre CO2
emissions are, however, only 10 to 20% higher than emissions of modern vehicles. On a life
cycle basis, including the production of vehicles, the kilometre km CO2 emissions of HVs are
Summary 89
about equal to those of the modern fleet. Since HV owners drive these vehicles less frequently
(roughly 1% of the fleet can be identified as HV, but their relative share in the total kilometres
driven is only 0.24%), and generally drive in favourable weather conditions and less
congested regions, it is less likely that these vehicles have a proportionally lower (and thus
marginal) impact on the congestion. Concerning safety, HVs perform worse compared to
modern vehicles with respect to both active (e.g. brakes, handling) and passive (crash
worthiness) safety characteristics. However, given the low accident rate, it seems that the safe
driving performance of HV owners compensates for the relatively unsafe features of HVs.
I further examined the social benefits of HV ownership and use. HV owners often develop
emotional bonds with their vehicles and enjoy driving them. These can be considered positive
social effects of HVs. The presence of HVs in social gatherings, public events and charity
events can be also an indicator of public support towards presence of such vehicles in the
society. Moreover, HVs provide some economic benefits. For example, annual expenses have
been estimated to be around €3782 per owner per year, excluding fuel and tax costs. In
addition, it has been estimated that these expenses support roughly 114,000 jobs in the EU.
However, without HVs, people would probably spend their money on other goods and
services, so this estimated number of jobs does not necessarily add to all jobs in the EU.
Study 4: segmenting HV owners
The final empirical study was focused on revealing heterogeneity among HV owners. Based
on a large dataset of HV owners from 15 EU nations, seven latent classes were extracted: 1)
recreational owners (28%), 2) reserved owners (21%), 3) repair men (15%), 4) die-hard fans
(13%), 5) next generation fans (9%), 6) frequent drivers (8%) and 7) collectors (5%). The
existence of seven, statistically significant, segments was insightful. The finding that only 8%
of the historic passenger car owners drove their car ‘frequently’ was especially relevant from
an environmental policy perspective. On the other hand, (as shown by the previous study) it
should be taken into account that emission factors of HVs are much higher than those of
modern cars.
The need for tailored policies
Environmental policies that require the voluntary participation of consumers often fail to
make a significant impact (e.g. CO2 offsetting schemes). Therefore, I argue that designing
effective passenger-oriented emission mitigation policies in transport, essentially, requires
identifying users’ preferences, attitudes and motives. By taking into account the heterogeneity
of transport users with respect to these aspects, transport planners can develop alternative
policies that are more effective in reducing the environmental impacts of transport. If policies
are informed by the preferences of specific segments, there is a higher probability that users
can relate to one (or more) mitigating policy. Taken together, different policy options may
thereby be able to attract more participation of transport users. In sum, designing tailored
policies for heterogeneous users in society can lead to higher participation of transport users
in voluntary measures.
Policy recommendations
With respect to the revealed air passenger segments, the price-hunters can best be engaged in
more sustainable travel behaviour by internalising the external costs of flying into the price of
travel. In this respect, governments could impose extra emission taxes on ‘C labelled’ airlines

90 Consumer heterogeneity, transport and the environment
or introduce taxes on kerosene. In this way, the price sensitive passengers are implicitly
directed to the cleaner airlines. Airlines may also approach this group with positive price
incentives, for example, by offering discounts in exchange for a reduction in the amount of
baggage the passenger is allowed to carry. This discount can be offered on the basis of the
amount of fuel saved (i.e. reduced operating costs).
Eco-flyers gain utility from carbon offsetting and will take information from eco-efficiency
labels into consideration when booking a flight. Minton & Rose (1997) also emphasize the
importance of access to relevant information to enhance people’s ability to choose the most
environmentally friendly product. To increase participation in carbon off-setting, current
schemes could be enriched by offering passengers a CO2 offset account and providing them
with credits each time they offset their emissions. Based on the credits earned, passengers can
be offered exclusive services in collaboration with airports, such as faster inspection and
customs checks. By making carbon offsetting ‘visible’ at airports other potential contributors
may be reached more effectively.
Regarding historic vehicles, a balanced approach is necessary to protect the interests of
owners and simultaneously reduce environmental impacts of these vehicles. To reduce the
environmental impacts of HVs, I suggest two policies: ‘charging per kilometre’ and ‘charging
based on a quota’. These policies have different technical approaches, but in essence both
policies allow HV owners to continue driving their vehicles and only enforce barriers to those
who drive HVs exceptionally more than the rest. Such policies would help to reduce HV
related emissions and also help to preserve HVs. I expect the effect of these policies to be
more promising than current policies related to restricted environmental zones, which have
not considered the diversity among HV users and do not offer any flexibility.
Final thought
As a final thought, I believe it is important that the consumer/passenger oriented approach
advocated in this thesis should not be used as an instrument to support “window dressing” by
the policy makers and transport planners. Policy makers should not postpone developing
and/or implementing ‘hard’ policy measures, like the taxation of kerosene or the
implementation of a functioning European Trading System. Such measures are difficult to
implement and are unpopular, but are actually needed to significantly reduce environmental
effects.
Hard and soft policies should be considered simultaneously in a way that they do not
contradict or neglect each other but instead reinforce each other. For instance, the ETS policy
that provides incentives for airlines to use less polluting aircrafts may be well aligned with the
eco-labeling scheme that is designed to inform passengers. ETS policy drives airlines to opt
for cleaner aircrafts and the eco-label drives passengers to choose cleaner airlines, thus
creating mutually reinforcing effects.
References
Bristow, A. L., Tight, M., Pridmore, A., & May, A. D. (2008). Developing pathways to low
carbon land-based passenger transport in Great Britain by 2050. Energy Policy, 36(9), 3427-
3435.

Summary 91
Handy, S. (2012). A Review of “Auto motives; Understanding car use behaviours” Karen
Lucas, Evelyn Blumenberg, and Rachel Weinberger (Eds.).(2011). Bingley, UK: Emerald
Publishing Group Limited. Journal of the American Planning Association, 78(3), 344-345.
Hickman, R., & Banister, D. (2007). Looking over the horizon: Transport and reduced CO2
emissions in the UK by 2030. Transport Policy, 14(5), 377-387.
IEA (2015). CO2 emissions from fuel combustion- highlights, from
https://www.iea.org/publications/freepublications/publication/CO2EmissionsFromFuelCombu
stionHighlights2015.pdf. OECD/IEA, 9 rue de la Fédération, 75739 Paris Cedex 15, France.
Minton, A. P., & Rose, R. L. (1997). The effects of environmental concern on
environmentally friendly consumer behavior: An exploratory study. Journal of Business
Research, 40(1), 37-48.
Nyborg, K., Rege, M., 2003. On social norms: the evolution of considerate smoking behavior.
Journal of Economic Behavior and Organization 52, 323–340.
Steg, L. (2005). Car use: lust and must. Instrumental, symbolic and affective motives for car
use. Transportation Research Part A: Policy and Practice, 39(2), 147-162.

92 Consumer heterogeneity, transport and the environment
93
Samenvatting
Achtergrond
Hoewel de transportsector essentieel is voor de economie van een land, draagt de sector ook
bij aan CO2 emissies en andere externaliteiten, zoals veiligheids risico’s en blootstelling aan
geluid. Volgens het International Energie Agentschap was ongeveer 23% van de wereldwijde
CO2 uitstoot in 2015 gerelateerd aan de transportsector. De sector komt hiermee - na de
energiesector - op de tweede plaats als het gaat om de relatieve bijdrage aan de totale CO2
uitstoot (IEA, 2015).
De energiesector is al langere tijd bezig met het stabiliseren van de hoeveelheid emissies door
hernieuwbare en schone energiebronnen te introduceren. Als de transportsector zich op
dezelfde voet blijft ontwikkelen, dan zal haar relatieve bijdrage aan de totale emissie groter
worden.
Hoewel top-down emissiebeleid succesvol is geweest (bijvoorbeeld de regulering ten aanzien
van roetfilters), toont de toename in emissies aan dat meer actie noodzakelijk is. Hoewel
regulering en technologische innovaties emissies kunnen reduceren, is dit niet voldoende is
om emissies tot acceptabele niveaus te reduceren; hiervoor is gedragsverandering ook
noodzakelijk (Bristow et al., 2008; Hickman & Banister, 2007). Het stellen van
gedragsrestricties kan echter leiden tot economische kosten. De vraag is dus hoe het aandeel
van transport in de globale emissies geminimaliseerd kan worden zonder dat dit gepaard gaat
met onwenselijke economische gevolgen.

94 Consumer heterogeneity, transport and the environment
Onderzoeksdoelen
Het beleid ten aanzien van emissiemitigatie in de transportsector, is vooral gefocust op het
dwingen van fabrikanten (van auto’s, treinen, schepen en vliegtuigen) om emissies te
reduceren door middel van technologische innovatie. Er is minder aandacht geweest voor de
‘consumenten’ van transport (passagiers, autobezitters, reizigers, etc.); hun bijdrage aan
emissiemitigatie is beperkt gebleven. In deze dissertatie heb ik me geconcentreerd op het
blootleggen van heterogeniteit onder transportpassagiers/-gebruikers ten aanzien van
milieumaatregelen. Het achterliggende doel is om met deze kennis van de heterogeniteit een
bijdrage te leveren aan het ontwerp van reizigers-georiënteerde maatregelen die beogen
transportemissies te verminderen. Aangezien de transportsector erg breed is, heb ik mijn
onderzoek gericht op de gebruikers in twee sectoren: 1) de civiele luchtvaart als de snelste
groeiende vervoerswijze en 2) historische voertuigen als onderdeel van het wegtransport dat
nog zeer weinig aandacht heeft gekregen in de transportliteratuur.
Ondanks de recessie zijn de jaarlijkse groeipercentages van het aantal passagiers in de civiele
luchtvaart over de afgelopen jaren groter dan 5% geweest. Dit betekent meer vluchten en dus
meer emissies. Vanuit een consumentenperspectief heb ik de attitudes en preferenties van
passagiers ten aanzien van drie milieumaatregelen onderzocht: 1) een vrijwillige CO2
compensatieregeling, 2) een luchtvaart eco-efficiëntie label en 3) een limiet ten aanzien van
de toegestane hoeveelheid bagage. De twee laatstgenoemde maatregelen zijn relatief nieuw en
zelden onderzocht in eerder onderzoek.
Over de afgelopen decennia waren transportplanners vooral geïnteresseerd in het voorspellen
van het geaggregeerde gedrag van reizigers (Handy, 2012). Afgelopen jaren is de aandacht
echter verschoven naar het begrijpen van individueel gedrag. Voor het ontwikkelen van
effectief beleid, beveelt Handy (2012) onderzoekers en beleidsmakers aan te trachten de
eisen, transportkeuzes, intenties en voorkeuren van specifieke segmenten van de populatie
beter te begrijpen. In navolging van deze aanbeveling, heb ik mij gericht op de verschillende
segmenten van luchtvaartpassagiers gebaseerd op de voorkeuren en attitudes ten aanzien van
de drie milieumaatregelen.
Daarnaast heb ik de invloed van sociale normen op het gedrag van luchtvaartpassagiers getest.
De collectieve participatiegraad in CO2 compensatie was geïntroduceerd als een vorm van
sociale norm richting de respondenten, om zodoende te achterhalen of en in welke mate dit de
bereidheid van passagiers zou beïnvloeden om deel te nemen aan dergelijke maatregelen.
Meer generiek, in navolging van Nyborg and Rege (2003), heb ik onderzocht hoe sociaal
wenselijk gedrag de participatie in vrijwillige CO2 compensatie kan beïnvloeden.
Met betrekking tot de tweede casus die onderzocht is in deze dissertatie (historische
voertuigen), kan geconcludeerd worden dat de academische literatuur uitgebreid de impact
van wegtransport op het milieu heeft behandeld, aangezien voertuigen op de weg
verantwoordelijk zijn voor 75% van de totale transport gerelateerde CO2 emissies wereldwijd
(IEA, 2015). Het beleid richt zich echter voornamelijk op nieuwe voertuigen die op de markt
komen en er is nagenoeg geen aandacht besteed aan bestaande voertuigen in de markt. Het
huidige beleidsdiscours ten aanzien van historische voertuigen adresseert daarnaast niet de
belangrijkste milieuaspecten van historische voertuigen en bestaand beleid is soms
tegenstrijdig. Het gebrek aan beschikbare academische studies in het veld van historische
voertuigen is een duidelijke kennislacune. De mogelijke maatschappelijke kosten en baten
van historische voertuigen zijn daarnaast nog niet geadresseerd in de bestaande literatuur.

Samenvatting 95
Volgens Steg (2005) zijn er een aantal motieven voor autobezit en –gebruik. Het identificeren
van de motieven van verschillende specifieke doelgroepen in de samenleving is erg
waardevol. Zij beveelt aan om beleidsmaatregelen te ontwerpen op basis van de motieven van
gebruikersgroepen in de samenleving. Op deze manier kunnen beleidsmaatregelen meer
impact hebben op maatschappelijk relevante doelen (Steg, 2005). Gebaseerd op deze
aanbeveling, en het feit dat de motieven van bezitters van historische voertuigen nog niet
eerder zijn onderzocht, heb ik een empirische studie uitgevoerd om de heterogeniteit onder
bezitters van historische voertuigen inzichtelijk te maken, en daarmee deze kennislacune te
adresseren. Gebaseerd op de resultaten, is de beleidsrelevantie (in termen van de
milieueffecten) van elk segment van historisch voertuigbezit bediscussieerd.
Methoden
Om de in dit proefschrift geformuleerde onderzoeksvragen te beantwoorden heb ik
voornamelijk een empirische aanpak gehanteerd. In totaal heb ik drie empirische studies
(studies 1, 2 en 4) en één literatuuronderzoek (studie 3) uitgevoerd.
In de eerste en tweede empirische studie, heb ik - binnen het raamwerk van discrete
keuzemodellen - de reacties onderzocht van luchtvaartpassagiers op milieumaatregelen. In de
eerste studie heb ik me daarnaast gericht op het vaststellen van de invloed van sociale normen
op het nut dat mensen ontlenen van milieumaatregelen. In de tweede studie heb ik
psychometrische en attitudes gerelateerde data gebruikt om verschillende segmenten van
luchtvaartpassagiers bloot te leggen.
De derde studie betrof een literatuurverkenning van historische voertuigen. Deze studie is
uitgevoerd op basis van de beschikbare academische en niet-academische literatuur
(beleidsdocumenten). Binnen deze verkenning zijn drie transportbeleidseffecten
meegenomen: congestie, veiligheid en vervuiling.
Als laatste is, de derde empirische studie, een latente klasse cluster analyse uitgevoerd om de
heterogeniteit te verkennen onder bezitters van historische voertuigen om zo verschillende
segmenten te onderscheiden.
Bevindingen
Studie 1: milieumaatregelen in de luchtvaart en de rol van sociale normen
Drie milieumaatregelen in de civiele luchtvaartsector waren, zoals hiervoor is aangegeven,
geselecteerd voor de empirische studie, namelijk 1) een vrijwillige CO2 compensatieregeling,
2) een luchtvaart eco-efficiëntie label en 3) een limiet ten aanzien van de toegestane
hoeveelheid bagage. De studie toonde aan dat het effect van vrijwillige CO2 compensatie op
het nut van passagiers licht positief is. Ook ontleenden passagiers meer nut van het oprekken
voor de limieten van de toegestane hoeveelheid bagage. En ten derde verloren passagiers,
zoals verwacht, nut indien het eco-efficiëntie label van de luchtvaartmaatschappij veranderde
van A (groen) naar C (grijs).
Gebaseerd op deze bevinden concludeer ik dat CO2 compensatieregelingen niet leiden tot
grote nutsbijdragen, wat overeenkomst met afwezigheid van grootschalige bijdragen aan
dergelijke regelingen in de werkelijkheid. Passagiers reageren sterk op limieten die gesteld

96 Consumer heterogeneity, transport and the environment
worden aan de hoeveelheid bagage, en dit beleid zal daarom waarschijnlijk falen of weinig
effect sorteren als het ingevoerd zou worden door luchtvaartmaatschappijen. Het concept
achter het eco-efficiëntie label werd echter goed begrepen en door passagiers meegenomen in
hun keuze voor een luchtvaartmaatschappij. Dit geeft aan dat een dergelijke maatregel
potentieel effectief kan zijn.
Ten aanzien van de invloeden van de sociale norm zijn ook een aantal significante effecten
gevonden. De resultaten tonen aan dat een toename in de collectieve participatiegraad in CO2
compensatie (de sociale norm) leidt tot een toename in nut (van compensatie), maar in
tegenstelling tot de verwachting op niet-lineaire wijze. Als de collectieve participatiegraad 5%
is, ontlenen passagiers enigszins nut van een bijdrage aan CO2 compensatie. Als de
collectieve participatiegraad 90% is, is het nut dat ontleend wordt ook hoog (in lijn met de
verwachting). Echter, de nutsbijdrage van vrijwillige compensatie wordt negatief als de
collectieve participatiegraad 50% is. Passagiers verliezen dus nut bij deelname aan CO2
compensatie bij deze collectieve participatiegraad. Hoewel verwacht werd dat de voorkeur
voor CO2 compensatie lineair zou toenemen met de collectieve participatiegraad, bleek de
feitelijke relatie dus curve-lineair. Mogelijk wordt een participatiegraad van 50% gezien als
indicatief voor sterke meningsverschillen ten aanzien van het compensatieprogramma, wat er
toe zou kunnen leiden dat respondenten zich terugtrekken en minder waarde hechten CO2
compensatie.
Tegen de verwachting in is gebleken dat de sociale norm ook van invloed is op de
gevoeligheid van respondent ten aanzien van de bagagelimiet en het eco-efficiëntie label van
de luchtvaarmaatschappij. Net als bij de CO2 compensatie bleek het effect voor de
bagagelimiet curve-lineair van aard te zijn. De indicator voor het eco-efficiëntie label had een
significante positieve interactie met de sociale norm indicator, wat betekent dat bij een hoge
sociale norm (i.e. een collectieve participatiegraad van 90%) passagiers meer waarde hechten
aan het eco-efficiëntie label.
Samenvattend concludeer ik dat de sociale norm die getoetst is in het experiment inderdaad de
preferenties van consumenten beïnvloedt, maar dat het effect niet lineair van aard is.
Daarnaast is gebleken dat de sociale norm niet alleen de preferentie ten aanzien van
vrijwillige CO2 compensatie beïnvloedt (zoals verwacht), maar ook de preferenties ten
aanzien van de twee andere maatregelen.
Studie 2: het onderscheiden van heterogeniteit onder luchtvaartpassagiers
Om de heterogeniteit van passagiers ten aanzien van de milieumaatregelen bloot te leggen,
waren de attitudes van respondenten gemeten aan de hand van 12 stellingen. Uit deze
stellingen zijn vier houdingsconstructen geëxtraheerd, die in combinatie met de specificatie
van een latente klasse keuze model, gebruikt zijn om passagiers te segmenteren op basis van
hun preferenties (keuzes) en attitudes. De resultaten toonden drie segmenten: prijsjagers,
bagageliefhebbers en eco-reizigers.
41% van de steekproef was toegewezen aan het eco-reizigers segment, wat betekent dat een
substantieel deel van de passagiers nut ontleende van de milieumaatregelen. In het algemeen
lijkt er dus potentie te zijn voor de implementatie van dergelijke maatregelen. De meeste
eerdere studies tonen tot nu toe alleen de gemiddelde schattingen voor de hele steekproef, wat
slechts beperkte inzichten biedt voor beleidsmakers. In deze studie heb ik me gericht op het
onderscheiden van de verschillende segmenten van passagiers om te achterhalen welk beleid

Samenvatting 97
gesteund zou worden door welke groep en om voorbeelden van specifieke ‘maatwerk’
maatregelen te geven.
Studie 3: verkenning van de effecten van historische voertuigen
Om de effecten van historische voertuigen op emissies, veiligheid en congestie vast te stellen
heb ik een literatuurstudie uitgevoerd, welke ik aangevuld heb met eigen berekeningen op
basis van de in de literatuur gevonden data.
De impact van historische voertuigen op het milieu was opgedeeld in drie categorieën,
namelijk CO2 emissies, niet-CO2 emissies en geluid. Als gevolg van de oude technologie,
stoten historische voertuigen in vergelijking met moderne voertuigen veel meer niet-CO2
emissies uit, zoals CO, HC, NOx, en PMx,. De CO2 emissie per gereden kilometer is echter
slechts 10-20% hoger dan die van moderne voertuigen. Op levenscyclusbasis, dus inclusief
het productieproces van auto’s, is de CO2 emissie per gereden kilometer min of meer gelijk
aan die van voertuigen van de moderne vloot. Omdat de bezitters van historische voertuigen
hun auto’s minder vaak gebruiken (ongeveer 1% van de vloot kan geïdentificeerd worden als
historisch voertuig, terwijl het aandeel in het totaal afgelegde aantal kilometers slechts 0,24%
is), en vaker in gunstige weersomstangheden rijden en gebieden die minder last hebben van
congestie, is het aannemelijk dat deze categorie van voertuigen een proportioneel mindere (en
daarmee marginale) invloed heeft op congestie. Ten aanzien van veiligheid presteren
historische voertuigen slechter dan moderne voertuigen in termen van zowel actieve (remmen,
rijgedrag) als passieve (botsingsbestendigheid) veiligheidskarakteristieken. Het relatief lage
aantal ongelukken suggereert echter dat de veilige manier van rijden van bezitters van
historische voertuigen compenseert voor deze onveilige kenmerken.
Ik heb ook de sociale baten van het bezit en gebruik van historische voertuigen beschouwd.
Eigenaren van historische voertuigen ontwikkelen vaak een emotionele band met hun
voertuigen en genieten van het rijden in hun voertuig, hetgeen kan worden gezien als de
positieve sociale effecten van historische voertuigen. De aanwezigheid van historische
voertuigen in sociale bijeenkomsten, publieke evenementen en liefdadigheidsevenementen,
kan ook gezien worden als indicator voor de steun van het publiek wat betreft het bestaan van
deze voertuigen in onze samenleving. Historische voertuigen gaan daarnaast ook gepaard met
economische baten. Zo zijn de jaarlijkse uitgaven per eigenaar per jaar geschat op 3782 euro,
exclusief brandstofkosten en belasting. Daarnaast is geschat dat deze uitgaven ongeveer
114.000 banen in de EU opleveren. Zonder historische voertuigen zouden mensen
waarschijnlijk hun geld besteden aan andere goederen en diensten, dus dit zijn geen
additionele banen.
Studie 4: het segmenteren van eigenaren van historische voertuigen
De laatste empirische studie was gericht op het blootleggen van heterogeniteit onder
eigenaren van historische voertuigen. Gebaseerd op een grote dataset van eigenaren van
historische voertuigen uit 15 verschillende EU landen, heb ik 7 clusters geëxtraheerd: 1)
recreatieve eigenaren (28%), 2) ingetogen eigenaren (21%), 3) reparateurs (15%), 4) fanatieke
fans (13%), 5) ‘next generation’ fans (9%), 6) frequente rijders (8%) en 7) verzamelaars (5%).
Het bestaan van de zeven statistisch significante segmenten was inzichtelijk. Zo was de
bevinding dat slechts 8% van de eigenaren van historische voertuigen hun auto regelmatig
gebruikte relevant vanuit een milieubeleidsoptiek. Aan de andere kant moet hierbij rekening

98 Consumer heterogeneity, transport and the environment
gehouden worden met het feit dat de emissiefactoren van historische voertuigen hoger zijn
dan moderne voertuigen (zoals de vorige studie heeft laten zien).
De noodzaak van ‘maatwerk’ beleid
Milieumaatregelen die afhankelijk zijn van de vrijwillige participatie van consumenten slagen
er vaak niet in om een significante impact te hebben (bijv. vrijwillige CO2 compensatie). Om
deze reden beargumenteer ik dat voor het ontwerp van effectieve passagier-georiënteerde
milieumaatregelen essentieel is kennis te hebben van de preferenties, voorkeuren en motieven
van gebruikers. Door de heterogeniteit van transportgebruikers ten aanzien van deze aspecten
in overweging te nemen, kunnen transportplanners alternatieve maatregelen ontwikkelen die
effectiever zijn in het reduceren van de milieueffecten van transport. Als maatregelen
gebaseerd zijn op de voorkeuren van specifieke groepen, is er een grote kans dat gebruikers
zich kunnen relateren aan één (of meerdere) mitigatiemaatregelen. Gezamenlijk kunnen
verschillende beleidsmaatregelen daardoor op meer participatie van transportgebruikers
rekenen. Samengevat, het ontwerp van maatwerkbeleid voor heterogene gebruikers kan leiden
tot meer deelname van transportgebruikers bij vrijwillige maatregelen.
Beleidsaanbevelingen
Met betrekking tot de segmenten van luchtvaartpassagiers die blootgelegd zijn, kunnen de
prijsjagers het beste aangezet worden tot duurzaam gedrag door de externe kosten van het
vliegen te internaliseren in de prijs. Zo zouden overheden extra belasting kunnen heffing op
‘C label’ luchtvaartmaatschappijen of belastingen kunnen invoeren op kerosine. Op deze
manier zullen de prijsgevoelige passagiers impliciet geleid worden naar de schonere
luchtvaartmaatschappijen. Luchtvaartmaatschappijen zouden deze groep ook kunnen
benaderen met positieve prijsincentives, door bijvoorbeeld kortingen aan te bieden als mensen
minder bagage meenemen. De korting kan gerelateerd worden aan de hoeveelheid bespaarde
brandstof (i.e. de reductie in operationele kosten).
Eco-reizigers ontlenen nut aan CO2 compensatie en zullen informatie met betrekking tot de
eco-efficiëntie van een luchtvaartmaatschappij in overweging nemen bij het boeken van een
vlucht. Ook Minton & Rose (1997) benadrukken het belang van toegang tot relevante
informatie om mensen in staat te stellen de meest milieuvriendelijke producten te kiezen. Om
de participatie in vrijwillige CO2 compensatie te verhogen, zouden huidige programma’s
verrijkt kunnen worden met het aanbieden van CO2 compensatie accounts waarmee mensen
punten kunnen verdienen voor iedere keer dat ze ervoor kiezen om hun uitstoot te
compenseren. In ruil voor deze punten zouden ze gebruik mogen maken van exclusieve
diensten in samenwerking met luchthavens, zoals snellere veiligheids- en douanecontroles.
Zodoende zou vrijwillige compensatie zichtbaar worden op de luchthaven, waardoor andere
mensen die potentieel willen bijdragen ook eerder bereikt kunnen worden.
Ten aanzien van historische voertuigen is een gebalanceerde aanpak noodzakelijk om de
belangen van eigenaren te waarborgen en tegelijkertijd de milieueffecten van deze voertuigen
te verminderen. Om de milieueffecten te verminderen suggereer ik twee maatregelen: een
kilometerheffing en een heffing gebaseerd op een quotum. De maatregelen kennen
verschillende technische uitvoeringen, maar in essentie laten beide ruimte voor eigenaren van
historische voertuigen om hun auto te gebruiken, terwijl ze barrières opwerpen voor eigenaren
die veel meer rijden dan de rest. Dergelijke maatregelen kunnen helpen emissies te reduceren
maar helpen ook in het behoud van historische voertuigen. Ik verwacht dat het effect van deze

Samenvatting 99
maatregelen veel belovender is dat de huidige milieuzones, die geen recht doen aan de
diversiteit onder eigenaren van historische voertuigen en niet flexibel zijn.
Tot slot
Tot slot acht ik het belangrijk te benadrukken dat de consumenten/passagier georiënteerde
aanpak die ik onderschrijf niet misbruikt moet worden als middel om ‘window dressing’ te
ondersteunen door beleidsmakers of transportplanners. Beleidsmakers moeten ‘harde’
maatregelen, zoals een belasting op kerosine of de invoering van het Europees systeem voor
emissiehandel (ETS), niet uitstellen. Dergelijke maatregelen zijn moeilijk te implementeren
en niet populair, maar feitelijk noodzakelijk om milieueffecten drastisch te reduceren.
Harde en zachte maatregelen zullen tegelijkertijd beschouwd moeten worden op een manier
waarop ze niet tegenstrijdig met elkaar zijn, maar elkaar juist aanvullen. Zo kan het ETS
beleid dat luchtvaartmaatschappijen een incentive biedt voor het gebruik van schone
vliegtuigen goed gecombineerd worden met een eco-label dat als doel heeft passagiers te
informeren. Het ETS beleid motiveert luchtvaartmaatschappijen te kiezen voor schone
vliegtuigen en het eco-label motiveert passagiers te kiezen voor schonere vliegtuigen en op
deze manier kunnen wederzijds versterkende effecten ontstaan.
Referenties
Bristow, A. L., Tight, M., Pridmore, A., & May, A. D. (2008). Developing pathways to low
carbon land-based passenger transport in Great Britain by 2050. Energy Policy, 36(9), 3427-
3435.
Handy, S. (2012). A Review of “Auto motives; Understanding car use behaviours” Karen
Lucas, Evelyn Blumenberg, and Rachel Weinberger (Eds.).(2011). Bingley, UK: Emerald
Publishing Group Limited. Journal of the American Planning Association, 78(3), 344-345.
Hickman, R., & Banister, D. (2007). Looking over the horizon: Transport and reduced CO2
emissions in the UK by 2030. Transport Policy, 14(5), 377-387.
IEA (2015). CO2 emissions from fuel combustion- highlights, from
https://www.iea.org/publications/freepublications/publication/CO2EmissionsFromFuelCombu
stionHighlights2015.pdf. OECD/IEA, 9 rue de la Fédération, 75739 Paris Cedex 15, France.
Minton, A. P., & Rose, R. L. (1997). The effects of environmental concern on
environmentally friendly consumer behavior: An exploratory study. Journal of Business
Research, 40(1), 37-48.
Nyborg, K., Rege, M., 2003. On social norms: the evolution of considerate smoking behavior.
Journal of Economic Behavior and Organization 52, 323–340.
Steg, L. (2005). Car use: lust and must. Instrumental, symbolic and affective motives for car
use. Transportation Research Part A: Policy and Practice, 39(2), 147-162.

100 Consumer heterogeneity, transport and the environment

101
About the author
Yashar Araghi was born on 31st of August 1980, in Zanjan, Iran. He graduated as a
mechanical engineer in 2005 and worked in the industry for 5 years. After gaining a few
years of work experience at the industry, he realised the need to gain some fundamental socio-
technical knowledge that are highly necessary and complementary to the engineering courses.
Therefore, he enrolled in a Master’s course called: “engineering and policy analysis”, in year
2010, at the faculty of technology policy and management (TPM), in Delft university of
Technology.
After completing his Master thesis, in year 2012, in the field of sustainable policy making in
the airline industry, he became more interested in the behavioural studies in the transport
sector and was offered to conduct a PhD research in this field.
Between 2012 and 2017, he performed his PhD research on the topic of passenger behaviour
and environmental policy making in transport. While doing his PhD research at the section of
transport and logistics (TLO), he also worked as a researcher at the section of energy and
industry (E&I), where he performed several independent studies on consumer preferences and
attitudes towards renewable energy sources. He borrowed several methods, frequently applied
in transport domain, and implemented them in the energy domain.
During his time at TPM, Yashar taught in several research methods courses and co-supervised
several student for their Master’s thesis. He also published his research in various academic
conferences and academic journals.

102 Consumer heterogeneity, transport and the environment

103
TRAIL Thesis Series
The following list contains the most recent dissertations in the TRAIL Thesis Series. For a
complete overview of more than 150 titles see the TRAIL website: www.rsTRAIL.nl.
The TRAIL Thesis Series is a series of the Netherlands TRAIL Research School on transport,
infrastructure and logistics.
Araghi, Y., Consumer Heterogeneity, Transport and the Environment, T2017/5, May 2017,
TRAIL Thesis Series, the Netherlands
Kasraian Moghaddam, D., Transport Networks, Land Use and Travel Behaviour: A long term
investigation, T2017/4, May 2017, TRAIL Thesis Series, the Netherlands
Smits, E.-S., Strategic Network Modelling for Passenger Transport Pricing, T2017/3, May
2017, TRAIL Thesis Series, the Netherlands
Tasseron, G., Bottom-Up Information Provision in Urban Parking: An in-depth analysis of
impacts on parking dynamics, T2017/2, March 2017, TRAIL Thesis Series, the Netherlands
Halim, R.A., Strategic Modeling of Global Container Transport Networks: Exploring the
future of port-hinterland and maritime container transport networks, T2017/1, March 2017,
TRAIL Thesis Series, the Netherlands
Olde Keizer, M.C.A., Condition-Based Maintenance for Complex Systems: Coordinating
maintenance and logistics planning for the process industries, T2016/26, December 2016,
TRAIL Thesis Series, the Netherlands

104 Consumer heterogeneity, transport and the environment
Zheng, H., Coordination of Waterborn AGVs, T2016/25, December 2016, TRAIL Thesis
Series, the Netherlands
Yuan, K., Capacity Drop on Freeways: Traffic dynamics, theory and Modeling, T2016/24,
December 2016, TRAIL Thesis Series, the Netherlands
Li, S., Coordinated Planning of Inland Vessels for Large Seaports, T2016/23, December
2016, TRAIL Thesis Series, the Netherlands
Berg, M. van den, The Influence of Herding on Departure Choice in Case of Evacuation:
Design and analysis of a serious gaming experimental set-up, T2016/22, December 2016,
TRAIL Thesis Series, the Netherlands
Luo, R., Multi-Agent Control of urban Transportation Networks and of Hybrid Systems with
Limited Information Sharing, T2016/21, November 2016, TRAIL Thesis Series, the
Netherlands
Campanella, M., Microscopic Modelling of Walking Behavior, T2016/20, November 2016,
TRAIL Thesis Series, the Netherlands
Horst, M. van der, Coordination in Hinterland Chains: An institutional analysis of port-related
transport, T2016/19, November 2016, TRAIL Thesis Series, the Netherlands
Beukenkamp, W., Securing Safety: Resilience time as a hidden critical factor, T2016/18,
October 2016, TRAIL Thesis Series, the Netherlands
Mingardo, G., Articles on Parking Policy, T2016/17, October 2016, TRAIL Thesis Series, the
Netherlands
Duives, D.C., Analysis and Modelling of Pedestrian Movement Dynamics at Large-scale
Events, T2016/16, October 2016, TRAIL Thesis Series, the Netherlands
Wan Ahmad, W.N.K., Contextual Factors of Sustainable Supply Chain Management Practices
in the Oil and Gas Industry, T2016/15, September 2016, TRAIL Thesis Series, the
Netherlands
Liu, X., Prediction of Belt Conveyor Idler Performance, T2016/14, September 2016, TRAIL
Thesis Series, the Netherlands
Gaast, J.P. van der, Stochastic Models for Order Picking Systems, T2016/13, September
2016, TRAIL Thesis Series, the Netherlands
Wagenaar, J.C., Practice Oriented Algorithmic Disruption Management in Passenger
Railways, T2016/12, September 2016, TRAIL Thesis Series, the Netherlands
Psarra, I., A Bounded Rationality Model of Short and Long-Term Dynamics of Activity-
Travel Behavior, T2016/11, June 2016, TRAIL Thesis Series, the Netherlands
Ma, Y., The Use of Advanced Transportation Monitoring Data for Official Statistics,
T2016/10, June 2016, TRAIL Thesis Series, the Netherlands