Deletion of the Transcription Factor PGC-1α in Mice ...
23
) Deletion of the Transcription Factor PGC-1α in Mice Negatively Regulates Bone Mass Graziana Colaianni1 · Luciana Lippo1,8 · Lorenzo Sanesi1 · Giacomina Brunetti2 · Monica Celi3 · Nunzio Cirulli2 ·Giovanni Passeri4 · Janne Reseland5 · Ernestina Schipani6 · Maria Felicia Faienza7 · Umberto Tarantino3 ·Silvia Colucci2 · Maria Grano1 1 Department of Emergency and Organ Transplantation, University of Bari, Piazza Giulio, Cesare 11, 70124 Bari, Italy 2 Department of Basic Medical Science, Neuroscience and Sense Organs, University of Bari, Bari, Italy 3 Department of Orthopedics and Traumatology, Tor Vergata University of Rome, Rome, Italy 4 Department of Clinical and Experimental Medicine, University of Parma, Parma, Italy 5 Department of Biomaterials, Institute for Clinical Dentistry, University of Oslo, Oslo, Norway 6 Departments of Medicine and Orthopaedic Surgery, University of Michigan, Ann Arbor, MI, USA 7 Department of Biomedical Science and Human Oncology, Pediatric Unit, University of Bari, Bari, Italy 8 PhD School in Tissue and Organ Transplantation and Cellular Therapies, Department of Emergency and Organ Transplantation, School of Medicine-University of Bari, Bari, Italy Abstract Peroxisome proliferator-activated receptor-gamma coactivator (PGC1α) is a transcription coactivator that interacts with a broad range of transcription factors involved in several biological responses. Here, we show that PGC1α plays a role in skeletal homeostasis since aged PGC1α-deficient mice (PGC1α−/−) display impaired bone structure. Micro-CT of the tibial mid-shaft showed a marked decrease of cortical thickness in PGC1α−/− (− 11.9%, p < 0.05) mice compared to wild-type littermate. Trabecular bone was also impaired in knock out mice which displayed lower trabecular thickness (Tb.Th) (− 5.9% vs PGC1α+/+, p < 0.05), whereas trabecular number (Tb.N) was higher than wild-type mice (+ 72% vs PGC1α+/+, p < 0.05), thus resulting in increased (+ 31.7% vs PGC1α+/+, p < 0.05) degree of anisotropy (DA), despite unchanged bone volume fraction (BV/TV). Notably, these impairments of cortical and trabecular bone led to a dramatic ~ 48.4% decrease in bending strength (p < 0.01). These changes in PGC1α−/− mice were paralleled by a significant increase in osteoclast number at the cortical bone surface and in serum level of the bone resorption marker, namely, C-terminal cross-linked telopeptides of type I collagen (CTX-I). We also found that in cortical bone, there was lower expression of mRNA codifying for the key bonebuilding protein Osteocalcin (Ocn). Interestingly, Collagen I mRNA expression was reduced in mesenchymal stem cells from bone marrow of PGC1α−/−, thus indicating that differentiation of osteoblast lineage is downregulated. Overall, results presented herein suggest that PGC1α may play a key role in bone metabolism. Keywords Peroxisome proliferator-activated receptor-gamma coactivator · Bone · Osteocalcin · Osteoclast · Osteoblast ·Mitochondria
Transcript of Deletion of the Transcription Factor PGC-1α in Mice ...
)
Deletion of the Transcription Factor PGC-1α in Mice Negatively Regulates Bone Mass Graziana Colaianni1 · Luciana Lippo1,8 · Lorenzo Sanesi1 · Giacomina Brunetti2 · Monica Celi3 · Nunzio Cirulli2 ·Giovanni Passeri4 · Janne Reseland5 · Ernestina Schipani6 · Maria Felicia Faienza7 · Umberto Tarantino3 ·Silvia Colucci2 · Maria Grano1
1 Department of Emergency and Organ Transplantation, University of Bari, Piazza Giulio, Cesare 11, 70124 Bari, Italy 2 Department of Basic Medical Science, Neuroscience and Sense Organs, University of Bari, Bari, Italy 3 Department of Orthopedics and Traumatology, Tor Vergata University of Rome, Rome, Italy 4 Department of Clinical and Experimental Medicine, University of Parma, Parma, Italy 5 Department of Biomaterials, Institute for Clinical Dentistry, University of Oslo, Oslo, Norway 6 Departments of Medicine and Orthopaedic Surgery, University of Michigan, Ann Arbor, MI, USA 7 Department of Biomedical Science and Human Oncology, Pediatric Unit, University of Bari, Bari, Italy 8 PhD School in Tissue and Organ Transplantation and Cellular Therapies, Department of Emergency and Organ Transplantation, School of Medicine-University of Bari, Bari, Italy
Abstract Peroxisome proliferator-activated receptor-gamma coactivator (PGC1α) is a transcription
coactivator that interacts with a broad range of transcription factors involved in several
biological responses. Here, we show that PGC1α plays a role in skeletal homeostasis since
aged PGC1α-deficient mice (PGC1α−/−) display impaired bone structure. Micro-CT of the
tibial mid-shaft showed a marked decrease of cortical thickness in PGC1α−/− (− 11.9%, p <
0.05) mice compared to wild-type littermate.
Trabecular bone was also impaired in knock out mice which displayed lower trabecular
thickness (Tb.Th) (− 5.9% vs PGC1α+/+, p < 0.05), whereas trabecular number (Tb.N) was
higher than wild-type mice (+ 72% vs PGC1α+/+, p < 0.05), thus resulting in increased (+
31.7% vs PGC1α+/+, p < 0.05) degree of anisotropy (DA), despite unchanged bone volume
fraction (BV/TV). Notably, these impairments of cortical and trabecular bone led to a
dramatic ~ 48.4% decrease in bending strength (p < 0.01). These changes in PGC1α−/− mice
were paralleled by a significant increase in osteoclast number at the cortical bone surface and
in serum level of the bone resorption marker, namely, C-terminal cross-linked telopeptides of
type I collagen (CTX-I). We also found that in cortical bone, there was lower expression of
mRNA codifying for the key bonebuilding protein Osteocalcin (Ocn). Interestingly, Collagen
I mRNA expression was reduced in mesenchymal stem cells
from bone marrow of PGC1α−/−, thus indicating that differentiation of osteoblast lineage is
downregulated. Overall, results presented herein suggest that PGC1α may play a key role in
bone metabolism.
Keywords Peroxisome proliferator-activated receptor-gamma coactivator · Bone ·
Osteocalcin · Osteoclast · Osteoblast ·Mitochondria
Introduction Peroxisome proliferator-activated receptor-γ coactivator 1-α (PGC1α) has emerged as a vital
regulator of several cellular processes, as well as adaptive thermogenesis, glucose
metabolism, and skeletal muscle fiber-type specialization. Considered to be predominantly
involved in the regulation of mitochondrial content and function [1–5], the expression of
PGC1α is greatly tuned in response to nutritional, hormonal, and environmental stimuli across
a variety of tissues [6–8] to meet increased cellular energetic requirements.
PGC1α mRNA expression increases in brown fat following cold exposure, in skeletal muscle
by bouts of physical activity [3, 9, 10] and in the liver by short-term fasting [11]. Pups
lacking PGC1α were born at the expected Mendelian ratio, suggesting that PGC1α is
dispensable for embryonic development; however, approximately 50% of homozygotes
exhibit postnatal lethality [12]. Mice homozygous for this targeted mutation are fertile and do
not display any abnormalities in several tissues, such as heart, skeletal muscle, pancreas, and
liver. However, knockout mice display abundant accumulation of large lipid droplets in the
brown fat and are unable to survive after exposure to 4 °C for more than 6 h. Studies on mice
with whole-body deletion of PGC1α reveal that null mice are surprisingly lean and insulin
sensitive when fed on a high fat diet [12]. This observation suggests the existence of a
PGC1α-mediated feedback pathway from muscle to the pancreas, but the identity of this
pathway remains uncertain. Current evidences indicate that PGC1α is a parathyroid hormone
(PTH)-induced, cAMPdependent primary response gene that directly synergizes with the
NR4A/NGFI-B orphan nuclear receptor (Nurr1) to transactivate target genes in osteoblasts
[13]. Beyond a broadly documented role of PGC1α in high energy-demand tissues, the effect
of PGC1α absence on bone has not yet been described. We show here that PGC1α-deficient
mice display impaired bone structure, revealing that the absence of one of the master
regulators of mitochondrial biogenesis can influence the microstructural and mechanical
properties of bone. The defect appears evident in aged mice, whereas 3-months-old PGC1α−/−
mice display a bone phenotype comparable to wild type littermates, with only few exceptions
in trabecular bone. Elucidation of the role of PGC1α in bone remodeling could reveal novel
insights into skeletal homeostasis for future development of drug targets and thus the
prevention or treatment of skeletal involution.
Methods Experimental Design and Animal Model PGC1α knockout, heterozygous and wild-type mice of mixed C57BL6/J-BALB/cOlaHsd
background were generated as previously described [14]. 12-months-old male and female
mice (total n = 26) representative of the three genotypes (male mice = 5 wild type, 5
heterozygous, 5 knockout; female mice = 4 wild type, 4 heterozygous, 3 knockout) and 3-
months-old male and female mice (total n = 13) representative of the two genotypes (male
mice = 4 wild type, 3 knockout; female mice = 3 wild type, 3 knockout) were housed in
standard rodent cages, maintained under standard conditions on a 12/12-h light/dark cycle and
with access to water and regular chow diet ad libitum (Harlan Teklad 2019, SDS, England).
Mice were weighed after being euthanized and their tissues were surgically excised. Spines,
right femurs, and tibiae were harvested and stored in 70% ethanol to be employed for μCT
and histological analysis. Left femurs and tibia were subjected to trabecular bone removal by
passing a needle to open the medullary canal and allow the bone marrow flushing. Both bone
marrow and bone were then stored in liquid nitrogen for quantitative PCR analysis.
The femurs and the tibia were cut transversally, and the two halves were mixed and used for
quantitative PCR analysis.
Microcomputed Tomography Analysis of Femur MicroCT (μCT) scanning was performed to measure morphological indices of metaphyseal
regions of femurs.
Femurs were rotated around their long axes and images were acquired using Bruker Skyscan
1172 (Kontich, Belgium) with the following parameters: pixel size = 5 μm; peak tube
potential = 59 kV; X-ray intensity = 167 μA; 0.4° rotation step. Raw images were
reconstructed by the Sky-Scan reconstruction software (NRecon) to 3-dimensional cross-
sectional image data sets using a 3-dimensional cone beam algorithm. Structural indices were
calculated on reconstructed images using the Skyscan CT Analyzer (CTAn) software
(Bruker). A set of three hydroxyapatite (HA) phantoms were scanned and used for calibration
and to compute volumetric BMD. Cortical and trabecular bone were separated using a custom
processing algorithm in CTAn, based on the different thicknesses of the structures.
Cortical bone was assessed at the femoral midshaft. The scan volume of the femoral midshaft
is centered on the midpoint of the bone, determined as half the distance from the distal
condyle to the proximal point of the femoral head for all mice. Cortical bone was analyzed by
a region of 150 slices, starting 9 mm distal to the metaphysis. Cortical parameters included
cortical thickness (Ct.Th) and polar moment of inertia (pMOI). Trabecular bone was analyzed
in the proximal metaphysis region, starting proximal to the distal growth plate and continuing
distally for 200 slices. Trabecular parameters included bone mineral density (BMD), bone
volume fraction (BV/TV), number (Tb.N), thickness (Tb.Th), and degree of anisotropy (DA).
Microcomputed Tomography Analysis of Tibiae Tibiae were rotated around their long axes and images were acquired using Bruker Skyscan
1172 (Kontich, Belgium) with the following parameters: pixel size = 5 μm; peak tube
potential = 59 kV; X-ray intensity = 167 μA; 0.4° rotation step. A set of three hydroxyapatite
(HA) phantoms were scanned and used for calibration to compute volumetric BMD. For
cortical bone properties, tibiae were scanned at the mid-diaphysis starting 5.5 mm from
proximal tibial condyles and extending for 200 6-μm slices (1.2 mm). For trabecular bone,
tibiae were scanned starting 1.9 mm from the proximal tibial condyles, just distal to the
growth plate, in the direction of the metaphysis, and extending for 200 slices (1.2 mm).
Microcomputed Tomography Analysis of Spine The fifth lumbar (L5) vertebrae of the spine were rotated around their long axes and images
were acquired using Bruker Skyscan 1172 (Kontich, Belgium) with the following parameters:
pixel size = 5 μm; peak tube potential = 59 kV; X-ray intensity = 167 μA; 0.4° rotation step.
The trabecular region of the vertebral body (excluding posterior elements) was designated
using manually drawn contours inside the cortical shell surrounding the entire vertebral body
enclosed by the growth plates and extending for 450 6-μm slices (2.7 mm).
3‑Point Bending Test of Mouse Femurs and Tibiae The tests were run on a Zwick tensile test machine (Zwick Roell, Ulm, Germany) with a 200
N load cell and the following test parameters: distance of lower supports: 12 mm; pre-load:
0.1 N; speed until pre-load: 20 mm/min; test speed: 10 mm/min.
The bones were stored in 70% ethanol at 4 °C before testing and taken out to be rehydrated
and stored at room temperature in good time before the mechanical test (> 30 min).
Length and diameter at mid shaft in the direction of the break force were measured for all the
samples before testing.
The samples were placed in a similar manner on the supports, with the distal end to the right
and the proximal side to the left. The posterior surface was facing down. The bones were
freed from any soft tissue and for the tibia the fibula removed on those samples where it was
still attached.
Histological Analysis of Bone and Adipose Tissues For dynamic bone-formation indices, mice were injected with calcein (10 mg/kg body weight)
and xylenol orange (90 mg/kg body weight), 20 and 8 days before sample collection,
respectively. Freshly dissected tibiae were immediately fixed in ice-cold 4%
paraformaldehyde solution for 4 h. After decalcification, performed with 0.5 M
ethylenediaminetetraacetic acid (EDTA) at 4 °C, bones were immersed into 20% sucrose and
2% polyvinylpyrrolidone (PVP) solution for 24 h. Tibiae were then embedded and frozen in
optimal cutting temperature (OCT) compound (VWR Chemicals).
For histological analyses, sections were generated by using a SLEE MEV Semi-Automatic
Cryostat (SLEE medical GmbH). To quantify the mineral apposition rate (MAR), bone
formation rate (BFR), and mineralizing surface per bone surface (MS/BS), non-decalcified
tibiae were immersed into 20% sucrose and 2% PVP solution for 24 h, then embedded in
OCT and sections were generated by using a SLEE MEV Semi-Automatic Cryostat. Tartrate-
resistant acidic phosphatase (TRAP) and Alkaline Phosphatase (ALP) positive cells were
detected by using the Leukocyte Acid Phosphatase Kit and the Alkaline Phosphatase Kit
(Sigma Aldrich), respectively. After TRAP staining, sections were counterstained with methyl
green. For the analysis of bone marrow adipocytes, histological sections were washed with
60% isopropanol and let dry completely, then stained with freshly prepared oil red O working
solution for 10 min.
After removal of oil red O solution, sections were rinsed in distilled water and tap water, then
counterstained with hematoxylin for 10 s and mounted with a aqueous mounting medium.
Histological sections were viewed under a Nikon Eclipse 80i light microscope (Nikon) using
a ×40 objective lens. Images were taken at 150 dpi (3840 × 3072 pixels) and analyzed by
using Image-J software, by manually outlining bone surface. Three sections per sample and
five high power fields for each section were analyzed.
Inguinal white adipose tissues were fixed overnight, then dehydrated, cleared, and embedded
in paraffin. 5 μm thick histological sections were cut and stained with hematoxylin and eosin
(H&E). All observations were performed with a Nikon Eclipse 80i light microscope (Nikon).
The area of adipocytes was measured on pictures from H&E stained slides at ×40
magnification by using the NIS-Element BR 4.10.00 software (Nikon, Japan).
Enzyme‑Linked Immunosorbent Assay (ELISA) Mice were fastened for 12 h before the sacrifice. Sera were collected at the time of sacrifice
and assayed for circulating levels of procollagen type I-N-terminal propeptide (P1NP) and C-
terminal telopeptide of type I-collagen (CTX-I) by ELISA kits (Immunodiagnostic Systems,
Boldon, UK) following the manufacturer’s protocol. Standard curves were generated using
serial dilutions of the P1NP or CTX-I calibration
standards supplied in the ELISA kit.
Peroxidase Immunohistochemistry Immunohistochemistry was performed on 5 μm-thick OCT-embedded transverse sections of
tibiae. Sections were reacted with 1% H2O2 (in PBS; 30 min) to block endogenous
peroxidase, rinsed with PBS and incubated with 5 mg/mL Proteinase K solution at 37 °C for 5
min. Then, sections were incubated with the mouse anti-Ocn primary antibody (Santa Cruz
Biotechnology) overnight at 4 °C. After a thorough rinse in PBS, sections were incubated
with secondary antibody (MATCH 1 mouse probe, Biocare) at room temperature for 15 min.
Histochemical reaction was performed using HRP-polymer and DAB Chromogen (Biocare).
Sections were counterstained with hematoxylin and mounted.
Staining was never observed when the primary antibody was omitted. For morphometric
analysis, immunostained bone sections were observed with a Nikon Eclipse 80i light
microscope (Nikon) using a ×40 objective. The percentage of Ocn protein stain was
determined by the Nikon Lucia IMAGE (v.
4.61) image analysis software.
Real Time‑PCR Total RNA from mouse tissues was extracted using spin columns (RNeasy, Qiagen) according
to the manufacturer’s instructions. DNase I treatment was performed to remove genomic
DNA contamination (Qiagen) and RNA integrity was assessed on agarose gels. Reverse
transcription was performed using iScript Reverse Transcription Supermix (Bio-Rad). The
resulting cDNA (20 ng) was subjected to quantitative PCR (qPCR) using the SsoFast
EvaGreen Supermix (Bio-Rad) on an iCycler iQ5 Cromo4 (Bio-Rad) for 40 cycles
(denaturation 95 °C for 5 s; annealing/extension 60 °C 10 s) after an initial 30 s step for
enzyme activation at 95 °C. To confirm the specificity of amplification products, melting
curve was performed between 65 and 96 °C, with 0.5 °C incrementing every 10 s. Primers
were designed by using Primer Blast (https ://www.ncbi.nlm.nih.gov/tools /
prime r-blast /). Primer sequences are listed in Supplementary Table S2, where it is also
indicated the accession number (NM_) and the product length for each primer. All primers
span an exon–exon junction. Three housekeeping genes were chosen because they are
normally stably expressed in bone and adipose tissues. Each transcript was assayed in
triplicate and cDNA was normalized to murine Glyceraldehyde 3-phosphate dehydrogenase
(GAPDH), β2-microglobulin. and β-actin. Quantitative measures were obtained using the
ΔΔCT method.
Cell Cultures Whole bone marrow cells were plated at a density of 4 × 10⁵ cells/cm2 in 96 multiwell plates
and cultured in 200 μL per well of alphaMEM 10% FBS in the presence of 5 ng/mL
macrophage colony-stimulating factor (M-CSF) and 3 ng/mL RANKL. After 96 h of culture,
cells were fixed with 10% formalin and stained for leukocyte acid phosphatase with TRAP kit
(387A-1KT Sigma Aldrich). TRAPpositive multinucleated mature osteoclasts (> 3 nuclei <
10 and > 10 nuclei) were then counted.
Bone marrow stromal cells were separated from monocytes through an overnight adhesion,
then cultured in osteogenic medium with α-MEM/10% FBS, supplemented with 50 μg/mL
ascorbic acid and 10− 2 M β-glycerophosphate for 10 or 21 days. At the end of the culture
period, ALP positive cells were detected by using ALP Kit (Sigma Aldrich) at day 10 and
mineralized nodules were detected by using Von Kossa Staining at day 21. Bone marrow-
derived macrophages were obtained from the non-adherent fraction of bone marrow cells and
cultured with α-MEM/10% FBS, supplemented with 5 ng/mL M-CSF, until confluence. Then,
macrophages were detached by 0.25% Trypsin–EDTA solution, seeded at 100,000/cm2 and
cultured in α-MEM/10% FBS, supplemented with 5 ng/mL M-CSF and 3 ng/mL RANKL for
7 days. At the end of the culture period, TRAPpositive multinucleated mature osteoclasts (>
10 nuclei) were detected by using TRAP Kit (Sigma Aldrich).
Statistical Analysis One-way analysis of variance (ANOVA) was used for evaluating the existence of differences
among the groups. When significant difference was detected, Bonferroni’s post hoc analysis
was used to determine the significance between every two groups. Values of p < 0.05 were
considered statistically significant.
Results To determine whether PGC1α deficiency leads to skeletal abnormalities, we examined long
bones of PGC1α wild type (PGC1α+/+), heterozygous (PGC1α+/−) and knock out (PGC1α−/−)
mice. Bone defects were identical in male and female mice, therefore, data for both genders
have been pooled.
To assess changes in bone structure, we performed micro-CT analysis on cortical and
trabecular bone at midshaft and proximal tibia, respectively. Although no defects were
observed in young mice (S1 Table), except for a significant reduction of BMD and Conn.
Density in the trabecular bone of the tibia, PGC1α−/− aged mice showed a defective bone
phenotype, more prominent in the tibia. As showed by representative microCT-generated
section images (Fig. 1a), measurement of cortical thickness (Ct.Th.) was lower in PGC1α+/−
(− 8.4%, p < 0.05) and PGC1α−/− (− 11.9%, p < 0.05) mice compared to wild type littermate
(Fig. 1a).
In knockout mice, the length of the tibia was significantly lower, whereas the diameter was
higher than wild type mice. However, this impairment of cortical structure was not
accompanied by a change of polar moment of inertia (pMOI), an index of resistance to
torsional forces. Interestingly, trabecular bone, although unaffected in heterozygous mice, was
defective in knock out mice which displayed lower trabecular thickness (Tb.Th) (− 5.9% vs
PGC1α+/+, p < 0.05), whereas trabecular number (Tb.N) was higher than wild type mice (+
72% vs PGC1α+/+, p < 0.05), thus resulting in increased (+ 31.7% vs PGC1α+/+, p < 0.05)
degree of anisotropy (DA), despite unchanged bone volume fraction (BV/TV) (Fig. 1b).
Although there was no change of bone volume fraction, PGC1α−/− showed a significant
increase of trabecular BMD, a defect opposite to that observed in the trabecular bone of 3-
months-old knock out mice. Notably, these impairments of cortical and trabecular bone in
PGC1α knock out mice led to a dramatic ~ 48.4% decrease in bending strength (p < 0.01)
compared with wild type and heterozygous mice (Fig. 1c). Moreover, also the energy to
fracture, albeit not significantly, showed a tendency to decrease by 20% (Fig. 1d).
The bone defect was also evident in the femurs, although to a lesser extent compared to the
tibia. By microCT analysis of femurs, we found that Ct. Th. was lower in femurs from
PGC1α+/− (− 11.25%, p < 0.05) and PGC1α−/− (− 20.7%, p < 0.05) mice ompared to wild
type littermates (Fig. 2a).
Furthermore, femurs from PGC1α−/− mice showed decreased resistance to torsional forces,
quantified as pMOI (− 20.88% vs PGC1α+/+, p < 0.05). Although it was observed the same
trend seen in the tibia, trabecular bone in femurs from either knock out or heterozygous mice
was unaffected, showing no significant variations respect to wild type mice, and also the
bending strength and the force at break were unchanged (Fig. 2b, c). However, given that
femur cortical thickness is reduced by 20%, this is mostly reflected in a reduction of torsional
strength, as demonstrated by the significant reduction in pMOI, rather than bending strength.
In addition, by analyzing the trabecular bone of the spine, we found that knock out mice
displayed the same defect observed in the tibia, namely decreased Tb.Th. (− 8.5% vs
PGC1α+/+, p < 0.05) and increased Tb.N (+ 42% vs PGC1α+/+, p < 0.05), despite unchanged
BV/TV (Fig. 2d).
To determine whether the dramatic reduction in cortical thickness observed in PGC1α−/− mice
is associated with increased bone resorption or with a deficit in bone formation or both, we
stained decalcified sections of tibiae to identify osteoclasts by TRAP (Fig. 3a) or to identify
osteoblasts by ALP (Fig. 3b). As shown in Fig. 3a, osteoclast number (OCs Nr) per bone
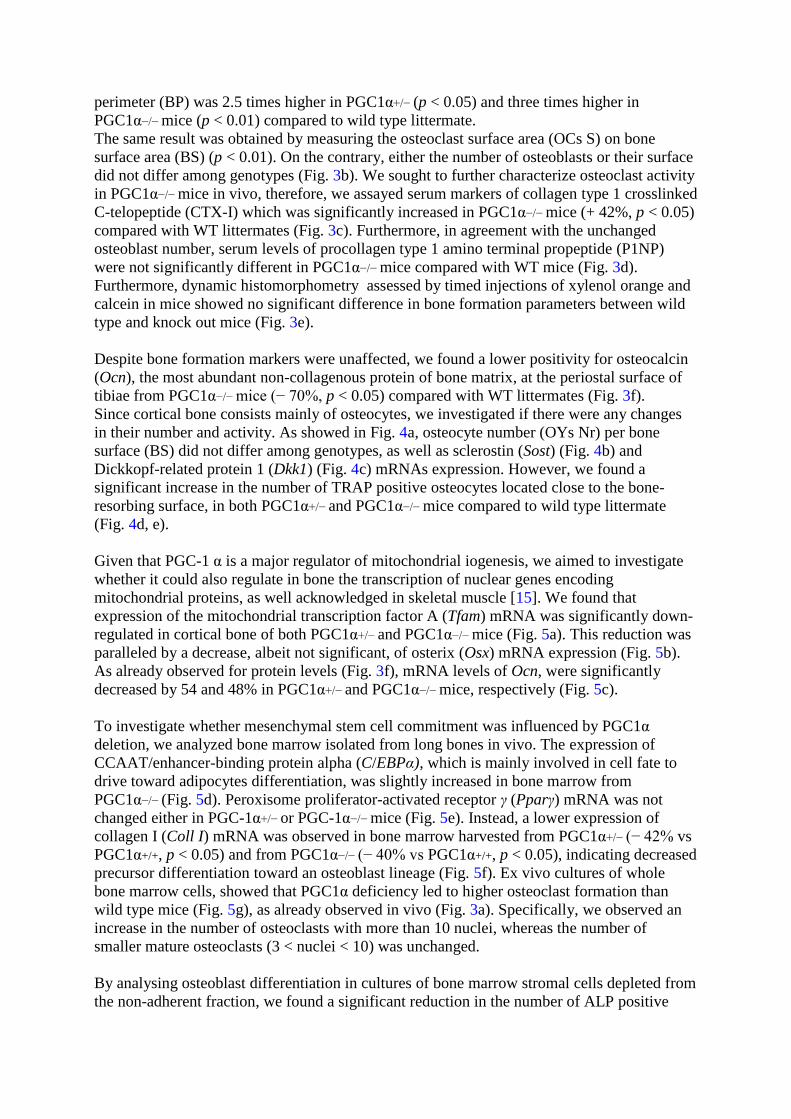
perimeter (BP) was 2.5 times higher in PGC1α+/− (p < 0.05) and three times higher in
PGC1α−/− mice (p < 0.01) compared to wild type littermate.
The same result was obtained by measuring the osteoclast surface area (OCs S) on bone
surface area (BS) (p < 0.01). On the contrary, either the number of osteoblasts or their surface
did not differ among genotypes (Fig. 3b). We sought to further characterize osteoclast activity
in PGC1α−/− mice in vivo, therefore, we assayed serum markers of collagen type 1 crosslinked
C-telopeptide (CTX-I) which was significantly increased in PGC1α−/− mice (+ 42%, p < 0.05)
compared with WT littermates (Fig. 3c). Furthermore, in agreement with the unchanged
osteoblast number, serum levels of procollagen type 1 amino terminal propeptide (P1NP)
were not significantly different in PGC1α−/− mice compared with WT mice (Fig. 3d).
Furthermore, dynamic histomorphometry assessed by timed injections of xylenol orange and
calcein in mice showed no significant difference in bone formation parameters between wild
type and knock out mice (Fig. 3e).
Despite bone formation markers were unaffected, we found a lower positivity for osteocalcin
(Ocn), the most abundant non-collagenous protein of bone matrix, at the periostal surface of
tibiae from PGC1α−/− mice (− 70%, p < 0.05) compared with WT littermates (Fig. 3f).
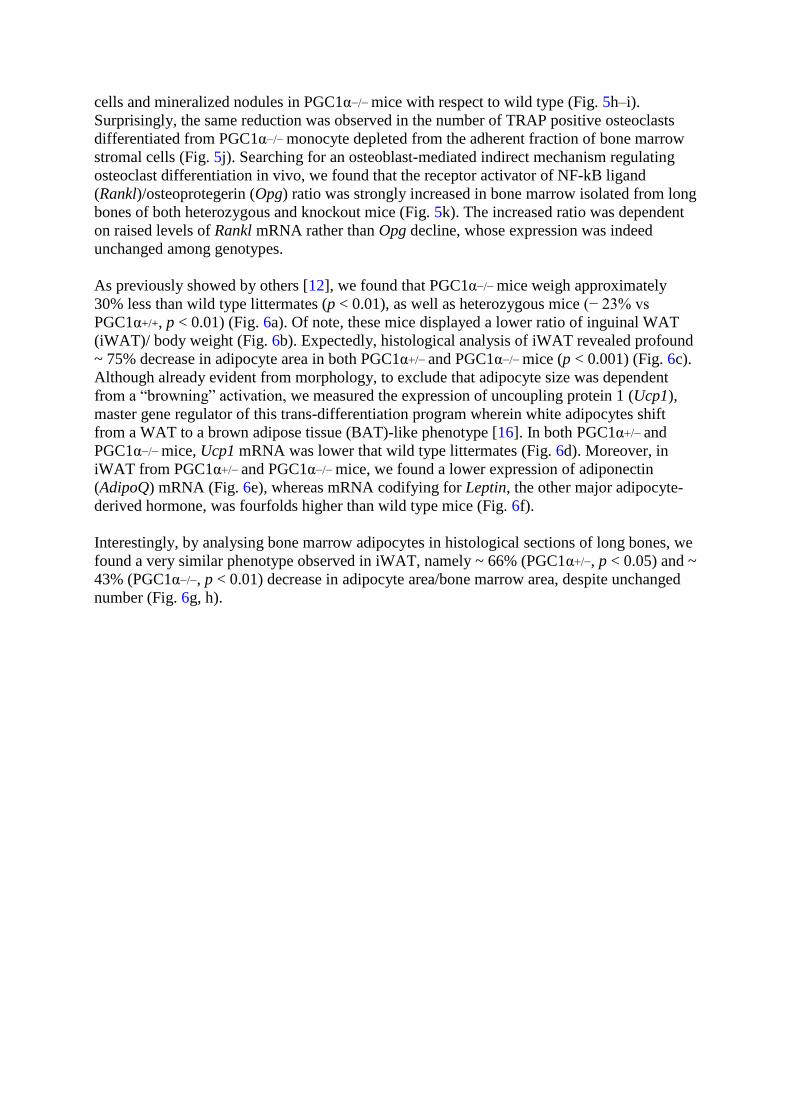
Since cortical bone consists mainly of osteocytes, we investigated if there were any changes
in their number and activity. As showed in Fig. 4a, osteocyte number (OYs Nr) per bone
surface (BS) did not differ among genotypes, as well as sclerostin (Sost) (Fig. 4b) and
Dickkopf-related protein 1 (Dkk1) (Fig. 4c) mRNAs expression. However, we found a
significant increase in the number of TRAP positive osteocytes located close to the bone-
resorbing surface, in both PGC1α+/− and PGC1α−/− mice compared to wild type littermate
(Fig. 4d, e).
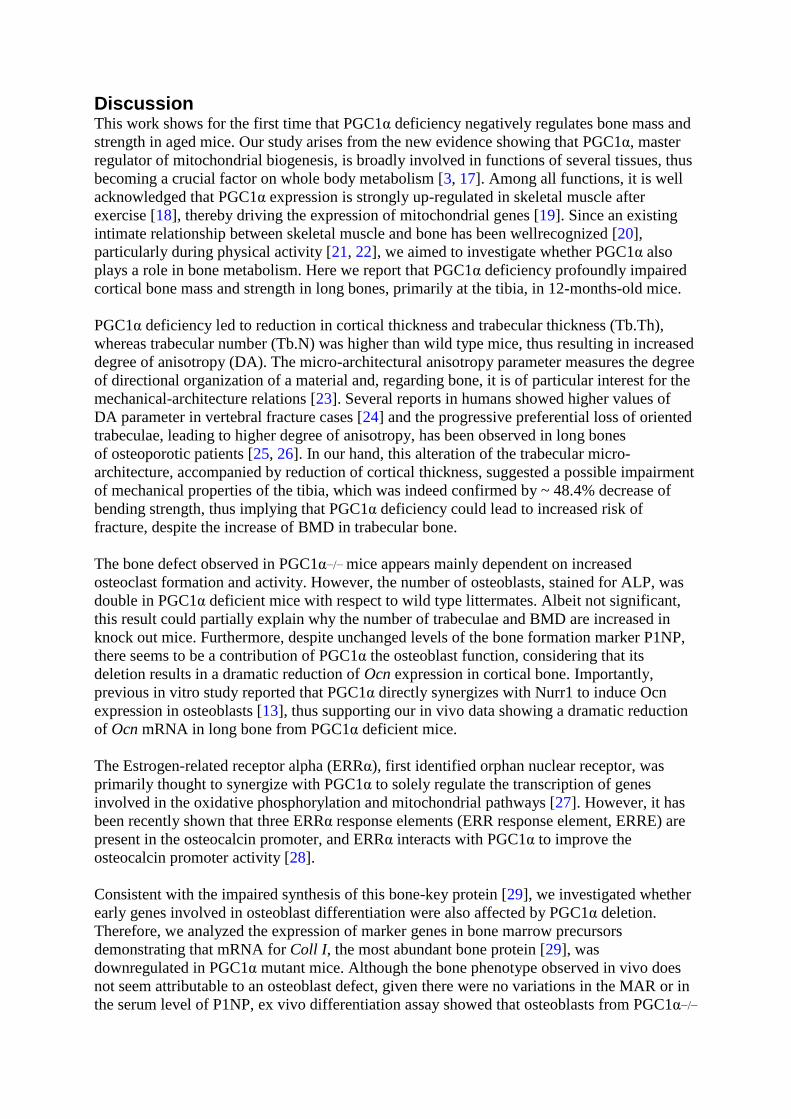
Given that PGC-1 α is a major regulator of mitochondrial iogenesis, we aimed to investigate
whether it could also regulate in bone the transcription of nuclear genes encoding
mitochondrial proteins, as well acknowledged in skeletal muscle [15]. We found that
expression of the mitochondrial transcription factor A (Tfam) mRNA was significantly down-
regulated in cortical bone of both PGC1α+/− and PGC1α−/− mice (Fig. 5a). This reduction was
paralleled by a decrease, albeit not significant, of osterix (Osx) mRNA expression (Fig. 5b).
As already observed for protein levels (Fig. 3f), mRNA levels of Ocn, were significantly
decreased by 54 and 48% in PGC1α+/− and PGC1α−/− mice, respectively (Fig. 5c).
To investigate whether mesenchymal stem cell commitment was influenced by PGC1α
deletion, we analyzed bone marrow isolated from long bones in vivo. The expression of
CCAAT/enhancer-binding protein alpha (C/EBPα), which is mainly involved in cell fate to
drive toward adipocytes differentiation, was slightly increased in bone marrow from
PGC1α−/− (Fig. 5d). Peroxisome proliferator-activated receptor γ (Pparγ) mRNA was not
changed either in PGC-1α+/− or PGC-1α−/− mice (Fig. 5e). Instead, a lower expression of
collagen I (Coll I) mRNA was observed in bone marrow harvested from PGC1α+/− (− 42% vs
PGC1α+/+, p < 0.05) and from PGC1α−/− (− 40% vs PGC1α+/+, p < 0.05), indicating decreased
precursor differentiation toward an osteoblast lineage (Fig. 5f). Ex vivo cultures of whole
bone marrow cells, showed that PGC1α deficiency led to higher osteoclast formation than
wild type mice (Fig. 5g), as already observed in vivo (Fig. 3a). Specifically, we observed an
increase in the number of osteoclasts with more than 10 nuclei, whereas the number of
smaller mature osteoclasts (3 < nuclei < 10) was unchanged.
By analysing osteoblast differentiation in cultures of bone marrow stromal cells depleted from
the non-adherent fraction, we found a significant reduction in the number of ALP positive
cells and mineralized nodules in PGC1α−/− mice with respect to wild type (Fig. 5h–i).
Surprisingly, the same reduction was observed in the number of TRAP positive osteoclasts
differentiated from PGC1α−/− monocyte depleted from the adherent fraction of bone marrow
stromal cells (Fig. 5j). Searching for an osteoblast-mediated indirect mechanism regulating
osteoclast differentiation in vivo, we found that the receptor activator of NF-kB ligand
(Rankl)/osteoprotegerin (Opg) ratio was strongly increased in bone marrow isolated from long
bones of both heterozygous and knockout mice (Fig. 5k). The increased ratio was dependent
on raised levels of Rankl mRNA rather than Opg decline, whose expression was indeed
unchanged among genotypes.
As previously showed by others [12], we found that PGC1α−/− mice weigh approximately
30% less than wild type littermates (p < 0.01), as well as heterozygous mice (− 23% vs
PGC1α+/+, p < 0.01) (Fig. 6a). Of note, these mice displayed a lower ratio of inguinal WAT
(iWAT)/ body weight (Fig. 6b). Expectedly, histological analysis of iWAT revealed profound
~ 75% decrease in adipocyte area in both PGC1α+/− and PGC1α−/− mice (p < 0.001) (Fig. 6c).
Although already evident from morphology, to exclude that adipocyte size was dependent
from a “browning” activation, we measured the expression of uncoupling protein 1 (Ucp1),
master gene regulator of this trans-differentiation program wherein white adipocytes shift
from a WAT to a brown adipose tissue (BAT)-like phenotype [16]. In both PGC1α+/− and
PGC1α−/− mice, Ucp1 mRNA was lower that wild type littermates (Fig. 6d). Moreover, in
iWAT from PGC1α+/− and PGC1α−/− mice, we found a lower expression of adiponectin
(AdipoQ) mRNA (Fig. 6e), whereas mRNA codifying for Leptin, the other major adipocyte-
derived hormone, was fourfolds higher than wild type mice (Fig. 6f).
Interestingly, by analysing bone marrow adipocytes in histological sections of long bones, we
found a very similar phenotype observed in iWAT, namely ~ 66% (PGC1α+/−, p < 0.05) and ~
43% (PGC1α−/−, p < 0.01) decrease in adipocyte area/bone marrow area, despite unchanged
number (Fig. 6g, h).
Discussion This work shows for the first time that PGC1α deficiency negatively regulates bone mass and
strength in aged mice. Our study arises from the new evidence showing that PGC1α, master
regulator of mitochondrial biogenesis, is broadly involved in functions of several tissues, thus
becoming a crucial factor on whole body metabolism [3, 17]. Among all functions, it is well
acknowledged that PGC1α expression is strongly up-regulated in skeletal muscle after
exercise [18], thereby driving the expression of mitochondrial genes [19]. Since an existing
intimate relationship between skeletal muscle and bone has been wellrecognized [20],
particularly during physical activity [21, 22], we aimed to investigate whether PGC1α also
plays a role in bone metabolism. Here we report that PGC1α deficiency profoundly impaired
cortical bone mass and strength in long bones, primarily at the tibia, in 12-months-old mice.
PGC1α deficiency led to reduction in cortical thickness and trabecular thickness (Tb.Th),
whereas trabecular number (Tb.N) was higher than wild type mice, thus resulting in increased
degree of anisotropy (DA). The micro-architectural anisotropy parameter measures the degree
of directional organization of a material and, regarding bone, it is of particular interest for the
mechanical-architecture relations [23]. Several reports in humans showed higher values of
DA parameter in vertebral fracture cases [24] and the progressive preferential loss of oriented
trabeculae, leading to higher degree of anisotropy, has been observed in long bones
of osteoporotic patients [25, 26]. In our hand, this alteration of the trabecular micro-
architecture, accompanied by reduction of cortical thickness, suggested a possible impairment
of mechanical properties of the tibia, which was indeed confirmed by ~ 48.4% decrease of
bending strength, thus implying that PGC1α deficiency could lead to increased risk of
fracture, despite the increase of BMD in trabecular bone.
The bone defect observed in PGC1α−/− mice appears mainly dependent on increased
osteoclast formation and activity. However, the number of osteoblasts, stained for ALP, was
double in PGC1α deficient mice with respect to wild type littermates. Albeit not significant,
this result could partially explain why the number of trabeculae and BMD are increased in
knock out mice. Furthermore, despite unchanged levels of the bone formation marker P1NP,
there seems to be a contribution of PGC1α the osteoblast function, considering that its
deletion results in a dramatic reduction of Ocn expression in cortical bone. Importantly,
previous in vitro study reported that PGC1α directly synergizes with Nurr1 to induce Ocn
expression in osteoblasts [13], thus supporting our in vivo data showing a dramatic reduction
of Ocn mRNA in long bone from PGC1α deficient mice.
The Estrogen-related receptor alpha (ERRα), first identified orphan nuclear receptor, was
primarily thought to synergize with PGC1α to solely regulate the transcription of genes
involved in the oxidative phosphorylation and mitochondrial pathways [27]. However, it has
been recently shown that three ERRα response elements (ERR response element, ERRE) are
present in the osteocalcin promoter, and ERRα interacts with PGC1α to improve the
osteocalcin promoter activity [28].
Consistent with the impaired synthesis of this bone-key protein [29], we investigated whether
early genes involved in osteoblast differentiation were also affected by PGC1α deletion.
Therefore, we analyzed the expression of marker genes in bone marrow precursors
demonstrating that mRNA for Coll I, the most abundant bone protein [29], was
downregulated in PGC1α mutant mice. Although the bone phenotype observed in vivo does
not seem attributable to an osteoblast defect, given there were no variations in the MAR or in
the serum level of P1NP, ex vivo differentiation assay showed that osteoblasts from PGC1α−/−
mice have a cell autonomous defect characterized by delays of differentiation and activity.
Surprisingly, also PGC1α−/− osteoclasts, differentiated from monocyte cultures depleted from
bone marrow stromal cells, showed the same delay in the differentiation process. This result
was in contrast with those observed in vivo, as the increased number and surface of
osteoclasts on cortical bone, as well as the elevated levels of the serum marker CTX-I. In
addition, when osteoclasts were differentiated starting from a culture of non-pure monocytes,
i.e. from the whole bone marrow, cells derived from mutated mice showed increased
formation of multinucleated osteoclast.
Although speculative, this suggested that it may exist an osteoblast-mediated indirect
mechanism which leads to high formation and activity of osteoclasts in vivo, resulting in
cortical thickness reduction in long bones of mutant mice. Searching for an osteoblast-
mediated indirect mechanism stimulating osteoclast differentiation in vivo, we found that
Rankl/Opg ratio was strongly increased, due to elevated levels of Rankl in the bone marrow of
knock out mice.
Moreover, it is well known that adipocytes and osteoblasts originate from a common
mesenchymal precursor within bone marrow and while mesenchymal stem cells activate their
differentiation process toward adipo- or osteogenic cell fate, specific transcription factors
become up-regulated [30]. Although PPARγ expression was unchanged, we found increased
levels of C/EBPα mRNA in PGC1α knock out mice. Further studies are required to
understand if PGC1α deletion leads to increased marrow adiposity which may contribute to
the detrimental effect on bone health [31–33].
In addition to the decrease of body weight, we also observed that both PGC1α+/− and
PGC1α−/− mice had lower ratio of iWAT/body weight, consistent with decreased adipocyte
size. Recent evidence has shown that certain WAT depots have a higher propensity to form
inducible brown fat [34], such as the inguinal WAT, whereas epididymal WAT is less prone
to browning [34]. PGC1α has been extensively studied in the classical brown fat
(intrascapular), where it coactivates PPARγ to up-regulate Ucp1 and consequently activates
the thermogenesis [3]. To our knowledge, here we show for the first time that the lack of
PGC1α negatively regulated Ucp1 expression also in inguinal WAT.
Several evidences claimed the existence of a reciprocal regulation between bone and energy
metabolism [35, 36]. The hormone osteocalcin, in addition to its primary role as bone-
building protein, also regulates energy metabolism, either by promoting insulin secretion by
pancreatic β-cells or signaling in adipocytes where it induces the synthesis of adiponectin, the
fat-specific hormone, and increases insulin sensitivity [37]. On the other hand, leptin, another
adipocyte-derived hormone, inhibits bone mass accrual via sympathetic nervous system [38]
and this action is partially counteracted by adiponectin [39]. Our data showed that these two
hormones are influenced by PGC1α deficiency in an opposite manner. Further studies could
demonstrate if the lower expression of AdipoQ and, at the same time, the higher expression of
Leptin, may contribute to the impairment of bone mass observed in PGC1α knock out mice.
One limitation of our study is that, although the whole-body deletion of PGC1α gives rise to
viable off-spring [12], the characterization of their bone phenotype could have been masked
by other systemic effects [40]. Therefore, the generation of PGC1α conditional knockout
models, with specific deletion in osteoblasts or osteoclasts, could provide in future a better
understanding into the contribution of this transcription factor to bone metabolism. In addition
to unexplored secondary systemic effects, the bone mass of PGC1α knock out mice may have
been affected by the 30% reduction of body weight respect to wild type littermates, thus
resulting in a lower “load” on the skeleton. However, despite the high body mass has
traditionally been considered positive to bone for the beneficial effect of mechanical loading
on bone formation, several studies have achieved a clear consensus, suggesting instead that
high fat mass could rather be detrimental to bone [41]. In parallel, several reports have
ascertained that low body weight, as observed in animal and human models of caloric
restriction and anorexia nervosa, often correlates with low bone mass and reduced BMD [32,
33].
Furthermore, we found that differentiation of osteoblasts and osteoclasts is affected in mutant
mice, providing evidence for a cell-autonomous role of PGC1α in bone cells. Although future
studies will be needed to better define if there are coupling factors, other than Rankl, which
exacerbate osteoclast activity in vivo, overall results presented herein highlight for the first
time that PGC1α has a critical role in the regulation of bone mass.
Acknowledgements We thank Dr. Antonio Moschetta (Department of Interdisciplinary
Medicine, “Aldo Moro” University of Bari, 70124 Bari, Italy) for the generous gift of PGC1α
heterozygous mice to generate the colony. This work was supported in part by MIUR Grant
ex60% (to M.G.), by SIOMMMS Grant (to G.C.) and by ERISTO (ESA) Grant (to M.G.).
Author Contribution GC, LL, UT, SC, MG designed research; LL, LS, MC, NC performed
research; GC, LL, GB, GP, JR, ES, MFF, UT, SC, MG analyzed, interpreted and discussed the
data; and GC, LL, MG wrote the paper.
Compliance with Ethical Standards Conflict of interest Graziana Colaianni, Luciana Lippo, Lorenzo Sanesi, Giacomina Brunetti,
Monica Celi, Nunzio Cirulli, Giovanni Passeri, Janne Reseland, Ernestina Schipani, Maria Felicia
Faienza, Umberto Tarantino, Silvia Colucci, and Maria Grano declare that there is no conflict of
interest regarding the publication of this paper.
Human and Animal Rights and Informed Consent This study is in accordance with the
European Law Implementation of Directive 2010/63/EU and all experimental protocols were
reviewed and approved by the Veterinary Department of the Italian Ministry of Health (Project
522-2016PR). Experimental procedures have been carried out following the standard biosecurity
and the institutional safety procedures. For this type of study formal consent is not required.
References 1. Lin J, Wu H, Tarr PT, Zhang CY, Wu Z, Boss O, Michael LF, Puigserver P, Isotani E, Olson
EN, Lowell BB, Bassel-Duby R, Spiegelman BM (2002) Transcriptional co-activator PGC-1α
drives the formation of slow-twitch muscle fibres. Nature 418(6899):797–801
2. Michael LF, Wu Z, Cheatham RB, Puigserver P, Adelmant G, Lehman JJ, Kelly DP,
Spiegelman BM (2001) Restoration of insulin-sensitive glucose transporter (GLUT4) gene
expression in muscle cells by the transcriptional coactivator PGC-1. Proc Natl Acad Sci USA
98(7):3820–3825
3. Puigserver P, Wu Z, Park CW, Graves R, Wright M, Spiegelman BM (1998) A cold-inducible
coactivator of nuclear receptors linked to adaptive thermogenesis. Cell 92(6):829–839
4. Wu Z, Puigserver P, Andersson U, Zhang C, Adelmant G, Mootha V, Troy A, Cinti S, Lowell
B, Scarpulla RC, Spiegelman BM (1999) Mechanisms controlling mitochondrial biogenesis and
respiration through the thermogenic coactivator PGC-1. Cell 98(1):115–124
5. Lin J, Tarr PT, Yang R, Rhee J, Puigserver P, Newgard CB, Spiegelman BM (2003) PGC-1β in
the regulation of hepatic glucose and energy metabolism. J Biol Chem 278(33):30843–30848
6. Irrcher I, Adhihetty PJ, Sheehan T, Joseph AM, Hood DA (2003) PPARγ coactivator-1α
expression during thyroid hormone- and contractile activity-induced mitochondrial adaptations.
Am J Physiol 284(6):C1669–C1677
7. Ljubicic V, Joseph AM, Saleem A, Uguccioni G, Collu-Marchese M, Lai RY, Nguyen LM,
Hood DA (2010) Transcriptional and post-transcriptional regulation of mitochondrial biogenesis
in skeletal muscle: effects of exercise and aging. Biochem Biophys Acta 1800(3):223–234
8. Pilegaard H, Saltin B, Neufer PD (2003) Exercise induces transient transcriptional activation of
the PGC-1α gene in human skeletal muscle. J Physiol 546(3):851–858
9. Baar K, Wende AR, Jones TE, Marison M, Nolte LA, Chen M, Kelly DP, Holloszy JO (2002)
Adaptations of skeletal muscle to exercise: rapid increase in the transcriptional coactivator PGC-
1. Fed Am Soc Exp Biol 16(14):1879–1886
10. Goto M, Terada S, Kato M, Katoh M, Yokozeki T, Tabata I, Shimokawa T (2000) cDNA
Cloning and mRNA analysis of PGC-1 in epitrochlearis muscle in swimming-exercised rats.
Biochem Biophys Res Commun 274(2):350–354
11. Yoon JC, Puigserver P, Chen G, Donovan J, Wu Z, Rhee J, Adelmant G, Stafford J, Kahn CR,
Granner DK, Newgard CB, Spiegelman BM (2001) Control of hepatic gluconeogenesis through
the transcriptional coactivator PGC-1. Nature 413(6852):131–138
12. Lin J, Wu PH, Tarr PT, Lindenberg KS, St-Pierre J, Zhang CY, Mootha VK, Jäger S, Vianna
CR, Reznick RM, Cui L, Manieri M, Donovan MX, Wu Z, Cooper MP, Fan MC, Rohas LM,
Zavacki AM, Cinti S, Shulman GI, Lowell BB, Krainc D, Spiegelman BM (2004) Defects in
adaptive energy metabolism with CNS-linked hyperactivity in PGC-1alpha null mice. Cell
119(1):121–135
13. Nervina JM, Magyar CE, Pirih FQ, Tetradis S (2006) PGC-1alpha is induced by parathyroid
hormone and coactivates Nurr1-mediated promoter activity in osteoblasts. Bone 39(5):1018–1025
14. D’Errico I, Salvatore L, Murzilli S, Lo Sasso G, Latorre D, Martelli N, Egorova AV,
Polishuck R, Madeyski-Bengtson K, Lelliott C, Vidal-Puig AJ, Seibel P, Villani G, Moschetta A
(2011) Peroxisome proliferator-activated receptor-gamma coactivator 1-alpha (PGC1alpha) is a
metabolic regulator of intestinal epithelial cell fate. Proc Natl Acad Sci USA 108(16):6603–6608
15. Uguccioni G, Hood DA (2011) The importance of PGC-1α in contractile activity-induced
mitochondrial adaptations. Am J Physiol Endocrinol Metab 300(2):E361–E371
16. Boström P, Wu J, Jedrychowski MP, Korde A, Ye L, Lo JC, Rasbach KA, Boström EA, Choi
JH, Long JZ, Kajimura S, Zingaretti MC, Vind BF, Tu H, Cinti S, Højlund K, Gygi SP,
Spiegelman BM (2012) A PGC1-α-dependent myokine that drives brown-fat-like development of
white fat and thermogenesis. Nature 481(7382):463–468
17. Puigserver P, Spiegelman BM (2003) Peroxisome proliferatoractivated receptor-gamma
coactivator 1 alpha (PGC-1 alpha): transcriptional coactivator and metabolic regulator. Endocr
Soc 24:78–90
18. Handschin C, Rhee J, Lin J, Tarr PT, Spiegelman BM (2003) An autoregulatory loop controls
peroxisome proliferator-activated receptor gamma coactivator 1alpha expression in muscle. Proc
Natl Acad Sci USA 100:7111–7116
19. Handschin C, Spiegelman BM (2011) PGC-1 coactivators and the regulation of skeletal
muscle fiber-type determination. [Comment Lett] Cell Metab 13(4):351 (author reply 352).
20. Brotto M, Johnson ML (2014) Endocrine crosstalk between muscle and bone. Curr Osteoporo
Rep 12(2):135–141
21. Colaianni G, Cuscito C, Mongelli T, Pignataro P, Buccoliero C, Liu P, Lu P, Sartini L, Di
Comite M, Mori G, Di Benedetto A, Brunetti G, Yuen T, Sun L, Reseland JE, Colucci S, New
MI, Zaidi M, Cinti S, Grano M (2015) The myokine irisin increases cortical bone mass. Proc Natl
Acad Sci USA 112(39):12157–12162
22. Mera P, Laue K, Ferron M, Confavreux C, Wei J, Galán-Díez M, Lacampagne A, Mitchell SJ,
Mattison JA, Chen Y, Bacchetta J, Szulc P, Kitsis RN, de Cabo R, Friedman RA, Torsitano C,
McGraw TE, Puchowicz M, Kurland I, Karsenty G (2016) Osteocalcin signaling in myofibers is
necessary and sufficient for optimum adaptation to exercise. Cell Metab 23(6):1078–1092
23. Kersh ME, Zysset PK, Pahr DH, Wolfram U, Larsson D, Pandy MG (2013) Measurement of
structural anisotropy in femoral trabecular bone using clinical-resolution CT images. J Biomech
46(15):2659–2666
24. Chappard C, Brunet-Imbault B, Lemineur G, Giraudeau B, Basillais A, Harba R, Benhamou
CL (2005) Anisotropy changes in post-menopausal osteoporosis: characterization by a new index
applied to trabecular bone radiographic images. Osteoporos Int 16(10):1193–1202
25. Singh M, Nagrath AR, Maini PS (1970) Changes in trabecular pattern of the upper end of the
femur as an index of osteoporosis. J Bone Joint Surg Am 52(3):457–467
26. Newitt DC, van Rietbergen B, Majumdar S (2002) Processing and analysis of in vivo high-
resolution MR images of trabecular bone for longitudinal studies: reproducibility of structural
measures and micro-finite element analysis derived mechanical properties. steoporos Int
13(4):278–287
27. Zhang Y, Ma K, Sadana P, Chowdhury F, Gaillard S, Wang F, McDonnell DP, Unterman TG,
Elam MB, Park EA (2006) Estrogen- related receptors stimulate pyruvate dehydrogenase kinase
isoform 4 gene expression. J Biol Chem 281:39897–39906
28. Wang H, Wang J (2013) Estrogen-related receptor alpha interacts cooperatively with
peroxisome proliferator-activated receptorgamma coactivator-1alpha to regulate osteocalcin gene
expression. Cell Biol Int 37(11):1259–1265
29. Florencio-Silva R, Rodrigues da Silva Sasso G, Sasso-Cerri E, Simões MJ, Cerri PS (2015)
Biology of bone tissue: structure, function, and factors that influence bone cells. BioMed Res Int.
https ://doi.org/10.1155/2015/42174 6
30. Colaianni G, Brunetti G, Faienza MF, Colucci S, Grano M (2014) Osteoporosis and obesity:
role of Wnt pathway in human and murine models. World J Orthop 5(3):242–246
31. Fazeli PK, Horowitz MC, MacDougald OA, Scheller EL, Rodeheffer MS, Rosen CJ,
Klibanski A (2013) Marrow fat and bonenew perspectives. J Clin Endocrinol Metab 98(3):935–
945
32. Devlin MJ, Cloutier AM, Thomas NA, Panus DA, Lotinun S, Pinz I, Baron R, Rosen CJ,
Bouxsein ML (2010) Caloric restriction leads to high marrow adiposity and low bone mass in
growing mice. J Bone Miner Res 25:2078–2088
33. Bredella MA, Fazeli PK, Miller KK, Fazeli PK, Miller KK, Misra M, Torriani M, Thomas BJ,
Ghomi RH, Rosen CJ, Klibanski A (2009) Increased bone marrow fat in anorexia nervosa. J Clin
Endocrinol Metab 94(6):2129–2136
34. Waldén TB, Hansen IR, Timmons JA, Cannon B, Nedergaard J (2012) Recruited vs.
nonrecruited molecular signatures of brown, “brite,” and white adipose tissues. Am J Physiol
Endocrinol Metab 302(1):E19–E31
35. Karsenty G, Oury F (2012) Biology without walls: the novel endocrinology of bone. Annu
Rev Physiol 74:87–105
36. Isaia GC, D’Amelio P, Di Bella S, Tamone C (2005) Is leptin the link between fat and bone
mass? J Endocrinol Investig 28(10 suppl):61–65
37. Lee NK, Sowa H, Hinoi E, Ferron M, Ahn JD, Confavreux C, Dacquin R, Mee PJ, McKee
MD, Jung DY, Zhang Z, Kim JK, Mauvais-Jarvis F, Ducy P, Karsenty G (2007) Endocrine
regulation of energy metabolism by the skeleton. Cell 130(3):456–469
38. Takeda S, Elefteriou F, Levasseur R, Liu X, Zhao L, Parker KL, Armstrong D, Ducy P,
Karsenty G (2002) Leptin regulates bone formation via the sympathetic nervous system. Cell
111(3):305–317
39. Kajimura D, Lee HW, Riley KJ, Arteaga-Solis E, Ferron M, Zhou B, Clarke CJ, Hannun YA,
DePinho RA, Guo XE, Mann JJ, Karsenty G (2013) Adiponectin regulates bone mass via opposite
central and peripheral mechanisms through FoxO1. Cell Metab 17(6):901–915
40. Rowe GC, Arany Z (2014) Genetic models of PGC-1 and glucose metabolism and
homeostasis. Rev Endocr Metab Disord 15(1):21–29
41. Rosen CJ, Bouxsein ML (2006) Mechanisms of disease: is osteoporosis the obesity of bone?
Nat Clin Pract Rheumatol 2:35–43
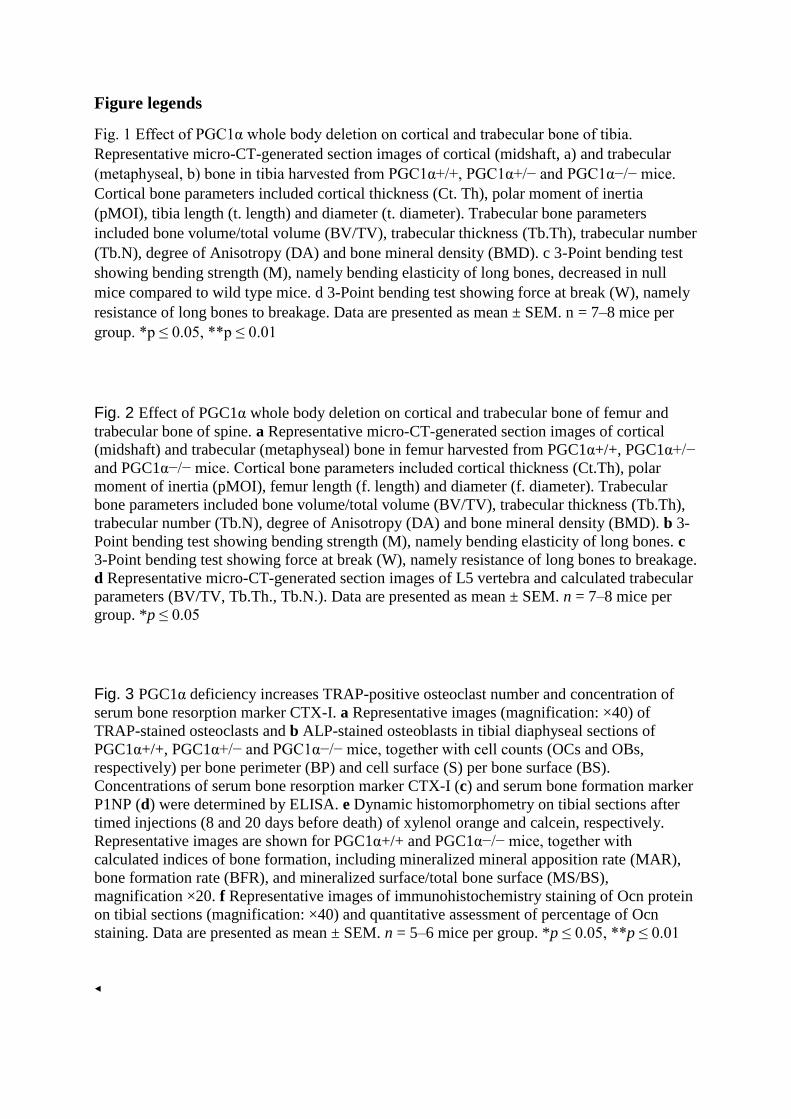
Figure legends
Fig. 1 Effect of PGC1α whole body deletion on cortical and trabecular bone of tibia.
Representative micro-CT-generated section images of cortical (midshaft, a) and trabecular
(metaphyseal, b) bone in tibia harvested from PGC1α+/+, PGC1α+/− and PGC1α−/− mice.
Cortical bone parameters included cortical thickness (Ct. Th), polar moment of inertia
(pMOI), tibia length (t. length) and diameter (t. diameter). Trabecular bone parameters
included bone volume/total volume (BV/TV), trabecular thickness (Tb.Th), trabecular number
(Tb.N), degree of Anisotropy (DA) and bone mineral density (BMD). c 3-Point bending test
showing bending strength (M), namely bending elasticity of long bones, decreased in null
mice compared to wild type mice. d 3-Point bending test showing force at break (W), namely
resistance of long bones to breakage. Data are presented as mean ± SEM. n = 7–8 mice per
group. *p ≤ 0.05, **p ≤ 0.01
Fig. 2 Effect of PGC1α whole body deletion on cortical and trabecular bone of femur and
trabecular bone of spine. a Representative micro-CT-generated section images of cortical
(midshaft) and trabecular (metaphyseal) bone in femur harvested from PGC1α+/+, PGC1α+/−
and PGC1α−/− mice. Cortical bone parameters included cortical thickness (Ct.Th), polar
moment of inertia (pMOI), femur length (f. length) and diameter (f. diameter). Trabecular
bone parameters included bone volume/total volume (BV/TV), trabecular thickness (Tb.Th),
trabecular number (Tb.N), degree of Anisotropy (DA) and bone mineral density (BMD). b 3-
Point bending test showing bending strength (M), namely bending elasticity of long bones. c
3-Point bending test showing force at break (W), namely resistance of long bones to breakage.
d Representative micro-CT-generated section images of L5 vertebra and calculated trabecular
parameters (BV/TV, Tb.Th., Tb.N.). Data are presented as mean ± SEM. n = 7–8 mice per
group. *p ≤ 0.05
Fig. 3 PGC1α deficiency increases TRAP-positive osteoclast number and concentration of
serum bone resorption marker CTX-I. a Representative images (magnification: ×40) of
TRAP-stained osteoclasts and b ALP-stained osteoblasts in tibial diaphyseal sections of
PGC1α+/+, PGC1α+/− and PGC1α−/− mice, together with cell counts (OCs and OBs,
respectively) per bone perimeter (BP) and cell surface (S) per bone surface (BS).
Concentrations of serum bone resorption marker CTX-I (c) and serum bone formation marker
P1NP (d) were determined by ELISA. e Dynamic histomorphometry on tibial sections after
timed injections (8 and 20 days before death) of xylenol orange and calcein, respectively.
Representative images are shown for PGC1α+/+ and PGC1α−/− mice, together with
calculated indices of bone formation, including mineralized mineral apposition rate (MAR),
bone formation rate (BFR), and mineralized surface/total bone surface (MS/BS),
magnification ×20. f Representative images of immunohistochemistry staining of Ocn protein
on tibial sections (magnification: ×40) and quantitative assessment of percentage of Ocn
staining. Data are presented as mean ± SEM. n = 5–6 mice per group. *p ≤ 0.05, **p ≤ 0.01
◂
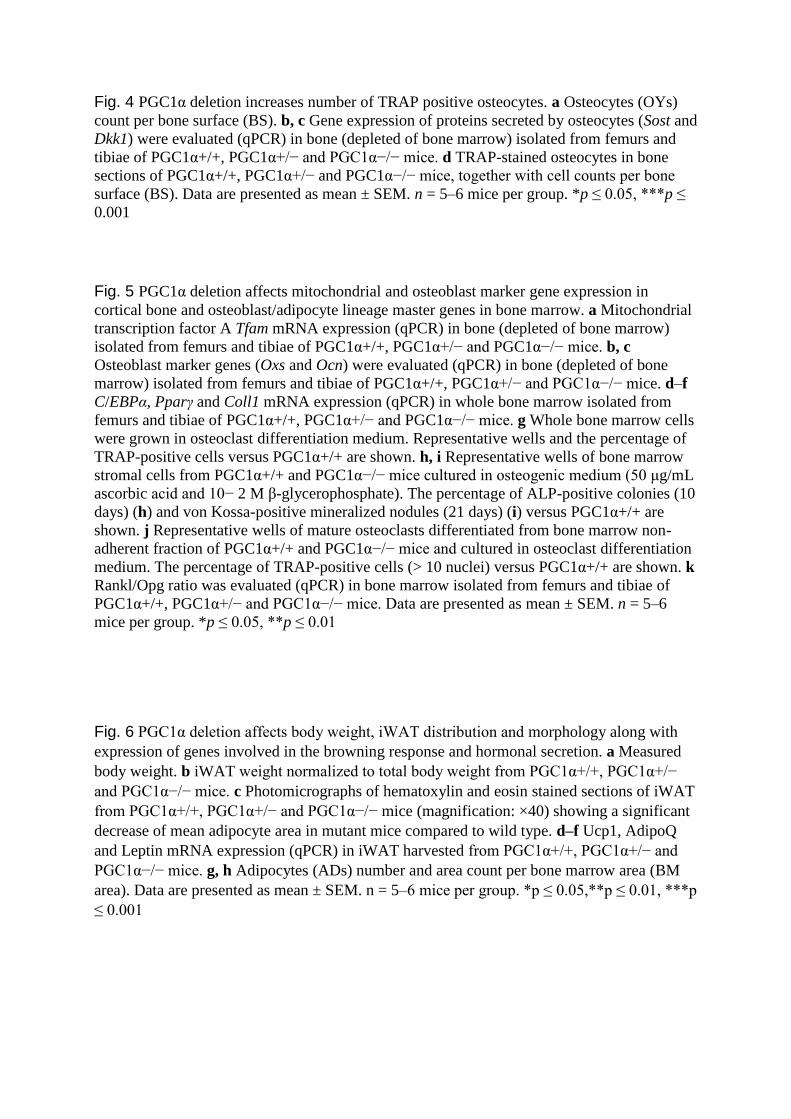
Fig. 4 PGC1α deletion increases number of TRAP positive osteocytes. a Osteocytes (OYs)
count per bone surface (BS). b, c Gene expression of proteins secreted by osteocytes (Sost and
Dkk1) were evaluated (qPCR) in bone (depleted of bone marrow) isolated from femurs and
tibiae of PGC1α+/+, PGC1α+/− and PGC1α−/− mice. d TRAP-stained osteocytes in bone
sections of PGC1α+/+, PGC1α+/− and PGC1α−/− mice, together with cell counts per bone
surface (BS). Data are presented as mean ± SEM. n = 5–6 mice per group. *p ≤ 0.05, ***p ≤
0.001
Fig. 5 PGC1α deletion affects mitochondrial and osteoblast marker gene expression in
cortical bone and osteoblast/adipocyte lineage master genes in bone marrow. a Mitochondrial
transcription factor A Tfam mRNA expression (qPCR) in bone (depleted of bone marrow)
isolated from femurs and tibiae of PGC1α+/+, PGC1α+/− and PGC1α−/− mice. b, c
Osteoblast marker genes (Oxs and Ocn) were evaluated (qPCR) in bone (depleted of bone
marrow) isolated from femurs and tibiae of PGC1α+/+, PGC1α+/− and PGC1α−/− mice. d–f
C/EBPα, Pparγ and Coll1 mRNA expression (qPCR) in whole bone marrow isolated from
femurs and tibiae of PGC1α+/+, PGC1α+/− and PGC1α−/− mice. g Whole bone marrow cells
were grown in osteoclast differentiation medium. Representative wells and the percentage of
TRAP-positive cells versus PGC1α+/+ are shown. h, i Representative wells of bone marrow
stromal cells from PGC1α+/+ and PGC1α−/− mice cultured in osteogenic medium (50 μg/mL
ascorbic acid and 10− 2 M β-glycerophosphate). The percentage of ALP-positive colonies (10
days) (h) and von Kossa-positive mineralized nodules (21 days) (i) versus PGC1α+/+ are
shown. j Representative wells of mature osteoclasts differentiated from bone marrow non-
adherent fraction of PGC1α+/+ and PGC1α−/− mice and cultured in osteoclast differentiation
medium. The percentage of TRAP-positive cells (> 10 nuclei) versus PGC1α+/+ are shown. k
Rankl/Opg ratio was evaluated (qPCR) in bone marrow isolated from femurs and tibiae of
PGC1α+/+, PGC1α+/− and PGC1α−/− mice. Data are presented as mean ± SEM. n = 5–6
mice per group. *p ≤ 0.05, **p ≤ 0.01
Fig. 6 PGC1α deletion affects body weight, iWAT distribution and morphology along with
expression of genes involved in the browning response and hormonal secretion. a Measured
body weight. b iWAT weight normalized to total body weight from PGC1α+/+, PGC1α+/−
and PGC1α−/− mice. c Photomicrographs of hematoxylin and eosin stained sections of iWAT
from PGC1α+/+, PGC1α+/− and PGC1α−/− mice (magnification: ×40) showing a significant
decrease of mean adipocyte area in mutant mice compared to wild type. d–f Ucp1, AdipoQ
and Leptin mRNA expression (qPCR) in iWAT harvested from PGC1α+/+, PGC1α+/− and
PGC1α−/− mice. g, h Adipocytes (ADs) number and area count per bone marrow area (BM
area). Data are presented as mean ± SEM. n = 5–6 mice per group. *p ≤ 0.05,**p ≤ 0.01, ***p
≤ 0.001
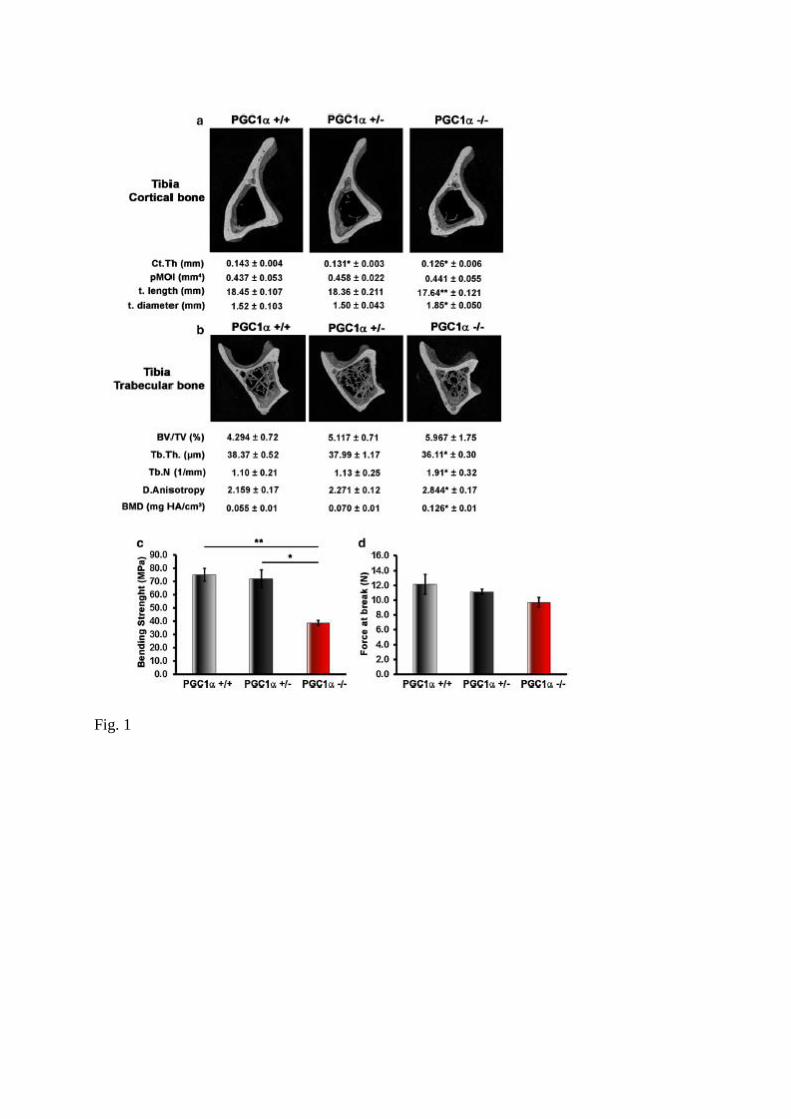
Fig. 1
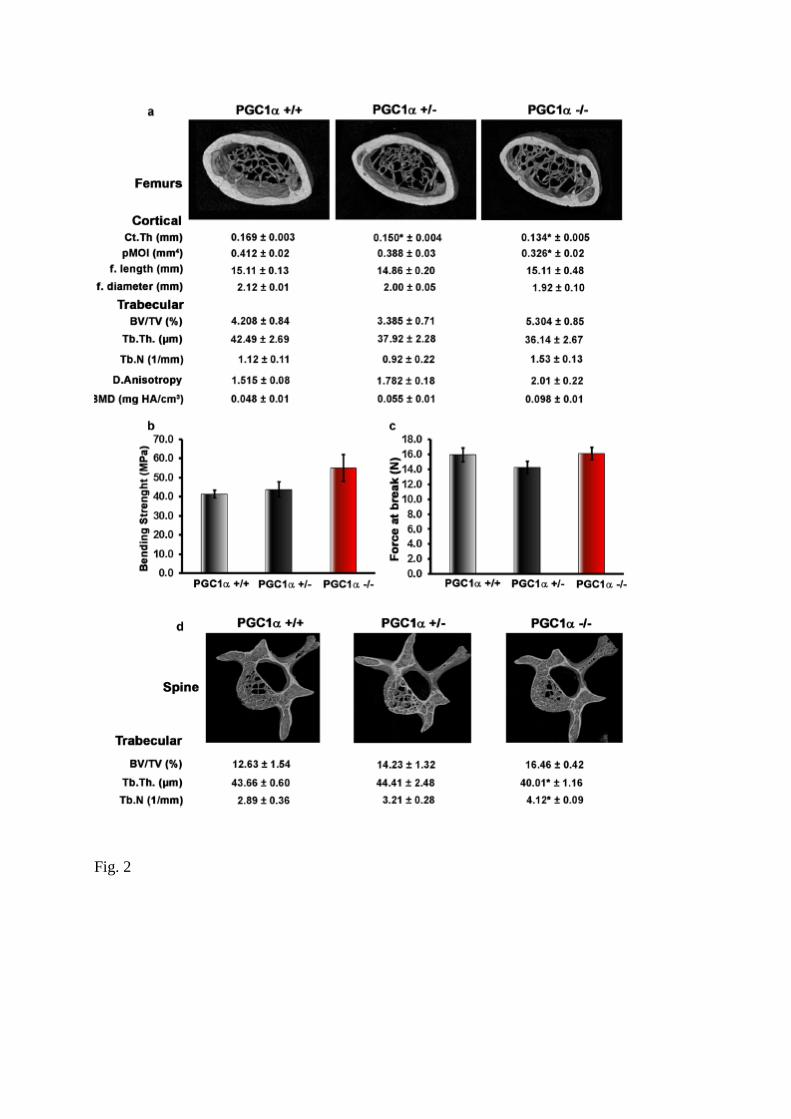
Fig. 2
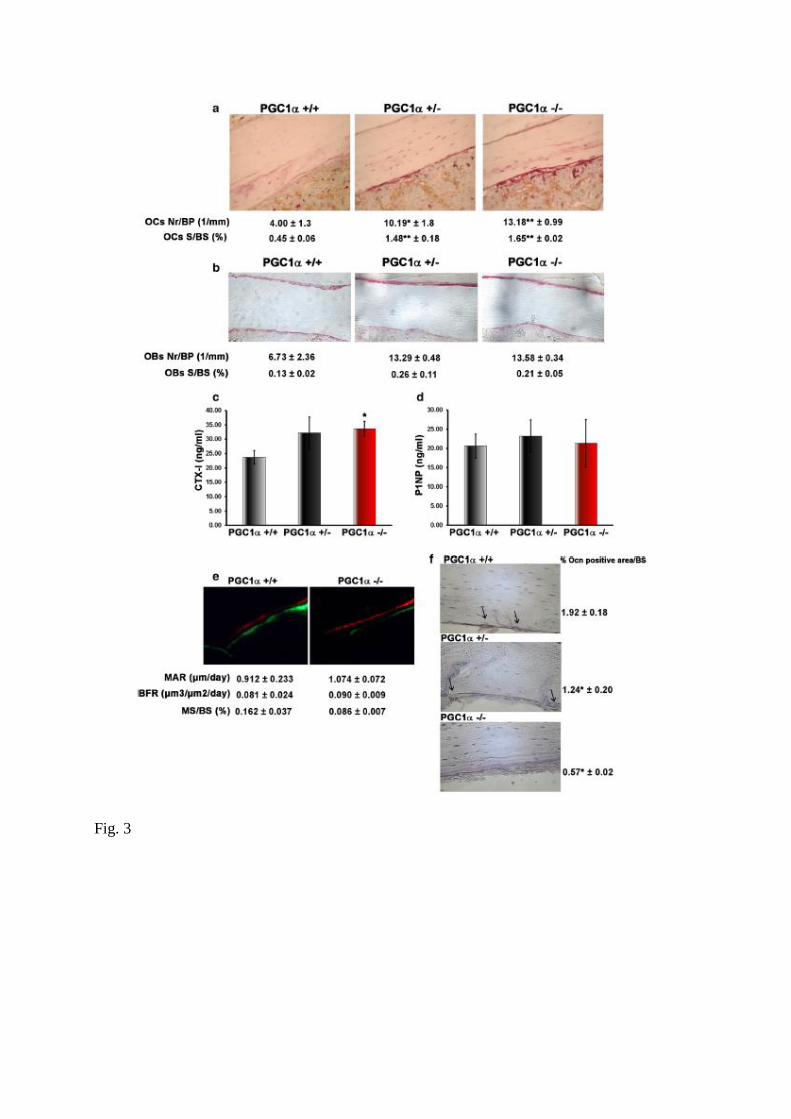
Fig. 3
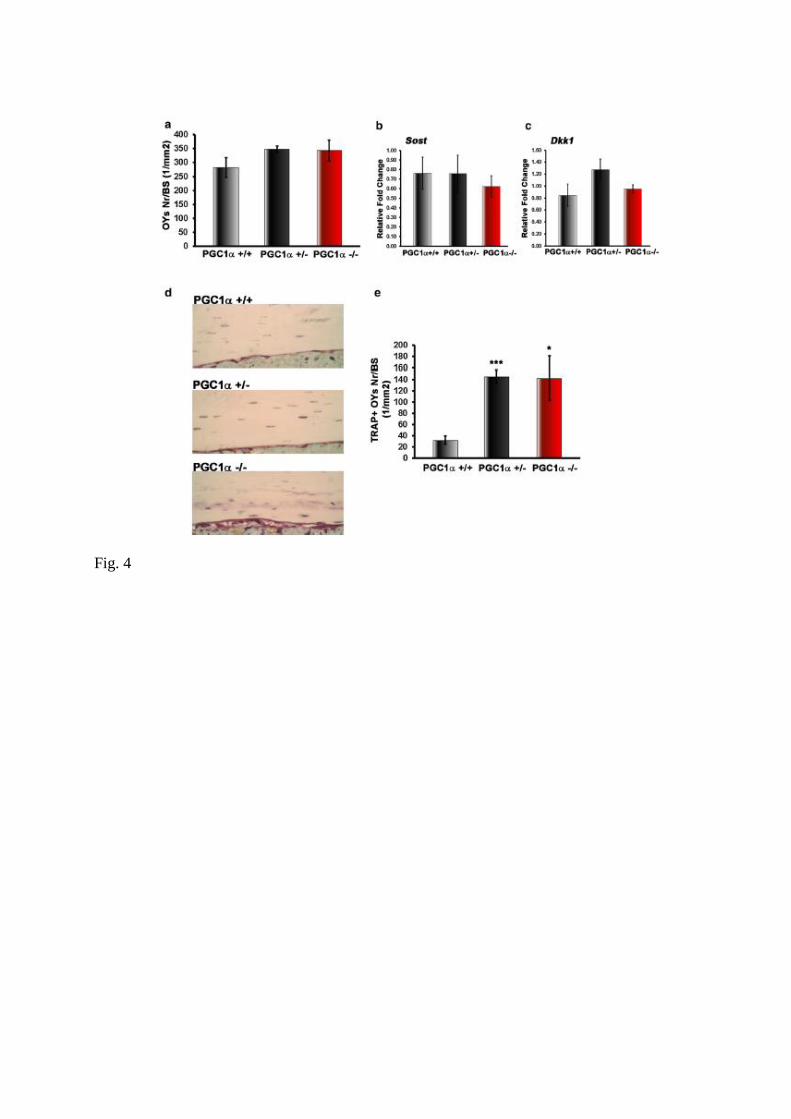
Fig. 4
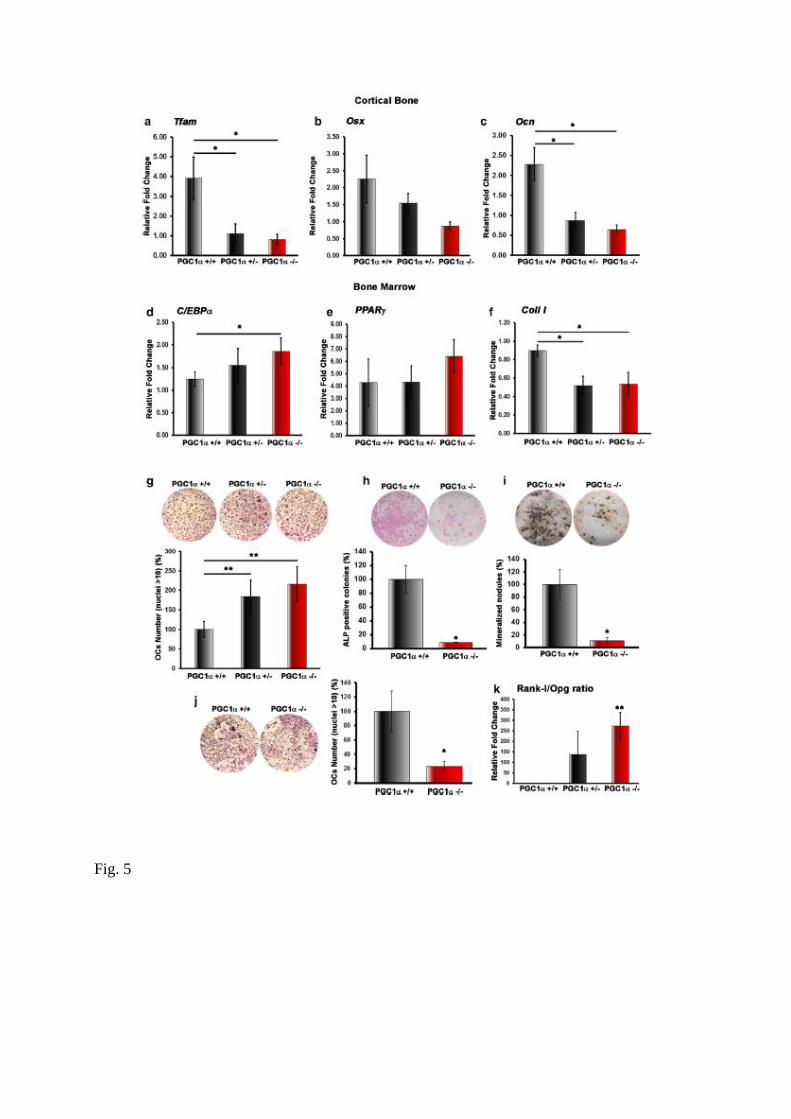
Fig. 5
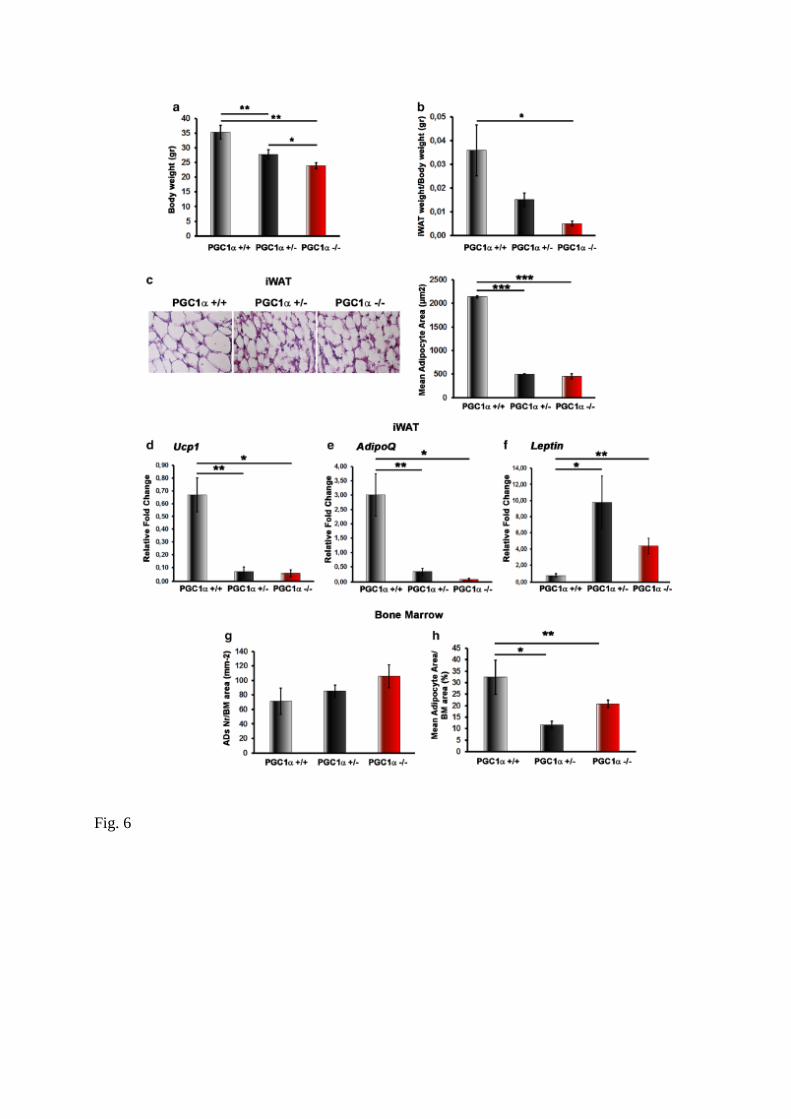
Fig. 6