Synergistic Effects between Gemini Inhibitor and Thiourea ...
DELETERIOUS SYNERGISTIC EFFECTS OF CONCURRENT MAGNETIC FIELD AND
SUPERPARAMAGNETIC (Fe3O4) NANOPARTICLE EXPOSURES ON CHO‐K1 CELL LINE
Zachary Coker, B.S.
Thesis Prepared for the Degree of
MASTER OF SCIENCE
UNIVERSITY OF NORTH TEXAS
May 2015
APPROVED: Tae‐Youl Choi, Major Professor Xun Yu, Committee Member Bennett L. Ibey, Committee Member Yong X. Tao, Chair of the Department of
Mechanical and Energy Engineering Nandika A. D’Souza, Mechanical and Energy
Engineering Graduate Program Coordinator
Costas Tsatsoulis, Dean of the College of Engineering and Interim Dean of the Toulouse Graduate School
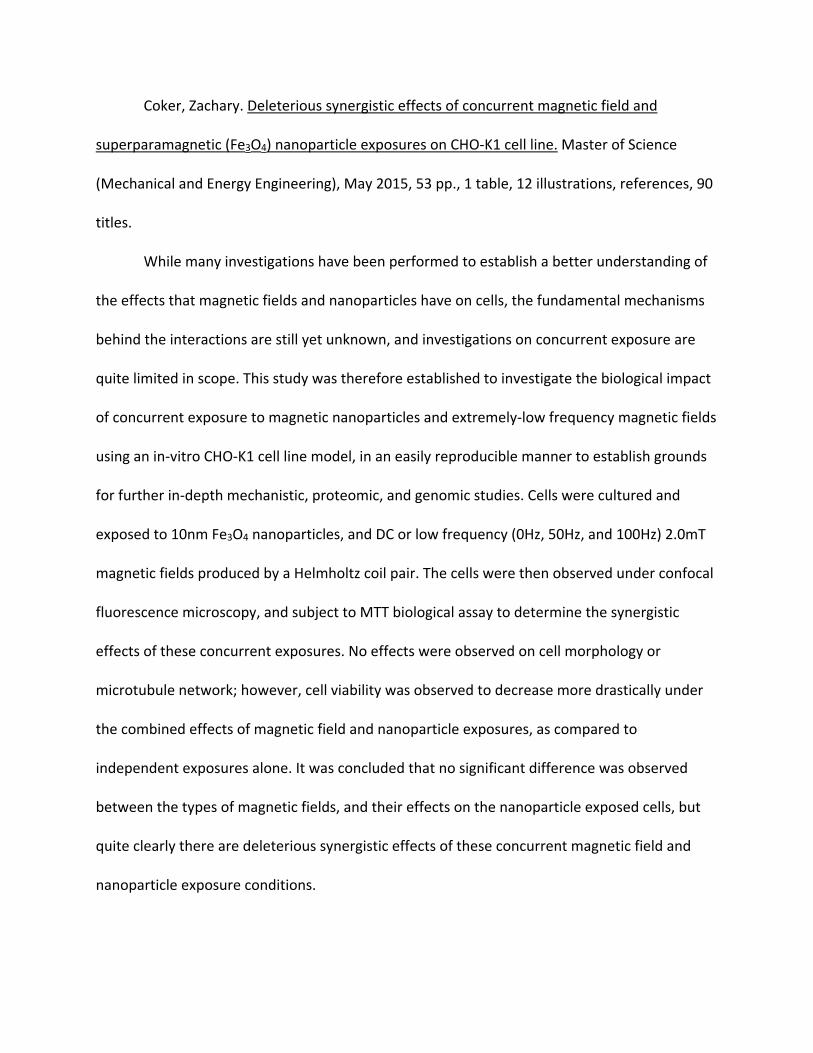
Coker, Zachary. Deleterious synergistic effects of concurrent magnetic field and
superparamagnetic (Fe3O4) nanoparticle exposures on CHO-K1 cell line. Master of Science
(Mechanical and Energy Engineering), May 2015, 53 pp., 1 table, 12 illustrations, references, 90
titles.
While many investigations have been performed to establish a better understanding of
the effects that magnetic fields and nanoparticles have on cells, the fundamental mechanisms
behind the interactions are still yet unknown, and investigations on concurrent exposure are
quite limited in scope. This study was therefore established to investigate the biological impact
of concurrent exposure to magnetic nanoparticles and extremely-low frequency magnetic fields
using an in-vitro CHO-K1 cell line model, in an easily reproducible manner to establish grounds
for further in-depth mechanistic, proteomic, and genomic studies. Cells were cultured and
exposed to 10nm Fe3O4 nanoparticles, and DC or low frequency (0Hz, 50Hz, and 100Hz) 2.0mT
magnetic fields produced by a Helmholtz coil pair. The cells were then observed under confocal
fluorescence microscopy, and subject to MTT biological assay to determine the synergistic
effects of these concurrent exposures. No effects were observed on cell morphology or
microtubule network; however, cell viability was observed to decrease more drastically under
the combined effects of magnetic field and nanoparticle exposures, as compared to
independent exposures alone. It was concluded that no significant difference was observed
between the types of magnetic fields, and their effects on the nanoparticle exposed cells, but
quite clearly there are deleterious synergistic effects of these concurrent magnetic field and
nanoparticle exposure conditions.

ii
Copyright 2015
by
Zachary Coker

ii
ACKNOWLEDGEMENTS
I would like to express my sincere gratitude to my advisers: Dr. Tae-Youl Choi for his
unwavering support and confidence in my abilities as a student and researcher. He has been an
exemplary adviser, mentor, and friend. Dr. Bennett Ibey for his guidance, support, and
suggestions in my pursuit of knowledge in a field previously unknown to me, and for his trust in
my abilities to learn, solve problems, and overcome challenges. Finally, Dr. Saber Hussain, who
after only a few conversations, put faith in my abilities, and provided me the chance to prove
myself through a summer research internship, and the opportunity to challenge myself by
branching into a new research field, and develop as a student, scientist, and engineer.
I would also like to recognize those who have helped me to learn and develop the
technical skills necessary to complete this work, or who have contributed in discussions that
have helped to advance this work, in no particular order: Dr. Gary Thompson, Mr. Larry Estlack,
Dr. Laura Braydich-Stolle, Dr. Matthew Grogg, Mrs. Elizabeth Maurer-Gardner, Ms. Madeleine
DeBrosse, Ms. Samantha Franklin, Mr. Caleb Roth, Dr. Ronald Barnes, Dr. Hope Beier, and Mr.
Cesario Cerna.
This work was supported by the United States Air Force 711th Human Performance
Wing, Human Effectiveness Directorate, Air Force Research Laboratory - Radio Frequency
(RHDR) and Molecular (RHDJ) Bioeffects Divisions.
iii
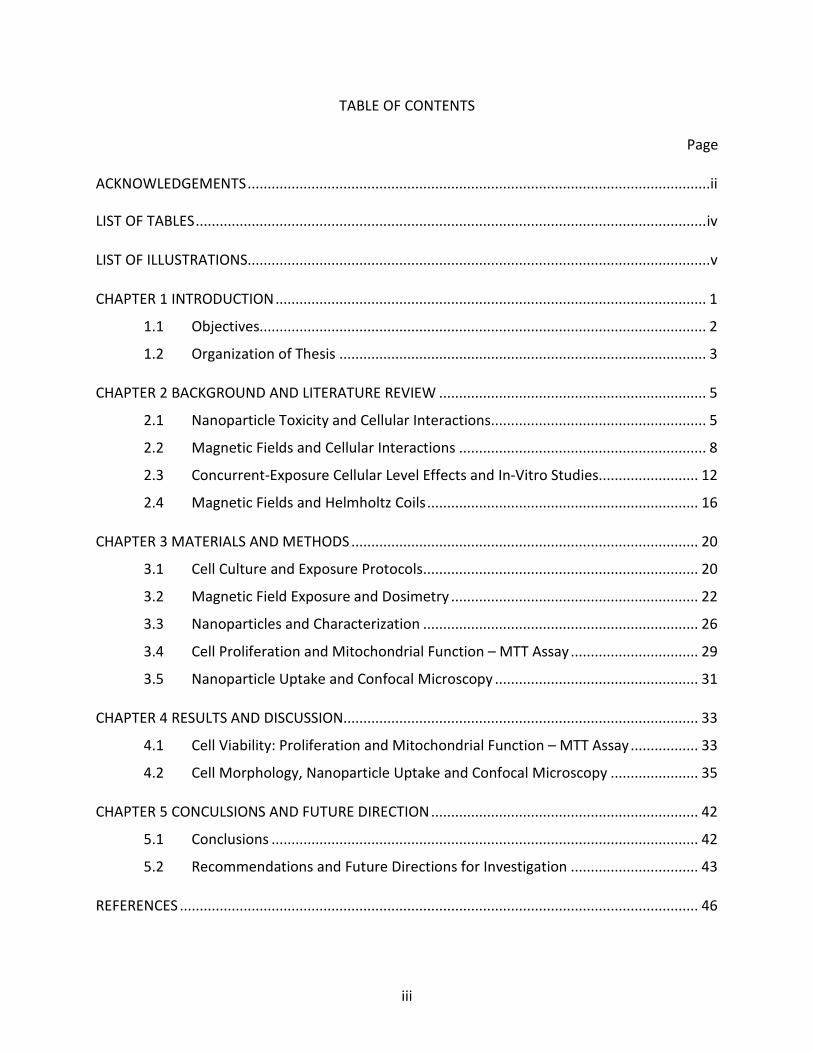
TABLE OF CONTENTS
Page
ACKNOWLEDGEMENTS ....................................................................................................................ii LIST OF TABLES ................................................................................................................................ iv LIST OF ILLUSTRATIONS.................................................................................................................... v CHAPTER 1 INTRODUCTION ............................................................................................................ 1
1.1 Objectives................................................................................................................ 2
1.2 Organization of Thesis ............................................................................................ 3 CHAPTER 2 BACKGROUND AND LITERATURE REVIEW ................................................................... 5
2.1 Nanoparticle Toxicity and Cellular Interactions ...................................................... 5
2.2 Magnetic Fields and Cellular Interactions .............................................................. 8
2.3 Concurrent-Exposure Cellular Level Effects and In-Vitro Studies ......................... 12
2.4 Magnetic Fields and Helmholtz Coils .................................................................... 16 CHAPTER 3 MATERIALS AND METHODS ....................................................................................... 20
3.1 Cell Culture and Exposure Protocols ..................................................................... 20
3.2 Magnetic Field Exposure and Dosimetry .............................................................. 22
3.3 Nanoparticles and Characterization ..................................................................... 26
3.4 Cell Proliferation and Mitochondrial Function – MTT Assay ................................ 29
3.5 Nanoparticle Uptake and Confocal Microscopy ................................................... 31 CHAPTER 4 RESULTS AND DISCUSSION......................................................................................... 33
4.1 Cell Viability: Proliferation and Mitochondrial Function – MTT Assay ................. 33
4.2 Cell Morphology, Nanoparticle Uptake and Confocal Microscopy ...................... 35 CHAPTER 5 CONCULSIONS AND FUTURE DIRECTION ................................................................... 42
5.1 Conclusions ........................................................................................................... 42
5.2 Recommendations and Future Directions for Investigation ................................ 43 REFERENCES .................................................................................................................................. 46
iv
LIST OF TABLES
Page
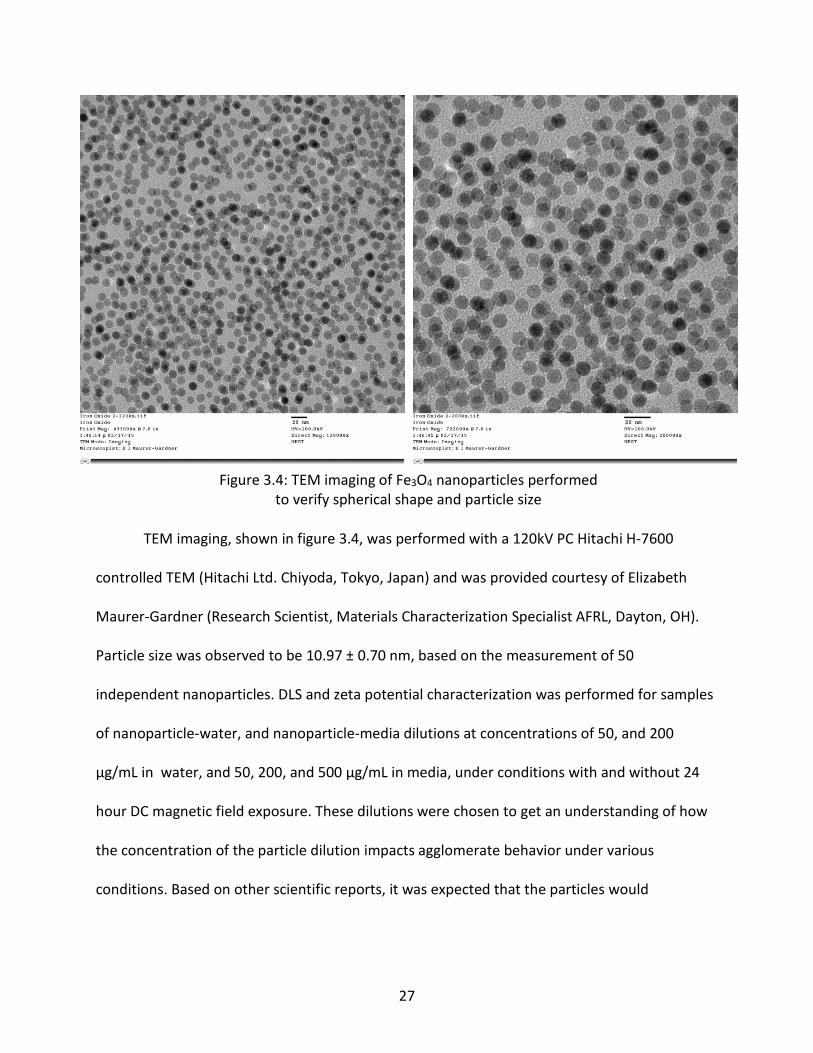
Table 3.1: Zetasizer nano measurements for various Fe3O4 particle dilutions in H2O and media, with and without MF Exposure ..................................................................................................... 29
v
LIST OF ILLUSTRATIONS
Page
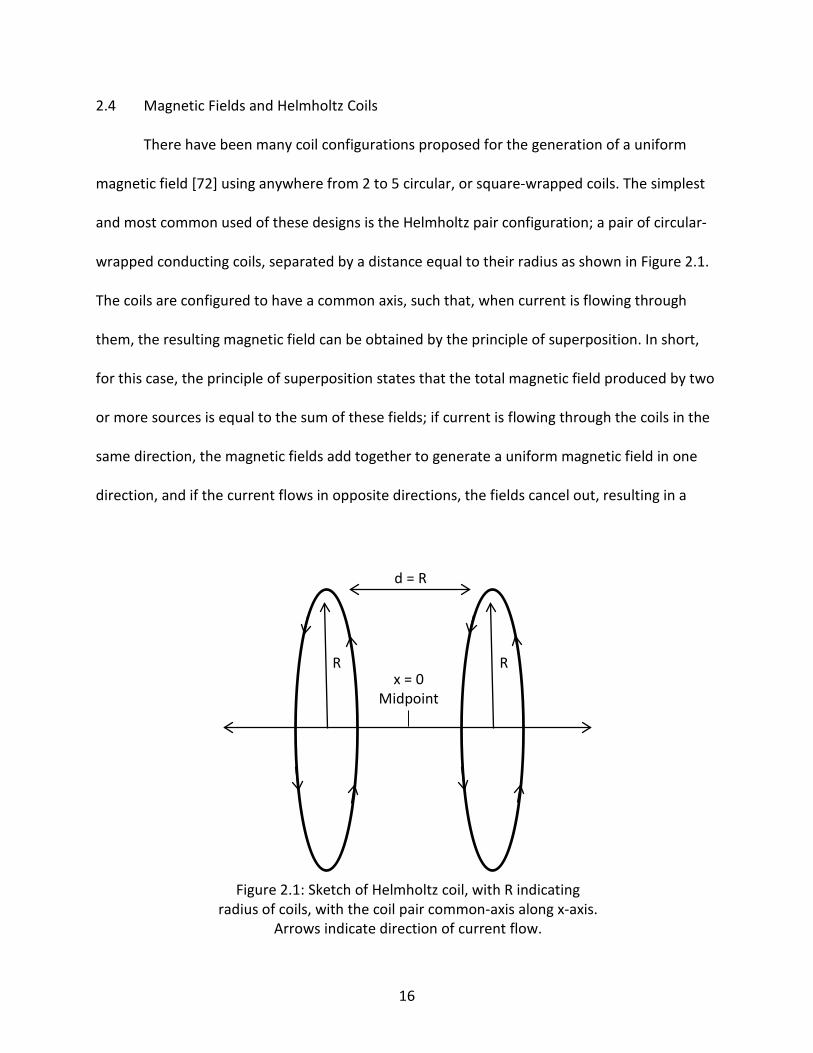
Figure 2.1: Sketch of Helmholtz coil, with R indicating radius of coils, with the coil pair common-axis along x-axis. Arrows indicate direction of current flow......................................................... 16
Figure 3.1: Components for magnetic field system: (a) SpinCoil-7-X Helmholtz Coil, with LakeShore probe (b) LakeShore 425 Gaussmeter (c) Kikusui PCR500M Compact Power Supply 22
Figure 3.2: FEMM simulation: Flux density plot for cross section cut of magnetic field produced by Helmholtz coil pair ................................................................................................................... 24
Figure 3.3: Flux density measurement from center of Helmholtz coil along either X or Y axis as depicted in Fig. 3.2.2 ..................................................................................................................... 24
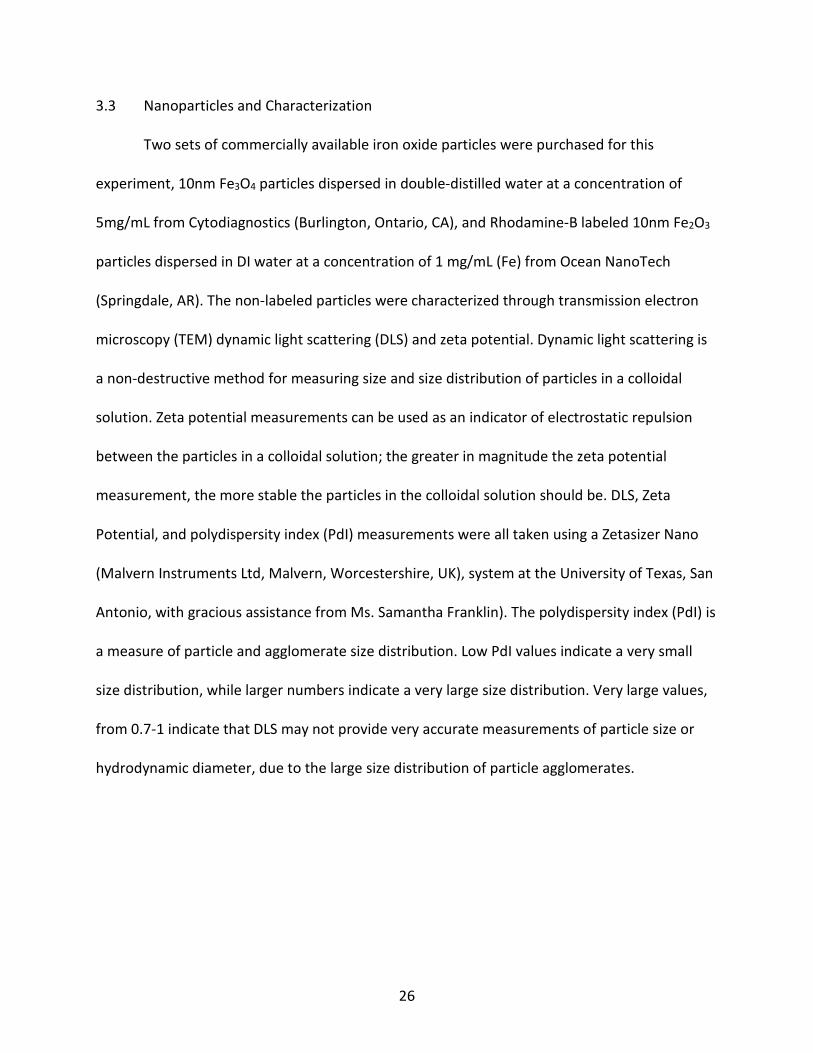
Figure 3.4: TEM imaging of Fe3O4 nanoparticles performed to verify spherical shape and particle size ................................................................................................................................................ 27
Table 3.1: Zetasizer nano measurements for various Fe3O4 particle dilutions in H2O and media, with and without MF Exposure ..................................................................................................... 29
Figure 3.5: Zeiss LSM 710 confocal microscope used for microscopy studies ............................. 31
Figure 4.1: MTT Concentration-dependent survivability curve of cells exposed to Fe3O4 nanoparticles and no magnetic field ............................................................................................ 34
Figure 4.2: MTT Concentration-dependent survivability curves for cells exposed to Fe3O4 nanoparticles and (a) DC magnetic field, (b) 50Hz magnetic field (c) 100Hz magnetic field, and (d) the respective Δ from sham conditions. The greyed section represents the area beyond the ED50 for cells not exposed to magnetic fields. Sham exposure Δ measured against trials in an independent incubator. ................................................................................................................ 36
Figure 4.3: Select images from confocal microscopy study without DC magnetic field exposure; (a) bright field images (b) Fluorescent mEmerald tubulin expression (c) Fluorescence imaging with Rhodamine-B labeled particles and (d) Overlay results from bright field and Rhodamine-B fluorescence imaging to show particles inside the cell structures. .............................................. 39
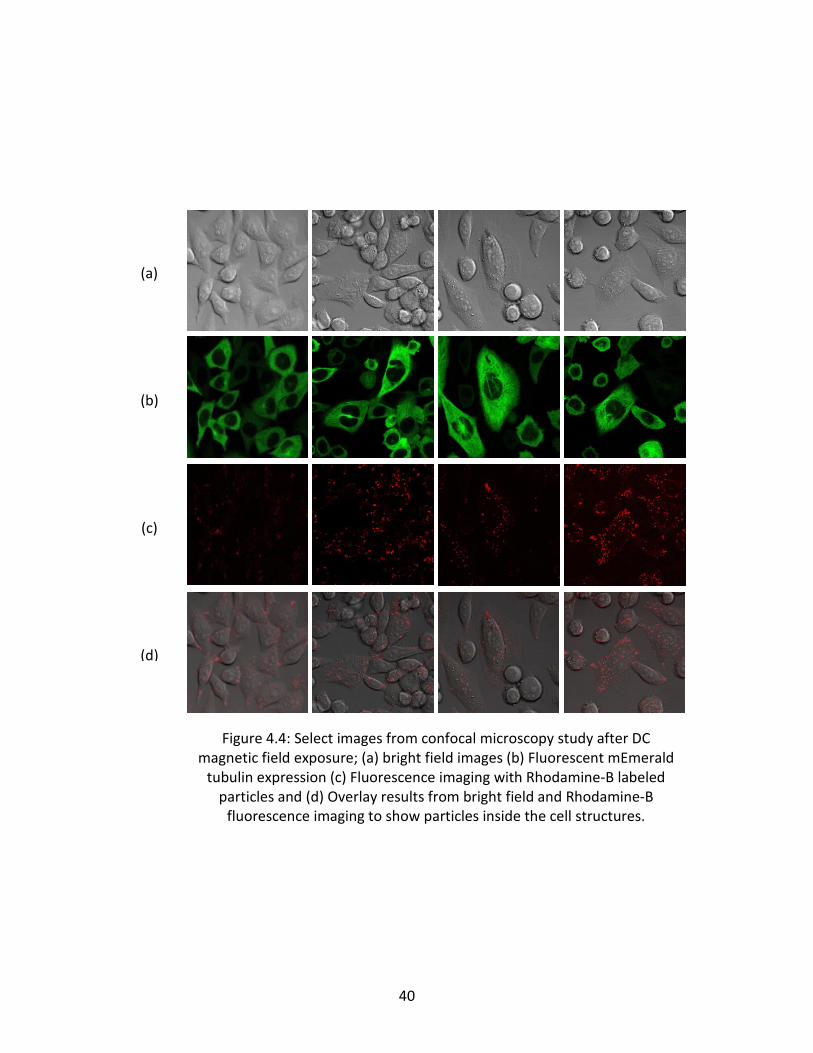
Figure 4.4: Select images from confocal microscopy study after DC magnetic field exposure; (a) bright field images (b) Fluorescent mEmerald tubulin expression (c) Fluorescence imaging with Rhodamine-B labeled particles and (d) Overlay results from bright field and Rhodamine-B fluorescence imaging to show particles inside the cell structures. .............................................. 40
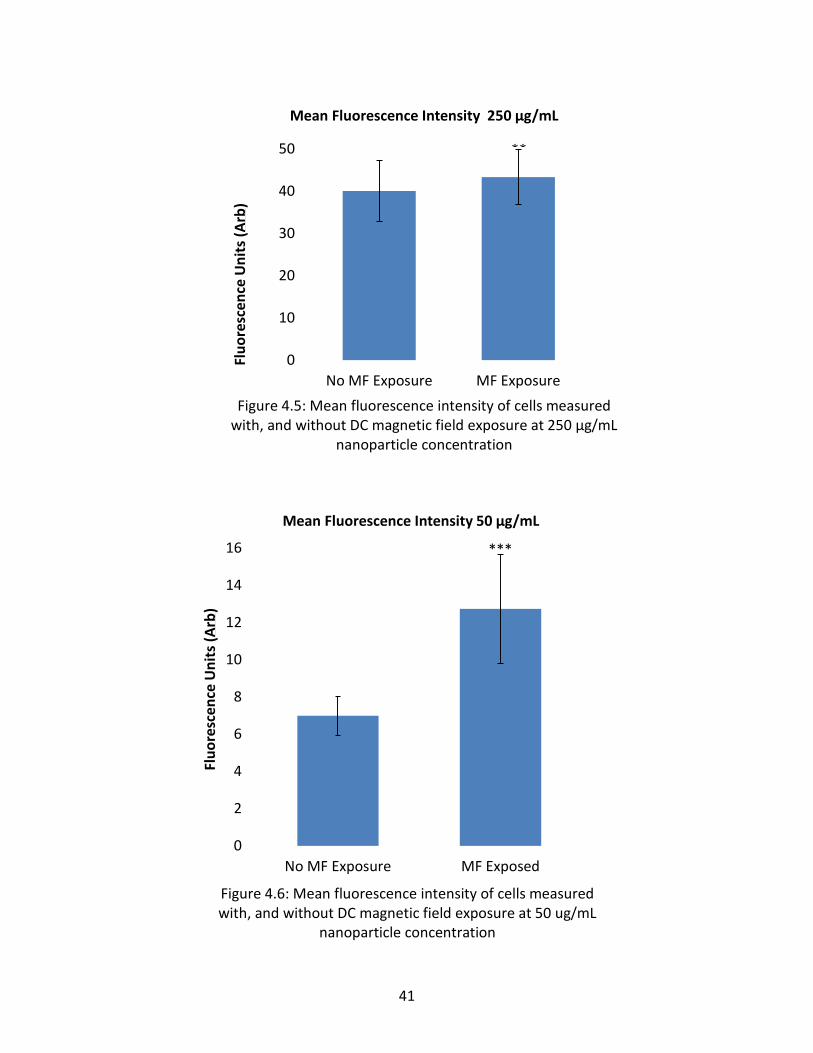
Figure 4.5: Mean fluorescence intensity of cells measured with, and without DC magnetic field exposure at 250 μg/mL nanoparticle concentration .................................................................... 41
vi
Figure 4.6: Mean fluorescence intensity of cells measured with, and without DC magnetic field exposure at 50 ug/mL nanoparticle concentration ...................................................................... 41
1
CHAPTER 1
INTRODUCTION
Despite numerous investigations since the 1970s, the effect of low frequency magnetic
fields on cells has remained unclear and the subject of much controversy, especially because
many investigators report irreproducible or even contradictory findings [1–4]. Difficulties arise
in that experiments can be very difficult to repeat as many exposure systems are custom made
for their respective experiments, and even minor variations in the design can induce moderate
to large changes in the magnetic fields produced. Additionally, the effects of magnetic field
exposures on cells are not necessarily ubiquitous, but rather may be dependent on cell line [5],
cell stage, or even age of cells or their respective donors [6,7]. Induced cellular level effects may
be also very small and difficult to quantify, and very minute variations in magnetic field
parameters such as field intensity, direction, duration of exposure, and field frequency may
have significant impacts on cell behavior [8–10]. Finally, the possible biophysical mechanisms
behind any induced cellular effects are still not well known, however many theoretical models
have been proposed [11].
Many studies have been presented on the effects of magnetic field exposures on various
cell lines, particularly at standard distribution frequencies of 50Hz and 60Hz [12–21] and DC
magnetic fields [22–25]. Additionally extensive investigations have been carried out on the
toxicological effects of nanoparticle interactions with cells, and what nanoparticle properties
impact those interactions [26–33]. Concurrent nanoparticle and magnetic field interactions
have indeed been investigated [12,23,24,34–38], however there are no consistent and
agreeable results from these studies showing specific effects of concurrent low frequency
2
magnetic fields, and magnetic nanoparticle exposure on cells. This study was therefore
designed to investigate the biological impact of concurrent DC, or low frequency magnetic
fields and magnetic nanoparticle exposures on the CHO-K1 cell line, in an easily reproducible
manner, to establish grounds for further in-depth mechanistic, proteomic, and genomic studies.
For the purpose of developing future studies, and for independent verification, the magnetic
field exposure was conducted using commercially available components, while nanoparticle
exposure procedures emulate that of well-established, previously performed toxicological
studies [32,39,40]. The exposure systems, protocols, and measurements are further detailed in
chapter 3. For the purpose of this experiment, the term “magnetic field” and “magnetic field
intensity” refer specifically to the magnitude of magnetic flux density of the induced magnetic
fields.
1.1 Objectives
The main objective of this research was to investigate the biological impact of
concurrent exposure to magnetic nanoparticles (NP) and extreme-low frequency magnetic
fields (ELF-MF) using an in-vitro CHO-K1 cell model. This objective was achieved through the
following specific aims:
Specific aims:
1. Establish in-vitro NP, ELF-MF, and concurrent NP+MF exposure system
for the CHO-K1 cell line model. Specifically DC, 50Hz, and 100Hz 2.0mT
magnetic fields and 10nm spherical superparamagnetic Fe3O4
nanoparticles were used in this study.
3
2. Investigate biological impacts and perform comparative analysis of
concurrent exposures against independent exposures, focusing
specifically on cell viability and recovery through mitochondrial activity
measurement following NP and MF treatment.
3. Investigate cell morphology and nanoparticle uptake changes in CHO-
K1 cells via confocal microscopy using mEmerald-tubulin expressing CHO
cells, and Rhodamine-B labeled nanoparticles.
1.2 Organization of Thesis
Chapter 2 presents information obtained through literature review of relevant scientific
investigations on cellular effects of nanoparticle, magnetic field, and concurrent exposures. The
first section of this chapter is dedicated specifically to current investigative efforts on
cytotoxicity and nanoparticle-cell interactions, while the second section is dedicated specifically
to magnetic field-cell interactions. As current investigations are limited with regard to
concurrent exposures, a brief discussion is presented on current investigative efforts in the final
section of this chapter. The final section of the chapter is dedicated to a brief review of
Helmholtz coils and their use to generate uniform magnetic fields.
Chapter 3 covers the methodology and materials used for the investigation, beginning
with cell culture methods for the CHO-K1 cell line, followed by a brief discussion about the
magnetic field exposure system and exposure conditions. The chapter closes with
characterization methods of the nanoparticles used and their attributes, MTT assay
methodology, and finally confocal and fluorescent microscopy methods.
4
Chapter 4 provides information related to the results of the investigation, where the
MTT assay results, as well as the confocal and fluorescent microscopy results are presented and
discussed.
Chapter 5 concludes the thesis with a summary of the investigation, and provides
suggestions for further development for studies of the mechanisms behind the cellular effects
of these exposures, and the potential future applications of the research.
5
CHAPTER 2
BACKGROUND AND LITERATURE REVIEW
This chapter briefly covers the results of a survey of relevant literature on modern
research efforts directly related to cellular interactions with nanoparticles, magnetic fields, and
concurrent nanoparticle-magnetic field exposures, and the mechanisms behind those
interactions. Following the review discussion, a brief description of Helmholtz coils is given,
along with relevant information for understanding magnetic field exposures used for this
experiment.
2.1 Nanoparticle Toxicity and Cellular Interactions
Rapid development of nanotechnology has resulted in nanomaterials being
incorporated into every day products and applications across many fields. Due to the unique
properties of nanoparticles, they have become very attractive for many wide-spread
applications, including, but not limited to commercial, medical, electronics, and military
applications. Naturally, with an increase in use and application, comes an increased risk of
incidental or unintended exposure. The reality of nanoparticle exposure is that everyone is
exposed, all the time, as particles are now found in food, beverages, clothing, cosmetics, and
various other daily-used items.
For the most part, these particles have little to no effect on health, however a growing
number of studies have shown that nanoparticle interactions with cells have the ability to
influence some of the most basic of cellular functions, such as proliferation, metabolism, and
even cell death. As nanoparticles are very small, on the order of 1x10⁻⁹m, some nanoparticles
6
have the ability to permeate through biological barriers, disrupt normal functions, and cause
substantial damage to biological systems. Several diseases have been associated with
nanoparticle-interaction and interference with basic cell processes, such as cancer,
neurodegenerative disease [28], and even Alzheimer’s disease [41]. Many investigations have
thus been performed to ascertain information about the potential risks associated with various
nanoparticle exposures [27–30,32,33,42] and their biological effects. For example, Hussain et
al. [39] reported on the in-vitro toxicity of various nanoparticles and related concentration
dependence, in BRL 3A rat liver cell model. Braydich-Stolle et al. [32] performed a similar
investigation in mammalian germline stem cells. Prabhu et al. [33] studied the size and
concentration dependence of cytotoxicity of Cu nanoparticles, and Comfort et al. [40] reported
that superparamagnetic Fe3O4 particles produced a strong alteration in epidermal growth factor
(EGF) activated gene transcription, with targeted genes influencing cell proliferation, migration,
and receptor expression in A-431 cell line model.
Magnetic nanoparticles have become particularly of interest, due to their unique
properties when exposed to magnetic fields; superparamagnetic iron oxide is already widely
implemented in the medical field as a contrast agent for MRIs. Bae et al. [43], Singh et al. [30],
and Mahmoudi et al. [27][42] have all reported findings on the cytotoxicity of
magnetic/superparamagnetic nanoparticles, and show high biocompatibility, in agreement with
the previously mentioned studies. All of these investigations together, have shown a multitude
of ways in which nanoparticle exposure can influence biological systems based on the various
properties of those particles, including size, shape, surface chemistry, chemical composition,
exposure conditions, and even synthesis methods [44–46].
7
With respect to nanoparticle-cell interactions, the size, shape and surface chemistry are
readily apparent as important factors that determine cellular response and uptake. Jiang et al.
[47] showed that dependence of cellular interaction on size and surface chemistry, which
corroborate similar reports by several others [48–51]. The reports on size dependence provide
insight into how the particles interact with the cell membrane; quantum dots, and very small
particles on the order of 10nm, appear to coat the plasma membrane before incorporation into
the cell, and must reach a critical threshold density to trigger the cell receptors to initiate
uptake, while larger particles were seen to be internalized immediately, without accumulation
on cell membranes. Likewise Jiang et al. provided their report on protein adsorption layer
impact on uptake showing results, similar to those by Nativo et al. [52]and Labhasetwar et al.
[53], that suggest surface modification strongly modulates cellular uptake. Finally, Kim et al.
[54] reported the role of cell cycle on nanoparticle uptake, and dilution amongst replicating
cells; little to no impact was reported within the first 10 hours of exposure to nanoparticles.
However, after 24 hours, concentration of nanoparticles in cells could be ranked with respect to
cell phase. An important finding in this study was that nanoparticles that are internalized by
cells are not exocytosed, but rather are split between daughter cells through cell division. Other
studies, such as the investigation by the time and space resolved uptake studies by Shapero et
al. [55] have reported negligible amounts of exocytosis through nanoparticle studies as well.
Jiang et al. [47] published a contradictory report on the endo- and exocytosis of quantum dots,
showing the particles being trafficked towards the peripheral regions of the cells for exocytosis,
though this may be a result of the very small size of the quantum dots, relative to the particles
used in Shapero’s studies. Ultimately, these contradictory reports reiterate the many variables
8
that influence cellular-level interactions with nanoparticles, and that there is still much room
for improvement in understandings of the mechanisms driving those interactions. In 2007,
Buzea et al. [28] published an extensive review covering the various sources and toxicities
associated with nanoparticle risk and exposure. Despite the extensive research efforts
conducted on nanoparticle interactions with biological systems, the true impact of these
particles, and all associated effects are yet to be clearly established or well understood. Due to
the relative ease by which nanoparticles can enter the human body, be it by inhalation,
gastrointestinal, or skin exposure, cytotoxicity of nanoparticles has grown to be a major
concern, and will continue to be so, with the constant increase in developments, and thereby
demands of nanoparticle applications.
2.2 Magnetic Fields and Cellular Interactions
In modern physics and electrodynamics, electromagnetic waves are described and
ordered by their frequency (f) or wavelength (λ), related by the equation λ = c/f, where c is
recognized as a universal constant, the speed of light in a vacuum (2.998x10⁸ m/s). Direct
current (DC) electromagnetic fields are static electric or magnetic fields which have emission
frequencies of 0 Hz. While most real-world exposures will occur over a large range of the
electromagnetic spectrum, much research has been conducted to investigate cellular level
effects of static fields, and fields of specific frequency levels relevant to electronic appliances
and power-line distributions. The magnetic fields investigated in this thesis are in the extreme-
low frequency range of 0-300Hz; induced by current flowing through paired coils of wire at the
respective driving frequency. This is further discussed in the methods and materials section.
9
Due to rapid developments in technology and electronic communications since the late
19th century, and the industrial revolution, exposure to low frequency magnetic fields is, in-
general, an unavoidable aspect of modern life. However, in 1979, Wertheimer and Leeper
reported a correlation between living near power distribution lines, and increased risk for
childhood leukemia [11]; since their report, the concern for possible health effects of low
frequency magnetic field exposures has been a rather controversial topic, and the subject of
many investigations. In a paper published in a section of the Journal of Electroanalytical
Chemistry, Glaser [56] suggests a hierarchical view must be considered for magnetic field
interactions with biological structures, in the order of atomic, molecular, cellular, and organism
interactions. Glaser suggests that effects are possible on the basis of quantum mechanics,
dipolar orientation of molecules, double-layer structures and modifications of systems of ionic
equilibrium. Additionally, Glaser points out that, though many phenomena of field effects have
been experimentally verified, the underlying effects are still not understood. This experiment
focuses on the cellular level interactions of magnetic field exposure, with the consideration that
many of the cellular level effects are likely not directly-driven by the field exposures, but rather
by molecular-level effects.
Similar to the complexities introduced when investigating cellular-level interactions with
nanoparticles, many complexities are introduced when considering cells under magnetic field
exposure and their related interactions. Conflicting results have been reported with respect to
cellular interactions with magnetic fields between different cell types, field exposures, and even
cells of the same type, based on age or conditions [6]. The complexity of the interactions is
somewhat exemplified by the proteomic analysis performed on SH-SY5Y neuroblastoma cell
10
line model by Hasanzadeh et al. [14], where they reported 189 individual proteins altered by a
2.0mT 50Hz magnetic field exposure for 3 hours, most of these protein alterations were
associated with the cellular defense mechanisms. Tenuzzo et al. [57] also demonstrate this
complexity with their analysis of 6mT static magnetic field influences on apoptosis of
lymphocytes, where it was reported that the effects are likely not a direct result of the
magnetic field acting on the cell, but rather through Ca2+ influx in the cells. These results were
complimented when Fanelli et al. [37] reported increased cell survival by magnetic field (up to
6mT) induced Ca2+ influx inhibition of apoptosis in several cell systems. However, contradictory
evidence is presented by Ahmadianpour et al. [25] in their report of 6mT magnetic field-
induced apoptosis, and altered cell cycle of p53 mutant Jurkat cells. Goodman et al. [9,58]
showed an increased expression in several transcripts in HL60 cells under various types of
magnetic field exposures (various frequency and field intensities), and mRNA levels after only
20 minutes of exposure. Initially, they reported that the strongest responses were measured
after exposure to 1.5mT 50Hz magnetic fields; however, this same group reported conflicting
data showing that the strongest responses were actually at a much lower field intensity of only
5.6μT, and that stronger fields, and longer exposure times actually lead to a reduced cellular
response.
The effects of magnetic field interaction with cells have been reported to have a
multitude of impacts beyond those previously mentioned, and the complexity intensifies; some
reports have shown opposite effects in the same cell, with simple variations in field strength
[1,20,59] while others have shown completely contradictory reports [60] compared to other
researchers. Luukkonen et al. [18] reported that SH-SY5Y cells, pre-treated with 100μT 50Hz
11
magnetic fields experienced enhanced menadione-induced DNA damage, and micronucleus
formation, but alternatively also experienced an increase in DNA repair rate. Simkó et al. [5]
also reported on micronuclei formation, showing yet another difference in cell line response, as
they reported findings on micronuclei formation in SCL II cell line, but not in human amniotic
fluid cells, after exposure to 0.1mT – 1.0mT 50Hz magnetic fields for 24 to 72 hours. The SH-
SY5Y cell line has been of particular interest in magnetic field-cellular level interactions, as SH-
SY5Y cells are often used as in vitro models of neuronal function; Falone et al. [15] reported
increased antioxidant defenses and a shift in redox homeostasis in these cells after exposure to
1.0mT 50Hz magnetic fields for 5, 10, and 15 days, with increase in protein expression changes
related to cellular defense mechanisms, similar to the study by Hasanzadeh mentioned earlier.
Cerrato et al. [16] reported an increase in proliferation immediately following 24 hours of
2.0mT 50Hz magnetic field exposure with SH-SY5Y cell line, in addition to immediate up-
regulation of TAU mRNA gene expression, and Syp gene expression, and immediate down-
regulation of MAP2 gene expression. All three of these expressions were regulated back to
normal 24 hours after exposure had ended. This indicates that some effects of magnetic field
exposure may not be readily apparent in all investigations, if there is a prolonged delay
between field exposure and analysis. In the studies by Cerrato et al. and Falone et al., it was
also reported that a 2.0mT 50Hz magnetic field had an impact on the cell morphology,
migration, and distribution of microtubules. Falone et al. observed that the cells would cluster
together during culture process, but when exposed to magnetic field, would be observed
evenly distributed about the culture surface. Cerrato et al. observed that the microtubules were
branched radially from the perinuclear region of the control cells, while exposed cells exhibited
12
microtubule distributions organized into clusters that would transition into the neurites that
were forming. This could indicate an effect on the microtubule structures themselves, or on
molecular processes that regulate this process in the cells. Complementing these reports on
morphological change in the cells, Pozzi et al. [13] reported that 2mT 50Hz magnetic fields
interfere with the growth process of Lan-5 neuroblastoma cell line, and induces changes in cell
morphology.
Santini et al. [61,62] have published a review article on investigations of cellular effects
of low frequency magnetic fields. A general conclusion that can be drawn is that despite the
multitude of studies, there still remains debate over what, if any, health effects result from
exposure to low frequency magnetic fields.
2.3 Concurrent-Exposure Cellular Level Effects and In-Vitro Studies
While extensive research has been conducted to investigate the independent impacts of
nanoparticle and magnetic field exposures on biological systems, studies for the combined
effects of these exposures, especially at very low magnetic field frequencies are not yet well
established. Current research dedicated to the combined effects of nanoparticle and
electromagnetic field exposures on cells is mostly focused on effects induced at very high
power absorption frequencies (kHz-MHz range) [63–66] for the purpose of thermal therapies
and targeted heat generation, neglecting the lower frequency domain. A review article by
Mamiya [67] on magnetic nanoparticles and targeted hyperthermia provides a brief description
of particle response to AC magnetic fields for the purpose of these therapies.
13
As research on the combined effects of low frequency fields and nanoparticles on cells is
beginning to grow, a noticeable trend is how closely related the investigations are to the
independent-exposure investigations. For instance, Jia et al. [68] recently reported in 2014 the
combined effects of 50Hz magnetic field and magnetic nanoparticle on proliferation and
apoptosis of PC12 cells. This is not far removed from the report by McFarlane et al. mentioned
in the previous section. Jia et al., however, showed data representing no statistically significant
difference between control groups with and without magnetic fields, but reduced cell viability,
and increased apoptosis with the application of the magnetic field to nanoparticle loaded cells,
compared to cells with nanoparticles, but no applied magnetic field.
Bae et al. [43] produced a report on the effects of static magnetic fields on aggregation
and cytotoxicity of magnetic nanoparticles, demonstrating that static magnetic fields induce
aggregation of superparamagnetic iron oxide particle clusters, and also reduced viability,
apoptosis, and irregularity of cell cycle of hepatocytes in vitro and in vivo. In this report, it was
noted that the particle aggregates were the primary source of the cytotoxicity, not necessarily
an interaction with the magnetic field after uptake. As well, the apoptotic effects were
dependent upon particle uptake, and related reactive oxygen species production, but cell
viability measurement was not. Finally, it was also reported that multinuclear giant cells
became more prevalent under concurrent exposures, after long-term observation, as compared
to the control groups. Shen et al. [69] demonstrated increased particle uptake with the
application of magnetic field, as well as capabilities of lysosome and magnetic nanoparticle
relocation by the application of external magnetic field gradients generated by two antiparallel
permanent magnets. Additionally, they demonstrated the capability of these gradients to
14
impact cell migration by controlling the magnetic particles after uptake. The cells were
observed to move along the direction of the applied magnetic field gradient, and little to no
cytotoxicity was reported. The authors propose the method presented as a novel way to study
cellular mechanics and intracellular forces. Increased cellular uptake of superparamagnetic
nanoparticles induced by magnetic field gradient was also reported by Prijic et al. [23] showing
significant increase in uptake in several different cell lines by the application of two different
magnets with surface flux densities of 60mT and 403mT, and magnetic gradients of 5.5 and 38
T/m respectively, reporting that the stronger magnets were significantly more effective for
impacting the internalization process; the cellular uptake rate of the particles was cell type, and
time dependent. The authors also point out that the malignant cells tested had significantly
higher uptake rate than the normal or healthy cells tested, as in agreement with other research
referenced in their report. Comfort et al. [24] investigated the effects of concurrent 24 hour
exposure to 0.5mT and 30mT static magnetic fields and gold or iron oxide nanoparticle on the
HaCaT cell line. Contradictory to the report by Bae et al., the application of external magnetic
fields from permanent magnets were reported to reduce, or counteract the stress response of
the cells due to nanoparticle exposure, through a reduction in reactive oxygen species
production, and modified gene regulation induced by the magnetic fields. These effects were
observed independent of nanoparticle exposure.
Some more adventurous research has been conducted with attempts to take advantage
of the magnetic properties of some nanoparticles applied to biological systems, such as
González et al. [70] reporting their success in controlling magnetotactic bacteria through the
application of magnetic field gradients generated by Helmholtz coils and nanoscale permalloy
15
islands. The authors report successful manipulation of magnetotactic bacteria, and the ability to
guide the bacteria to desired locations. Dobson [71] has reported progress towards binding
magnetic nanoparticles (100nm – 2.7μm) to cell surfaces, for the purpose of manipulating
cellular function and behavior by shear stress applied by magnetic force-actuation, while giving
a brief overview of nanomagnetic actuation for targeting ion channel activation and cell
membrane receptors. By binding nanoparticles directly to ion channels, Dobson reports success
in activating single ion channels, without interfering with normal function in other membrane
channels. Finally, Zhang et al. [38] have reported on the use of dynamic or moving magnetic
fields of very low frequency (10-40Hz) to control nanoparticles in order to enhance cellular
uptake, and then for targeted cell death by forced-lysosome disruption in both rat insulinoma
tumor cells, and human pancreatic beta cells. Lysosomal disruption was accomplished through
the application of LAMP-1 antibody coated nanoparticles, which bound to the lysosome
membranes, applying torque to the membrane by particle rotation under the influence of the
external magnetic field. The authors report that the dynamic magnetic field causes a rotational
motion in the nanoparticles, causing them to roll along the surface of cell membranes,
simulating a virus-like interaction between the particles and cells’ surfaces, thus triggering
uptake mechanisms, and enhancing internalization into the cells. These research efforts show
the potential for the ever growing applications of magnetic field and nanoparticle exposures to
biological systems, highlighting the importance of further developing the underlying
mechanisms behind cellular level interaction of nanoparticles, magnetic fields, and concurrent
exposures.
16
2.4 Magnetic Fields and Helmholtz Coils
There have been many coil configurations proposed for the generation of a uniform
magnetic field [72] using anywhere from 2 to 5 circular, or square-wrapped coils. The simplest
and most common used of these designs is the Helmholtz pair configuration; a pair of circular-
wrapped conducting coils, separated by a distance equal to their radius as shown in Figure 2.1.
The coils are configured to have a common axis, such that, when current is flowing through
them, the resulting magnetic field can be obtained by the principle of superposition. In short,
for this case, the principle of superposition states that the total magnetic field produced by two
or more sources is equal to the sum of these fields; if current is flowing through the coils in the
same direction, the magnetic fields add together to generate a uniform magnetic field in one
direction, and if the current flows in opposite directions, the fields cancel out, resulting in a
R R
d = R
x = 0 Midpoint
Figure 2.1: Sketch of Helmholtz coil, with R indicating radius of coils, with the coil pair common-axis along x-axis.
Arrows indicate direction of current flow.
17
region of essentially net-zero magnetic field. The calculation of the exact magnetic field at any
point in space is mathematically complex; however, when considering positions along the
central axis, such as in this experiment, the calculations become far simpler. Cvetkovic et al.
[73] provide a generalized theory of Helmholtz coils and uniform magnetic field production, and
DeTroye et al. [74] expand by providing a comparison between experimental measurements
and analytical calculations of the field generated by a Helmholtz coil.
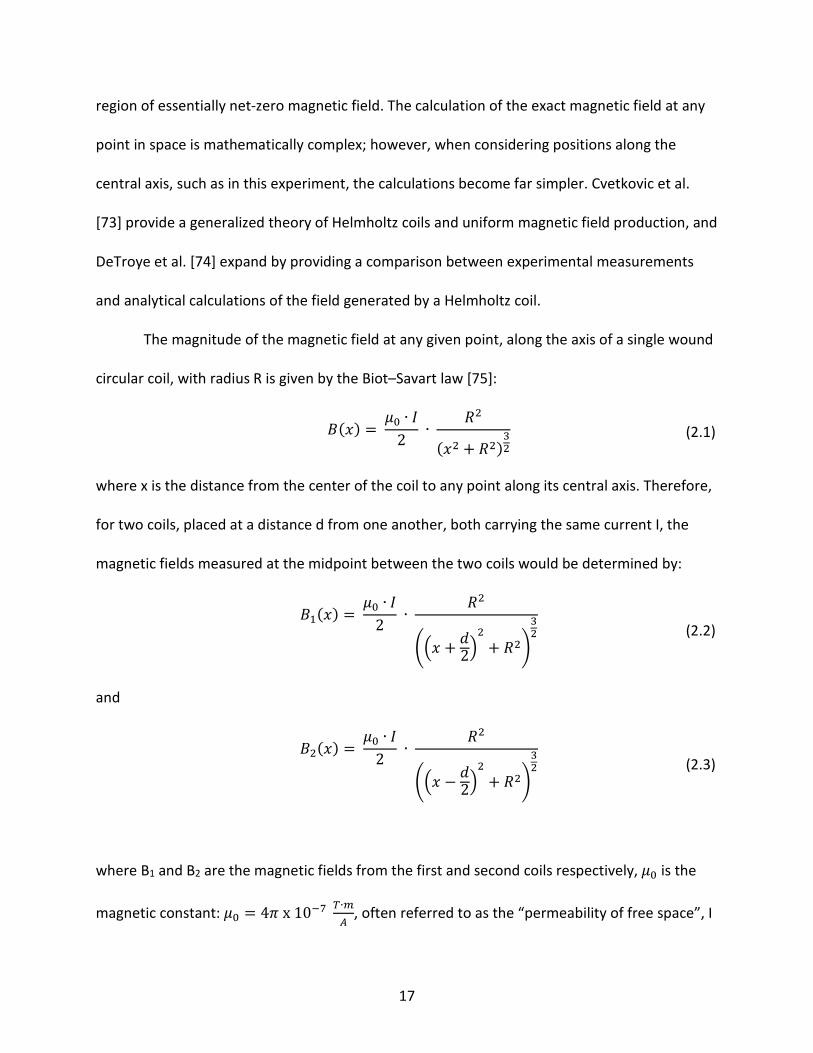
The magnitude of the magnetic field at any given point, along the axis of a single wound
circular coil, with radius R is given by the Biot–Savart law [75]:
𝐵𝐵(𝑥𝑥) = 𝜇𝜇0 ∙ 𝐼𝐼
2 ∙
𝑅𝑅2
(𝑥𝑥2 + 𝑅𝑅2)32 (2.1)
where x is the distance from the center of the coil to any point along its central axis. Therefore,
for two coils, placed at a distance d from one another, both carrying the same current I, the
magnetic fields measured at the midpoint between the two coils would be determined by:
𝐵𝐵1(𝑥𝑥) =
𝜇𝜇0 ∙ 𝐼𝐼2
∙ 𝑅𝑅2
��𝑥𝑥 + 𝑑𝑑2�
2+ 𝑅𝑅2�
32
(2.2)
and
𝐵𝐵2(𝑥𝑥) =
𝜇𝜇0 ∙ 𝐼𝐼2
∙ 𝑅𝑅2
��𝑥𝑥 − 𝑑𝑑2�
2+ 𝑅𝑅2�
32
(2.3)
where B1 and B2 are the magnetic fields from the first and second coils respectively, 𝜇𝜇0 is the
magnetic constant: 𝜇𝜇0 = 4𝜋𝜋 x 10−7 𝑇𝑇∙𝑚𝑚𝐴𝐴
, often referred to as the “permeability of free space”, I
18
is the current in the coils, in amperes, and R is the radius of the coils, in meters. Helmholtz coils,
however, typically consists of two coils with n-number of turns per coil; accounting for the
number of turns in the coils is rather simple, and can be done by multiplying the current term, I,
by the number of turns in the coil, n:
𝐵𝐵1 �
𝑑𝑑2� =
𝜇𝜇0 ∙ 𝑛𝑛 ∙ 𝐼𝐼 ∙ 𝑅𝑅2
2 ∙ �𝑅𝑅2 + �𝑅𝑅2�2�32
(2.4)
and
𝐵𝐵2 �
𝑑𝑑2� =
𝜇𝜇0 ∙ 𝑛𝑛 ∙ 𝐼𝐼 ∙ 𝑅𝑅2
2 ∙ �𝑅𝑅2 − �𝑅𝑅2�2�32
(2.5)
by the superposition principle mentioned earlier, the total magnetic field between the coils can
be described as a function of the distance from the midpoint of the coils x:
𝐵𝐵(𝑥𝑥) = 𝜇𝜇0 ∙ 𝑛𝑛 ∙ 𝐼𝐼 ∙ 𝑅𝑅2
2 ∙ ���𝑥𝑥 +
𝑑𝑑2�2
+ 𝑅𝑅2�−32
+ ��𝑥𝑥 −𝑑𝑑2�2
+ 𝑅𝑅2�−32� (2.6)
Noting that the most uniform field in a two-coil system is achieved when the distance between
the coils is equal to the radius of each coil, and through use of a minor shift – defining the
center of one coil at x = 0, and the midpoint between two coils becomes x = d/2 or x = R/2. By
utilizing symmetric relations, the equations can then be simplified to say that the magnetic field
at the center of the coil pair is equal to that of two times a single coil where the single coil B1 is
now:
𝐵𝐵1 �
𝑅𝑅2� =
𝜇𝜇0 ∙ 𝑛𝑛 ∙ 𝐼𝐼 ∙ 𝑅𝑅2
2 ∙ �𝑅𝑅2 + �𝑅𝑅2�2�32
(2.7)
19
and the magnetic field at the midpoint Bm is described as twice that:
𝐵𝐵𝑚𝑚 �
𝑅𝑅2� = 2 ∙ 𝐵𝐵1 ∙ �
𝑅𝑅2� =
2 ∙ 𝜇𝜇0 ∙ 𝑛𝑛 ∙ 𝐼𝐼 ∙ 𝑅𝑅2
2 ∙ �𝑅𝑅2 + �𝑅𝑅2�2�32
(2.8)
which simplifies to:
𝐵𝐵𝑚𝑚 �𝑅𝑅2� =
𝜇𝜇0 ∙ 𝑛𝑛 ∙ 𝐼𝐼 ∙ 𝑅𝑅2
�𝑅𝑅2 + 14𝑅𝑅
2�32
=𝜇𝜇0 ∙ 𝑛𝑛 ∙ 𝐼𝐼 ∙ 𝑅𝑅2
�54𝑅𝑅
2�32
= �45�32∙𝜇𝜇0 ∙ 𝑛𝑛 ∙ 𝐼𝐼
𝑅𝑅 (2.9)
20
CHAPTER 3
MATERIALS AND METHODS
This chapter provides a discussion about the nanoparticle and magnetic field exposure
methods and protocols, as well as descriptions of experimental instruments, setups, and
procedure for each analysis performed, from the beginning of cell culture, to the viability
assays, as well as confocal and fluorescence microscopy.
3.1 Cell Culture and Exposure Protocols
The CHO-K1 (ATCC® CCL-61™ Chinese hamster ovary, American Type Culture Collection
[ATCC], Manassas, VA) cell line was maintained in Kaighn's modification of Ham's F-12 medium
(F-12K Medium) supplemented with 10% volume fetal bovine serum (FBS) (ATCC® 30-2020™)
and 1% volume penicillin/streptomycin antibiotics (ATCC® 30-2300). Subculture procedure
followed the guidelines set forth by the manufacturer, modified slightly; cells were rinsed with
Hank’s Balanced Salt Solution (HBSS, Invitrogen-GIBCO, Waltham, MA), and the subculture ratio
used was 1:10, rather than the recommended 1:4, or 1:8 due to the very rapid proliferation rate
of the CHO-K1 cells. After the HBSS rinse, the adherent CHO cells were released from the
surface of the culture flask by incubation for 5 minutes with 1mL trypsin (Trypsin-EDTA
Solution, 1X (ATCC® 30-2101™), followed by dilution in 9mL full serum media. Cells were
incubated at 37 °C, 5% CO2 in a Heracell™150i CO2 incubator (Thermo Fisher Scientific Inc.,
Waltham, MA), in 75 cm2 cell culture flasks and 96-well plates for continued culture, and for
exposure conditions respectively. The pH level of the culture media was controlled by 5% CO2 in
the incubation chamber, in combination with sodium bicarbonate concentration (1,500mg/mL)
21
in media. For visualization of microtubule cytoskeleton, CHO cells were transfected with a
mEmerald-tubulin plasmid (a kind gift from Mr. Michael W. Davidson of the National High
Magnetic Field Laboratory at Florida State University, Tallahassee, FL) using Effectene
(#301425; Qiagen, Gaithersburg, MD) and maintained with G418 sulfate solution (#345812,
Calbiochem, Philadelphia, PA). The stable transfection of the CHO cell line was performed by Dr.
Marjorie Kuipers and provided as a generous gift from the U.S. Air Force Research Laboratories
(Fort Sam Houston, TX).
For all exposures, cells were harvested, counted, and viability assessed using the trypan
blue exclusion method using trypan blue 0.4% solution in phosphate buffered saline (PBS)
(Corning-MediaTech, Corning, NY) in an Invitrogen Countess automated cell counter (Eugene,
OR). Cells were then diluted into culture media and plated at 2 x 10⁵ cells/mL into 96 well plates
at 50 μL/well, giving approximately 1 x 10⁴ cells per well. Six hours after plating, the solutions in
each well were then supplemented with 50 μL of their respective nanoparticle-media dilute
solution, providing each well with a total of 100 μL solution for the duration of the exposure(s).
As pH value of cell culture media is critical to the optimal growth and development of the cell
culture [76,77], the pH value for each dilution was measured using an Orion™ 2-Star Benchtop
pH Meter (Fisher Scientific, Waltham, MA) to have values of 7.66-7.60 from complete cell
culture media, to highest nanoparticle dilution concentration, respectively. For microscopy
studies, cells were plated at 1x10⁶cells/mL in poly-D-lysine coated glass bottom, γ-irradiated,
35mm petri dishes ((Cat# P35GC-0-10-C, MatTek, Inc., Ashland, Massachusetts) with an initial
volume of 1.5 mL cell culture media, followed by the addition of 1.5 mL dilute nanoparticle-cell
culture media solution six hours later. This is a similar protocol as used for the 96-well plates
22
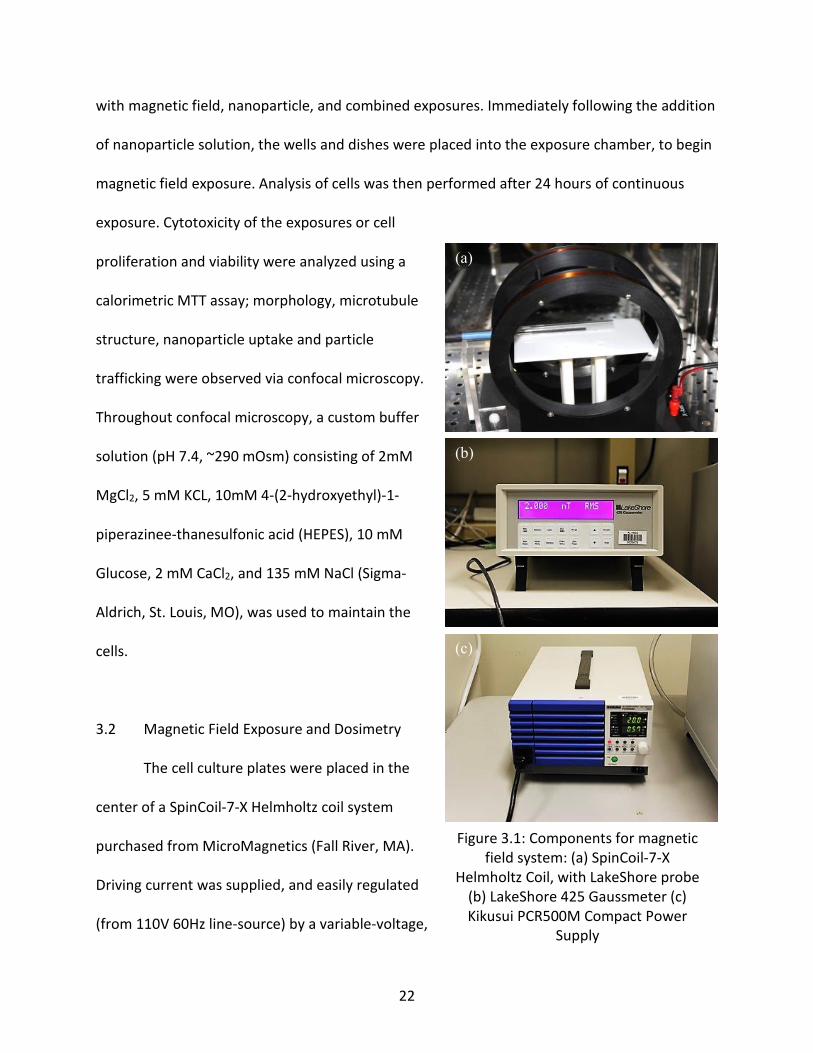
with magnetic field, nanoparticle, and combined exposures. Immediately following the addition
of nanoparticle solution, the wells and dishes were placed into the exposure chamber, to begin
magnetic field exposure. Analysis of cells was then performed after 24 hours of continuous
exposure. Cytotoxicity of the exposures or cell
proliferation and viability were analyzed using a
calorimetric MTT assay; morphology, microtubule
structure, nanoparticle uptake and particle
trafficking were observed via confocal microscopy.
Throughout confocal microscopy, a custom buffer
solution (pH 7.4, ~290 mOsm) consisting of 2mM
MgCl2, 5 mM KCL, 10mM 4-(2-hydroxyethyl)-1-
piperazinee-thanesulfonic acid (HEPES), 10 mM
Glucose, 2 mM CaCl2, and 135 mM NaCl (Sigma-
Aldrich, St. Louis, MO), was used to maintain the
cells.
3.2 Magnetic Field Exposure and Dosimetry
The cell culture plates were placed in the
center of a SpinCoil-7-X Helmholtz coil system
purchased from MicroMagnetics (Fall River, MA).
Driving current was supplied, and easily regulated
(from 110V 60Hz line-source) by a variable-voltage,
Figure 3.1: Components for magnetic field system: (a) SpinCoil-7-X
Helmholtz Coil, with LakeShore probe (b) LakeShore 425 Gaussmeter (c) Kikusui PCR500M Compact Power
Supply
(a)
(b)
(c)
23
variable-frequency Kikusui PCR500M Compact AC Power Supply (Kikusui Electronics
Corporation, Yokohama, Japan) shown in figure 3.1, allowing for precise control of the system
(0-270VAC, DC, 40-400Hz). A Helmholtz coil was selected as the desired magnetic field
generation configuration due to the mostly-uniform magnetic field generated over a reasonably
large area at the center of the coils [73,74,78]. The Helmholtz coil was placed inside a NuAire
Autoflow CO2 Water-Jacketed Incubator (NuAire Plymouth, MN), maintained at 37 °C, 5% CO2,
and power-supply run through an insulated port in the side of the chamber. The magnetic flux
density was measured at multiple points across the area through which cell culture plates were
exposed, using a Lakeshore 425 Gaussmeter and LakeShore Fiberglass Transverse Probe HMNT-
4E04-VR (LakeShore Cryotronics Inc Westerville, OH). The Helmholtz coil was powered for one
hour before cell culture-exposure began, allowing any heating and resistive change in the
circuit to occur prior to executing the experiment. There was no measurable temperature rise
within the exposure chamber, or region near cell culture during operation of the Helmholtz coil
system, however there was a minor change in current measured through the coil after 15-20
minutes of operation. The power to the coil was briefly cut off when inserting and removing
each cell culture dish, to prevent any unintended magnetic field effects on the particles as they
moved into, and through the field.
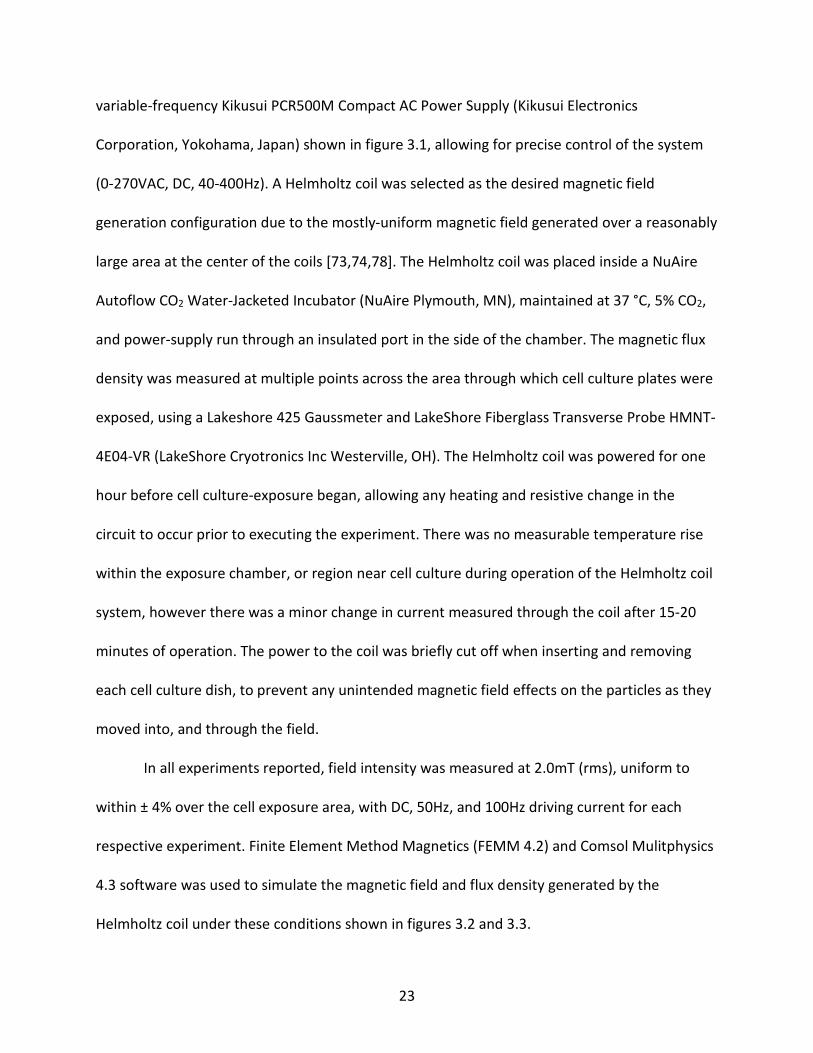
In all experiments reported, field intensity was measured at 2.0mT (rms), uniform to
within ± 4% over the cell exposure area, with DC, 50Hz, and 100Hz driving current for each
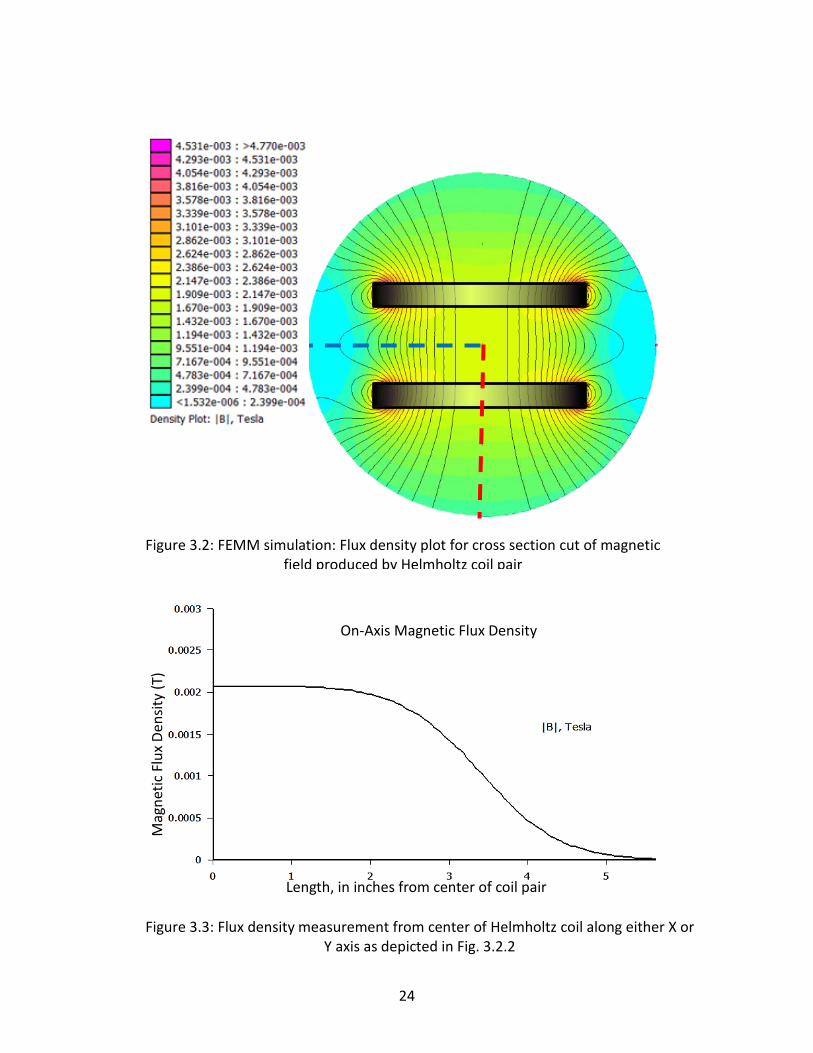
respective experiment. Finite Element Method Magnetics (FEMM 4.2) and Comsol Mulitphysics
4.3 software was used to simulate the magnetic field and flux density generated by the
Helmholtz coil under these conditions shown in figures 3.2 and 3.3.
24
Figure 3.2: FEMM simulation: Flux density plot for cross section cut of magnetic field produced by Helmholtz coil pair
Figure 3.3: Flux density measurement from center of Helmholtz coil along either X or Y axis as depicted in Fig. 3.2.2
Mag
netic
Flu
x De
nsity
(T)
Length, in inches from center of coil pair
On-Axis Magnetic Flux Density
25
Magnetic field parameters of 2.0mT, DC and 50Hz fields were selected because, as
referenced earlier, they have been frequently investigated for impact on cellular behavior [13–
16,23,25,60,79], and because 50Hz and 60Hz are common frequencies at which electric power
distribution lines operate worldwide [11,80,81]. Additionally, a DC field was selected to provide
insight about field interactions with the cells and particles, as compared to alternating
frequency effects. 100Hz frequency was selected to determine any specific frequency
dependent or frequency specific effects between 0Hz (DC), 50Hz, and 100Hz exposures. In
addition, the 100Hz frequency experiment was selected in order to gleam insight towards the
magnetic field-nanoparticle interactions, and to investigate if a higher frequency magnetic field
would have an increased effect on nanoparticle uptake, and cell survival. Based on the initial
study for 50Hz magnetic field, it was conceived that the magnetic field was interacting with the
particles such that it was causing a vibratory motion, causing the particles to force their way
into the cells, or somehow enhancing the cells’ ability to interact with the particles.
For all exposure conditions, a respective parallel sham experiment was performed and used as
a control group. Shams were placed in the same incubation chamber as the magnetic field-
exposed cells, at a distance such that the magnetic field generated by the Helmholtz coil was
negligible. This was possible due to the 1/r2 relation of magnetic field strength, where r is the
distance from a magnetic field source; the magnetic field strength falls off very rapidly away
from the source of the field, and therefore only a short distance outside of the coil system, the
magnetic field strength is negligible. This procedure worked to ensure that any potential
variability between additional environmental strain between the exposed group, and the
control group was related specifically to the magnetic field exposure, and
26
3.3 Nanoparticles and Characterization
Two sets of commercially available iron oxide particles were purchased for this
experiment, 10nm Fe3O4 particles dispersed in double-distilled water at a concentration of
5mg/mL from Cytodiagnostics (Burlington, Ontario, CA), and Rhodamine-B labeled 10nm Fe2O3
particles dispersed in DI water at a concentration of 1 mg/mL (Fe) from Ocean NanoTech
(Springdale, AR). The non-labeled particles were characterized through transmission electron
microscopy (TEM) dynamic light scattering (DLS) and zeta potential. Dynamic light scattering is
a non-destructive method for measuring size and size distribution of particles in a colloidal
solution. Zeta potential measurements can be used as an indicator of electrostatic repulsion
between the particles in a colloidal solution; the greater in magnitude the zeta potential
measurement, the more stable the particles in the colloidal solution should be. DLS, Zeta
Potential, and polydispersity index (PdI) measurements were all taken using a Zetasizer Nano
(Malvern Instruments Ltd, Malvern, Worcestershire, UK), system at the University of Texas, San
Antonio, with gracious assistance from Ms. Samantha Franklin). The polydispersity index (PdI) is
a measure of particle and agglomerate size distribution. Low PdI values indicate a very small
size distribution, while larger numbers indicate a very large size distribution. Very large values,
from 0.7-1 indicate that DLS may not provide very accurate measurements of particle size or
hydrodynamic diameter, due to the large size distribution of particle agglomerates.
27
TEM imaging, shown in figure 3.4, was performed with a 120kV PC Hitachi H-7600
controlled TEM (Hitachi Ltd. Chiyoda, Tokyo, Japan) and was provided courtesy of Elizabeth
Maurer-Gardner (Research Scientist, Materials Characterization Specialist AFRL, Dayton, OH).
Particle size was observed to be 10.97 ± 0.70 nm, based on the measurement of 50
independent nanoparticles. DLS and zeta potential characterization was performed for samples
of nanoparticle-water, and nanoparticle-media dilutions at concentrations of 50, and 200
μg/mL in water, and 50, 200, and 500 μg/mL in media, under conditions with and without 24
hour DC magnetic field exposure. These dilutions were chosen to get an understanding of how
the concentration of the particle dilution impacts agglomerate behavior under various
conditions. Based on other scientific reports, it was expected that the particles would
Figure 3.4: TEM imaging of Fe3O4 nanoparticles performed to verify spherical shape and particle size
28
agglomerate, due to protein-particle interaction in cell media, and the particles’ induced
magnetization when subject to the application of a large external magnetic field [36,45,82–86].
The zeta potential of the particles dispersed in water was that of a moderately stable
colloidal solution, with magnitude ranging from 16.2 to 38.2 mV, however the PdI was very high
for the lowest concentration of particles both with and without magnetic field exposure, at
0.94-0.96, indicating that the particles had begun to sediment and settle in the solution. The
average hydrodynamic diameter was measured at 1248nm and 518.2nm for the 50 μg/mL
concentration in water with and without magnetic field exposure respectively, indicating that
the average agglomerate size is larger with magnetic field exposure, even with sedimentation.
At the higher concentration of 200μg/mL the colloidal solution appeared to be more stable,
with PdI around 0.33-0.35, and average hydrodynamic diameter measurements in the expected
range of approximately 20nm and 50nm with and without magnetic field exposure respectively.
For particles dispersed in media, the zeta potential was measured significantly closer to
zero, or near-neutral, with magnitude ranging from 0.16 to 9.0 mV. A near-neutral zeta
potential indicates that the particles may agglomerate or coagulate fairly rapidly, however the
PdI measured for all but one sample, was measured below 0.7, indicating reliable size
measurements, or small size distribution of particle agglomerates. The hydrodynamic diameter,
PdI, and Zeta potential measurements for all samples are displayed in table 3.1 for all particle
dilution conditions. Of most importance to this study, are the magnitudes of zeta potential
measurements from particle-media dilution samples, which are all less than 10, with
hydrodynamic diameters ranging from 50nm – 1 μm when exposed to magnetic field.
29
The Rhodamine-B labeled particles were used for fluorescence microscopy experiments only,
and therefore were not a focus of characterization study. The manufacturer report indicates
that the Rhodamine-B labeled particles have a near-neutral zeta potential, and particle size of
10nm ± 2.5nm, with size distribution of ~10%. Ultimately, this difference between the
Rhodamine-B labeled particles and the non-labeled particles is not of great concern in this
particular study, as all statistically significant effects were observed at very high Fe3O4
concentrations, where the respective measurements in media closely reflect this same
behavior.
3.4 Cell Proliferation and Mitochondrial Function – MTT Assay
To assess cell mitochondrial function, and thereby viability or proliferation, a
calorimetric MTT (3-(4, 5-dimethylthiazolyl-2)-2, 5-diphenyltetrazolium bromide) assay was
used (ATCC ® 30-1010K™). In the MTT assay, a tetrazolium salt reagent is added to the cell
Sample Conditions ZP (mV) Size (nm) PdI
H2O 50 μg/mL No MF -16.2 518.2 0.96 H2O 50 μg/mL DC MF -32.3 1248 0.94
H2O 200 μg/mL No MF -33.4 48.78 0.355 H2O 200 μg/mL DC MF -38.2 19.75 0.333
Media 50 μg/mL No DC MF 0.167 37.44 0.524 Media 50 μg/mL DC MF -7.93 59.45 0.458
Media 200 μg/mL No DC MF -4.38 187.9 0.411 Media 200 μg/mL DC MF -7.09 146.2 0.289
Media 500 μg/mL No DC MF -9 473.5 0.656 Media 500 μg/mL DC MF -8.66 935.8 0.791
Table 3.1: Zetasizer nano measurements for various
Fe3O4 particle dilutions in H2O and media, with and without MF Exposure
30
culture, which is reduced by metabolically active cells, and converted to water-insoluble
formazan crystals, which appear dark blue or purple under inverted microscope [87]. The
microscope used for this study was the Leica DM IL inverted contrasting microscope (Leica
Microsystems Inc. Buffalo Grove, IL). After sufficient reaction time, a provided detergent
(ATCC® 30-1010K™) is added to the wells to dissolve the formazan into a solution with the cell
media. The absorbance of this solution is then measured; in this experiment a Synergy™ HT
Multi-Detection Microplate Reader (Biotek, Winooski, VT) was used. Using the aforementioned
culture methods, cells were plated at 2 x 10⁵ cells/mL into 96 well plates at 50μl/well, giving
approximately 1 x 10⁴ cells per well, and then exposed to each respective exposure condition
six hours later. After 24 hours of continuous exposure, the cell media and nanoparticles were
aseptically removed, and the wells were refilled with a mixture of 100μl full cell media, and
10μl MTT tetrazolium salt reagent. The cells were let sit for two hours (more than sufficient
time to observe the crystal formation under microscope) in the Heracell™150i CO2 incubator,
before 100μl of the detergent was added to each well to dissolve the formazan crystals. The
plates were then wrapped in aluminum foil, and placed on a MaxQ™ 3000 Benchtop Orbital
Shaker (Thermo Fisher Scientific Inc. Waltham, MA), at room temperature, overnight;
absorbance readings were taken the following morning. Background readings were taken from
wells that were treated identical to the experiment wells, with the exception that there were
no cells plated. These background cells allowed for analysis to consider any residual particles
that may have been left in the wells and their potential interference with the absorption
readings from the microplate reader. An effective dose (ED50) was calculated to determine the
31
concentration of the particles that successfully reduces the cell population to a fraction of half
the control value, after the exposure time is complete.
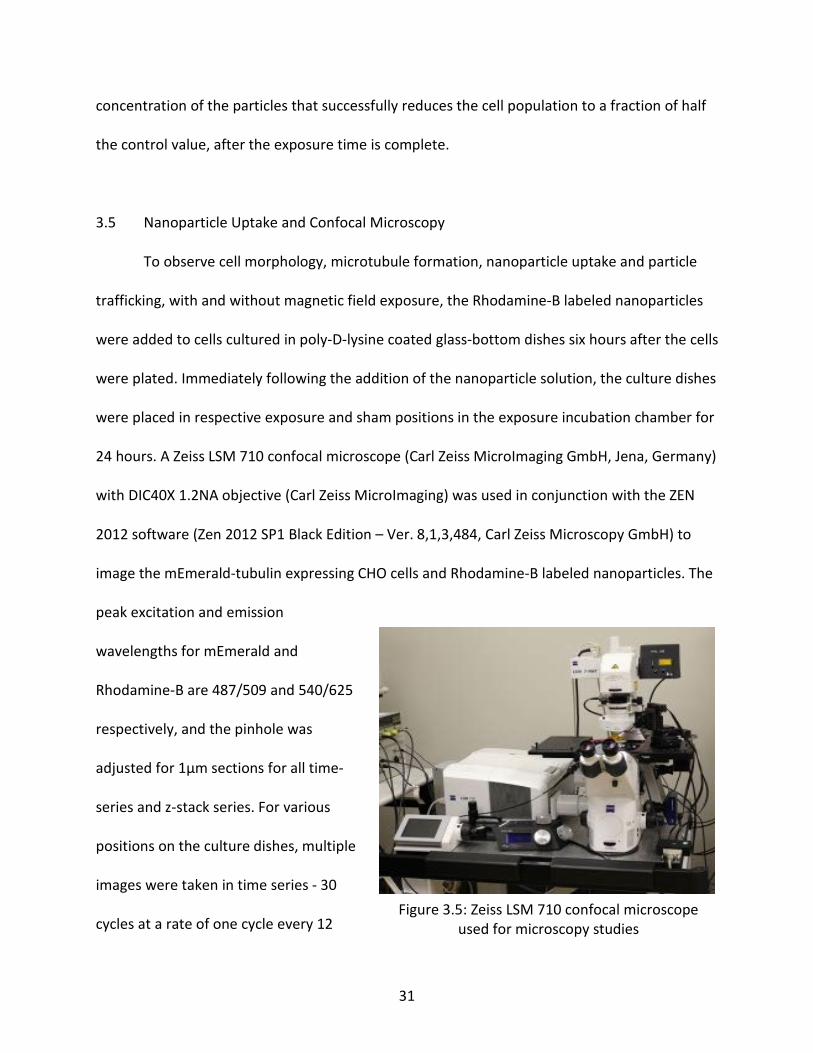
3.5 Nanoparticle Uptake and Confocal Microscopy
To observe cell morphology, microtubule formation, nanoparticle uptake and particle
trafficking, with and without magnetic field exposure, the Rhodamine-B labeled nanoparticles
were added to cells cultured in poly-D-lysine coated glass-bottom dishes six hours after the cells
were plated. Immediately following the addition of the nanoparticle solution, the culture dishes
were placed in respective exposure and sham positions in the exposure incubation chamber for
24 hours. A Zeiss LSM 710 confocal microscope (Carl Zeiss MicroImaging GmbH, Jena, Germany)
with DIC40X 1.2NA objective (Carl Zeiss MicroImaging) was used in conjunction with the ZEN
2012 software (Zen 2012 SP1 Black Edition – Ver. 8,1,3,484, Carl Zeiss Microscopy GmbH) to
image the mEmerald-tubulin expressing CHO cells and Rhodamine-B labeled nanoparticles. The
peak excitation and emission
wavelengths for mEmerald and
Rhodamine-B are 487/509 and 540/625
respectively, and the pinhole was
adjusted for 1μm sections for all time-
series and z-stack series. For various
positions on the culture dishes, multiple
images were taken in time series - 30
cycles at a rate of one cycle every 12 Figure 3.5: Zeiss LSM 710 confocal microscope
used for microscopy studies
32
seconds, for a total period of six minutes, to observe cell-nanoparticle interaction, intracellular
trafficking, and tubulin change. Single image acquisition of CHO cells with fluorescent tubulin
expression was done with a line step of one, and line average four to acquire clear images of
microtubule formations. Likewise, several series of images were taken at multiple focal points
from beneath the cells, to above cells, in order to compile a Z-stack profile of nanoparticle
location and distribution throughout the cell. Each series was comprised of approximately 25 to
35 images, depending on cell height, with an average interval of approximately 0.5μm, using
pinhole sections of 1μm to achieve Nyquist sampling. Mean fluorescence of cells exposed to
Rhodamine-B labeled nanoparticles was measured and compared between those subjected to
DC magnetic field exposure and those of sham exposure conditions. DC magnetic field was
selected for the microscopy study based on MTT results that displayed DC magnetic field
exposure to have the most prominent effect on cell viability. As microtubules have been
identified as playing a significant role in vesicular intracellular trafficking [88], CHO cells with
both mEmerald-tubulin expression and nanoparticle exposures were imaged after magnetic
field and sham exposure conditions, in an attempt to observe any changes in tubulin-
nanoparticle interaction, tubulin expression, and microtubule structure and formation. The
public domain Java-based program Fiji [89] was used for independent image and image-series
processing.

33
CHAPTER 4
RESULTS AND DISCUSSION
This chapter presents the results of the MTT viability assay and microscopy assessments
for the various conditions of nanoparticle and magnetic field exposures. Each case is presented
and considered, from independent conditions for the viability assay, to varying particle
concentration and field effects under microscopy. A brief discussion is presented on how the
data should be interpreted for the sake of this experiment.
4.1 Cell Viability: Proliferation and Mitochondrial Function – MTT Assay
The cytotoxicity of 10nm Fe3O4 nanoparticles was assessed by means of MTT assay, as
described in the previous chapter. The measurements for nanoparticle exposure without any
applied external magnetic field are displayed in figure 4.1.1, and as sham exposures in all
graphs. These results closely resemble those of other reported toxicity assessments for Fe3O4
particles [27,39,43], showing a minor increase in mitochondrial activity at very low doses
~10μg/mL, and significant reduction at extremely high concentrations, upward of 250μg/mL
and higher. Additional assays were performed for cells cultured under nanoparticle and
concurrent (DC, 50Hz, or 100Hz) magnetic field, or respective sham exposure conditions. The
ED50 value for nanoparticle (no magnetic field) exposure was calculated at 370μg/mL, which is
also in agreement with the previously mentioned studies. Statistical significance compared to
controls was determined using Student’s unpaired t-test with two-tailed P value < 0.05.
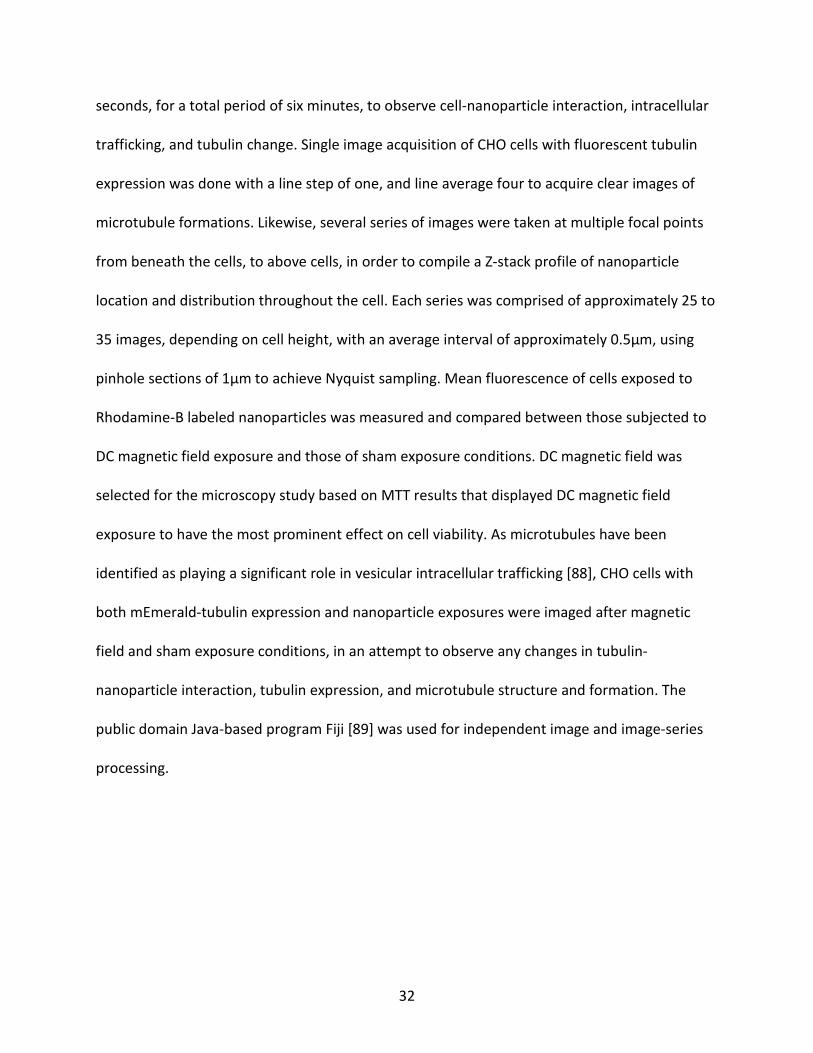
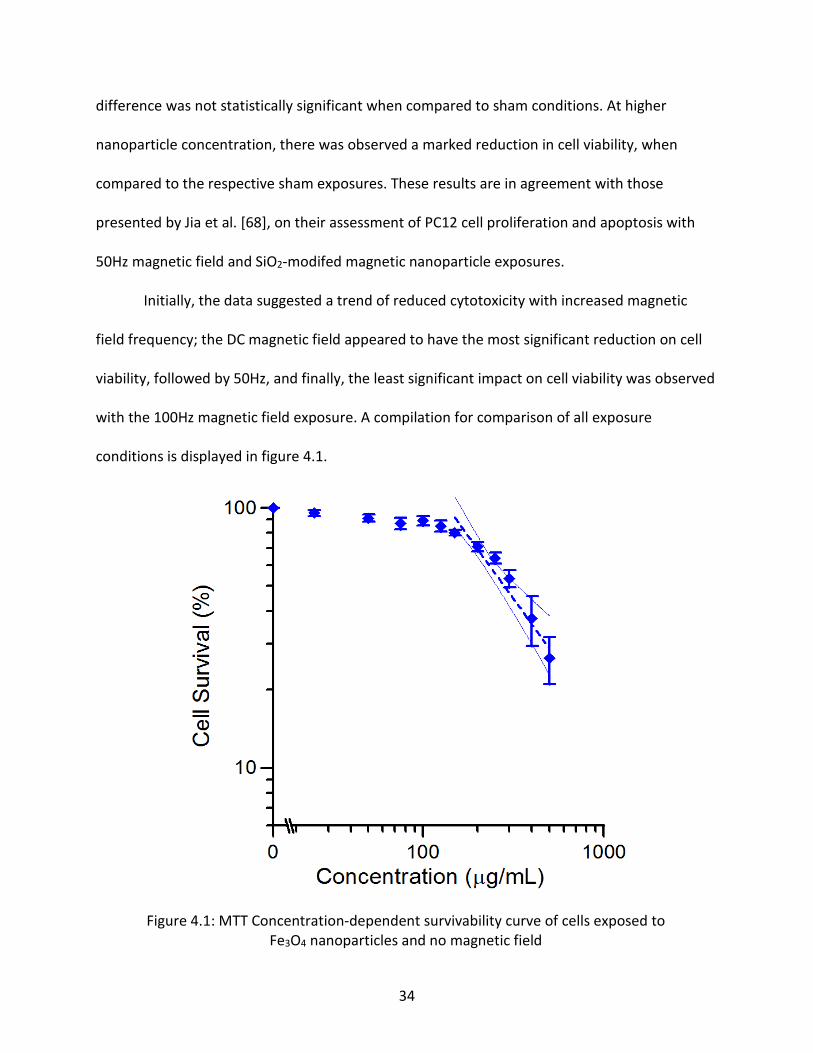
MTT assay results for the various magnetic field exposure conditions showed a minor
increase in viability at low Fe3O4 nanoparticle concentration in most trials; however the
34
difference was not statistically significant when compared to sham conditions. At higher
nanoparticle concentration, there was observed a marked reduction in cell viability, when
compared to the respective sham exposures. These results are in agreement with those
presented by Jia et al. [68], on their assessment of PC12 cell proliferation and apoptosis with
50Hz magnetic field and SiO2-modifed magnetic nanoparticle exposures.
Initially, the data suggested a trend of reduced cytotoxicity with increased magnetic
field frequency; the DC magnetic field appeared to have the most significant reduction on cell
viability, followed by 50Hz, and finally, the least significant impact on cell viability was observed
with the 100Hz magnetic field exposure. A compilation for comparison of all exposure
conditions is displayed in figure 4.1.
Figure 4.1: MTT Concentration-dependent survivability curve of cells exposed to Fe3O4 nanoparticles and no magnetic field
35
Upon further inspection and analysis, however, it was concluded that all three magnetic field
exposures have the same effect on the cells; the apparent decrease in toxicity with 100Hz
magnetic field exposure, compared to DC and 50Hz frequency conditions is likely the results of
a small variation in dilution for those exposure conditions introduced by pipette error. This
conclusion was drawn from data shown in figure 4.2-c; a graph showing the respective
difference in survival from exposure and sham conditions. The 100Hz delta curve follows almost
exactly the curves of the DC and 50Hz exposures, with a right-shift of one concentration value,
and peaks with the same trend. The ED50 of each exposure condition was calculated by
interpolation as 370μg/mL, 217μg/mL, 237.4μg/mL, and 303.3μg/mL for no magnetic field, DC,
50Hz, and 100Hz, respectively. The differences between ED50 for each magnetic field exposure
may yet again be attributed to the right-shift in delta mentioned previously. Due to the
prominence of the DC field on cytotoxicity and cell viability measurements in the initial studies,
all fluorescence and microscopy studies were performed with DC magnetic field exposure
conditions in an attempt to investigate the cellular physiology effects of the exposures.
4.2 Cell Morphology, Nanoparticle Uptake and Confocal Microscopy
CHO cells with mEmerald-tubulin expression were observed under live-confocal
microscopy to examine cell morphology, microtubule distribution, nanoparticle uptake, and
nanoparticle trafficking after 24-hour exposure to four unique conditions. Exposures were
performed at 50 and 250 μg/mL Rhodamine-B labeled nanoparticle concentrations, with and
without DC magnetic field. The different nanoparticle concentrations were selected to
determine if there was a direct impact on cellular uptake with respect to increased particle

36
concentration, while exposure to magnetic field and sham conditions were established to
observe any possible changes in cell morphology, orientation or directionality, and microtubule
network, as a result of magnetic field exposure.
(a) (b)
(d) (c)
Figure 4.2: MTT Concentration-dependent survivability curves for cells exposed to Fe3O4 nanoparticles and (a) DC magnetic field, (b) 50Hz magnetic field (c) 100Hz
magnetic field, and (d) the respective Δ from sham conditions. The greyed section represents the area beyond the ED50 for cells not exposed to magnetic fields. Sham
exposure Δ measured against trials in an independent incubator.
37
Bright field imaging revealed no evident change in morphology between cells exposed
to DC magnetic field and sham conditions. In both cases, the cells were observed in various
shapes, sizes, and formations. Many cells, as displayed in figure 4.2.1 were observed to have
three extensions away from their nuclei, towards distal focal adhesion points, but with no
particular favor of directionality with or without magnetic field exposure. Likewise, confocal
fluorescence microscopy using the mEmerald-tubulin expression shown in figure 4.1-b and 4.2-
b revealed no change in microtubule distribution or direction between exposure conditions.
While there was no change in microtubule orientation, the images also give an idea of nuclear
height within the cells; there are very few cells with microtubules observed underneath the
perinuclear region of the cells (observed as dark circular formations toward the center of each
cell), indicating that there is no change in nuclear height between magnetic field exposure
conditions.
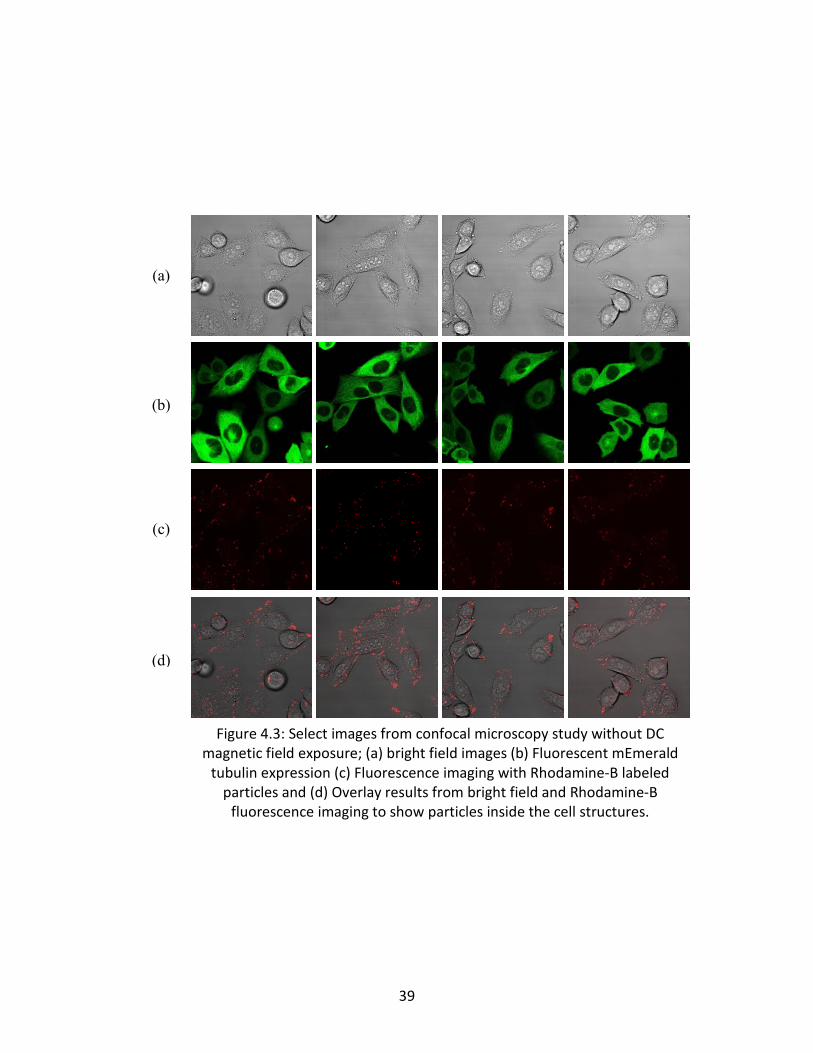
Mean fluorescence intensity (MFI) from Rhodamine-B in the cells was measured to
quantify nanoparticle uptake at both concentrations, under DC magnetic field and sham
exposure conditions. Cells under concurrent DC magnetic field and nanoparticle exposure were
measured to have a significantly greater MFI than that of cells exposed to nanoparticles alone,
shown in figures 4.3 and 4.4. At lower particle concentrations, the difference in MFI between
DC field exposure and sham was much greater when compared to the difference in MFI at the
higher nanoparticle concentration. Jiang, et al. have previously reported size dependent effects
of nanoparticles on cellular uptake, showing that smaller particles of ~10nm coat cell
membrane surfaces before triggering endocytosis, while larger particles (or in this case
agglomerates) of ~100nm or larger more readily trigger uptake [47,49,90]. The drastic contrast
38
at lower concentration may therefore be attributed to agglomeration effects and the size
distributions observed at lower concentrations– DLS measurements of the particle-media
solutions showed large hydrodynamic diameters up to 1μm at the concentration of 50 μg/mL.
Multiple images taken over time-series showed intracellular trafficking of nanoparticle clusters;
however, no quantification method was readily available to determine if there was a difference
in the rate of trafficking between cells exposed to magnetic field exposed cells, and those not
exposed. This is discussed further in the final section of this thesis.
39
(a)
(b)
(c)
(d)
Figure 4.3: Select images from confocal microscopy study without DC magnetic field exposure; (a) bright field images (b) Fluorescent mEmerald
tubulin expression (c) Fluorescence imaging with Rhodamine-B labeled particles and (d) Overlay results from bright field and Rhodamine-B
fluorescence imaging to show particles inside the cell structures.
40
(a)
(b)
(c)
(d)
Figure 4.4: Select images from confocal microscopy study after DC magnetic field exposure; (a) bright field images (b) Fluorescent mEmerald
tubulin expression (c) Fluorescence imaging with Rhodamine-B labeled particles and (d) Overlay results from bright field and Rhodamine-B
fluorescence imaging to show particles inside the cell structures.
41
Figure 4.6: Mean fluorescence intensity of cells measured with, and without DC magnetic field exposure at 50 ug/mL
nanoparticle concentration
0
2
4
6
8
10
12
14
16
No MF Exposure MF Exposed
Fluo
resc
ence
Uni
ts (A
rb)
Mean Fluorescence Intensity 50 μg/mL
***
0
10
20
30
40
50
No MF Exposure MF Exposure
Fluo
resc
ence
Uni
ts (A
rb)
Mean Fluorescence Intensity 250 μg/mL
**
Figure 4.5: Mean fluorescence intensity of cells measured with, and without DC magnetic field exposure at 250 μg/mL
nanoparticle concentration
42
CHAPTER 5
CONCULSIONS AND FUTURE DIRECTION
5.1 Conclusions
A study was performed to investigate the biological impact of concurrent exposure to
magnetic nanoparticles and extremely-low frequency magnetic fields (ELF-MF) using an in-vitro
CHO-K1 cell line model. Protocols were established for in-vitro nanoparticle, magnetic field, and
concurrent exposure, specifically for DC, 50Hz, and 100Hz 2.0mT magnetic fields, and 10nm
Fe3O4 nanoparticles. The investigation focused primarily on comparative analysis of concurrent
exposures against independent controls, to investigate cell viability and recovery through
mitochondrial activity measurement via MTT assay, immediately following continuous exposure
for 24 hours. The magnetic fields were generated by the application of a precisely controlled
driving current through a Helmholtz coil system, in an environment-control incubation
chamber. In all experiments reported, magnetic field intensity was measured at 2.0mT (rms),
uniform to within ± 4% over the cell exposure area. MTT assay results indicated a significant
decrease in cell viability between each magnetic field exposure condition, and respective sham
at high nanoparticle concentrations. It was concluded that there was little to no effect between
applied field frequencies, with only minor changes in cytotoxicity, or change in cell viability
measurements with each respective field. It is worth mentioning that cells exposed to the DC,
50Hz, and 100Hz magnetic fields without nanoparticle exposure did exhibit an increase in MTT
measurement, as compared to their respective sham exposures; this difference is likely due to
an increase in total cell number by magnetic-field related stimulus on proliferation rate. Further
43
investigation is most certainly required to gleam a better understanding of the mechanisms
behind this effect, as magnetic field interactions with cells are still not well known.
Confocal microscopy of the cells under concurrent nanoparticle and magnetic field
exposure revealed no apparent changes in cell morphology or cytoskeletal structure between
applied magnetic field, and no-field conditions. Fluorescence microscopy on the CHO cells with
fluorescent tubulin expression also revealed no change between exposure conditions. The
absence of effect on tubulin expression is contradictory to reports of 50Hz magnetic field effect
on tubulin expression in SH-SY5Y cell models reported by Cerrato, et al. [16]. This may be
attributed to the difference in cell line, or exposure time; additional studies are warranted to
investigate field effect on tubulin expression between cell lines.
There was a measured change in nanoparticle uptake, with regard to applied magnetic
field; a higher mean fluorescence was measured in cells subject to magnetic field exposure, as
compared to the respective no-field conditions. This effect was observed at both high and low
particle concentrations, but was more significant at lower concentrations. These results can be
used to confirm the impact of nanoparticle concentration and agglomeration effects on cellular
uptake. Intracellular trafficking of nanoparticle clusters was observed with all exposure
conditions; however no quantification method was available to determine if there was a
difference in the rate and directions of trafficking.
5.2 Recommendations and Future Directions for Investigation
With the current investigation methods, it is not possible to know the exact method of
endocytosis, or storage and trafficking of the nanoparticles once they have been taken up into

44
the cells. By changing the label on the nanoparticles, and systematically selecting alternative
photoactive tags for cell proteins, such as the lysosomal-associated membrane protein 1
(LAMP1), and Tetramethylrhodamine (TRITC), co-localization of the particles and lysosome
structures may be observed. Additionally, inhibitory drugs that interfere with specific pathways
may be systematically selected and administered to the cells to identify the particular uptake
mechanisms involved with these particles.
While there was no observed effect on cell viability between the DC, 50Hz, and 100Hz
magnetic fields, that is not to say that there are no proteomic or genomic changes within the
cells between these, and other applied external magnetic field frequencies. A brief investigation
into reactive oxygen species (ROS) or Interleukin 6 (IL-6) as an indicator of cellular stress and
inflammatory response, in addition to an assay to reveal caspase 3/7 activities could provide
some insight into the cause of changes in mitochondrial function reported via MTT assay. As the
mechanisms behind magnetic field and cell interactions are still not well known, further in-
depth studies could be developed to investigate individual proteomic and genomic expression
within the cells exposed to various magnetic field conditions, similar to the analyses reported
by Falone et al., and Hasanzadeh, et al. [14,15] with SH-SY5Y neuroblastoma cell lines exposed
to 50Hz magnetic fields for 3 hours.
Ultimately, there are near infinitely many variations available for experimentation from
field specifics such as frequency, intensity, and direction, along with dynamic and moving fields
or static field gradients, as well as nanoparticle size, shape, composition, fabrication method,
and time duration of each related exposure. An important and more impactful direction to
focus future efforts would be on bridging the gap in knowledge between the specific
45
mechanisms behind the magnetic field interactions with cells, to better understand why
different cell types have different responses to the same exposure conditions, and how to take
advantage of said mechanisms. Future applications of these advantages may be developed to
eliminate deleterious effects, and enhance desirable or salubrious effects in medical,
commercial, and military applications.
46
REFERENCES
[1] Blackman C., Benane S., and House D., 1993, “Evidence for direct effect of magnetic fields on neurite outgrowth,” The FASEB journal, 7(9), pp. 801–806.
[2] Berg H., 1999, “Problems of weak electromagnetic field effects in cell biolog,” Bioelectrochem Bioenerg, 48(2), pp. 355–60.
[3] Gustavsson M., Lindgren M., Galt S., and Hamnerius Y., 1999, “Independently replicated biological effects of ELF electromagnetic fields: a literature study,” Electricity and Magnetism in Biology and Medicine, Springer, pp. 979–982.
[4] Ding G.-R., Nakahara T., and Miyakoshi J., 2003, “Induction of kinetochore-positive and kinetochore-negative micronuclei in CHO cells by ELF magnetic fields and/or X-rays,” Mutagenesis, 18(5), pp. 439–443.
[5] Simkó M., Kriehuber R., Weiss D. G., and Luben R. A., 1998, “Effects of 50 Hz EMF exposure on micronucleus formation and apoptosis in transformed and nontransformed human cell lines,” Bioelectromagnetics, 19(2), pp. 85–91.
[6] Cadossi R., Bersani F., Cossarizza A., Zucchini P., Emilia G., Torelli G., and Franceschi C., 1992, “Lymphocytes and low-frequency electromagnetic fields,” The FASEB Journal, 6(9), pp. 2667–2674.
[7] Walleczek J., and Budinger T. F., 1992, “Pulsed magnetic field effects on calcium signaling in lymphocytes: dependence on cell status and field intensity,” FEBS Lett., 314(3), pp. 351–5.
[8] Goodman R., and Henderson A. S., 1988, “Exposure of salivary gland cells to low-frequency electromagnetic fields alters polypeptide synthesis,” Proceedings of the National Academy of Sciences, 85(11), pp. 3928–3932.
[9] Goodman R., Weisbrot D., Uluc A., and Henderson A., 1992, “Transcription in Drosophila melanogaster salivary gland cells is altered following exposure to low-frequency electromagnetic fields: Analysis of chromosome 3R,” Bioelectromagnetics, 13(2), pp. 111–118.
[10] Balcer-Kubiczek E. K., Harrison G., Davis C. C., Haas M. L., and Koffman B. H., 2000, “Expression analysis of human HL60 cells exposed to 60 Hz square-or sine-wave magnetic fields." Radiat. Res., 153(5 Pt 2), pp. 670–8
[11] Portier C. J., and Wolfe M. S., 1998, “Assessment of health effects from exposure to power-line frequency electric and magnetic fields,” NIH Publication, 98, p. 3981.
47
[12] Zhang Y., Ding J., and Duan W., 2006, “A study of the effects of flux density and frequency of pulsed electromagnetic field on neurite outgrowth in PC12 cells,” Journal of biological physics, 32(1), pp. 1–9.
[13] Pozzi D., Grimaldi S., Ledda M., De Carlo F., Modesti A., Scarpa S., Foletti A., and Lisi A., 2007, “Effect of 50 Hz Magnetic Field exposure on Neuroblastoma Morphology,” IJIB, 1, pp. 12–16.
[14] Hasanzadeh H., Rezaie-Tavirani M., Seyyedi S. S., Zali H., Keshel S. H., Jadidi M., and Abedelahi A., 2014, “Effect of ELF-EMF Exposure on Human Neuroblastoma Cell Line: a Proteomics Analysis,” Iranian journal of cancer prevention, 7(1), p. 22.
[15] Falone S., Sulpizio M., Angelucci S., Marchisio M., Di Giuseppe F., Eleuterio E., Di Ilio C., and Amicarelli F., “Extremely low frequency magnetic field-induced effects on cell biology and proteome expression of a human neuroblastoma cell line.”
[16] Cerrato C., Cialdai F., and Monici M., 2011, “Effects of Low Frequency Electromagnetic Fields on SHSY5Y cells-a neuroblast model,” Energy for Health, 8, pp. 18–24.
[17] Markkanen A., Juutilainen J., and Naarala J., 2008, “Pre-exposure to 50 Hz magnetic fields modifies menadione-induced DNA damage response in murine L929 cells,” International journal of radiation biology, 84(9), pp. 742–751.
[18] Luukkonen J., Liimatainen A., Hӧytӧ A., Juutilainen J., and Naarala J., 2011, “Pre-exposure to 50 Hz magnetic fields modifies menadione-induced genotoxic effects in human SH-SY5Y neuroblastoma cells,” PLoS One, 6(3), p. e18021.
[19] Vianale G., Reale M., Amerio P., Stefanachi M., Di Luzio S., and Muraro R., 2008, “Extremely low frequency electromagnetic field enhances human keratinocyte cell growth and decreases proinflammatory chemokine production,” British Journal of Dermatology, 158(6), pp. 1189–1196.
[20] McFarlane E. H., Dawe G. S., Marks M., and Campbell I. C., 2000, “Changes in neurite outgrowth but not in cell division induced by low EMF exposure: influence of field strength and culture conditions on responses in rat PC12 pheochromocytoma cells,” Bioelectrochemistry, 52(1), pp. 23–28.
[21] Miyata H., Ishizawa K., Ishido M., Sugawara K., Murase M., and Hondou T., 2012, “The effect of a 50-Hz sinusoidal magnetic field on nitric oxide (NO) production by human umbilical vein endothelial cells (HUVECs),” Journal of Physics: Conference Series, p. 012006.

48
[22] Consales C., Merla C., Marino C., and Benassi B., 2012, “Electromagnetic fields, oxidative stress, and neurodegeneration,” International journal of cell biology, 2012.
[23] Prijic S., Scancar J., Cemazar M., Bregar V. B., Znidarsic A., Sersa G., and others, 2010, “Increased cellular uptake of biocompatible superparamagnetic iron oxide nanoparticles into malignant cells by an external magnetic field,” The Journal of membrane biology, 236(1), pp. 167–179.
[24] Comfort K. K., Maurer E. I., and Hussain S. M., 2013, “The biological impact of concurrent exposure to metallic nanoparticles and a static magnetic field,” Bioelectromagnetics, 34(7), pp. 500–511.
[25] Ahmadianpour M. R., Abdolmaleki P., Mowla S. J., and Hosseinkhani S., 2013, “Static magnetic field of 6 mT induces apoptosis and alters cell cycle in p53 mutant Jurkat cells,” Electromagnetic biology and medicine, 32(1), pp. 9–19.
[26] Mahmoudi M., Sant S., Wang B., Laurent S., and Sen T., 2011, “Superparamagnetic iron oxide nanoparticles (SPIONs): development, surface modification and applications in chemotherapy,” Advanced drug delivery reviews, 63(1), pp. 24–46.
[27] Mahmoudi M., Simchi A., Milani A., and Stroeve P., 2009, “Cell toxicity of superparamagnetic iron oxide nanoparticles,” Journal of colloid and interface science, 336(2), pp. 510–518.
[28] Buzea C., Pacheco I. I., and Robbie K., 2007, “Nanomaterials and nanoparticles: sources and toxicity,” Biointerphases, 2(4), p. 55 p.
[29] Markides H., Rotherham M., and El Haj A., 2012, “Biocompatibility and toxicity of magnetic nanoparticles in regenerative medicine,” Journal of Nanomaterials, 2012, p. 13.
[30] Singh N., Jenkins G. J., Asadi R., and Doak S. H., 2010, “Potential toxicity of superparamagnetic iron oxide nanoparticles (SPION),” Nano reviews, 1.
[31] Mukhopadhyay A., Grabinski C., Afrooz A. N., Saleh N. B., and Hussain S., 2012, “Effect of gold nanosphere surface chemistry on protein adsorption and cell uptake in vitro,” Applied biochemistry and biotechnology, 167(2), pp. 327–337.
[32] Braydich-Stolle L., Hussain S., Schlager J. J., and Hofmann M.-C., 2005, “In vitro cytotoxicity of nanoparticles in mammalian germline stem cells,” Toxicological sciences, 88(2), pp. 412–419.
[33] Prabhu B. M., Ali S. F., Murdock R. C., Hussain S. M., and Srivatsan M., 2010, “Copper nanoparticles exert size and concentration dependent toxicity on somatosensory neurons
49
of rat,” Nanotoxicology, 4(2), pp. 150–160.
[34] Hughes S., McBain S., Dobson J., and El Haj A. J., 2008, “Selective activation of mechanosensitive ion channels using magnetic particles,” Journal of The Royal Society Interface, 5(25), pp. 855–863.
[35] Tseng P., Judy J. W., and Di Carlo D., 2012, “Magnetic nanoparticle-mediated massively parallel mechanical modulation of single-cell behavior,” Nature methods, 9(11), pp. 1113–1119.
[36] Skebo J. E., Grabinski C. M., Schrand A. M., Schlager J. J., and Hussain S. M., 2007, “Assessment of metal nanoparticle agglomeration, uptake, and interaction using high-illuminating system,” International journal of toxicology, 26(2), pp. 135–141.
[37] Fanelli C., Coppola S., Barone R., Colussi C., Gualandi G., Volpe P., and Ghibelli L., 1999, “Magnetic fields increase cell survival by inhibiting apoptosis via modulation of Ca2+ influx,” The FASEB Journal, 13(1), pp. 95–102.
[38] Zhang E., Kircher M. F., Koch M., Eliasson L., Goldberg S. N., and Renström E., 2014, “Dynamic magnetic fields remote-control apoptosis via nanoparticle rotation,” ACS nano, 8(4), pp. 3192–3201.
[39] Hussain S., Hess K., Gearhart J., Geiss K., and Schlager J., 2005, “In vitro toxicity of nanoparticles in BRL 3A rat liver cells,” Toxicology in vitro, 19(7), pp. 975–983.
[40] Comfort K. K., Maurer E. I., Braydich-Stolle L. K., and Hussain S. M., 2011, “Interference of silver, gold, and iron oxide nanoparticles on epidermal growth factor signal transduction in epithelial cells,” ACS nano, 5(12), pp. 10000–10008.
[41] Braidy N., Poljak A., Marjo C., Rutlidge H., Rich A., Jayasena T., Inestrosa N. C., and Sachdev P., 2014, “Metal and complementary molecular bioimaging in Alzheimer’s disease,” Front Aging Neurosci, 6, p. 138.
[42] Mahmoudi M., Hofmann H., Rothen-Rutishauser B., and Petri-Fink A., 2011, “Assessing the in vitro and in vivo toxicity of superparamagnetic iron oxide nanoparticles,” Chemical reviews, 112(4), pp. 2323–2338.
[43] Bae J.-E., Huh M.-I., Ryu B.-K., Do J.-Y., Jin S.-U., Moon M.-J., Jung J.-C., Chang Y., Kim E., Chi S.-G., and others, 2011, “The effect of static magnetic fields on the aggregation and cytotoxicity of magnetic nanoparticles,” Biomaterials, 32(35), pp. 9401–9414.
[44] Yang W. J., Lee J. H., Hong S. C., Lee J., Lee J., and Han D.-W., 2013, “Difference between toxicities of iron oxide magnetic nanoparticles with various surface-functional groups against human normal fibroblasts and fibrosarcoma cells,” Materials, 6(10), pp. 4689–
50
4706.
[45] Teja A. S., and Koh P.-Y., 2009, “Synthesis, properties, and applications of magnetic iron oxide nanoparticles,” Progress in crystal growth and characterization of materials, 55(1), pp. 22–45.
[46] El Ghandoor H., Zidan H., Khalil M. M., and Ismail M., 2012, “Synthesis and some physical properties of magnetite (Fe3O4) nanoparticles,” Int. J. Electrochem. Sci, 7, pp. 5734–5745.
[47] Jiang X., Röcker C., Hafner M., Brandholt S., Dörlich R. M., and Nienhaus G. U., 2010, “Endo-and exocytosis of zwitterionic quantum dot nanoparticles by live HeLa cells,” ACS nano, 4(11), pp. 6787–6797.
[48] Shang L., Nienhaus K., Jiang X., Yang L., Landfester K., Mailänder V., Simmet T., and Nienhaus G. U., 2014, “Nanoparticle interactions with live cells: Quantitative fluorescence microscopy of nanoparticle size effects,” Beilstein journal of nanotechnology, 5(1), pp. 2388–2397.
[49] Wang T., Bai J., Jiang X., and Nienhaus G. U., 2012, “Cellular uptake of nanoparticles by membrane penetration: a study combining confocal microscopy with FTIR spectroelectrochemistry,” ACS nano, 6(2), pp. 1251–1259.
[50] Chithrani B. D., Ghazani A. A., and Chan W. C., 2006, “Determining the size and shape dependence of gold nanoparticle uptake into mammalian cells,” Nano letters, 6(4), pp. 662–668.
[51] Rejman J., Oberle V., Zuhorn I., and Hoekstra D., 2004, “Size-dependent internalization of particles via the pathways of clathrin-and caveolae-mediated endocytosis,” Biochem. J, 377, pp. 159–169.
[52] Nativo P., Prior I. A., and Brust M., 2008, “Uptake and intracellular fate of surface-modified gold nanoparticles,” ACS nano, 2(8), pp. 1639–1644.
[53] Labhasetwar V., Song C., Humphrey W., Shebuski R., and Levy R. J., 1998, “Arterial uptake of biodegradable nanoparticles: effect of surface modifications,” Journal of pharmaceutical sciences, 87(10), pp. 1229–1234.
[54] Kim J. A., Åberg C., Salvati A., and Dawson K. A., 2012, “Role of cell cycle on the cellular uptake and dilution of nanoparticles in a cell population,” Nat Nanotechnol, 7(1), pp. 62–8.
[55] Shapero K., Fenaroli F., Lynch I., Cottell D. C., Salvati A., and Dawson K. A., 2011, “Time and space resolved uptake study of silica nanoparticles by human cells,” Molecular
51
Biosystems, 7(2), pp. 371–378.
[56] Glaser R., 1992, “Current concepts of the interaction of weak electromagnetic fields with cells,” Bioelectrochemistry and bioenergetics, 27(3), pp. 255–268.
[57] Tenuzzo B., Vergallo C., and Dini L., 2009, “Effect of 6mT static magnetic field on the bcl-2, bax, p53 and hsp70 expression in freshly isolated and in vitro aged human lymphocytes,” Tissue and Cell, 41(3), pp. 169–179.
[58] Godman R., Bumann J., Wei L.-X., and Shirley-Henderson A., 1992, “Exposure of human cells to electromagnetic fields: Effect of time and field strength on transcript levels,” Electromagnetic Biology and Medicine, 11(1), pp. 19–28.
[59] Blackman C. F., House D. E., and Blanchard J. P., 1996, “Nonbinomial distributions of relative neurite outgrowth in PC-12 cells,” Bioelectromagnetics, 17(6), pp. 512–515.
[60] Gamboa O., Gutiérrez P., Alcalde I., De la Fuente I., and Gayoso M., 2007, “Absence of relevant effects of 5 mT static magnetic field on morphology, orientation and growth of a rat Schwann cell line in culture.”
[61] Santini M., Ferrante A., Rainaldi G., Indovina P., and Indovina P., 2005, “Extremely low frequency (ELF) magnetic fields and apoptosis: a review,” International Journal of Radiation Biology, 81(1), pp. 1–11.
[62] Santini M. T., Rainaldi G., and Indovina P. L., 2009, “Cellular effects of extremely low frequency (ELF) electromagnetic fields,” International journal of radiation biology, 85(4), pp. 294–313.
[63] Huang H., Delikanli S., Zeng H., Ferkey D. M., and Pralle A., 2010, “Remote control of ion channels and neurons through magnetic-field heating of nanoparticles,” Nature nanotechnology, 5(8), pp. 602–606.
[64] Bordelon D. E., Goldstein R. C., Nemkov V. S., Kumar A., Jackowski J. K., DeWeese T. L., and Ivkov R., 2012, “Modified solenoid coil that efficiently produces high amplitude AC magnetic fields with enhanced uniformity for biomedical applications,” Magnetics, IEEE Transactions on, 48(1), pp. 47–52.
[65] Yamaguchi M., Ito A., Ono A., Kawabe Y., and Kamihira M., 2013, “Heat-inducible gene expression system by applying alternating magnetic field to magnetic nanoparticles,” ACS synthetic biology, 3(5), pp. 273–279.
[66] Goya G., Grazu V., and Ibarra M., 2008, “Magnetic nanoparticles for cancer therapy,” Current Nanoscience, 4(1), pp. 1–16.
52
[67] Mamiya H., 2013, “Recent advances in understanding magnetic nanoparticles in AC magnetic fields and optimal design for targeted hyperthermia,” Journal of Nanomaterials, 2013.
[68] JIA H. L., Chao W., Yue L., Yan L., WANG P. P., PAN W. D., and Tao S., 2014, “Combined effects of 50 Hz magnetic field and magnetic nanoparticles on the proliferation and apoptosis of PC12 cells,” Biomedical and Environmental Sciences, 27(2), pp. 97–105.
[69] Shen H., Tong S., Bao G., and Wang B., 2014, “Structural responses of cells to intracellular magnetic force induced by superparamagnetic iron oxide nanoparticles,” Physical Chemistry Chemical Physics, 16(5), pp. 1914–1920.
[70] González L. M., Ruder W. C., Leduc P. R., and Messner W. C., 2014, “Controlling magnetotactic bacteria through an integrated nanofabricated metallic island and optical microscope approach,” Scientific reports, 4.
[71] Dobson J., 2008, “Remote control of cellular behaviour with magnetic nanoparticles,” Nature nanotechnology, 3(3), pp. 139–143.
[72] Kirschvink J. L., 1992, “Uniform magnetic fields and double-wrapped coil systems: Improved techniques for the design of bioelectromagnetic experiments,” Bioelectromagnetics, 13(5), pp. 401–411.
[73] Cvetkovic D., and Cosic I., 2007, “Modelling and design of extremely low frequency uniform magnetic field exposure apparatus for in vivo bioelectromagnetic studies,” Engineering in Medicine and Biology Society, 2007. EMBS 2007. 29th Annual International Conference of the IEEE, pp. 1675–1678.
[74] DeTroye D. J., and Chase R. J., 1994, “The Calculation and Measurement of Helmholtz Coil Fields.”
[75] Griffiths D. J., and College R., 1999, Introduction to electrodynamics, Prentice Hall Upper Saddle River, NJ.
[76] Li F., Vijayasankaran N., Shen A., Kiss R., and Amanullah A., 2010, “Cell culture processes for monoclonal antibody production,” MAbs, pp. 466–479.
[77] Oguchi S., Saito H., Tsukahara M., and Tsumura H., 2006, “pH Condition in temperature shift cultivation enhances cell longevity and specific hMab productivity in CHO culture,” Cytotechnology, 52(3), pp. 199–207.
[78] Bhatt V., Rautela R., Sharma P., Tiwari D., and Khushu S., “Design \& Development of Helmholtz Coil for Hyperpolarized MRI.”
53
[79] Ghodbane S., Lahbib A., Sakly M., and Abdelmelek H., 2013, “Bioeffects of static magnetic fields: oxidative stress, genotoxic effects, and cancer studies,” BioMed research international, 2013.
[80] Graham C., Cook M. R., Cohen H. D., Riffle D. W., Hoffman S., and Gerkovich M. M., 1999, “Human exposure to 60-Hz magnetic fields: neurophysiological effects,” International journal of Psychophysiology, 33(2), pp. 169–175.
[81] Graham C., Sastre A., Cook M. R., and Gerkovich M. M., 2000, “Nocturnal magnetic field exposure: gender-specific effects on heart rate variability and sleep,” Clinical neurophysiology, 111(11), pp. 1936–1941.
[82] Tschulik K., and Compton R. G., 2014, “Nanoparticle impacts reveal magnetic field induced agglomeration and reduced dissolution rates,” Physical Chemistry Chemical Physics, 16(27), pp. 13909–13913.
[83] Lim E. W. C., and Feng R., 2012, “Agglomeration of magnetic nanoparticles,” The Journal of chemical physics, 136(12), p. 124109.
[84] Hoffman-Amtenbrink M., Von Rechenberg B., and Hofmann H., 2009, “Superparamagnetic nanoparticles for biomedical applications.”
[85] Issa B., Obaidat I. M., Albiss B. A., and Haik Y., 2013, “Magnetic nanoparticles: surface effects and properties related to biomedicine applications,” International journal of molecular sciences, 14(11), pp. 21266–21305.
[86] Papaefthymiou G. C., 2009, “Nanoparticle magnetism,” Nano Today, 4(5), pp. 438–447.
[87] Mosmann T., 1983, “Rapid colorimetric assay for cellular growth and survival: application to proliferation and cytotoxicity assays,” Journal of immunological methods, 65(1), pp. 55–63.
[88] Matteoni R., and Kreis T. E., 1987, “Translocation and clustering of endosomes and lysosomes depends on microtubules,” The Journal of cell biology, 105(3), pp. 1253–1265.
[89] Schindelin J., Arganda-Carreras I., Frise E., Kaynig V., Longair M., Pietzsch T., Preibisch S., Rueden C., Saalfeld S., Schmid B., and others, 2012, “Fiji: an open-source platform for biological-image analysis,” Nature methods, 9(7), pp. 676–682.
[90] Treuel L., Jiang X., and Nienhaus G. U., 2013, “New views on cellular uptake and trafficking of manufactured nanoparticles,” Journal of The Royal Society Interface, 10(82), p. 20120939.