DEKRA Test Center - Transport & Environment
16
© 2016 DEKRA TEST CENTER DEKRA Test Center On the safe side Field survey on tire inflation of M1 vehicles - May 2018 DEKRA Test Center reference : 17T&E11-149 DEKRA report reference 17T&E11-149 of survey performed from 1 st of February to 9 th of February 2018 is only valid in its entirety. An extraction or partial utilization of results for external publication will be under T&E responsibility.
Transcript of DEKRA Test Center - Transport & Environment
© 2016 DEKRA TEST CENTER
DEKRA Test CenterOn the safe side
Field survey on tire inflation of
M1 vehicles - May 2018
DEKRA Test Center reference : 17T&E11-149
DEKRA report reference 17T&E11-149 of survey performed from 1st of February to 9th of February 2018 is only valid in its entirety.
An extraction or partial utilization of results for external publication will be under T&E responsibility.

© 2016 DEKRA TEST CENTER
DEKRA Test Center
Aim of the survey
General criteria
Test protocol
Location of the survey
Data processing
Results
Seite 2
Agenda
DEKRA Test Center reference :17T&E11-149
© 2016 DEKRA TEST CENTER
DEKRA Test Center
The aim of this survey is first to collect the actual tire inflations and corresponding tire pressuresrecommended by the vehicles manufacturers, and then to calculate and draw the distributions of tireunderinflations/overinflations, and this for the 3 following groups of vehicles:
- Group “R64 dTPMS vehicles” are vehicles equipped with an UNECE Regulation No. R64 TPMS (TirePressure Monitoring System) based on the direct technology (which uses an actual factory calibratedpressure sensor to measure each tire pressure).
- Group “R64 iTPMS vehicles” are vehicles equipped with an UNECE Regulation No. R64 TPMS basedon the indirect technology (which uses the ABS/ESP tooth wheel sensors to estimate indirectly each tirepressure based on wheel rotation speed and vibration).
- Group “no TPMS vehicles” are vehicles not equipped with a TPMS nor with a tire puncture detectionsystem.
Seite 3
Aim of the survey
DEKRA Test Center reference :17T&E11-149
© 2016 DEKRA TEST CENTER
DEKRA Test Center
This field survey will be done in 2 different locations : 1 in Portugal and 1 in Italy, and will cover around 1000 vehicles altogether.
It will include only M1 vehicles firstly registered in EU after Nov 1st 2014 in case of Group “R64 dTPMSvehicles” and Group “R64 iTPMS vehicles”.
It will include only M1 vehicles firstly registered in EU after Jan 1st 2009 and before Jan 1st 2014 in case of Group “no TPMS vehicles”.
Seite 4
General criteria
DEKRA Test Center reference :17T&E11-149

© 2016 DEKRA TEST CENTER
DEKRA Test Center
Date, time and location of the survey
Vehicle’s brand & model
Vehicle’s VIN number
Vehicle load (partially loaded, fully loaded)
Tire size
Tire flange temperature
Relative tire pressure
Seite 5
Test protocolData to record Post processed data
Vehicle’s date of 1st registration
TPMS equipment (dTPMS, iTPMS or no TPMS)
Recommended tire pressure placard
DEKRA Test Center reference :17T&E11-149

© 2016 DEKRA TEST CENTER
DEKRA Test Center
Manometer
Natech
N°IT3471-03
Measurement accuracy : 0,05b
Daily compared with manometer : AQ336
Thermometer
RS PRO 1327K
N° : AQ 368
Measurement accuracy : +/- 0.3°C
Seite 6
Test protocolEquipment used
DEKRA Test Center reference :17T&E11-149
© 2016 DEKRA TEST CENTER
DEKRA Test Center
Seite 7
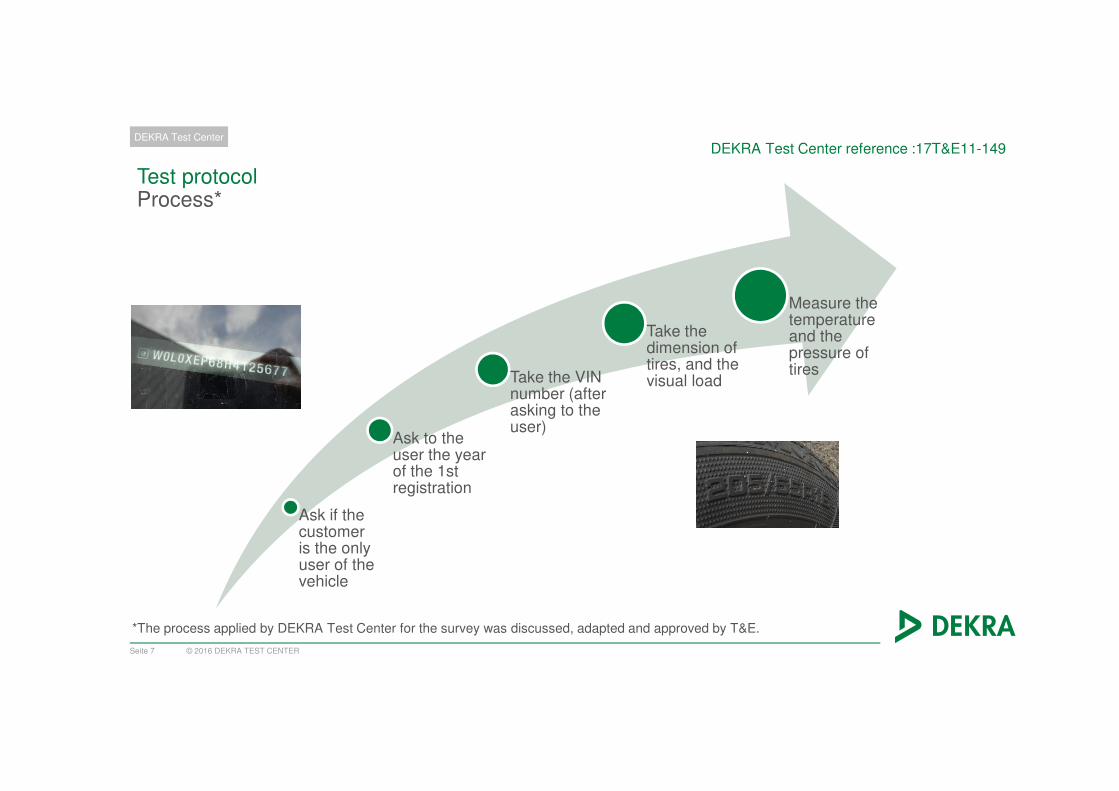
Test protocolProcess*
Ask if the customeris the onlyuser of the vehicle
Ask to the user the yearof the 1st registration
Take the VIN number (afterasking to the user)
Take the dimension of tires, and the visual load
Measure the temperatureand the pressure of tires
*The process applied by DEKRA Test Center for the survey was discussed, adapted and approved by T&E.
DEKRA Test Center reference :17T&E11-149
© 2016 DEKRA TEST CENTER
DEKRA Test Center
Seite 8
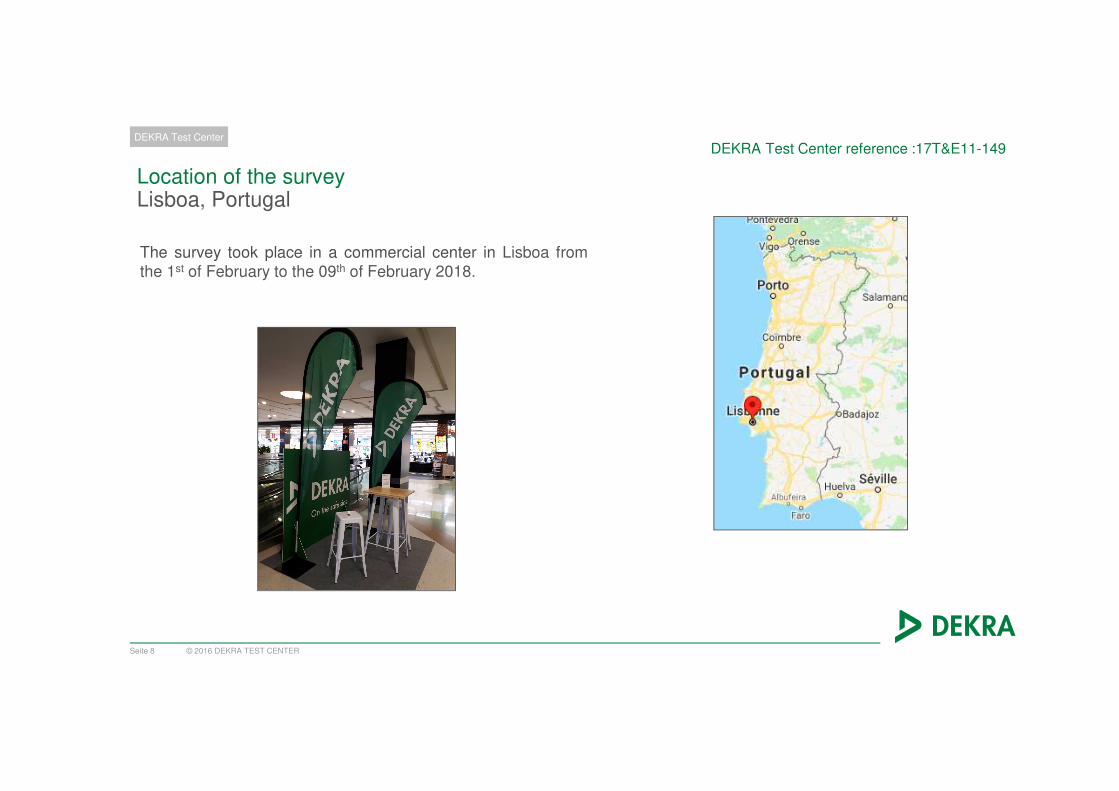
Location of the surveyLisboa, Portugal
The survey took place in a commercial center in Lisboa fromthe 1st of February to the 09th of February 2018.
DEKRA Test Center reference :17T&E11-149

© 2016 DEKRA TEST CENTER
DEKRA Test Center
Seite 9
Data processing
With the VIN number, some researches are done :
Check of the date of registration (Internet bank info + car dealership)
Recommended pressure (Internet bank info + car dealership)
Type of TPMS (car dealership)
Vehicles are sorted to keep only the vehicles which we have all the exact information, and sorted in 3 groups :
noTPMS
dTPMS
iTPMS
DEKRA Test Center reference :17T&E11-149

© 2016 DEKRA TEST CENTER
DEKRA Test Center
Seite 10
Data processing
Pressure measured is corrected with temperature :
Normalized cold actual tire pressure = ((measured tire pressure + 101) x (measured ambient
temperature + 273)/(measured tire flange temperature + 273)) – 101
Then pressure delta is calculated between this normalized cold actual pressure and the recommended pressure for each wheel.
DEKRA Test Center reference :17T&E11-149
© 2016 DEKRA TEST CENTER
DEKRA Test Center
Results
Lisboa
Seite 11
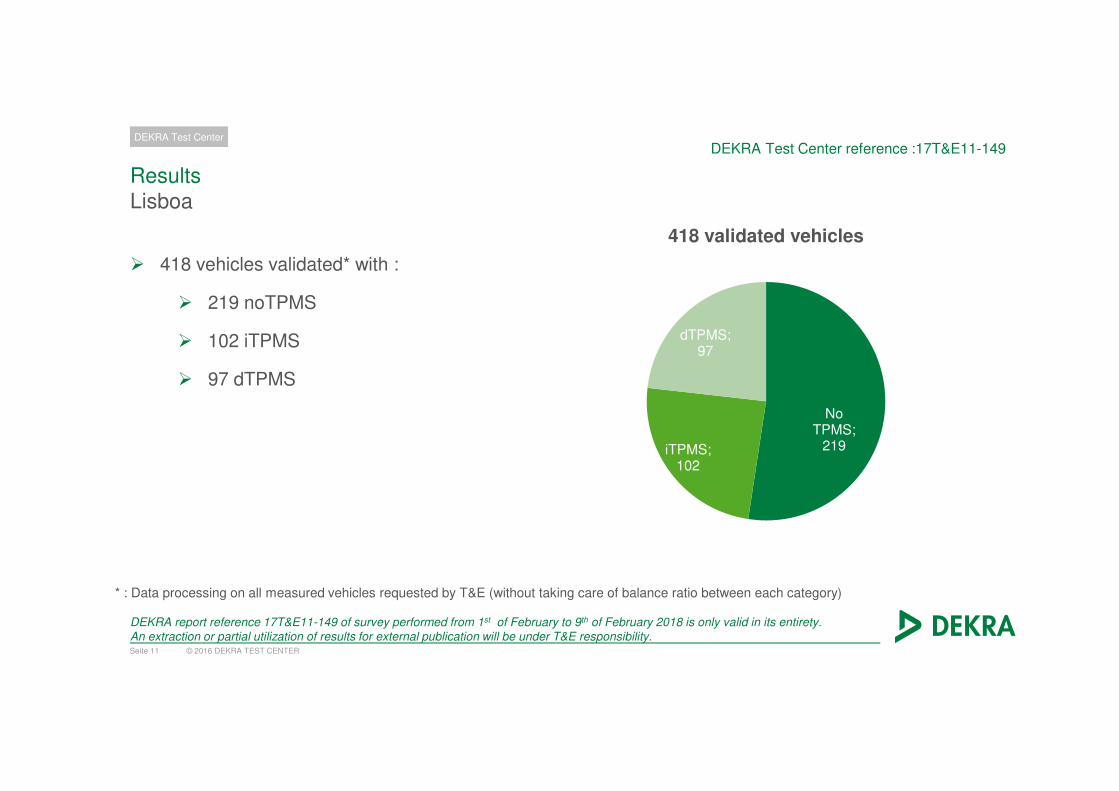
418 vehicles validated* with :
219 noTPMS
102 iTPMS
97 dTPMS
DEKRA Test Center reference :17T&E11-149
* : Data processing on all measured vehicles requested by T&E (without taking care of balance ratio between each category)
DEKRA report reference 17T&E11-149 of survey performed from 1st of February to 9th of February 2018 is only valid in its entirety.
An extraction or partial utilization of results for external publication will be under T&E responsibility.
No TPMS;
219iTPMS; 102
dTPMS; 97
418 validated vehicles
© 2016 DEKRA TEST CENTER
DEKRA Test Center
Results
Lisboa
Seite 12
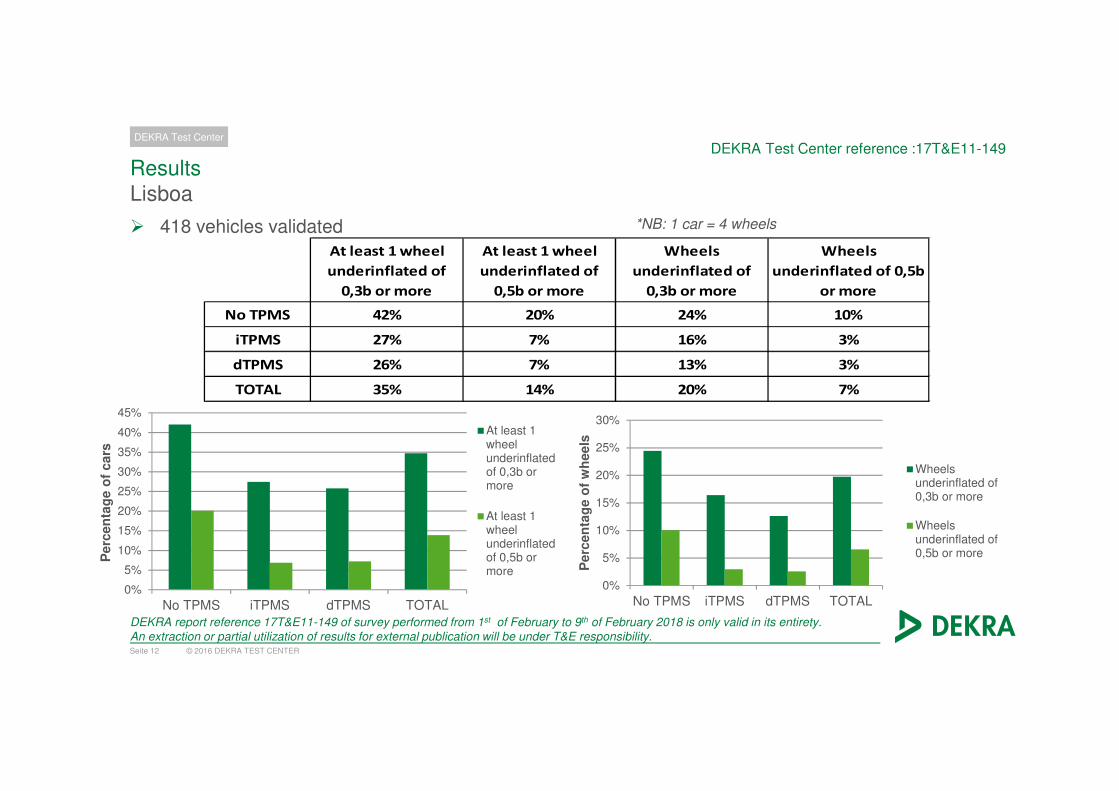
418 vehicles validated *NB: 1 car = 4 wheels
DEKRA Test Center reference :17T&E11-149
DEKRA report reference 17T&E11-149 of survey performed from 1st of February to 9th of February 2018 is only valid in its entirety.
An extraction or partial utilization of results for external publication will be under T&E responsibility.
At least 1 wheel
underinflated of
0,3b or more
At least 1 wheel
underinflated of
0,5b or more
Wheels
underinflated of
0,3b or more
Wheels
underinflated of 0,5b
or more
No TPMS 42% 20% 24% 10%
iTPMS 27% 7% 16% 3%
dTPMS 26% 7% 13% 3%
TOTAL 35% 14% 20% 7%
0%
5%
10%
15%
20%
25%
30%
35%
40%
45%
No TPMS iTPMS dTPMS TOTAL
Perc
en
tag
e o
f cars
At least 1wheelunderinflatedof 0,3b ormore
At least 1wheelunderinflatedof 0,5b ormore
0%
5%
10%
15%
20%
25%
30%
No TPMS iTPMS dTPMS TOTAL
Perc
en
tag
e o
f w
heels
Wheelsunderinflated of0,3b or more
Wheelsunderinflated of0,5b or more

© 2016 DEKRA TEST CENTER
DEKRA Test Center
Results
Lisboa
Seite 12
418 vehicles validated
DEKRA Test Center reference :17T&E11-149
DEKRA report reference 17T&E11-149 of survey performed from 1st of February to 9th of February 2018 is only valid in its entirety.
An extraction or partial utilization of results for external publication will be under T&E responsibility.
Cars with at least 1
wheel inflated at 1,5b or
less
No TPMS 11%
iTPMS 2%
dTPMS 2%
TOTAL 6%0%
2%
4%
6%
8%
10%
12%
No TPMS iTPMS dTPMS TOTALP
erc
en
tag
e o
f cars
Cars with at least 1wheel inflated at 1,5b orless

© 2016 DEKRA TEST CENTER
DEKRA Test Center
Results
Lisboa
Seite 13
Pressure delta are gathered as follows : P-0,05b < P < P+0,05b.
Example : P+0,4 gathers pressure delta from P+0,35 to P+0,45.
DEKRA Test Center reference :17T&E11-149
DEKRA report reference 17T&E11-149 of survey performed from 1st of February to 9th of February 2018 is only valid in its entirety.
An extraction or partial utilization of results for external publication will be under T&E responsibility.
0%
2%
4%
6%
8%
10%
12%
14%
16%
18%
20%
Perc
en
tag
e o
f w
heels
Pressure delta (bar)
Distribution of tire pressure per wheel
No TPMS
iTPMS
dTPMS
Total
OverinflationUnderinflation

© 2016 DEKRA TEST CENTER
DEKRA Test Center
Seite 14
Pressure delta are gathered as follows : P-0,05b < P < P+0,05b.
Example : P+0,4 gathers pressure delta from P+0,35 to P+0,45.
Results
Lisboa
DEKRA Test Center reference :17T&E11-149
DEKRA report reference 17T&E11-149 of survey performed from 1st of February to 9th of February 2018 is only valid in its entirety.
An extraction or partial utilization of results for external publication will be under T&E responsibility.
0%
2%
4%
6%
8%
10%
12%
14%
16%
18%
20%
22%
Perc
en
tag
e o
f w
ors
t ti
re p
er
car
Pressure delta (bar)
Distribution of worst tire pressure per car
No TPMS
iTPMS
dTPMS
Total
Underinflation Overinflation

© 2016 DEKRA TEST CENTER
MISSION
SAFETY
Seite 16