Deicing Salt-Scaling Resistance
41
Center for By-Products Utilization DEICING SALT-SCALING RESISTANCE: LABORATORY AND FIELD EVALUATION OF CONCRETE CONTAINING UP TO 70 % CLASS C AND CLASS F FLY ASH By Tarun R. Naik, Rudolph N. Kraus, Bruce W. Ramme, and Yoon-moon Chun Report No. CBU-2003-07 REP-502 March 2003 For presentation and publication at the ASTM Symposium on Concrete Durability: Deicing Chemicals and Freezing-Thawing, sponsored by ASTM Committee C09 on Concrete and Concrete Aggregates and C01 on Cement, June 17, 2003, Denver, CO. Department of Civil Engineering and Mechanics College of Engineering and Applied Science THE UNIVERSITY OF WISCONSIN – MILWAUKEE
-
Upload
truonglien -
Category
Documents
-
view
218 -
download
0
Transcript of Deicing Salt-Scaling Resistance
Center for By-Products Utilization
DEICING SALT-SCALING RESISTANCE: LABORATORY AND FIELD EVALUATION OF CONCRETE CONTAINING UP TO 70 % CLASS C AND CLASS F FLY ASH
By Tarun R. Naik, Rudolph N. Kraus, Bruce W. Ramme, and Yoon-moon Chun Report No. CBU-2003-07 REP-502 March 2003 For presentation and publication at the ASTM Symposium on Concrete Durability: Deicing Chemicals and Freezing-Thawing, sponsored by ASTM Committee C09 on Concrete and Concrete Aggregates and C01 on Cement, June 17, 2003, Denver, CO.
Department of Civil Engineering and Mechanics College of Engineering and Applied Science THE UNIVERSITY OF WISCONSIN – MILWAUKEE

TRANSACTIONS
Naik et al., “Deicing Salt -Scaling…”
Transactions, June 2003 Vol XX, No. X
Symposium on Concrete Durability: Deicing Chemicals and Freezing-Thawing, June 17, 2003, Paper ID:
Available online at: www.astm.org
Published XXXX
JOURNAL ARTICLE
Tarun R. Naik1, Rudolph N. Kraus2, Bruce W. Ramme3, and Yoon-moon Chun4
Deicing Salt-Scaling Resistance: Laboratory and Field
Evaluation of Concrete Containing up to 70 % Class C and
Class F Fly Ash
ABSTRACT: Two series of laboratory mixtures and four series of field construction
mixtures were made to evaluate salt-scaling resistance of concrete incorporating large
amounts of Class C or Class F fly ash obtained from several different sources. Results
from the first series of laboratory mixtures indicate that it is possible to produce
structural-grade, salt-scaling resistant concrete using Class C fly ash with up to a fly ash
to cementitious materials ratio of 56 % by mass. The second series of laboratory
1 Director, UWM Center for By-Products Utilization, P.O. Box 784, Milwaukee, WI 53201. 2 Assistant Director, UWM Center for By-Products Utilization, P.O. Box 784, Milwaukee, WI 53201. 3 Manager - Land Quality, We Energies Environmental Department, 333 W. Everett St., Milwaukee, WI 53203. Copyright © 2003 by ASTM International, 100 Barr Harbor Drive, PO Box C700, West Conshohocken, PA 14928-2959.

TRANSACTIONS
Naik et al., “Deicing Salt -Scaling…”
3
mixtures that incorporated up to 60 % Class C fly ash exhibited either equivalent or
higher salt-scaling resistance compared with a reference mixture without fly ash. Salt-
scaling resistance of one series of field mixtures decreased as the fly ash content
increased. However, another series of field mixtures showed the opposite trend, Series
3C. Some mixtures with up to 67 % Class F fly ash exhibited satisfactory salt-scaling
resistance in actual pavements.
KEYWORDS: compressive strength, concrete, durability, fly ash, freezing and
thawing, salt-scaling resistance
Introduction
Strength and durability related properties of concrete are influenced by the addition of fly
ash. However, the level of influence on these properties is dependent upon the amount and type
of fly ash. In North America, expansion of concrete resulting from freezing and thawing is a
major cause of damage to concrete structures such as pavements, retaining walls, bridge decks,
parking structures, and similar structures. Such expansion results in cracking and spalling
(Mehta 1993). Applications of deicer salts further aggravate these problems. Freezing and
thawing in the presence of moisture and deicer chemical causes damage to concrete slabs in the
form of surface scaling. The amount of scaling damage to a particular concrete under freezing
and thawing cycling is dependent upon the deicer solution concentration. It has also been
reported that the maximum scaling damage to concrete surfaces occurs at about 4 to 5 %
concentration of deicer salts (Mehta 1993). Furthermore, a 3 % concentration of deicer exhibited
higher scaling damage than either lower (down to 0 %) or higher (up to 16 %) concentration of
4 Postdoctoral Fellow, UWM Center for By-Products Utilization, P.O. Box 784, Milwaukee, WI 53201.
TRANSACTIONS
Naik et al., “Deicing Salt -Scaling…”
4
deicer irrespective of type of deicer (NaCl, CaCl2, Urea, and CH3CH2OH) used (Verbeck and
Klieger 1956). In general, it is well accepted that air entrainment improves concrete resistance to
salt-scaling as well as freezing and thawing actions to a marked extent.
Researchers have indicated that the salt-scaling damage to concrete can occur by both
physical and chemical mechanisms. The physical mechanism by which salt-scaling damage to
concrete occurs has been described (Browne and Cady 1975). It was indicated that the scaling
often occurs in the form of small flat flakes breaking away from the surface of the pavement.
These flakes look like sound concrete, similar to that of the mass of the concrete. This
phenomenon probably occurs due to the deicer concentration gradient and the degree of
saturation. Due to hygroscopic character of deicer salts, the degree of saturation of concrete
increases with the use of deicers and differential stresses are generated as a result of layer-by-
layer freezing that occurs due to salt concentration gradients. Additionally, concrete covered
with snow experiences thermal shock when deicing salt is applied. These factors are probably
primarily responsible for lowered concrete resistance to freezing and thawing actions when
deicer chemicals are used.
The chemical mechanism through which the salt-scaling occurs has also been described
(Neville 1969). It was reported that saturated solutions of calcium chloride, even without
freezing and thawing cycling, were deleterious to concrete. The damaging effect was found to
be greatly influenced by the water-cement ratio (w/c). Although at low w/c the effect of
exposure to saturated calcium chloride solution on length changes of concrete was negligible,
large mass losses and degradation in dynamic modulus of elasticity did occur. At a high w/c of
0.7, the saturated calcium chloride solution resulted in increased expansions, mass gains, and
losses in dynamic modulus of elasticity of concrete. Neville further hypothesized that the
TRANSACTIONS
Naik et al., “Deicing Salt -Scaling…”
5
degradation of concrete at the low w/c occurred due to leaching and resultant loss of strength,
whereas at the high w/c it occurred primarily from deposition and crystallization in the voids left
by water molecules.
Factors that can influence salt-scaling resistance of concrete include: the level of saturation
of concrete, compressive strength, entrained air, water-cementitious materials ratio (w/cm), type
and amount of cementitious materials, type and amount of admixtures, aggregate type and
gradation, finishing and curing procedures, and exposure conditions. This investigation was
performed to evaluate strength and salt-scaling resistance of air-entrained concrete incorporating
various sources of Class C, and a Class F fly ash.
Research Significance
The major aim of this work was to evaluate salt-scaling resistance of concrete made with
Class C and Class F fly ash. The properties measured were compressive strength and salt-scaling
resistance with and without fly ash. The results of this investigation provided data for
establishing appropriate mixture proportions for concretes subjected to freezing and thawing in
the presence of deicer salts. Effect of air content is also evaluated.
Review of Literature
Naik et al. published several reports dealing with information and recent experimental data
on properties of concrete incorporating large amounts of fly ash (Naik et al. 1993a-f). Literature
on deicer salt-scaling resistance of fly ash concrete systems is reported elsewhere (Naik et al.
1993f) and a brief summary is provided herein. Also, recent literature has been reviewed and the
information is presented later in this section.
Class F fly ash concrete cured at low temperatures attained slightly lower deicer salt-scaling
resistance compared to either the Class C fly ash concrete or the concrete without fly ash (Gebler
TRANSACTIONS
Naik et al., “Deicing Salt -Scaling…”
6
and Klieger 1986). Optimum fly ash content of 25 % was indicated with respect to salt-scaling
(Tyson 1991).
Concrete specimens made with 326 kg/m3 cement and 151 kg/m3 of Class C fly ash (fly ash
to cementitious materials ratio [FA/(C+FA)] of 32 %) at a water-cementitious materials ratio
(W/[C+FA]) of about 0.4 performed satisfactorily against deicer scaling exposure (Johnston
1987).
No clear relationship between the deicer scaling resistance of concretes and the w/cm,
compressive strength, or curing practices was found in an investigation with concrete containing
fly ash at FA/(C+FA) of 0, 25, and 35 % (Hadchti and Carrasquillo 1988).
The resistance to deicer scaling of low-strength (high w/cm) air-entrained concretes primarily
made with Class F fly ash obtained from six different sources was evaluated (Whiting 1989).
The results showed that the scaling resistance was heavily dependent upon the source and the
type of fly ash used. All the Class F fly ash concretes showed poor results at the 50 %
replacement level. No distinct relationship was observed between the deicer salt-scaling
resistance of concrete and curing conditions or fly ash content in the range of 25-35 % (Barrow
et al. 1989).
Salt-scaling resistance of concrete having 50 % portland cement replacement by fly ash and
other materials at a w/cm of 0.47 was reported (Langan et al. 1990). Poor salt-scaling
performance for the 50 % fly ash mixtures was recorded. This was attributed to lower
compressive strength of this mixture compared to the reference mixture.
Influence of curing and drying on salt-scaling resistance of fly ash concrete was studied
(Bilodeau et al. 1991). Air-entrained concrete mixtures were proportioned to contain 20 and 30
percent Class F fly ash at W/(C+FA) of 0.35, 0.45, and 0.55. The results revealed all test

TRANSACTIONS
Naik et al., “Deicing Salt -Scaling…”
7
parameters, such as fly ash content, extended moist-curing or drying periods prior to salt
exposure did not significantly affect the performance of concrete. Severe salt-scaling of a high-
volume Class F fly ash concrete incorporating 56 % fly ash at a W/(C+FA) of 0.32 was reported
(Malhotra et al. 1991). Deicer salt-scaling of high-volume fly ash concrete systems
incorporating 58 % fly ash was reported (Bilodeau and Malhotra 1992). All concrete specimens
with fly ash had severe scaling due to the deicer salt-scaling applications, whereas the reference
mixture without fly ash exhibited very slight to moderate salt-scaling resistance. The same trend
was also observed elsewhere (Bilodeau et al. 1994).
Air-entrained concrete made with 20 % and 40 % (by mass) of portland cement replaced with
Class F fly ash and w/cm of 0.4 showed lower salt-scaling resistance than the reference concrete
made without fly ash (Pigeon et al. 1996). When subjected to 50 cycles of freezing and thawing
in the presence of 3 % NaCl solution, 0 % (reference), 20 %, and 40 % fly ash concrete mixtures
showed cumulative scaling loss of about 1, 1.6, and 3.3 kg/m2. Similar trend was observed for
18 % Class F fly ash concrete elsewhere (Afrani and Rogers 1994).
Air-entrained concrete incorporating Class C fly ash at FA/(C+FA) of 35 % showed no
scaling when subjected to 50 cycles of freezing and thawing in the presence of 4 % CaCl2
solution (Naik et al. 1998). Concrete incorporating 20 % Class C fly ash and 20 % Class F fly
ash (FA/[C+FA] = 0.40) showed comparable salt-scaling resistance (slight scaling) as the
reference concrete made without fly ash. Concrete with 10 % Class C fly ash and 30 % Class F
fly ash (FA/[C+FA] = 0.40) showed lower resistance to salt-scaling (moderate scaling) than the
reference concrete.
Air-entrained concrete incorporating 55 % Class F fly ash by mass, as a replacement of
portland cement, showed excellent resistance to cycles of freezing and thawing (Bouzoubaa et al.
TRANSACTIONS
Naik et al., “Deicing Salt -Scaling…”
8
2001). However, it showed poor salt-scaling resistance when subjected to 50 cycles of freezing
and thawing in the presence of 3 % NaCl solution. The 55 % fly ash concrete showed
cumulative scaling residue of 4.5 kg/m2 compared to 0.1 kg/m2 of the reference concrete.
Based on the information presented above, it can be concluded that very high replacements
of cement with Class F fly ash may result in significantly reduced concrete resistance to salt-
scaling as determined by ASTM Test Method for Scaling Resistance of Concrete Surfaces
Exposed to Deicing Chemicals (C 672). More insight is needed to optimize fly ash content,
particularly Class C fly ash content, in concrete with respect to salt-scaling resistance and to
determine correlation between the laboratory test results and field results (actual pavement) due
to scaling under anticipated outdoors exposure conditions.
Experimental Program
A test program was designed to investigate salt-scaling resistance of concrete with fly ash
using three series of tests. For Series 1 investigation, concrete mixtures were proportioned to
contain one source of Class C fly ash as a replacement for cement. The fly ash to cementitious
materials ratio was varied from 0 % to 74 %. Series 2 mixtures were proportioned to contain
Class C fly ash from one of three different sources. The fly ash to cementitious materials ratio
was set at 0 %, 40 %, 50 %, and 60 % by mass.
A field investigation (Series 3) of in-place concrete was also conducted. The Series 3
investigation is comprised of four separate studies (3A, 3B, 3C, and 3D). Each of the four
studies evaluated compressive strength, laboratory salt-scaling resistance (except for Study 3B
where no laboratory results are available) and a field evaluation of the in-place pavement for
surface scaling.
TRANSACTIONS
Naik et al., “Deicing Salt -Scaling…”
9
Study 3A used two types of fly ash, Class C and Class F with a fly ash to cementitious
materials ratio of 19 % and 50 % for Class C fly ash and 40 % Class F fly ash. Study 3B used
one source of Class C fly ash and set a fly ash to cementitious materials ratio of the mixtures of 0
%, 19 %, and 24 %. Study 3C used one source of Class F fly ash (Oak Creek) and a fly ash to
cementitious materials ratio of 53 % and 67 %. Study 3D used one source of Class F fly ash and
used a fly ash content of 50 %.
Materials
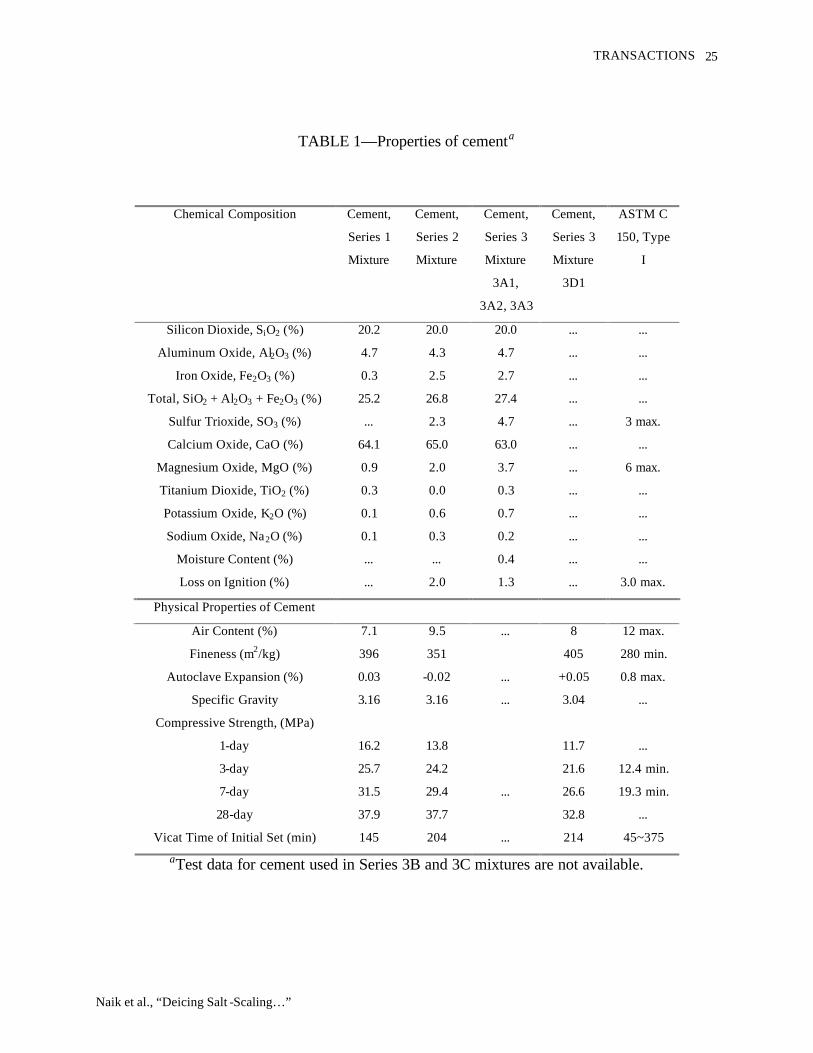
Cement—Type I portland cement conforming to ASTM Specification for Portland Cement
(C 150) was used for Series 1, 2, and 3 concrete mixtures. The chemical and physical properties
of the cement are shown in Table 1.
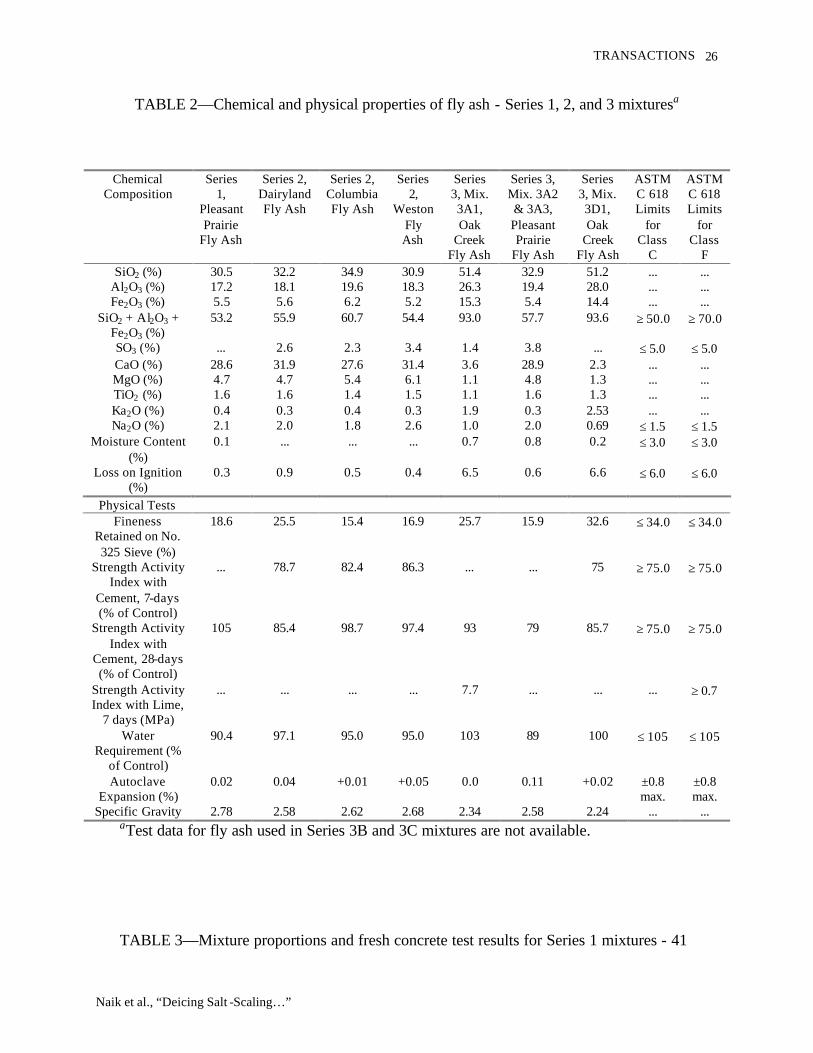
Fly Ash—Fly ashes conforming to ASTM Specification for Coal Fly Ash and Raw or
Calcined Natural Pozzolan for Use as a Mineral Admixture in Concrete (C 618), Class C, were
obtained from four different sources. ASTM C 618 Class F fly ash was obtained from one
source. The chemical analysis and physical properties of these fly ashes were determined in
accordance with applicable ASTM standards (Table 2).
Aggregates—Natural sand with a 6.35-mm maximum size meeting grading requirements
ASTM Specification for Concrete Aggregates (C 33) was used as the fine aggregate for all
mixtures. Crushed limestone with a 25-mm nominal maximum size was used as the coarse
aggregate for Series 1 mixtures. The coarse aggregate used for Series 2 mixtures was gravel
with a 19-mm nominal maximum size. The coarse aggregate used for Series 3 mixtures had a
maximum size of 38 mm. All coarse aggregates also met the requirements of ASTM C 33.
Chemical Admixtures—Air entraining agent conforming to ASTM Specification for Air-
Entraining Admixture for Concrete (C 260) and a melamine-based superplasticizer conforming
TRANSACTIONS
Naik et al., “Deicing Salt -Scaling…”
10
to ASTM Specification for Chemical Admixtures for Concrete (C 494), Type A, were used
throughout this investigation.
Mixture Proportions
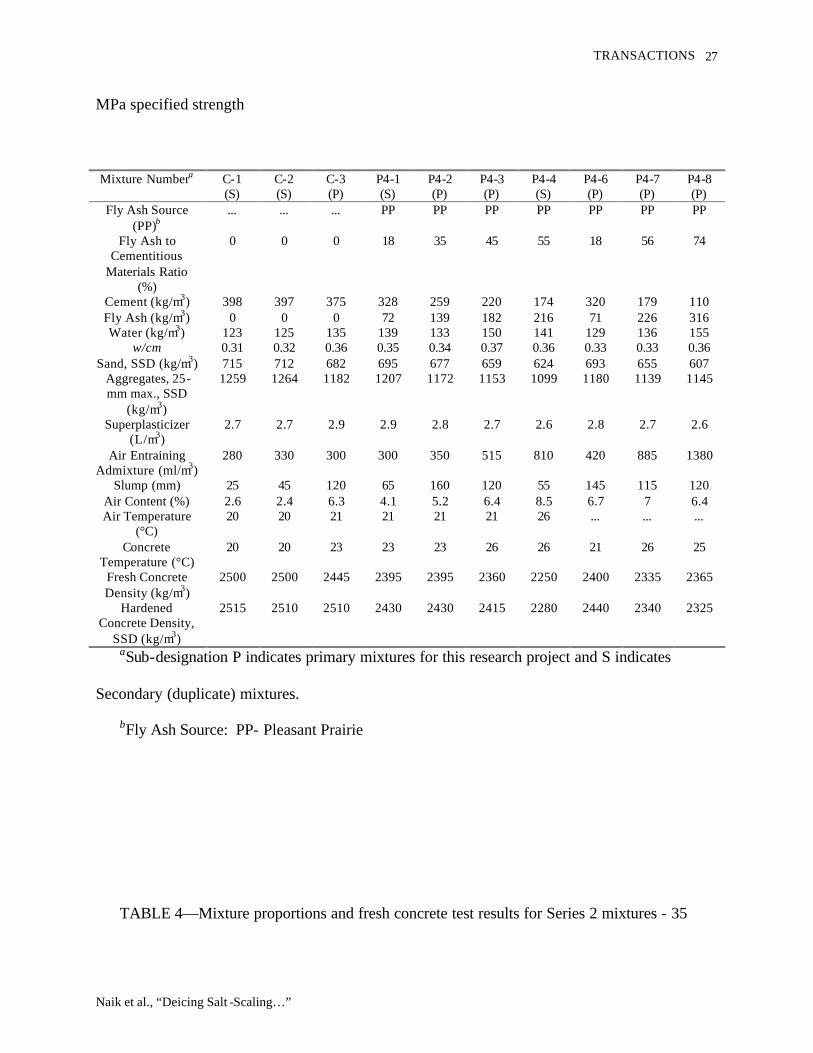
Series 1—A total of 10 different mixtures were proportioned for Series 1 tests. Of these,
three were no-fly ash mixtures, and the remaining seven mixtures contained the Pleasant Prairie
Power Plant Class C fly ash. The control mixture without fly ash was proportioned to have 28-
day compressive strength of 41 MPa. The fly ash to cementitious materials ratio was varied
from 18 to 74 % (Table 3). The w/cm was maintained at 0.35 ± 0.02 and air content was kept at
6 ± 1 % for all mixtures. The mixtures that did not meet the target w/cm, air content, or both
were classified as secondary mixtures. The secondary mixtures were used only to investigate the
effect of air content on hardened concrete properties. All concrete mixing was performed
according to ASTM Practice for Making and Curing Concrete Test Specimens in the Laboratory
(C 192).
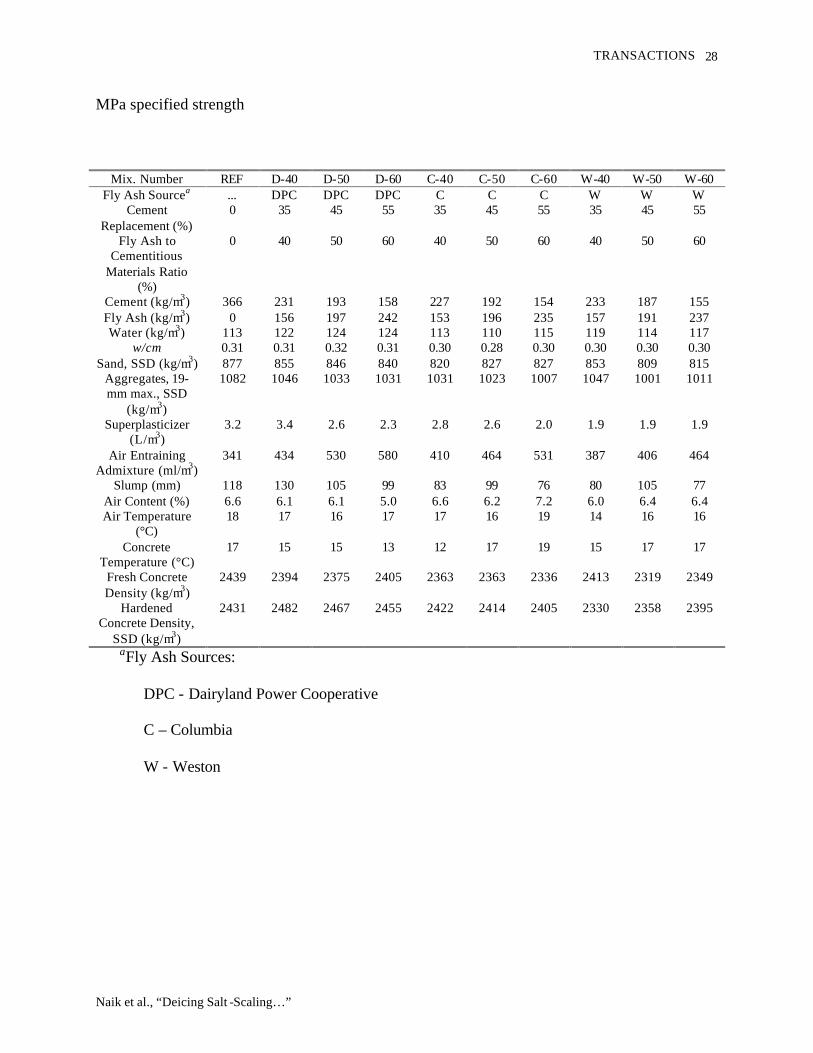
Series 2—A total of 10 different mixtures were proportioned for the Series 2 investigation.
Of these mixtures, one was a control mixture and the remaining 9 mixtures contained Class C fly
ash. Three different concrete mixtures were developed using the Class C fly ash from each
source. The three mixtures for each source of fly ash were based on a fly ash to cementitious
materials ratio of 40 %, 50 %, and 60 % (Table 4). The control mixture without fly ash was
proportioned to have a 28-day compressive strength of 35 MPa. All mixtures had w/cm of 0.30 ±
0.02 and the air content of 6 ± 1 %. The desired workability was achieved through the use of a
superplasticizer. All concrete mixtures were mixed according to ASTM C 192
Series 3—The field studies of the Series 3 investigation also consisted of a total of 10
different mixture proportions. These 10 mixtures were part of four different field demonstration
TRANSACTIONS
Naik et al., “Deicing Salt -Scaling…”
11
studies (3A, 3B, 3C, and 3D). These paving demonstration projects were conducted from 1988
to 1992 (Series 3A, 1990; Series 3B, 1988; Series 3C, 1991; and Series 3D, 1992).
Study 3A (Table 5) consisted of three mixtures (3A1, 3A2, and 3A3) incorporating Class C
fly ash obtained from the Pleasant Prairie Power Plant and Class F fly ash obtained from the Oak
Creek Power Plant. One mixture with a fly ash to cementitious materials ratio of 40 % was
developed using Class F fly ash and two mixtures with a fly ash to cementitious materials ratio
of 19 % and 50 % were developed using Class C fly ash. Each mixture consisted of three to four
test batches. Actual volume of the demonstration project roadway paving concrete varied from
about 500 to 700 m3. All three mixtures were proportioned to have 28-day compressive strength
of 24 MPa and air content of 5 to 6 % with slump maintained at about 65 ± 35 mm.
The second study, Series 3B, Mixtures 3B1, 3B2, and 3B3, were developed using the
Pleasant Prairie Class C fly ash. Fly ash to cementitious materials ratios for these mixtures were
0 %, 19 %, and 24 %. Actual volume of this demonstration project highway paving concrete
varied from about 500 to 1,000 m3. One mixture was a control mixture having no fly ash
content. All mixtures were proportioned to have the 28-day compressive strength of 28 MPa.
Slump was maintained at 35 ± 15 mm, with air contents of approximately 4 to 8 %.
The third study, Series 3C, consisted of two mixtures, Mixtures 3C1 and 3C2, which
incorporated Oak Creek Class F fly ash (Table 7). Fly ash to cementitious materials ratio of the
two mixtures was 53 % and 67 %. These mixtures were proportioned for a 28-day compressive
strength of 28 MPa. The mixtures proportions were developed based upon Wisconsin
Department of Transportation (DOT) mixtures. Actual volume of this demonstration project
roadway paving concrete varied from about 500 to 700 m3. The fourth study, Series 3D, Mixture
3D1 (which consisted of 6 test batches) incorporated Oak Creek Class F fly ash with a fly ash to
TRANSACTIONS
Naik et al., “Deicing Salt -Scaling…”
12
cementitious materials ratio of 50 %. Actual volume of this demonstration project parking lot
paving concrete was approximately 1400 m3.
Casting and Curing of Test Specimens
All test specimens were cast in accordance with ASTM C 192. Cylinders (150 x 300 mm)
were made from each mixture to evaluate the compressive strength. Slab specimens (300 x 300
x 100 mm) were cast for deicer salt-scaling testing.
The test specimens for Series 1 investigation were cast at a precast concrete plant using their
production run batching and mixing procedures. All specimens were covered with plastic to
minimize their moisture loss immediately after casting and finishing them. These specimens
were stored at temperatures of about 20 ± 2 °C in the casting room area of the plant. After 24
hours, all specimens were demolded. They were then brought to the test laboratory and put into
a moist curing room at 23 ± 1 °C temperature and 100 percent relative humidity until the time of
test. The specimens of Series 1 with a fly ash to cementitious materials ratio of 74 % were
demolded after 11 days of curing under the casting room conditions of 20 ± 2 °C due to their
very slow hardening.
All specimens for the Series 2 investigation were made in a laboratory cond ition at a room
temperature of about 22 ± 2 °C. All Series 3 test specimens were made at the construction
project sites at the time of construction. After 24 hours these test specimens were brought to the
test lab, demolded, and placed in a moist curing-room at 23 ± 1 °C and 100 % relative humidity.
Concrete Tests
Fresh Concrete Properties—Slump, density, temperature, and air content for each concrete
mixture were evaluated in accordance with applicable ASTM test methods. The fresh concrete
properties are given in Table 3 for Series 1 mixtures, Table 4 for Series 2 mixtures, and Tables 5
TRANSACTIONS
Naik et al., “Deicing Salt -Scaling…”
13
and 6 for Series 3 mixtures.
Hardened Concrete Properties—All compressive strength measurements were made in
accordance with ASTM Test Method for Compressive Strength of Cylindrical Concrete
Specimens (C 39). Deicer salt-scaling resistance of concrete was evaluated according to ASTM
C 672. The Series 1 test specimens were subjected to the deicer salt-scaling tests after 4 weeks
of moist curing followed by 3 weeks of air curing in the laboratory. The Series 2 test specimens
were subjected to the deicer salt-scaling tests after 14 days of moist curing followed by 14 days
of air curing in the laboratory. The deicer used for both series (Series 1 and 2) was 4 % CaCl2
solution.
Series 3A test specimens (Mixture 3A1, 3A2, and 3A3) were subjected to a 3 % NaCl
solution at an age of 6 weeks consisting of 3 weeks of moist curing and 3 weeks of air curing in
the laboratory. No laboratory evaluation of salt-scaling resistance was conducted for Series 3B
mixtures. The test specimens of Series 3C (Mixture 3C1, and 3C2) were subjected to a 4 %
CaCl2 solution at an age of 9 months while Series 3D test specimens (Batch 3D-1 and 3D-2)
were subjected to a 4 % CaCl2 solution at the age of 6 weeks.
Field Evaluation
A field evaluation is being conducted for each of the three roadway and one parking lot
pavements of the Series 3 investigation (Studies 3A, 3B, 3C, and 3D). Surface scaling was
evaluated using the same guidelines as laboratory salt-scaling testing per ASTM C 672.
Test Results and Discussion
Compressive Strength
Series 1—The test data on compressive strength of Series 1 concrete mixtures are presented

TRANSACTIONS
Naik et al., “Deicing Salt -Scaling…”
14
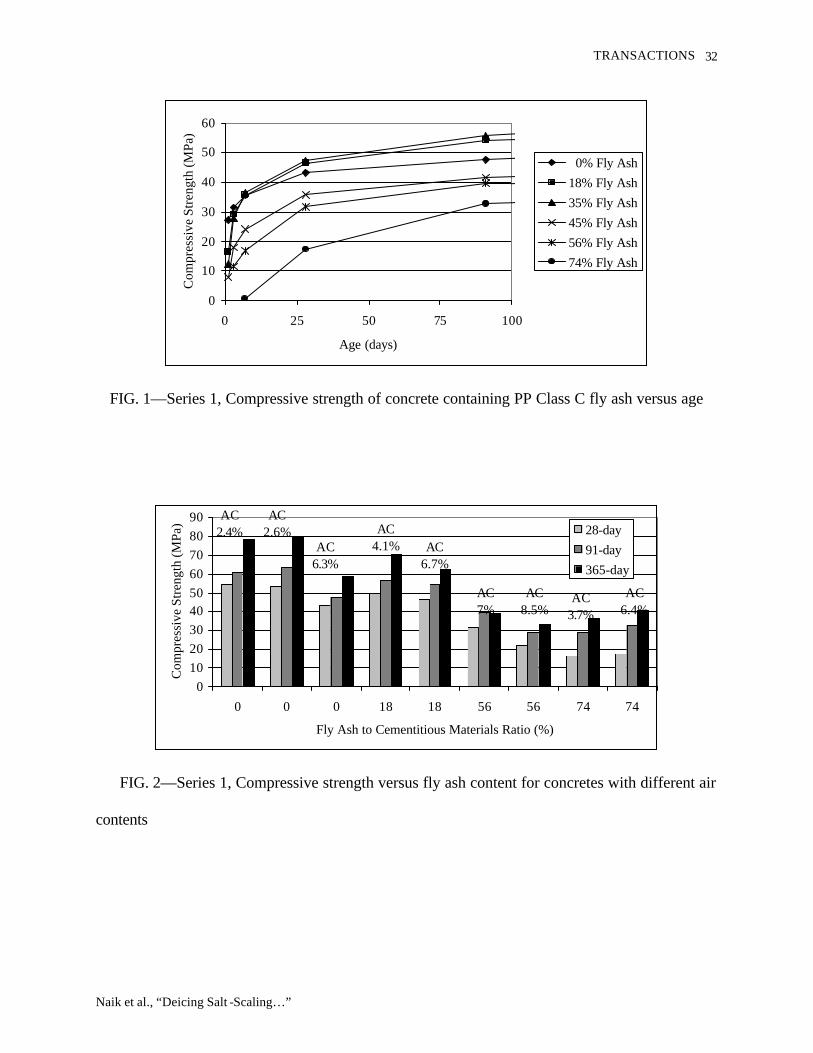
in Figs. 1 and 2. At early ages up to 3 days, all the fly ash concrete mixtures exhibited lower
strength relative to the no-fly ash mixture (Fig. 1). However, beyond the 3-day age, the 35
percent fly ash mixture generally showed the maximum compressive strength. The compressive
strength of concrete generally decreased with increasing fly ash content beyond the 35 % fly ash
mixture. The 35 % mixture had a compressive strength higher than 47 MPa at the 28-day age.
The 45 % and 56 % fly ash mixtures exhibited 28-day strengths in excess of 30 MPa. Due to
pozzolanic reactions of the fly ash, all fly ash mixtures showed a continuous increase in the rate
of strength gain at later ages relative to the concrete without fly ash. Consequently, performance
of the fly ash mixtures, especially high-volume mixtures, improved greatly when tested at ages
beyond 28 days.
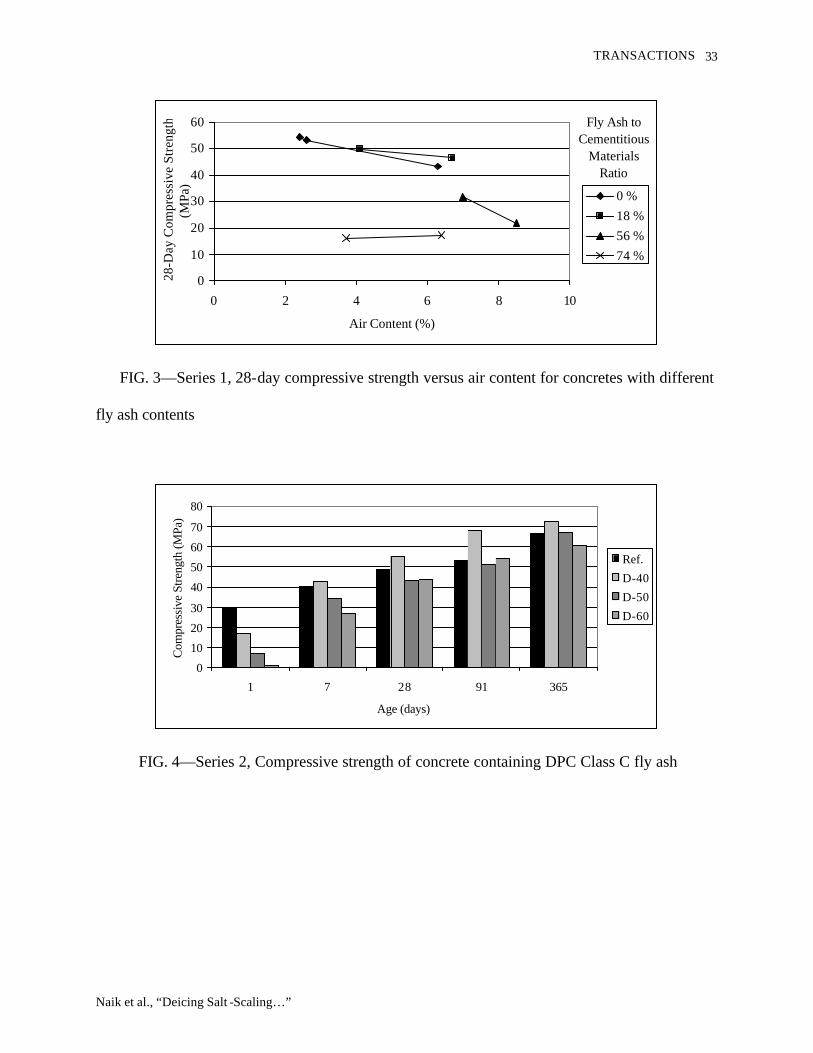
In general, compressive strength decreased when air content increased (Fig. 2 and 3).
However, for the low cement factor 74 % fly ash mixture, the effect of increased air content was
a slight increase in strength (Fig. 2 and 3).
Series 2—The test results are presented in Figures 4 through 6. The concrete mixtures
containing 40 % DPC Class C fly ash attained lower one-day strength compared to the reference
mixture but showed higher strength at ages from 7 to 365 days (Fig. 4). The mixtures containing
50 % and 60 % DPC fly ash had lower strength up to 28 days compared to the control mixture.
However, after 28 days, compressive strength of these mixtures was approximately the same as
the control mixture.
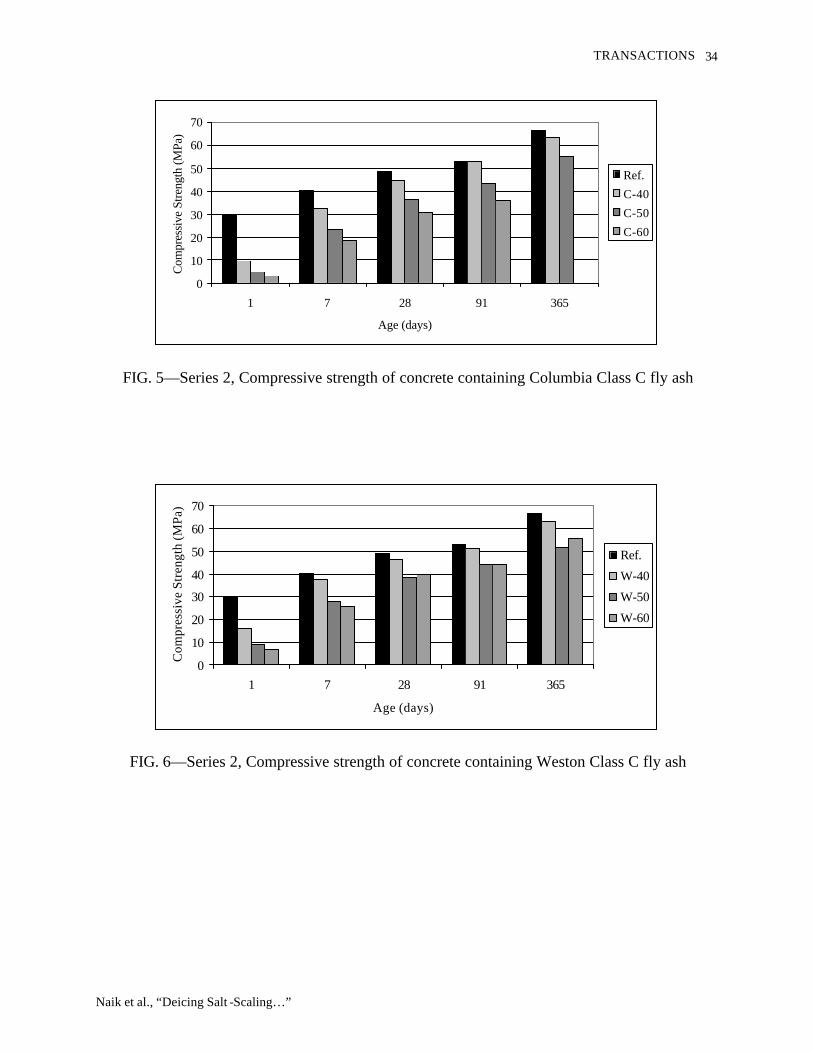
The concrete mixtures containing 40, 50, and 60 % of Columbia Class C fly ash generally
exhibited lower compressive strength than the control mixture at all ages (Fig. 5). However, the
40 % fly ash mixtures achieved compressive strengths comparable to the control mixture beyond
the 28-day age.

TRANSACTIONS
Naik et al., “Deicing Salt -Scaling…”
15
The 40 % Weston Class C fly ash mixture had lower compressive strength at one day when
compared with the control mixture, but were approximately equal to the control mixture at later
ages (Fig. 6). The 50 % and 60 % fly ash mixtures had lower compressive strength at all ages
when compared to the control mixture (Fig. 6).
The above results indicate that the source of the fly ash had a noticeable effect on the
compressive strength. The concrete mixtures containing DPC fly ash with a fly ash to
cementitious materials ratio of 40 % and 50 % exhibited significantly higher strengths than
mixtures containing Columbia or Weston fly ash, particularly at early ages (less than 28 days).
Series 3—The compressive strength results for Series 3 mixture consists of four separate
field studies: Study 3A, Mixture 3A1, 3A2, and 3A3; Study 3B, Mixture 3B1, 3B2, and 3B3;
Study 3C, Mixtures 3C1 and 3C2; and Study 3D, Mixture 3D1.
Study 3A: Test data for Study 3A, Mixture 3A1, 3A2, and 3A3, are shown in Fig. 7. All
mixture containing fly ash exceeded the specified compressive strength of 24 MPa at the 28-day
age. A comparison of compressive strength between mixtures with 50 % and 19 % fly ash in
total cementitious materials showed that the 50 % fly ash mixture had lower compressive
strengths (up to 40 % lower compressive strength), particularly at early ages up to 3 days, as
compared to the 19 % mixture. However, at later ages, 28 days and beyond, compressive
strength of the 50 % mixture were within 10 to 15 % of the 19 % fly ash mixture. This indicates
that the rate of strength gain for the 50 % mixture is much higher than that of the 19 % mixture
after the 3-day age. The mixture with 40 % Class F fly ash had a slightly higher strength at one
day when compared to the 50 % Class C fly ash mixture. However, beyond about two-day age,
the 50 % Class C fly ash mixture exceeded the compressive strength of the 40 % Class F
mixture.
TRANSACTIONS
Naik et al., “Deicing Salt -Scaling…”
16
Study 3B: The test results of the study are presented in Fig. 8. The compressive strength
results showed that the 24 % fly ash mixture had the highest strength followed by the 19 % fly
ash mixture. The no-fly ash mixture had the lowest compressive strength. However, all the
mixtures exhibited higher compressive strength than the specified strength of 28 MPa at the 28-
day age.
Study 3C: Test data for Study 3C, Mixture 3C1 and 3C2, are shown in Fig. 9. Study 3C
mixtures incorporated Oak Creek Class F fly ash with FA/(FA+C) of 53 % and 67 %. The
compressive strength of Mixture 3C1 (53 % fly ash) were 15 to 20 % lower at all ages when
compared to mixture 3C2 (67 % fly ash).
Study 3D: Test data on the Study 3D, Mixture 3D1-1 and 3D1-6, are shown in Fig. 10. All
test data for these six different batches of the same concrete, Mixture 3D1, were essentially
similar, as can be expected. All mixtures had 50 % Oak Creek Class F fly ash to cementitious
materials ratio.
Salt-scaling Resistance
Evaluation of concrete resistance to surface scaling due to freezing and thawing in the
presence of deicer chemicals was conducted in accordance with ASTM C 672. The surface
scaling was rated between zero to five, zero being the highest resistance (“no scaling”) and 5
being the lowest resistance (“severe scaling”) to salt application per ASTM C 672.
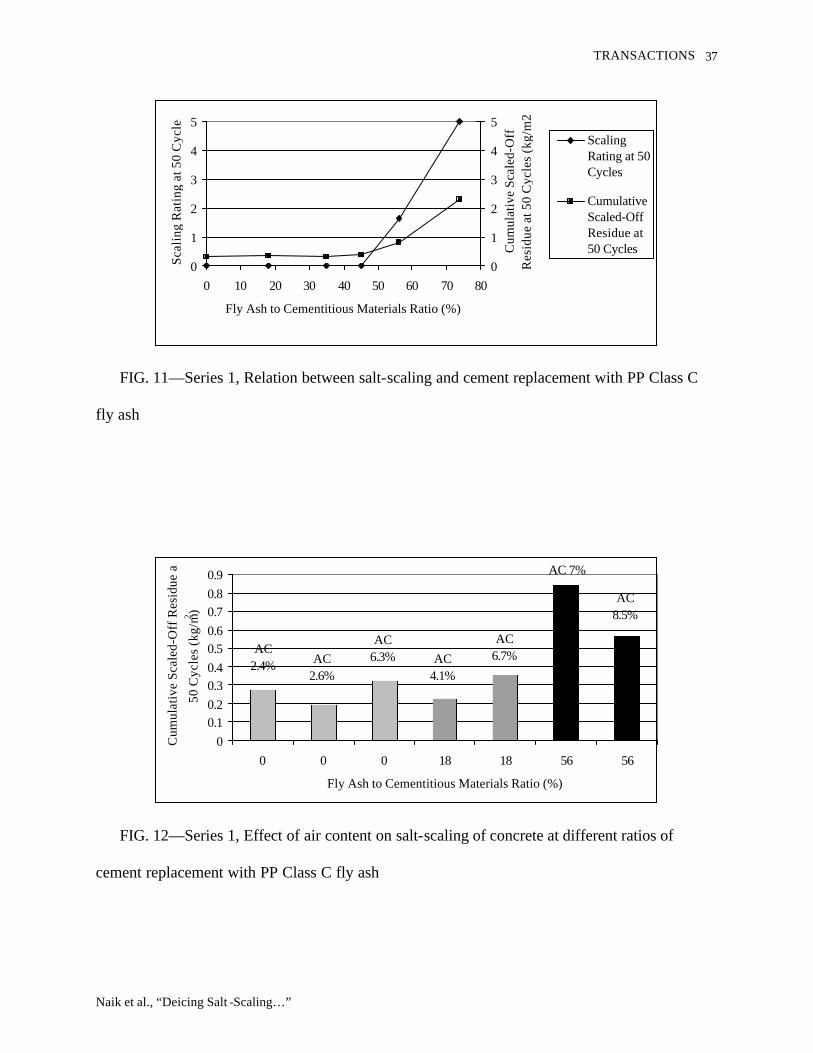
Series 1—The salt-scaling test results are shown in Figs. 11 and 12. The results indicated
that the fly ash mixtures with up to 45 % fly ash to cementitious materials ratio showed no
surface scaling (Rating of zero) after being subjected to 50 cycles of freezing and thawing in the
presence of deicer-salt solution (Fig. 11). The 56 % fly ash mixture achieved a Rating of slightly
below 2, representing “slight to moderate” scaling per ASTM C 672. The 74 % fly ash concrete
TRANSACTIONS
Naik et al., “Deicing Salt -Scaling…”
17
mixture showed severe surface scaling, Rating of 5. The mass of the scaled residue after 50
cycles of freezing and thawing was low (average values ranging from 0.32 to 0.84 kg/m2) for the
fly ash concretes with up to 56 % fly ash to cementitious materials ratio. Concrete specimens
made from the 74 % fly ash mixture showed the highest value of the scaled-off residue amongst
all the mixtures tested; it exhibited an average value of 2.32 kg/m2 at the end of 50 cycles.
Fig. 12 shows that the salt-scaling resistance of concrete was not materially affected by the
levels of air content used in this work for 0 %, 18 %, and 56 % fly ash to cementitious materials
ratio concretes. However, higher fly ash content concrete had a higher amount of scaled-off
residue, probably due to decreased compressive strength.
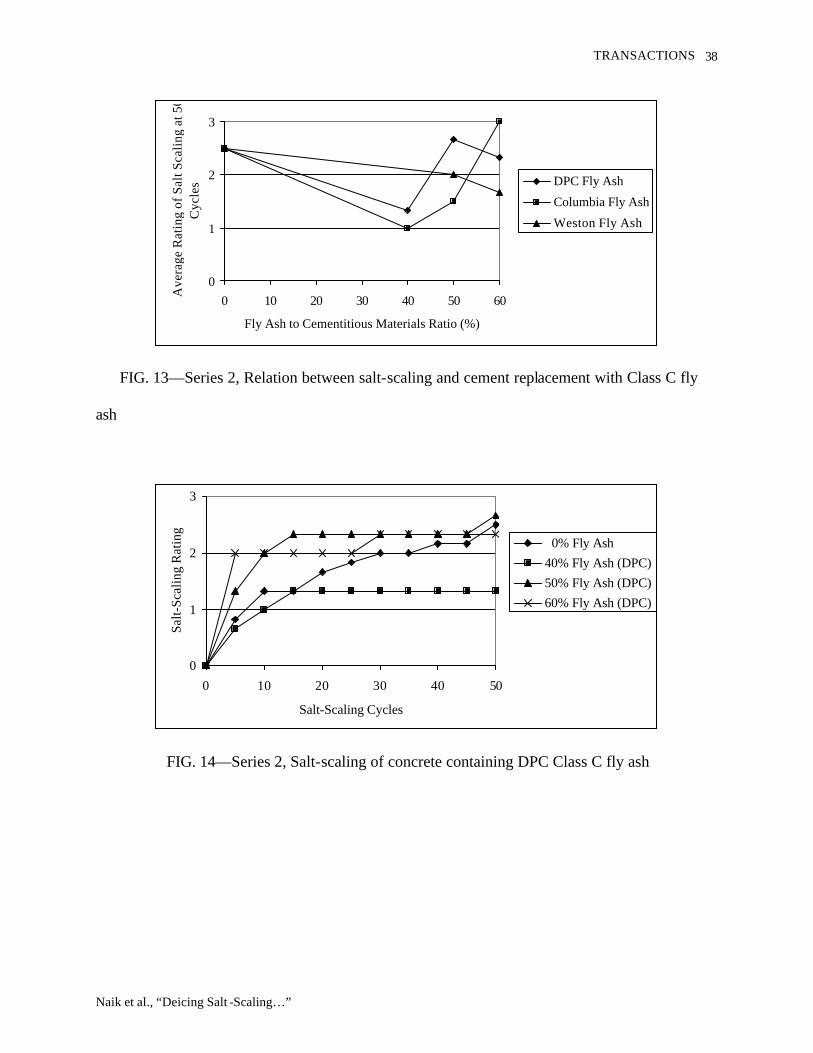
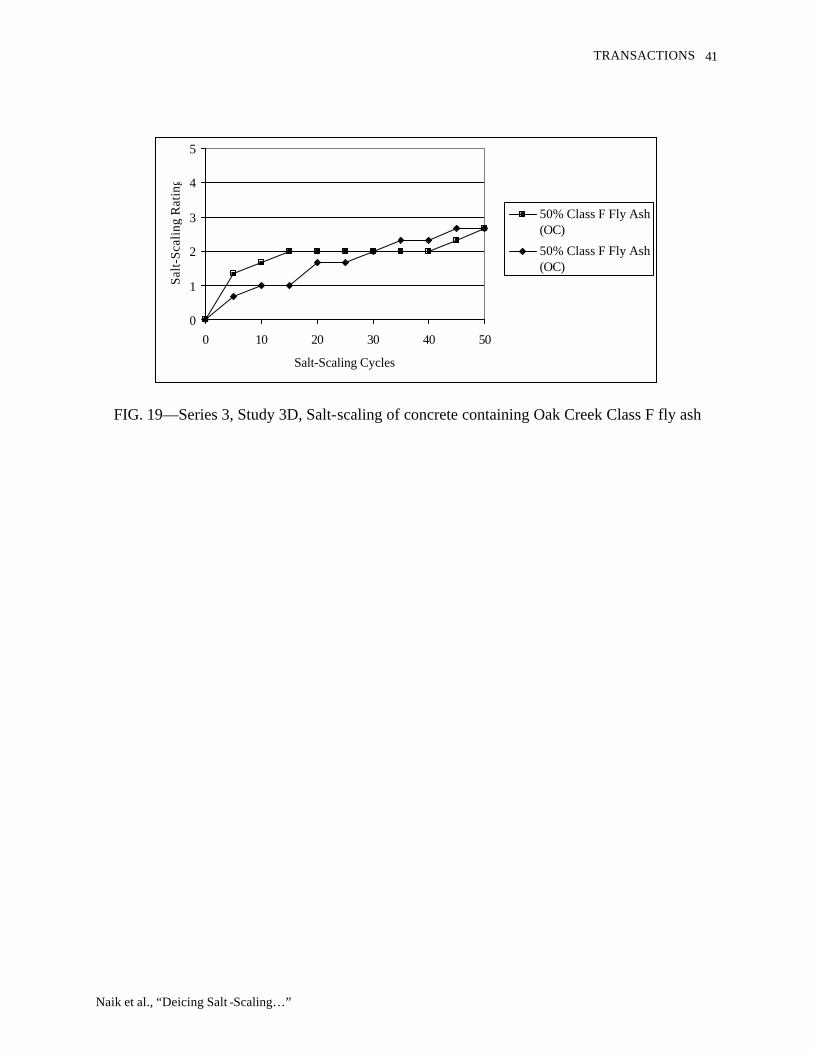
Series 2—The salt-scaling test results for the Series 2 mixtures are shown in Figs. 13 to 16.
These results indicate that the salt-scaling ratings after 50 cycles of freezing and thawing for
concretes with a fly ash to cementitious materials ratio of 50 % and 60 % were approximately the
same as the control mixture having no fly ash (a visual rating of between 2 and 3). Mixtures
with 40 % fly ash to cementitious materials ratio had a visual rating of approximately 1 (very
slight scaling). This is a significant improvement for salt-scaling resistance when compared to
the control mixture (0 % fly ash).
The effect of the fly ash source on salt-scaling of concrete after being subjected to 50 cycles
of freezing and thawing showed only minor differences in the visual rating between the three
sources. However, at 5 to 15 cycles, concrete containing DPC fly ash at 50 % and 60 % of total
cementitious materials showed a visual rating which was higher than mixtures containing
Columbia or Weston fly ash for the same percentage fly ash contents.
Series 3—The salt-scaling test results for the Series 3 mixtures are shown in Figs. 17 through
19. A laboratory evaluation of Study 3B mixtures was not conducted. The salt-scaling results of

TRANSACTIONS
Naik et al., “Deicing Salt -Scaling…”
18
Study 3A mixtures (Fig. 17) indicate that the concrete with fly ash to cementitious materials ratio
of 19 % (PP Class C fly ash) had highest salt-scaling resistance (scaling rating of about 1). The
mixture containing 40 % fly ash (OC Class F) showed lower resistance (scaling rating of 2, slight
to moderate scaling). For the mixture with 50 % fly ash (PP Class C), salt-scaling resistance was
the poorest (scaling rating of 4, indicating moderate to severe scaling).
Salt-scaling results of Study 3C mixture indicate that, after 50 cycles of freezing and
thawing, salt-scaling of the mixture containing 53 % Oak Creek Class F fly ash in total
cementitious materials was higher (scaling rating of 4) when compared to the mixture containing
67 % fly ash (scaling rating of 2), Fig. 18.
Salt-scaling results of Study 3D mixtures (Fig. 19) containing Oak Creek Class F fly ash with
fly ash to cementitious materials ratio of 50 % had the same visual rating (almost 3, moderate
scaling) after being subjected to 50 cycles of freezing and thawing.
Visual observations (in 2000) revealed that the pavement sections containing high volumes
of Class F fly ash (40 to 67 % FA) performed well in the field with only minor surface scaling.
All other pavement sections have experienced very little surface damage due to the scaling.
Conclusions
The experimental investigation carried out in this study led to the following main
conclusions:
• In general, strength properties of the air-entrained fly ash concretes were lower at the
very early ages relative to the reference air-entrained concrete without fly ash. However,
the fly ash mixtures exhibited a much higher rate of strength gain at later ages than that
indicated by the reference mixtures without fly ash, especially after seven days.
TRANSACTIONS
Naik et al., “Deicing Salt -Scaling…”
19
• The Series 1 concrete mixtures up to 45 % fly ash to cementitious materials ratio showed
excellent salt-scaling resistance according to ASTM C 672 criteria. The 56 % fly ash to
cementitious materials ratio mixture exhibited slight to moderate surface scaling.
However, the 74 % fly ash to cementitious materials ratio mixture experienced extensive
surface scaling when subjected to the salt-scaling tests. The level of entrained air content
was not an important parameter affecting concrete resistance to the salt-scaling within the
experimental range.
• The salt-scaling resistance of Series 2 mixtures having 50 % and 60 % Class C fly ash to
cementitious materials ratio was approximately the same as the control mixture without
fly ash. After 50 cycles of freezing and thawing, 40 % fly ash concrete mixture exhibited
noticeable improvement in resistance to salt-scaling when compared to the control
mixture. Minor differences existed between the three Class C fly ash sources (DPC,
Columbia, and Weston) for salt-scaling resistance of concrete after being subjected to 50
freezing and thawing cycles. However, the mixture with 50 % and 60 % DPC Class C fly
ash exhibited lower resistance to salt-scaling than the control mixture at 5 to 25 freezing
and thawing cycles.
• The laboratory evaluation of salt-scaling resistance indicated that, in many cases (Series 1
and 2), concrete containing up to 50 % of fly ash by mass of total cementitious materials
showed equivalent or even higher resistance to salt-scaling when compared with the
control concrete made without fly ash. Sometimes this was true for concrete containing
up to 60 % fly ash (Series 2). In some cases, concrete with higher percentage of fly ash
showed lower salt-scaling resistance (Series 2: C; and Series 3A) and, in other cases,

TRANSACTIONS
Naik et al., “Deicing Salt -Scaling…”
20
concrete with higher fly ash content showed higher salt-scaling resistance (Series 2: DPC,
W; and Series 3C).
Acknowledgements
The authors express their gratitude to Electric Power Research Institute (EPRI) for providing
partial financial support for the Series 1 tests of this project. They would like to thank Dean M.
Golden and Michael J. Miller of EPRI for their interest and help during this investigation. Partial
support for Series 1 tests was also provided by Advance Cast Stone Co., Random Lake, WI;
UWM Graduate School; and primary supporters of the UWM-Center for By-Products
Utilization. The authors would also like to thank the College of Engineering and Applied
Science for providing additional funding and facilities for conducting this research work.
The primary sponsors of the Center for By-Products Utilization are: Dairyland Power
Cooperative, La Crosse, Wisconsin; Madison Gas and Electric Company, Madison, Wisconsin;
Manitowoc Public Utilities, Manitowoc, Wisconsin; National Minerals Corporation, St. Paul,
Minnesota; Northern States Power Company, Eau Claire, Wisconsin; We Energies, Milwaukee,
Wisconsin; Wisconsin Power and Light Company, Madison, Wisconsin; and, Wisconsin Public
Service Corporation, Green Bay, Wisconsin. Their continuing help and interest in the activities
of CBU are gratefully acknowledged. Their significant support in conduct of this research was
invaluable. Series 2 project was supported by the primary sponsors of the Center.
The help provided by staff of the Center for By-Products Utilization and former graduate
assistants, Wenyi Hu and Congli Ye, in data collection is gratefully acknowledged. All the
laboratory activities for the Series 2 research were conducted by Brian Moen and Scott Belonger
under the supervision of Robert M. Wendorf. Their dedicated work helped assure high quality,
carefully conducted laboratory activities. The authors are grateful for their help.
TRANSACTIONS
Naik et al., “Deicing Salt -Scaling…”
21
Series 3 projects were supported by We Energies. The authors are very grateful for the
opportunity to work on this field project. They would like to acknowledge and thank Bruce W.
Ramme and John H. Tews for their continuing encouragement and interest in high-volume fly
ash concrete technology development and demonstration projects. Series 3 testing for salt-
scaling was conducted by Dr. V. Mohan Malhotra of CANMET. Their generous help and
support are gratefully acknowledged.
References
Afrani, I. and Rogers, C., December 1994, “Effects of Different Cementing Materials and Curing
on Concrete Scaling,” Cement, Concrete and Aggregates, Vol. 16, No. 2, pp. 132-139.
Barrow, R. S., Hadchiti, K. M., Carrasquillo, P. M., and Carrasquillo, R. L., 1989, “Temperature
Rise and Durability of Concrete Containing Fly Ash,” Proceedings of the Third International
Conference on the Use of Fly Ash, Silica Fume, Slag, and Natural Pozzolans in Concrete, V.
M. Malhotra, Ed., Trondheim, Norway, ACI Special Publication No. SP-123, Vol. 1, pp. 331-
348.
Bilodeau, A., Carette, G. G., Malhotra, V. M., and Langly, W. S., 4-9 August 1991, “Influence of
Curing and Drying on Salt Scaling Resistance of Fly Ash Concrete,” Proceedings of the
Second International Conference on Concrete Durability, Montreal, Canada, Vol. 1, ACI
Special Publication No. SP-126, pp. 201-228.
Bilodeau, A. and Malhotra, V. M., 1992, “Concrete Incorporating High Volumes of ASTM Class
F Fly Ashes: Mechanical Properties and Resistance to Deicing Salt Scaling and to Chloride-
Ion Penetration,” Proceedings of the Fourth CANMET/ACI International Conference on the
Use of Fly Ash, Silica Fume, Slag, and Natural Pozzolans in Concrete, V. M. Malhotra, Ed.,
Istanbul, Turkey, Vol. 1, ACI Special Publication No. SP-132, pp. 319-349.
TRANSACTIONS
Naik et al., “Deicing Salt -Scaling…”
22
Bilodeau, A., Sivasundaram, V., Painter, K. E., and Malhotra, V. M., January-February 1994,
“Durability of Concrete Incorporating High Volumes of Fly Ash From Sources in the U.S.,”
ACI Materials Journal, Vol. 91, No. 1, pp. 3-12.
Bouzoubaa, N., Zhang, M. H., and Malhotra, V. M., October 2001, “Mechanical Properties and
Durability of Concrete Made With High-Volume Fly Ash Blended Cements Using a Coarse
Fly Ash,” Cement and Concrete Research, Vol. 31, No. 10, pp. 1393-1402.
Browne, F. P. and Cady, P. D., 1975, “Deicer Scaling Mechanisms in Concrete,” ACI Special
Publication No. SP-47, pp. 101-119.
Gebler, S. H. and Klieger, P., 1986, “Effect of Fly Ash on the Durability of Air-Entrained
Concrete,” Proceedings of the Second International Conference on the Use of Fly Ash, Silica
Fume, Slag and Natural Pozzolans in Concrete, Madrid, Spain, V. M. Malhotra, Ed., ACI
Special Publication No. SP-91, Vol. 1, pp. 483-519.
Hadchti, K. M. and Carrasquillo, R. L., August 1988, Abrasion Resistance and Scaling
Resistance of Concrete Containing Fly Ash, Research Report No. 481-3, Center for
Transportation Research, Bureau of Engineering Research, Unive rsity of Texas at Austin.
Johnston, C., April-May 1987, “Effects of Microsilica and Class C Fly Ash on Resistance of
Concrete to Rapid Freezing and Thawing and Scaling in the Presence of Deicing Agents,”
Proceedings of the Katharine and Bryant Mather International Conference on Concrete
Durability, Atlanta, Georgia, ACI Special Publication No. SP-100, pp. 1183-1204.
Langan, B. W., Joshi, R. C., and Ward, M. A., 1990, “Strength and Durability of Concrete
Containing 50% Portland Cement Replacement by Fly Ash and Other Materials,” Canadian
Journal of Civil Engineering, Vol. 17, pp. 19-27.
Malhotra, V. M., Carette, G. G., Bilodeau, A., and Sivasundaram, V., 4-9 August 1991, “Some
TRANSACTIONS
Naik et al., “Deicing Salt -Scaling…”
23
Aspects of Durability of High-Volume ASTM Class F (Low-Calcium) Fly Ash Concrete,”
Proceedings of the Second International Conference on Concrete Durability, Montreal,
Canada, Vol. 1, ACI Special Publication No. SP-126, pp. 65-76.
Mehta, P. K., 1993, Concrete: Structure, Properties and Materials, 2nd Edn., Prentice-Hall,
Inc., Englewood Cliffs, NJ.
Naik, T. R., Singh, S. S., and Hossain, M. M., January 1993a, “Abrasion Resistance of High-
Volume Fly Ash Concrete Systems,” A Final Progress Report Prepared for Electric Power
Research Institute (EPRI), CBU Report No. 176, Center for By-Products Utilization,
Department of Civil Engineering and Mechanics, University of Wisconsin-Milwaukee.
Naik, T. R., Singh, S. S. and Hossain, M. M., March 1993b, “Permeability of Concrete
Incorporating Large Quantities of Fly Ash,” A Final Progress Report, Prepared for EPRI,
CBU Report No. 180, Center for By-Products Utilization, Department of Civil Engineering
and Mechanics, University of Wisconsin-Milwaukee.
Naik, T. R., Singh, S. S., and Ye, C., March 1993c, “Fatigue Behavior of Plain Concrete Made
With or Without Fly Ash,” A Final Progress Report Prepared for EPRI, CBU Report No. 181,
Center for By-Products Utilization, Department of Civil Engineering and Mechanics,
University of Wisconsin-Milwaukee.
Naik, T. R., Singh, S. S., Gillot, M. A. and Hossain, M. M., May 1993d, “Mechanical and
Structural Properties of Concrete Containing Fly Ash,” A Final Progress Report Prepared for
EPRI, CBU Report No. 185, Center for By-Products Utilization, Department of Civil
Engineering and Mechanics, University of Wisconsin-Milwaukee.
Naik, T. R., Singh, S. S. and Hossain, M. M., July 1993e, “Freezing and Thawing Durability of
Concrete Incorporating Class C Fly Ash,” A Final Progress Report Prepared for EPRI, CBU
TRANSACTIONS
Naik et al., “Deicing Salt -Scaling…”
24
Report No. 199, Center for By-Products Utilization, Department of Civil Engineering and
Mechanics, University of Wisconsin-Milwaukee.
Naik, T. R., Singh, S. S. and Hossain, M. M., October 1993f, “Salt Scaling Resistance of High
Volume Class C Fly Ash Concrete,” A Final Progress Report Prepared for EPRI, CBU
Report No. 206, Center for By-Products Utilization, Department of Civil Engineering and
Mechanics, University of Wisconsin-Milwaukee.
Naik, T. R., Singh, S. S., and Ramme, B. W., July-August 1998, “Mechanical Properties and
Durability of Concrete Made With Blended Fly Ash,” ACI Materials Journal, Vol. 95, No. 4,
pp. 454-462.
Neville, A. M., 1969, “Behavior of Concrete in Saturated Solutions and Weak Solutions of
Magnesium Sulfate or Calcium Chloride,” Journal of Materials, Vol. 4, No. 4, pp. 781-816.
Pigeon, M., Talbot, C., Marchand, J., and Hornain, H., October 1996, “Surface Microstructure
and Scaling Resistance of Concrete,” Cement and Concrete Research, Vol. 26, No. 10, pp.
1555-1566.
Tyson, S. S., January 1991, “Freeze-Thaw Durability of Coal Fly Ash Concrete,” Proceedings of
the Ninth ACAA International Coal Ash Use Symposium, EPRI Report No. GS-7162, Vol. 1,
Electric Power Research Institute, Palo Alto, CA, pp. 10-1 through 10-14.
Verbeck, G. and Klieger, P., January 1956, “Studies of Salt Scaling of Concrete,” Highway
Research Board Bulletin 150.
Whiting, D., 1989, “Deicer-Scaling Resistance of Lean Concrete Containing Fly Ash,”
Proceedings of the Third International Conference on Fly Ash, Silica Fume, Slag, and
Natural Pozzolans in Concrete, V.M. Malhotra, Ed., Trondheim, Norway, ACI Special
Publication No. SP-123, Vol. 1, pp. 349-372.
TRANSACTIONS
Naik et al., “Deicing Salt -Scaling…”
25
TABLE 1—Properties of cementa
Chemical Composition Cement,
Series 1
Mixture
Cement,
Series 2
Mixture
Cement,
Series 3
Mixture
3A1,
3A2, 3A3
Cement,
Series 3
Mixture
3D1
ASTM C
150, Type
I
Silicon Dioxide, SiO2 (%) 20.2 20.0 20.0 ... ...
Aluminum Oxide, Al2O3 (%) 4.7 4.3 4.7 ... ...
Iron Oxide, Fe2O3 (%) 0.3 2.5 2.7 ... ...
Total, SiO2 + Al2O3 + Fe2O3 (%) 25.2 26.8 27.4 ... ...
Sulfur Trioxide, SO3 (%) ... 2.3 4.7 ... 3 max.
Calcium Oxide, CaO (%) 64.1 65.0 63.0 ... ...
Magnesium Oxide, MgO (%) 0.9 2.0 3.7 ... 6 max.
Titanium Dioxide, TiO2 (%) 0.3 0.0 0.3 ... ...
Potassium Oxide, K2O (%) 0.1 0.6 0.7 ... ...
Sodium Oxide, Na2O (%) 0.1 0.3 0.2 ... ...
Moisture Content (%) ... ... 0.4 ... ...
Loss on Ignition (%) ... 2.0 1.3 ... 3.0 max.
Physical Properties of Cement
Air Content (%) 7.1 9.5 ... 8 12 max.
Fineness (m2/kg) 396 351 405 280 min.
Autoclave Expansion (%) 0.03 -0.02 ... +0.05 0.8 max.
Specific Gravity 3.16 3.16 ... 3.04 ...
Compressive Strength, (MPa)
1-day
3-day
7-day
28-day
16.2
25.7
31.5
37.9
13.8
24.2
29.4
37.7
...
11.7
21.6
26.6
32.8
...
12.4 min.
19.3 min.
...
Vicat Time of Initial Set (min) 145 204 ... 214 45~375
aTest data for cement used in Series 3B and 3C mixtures are not available.
TRANSACTIONS
Naik et al., “Deicing Salt -Scaling…”
26
TABLE 2—Chemical and physical properties of fly ash - Series 1, 2, and 3 mixturesa
Chemical Composition
Series 1,
Pleasant Prairie
Fly Ash
Series 2, Dairyland Fly Ash
Series 2, Columbia Fly Ash
Series 2,
Weston Fly Ash
Series 3, Mix. 3A1, Oak
Creek Fly Ash
Series 3, Mix. 3A2 & 3A3, Pleasant Prairie
Fly Ash
Series 3, Mix. 3D1, Oak
Creek Fly Ash
ASTM C 618 Limits
for Class
C
ASTM C 618 Limits
for Class
F SiO2 (%) 30.5 32.2 34.9 30.9 51.4 32.9 51.2 ... ...
Al2O3 (%) 17.2 18.1 19.6 18.3 26.3 19.4 28.0 ... ... Fe2O3 (%) 5.5 5.6 6.2 5.2 15.3 5.4 14.4 ... ...
SiO2 + Al2O3 + Fe2O3 (%)
53.2 55.9 60.7 54.4 93.0 57.7 93.6 ≥ 50.0 ≥ 70.0
SO3 (%) ... 2.6 2.3 3.4 1.4 3.8 ... ≤ 5.0 ≤ 5.0 CaO (%) 28.6 31.9 27.6 31.4 3.6 28.9 2.3 ... ... MgO (%) 4.7 4.7 5.4 6.1 1.1 4.8 1.3 ... ... TiO2 (%) 1.6 1.6 1.4 1.5 1.1 1.6 1.3 ... ... Ka2O (%) 0.4 0.3 0.4 0.3 1.9 0.3 2.53 ... ... Na2O (%) 2.1 2.0 1.8 2.6 1.0 2.0 0.69 ≤ 1.5 ≤ 1.5
Moisture Content (%)
0.1 ... ... ... 0.7 0.8 0.2 ≤ 3.0 ≤ 3.0
Loss on Ignition (%)
0.3 0.9 0.5 0.4 6.5 0.6 6.6 ≤ 6.0 ≤ 6.0
Physical Tests Fineness
Retained on No. 325 Sieve (%)
18.6 25.5 15.4 16.9 25.7 15.9 32.6 ≤ 34.0 ≤ 34.0
Strength Activity Index with
Cement, 7-days (% of Control)
... 78.7 82.4 86.3 ... ... 75 ≥ 75.0 ≥ 75.0
Strength Activity Index with
Cement, 28-days (% of Control)
105 85.4 98.7 97.4 93 79 85.7 ≥ 75.0 ≥ 75.0
Strength Activity Index with Lime,
7 days (MPa)
... ... ... ... 7.7 ... ... ... ≥ 0.7
Water Requirement (%
of Control)
90.4 97.1 95.0 95.0 103 89 100 ≤ 105 ≤ 105
Autoclave Expansion (%)
0.02 0.04 +0.01 +0.05 0.0 0.11 +0.02 ±0.8 max.
±0.8 max.
Specific Gravity 2.78 2.58 2.62 2.68 2.34 2.58 2.24 ... ... aTest data for fly ash used in Series 3B and 3C mixtures are not available.
TABLE 3—Mixture proportions and fresh concrete test results for Series 1 mixtures - 41
TRANSACTIONS
Naik et al., “Deicing Salt -Scaling…”
27
MPa specified strength
Mixture Numbera C-1 (S)
C-2 (S)
C-3 (P)
P4-1 (S)
P4-2 (P)
P4-3 (P)
P4-4 (S)
P4-6 (P)
P4-7 (P)
P4-8 (P)
Fly Ash Source (PP)b
... ... ... PP PP PP PP PP PP PP
Fly Ash to Cementitious
Materials Ratio (%)
0 0 0 18 35 45 55 18 56 74
Cement (kg/m3) 398 397 375 328 259 220 174 320 179 110 Fly Ash (kg/m3) 0 0 0 72 139 182 216 71 226 316 Water (kg/m3) 123 125 135 139 133 150 141 129 136 155
w/cm 0.31 0.32 0.36 0.35 0.34 0.37 0.36 0.33 0.33 0.36 Sand, SSD (kg/m3) 715 712 682 695 677 659 624 693 655 607 Aggregates, 25-mm max., SSD
(kg/m3)
1259 1264 1182 1207 1172 1153 1099 1180 1139 1145
Superplasticizer (L/m3)
2.7 2.7 2.9 2.9 2.8 2.7 2.6 2.8 2.7 2.6
Air Entraining Admixture (ml/m3)
280 330 300 300 350 515 810 420 885 1380
Slump (mm) 25 45 120 65 160 120 55 145 115 120 Air Content (%) 2.6 2.4 6.3 4.1 5.2 6.4 8.5 6.7 7 6.4 Air Temperature
(°C) 20 20 21 21 21 21 26 ... ... ...
Concrete Temperature (°C)
20 20 23 23 23 26 26 21 26 25
Fresh Concrete Density (kg/m3)
2500 2500 2445 2395 2395 2360 2250 2400 2335 2365
Hardened Concrete Density,
SSD (kg/m3)
2515 2510 2510 2430 2430 2415 2280 2440 2340 2325
aSub-designation P indicates primary mixtures for this research project and S indicates
Secondary (duplicate) mixtures.
bFly Ash Source: PP- Pleasant Prairie
TABLE 4—Mixture proportions and fresh concrete test results for Series 2 mixtures - 35
TRANSACTIONS
Naik et al., “Deicing Salt -Scaling…”
28
MPa specified strength
Mix. Number REF D-40 D-50 D-60 C-40 C-50 C-60 W-40 W-50 W-60 Fly Ash Sourcea ... DPC DPC DPC C C C W W W
Cement Replacement (%)
0 35 45 55 35 45 55 35 45 55
Fly Ash to Cementitious
Materials Ratio (%)
0 40 50 60 40 50 60 40 50 60
Cement (kg/m3) 366 231 193 158 227 192 154 233 187 155 Fly Ash (kg/m3) 0 156 197 242 153 196 235 157 191 237 Water (kg/m3) 113 122 124 124 113 110 115 119 114 117
w/cm 0.31 0.31 0.32 0.31 0.30 0.28 0.30 0.30 0.30 0.30 Sand, SSD (kg/m3) 877 855 846 840 820 827 827 853 809 815
Aggregates, 19-mm max., SSD
(kg/m3)
1082 1046 1033 1031 1031 1023 1007 1047 1001 1011
Superplasticizer (L/m3)
3.2 3.4 2.6 2.3 2.8 2.6 2.0 1.9 1.9 1.9
Air Entraining Admixture (ml/m3)
341 434 530 580 410 464 531 387 406 464
Slump (mm) 118 130 105 99 83 99 76 80 105 77 Air Content (%) 6.6 6.1 6.1 5.0 6.6 6.2 7.2 6.0 6.4 6.4 Air Temperature
(°C) 18 17 16 17 17 16 19 14 16 16
Concrete Temperature (°C)
17 15 15 13 12 17 19 15 17 17
Fresh Concrete Density (kg/m3)
2439 2394 2375 2405 2363 2363 2336 2413 2319 2349
Hardened Concrete Density,
SSD (kg/m3)
2431 2482 2467 2455 2422 2414 2405 2330 2358 2395
aFly Ash Sources:
DPC - Dairyland Power Cooperative
C – Columbia
W - Weston

TRANSACTIONS
Naik et al., “Deicing Salt -Scaling…”
29
TABLE 5—Mixture proportions and fresh concrete test results for Series 3 mixtures - field
study 3A
Mixture Number 3A1 3A2 3A3 Batch Number 3A1-1 3A1-2 3A1-3 3A2-1 3A2-2 3A2-3 3A3-1 3A3-2 3A3-3 3A3-4
Specified Strength (MPa)
24 24 24 24 24 24 24 24 24 24
Fly Ash Sourcea OC OC OC PP PP PP PP PP PP PP Fly Ash to
Cementitious Materials Ratio
(%)
40 40 40 50 50 50 19 19 19 19
Cement (kg/m3) 216 216 216 176 174 176 284 285 284 283 Fly Ash (kg/m3) 145 145 144 176 176 176 67 65 65 65 Water (kg/m3) 97 98 98 92 95 90 102 107 88 109
w/cm 0.27 0.27 0.27 0.26 0.27 0.26 0.29 0.31 0.25 0.31 Sand, SSD
(kg/m3) 916 912 916 687 767 770 812 810 816 810
Aggregates, 19-mm max., SSD
(kg/m3)
1096 1092 1091 1014 1120 1126 1146 1142 1146 1144
Superplasticizer (L/m3)
4.6 4.6 4.6 0 0 0 0 0 0 0
Air Entraining Admixture
(ml/m3)
580 580 580 464 464 464 271 271 271 271
Slump (mm) 102 44 44 70 70 76 51 32 44 76 Air Content (%) 6.2 5.2 5.0 5.4 5.0 5.5 5.9 5.2 6.0 6.0 Air Temperature
(°C) 32 37 37 36 24 26 24 24 24 24
Concrete Temperature (°C)
29 33 33 33 30 30 29 29 29 28
Fresh Concrete Density (kg/m3)
2310 2273 2342 2333 2355 2368 2347 2366 2316 2185
Date of Construction
August 1990
August 1990
August 1990
August 1990
August 1990
August 1990
August 1990
August 1990
August 1990
August 1990
aFly Ash Sources:
OC - Oak Creek Power Plant (Class F Fly Ash)
PP - Pleasant Prairie (Class C Fly Ash)
TABLE 6—Mixture proportions and fresh concrete test results for Series 3 mixtures - field
study 3B

TRANSACTIONS
Naik et al., “Deicing Salt -Scaling…”
30
Mixture Number
3B1 3B2 3B3
Batch Number 3B1-1
3B1-2
3B1-3
3B4 to 8
3B2-1
3B2-2
3B2-3
3B2-4 to 7
3B3-1
3B2-2
3B3-3
3B3-4
Specified Strength (MPa)
28 28 28 28 28 28 28 28 28 28 28 28
Fly Ash Sourcea
… … … … PP PP PP PP PP PP PP PP
Fly Ash to Cementitious
Materials Ratio (%)
0 0 0 0 19 19 19 19 24 24 24 24
Cement (kg/m3)
335 335 335 335 285 285 285 285 267 267 267 267
Fly Ash (kg/m3)
0 0 0 0 65 65 65 65 83 83 83 83
Water (kg/m3) 178 178 178 178 173 173 173 173 173 173 173 173 w/cm 0.53 0.53 0.53 0.53 0.49 0.49 0.49 0.49 0.49 0.49 0.49 0.49
Sand, SSD (kg/m3)
753 753 753 753 747 747 747 747 747 747 747 749
Aggregates, 38-mm max., SSD
(kg/m3)
1133 1133 1133 1133 1127 1127 1127 1127 1127 1127 1127 1127
Slump (mm) 38 38 44 38-44 32 25 51 19-44 51 38 44 25 Air Content
(%) 4.5 4.7-
5.1 4.2 4.2-
4.9 5.7 5.0-
5.1 5.8 4.0-
7.0 4.8 3.8-
4.1 5.1 8.2
Air Temperature
(°C)
13 15 12 - 18 23 24 10-18 12 11 14 20
Concrete Temperature
(°C)
18 17 23 - 23 23 24 19-24 21 22 23 21
Fresh Concrete Density (kg/m3)
2429 2435 2435 - 2429 2429 2422 2390-2441
- 2416 2435 2389
Date of Construction
1988 1988 1988 1988 1988 1988 1988 1988 1988 1988 1988 1988
aFly Ash Source: PP - Pleasant Prairie (Class C Fly Ash)
TABLE 7—Mixture proportions and fresh concrete test results for Series 3 mixtures - field
study 3C

TRANSACTIONS
Naik et al., “Deicing Salt -Scaling…”
31
Mixture Number 3C1 3C2
Fly Ash Source OC OC
Fly Ash to Cementitious Materials
Ratio (%)
53 67
Cement (kg/m3) 181 133
Fly Ash (kg/m3) 208 267
Water (kg/m3) 119 125
w/cm 0.31 0.31
Sand, SSD (kg/m3) 837 837
Coarse aggregates, SSD (kg/m3) 1,127 1,127
Superplasticizer (HRWRA) (mL/m3) 194 217
Air Entraining Admixture (mL/m3) 1,238 1,238
Slump (mm) 57 44
Air Content (%) 5.8 5
Air Temperature (°C) 11.1 12.2
Concrete Temperature (°C) 17.8 17.0
Fresh Concrete Density (kg/m3) 2,339 2,339
Date of Construction November
1991
November
1991
TRANSACTIONS
Naik et al., “Deicing Salt -Scaling…”
32
0
10
20
30
40
50
60
0 25 50 75 100
Age (days)
Com
pres
sive
Str
engt
h (M
Pa)
0% Fly Ash18% Fly Ash35% Fly Ash45% Fly Ash56% Fly Ash74% Fly Ash
FIG. 1—Series 1, Compressive strength of concrete containing PP Class C fly ash versus age
0102030405060708090
0 0 0 18 18 56 56 74 74
Fly Ash to Cementitious Materials Ratio (%)
Com
pres
sive
Str
engt
h (M
Pa) 28-day
91-day365-day
AC2.4%
AC2.6%
AC6.3%
AC4.1% AC
6.7%
AC7%
AC8.5%
AC3.7%
AC6.4%
FIG. 2—Series 1, Compressive strength versus fly ash content for concretes with different air
contents
TRANSACTIONS
Naik et al., “Deicing Salt -Scaling…”
33
0
10
20
30
40
50
60
0 2 4 6 8 10
Air Content (%)
28-D
ay C
ompr
essi
ve S
tren
gth
(MPa
)0 %18 %56 %74 %
Fly Ash to Cementitious
Materials Ratio
FIG. 3—Series 1, 28-day compressive strength versus air content for concretes with different
fly ash contents
0
10
20
30
40
50
60
70
80
1 7 28 91 365
Age (days)
Com
pres
sive
Stre
ngth
(MPa
)
Ref.
D-40
D-50
D-60
FIG. 4—Series 2, Compressive strength of concrete containing DPC Class C fly ash
TRANSACTIONS
Naik et al., “Deicing Salt -Scaling…”
34
0
10
20
30
40
50
60
70
1 7 28 91 365
Age (days)
Com
pres
sive
Stre
ngth
(MPa
)Ref.
C-40
C-50
C-60
FIG. 5—Series 2, Compressive strength of concrete containing Columbia Class C fly ash
0
10
20
30
40
50
60
70
1 7 28 91 365
Age (days)
Com
pres
sive
Str
engt
h (M
Pa)
Ref.
W-40
W-50
W-60
FIG. 6—Series 2, Compressive strength of concrete containing Weston Class C fly ash

TRANSACTIONS
Naik et al., “Deicing Salt -Scaling…”
35
0
10
20
30
40
50
0 25 50 75 100
Age (days)
Com
pres
sive
Str
engt
h (M
Pa)
3A-3, 19% Class C Fly Ash (PP)
3A-2, 50% Class C Fly Ash (PP)3A-1, 40% Class F Fly Ash (OC)
FIG. 7—Series 3, Mixtures 3A-1, 3A-2, and 3A-3, Compressive strength versus age
20
25
30
35
40
45
50
0 20 40 60 80 100 120
Age (days)
Com
pres
sive
Str
engt
h (M
Pa)
3B-3, 24% Classs C Fly Ash (PP)
3B-2, 19% Classs C Fly Ash (PP)
3B-1, 0% Fly Ash
FIG. 8—Series 3, Mixtures 3B-1, 3B-2, and 3B-3, Compressive strength versus age

TRANSACTIONS
Naik et al., “Deicing Salt -Scaling…”
36
0
10
20
30
40
50
0 25 50 75 100 125 150 175 200
Age (days)
Com
pres
sive
Str
engt
h (M
Pa)
3C-2, 67% Class F Fly Ash (OC)
3C-1, 53% Class F Fly Ash (OC)
FIG. 9—Series 3, Mixtures 3C-1 and 3C-2, Compressive strength versus age
0
10
20
30
40
50
60
0 25 50 75 100
Age (days)
Com
pres
sive
Str
engt
h (M
Pa)
3D1-4, 50% Class F Fly Ash (OC)
3D1-2, 50% Class F Fly Ash (OC)
FIG. 10—Series 3, Mixtures 3D1-2 and 3D1-4, Compressive strength versus age
TRANSACTIONS
Naik et al., “Deicing Salt -Scaling…”
37
0
1
2
3
4
5
0 10 20 30 40 50 60 70 80
Fly Ash to Cementitious Materials Ratio (%)
Scal
ing
Rat
ing
at 5
0 C
ycle
s
0
1
2
3
4
5
Cum
ulat
ive
Scal
ed-O
ff
Res
idue
at 5
0 C
ycle
s (k
g/m
2)
ScalingRating at 50Cycles
CumulativeScaled-OffResidue at50 Cycles
FIG. 11—Series 1, Relation between salt-scaling and cement replacement with PP Class C
fly ash
00.10.20.30.40.50.60.70.80.9
0 0 0 18 18 56 56
Fly Ash to Cementitious Materials Ratio (%)
Cum
ulat
ive
Scal
ed-O
ff R
esid
ue a
t
50 C
ycle
s (k
g/m2 )
AC 2.4% AC
2.6%
AC 6.3% AC
4.1%
AC 6.7%
AC 7%
AC 8.5%
FIG. 12—Series 1, Effect of air content on salt-scaling of concrete at different ratios of
cement replacement with PP Class C fly ash
TRANSACTIONS
Naik et al., “Deicing Salt -Scaling…”
38
0
1
2
3
0 10 20 30 40 50 60
Fly Ash to Cementitious Materials Ratio (%)
Ave
rage
Rat
ing
of S
alt S
calin
g at
50
Cyc
les DPC Fly Ash
Columbia Fly Ash
Weston Fly Ash
FIG. 13—Series 2, Relation between salt-scaling and cement replacement with Class C fly
ash
0
1
2
3
0 10 20 30 40 50
Salt-Scaling Cycles
Salt-
Scal
ing
Rat
ing
0% Fly Ash40% Fly Ash (DPC)50% Fly Ash (DPC)60% Fly Ash (DPC)
FIG. 14—Series 2, Salt-scaling of concrete containing DPC Class C fly ash

TRANSACTIONS
Naik et al., “Deicing Salt -Scaling…”
39
0
1
2
3
0 10 20 30 40 50
Salt-Scaling Cycles
Salt-
Scal
ing
Rat
ing
0% Fly Ash
40% Fly Ash (C)
50% Fly Ash (C)
60% Fly Ash (C)
FIG. 15—Series 2, Salt-scaling of concrete containing Columbia Class C fly ash
0
1
2
3
0 10 20 30 40 50
Salt-Scaling Cycles
Salt-
Scal
ing
Rat
ing
0% Fly Ash
50% Fly Ash (W)
60% Fly Ash (W)
FIG. 16—Series 2, Salt-scaling of concrete containing Weston Class C fly ash

TRANSACTIONS
Naik et al., “Deicing Salt -Scaling…”
40
0
1
2
3
4
5
0 10 20 30 40 50
Salt-Scaling Cycles
Salt-
Scal
ing
Rat
ing
50% Class C Fly Ash(PP)40% Class F Fly Ash(OC)19% Class C Fly Ash(PP)
FIG. 17—Series 3, Study 3A, Salt-scaling of concrete containing PP Class C and Oak Creek
Class F fly ash
0
1
2
3
4
5
0 10 20 30 40 50
Salt-Scaling Cycles
Salt-
Scal
ing
Rat
ing
53% Class F Fly Ash(OC)67% Class F Fly Ash(OC)
FIG. 18—Series 3, Study 3C, Salt-scaling of concrete containing Oak Creek Class F fly ash
TRANSACTIONS
Naik et al., “Deicing Salt -Scaling…”
41
0
1
2
3
4
5
0 10 20 30 40 50
Salt-Scaling Cycles
Salt-
Scal
ing
Rat
ing
50% Class F Fly Ash(OC)
50% Class F Fly Ash(OC)
FIG. 19—Series 3, Study 3D, Salt-scaling of concrete containing Oak Creek Class F fly ash


![A review of salt scaling: I. Phenomenology review of salt scaling: I. Phenomenology ... than freezing a saline solution on the surface of the slab [2], ... which is twice that used](https://static.fdocuments.net/doc/165x107/5b0c5ba27f8b9a61448e53c4/a-review-of-salt-scaling-i-review-of-salt-scaling-i-phenomenology-than-freezing.jpg)