
DEFINITIVE FEASIBILITY STUDY ON PANDA HILL 20 April 2016 ASX Release ASX Code: CXX DEFINITIVE...
43
1 20 April 2016 ASX Release ASX Code: CXX DEFINITIVE FEASIBILITY STUDY ON PANDA HILL Highlights Cradle’s DFS results demonstrate a highly economic and robust Project: o NPV8 pre-tax US$796M o NPV8 post-tax US$542M o IRR 32% (pre-tax) o IRR 27% (post-tax) Key Feasibility Study results include: o Life Of Mine average EBITDA of US$112M pa o Initial capital expenditure of US$196M o Life Of Mine of 30 years o Average LOM production of 5,400tpa contained Niobium (8,200tpa Ferroniobium) The Project commences at 1.3Mtpa and ramps up to 2.6Mtpa after year 4 of production, whereupon: o NPV8 pre-tax increases to US$1,408M o NPV8 post-tax increases to US$1,022M Initial 10 years mining predominantly in the higher grade Angel Zone Key production figures for first 10 years: o Average grade: 0.68% Nb2O5 o Average recovery: 61% o Strip ratio: 2.5 to 1 Key production figures for Life Of Mine: o Average grade: 0.54% Nb2O5 o Average recovery: 61% o Strip ratio: 1.5 to 1 Offtake agreement is well advanced, in documentation phase Project debt financing is well underway Mining Licence and Environmental Licenses are in place Cradle Resources Limited is pleased to announce the results of its Definitive Feasibility Study (“DFS” or “Study”) for the Panda Hill Niobium Project (“Project”) in Tanzania. The Study is reported in accordance with JORC Code (2012), and is based on Mineral Resources. The Study incorporates the results of the extensive investigations and feasibility work carried out since 2012 by Cradle and more recently by Panda Hill Tanzania Limited (“PHT”). Cradle owns 50% of PHT which in turn owns 100% of the Project. For personal use only
Transcript of DEFINITIVE FEASIBILITY STUDY ON PANDA HILL 20 April 2016 ASX Release ASX Code: CXX DEFINITIVE...

1
20 April 2016
ASX Release ASX Code: CXX
DEFINITIVE FEASIBILITY STUDY ON PANDA HILL
Highlights
Cradle’s DFS results demonstrate a highly economic and robust Project:
o NPV8 pre-tax US$796M
o NPV8 post-tax US$542M
o IRR 32% (pre-tax)
o IRR 27% (post-tax)
Key Feasibility Study results include:
o Life Of Mine average EBITDA of US$112M pa
o Initial capital expenditure of US$196M
o Life Of Mine of 30 years
o Average LOM production of 5,400tpa contained Niobium (8,200tpa Ferroniobium)
The Project commences at 1.3Mtpa and ramps up to 2.6Mtpa after year 4 of production, whereupon:
o NPV8 pre-tax increases to US$1,408M
o NPV8 post-tax increases to US$1,022M
Initial 10 years mining predominantly in the higher grade Angel Zone
Key production figures for first 10 years:
o Average grade: 0.68% Nb2O5
o Average recovery: 61%
o Strip ratio: 2.5 to 1
Key production figures for Life Of Mine:
o Average grade: 0.54% Nb2O5
o Average recovery: 61%
o Strip ratio: 1.5 to 1
Offtake agreement is well advanced, in documentation phase
Project debt financing is well underway
Mining Licence and Environmental Licenses are in place
Cradle Resources Limited is pleased to announce the results of its Definitive Feasibility Study (“DFS” or “Study”) for the Panda Hill Niobium Project (“Project”) in Tanzania. The Study is reported in accordance with JORC Code (2012), and is based on Mineral Resources. The Study incorporates the results of the extensive investigations and feasibility work carried out since 2012 by Cradle and more recently by Panda Hill Tanzania Limited (“PHT”). Cradle owns 50% of PHT which in turn owns 100% of the Project.
For
per
sona
l use
onl
y

2
Craig Burton, the Chairman of Cradle, commented: “The Cradle DFS demonstrates an exceptionally strong Project. The numbers speak for themselves. On any analysis, this Project is likely to be brought into production and deliver substantial profits for many years. This will be the first new niobium producer in 40 years and the only new producer of this rare metal in the foreseeable future. The demand for niobium continues to grow strongly due to the burgeoning world-wide demand for new-age materials and associated elements like lithium, graphite and niobium. Panda Hill is only seeking to capture a modest portion of this ongoing demand growth. The next 6 months will focus on off-take and debt financing whereupon a decision to mine is expected. During this financing period, front end engineering and fine tuning of the Project will continue, ensuring a rapid and smooth transition into construction.” This is a DFS prepared by Cradle and not PHT. It is a formal technical, resource and project development study which assesses the viability of developing and mining the Panda Hill deposit to a level reasonably sufficient to support a decision to mine (subject to finance). However, this Cradle DFS is not intended to support an immediate decision to mine due to ongoing work by PHT on off-take and debt financing. It is expected that PHT will complete its DFS incorporating this additional work in about 6 months’ time. In the meantime, given the strong results achieved to date, PHT will likely undertake a program of Front End Engineering and Design work (“FEED”) overlapping this debt financing period. In effect, the FEED will reduce the Project construction period by undertaking work in the next 6 months that would ordinarily be undertaken post decision to mine. PHT is still to finalise a work program and budget for the FEED, and a further announcement will be made when this is available. The key inputs to this DFS were delivered by South African based project engineers MDM Technical Africa Pty Ltd who undertook plant design and operating cost and capital expenditure estimation and incorporated technical aspects from:
Coffey Mining Pty Ltd for the Mineral Resource estimate;
SRK Consulting (Australasia) Pty Ltd for the geotechnical analysis and mine planning, including open pit optimisation, pit design, and production scheduling and associated cost estimates;
SGS Canada Inc. for metallurgical test work;
SLR Consulting (Africa) Pty Ltd for tailings and water studies and associated cost estimates; and
MTL Consulting Company Ltd for environmental and social studies. Roskill Consulting Group Limited provided to Cradle a Ferroniobium Pricing Study dated February 2016 which includes baseline price forecasts for the period 2015 to 2045 (in real 2015 dollars). The DFS incorporates a price deck comprising 60% Roskill’s US$ price deck and 40% Roskill’s Euro price deck, which commences at an average price of US$37.56/kg Nb for 2015. The DFS assumes that the Project commences at a throughput of 1.3 million tonnes per annum and is ramped up to 2.6 million tonnes per annum after four years production, with this ramp up funded by Project cash flows. The total mine life is 30 years with aggregate throughput being 72.4 Mt of ore at a strip ratio of 1.5 to 1. Unless otherwise stated, the DFS calculates the NPVs and IRR as at a decision to mine. The first 10 years of production (20.6 Mt of mill feed) is based solely upon Measured and Indicated Resources, with payback of all upfront and expansion capital well within this period. The 30 year life of mine is based upon 35.3 Mt of Measured and Indicated Resources (49%) and 37.1 Mt of Inferred Resources (51%).
For
per
sona
l use
onl
y
3
JORC required Cautionary Statement concerning Production Target Results including Inferred Resources Cradle advises that the production targets after the first 10 years and related results reflected in this announcement are preliminary in nature as conclusions are drawn partly from Inferred Mineral Resources. There is a low level of geological confidence associated with Inferred Mineral Resources and there is no certainty that further exploration work will result in the conversion of Inferred Mineral Resources to Indicated or Measured Mineral Resources or that the production target itself will be realised. The conversion of the Measured and Indicated Resources included in the first 10 years of production to Proven and Probable Reserves is to be undertaken post this DFS and is expected to be straight-forward given the DFS results. The Mineral Resources underpinning the DFS have been prepared in accordance with the JORC Code (2012) by Mr Ingvar Kirchner of Coffey Mining (Perth). Competent Person statements and the relevant responsible persons are compiled at the end of this announcement.
For
per
sona
l use
onl
y

4
THE PANDA HILL DFS IN SUMMARY POSITIVE FINANCIALS
Cash flow modelling of the Project demonstrates highly positive financial returns. The modelling is based upon 100% ownership, no debt, 30 year life of mine, the Roskill price deck, and the MDM, SLR and SRK supplied capital and operating costs (as set out further below). The key financial results are:
Summary Financial Data – At Decision to Mine
NPV8 (pre-tax) US$796M
NPV8 (post-tax) US$542M
NPV10 (pre-tax) US$602M
NPV10 (post-tax) US$404M
IRR (pre-tax) 32%
IRR (post-tax) 27%
EBITDA/annum (average LOM) US$112M
Upfront Capital Cost US$196M
Production (average LOM) 5,400tpa Nb (8,200tpa FeNb)
Operating Cost (average LOM) US$21.34/kg Nb (total cash cost)
LOM 30 years
The Project becomes particularly attractive when production is ramped up to 2.6mtpa after the 4th year of production. The key financial results at that time are:
Summary Financial Data – After Ramp Up
NPV8 (pre-tax) US$1,408M
NPV8 (post-tax) US$1,022M
NPV10 (post-tax) US$1,231M
NPV10 (post-tax) US$899M
EBITDA/annum US$121M
CAPITAL COSTS
The construction capital required for a 1.3Mtpa plant is estimated to be US$195.6M (excluding working capital). This includes an 11.4% overall contingency and is based on the following:
Contract mining
Primary crusher with two-stage milling
Desliming, magnetic separation
Two-stage flotation
Concentrate leaching
Concentrate drying and FeNb converter
Onsite heavy fuel oil (“HFO”) power plant (leased)
Site access roads
For
per
sona
l use
onl
y

5
Tailing storage facility
Relocation of the Songwe Prison
The capital cost is based upon an estimate date of Q1 2016 with an accuracy of -10% +15%. The breakdown of the capital cost estimate is shown below:
Table 1: Capital Cost Estimate (Q1, 2016)*
*Note: figures have been rounded
Upfront capital is marginally higher than the PFS number even though initial throughput has been reduced. This is due to the inclusion of the calcite flotation circuit and the more extensive surface water management system. A plant expansion to 2.6Mtpa in conjunction with a conversion from heavy fuel oil (HFO) power to grid power is part of the base case and provision for a further capital expenditure of ~US$93M in Year 4 has been provided for in our analysis. This is expected to be funded out of the cash flows generated by the Project. In addition, the estimated peak working capital is US$8.7M. Pre-production costs are described below in Table 2.
Table 2 – Pre-Production Cost Estimate (Q1, 2016*)
Main Area DFS
US$M
PFS
US$M
First Fills 2.7 3.1
Spares 1.9 1.8
Owners 4.7 1.9
Pre-production 15.0 16.7
Prison Relocation 6.2 Excluded
Services Included 8.9
Total 30.5 32.6
*Note: figures have been rounded
Sustaining capital costs are described below in Table 3.
Main Area DFS
US$M
PFS
US$M
Mining 3.1 4.6
Plant 75.4 85.2
Infrastructure 7.8 10.6
Tailings & Water 42.5 23.3
In-directs 4.2 Included
Management Costs 14.3 16.3
Subtotal 147.3 140.1
Project Contingency 17.8 17.7
Project Escalation 0 0
Subtotal 17.8 17.7
Total 165.2 157.9
For
per
sona
l use
onl
y

6
Table 3 – Average Annual Sustaining Cost Estimate (Q1, 2016)*
Main Area DFS
US$M
PFS
US$M
Tailings dam lifts 2.8 4.7
Mining 0.1 0.0
Plant 0.9 3.0
Plant Mobile equipment 0.2 0.4
Other 0.1 0.4
Total 4.1 8.6
*Note: figures have been rounded
OPERATING COSTS
The production schedule and mine design has been based around a 30 year LOM, although the total Mineral Resource and pit optimisation results indicate that a LOM well in excess of this is possible. The operating cost is presented below assuming a 1.3Mtpa processing plant with an HFO onsite power plant for power supply, and an expansion to 2.6Mtpa and conversion to grid power in Year 4, with production ramping up in Year 5. The expected accuracy is -10% +15% and no contingency allowance has been assumed.
Years 1 – 4 (1.3Mtpa)* LOM*
Cost Centre US$M’s pa US$/t Ore US$/kg Nb US$M’s pa US$/t Ore US$/kg Nb
Mining 21.5 17.18 6.27 27.3 11.29 5.01
Processing & Maintenance 44.8 35.76 13.05 63.2 26.15 11.62
General & Administration 9.1 7.23 2.64 9.1 3.76 1.67
Total Mine Site Cash Costs 75.3 60.16 21.96 99.5 41.20 18.30
Product Transport 1.3 1.05 0.38 2.1 0.86 0.38
Marketing & Insurance 4.1 3.28 1.20 6.9 2.87 1.27
Royalties 4.5 3.58 1.31 7.5 3.11 1.38
Total Cash Cost 85.3 68.08 24.85 116.0 48.04 21.34
*Note: figures have been rounded
PRODUCTION PROFILE
The DFS is based upon an open pit mining operation providing 1.3Mtpa mill feed during the first 4 years of operation and then ramping up to 2.6Mtpa mill feed in year 5 for a total 30 year life of mine (“LOM”). The 1.3Mtpa niobium production rate equates to approximately 6% of world niobium production and the staged case is designed so as to both reduce upfront capital and achieve a more gradual entry into the market. Ferroniobium demand growth is estimated at 3% to 4% per annum, so the Project is expected to absorb only a portion of ongoing demand growth during its development and ramp up over the next 7 years. There have been no new niobium producers in the last 40 years, with no other likely entrants in the market in the foreseeable future.
For
per
sona
l use
onl
y

7
The production schedule has been developed to only target the carbonatite type mineralogy, with an average grade
of 0.68% Nb2O5 in the first 10 years of production and utilises only Measured and Indicated Resources in these years. Over the modelled 30 years the Project utilises 35.3 Mt of Measured and Indicated Resources (49%) and 37.1 Mt of Inferred Resources (51%). It is noted that through the 3 major drilling campaigns undertaken by Cradle, there has been a high conversion rate of Inferred Mineral Resources to Indicated Mineral Resources.
METALLURGY
Cradle undertook extensive metallurgical test work on representative core samples. A total of 243 batch flotation tests and 23 locked cycle tests were completed throughout a series of programs. A variability test program and three phases of pilot testing formed part of the DFS, with 55t of total material tested in the pilot plants at SGS Lakefield in Canada. The final piloting campaign was undertaken on two samples representative of the two material types that will form the majority of the mill feed (fresh carbonatite and moderately oxidised carbonatite). This work was considered to be definitive and validated the results of the previous benchscale testwork undertaken on multiple samples taken from across the complete range of potential feeds to the mill. The metallurgical recoveries achieved were in the range of 52% to 70% as shown in the graph below.
Niobium Recovery Trend by Geological Zone (SiO2 Grade in Feed)
The test work also demonstrated that the same circuit configuration could be used for all three main material types, and that only minor changes to the reagent addition rates were required to achieve the reported results. Continuous testwork was also undertaken on the leaching stage of the process (post flotation) to confirm the benchscale results achieved previously. The leaching process is carried out on the flotation concentrate and is used to remove the final impurities from the concentrate prior to the ferroniobium conversion step. This process was shown not only to be successful in reducing phosphate below required specification (0.04% vs. target of <0.15% P2O5), but also reduced SiO2 levels significantly (1.5% vs. target of <3.5%) and increased Nb2O5 grades, such that the grade constraints on the flotation process can be relaxed to improve recoveries.
PROCESSING
The flow sheet developed for the processing of the Panda Hill material consists of the following stages:
Single stage crushing of ROM
2016 Pilot Results
Fresh Moderately
Oxidised Oxidised
For
per
sona
l use
onl
y

8
Two-stage milling (SAG and Ball)
De-sliming
Pyrite flotation and magnetic separation
Carbonate flotation
De-sliming/dewatering
Niobium flotation
Pyrite flotation and magnetic separation
Two-stage concentrate leach (acid and caustic)
Concentrate dryer
Ferroniobium conversion
Product crushing and packaging
The process is similar to those used by other niobium producers, specifically Niobec for the flotation, Catalão for the concentrate leach, and CBMM for the final step in the conversion process. The plant has been sized initially for 1.3Mtpa mill feed so as to reduce upfront capital expenditure and enable a more gradual entry into the market. The planned expansion to 2.6Mtpa after the 4th year of production involves the construction of a second milling and flotation train together with expansion of the leaching and converter stages. A conversion from an onsite power plant to grid power is included in the expansion. All infrastructure, including the tailings storage facility, have been sized/designed with the expansion in mind.
EXCELLENT INFRASTRUCTURE
The Project has excellent nearby infrastructure including: TAZARA Rail line (2km away), a dry port located in Mbeya (26km away), the Dar es Salaam - Tunduma Highway (5km away), Songwe Airport (8km away), the Lafarge Songwe Cement Factory (6km away) and a major fuel depot in Mbeya. Access to water and power is also relatively simple with water harvesting from TSF and surrounds possible and the Songwe River, a major water course, running next to the mining tenements. Power is available at the Mbeya Substation and TANESCO is also planning a new 400kV power line that will run past the licence area. The Mbeya region is also a developing mining area with the established Shanta goldmine less than 100km away and Peak Resources developing a rare earths mine in the region. Mbeya city is a growing city with good educational and medical facilities, including technical colleges that are expected to be a source of personnel for the operations.
MINERAL RESOURCE
The total Carbonatite Mineral Resources is 178Mt at 0.50% Nb2O5 following a significant Mineral Resource upgrade finalised by Coffey Mining in April 2015.
Panda Hill April 2015 Resource Reported Above a 0.3% Nb2O5 Lower Cut-off
Combined Carbonatite
Classification Million Tonnes Nb2O5 % Nb2O5 Content (KT)
Measured 16 0.63 99
Indicated 53 0.50 263
Inferred 109 0.48 528
Total 178 0.50 891
For
per
sona
l use
onl
y
9
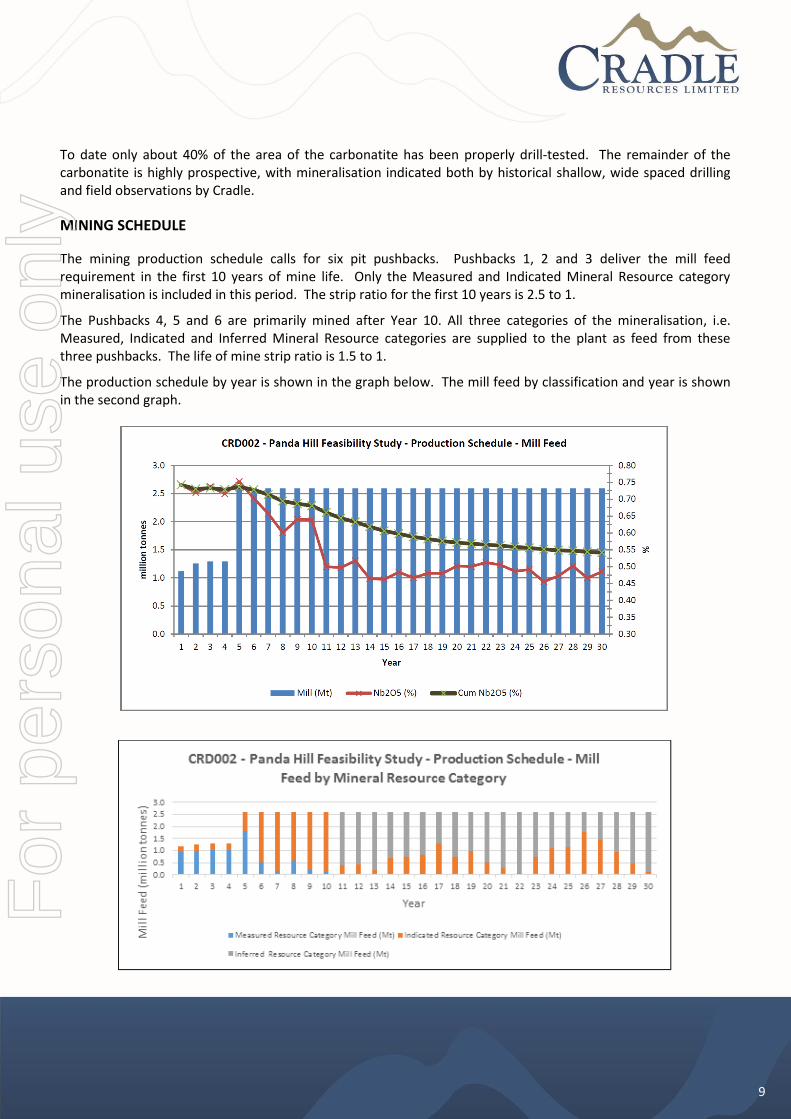
To date only about 40% of the area of the carbonatite has been properly drill-tested. The remainder of the carbonatite is highly prospective, with mineralisation indicated both by historical shallow, wide spaced drilling and field observations by Cradle.
MINING SCHEDULE
The mining production schedule calls for six pit pushbacks. Pushbacks 1, 2 and 3 deliver the mill feed requirement in the first 10 years of mine life. Only the Measured and Indicated Mineral Resource category mineralisation is included in this period. The strip ratio for the first 10 years is 2.5 to 1.
The Pushbacks 4, 5 and 6 are primarily mined after Year 10. All three categories of the mineralisation, i.e. Measured, Indicated and Inferred Mineral Resource categories are supplied to the plant as feed from these three pushbacks. The life of mine strip ratio is 1.5 to 1.
The production schedule by year is shown in the graph below. The mill feed by classification and year is shown in the second graph.
For
per
sona
l use
onl
y

10
NEXT STEPS
The DFS demonstrates a highly economic Project. It is expected that the Project will attract debt and equity finance over the next 6 months and thereupon proceed to decision to mine and construction. The key activities for the next 6 months are:
Finalising off-take agreements with the selected parties
Securing debt financing
Value engineering to look at cost reduction opportunities
Front end engineering and design on critical items to reduce the construction period
Construction permitting processes
Possible procurement of some long-lead items
Possible early site establishment for the main site based contractor
For
per
sona
l use
onl
y

11
DETAILED DFS DOCUMENTATION
Introduction Project Description and Tenements Geology and Exploration Exploration History Geology Mineral Resource Mining Processing Infrastructure Environmental and Social Capital Costs Operating Costs Marketing Financial Implementation Conclusions
INTRODUCTION
Cradle has completed its DFS on the Panda Hill Niobium Project in Tanzania. The Study has focussed on producing on average 5,400tpa (5.4Mkg/annum) niobium as ferroniobium over the LOM with a 1.3Mtpa concentrator initially (average 3,400tpa niobium) operating for 4 years and then expanding to 2.6Mtpa in Year 5, and associated infrastructure treating ore from an open cut mine. The Panda Hill Niobium Project is situated on the Panda Hill carbonatite exposure which is located near the town of Songwe. The Project is unique in that it is located close to highly developed surrounding infrastructure including the TAZARA Rail line (2km away), the Dar es Salaam - Tunduma Highway (5km away), the Songwe Airport (8km away) and major power infrastructure located in Mbeya (26km away). The Study incorporates the results of technical studies undertaken by Cradle since it acquired ownership rights to the Project in 2013 and represents the first significant work on the niobium deposit at Panda Hill since the 1970s. The Study has focused on developing an open cut mine and treating selected material through a milling and two-stage flotation process to produce a concentrate which after cleaning is suitable for standard ferroniobium production in an onsite converter. Standard grade ferroniobium constitutes ~90% of the world’s niobium consumption, with the product sold directly to steel mills where it is used in the production of high strength low alloy (HSLA) steels.
PROJECT DESCRIPTION AND TENEMENTS
The Panda Hill Niobium Project (Figure 1) is located in the Mbeya region in south western Tanzania approximately 680km west of the capital Dar es Salaam. The industrial city of Mbeya is situated only 26km from the project area and has a population of approximately 280,000 people. The Project is located near the main highway to the capital Dar es Salaam and in close proximity to the Songwe Airport which has regular domestic flights from Dar es Salaam and plans for regional expansion.
For
per
sona
l use
onl
y

12
Figure 1 - Panda Hill and surrounds
The Panda Hill Niobium deposit is covered by three Mining Licences (ML237/2006, 238/2006 and 239/2006) granted on 16 November 2006 and covering a total area of approximately 22.1 km2. Title of these licences have been transferred to Panda Hill Tanzania Limited (“PHT”) and subsequently extended for a further 10 years to 16 November 2026. Tremont Investments Limited (backed by Denham Capital) (“Tremont”) is the joint venture partner and has earned a 50% stake in the PHT, the operating company, through the payment of US$20M which has been used to finance the PFS and DFS activities. The corporate structure is shown below in Figure 2.
Figure 2 – Panda Hill Corporate Structure
For
per
sona
l use
onl
y

13
GEOLOGY AND EXPLORATION
Exploration History
The Panda Hill carbonatite intrusion has been subject to multiple phases of exploration work since the 1950s. This work has targeted the niobium and phosphate endowment of the deposit. From 1953 to 1965, the Geological Survey of Tanzania (“GST”) undertook mapping, diamond drilling and trenching (17 DDH for 1,405m) to assess the niobium and phosphate potential of the deposit. From 1954 to 1963, the Mbeya Exploration Company (“MBEXCO”) joint venture was formed between N. V. Billiton Maatschappij and Colonial Development Corporation, London. MBEXCO drilled 66 diamond holes for 3,708m, excavated numerous pits, sunk two shafts and undertook trial mining and constructed a trial gravity and flotation plant on site. Concentrate from site was sent to the Netherlands for further processing, with positive early metallurgical test work results noted. From 1978 to 1980 a Yugoslavian State Enterprise (“RUDIS”) undertook a joint study primarily on the phosphate endowment in collaboration with the Tanzanian Mining Industrial Association and State Mining Corporation (“STAMICO”). This work included mapping, diamond drilling and pitting (13 diamond holes for 1,306m). Cradle commenced exploration work on the Project in 2013 and has drilled 137 holes (RC and DDH) for 20,724m to December 2014. The bulk of the drilling has been on a 50m x 50m pattern with broader lines of up to 100m x 100m. Cradle also undertook extensive geological mapping campaigns over the carbonatite intrusion and has undertaken a magnetic and radiometric survey over the broader region. Geology
The Panda Hill carbonatite (Figure 3) is a mid-Cretaceous volcanic intrusion which has intruded into gneisses and amphibolites of the NE-SE trending mobile belt. It forms a steeply dipping, near-circular plug of approximately 1.5km diameter and is partly covered by fenitised country rocks and residual soil material. The fenite forms a "cap" or roof over the south of the carbonatite complex, and is in turn overlain by residual and transported soils. Volcanic ash over part of the complex suggests a later stage of volcanic activity. It is apparent that portions of fenite, ash and soil cover are underlain by carbonatite and these areas are only lightly explored. In the main exposed portion of the carbonatite evidence supports three stages of carbonatite activity outwards from the centre of the plug. An early-stage calcite carbonatite forms the core, while intermediate and late-stage carbonatites, composed of more magnesium-rich and iron-rich carbonatites, form the outer parts of the plug. Later stage apatite-magnetite rich rocks and ferro-carbonatite dykes are also found in the complex. Fenitisation of the pre-existing gneisses led to the development of potassium-rich rocks containing K-feldspar and phlogopite. The Sovite carbonatite from Panda Hill is composed mainly of calcite, which forms an average of 60 - 75% by volume. The fresh Sovite carbonatite may contain up to 5% apatite, with pyrochlore, magnetite, phlogopite and quartz. Dolomite-rich carbonatites (Rauhaugite) and ankerite/siderite-rich carbonatites (Beforesite) are also present and can be mineralised.
For
per
sona
l use
onl
y

14
Figure 3 – Geology plan showing the 2015 Mineral Resource regions and drilled section lines. The regions in blue (carbonatite) and pink (Fenite Cap) are both highly prospective with field mapping showing carbonatite and magnetite-carbonatite outcrop contained within many of these areas. Cradle has only drill tested approximately 40% of the area of the carbonatite, with the remaining areas having
mineralisation indicated by historical drilling.
The bulk of the Panda Hill niobium mineralisation is found within pyrochlore and lesser columbite. The bulk of the known mineralisation is within primary (i.e. fresh to moderately weathered) carbonatite lithologies, with Nb2O5 grades typically ranging from 0.1% to 1%. Higher-grade material is related to magnetite-rich bands and flow-banding (schlieren) within the carbonatite. Grades within the magnetite-carbonatite are up to 3% Nb2O5. The weathered carbonatite lithologies (elluvial soils and residual clays) can also contain up to 3% Nb2O5.
For
per
sona
l use
onl
y

15
Mineral Resource
The April 2015 Mineral Resource estimation was undertaken by independent mining consultants, Coffey Mining based in Perth, Western Australia and was reported in accordance to the Australasian Code for Reporting of Exploration Results, Mineral Resources and Ore Reserves, The JORC Code 2012 Edition (JORC 2012). The Mineral Resource update utilised both historical drilling (33 DDH for 2,389m) and drilling undertaken by Cradle up to December 2014 (144 RC and DDH holes for 20,142m). The 2014 Mineral Resource was estimated using Multiple Indicator Kriging (“MIK”) on 2m composites with a 25m by 25m by 5m (X by Y by Z) panel to generate a recoverable estimate emulating a selective mining unit (“SMU”) including mining dilution of 6.25m x 12.5m x 5m. Drill holes are spaced from 25m x 50m to 50m x 50m and 50m x 100m on sections oriented approximately NE-SW. The majority of drill holes are angled with dips of -60° towards 046°, targeting the SW dipping carbonatites and the pyrochlore rich flow banding entrained within the carbonatites. Assaying for Nb2O5 was by Borate fusion XRF carried out by SGS in Johannesburg. This method also provides assays for a multi-element suite including Fe2O3, SiO2, CaO, TiO2 as well as other major elements. Drill holes were sampled in their entirety except where there was no sample due to intersection of cavities. Diamond core was sampled on geological intervals, generally of 1m length. RC holes were sampled as 2m composites. Quality Assurance Quality Control (“QAQC”) data was supplied with the data and consisted of results for certified standards, blanks, field duplicates, coarse reject duplicates and umpire duplicates from the 2013 and 2014 drilling programs. The Panda Hill database contains approximately 2,700 calliper method bulk density determinations collected from the diamond holes drilled in 2013 and 2014. A relatively broad mineralisation envelope wireframe was defined for the Nb2O5 mineralisation for use in the MIK modelling (Zone code 100). A nominal 0.2% Nb2O5 lower cut-off was used to define the mineralisation. Wireframe surfaces were created to mark the divisions between mostly completely oxidised material, transitional material, and mostly fresh material. All wireframes were snapped to drill holes. The updated total Mineral Resource (Weathered and Primary Carbonatite) contained 178Mt at 0.50% Nb2O5 for 891kt of contained Nb2O5 reported at a 0.3% Nb2O5 cut off, and is based predominantly on new drilling undertaken in 2013 and 2014. The April 2015 Mineral Resource is summarised below in Table 1 by weathering type and the area of the Mineral Resource is shown in Figure 3 above.
For
per
sona
l use
onl
y

16
Panda Hill April 2015 Resource Combined Carbonatite Resource
Reported Above a 0.3% Nb2O5 Lower Cut-off
Classification Million Tonnes Nb2O5 % Nb2O5 Content (KT)
Measured 16 0.63 99
Indicated 53 0.50 263
Inferred 109 0.48 528
Total 178 0.50 891
Primary Carbonatite1
Classification Million Tonnes Nb2O5 % Nb2O5 Content (KT)
Measured 14 0.62 84
Indicated 50 0.49 247
Inferred 103 0.48 496
Total 167 0.50 828
Weathered Carbonatite2
Classification Million Tonnes Nb2O5 % Nb2O5 Content (KT)
Measured 2 0.67 15
Indicated 3 0.53 15
Inferred 6 0.52 32
Total 11 0.55 63
Note: Figures have been rounded. 1 Primary Carbonatite is defined as a region of fresh to moderately oxidised material dominated by carbonatite lithologies. This material is expected to have a higher metallurgical recovery. 2 Weathered Carbonatite is a region dominated by weathered material comprising oxidised and strongly oxidised carbonatite with other mixed lithologies. This material is expected to have a lower recovery than the Primary Carbonatite material.
Mining
The mining study was undertaken by SRK Consulting Australasia (“SRK”) and assumed development of the Panda Hill deposit by conventional open cut mining based on drill, blast, load and haul using a typical medium fleet arrangement of two 120 tonne excavator and six to eighteen 90 tonne haul trucks (e.g. CAT 777) . Contract mining is assumed and mining costs have been based on proposals received by potential contractors. Open pit optimisation was used to identify the optimum economic pit shape based on the highest project cashflow. The Whittle process used Coffey’s MIK Mineral Resource block model and included the geo-metallurgical material interpretation. The embedded geomet model allowed selective mine planning to occur with the focus on selecting the carbonatite materials that are best treated in the selected process. The mineralised materials that have either lower grades or a lower than optimal metallurgical recoveries will be stockpiled in an Interim Stockpile (“ISP”) for future treatment, potentially in a gravity circuit prior to feeding to the flotation process. This processing option has been excluded from the current Study economics, but does represent a future upside for the Project. Open pit optimisations were based on:
Niobium price: US$44.00/kg Nb
Processing costs: US$22.5 to US$23.3/tonne of ore processed (depending on material type)
Processing recoveries: 55% to 68% (depending on material type)
For
per
sona
l use
onl
y

17
Pit slope angles: Bench-stack pit slope angles of 46o and 49o were derived for weathered material domains and 55o for fresh material domains
Strategic scheduling was undertaken on the selected Whittle pit shells and run such that the first 10 years of operation the Run of Mine (“RoM”) will be sourced solely from Measured and Indicated Mineral Resource material, any Inferred Mineral Resource or low grade material will be stockpiled. Thereafter Inferred Mineral Resource material was allowed to be process along with the remaining Measured and Indicated Mineral Resource material. A RoM grade of 0.70% Nb2O5 was achieved for the first 10 years of operation, with an average grade of 0.45% Nb2O5 achieved for the remaining LOM. The schedule target 1.3Mtpa for the first 4 years and 2.6Mtpa from Year 5 onwards. The impact of targeting only Measured and Indicated Mineral Resource material and ensuring higher grade mill feed in the first 10 years of operation has resulted in higher mining strip ratio in the early years. This results in higher mining costs, but the additional revenue generated from this strategy exceeds the added costs by a significant factor. The pit designs were based on the strategic scheduling and identified six pushbacks. The ultimate pit was identified based on meeting the 30-year LOM criterion. Pit designs were undertaken on these six pushbacks. Pushbacks 1 to 3 covered the first ten years, pushbacks 4 to 6 the remaining LOM. Detailed scheduling followed a similar approach to the strategic scheduling and achieved a RoM grade of 0.68% Nb2O5 for the first 10 years of operation, with an average grade of 0.49% Nb2O5 achieved for the remaining LOM. The results of the mining study are summarised below in Table 2 and 3 and in Figures 4 and 5.
Cautionary Statement concerning Production Target Results including Inferred Resources
Cradle advises that the production targets after the first 10 years and related results reflected in this announcement are preliminary in nature as conclusions are drawn partly from Inferred Mineral Resources. There is a low level of geological confidence associated with Inferred Mineral Resources and there is no certainty that further exploration work will result in the conversion of Inferred Mineral Resources to Indicated or Measured Mineral Resources or that the production target itself will be realised.
Table 2 – Mining Inventory Pushback 1, 2 &3 (Measured and Indicated Resources Only)
Pushback
Total material Mineralisation Nb2O5 grade
(%)
CaO grade
(%)
SiO2 grade
(%)
Fe2O3 grade
(%) (kBCM) (kt) (kBCM) (kt)
1 11,222 27,838 4,309 10,974 0.71 29.26 15.28 13.88
2 16,504 42,345 5,306 13,744 0.62 32.91 11.60 10.47
3 17,318 44,860 4,004 10,445 0.57 34.90 10.58 8.75
Subtotal 45,044 115,043 13,619 35,163 0.63 32.36 12.45 11.02
Table 3 – Mining Inventory Pushback 4, 5 & 6 (Measured, Indicated and Inferred Resource)
Pushback
Total material Mineralisation Nb2O5 grade
(%)
CaO grade
(%)
SiO2 grade
(%)
Fe2O3 grade
(%) (kBCM) (kt) (kBCM) (kt)
4 33,128 83,975 14,238 36,375 0.52 28.47 10.42 8.09
5 5,125 13,246 1,429 3,769 0.48 32.06 10.45 8.01
6 3,047 7,830 1,404 3,607 0.48 17.94 8.62 4.68
Subtotal 41,300 105,051 17,071 43,751 0.51 27.91 10.27 7.80
For
per
sona
l use
onl
y

18
Figure 4 – Panda Hill Production Schedule
Figure 5 – Panda Hill Production Schedule by Pushback
For
per
sona
l use
onl
y

19
Processing
The test work has been undertaken by SGS Canada and has consisted of a program of open circuit milling and flotation tests (243), backed up by 23 locked cycle tests, a variability program and three pilot plant campaigns. The three phases of flotation piloting consisted of the mini-pilot plant, which was set-up to test the influence of continuous operation, specifically the impact of recycle streams and flotation density. The results of this were used to design the circuit for the second campaign which was done at a much larger scale and over a longer operating period. This campaign identified the importance of water quality and the impact this can have on the niobium flotation circuit. The final definitive campaign was undertaken on the modified flotation circuit which include a pre-float to remove the active calcite/carbonate before the niobium flotation. A summary of the flotation results are shown in Table 5 below. The test work clearly demonstrated the robustness of the circuit for treating the carbonatite materials with recoveries ranging from 52% for the strongly oxidised materials through to over 70% for the fresh clean sovite material. A strong relationship between metallurgical recoveries and oxidation/weathering profile was demonstrated as part of the test work and an algorithm has been generated such that grade and recovery predictions can be made for specific material types.
Table 5 – Summary of flotation results
Material Zone Represented
Conc. Grade % Nb2O5
% Recovery Nb2O5
Previous Locked Cycle Tests (LCT)
Results
Fresh Sovite (Comp E) Primary / Fresh Zone 54.2 70.7
Fresh Carbonatite (Comp B) Primary / Fresh Zone 43.6 65.6
Weakly Oxidised Carbonatite (FC) Primary / Fresh Zone 47.5 61.0
Mod Oxidised Carbonatite (MOC) Transition / Mod
Oxidised 44.7 55.2
Strongly Oxidised Carbonatite (Comp D) Weathered / Strongly
Oxidised Zone 41.4 52.0
Strongly Oxidised Carbonatite (OC) Weathered / Strongly
Oxidised Zone 41.7 51.6
New LCT Results
Fresh Carbonatite (FC) Primary / Fresh Zone 47.2 72.0
Weakly Oxidised Carbonatite (FC) Primary / Fresh Zone 45.8 58.3
Mod Oxidised Carbonatite (MOC) Transition / Mod
Oxidised 44.8 62.9
Pilot Plant Results
Fresh Carbonatite (FC) Primary / Fresh Zone 42.6 71.2
52.2 66.6
Mod Oxidised Carbonatite (MOC) Transition / Mod
Oxidised
40.2 62.0
45.5 56.1
The variability study was also completed as part of the DFS testwork program. This work tested 34 individual samples and consisted of mineralogical, comminution and open-circuit bench-scale flotation. The results showed that although there was variation between the individual samples in each of the geological zones the average results were very similar to those achieved on the blended samples tested in the Prefeasibility Study (“PFS”).
For
per
sona
l use
onl
y

20
Table 6 – Summary of Variability Testwork Results
Fresh Carbonatite Mod Oxidised Carbonatite Oxidised Carbonatite
PFS Variability PFS Variability PFS Variability Sample
FC Ave Range MOC Ave Range OC Ave Range
Head Grade (%Nb2O5) 0.64% 0.47% 0.36-0.71% 0.76% 0.53% 0.38-0.67% 0.62% 1.01% 0.69-1.33%
Nb Recovery to Rougher Feed (%) 79.4% 82.9% 78.3-86.9% 79.0% 81.1% 78.1-86.3% 72.4% 71.5% 68.3-74.6%
Rougher Conc. Grade (%Nb2O5) 3.7% 2.1% 1.2-4.3% 4.1% 2.2% 1.6-3.3% 2.6% 3.4% 2.5-5.6%
Nb Recovery to Rougher Conc. (%) 71.2% 77.3% 69.8-85.5% 66.0% 70.4% 50.7-82.4% 64.6% 65.5% 60.4-69.2%
Final Conc. Grade (%Nb2O5) 47.5% 43.4% 36.4-46.9% 44.8% 40.7% 22.1-48.7% 44.6% 40.2% 30.4-48.7%
The concentrate cleaning test work was also undertaken at SGS Canada and included bench scale leaching tests on the flotation concentrates generated from the various programs. To confirm the process a semi-continuous test was undertake to assess reagent recycling. This was followed by a continuous leach test run of 5 days. The selected leaching process consists of a two-stage leach process with an acid leach followed by an alkaline leach, both of which occur under atmospheric conditions. Under these conditions no niobium losses occur as the pyrochlore and columbite minerals are refractory. All the tests showed the phosphate and silicate specification for the ferroniobium process could be met (see Table 7 below). Pyrometallurgical test work on the leach product is currently being undertaken. A recovery of 97% has also been assumed for the converter based on the experience of specialist consultants familiar with the process.
Table 7 – Summary of leaching tests on flotation concentrate
Feed Type
Leach Feed(Flotation Concentrate)
Leach Residue
(Converter Feed)
%Nb2O5 %SiO2 %P2O5 %Nb2O5 %SiO2 %P2O5
Converter Feed Targets >45% <3.5% <0.15%
Batch Tests
Average Flotation Concentrate 45.1 7.2 2.1 52.6 1.2 0.03
High Silicate Concentrate 43.5 10.3 1.9 57.5 1.1 0.05
High High Silicate Concentrate 40.5 20.9 1.3 53.5 2.2 0.06
Pilot Plant I Concentrate 41.2 7.3 3.9 51.9 1.8 0.09
Pilot Plant IIA Concentrate 39.6 6.8 1.3 47.3 1.0 0.04
Pilot Plant IIB Concentrate 40.0 6.9 1.9 50.4 0.9 0.04
Continuous Pilot Run
Pilot Plant IIA Concentrate 39.3 6.8 1.2 45.9 1.5 0.02
The selected flowsheet, and that which was based on the final piloting campaign, is based on upfront crushing followed by a two-stage SAG-Ball mill circuit. The milled product is de-slimed and subjected to magnetic separation to remove any magnetite before entering the staged flotation circuits. These consist of a pyrite float, calcite float with cleaning and the niobium flotation. There is a dewatering stage between calcite and flotation to ensure the correct water quality is achieved in the niobium circuit. The niobium flotation chemistry is based on an amine system of collectors with acid for pH control in the cleaners to reject silicate. The flotation concentrate, although high grade (~40-45% Nb2O5), does contain some impurities which must be removed prior to the ferroniobium converter. This is
For
per
sona
l use
onl
y

21
done through a two-stage leach process which removes the phosphates and sulphur, and also has the added advantage of reducing the final silicate grade if required. The final leach residue is dried and fed to a DC furnace for standard grade ferroniobium production using aluminium as a reductant. The final ferroniobium product is then crushed and packaged to meet the specific customer specifications. The proposed flowsheet is shown schematically in Figure 6. The process flowsheet described is similar to the circuits of the current niobium operations (Catalão, CBMM and Niobec), with the flotation regime most similar to Niobec which has a similar geology and mineralogy to the Panda Hill primary material. The leach is based on the Catalão process and the ferroniobium converter on some of the principles from the final stage of the CBMM pyrometallurgical circuit. The milling, flotation and leach circuits have been tested on all the major material types and the flowsheet has been shown to successfully treat, under similar process conditions, the range of carbonatites identified in the deposit (oxidised to fresh, including magnetite carbonatites), although with some variation in recovery and grade and reagent addition rates.
Figure 6 – Schematic of proposed flowsheet
The calculated recoveries for the process (excluding converter losses) for each pushback using a combination of the piloting results, the locked cycle tests, and the recovery algorithm, and weighted by material type, is shown in Table 8 below.
For
per
sona
l use
onl
y

22
Table 8 – Metallurgical Recoveries (Flotation) by Pushback
Material Types Niobium Recovery in Flotation (%Nb Recovery)
Pushback 1 Pushback 2 Pushback 3 Pushback 4 Combined
Fresh Carbonatite 64.3% 65.8% 66.4% 65.1% 65.6%
Moderately Oxidised Carbonatite (Transition)
57.7% 57.9% 58.4% 57.5% 57.9%
Oxidised Carbonatite (Weathered)
53.3% 53.5% 53.1% 53.1% 53.4%
Weighted Average* 59.8% 63.1% 64.3% 60.8% 61.7%
*Note: recoveries are weighted by the % material type within each pushback
Infrastructure
Infrastructure within the local area of the Project is already well established and as such the project development will only require significant investment in a tailings storage facility, surface water management, road upgrades, an onsite power plant and camp/accommodation. The regional infrastructure is shown in Figure 7 below.
Figure 7 – Location of the Project and surrounding infrastructure
Access – The project site is accessible via the Dar es Salaam – Tunduma Highway which runs to within approximately 5km of the site. An existing unsealed road accesses the project area and surrounding villages. A new 8km access road will be built from the highway to the plant. In addition a new diversion road around the perimeter of the mine will be
built to allow continued public travel between the villages in the south and the highway. Tailings storage facility (“TSF”) – The Tailings Storage Facility (TSF) is based on a High Density Thickened (HDT) tailings method of disposal. This method of disposal was selected for the project as it allows for maximum recycling of process water, minimises tailings volumes, thereby reducing costs and also minimises seepage to the groundwater systems so that lining of the TSF can be simplified. The design is based on a production rate of 1.3Mtpa for the first 4 years increasing to 2.6Mtpa for the remaining 26 year (30 year LOM), giving total storage capacity requirement for 72,4Mt. The tailings was assigned a placed average dry density of 1.6t/m3, at an SG of 2.98, which results in a required HDT TSF storage capacity of 45.5 million m3 over the Life of Mine (LOM). The HDT tailings are considered to
For
per
sona
l use
onl
y

23
be non-acid generating. The HDT TSF is constructed with downstream wall raises in 10 Phases over the LOM, with a 2 year start-up (Phase 1) wall followed by an additional 3 year capacity for Phase 2, a 4 year capacity for Phase 3, and a 3 year capacity for each of the Phases 4 to 10. The Phase 1 starter wall has a maximum height of 7,4m and a final LOM wall height of 29,5m.
Water – Water demand for the Project is anticipated to average 0.8Mm3 per annum for the first 4 years of operation. This increases to 1.3 Mm3 with the plant expansion to 2.6Mtpa. The surface water and ground water studies have indicated that in the initial stage of operation (1.3Mtpa) the plant can be self-sufficient with regarded to water if sufficient storage is provided to collect water during the wet season and feed this into the process during the dry season. This storage consists of two storm water dams alongside the TSF return water dam. When the expansion occurs, the local Songwe River is the most likely source of water for the Project, with a possible option of some ground water available from aquifers to the south east of the TSF structure. All three water sources; the Songwe River, boreholes and water harvesting/storage, are likely to be used to supply water during various phases of the Project.
Power – Power will be provided to plant and other infrastructure from an onsite HFO power plant. The base case assumes leasing the power plant and is based on discussions held with various providers. The opportunity to connect to the national grid by constructing a new transmission line that will connect the site to the Mbeya 220kV substation was investigated. The reliability of power on the 220kV distribution network has been shown to be very high, but there were concerns around the timing for the installation and from a risk perspective the HFO plant is more attractive. The connection to the national grid is then considered as an upgrade to the plant during the operation phase. This was assumed to occur in Year 4 in our analysis. Total installed capacity for the plant is anticipated to be 18MW with an operating load of 11MW. Energy costs are US$0.188/kWh, based on current fuel prices, with a reduction to US$0.085 when the connection to the grid occurs. The conceptual site layout is shown in Figure 8.
Figure 8 – Site layout
For
per
sona
l use
onl
y

24
Environmental and Social
As part of the initial development work undertaken by the previous owners an Environmental Impact Assessment Certificate (“EIAC”) for Panda Hill was issued in June 2005 and based on this a mining licence was issued to Panda Hill Mines Ltd. Although the mining licence is still in effect, a new EIAC is required as no development at the mine site was undertaken in the three years after the issuing of the certificate. As such a new Terms of Reference (“ToR”) and ESIA Scoping document was prepared as part of the Scoping Study. The ToR were accepted by the National Environmental Management Council (“NEMC”) in late 2013. The full ESIA program of work, including the wet season and dry season baseline studies and the social studies were undertaken during the PFS and DFS studies. The ESIA documentation was submitted to the NEMC in May 2015 and the EIA Certificate issued for the project on 18 August 2015. This ESIA complies with the Tanzanian standards, but the inclusion of the results from the dry season baseline study is required for this to meet the IFC complaint ESIA. This update is being finalised now and the final ESIA report will be issued in April 2016.
Capital Costs
The capital cost estimates for the Project are shown below in Table 9. The costs are presented in US dollars as at the first quarter 2016 (Q1 2016) to an accuracy of -10% +15%. The estimate was prepared by MDM Engineering with input from SLR Consulting for the tailings and water facilities and SRK Consulting for mining. The costs include a contingency of 11.4%.
Table 9 – Capital Cost Estimate (Q1, 2016)*
Main Area DFS
US$M
PFS
US$M
Mining 3.1 4.6
Plant 75.4 85.2
Infrastructure 7.8 10.6
TSF & Water 42.5 23.3
In-directs 4.2 Included
Management Costs 14.3 16.3
Subtotal 147.3 140.1
Project Contingency 17.8 17.7
Project Escalation 0 0
Subtotal 17.8 17.7
Total 165.2 157.9
*Note: figures have been rounded
Pre-production costs are described below in Table 10.
For
per
sona
l use
onl
y

25
Table 10 – Pre-Production Cost Estimate (Q1, 2016)*
Main Area DFS
US$M
PFS
US$M
First Fills 2.7 3.1
Spares 1.9 1.8
Owners 4.7 1.9
Preproduction 15.0 16.7
Prison Relocation 6.2 Excluded
Services Included 8.9
Total 30.5 32.6
*Note: figures have been rounded
Sustaining capital costs are described below in Table 11.
Table 11 – Annual Sustaining Cost Estimate (Q1, 2016)*
Main Area DFS
US$M
PFS
US$M
Tailings dam lifts 2.8 4.7
Mining 0.1 0
Plant 0.9 3.0
Plant Mobile equipment 0.2 0.4
Other 0.1 0.4
Total 4.1 8.6
*Note: figures have been rounded
The total capital costs are estimated at US$195.6M (excluding working capital). Peak working capital for the initial period has been estimated at US$8.7M. Upfront capital is similar to the PFS even though initial throughput has been reduced. This is due to the inclusion of the calcite flotation circuit and the more extensive surface water management system put in place.
A plant expansion to 2.6Mtpa in conjunction with a conversion from heavy fuel oil (HFO) power to grid power is part of the base case and provision for a further capital expenditure of ~US$93M in Year 4 has been provided for in our analysis. The breakdown is shown below in Table 12.
Table 12 – Expansion Capital Cost Estimate (Q1, 2016)*
Main Area Expansion Capital (DFS)
US$M
Mining 0
Plant 59.9
Infrastructure (Power) 15.3
TSF & Water 0
Management Costs 8.8
Subtotal 84.0
Project Contingency 8.9
Project Escalation 0
Subtotal 8.9
Total 92.9
For
per
sona
l use
onl
y

26
Operating Costs
The operating cash cost estimates are shown in Table 13. The cost estimates were prepared by MDM Engineering, with SRK Consulting providing the cost for the mining portion and SLR providing inputs for the tailings and water. The costs shown are the weighted average costs for the various material types treated in each period derived from the production schedule. The estimate is based on prices obtained during the first quarter 2016 (Q1 2016), and is to an accuracy of -10% +15%, no contingency has been included in these costs.
Table 13 – LOM Cost Estimate Summary (Q1, 2016)*
DFS Years 1 – 4 (1.3Mtpa) DFS LOM PFS LOM
Cost Centre US$M’s /
a US$/t Ore
US$/kg Nb
US$M’s / a
US$/t Ore
US$/kg Nb
US$M’s / a US$/t Ore US$/kg
Nb
Mining 21.5 17.18 6.27 27.3 11.29 5.01 30.6 15.38 6.64
Processing & Maintenance 44.8 35.76 13.05 63.2 26.15 11.62 45.7 22.97 9.91
General & Administration 9.1 7.23 2.64 9.1 3.76 1.67 10.8 5.45 2.35
Total Mine Site Cash Costs 75.3 60.16 21.96 99.5 41.20 18.30 87.1 43.80 18.90
Product Transport 1.3 1.05 0.38 2.1 0.86 0.38 2.2 1.11 0.48
Marketing & Insurance 4.1 3.28 1.20 6.9 2.87 1.27 5.1 2.59 1.12
Royalty 4.5 3.58 1.31 7.5 3.11 1.38 5.9 2.97 1.28
Total Cash Cost 85.3 68.08 24.85 116.0 48.04 21.34 100.4 50.47 21.78
* Note: figures have been rounded and exclude sustaining capital
Compared to the PFS processing costs over LOM are similar, but in early years while operating at 1.3Mtpa operating cost are higher due to the impact of the smaller throughput on the fixed costs. Marketing
Pricing – Most ferroniobium is sold under long-term contracts between producers and consumers. The three major producers sell direct to customers or through marketing subsidiaries or partners in Asia, Europe and North America. Less than 10% of total production is sold via the spot market. Contract prices are not disclosed but the trends can be seen from average trade values. Ferroniobium prices are not wholly demand-driven. Demand can certainly have an impact on price movements but the underlying price is ultimately controlled largely by CBMM. Ferroniobium prices are historically stable - US$40/kg Nb (±5%). The long-term trend in US prices is mirrored by that for Western Europe and Japan. Roskill Consulting Group RSG was commissioned by Cradle to produce an independent report including long-term ferroniobium pricing. These forecasts were used in the financial modelling, but are not presented here for competition purposes.
Supply – With regard to supply the three main niobium producers in the world (CBMM, Anglo American Brazil - Catalão and Magris Resources - Niobec) together have an installed capacity of almost 89ktpy Nb (135ktpy FeNb). The only other producers are in China, Africa and CIS, but their estimated annual capacity stands between only 500 and 800tpy Nb.
For
per
sona
l use
onl
y

27
CBMM has expanded its production capacity several times over the years and plans to expand further although its current status has not been made public and CBMM has postponed expansion plans in the past. Anglo American Brazil is increasing its annual ferroniobium capacity from 5ktpy Nb (in 2014) to 9ktpy, with ramp-up expected to be completed in 2017. Magris Resources reports production capacity as 5ktpy Nb. Several years ago, IAMGOLD (the previous owner of Niobec) announced plans to triple ferroniobium capacity but that it would not do so unless it found an investment partner. The expansion would involve a change in mining method, to block caving. Cradle understands that this expansion, the cost of which is estimated at US$750M, is not proceeding in the foreseeable future. Catalão and Niobec production is relatively stable at design throughputs, with CBMM adjusting their production to meet demand. All three main suppliers produce standard grade ferroniobium, although CBMM also produces high grade ferroniobium, niobium oxide, niobium metal and alloys. Demand – Relatively little of the niobium mined enters the market as ore or concentrate. The majority enters as ferroniobium, a direct feedstock for the steel industry. Brazil and Canada are the main exporters, with Brazil by the far the larger of the two. Approximately 90% of the global niobium consumption is used by the steel industry, of which HSLA steels make up the majority (>80% global consumption). The demand for niobium is effectively driven by two factors; an increase in overall steel production has traditionally been the biggest contributor to niobium growth, accounting for most of the annual growth seen in niobium consumption since 2002. Steel production is however strongly related to economic trends. The other factor is the intensity of use of niobium in the steel industry. On a global basis the average niobium intensity is 50g FeNb / t of steel, although this is greatly skewed across the different producers. In the developed countries e.g. USA, the intensity can be as high as 120g FeNb / t of steel, while for the developing world e.g. China and India the intensity is as low as 20g FeNb / t of steel. As the steel mix of these countries moves towards the higher quality steels, their consumption of niobium will increase. The main area for growth is definitely Asia, which has seen imports of ferroniobium increase much faster since the mid-2000s than anywhere else in the world. The growth split between the various countries in Asia is however mixed; Japan is relatively mature, South Korea’s demand continues to grow at healthy rates, while China and India remain the key drivers for future growth. Even a relatively small positive shift in their niobium usage intensity will increase demand significantly, and this is seen to be a more important influencer on demand in the future than economic growth. It is expected that China will gradually catch up other key markets in the quality of steel they produce as their steel industry is facing overcapacity and new regulations are being put in place. This will push global ferroniobium demand to new highs and producers are preparing to face this raise.
For
per
sona
l use
onl
y

28
Figure 14 – FeNb demand by region
End Users – The unique properties of niobium make it a vital component in a diverse range of products and applications. These properties include corrosion resistance, very high melting temperatures, superconductivity, shape memory properties, high coefficient of capacitance and bio-compatibility. Niobium is used in a variety of forms but standard grade ferroniobium (FeNb), as used in the steel industry, is the most common, accounting for almost 90% of total niobium usage. HSLA steels are the main niobium containing steels, accounting for the majority of niobium used in the steel industry. Other noteworthy niobium containing steels are stainless steels. HSLA steels themselves makeup for approximately 10% of the world’s steel production and this number is seen to rise constantly in the future. When niobium is added to these steels it acts as a grain refiner and precipitation hardener simultaneously improving the mechanical strength, toughness and corrosion resistance of steel. When used, niobium is added in small quantities (0.02%). Niobium additions at these rates cost only a few dollars / tonne steel, but can have significant benefit in terms of reduced quantities of steel being required for equivalent performance. The main applications of HSLA steels are oil and gas pipes, automobile body panels and chassis, bridges, high rise buildings and welded pipes (Figure 15 below).
For
per
sona
l use
onl
y

29
Figure 15 – End Users
Financial
The indicative financial results for the Project based on the inputs described previously are shown in Table 16 below. The key input data for the evaluation is:
Initial capital expenditure - US$165.2M
Pre-production - US$30.5
Working capital - US$8.7M
Average sustaining capital - $4.1M/annum
Average LOM operating cost - US$48.04/t mill feed (US$21.34/kg Nb)
Niobium Price as per Roskill Report o 40% Europe based o 60% USA based
Plant throughput – 1.3Mtpa ramping up to 2.6Mtpa in Year 5
Expansion capital - US$92.9M
ROM grades - 0.54% Nb2O5 LOM (0.68% Nb2O5 for the first 10 years)
Metallurgical recoveries - 61% (with 97% recovery in converter)
Government Royalty - 3%
Local Government Levy – 0.3%
Tax Rate - 30%
Marketing Fee– 2.5% Table 16 – Financial Analysis
Summary Financial Data at Decision to Mine
NPV8 (before tax) US$796M
NPV8 (after tax) US$542M
NPV10 (before tax) US$602M
NPV10 (after tax) US$404M
IRR (before tax) 32%
IRR (after tax) 27%
EBITDA/annum (average LOM) US$112M
Payback Period (from fully funded) 4.75 years
Average LOM Production 5,400t Nb (8,200t FeNb)
LOM 30 years
For
per
sona
l use
onl
y

30
Projected cash flow over time is summarised below in Figure 17. Capital expenditure starts in 2016 with pre-production costs and extends to first quarter 2018 when construction is planned to be completed. Operations start in Q2 2018 with the plant ramping up to full production after one year. Expansion capital occurs in Year 4 (2021), hence the reason for the negative cash flow in that year.
Figure 17 – Projected cash flow over time
The NPV10 value of the Project increases substantially in the first 5 years, as shown below.
Figure 18 – Rolling NPV10
For
per
sona
l use
onl
y

31
Sensitivity analysis using NPV10 for the key project drivers are shown below in Figure 19. The Project is most sensitive to price, recovery (and head grade), with operating cost having more of an impact than capital costs.
Figure 19 – Sensitivity analysis of key economic drivers
A number of scenarios were tested incorporating financing alternatives, price, and costs in various combinations. The 100% Equity was set as the base case and the scenarios are compared to this. Results are shown as changes to NPV10 and IRR
Figure 20 – Scenario Analysis (NPV10 & IRR)
For
per
sona
l use
onl
y

32
Implementation
The high level implementation schedule for the Project is shown below in Figure 21. The schedule indicates a construction period of 21 months and assumes a start date (i.e. decision to mine) of 1 October 2016. This start date is subject to completion of the off-take agreement and conclusion of the financing arrangements. As a lag exists between the completion of this DFS and the decision to mine an opportunity exists to undertake some critical tasks that impact the execution schedule prior to 1 October. For example a program of Front End Engineering and Design work (“FEED”) can overlap this debt financing period. In effect, the FEED will reduce the Project construction period by undertaking work in the next 6 months that would ordinarily be undertaken post decision to mine. A work program and budget for the FEED is still to be finalised and a further announcement will be made when this is available. With FEED the completion of the construction would be expected to occur at end Q1 2018, with the plant start-up in April 2018. This scenario has been taken as the base case for the financial modelling.
Figure 21 – Implementation schedule
Conclusions
The completion of Cradle’s DFS Study for the Panda Hill Niobium Project is an important step in progressing the Project. There are only three active niobium mines worldwide, while Panda Hill is the most advanced developing niobium project in the world. It has significant advantages in being an open cut operation, having excellent nearby infrastructure, low-cost capital, robust and low-cost flotation metallurgy, and an approved mining licence. There is no other niobium project in the world this advanced.
Execution Schedule - Panda Hill Niobium Project
Activities Target End Date Q4 2016 Q1 2017 Q2 2017 Q3 2017 Q4 2017 Q1 2018 Q2 2018 Q3 2018
Project Schedule June 2018
Mining March 2018
Mobilisation / Training May 2017
Haul Road March 2018
WRD/ISP/ROM pad March 2018
Tailings Storage Facility June 2018
Design & Engineering June 2017
TSF Construction June 2018
Storm Water Management April 2018
Processing Plant May 2018
Detailed Engineering August 2017
Procurement September 2017
Detailing/Fabrication November 2017
Delivery Phase January 2018
Construction Phase May 2018
Initial Site Establishment January 2017
Bulk Earthworks July 2017
Plant Buildings April 2018
External Infrastructure September 2017
Prison August 2017
Housing September 2017
Other Infrastructure July 2017
Access Roads August 2017
Commissioning June 2018
C3 Mill/Float June 2018
C3 Converter June 2018
For
per
sona
l use
onl
y

33
The DFS has identified the potential for a low operating cost, 1.3Mtpa operation that will produce ferroniobium, the most saleable niobium product. A feed grade of 0.68% Nb2O5 has been achieved for the first 10 years (average LOM feed grade of 0.54%) with flotation recoveries of 62% and a demonstrated concentrate specification that meets the requirements of producing a marketable standard grade ferroniobium.
An initial construction capital cost of US$165M with a pre-production requirement of US$31M (excluding working capital) was determined which included the required plant and infrastructure. It has been assumed that in the beginning power will be via leased HFO onsite power plant, but that this will be changed over to a national grid connection during the operating phase. A further US$93M has been allowed for the expansion of the plant to 2.6Mtpa and the construction of a transmission line so that the plant can connect to the national grid. Average LOM operating costs for the process are estimated at US$48.04/t RoM (US$21.34/kg Nb) incorporating the grid power from Year 5.
Positive financial metrics are indicated for the Project with a projected NVP8 (after tax) of US$542M and pre-tax IRR of 32% and a nominal pay-back period of 4.75 years (from fully funded) and inclusive of the expansion capital.
Cradle is in close communication with the Tanzanian Government and all parties are working to see the Project progress into production.
Competent Person’s Statement
The information in this document that relates to Exploration Results and Mineral Resources is based on information compiled or reviewed by Mr Neil Inwood who is a Fellow of The Australasian Institute of Mining and Metallurgy and a Member of the Australian Institute of Geoscientists. Mr Inwood is a full time employee of Verona. Mr Inwood has sufficient experience which is relevant to the style of mineralisation and type of deposit under consideration and to the activity which he is undertaking to qualify as a Competent Person as defined in the 2012 Edition of the ‘Australasian Code for Reporting of Exploration Results, Mineral Resources and Ore Reserves’. Mr Inwood consents to the inclusion in this document of the matters based on his information in the form and context in which it appears.
The information in this document relating to the Panda Hill Mineral Resource Estimate is extracted from the announcement entitled ‘Significant Resource Upgrade for Panda Hill Niobium Project’ dated 30 April 2015 and is available to view on http://www.cradleresources.com.au. The Company confirms that it is not aware of any new information or data that materially affects the information included in the original market announcement and that, in the case of Mineral Resources or Ore Reserves, all the material assumptions and technical parameters underpinning the estimates in the relevant market announcement continue to apply and have not materially changed. The Company notes that an updated Mineral Resource is underway and results will be released in Q2 2015. The Company confirms that the form and context in which the Competent Person's findings are presented have not been materially modified from the original market announcement.
Assumptions on the metallurgical and plant design factors and costs as related to the broader DFS study are provided by Mr Roger Gordon Leighton. Mr Leighton is an employee of MDM Engineering, South Africa, and is a Fellow of the SAIMM. Mr Leighton has sufficient relevant experience to qualify as a competent person as defined in the 2012 edition of the “Australasian Code for Reporting of Mineral Resources and Reserves”. Mr Leighton has consented to the inclusion of this information in the document in the form and context in which it appears.
Assumptions on the Mining factors, operating costs and pit design are provided by Mr Sjoerd Duim. Mr Duim is a consultant for SRK Consulting (Perth, Australia), and is a Member of the AusIMM. Mr Duim has sufficient relevant experience to qualify as a Competent Person as defined in the 2012 edition of the “Australasian Code for Reporting of Mineral Resources and Ore Reserves”. Mr Duim has consented to the inclusion of this information in the document in the form and context in which it appears.
Assumptions on the Environmental Aspects are provided by Dr. Willison Kaguga Mutagwaba. Dr Willison Kaguga Mutagwaba is a consultant for MTL Consulting (Tanzania), and is a Consulting Engineer Registered with the Engineers Registration Board of Tanzania and a Member of the Institution of Engineers Tanzania. He is also registered as an Environmental Expert for Environmental Impact Assessment and Expert for Environmental Audit with the National Environment Management Council (NEMC) of Tanzania. Dr. Willison Kaguga Mutagwaba has consented to the inclusion of this information in the document in the form and context in which it appears.
Under the JORC Code (2012), Clause 9, consent has been sought and obtained, where applicable, from the Competent Persons listed above for any initial public release of information related to this report.
For
per
sona
l use
onl
y

34
Appendix 1 – JORC (2012) Table1
Portions of the JORC Code 2012 Table 1 has been previously filed for the Mineral Resource and is included here for completeness. Refer to the announcement entitled ‘Significant Resource Upgrade for Panda Hill Niobium Project’ dated 30 April 2015 that is available to view on http://www.cradleresources.com.au.
Section 1 Sampling Techniques and Data (Criteria in this section apply to all succeeding sections). Table 1 – Extract of JORC Code 2012 Table 1
Criteria JORC Code Explanation Commentary Competent
Person
Sampling techniques
Nature and quality of sampling (eg cut channels, random chips, or specific specialised industry standard measurement tools appropriate to the minerals under investigation, such as down hole gamma sondes, or handheld XRF instruments, etc). These examples should not be taken as limiting the broad meaning of sampling.
Include reference to measures taken to ensure sample representivity and the appropriate calibration of any measurement tools or systems used.
Aspects of the determination of mineralisation that are Material to the Public Report.
In cases where ‘industry standard’ work has been done this would be relatively simple (eg ‘reverse circulation drilling was used to obtain 1m samples from which 3kg was pulverised to produce a 30g charge for fire assay’). In other cases more explanation may be required, such as where there is coarse gold that has inherent sampling problems. Unusual commodities or mineralisation types (eg submarine nodules) may warrant disclosure of detailed information.
Sample intervals for the 2013 and 2014 drill core were based on lithological units. Care was taken not to mix different lithologies or weathering types. Sample intervals were nominally 1m length but range from 0.3m to a maximum of 1.5m in barren uniform material. Sample lengths are kept to 1m in mineralised material where possible.
Quarter core samples were taken from the HQ and ½ core from NQ core for assaying. Competent core was cut using a diamond saw. Friable material was carefully sampled by hand.
RC Samples are split using a cone splitter into 1m samples, then a combined 2m composite is taken using a riffle splitter. RC sample weights are approximately 2kg.
Samples were dispatched to the SGS preparation laboratory in Mwanza, Tanzania, for crushing and pulverising to 85% passing 75μm. Pulps were then sent to SGS Johannesburg, South Africa, for niobium assay by XRF Borate Fusion.
A calibrated hand-held Niton XRF analyser is used to aid in mineralisation identification.
Historic core samples were sampled according to rock type. Sample intervals reportedly varied between 2m and 20m, however the assay data contains some sample intervals much larger than this. Unrealistic intervals were not included in the estimate.
NAI
Drilling techniques
Drill type (eg core, reverse circulation, open-hole hammer, rotary air blast, auger, Bangka, sonic, etc) and details (eg core diameter, triple or standard tube, depth of diamond tails, face-sampling bit or other type, whether core is oriented and if so, by what method, etc).
2013 diamond drilling was conducted by Bamboo Rock drilling. 2014 diamond drilling was conducted by Capital Drilling. Drilling typically started in HQ3 core to allow for safe collaring and to capture sufficient material for metallurgical test work. When difficult drilling conditions were encountered, the HQ rods were left as casing to allow for continuation of drilling using NQ rods. HQ and NQ core is typically taken.
Core orientations were done with the Reflex orientation tool.
RC drilling is by a Schram 450 rig, typically drilling with a 5.5” diameter bit and a 900cfm compressor. No booster compressor was required for RC drilling.
Type of rig and core size were not recorded for the majority of historic holes. One generation of historic holes (drilled by RUDIS) were drilled using a Longyear 38DC rig with NQ core sampled as quarter core and BQ core sampled as half core.
NAI
Drill sample recovery
Method of recording and assessing core and chip sample recoveries and results assessed.
Measures taken to maximise sample recovery and ensure representative nature of the samples.
Whether a relationship exists between
Core recovery is measured as a proportion (%) and any cavities or missing intervals are recorded.
Recovery was generally high for all core. Up to 6% voids are reported in some regions.
RC recovery is recorded by visual estimation of recovered sample bags and by weighing all sample rejects from the splitter.
NAI For
per
sona
l use
onl
y

35
Criteria JORC Code Explanation Commentary Competent
Person
sample recovery and grade and whether sample bias may have occurred due to preferential loss/gain of fine/coarse material.
Recovery is generally good.
Recovery is not recorded for the historic drilling data.
Logging Whether core and chip samples have been geologically and geotechnically logged to a level of detail to support appropriate Mineral Resource estimation, mining studies and metallurgical studies.
Whether logging is qualitative or quantitative in nature. Core (or costean, channel, etc) photography.
The total length and percentage of the relevant intersections logged.
Logging of the 2013 and 2014 drillholes included recording of lithological contacts, weathering contacts, vein/dyke orientations, and the orientation of any observed flow banding. Structural measurements (alpha and beta angles) were taken. Wet and dry core photographs were taken. All Cradle core was logged.
Geotechnical logging of the Cradle holes was completed by a geotechnical engineer. RQDs, defects, weathering, strength, infill, and jointing were recorded.
Logging is of sufficient quality for the current studies.
Geological logging of historic holes was qualitative, focusing on rock type and mineralogy, particularly the presence of pyrochlore and apatite, and the carbonate mineralogy. Some holes only had summary log information. Overall the historical logging is repeated by the 2013 logging. The 2013 logging contains the most detail, the RUDIS logging is generally good, and the logging of the original MBEXCO drillholes is generally of less detail than the other drill campaigns.
NAI
Sub-sampling techniques and sample preparation
If core, whether cut or sawn and whether quarter, half or all core taken.
If non-core, whether riffled, tube sampled, rotary split, etc and whether sampled wet or dry.
For all sample types, the nature, quality and appropriateness of the sample preparation technique.
Quality control procedures adopted for all sub-sampling stages to maximise representivity of samples.
Measures taken to ensure that the sampling is representative of the in situ material collected, including for instance results for field duplicate/second-half sampling.
Whether sample sizes are appropriate to the grain size of the material being sampled.
For the 2013 and 2014 drilling, half core samples were sent to SGS Vancouver for metallurgical testing and quarter core samples were sent to SGS Johannesburg for assay after being sent to SGS Mwanza (Tanzania) for preparation.
All sampling of the 2013 and 2014 core was carefully supervised. Ticket books were used with pre-numbered tickets placed in the sample bag and the core tray and double checked against the ticket stubs to guard against sample mix ups.
One metre lengths of quarter HQ/NH core, as sampled by Cradle, are considered sufficient to provide an adequately representative sample for chemical assaying.
RC samples were taken as 2m composites using a riffle splitter.
RUDIS sampled NQ core as quarter core and BQ core as half core to ensure similar sample weights were collected. Samples were crushed on site, composited and sent to Yugoslavia for analysis in their own laboratory using a Philips XRF machine.
Details of historic sampling from GST and MBEXCO are not known.
Portions of the 2013 drillholes that twin sections of the historic holes show comparable Nb2O5 grades.
NAI
Quality of assay data and laboratory tests
The nature, quality and appropriateness of the assaying and laboratory procedures used and whether the technique is considered partial or total.
For geophysical tools, spectrometers, handheld XRF instruments, etc, the parameters used in determining the analysis including instrument make and model, reading times, calibrations factors applied and their derivation, etc.
Nature of quality control procedures adopted (eg standards, blanks, duplicates, external laboratory checks) and whether acceptable
Coffey conducted an inspection of the Johannesburg laboratory during a site visit in August 2013 and found the laboratory to be of industry standard with no problems noted.
Matrix-matched standards are inserted every 20 samples on sample numbers ending in 0 (e.g. *00, *20, *40, etc.). Eight different standards were used. Approximately 10g of standard was used for the XRF Borate fusion analysis samples (note: borate fusion only used approximately 4g of pulp). Standards were either supplied pre-packaged or were measured into a small paper bag, and the standards were not blind. One standard appears to be biased high. However, an additional standard sourced from an independent supplier has a very similar expected value and shows no bias, suggesting there is no
NAI/EM
For
per
sona
l use
onl
y

36
Criteria JORC Code Explanation Commentary Competent
Person
levels of accuracy (ie lack of bias) and precision have been established.
problem with the assay laboratory i.e. the high bias is inherent in the standard.
Blanks were inserted at a ratio of 1:50 (i.e. samples *10, *70) and at the start of each sample batch.
A programme of coarse reject duplicates was undertaken for the core samples. Duplicates were taken at a rate of approximately 1 in 30.
Field duplicates of RC samples were taken at a rate of 1 in 30.
A selection of pulps were sent to Genalysis in Perth for umpire assaying. Full assay results are still pending at the time of writing but preliminary results do not suggest any assay problems.
Verification of sampling and assaying
The verification of significant intersections by either independent or alternative company personnel.
The use of twinned holes.
Documentation of primary data, data entry procedures, data verification, data storage (physical and electronic) protocols.
Discuss any adjustment to assay data.
Coffey conducted site visits in August 2013 and September 2014, during the drilling programmes, observing all drilling procedures. All procedures were considered industry standard, well supervised and well carried out.
Geological data is entered directly into a “Tough Book” logging laptop computer. The data is then directly downloaded to a computer where it is compiled into an Access database.
Assay data is provided as .csv files from the laboratory and extracted through a database query directly into the assay table, eliminating the chance of data-entry errors. Spot checks are made against the laboratory certificates. Datashed is used for final assay import.
3 RC holes have been drilled to twin the 2013 diamond drilling.
2 RC holes with diamond tails have been drilled twinning a 2013 diamond drillhole and a 2014 RC drillhole.
NAI/EM
Location of data points
Accuracy and quality of surveys used to locate drillholes (collar and down-hole surveys), trenches, mine workings and other locations used in Mineral Resource estimation.
Specification of the grid system used.
Quality and adequacy of topographic control.
Collar positions were set out using a Handheld Garmin GPS with reported accuracy of 3m horizontal. Two pegs lined up using a Suunto compass were used to align the rig. Historic holes were drilled on the Tanzanian ARC60 grid. Cradle Resources are using the WGS84, UTM36S grid.
Drillhole positions have been surveyed by DGPS using a local base station and survey stations and have an average relative accuracy of ±2cm.
Downhole surveys were taken using a Reflex electronic multi shot instrument. Collar surveys were taken using a compass and inclinometer. There is the possibility of some deviation in the recorded azimuth due to the presence of magnetite in the carbonatite, however overall the surveys showed only minor deviations in azimuth and dip. There is no apparent trend to the deviations based on drilling direction.
NAI
Data spacing and distribution
Data spacing for reporting of Exploration Results.
Whether the data spacing and distribution is sufficient to establish the degree of geological and grade continuity appropriate for the Mineral Resource and Ore Reserve estimation procedure(s) and classifications applied.
Whether sample compositing has been applied.
The drillholes are spaced on a nominal 50m to 100m spacing; with 50m section lines. The main Angel zone has been infilled to 25m spaced drillholes on 50m sections. Step out exploration extends to 100m x 100m spacing.
The 2014 drilling had a nominal sample length of 1m for diamond and 2m for RC.
The data spacing is considered suitable for resource estimates.
NAI/EM
Orientation of data in relation to
Whether the orientation of sampling achieves unbiased sampling of possible structures and the extent to which this is known, considering
The distribution of pyrochlore and hence of niobium within the carbonatite is fairly uniform for the lower grade material. Higher grade areas occur in the steeply dipping schlieren (flow banding),
NAI/EM
For
per
sona
l use
onl
y

37
Criteria JORC Code Explanation Commentary Competent
Person
geological structure
the deposit type.
If the relationship between the drilling orientation and the orientation of key mineralised structures is considered to have introduced a sampling bias, this should be assessed and reported if material.
particularly in the magnetite rich zones. The recent drilling has been oriented with a dip of 60° with an azimuth of 045 degrees, which is considered acceptable to test the mineralisation.
Sample security
The measures taken to ensure sample security.
Details for sample security for the historic drillholes is not known.
Samples from the 2013 and 2014 drilling were placed into small plastic bags with the pre-printed sample number. These bags were stapled shut in the core yard. The samples were then put into large polyweave or plastic bags with approximately 10 samples per bag. These were sealed shut using tape prior to being transported by dedicated truck to the SGS preparation laboratory in Mwanza (northern Tanzania).
NAI
Audits or reviews
The results of any audits or reviews of sampling techniques and data.
Coffey conducted site visits during the drilling program in August 2013 and during the infill drilling programme in September 2014. The sampling techniques were reviewed and found to be of industry standard and entirely appropriate for this type of deposit.
EM
Section 2 Reporting of Exploration Results (Criteria listed in the preceding section also apply to this section).
Criteria JORC Code Explanation Commentary Competent
Person
Mineral tenement and land tenure status
Type, reference name/number, location and ownership including agreements or material issues with third parties such as joint ventures, partnerships, overriding royalties, native title interests, historical sites, wilderness or national park and environmental settings.
The security of the tenure held at the time of reporting along with any known impediments to obtaining a licence to operate in the area.
The project area is located on three granted MLs (ML237/2006, 238/206 and 239/2006) located approximately 25km WSW of the regional capital of Mbeya, in southern Tanzania. The three MLs cover an approximate area of 22km2. Cradle Resources holds a 50% interest in all three MLs through its ownership of Panda Hill Mining Pty Ltd (PHM). RECB Ltd (a BVI Company) owns the three Panda Hill MLs, PHM owns 50% of RECB Ltd and has an option to purchase the remaining 50%. It is understood that a 3% royalty may be payable to the Tanzanian Government once mining has started. The licenses are not subject to any 3rd party agreements.
The resource and the bulk of ML237/2006 and ML238/2006 are located within a region of designated Prison grounds. The Resource itself is removed from any existing buildings or infrastructure. As the location of the resource is located within the prison boundaries, only the prison-related community would be directly affected by any potential mining activities.
The three granted MLs are current until 16 November 2016. Department of Prisons approval is required for any work to be conducted on ML237/2006 and ML238/2006. Cradle Resources has obtained permission to operate on these areas and is not aware of any impediment for future operations.
NAI
Exploration done by other parties
Acknowledgment and appraisal of exploration by other parties.
The Panda Hill Niobium project has been explored since the 1950s. The Geological Survey of Tanzania (GST) and Mbeya Exploration Company (MBEXCO) drilled 83 diamond drillholes for a total depth of 5,187m in the Panda Hill project area in the 1950’s and early 1960’s. Yugoslavian company RUDIS, in joint venture with the State Mining Company of Tanzania (STAMINCO), drilled 13 diamond drillholes for a total of 1,305m in the period of 1978 to 1980. These holes were drilled on 100m x 100m spaced centres on the Tanzanian ARC60 grid. Drillhole
NAI
For
per
sona
l use
onl
y

38
Criteria JORC Code Explanation Commentary Competent
Person
logs and assays are available for the historic drilling. Laboratory certificates have been sighted for the GST drilling and original data printouts have been obtained for the RUDIS drilling
Geology Deposit type, geological setting and style of mineralisation.
The project is characterised as a carbonatite-hosted niobium deposit. The majority of the Panda Hill niobium mineralisation is found within pyrochlore and lesser columbite. The bulk of the known mineralisation is located within carbonatite lithologies, with Nb2O5 grades typically ranging from 0.1% to 1%. Higher-grade niobium mineralisation is noted within flow-banding (“schlieren”) within the carbonatite and within the surficial weathered cap.
NAI
Drillhole Information
A summary of all information material to the understanding of the exploration results including a tabulation of the following information for all Material drillholes:
easting and northing of the drillhole collar
elevation or RL (Reduced Level – elevation above sea level in metres) of the drillhole collar
dip and azimuth of the hole
down hole length and interception depth
hole length
If the exclusion of this information is justified on the basis that the information is not Material and this exclusion does not detract from the understanding of the report, the Competent Person should clearly explain why this is the case.
Drillhole coordinates and orientations are provided in Table 2 of this report.
This statement relates to an (updated) Mineral Resource. Exploration results have been announced by Cradle Resources previously.
65 of the historic drillholes have been removed from the drilling database. 38 of these are replaced by new drilling, 8 are adjacent to other better informed historic holes, and the remainder are either outside the resource area or too far from other holes to allow interpretation and estimation in that area, and/or have insufficient assay data or data quality to be able to be used.
Three RC drillholes drilled by Cradle were removed from the resource database as they lie north of the resource area. Two diamond drillholes drilled by Cradle were not included in the resource database in the resource as they were used as geotechnical drillholes.
NAI/EM
Data aggregation methods
In reporting Exploration Results, weighting averaging techniques, maximum and/or minimum grade truncations (eg cutting of high grades) and cut-off grades are usually Material and should be stated.
Where aggregate intercepts incorporate short lengths of high grade results and longer lengths of low grade results, the procedure used for such aggregation should be stated and some typical examples of such aggregations should be shown in detail.
The assumptions used for any reporting of metal equivalent values should be clearly stated.
This statement relates to a Mineral Resource. Exploration results have been announced by Cradle Resources previously.
Relationship between mineralisation widths and intercept lengths
These relationships are particularly important in the reporting of Exploration Results.
If the geometry of the mineralisation with respect to the drillhole angle is known, its nature should be reported.
If it is not known and only the down hole lengths are reported, there should be a clear statement to this effect (eg ‘down hole length, true width not known’).
This statement relates to a Mineral Resource. Exploration results have been announced by Cradle Resources previously.
Diagrams Appropriate maps and sections (with scales) and tabulations of intercepts should be
A drillhole plan and accompanying cross-sections are provided in Figures 2 to 4 of this report.
NAI/EM
For
per
sona
l use
onl
y

39
Criteria JORC Code Explanation Commentary Competent
Person
included for any significant discovery being reported These should include, but not be limited to a plan view of drillhole collar locations and appropriate sectional views.
Balanced reporting
Where comprehensive reporting of all Exploration Results is not practicable, representative reporting of both low and high grades and/or widths should be practiced to avoid misleading reporting of Exploration Results.
This statement relates to a Mineral Resource. Exploration results have been announced by Cradle Resources previously.
Other substantive exploration data
. Other exploration data, if meaningful and material, should be reported including (but not limited to): geological observations; geophysical survey results; geochemical survey results; bulk samples – size and method of treatment; metallurgical test results; bulk density, groundwater, geotechnical and rock characteristics; potential deleterious or contaminating substances.
Detailed geological mapping has been conduction by the Tanganyika Geological Survey in the 1950s and RUDIS in the 1980s. Two papers detailing the geology of the Panda Hill carbonatite were subsequently published in Economic Geology.
Cradle conducted geological mapping at the same time as the drilling program. Both the recent and historic mapping provides information relating to the orientation of the flow banding within the carbonatite.
Metallurgical test work has been conducted by MBEXCO and RUDIS in the past. MBEXCO also conducted trial mining. Cradle has undertaken metallurgical test work on the mineralized carbonatite material. At the time of writing the results are not available, however there is no reason to suspect they will be materially different from the historic test work results.
NAI
Further work The nature and scale of planned further work (eg tests for lateral extensions or depth extensions or large-scale step-out drilling).
Diagrams clearly highlighting the areas of possible extensions, including the main geological interpretations and future drilling areas, provided this information is not commercially sensitive.
Four high priority target regions have been identified (see announcement 23 February 2015). And these will be the focus of future planned drilling with an aim to define further high grade mineralisation.
NAI
Section 3 Estimation and Reporting of Mineral Resources (Criteria listed in section 1, and where relevant in section 2, also apply to this section).
Criteria JORC Code Explanation Commentary Competent
Person
Database integrity
Measures taken to ensure that data has not been corrupted by, for example, transcription or keying errors, between its initial collection and its use for Mineral Resource estimation purposes.
Data validation procedures used.
The 2013 and 2014 data collection was directly into logging tablets. Entry of 2013 assay data into the database was through direct extraction via an Access query from the laboratory files. In 2014 the database was migrated through to a Datashed relational database. Final assay importation of the.csv files provided by the assay laboratory has been into Datashed, eliminating the potential for data entry errors. Spot checks have been conducted on all aspects of the data by Cradle.
Coffey has conducted its own validation process on the data, with checks looking for missing/overlapping intervals, missing data and extreme values. Coffey has also carried out spot checks on the assay data against the laboratory certificates.
Historic data was compiled by the Canadian National Geo. Expl. Ltd. (CINGEX) in 1972-1973. Neil Inwood of Verona Capital has validated this data compilation against original laboratory assay sheets for the GST and MBEXCO drilling, and found only 1 data transposition. The compilation was also validated against an original computer printout of the RUDIS database, and found to
NAI/EM
For
per
sona
l use
onl
y

40
Criteria JORC Code Explanation Commentary Competent
Person
be fully in accordance. No original geological logs were found for validation.
Site visits Comment on any site visits undertaken by the Competent Person and the outcome of those visits.
If no site visits have been undertaken indicate why this is the case.
Neil Inwood supervised the Cradle Resources 2013 and 2014 drilling programmes on site.
Ellen Maidens conducted site visits during the August 2013 drilling programme and the September 2014 drilling programme. All drilling, logging and sampling procedures were observed and found to be of industry standard with no problems highlighted. Ellen Maidens also conducted a site visit of the SGS Johannesburg assay laboratory with Keith Bowes of Cradle Resources during the 2013 visit. The laboratory was found to be of industry standard with no material problems noted.
NAI/EM
Geological interpretation
Confidence in (or conversely, the uncertainty of) the geological interpretation of the mineral deposit.
Nature of the data used and of any assumptions made.
The effect, if any, of alternative interpretations on Mineral Resource estimation.
The use of geology in guiding and controlling Mineral Resource estimation.
The factors affecting continuity both of grade and geology.
The understanding of the orientation of the flow-banding from mapping and recent drilling has been used to support the orientations seen in the Variography and used in the Resource estimate.
It is apparent that over the extent of the Resource area, there are areas of different orientations. It is planned to use further mapping and drilling to delineate these area into discrete domains.
NAI
Dimensions The extent and variability of the Mineral Resource expressed as length (along strike or otherwise), plan width, and depth below surface to the upper and lower limits of the Mineral Resource.
The block model dimensions are given below:
Easting (X) Northing (Y) RL (Z)
Model Origin 526,000 9,004,800 1,150
Model Extent (m) 1,400 1,800 500
Parent Cell dimension (m)
25 25 5
Minimum Sub-cell dimension (m)
5 5 1
Number of Parent Cells
56 72 110
Note that due to drillhole depths, mineralisation is only modelled to a maximum vertical extent of approximately 410m below surface. Mineralisation occurs from surface.
IK
Estimation and modelling techniques
The nature and appropriateness of the estimation technique(s) applied and key assumptions, including treatment of extreme grade values, domaining, interpolation parameters and maximum distance of extrapolation from data points. If a computer assisted estimation method was chosen include a description of computer software and parameters used.
The availability of check estimates, previous estimates and/or mine production records and whether the Mineral Resource estimate takes appropriate account of such data.
The assumptions made regarding recovery of by-products.
Estimation of deleterious elements or other non-grade variables of economic significance (eg sulphur for acid mine drainage
Multiple Indicator Kriging (MIK) with change of support for a final SMU model is considered a robust method for the style of mineralisation and intended purpose of the model (for PFS use). An indicator based grade shell (IND0P30) was generated using a 0.3% Nb2O5 indicator threshold on all data and a (0.2) 20% Probability (IND0P30 > 0.2) for use in the MIK modelling (Zonecode 100). The estimation was carried out using the Datamine mining software package.
No top cut is used in the MIK estimation process, and a top cut of 3% Nb2O5 was applied to the Nb2O5 composites used for variography and geostatistical validation. This was based on analysis of the Nb2O5 population distribution.
MIK grade estimation with change of support has been applied to produce ‘recoverable’ Nb2O5 estimates targeting a Selective Mining Unit (SMU) of 6.25m x 12.5m x 5m.
Search ellipses were oriented dipping to the SW based on variography and geology. Estimation was generally conducted in a 2 pass strategy with the second estimate completed with
IK
For
per
sona
l use
onl
y

41
Criteria JORC Code Explanation Commentary Competent
Person
characterisation).
In the case of block model interpolation, the block size in relation to the average sample spacing and the search employed.
Any assumptions behind modelling of selective mining units.
Any assumptions about correlation between variables.
Description of how the geological interpretation was used to control the resource estimates.
Discussion of basis for using or not using grade cutting or capping.
The process of validation, the checking process used, the comparison of model data to drillhole data, and use of reconciliation data if available.
expanded sample searches and relaxed composite collection criteria.
Validation was by visual and statistical comparison of the estimation with the input data. The previous 2014 resource estimate is available for comparison.
The new drilling has increased the confidence in the geology and grade continuity, resulting in the conversion of a large part of the Resource to Indicated category and allowing for the conversion of a portion of the Resource to Measured category. Deeper drilling and removal of waste by the indicator based grade shell has resulted in an overall increase in tonnage and metal content for the project.
There is no mining at Panda Hill to date.
No assumptions are made regarding recovery of by-products.
Additional elements (Fe2O3, SiO2, CaO, Ta and TiO2) were estimated by Ordinary Kriging (OK).
Probability Kriging was conducted for lithology (fenites) and the oxidation/weathering variables.
The panel size of 25mx25mx5m is appropriate to the sample spacing and style of mineralisation.
Moisture Whether the tonnages are estimated on a dry basis or with natural moisture, and the method of determination of the moisture content.
Tonnages are based on in-situ dry bulk density measurements. IK
Cut-off parameters
The basis of the adopted cut-off grade(s) or quality parameters applied.
A nominal reporting grade of 0.3% Nb2O5 has been chosen to reflect a potentially economic mining cut off. Further work is required to define this cut-off.
IK/NAI
Mining factors or assumptions
Assumptions made regarding possible mining methods, minimum mining dimensions and internal (or, if applicable, external) mining dilution. It is always necessary as part of the process of determining reasonable prospects for eventual economic extraction to consider potential mining methods, but the assumptions made regarding mining methods and parameters when estimating Mineral Resources may not always be rigorous. Where this is the case, this should be reported with an explanation of the basis of the mining assumptions made.
Based on the studies completed, there is sufficient data to support the design of a typical moderate scale open cut mine to economically extract the contained resource and reasonable prospects for eventual economic extraction.
The SMU dimension of 6.25m x 12.5m x 5m assumes a moderate level of mining selectivity if required.
The assumption is that there is existing, steady demand and price for the niobium product.
IK/NAI
Metallurgical factors or assumptions
The basis for assumptions or predictions regarding metallurgical amenability. It is always necessary as part of the process of determining reasonable prospects for eventual economic extraction to consider potential metallurgical methods, but the assumptions regarding metallurgical treatment processes and parameters made when reporting Mineral Resources may not always be rigorous. Where this is the case, this should be reported with an explanation of the basis of the metallurgical assumptions made.
Ferro-niobium has been economically produced from carbonatite ores for many years. In 2002, preliminary test work undertaken on the Panda Hill fresh carbonatite by SGS Lakefield reported an Nb2O5 recovery of 69% at 56% grade. Published recovery1 for a similar carbonatite ore body currently in production in Malawi is 58% Nb2O5. Both the producing plant and the test work share a similar flow sheet consisting of reverse gangue flotation followed by direct niobium mineral flotation. Recent test work has commenced, also using SGS Lakefield, to test the main material types observed on the deposit in the 2013 drill program including investigating flow sheet options for the weathered material. It is reasonable to assume that some portion of the weathered material can be recovered economically.
1 “The Production of Ferro-niobium at the Niobec Mine” by Claude Dufrense and Ghislain Goyette;
NAI
For
per
sona
l use
onl
y

42
Criteria JORC Code Explanation Commentary Competent
Person
http://www.globemetalsandmining.com.au/Files/Investors/Presentations/2009/20090518_Investor-Presentation-May-2009.aspx.
Environmental factors or assumptions
Assumptions made regarding possible waste and process residue disposal options. It is always necessary as part of the process of determining reasonable prospects for eventual economic extraction to consider the potential environmental impacts of the mining and processing operation. While at this stage the determination of potential environmental impacts, particularly for a greenfields project, may not always be well advanced, the status of early consideration of these potential environmental impacts should be reported. Where these aspects have not been considered this should be reported with an explanation of the environmental assumptions made.
No detailed assumption regarding possible waste and process residue disposal options or environmental surveys have been made at this early stage of the project.
NAI
Bulk density . Whether assumed or determined. If assumed, the basis for the assumptions. If determined, the method used, whether wet or dry, the frequency of the measurements, the nature, size and representativeness of the samples.
The bulk density for bulk material must have been measured by methods that adequately account for void spaces (vugs, porosity, etc), moisture and differences between rock and alteration zones within the deposit.
Discuss assumptions for bulk density estimates used in the evaluation process of the different materials.
A total of 2,793 density measurements have been taken from Cradle core. The majority of these have been determined using
the calliper method. In 2013, density measurements were also determined using the Archimedes method. A statistical comparison revealed negligible difference between the methods.
After statistical review of the density data, average bulk density values have been assigned to the block model as follows:
The bulk density values for material within the mineralisation envelope incorporate a 6% void factor for oxide material, and a 3% void factor for transitional and fresh material resulting from statistical estimates of voids/cavities recorded during drilling.
The bulk density values are slightly lower than those used in the December 2014 Resource estimate.
Oxidation state Mineralised Zone Waste
Oxidised 2.04t/m3 2.27t/m3
Moderately oxidised 2.54t/m3 2.54t/m3
Fresh 2.65t/m3 2.68t/m3
IK
Classification The basis for the classification of the Mineral Resources into varying confidence categories.
Whether appropriate account has been taken of all relevant factors (ie relative confidence in tonnage/grade estimations, reliability of input data, confidence in continuity of geology and metal values, quality, quantity and distribution of the data).
Whether the result appropriately reflects the Competent Person’s view of the deposit.
Resource classification was developed from the confidence levels of key criteria including drilling methods, geological understanding and interpretation, sampling quality, data density and location, grade estimation and quality of the estimates, as well as the various and more subjective considerations discussed in this table.
IK
Audits or reviews
The results of any audits or reviews of Mineral Resource estimates.
The 2012 Resource estimate for Panda Hill, completed by Coffey, was reviewed in an Independent Geologist’s Report by Ravensgate Mining Industry Consultants and found to be appropriate though conservative.
EM
Discussion of relative accuracy/ confidence
Where appropriate a statement of the relative accuracy and confidence level in the Mineral Resource estimate using an approach or procedure deemed appropriate by the Competent Person. For example, the
The grade estimate is based on the assumption that small to medium scale open cut mining methods will be applied.
The Resource is a recoverable model assuming a 6.25m x 12.5m x 5m SMU.
IK
For
per
sona
l use
onl
y

43
Criteria JORC Code Explanation Commentary Competent
Person
application of statistical or geostatistical procedures to quantify the relative accuracy of the resource within stated confidence limits, or, if such an approach is not deemed appropriate, a qualitative discussion of the factors that could affect the relative accuracy and confidence of the estimate.
The statement should specify whether it relates to global or local estimates, and, if local, state the relevant tonnages, which should be relevant to technical and economic evaluation. Documentation should include assumptions made and the procedures used.
These statements of relative accuracy and confidence of the estimate should be compared with production data, where available.
The MIK SMU estimation process is deemed appropriate for use in this style of deposit.
Factors affecting the confidence and relative accuracy of the Resource are primarily:
o Incorporation of the historic drillhole data. This data is gradually being phased out and superseded by current drilling.
o Increased drilling density might vary model results in localised areas.
o Accuracy of averaged bulk density data and associated void factors. There has been a substantial amount of data collected by Cradle Resources. Mineralisation and lithology may prove to be more variable than the current scale of drilling suggest.
o The variance adjustment factor applied for the SMU model may vary in future estimates according to the amount of data available within the domains being modelled.
o Geology and domains are possibly more complex than assumed by the current resource model, particularly with respect to strike and dip of mineralisation and possible multiple potential orientations related to the complex geometry of the intrusives.
o Fenite lithology definition may vary with available data, and is significant for metallurgical processing.
o Cut-off grades may vary in future according to mining studies.
For
per
sona
l use
onl
y