Defining Neotropical otter Lontra longicaudis distribution ... · potencial e as áreas mais...
16
Mongabay.com Open Access Journal - Tropical Conservation Science Vol.7 (2): 214-229, 2014 Tropical Conservation Science | ISSN 1940-0829 | Tropicalconservationscience.org 214 Research article Defining Neotropical otter Lontra longicaudis distribution, conservation priorities and ecological frontiers Marcelo Lopes Rheingantz 1 , Jorge Fernando Saraiva de Menezes 2 and Benoit de Thoisy 3 1 Laboratório de Ecologia e Conservação de Populações - Av. Carlos Chagas Filho, 373 - Centro de Ciências da Saúde, Instituto de Biologia. Departamento de Ecologia, Sala A027, Cx. P. 68020, Universidade Federal do Rio de Janeiro. Rio de Janeiro, RJ, CEP 21941-590. Brazil, 2 Laboratório de Vida Selvagem – Embrapa - Rua 21 de setembro, 1880. Bairro N.S. Fátima CxP 109. Corumbá, MS, CEP 79320- 900. Brazil, 3 Association Kwata, BP 672, 97335 Cayenne cedex, French Guiana Corresponding author and Email address: Marcelo Lopes Rheingantz [email protected] Abstract Understanding a species' occurrence requirements is essential for its conservation, and species distribution models (SDMs) are a powerful tool for this purpose. Here we estimated a SDM based on actual distribution information, in relation to climatic, hydrological, human population, and vegetation data sets, to understand the ecological requirements and geographic distribution of the Neotropical otter Lontra longicaudis, a species whose habitat requirements and conservation needs are mostly unknown. Using MaxEnt, we defined its potential distribution and most suitable areas to indicate priority areas for research and to analyze the efficiency of Protected Areas (PAs). Our findings suggest that the range of Neotropical otters could extend beyond their present estimated distribution, adding new areas in northeastern Brazil, Andean region, west Ecuador, Venezuela, Peru, Mexico, and Argentina, with higher suitability in rain forests (especially Atlantic and Amazon Forests). We also found that PAs are the most suitable areas for otter distribution. Although better than non-protected areas, PAs are close to the median of the suitability values, indicating that they still can be improved to conserve otters. Annual temperature and human population density explained most data variance in our model. We suggest the change of the actual status of Neotropical otter to Least Concern or Near Threatened categories. We recommend verifying the possible sympatry with other otters, and demonstrate that rudimentary and/or occasional recent data of occurrence can also be used in SDMs and contribute to species conservation. Keywords: distribution range, Neotropical otter, niche modeling, reserve design, suitability Resumo Compreender os requisitos para a ocorrência de uma espécie é fundamental para sua conservação, e os modelos de distribuição de espécies (SDM) são uma ferramenta poderosa para essa finalidade. Aqui nós estimamos um SDM a partir de informações reais de distribuição, em relação a conjuntos de dados climáticos, hidrológicos, de população humana e de vegetação para entender as exigências ecológicas e a distribuição geográfica da lontra Neotropical Lontra longicaudis, espécie cujos requisitos de habitat e necessidades para a sua conservação são praticamente desconhecidos. Usando MaxEnt, definimos sua distribuição potencial e as áreas mais adequadas para a espécie a fim de indicar áreas prioritárias para pesquisa e analisar a eficácia das áreas protegidas (APs). Nossos resultados indicam que a distribuição da lontra neotropical poderia se estender além de sua distribuição atual estimada, adicionando novas áreas no nordeste do Brasil, na região andina, no oeste do Equador, na Venezuela, no Peru, no México e na Argentina, com maior adequabilidade em florestas tropicais (especialmente Mata Atlântica e Floresta Amazônica). Descobrimos também que APs são as áreas mais adequadas para a distribuição de lontra. Porém, embora sejam mais adequadas do que áreas não protegidas, as APs estão perto da mediana dos valores de adequabilidade, o que indica que elas ainda podem ser melhoradas para melhor conservar lontras. Temperatura anual e Densidade populacional humana foram as variáveis que melhor explicaram a variância dos dados em nosso modelo. Sugerimos a mudança do status real de lontra neotropical para Pouco Preocupante ou categorias Quase Ameaçada. Recomendamos verificar a eventual simpatria com outras lontras, e demonstramos que mesmo dados rudimentares e/ou ocasionais de ocorrência também podem ser usado em SDMs e contribuir para a preservação de espécies. Palavras-chave: adequabilidade, desenho de reservas, distribuição geográfica, lontra Neotropical, modelagem de nicho
Transcript of Defining Neotropical otter Lontra longicaudis distribution ... · potencial e as áreas mais...
Mongabay.com Open Access Journal - Tropical Conservation Science Vol.7 (2): 214-229, 2014
Tropical Conservation Science | ISSN 1940-0829 | Tropicalconservationscience.org
214
Research article
Defining Neotropical otter Lontra longicaudisdistribution, conservation priorities andecological frontiers
Marcelo Lopes Rheingantz1, Jorge Fernando Saraiva deMenezes2 and Benoit de Thoisy31Laboratório de Ecologia e Conservação de Populações - Av. Carlos Chagas Filho, 373 - Centro deCiências da Saúde, Instituto de Biologia. Departamento de Ecologia, Sala A027, Cx. P. 68020,Universidade Federal do Rio de Janeiro. Rio de Janeiro, RJ, CEP 21941-590. Brazil, 2Laboratório de VidaSelvagem – Embrapa - Rua 21 de setembro, 1880. Bairro N.S. Fátima CxP 109. Corumbá, MS, CEP 79320-900. Brazil, 3Association Kwata, BP 672, 97335 Cayenne cedex, French GuianaCorresponding author and Email address: Marcelo Lopes Rheingantz [email protected] a species' occurrence requirements is essential for its conservation, and species distribution models (SDMs) area powerful tool for this purpose. Here we estimated a SDM based on actual distribution information, in relation to climatic,hydrological, human population, and vegetation data sets, to understand the ecological requirements and geographicdistribution of the Neotropical otter Lontra longicaudis, a species whose habitat requirements and conservation needs aremostly unknown. Using MaxEnt, we defined its potential distribution and most suitable areas to indicate priority areas forresearch and to analyze the efficiency of Protected Areas (PAs). Our findings suggest that the range of Neotropical otters couldextend beyond their present estimated distribution, adding new areas in northeastern Brazil, Andean region, west Ecuador,Venezuela, Peru, Mexico, and Argentina, with higher suitability in rain forests (especially Atlantic and Amazon Forests). We alsofound that PAs are the most suitable areas for otter distribution. Although better than non-protected areas, PAs are close to themedian of the suitability values, indicating that they still can be improved to conserve otters. Annual temperature and humanpopulation density explained most data variance in our model. We suggest the change of the actual status of Neotropical otterto Least Concern or Near Threatened categories. We recommend verifying the possible sympatry with other otters, anddemonstrate that rudimentary and/or occasional recent data of occurrence can also be used in SDMs and contribute to speciesconservation.Keywords: distribution range, Neotropical otter, niche modeling, reserve design, suitabilityResumoCompreender os requisitos para a ocorrência de uma espécie é fundamental para sua conservação, e os modelos de distribuiçãode espécies (SDM) são uma ferramenta poderosa para essa finalidade. Aqui nós estimamos um SDM a partir de informaçõesreais de distribuição, em relação a conjuntos de dados climáticos, hidrológicos, de população humana e de vegetação paraentender as exigências ecológicas e a distribuição geográfica da lontra Neotropical Lontra longicaudis, espécie cujos requisitosde habitat e necessidades para a sua conservação são praticamente desconhecidos. Usando MaxEnt, definimos sua distribuiçãopotencial e as áreas mais adequadas para a espécie a fim de indicar áreas prioritárias para pesquisa e analisar a eficácia dasáreas protegidas (APs). Nossos resultados indicam que a distribuição da lontra neotropical poderia se estender além de suadistribuição atual estimada, adicionando novas áreas no nordeste do Brasil, na região andina, no oeste do Equador, na Venezuela,no Peru, no México e na Argentina, com maior adequabilidade em florestas tropicais (especialmente Mata Atlântica e FlorestaAmazônica). Descobrimos também que APs são as áreas mais adequadas para a distribuição de lontra. Porém, embora sejammais adequadas do que áreas não protegidas, as APs estão perto da mediana dos valores de adequabilidade, o que indica queelas ainda podem ser melhoradas para melhor conservar lontras. Temperatura anual e Densidade populacional humana foramas variáveis que melhor explicaram a variância dos dados em nosso modelo. Sugerimos a mudança do status real de lontraneotropical para Pouco Preocupante ou categorias Quase Ameaçada. Recomendamos verificar a eventual simpatria com outraslontras, e demonstramos que mesmo dados rudimentares e/ou ocasionais de ocorrência também podem ser usado em SDMs econtribuir para a preservação de espécies.Palavras-chave: adequabilidade, desenho de reservas, distribuição geográfica, lontra Neotropical, modelagem de nicho
Mongabay.com Open Access Journal - Tropical Conservation Science Vol.7 (2): 214-229, 2014
Tropical Conservation Science | ISSN 1940-0829 | Tropicalconservationscience.org
215
IntroductionUnderstanding drivers of species distribution is essential to its conservation and determiningecological requirements[1,2]. Although field techniques can address several questions aboutspecies conservation as well as or even better than estimated distributions, experiment costsare prohibitive for large mammals. The Neotropical otter (Lontra longicaudis), a solitary andelusive semiaquatic carnivore [3] with one of the largest home ranges of Lutrinae [4], is aspecies whose large scale dynamics cannot be addressed by traditional methods. Despite allefforts, present data are not accurate enough to determine the conservation status of theNeotropical otter based on International Union for Conservation of Nature (IUCN) criteria, andthe species is now labeled as ‘data deficient’ [5]. In order to correct such knowledgedeficiencies, the IUCN Otter Specialist Group (during the XIth IUCN OSG International OtterColloquium in Pavia, Italy in 2011) recommended that research on this species, currently oneof the least studied of the subfamily Lutrinae [5,6], should focus on defining its actualdistribution, population status, and habitat requirements.
The status of Neotropical otter is important to the conservation of river ecosystems becauseof its role as a top-chain predator on those ecosystems, and its presence can help maintainlocal biodiversity [3,7]. In addition, the species requires large territory extensions to establisha viable population, as each individual requires dozens of kilometres of riparian habitats [8–10] and also depends on water physicochemical conditions and habitat structures to persist[8,9]. Modifications of those characteristics can considerably affect otter populations [9],reducing local diversity.
Despite its importance to species conservation, species distribution areas are frequentlyestimated using a minimum convex polygon, a method that ignores species’ ecologicalconstraints [1,2]. A more recent set of techniques, known as species distribution models(SDMs), can overcome this limitation. SDMs also provide extra information in several areasof ecology, evolution, conservation, and management [11,12]. SDMs were initially developedto predict distributions from incomplete data [13], but have been widely used in other areasrelated to conservation, such as the impact of biological invasions (see[14]), threatenedspecies monitoring (see [15]), estimating distribution expansion of recovering species [16,17],and evaluating climate change impacts [17–19]. These models also identify the most suitableareas for a species, from which we can infer where it is most abundant [20,21] and whichenvironmental characteristics are important to it.
In species with large distribution areas, such as the Neotropical otter, that knowledge can befurther used to prioritize regions for species conservation while considering economic interest[22]. Large species also have more accurate representations of their distribution, as mostmodels are based on climatic variables, which are more determinant at larger scales [23,24].
Received: 21 Febraury 2014; Accepted 28 April 2014; Published: 23 June 2014
Copyright: © Marcelo Lopes Rheingantz, Jorge Fernando Saraiva de Menezes and Benoit de Thoisy. This is an open access paper. Weuse the Creative Commons Attribution 3.0 license http://creativecommons.org/licenses/by/3.0/us/. The license permits any user todownload, print out, extract, archive, and distribute the article, so long as appropriate credit is given to the authors and source of thework. The license ensures that the published article will be as widely available as possible and that your article can be included in anyscientific archive. Open Access authors retain the copyrights of their papers. Open access is a property of individual works, notnecessarily journals or publishers.
Cite this paper as: Marcelo Lopes Rheingantz, Jorge Fernando Saraiva de Menezes and Benoit de Thoisy. 2014. Defining Neotropicalotter Lontra longicaudis distribution, conservation priorities, and ecological frontiers. Tropical Conservation Science Vol.7 (2): 214-229.Available online: www.tropicalconservationscience.org
Mongabay.com Open Access Journal - Tropical Conservation Science Vol.7 (2): 214-229, 2014
Tropical Conservation Science | ISSN 1940-0829 | Tropicalconservationscience.org
216
Among SDMs, Maximum entropy (MaxEnt) is a method used for predictions or inferences withpresence-only data [21,25–28], and is as efficient as models with both presence and absencedata [26,29]. This model tool is highly recommended for studies with the same goals as ourwork, since the model discriminates between appropriate and inappropriate areas fairly wellwhen compared with other methods [26,30]. Considering all these advantages, coupled withthe lack of information regarding Neotropical otter, we developed a questionnaire to collectinformation about Lontra longicaudis occurrences and sent it to researchers andenvironmentalists. Using their information, we modeled the species distribution usingMaxEnt.
In summary, we intended to: (a) obtain an updated database with all available Neotropicalotter locations in all its distribution range; (b) estimate the species distribution; (c) identifyclimatic, environmental and population variables that most influenced Lontra longicaudishabitat suitability; (d) identify recommended areas for future studies; and (e) verify if theactual network of Protected Areas is more suitable for Neotropical otter than non-protectedareas.
MethodsTo test the hypotheses above, we adopted the following method/work flow: first a databaseof known records and abiotic variables was assembled; then, we used MaxEnt Modeling tocreate a species distribution model; and last, specific procedures were used to address eachhypothesis.
Database description
We surveyed current Neotropical otter occurrences to identify where the species is present,sampling literature and asking researchers for otter records to estimate species potentialdistribution.
We included all geo-referenced records published in scientific papers (search engines: GoogleScholar, ISI Web of Knowledge, Scopus, Scielo) and provided by specialists working on faunalinventories, especially semiaquatic mammals (consulting 231 members of the IUCN OtterSpecialist Group), and sent 331 requests directly to known scientists who work with river ormammal ecology within Lontra longicaudis distribution. We considered both direct (visual,captures, camera-traps), and indirect observations (including footprints, spraints and/or hair).We considered as presences only data with date information, exact geographic coordinates(converted in WGS-84 system), and collector’s name. All occurrence data used in this work arelisted in the supplementary material. We obtained data from Brazil, Argentina, Uruguay,Paraguay, Peru, Ecuador, Colombia, French Guiana, Suriname, Venezuela, Mexico, Bolivia,Costa Rica, and Panama, for a period covering 1991 to 2012. With this time span of 30 yearswe assumed that our record database accurately describes the current distribution of theNeotropical otter (Fig. 1).
We obtained abiotic data from different sources. To build the SDM, we chose a priori variablesthat we assumed to be the most significant to the species and/or were used in previousNeotropical mammal studies [28,31]: annual precipitation, precipitation of the driest month,precipitation seasonality, precipitation of the warmest quarter, annual temperature,isothermallity, and temperature standard. Other variables deemed less important were notincluded, as including more variables reduces model fitness [32]. One data source was the
Mongabay.com Open Access Journal - Tropical Conservation Science Vol.7 (2): 214-229, 2014
Tropical Conservation Science | ISSN 1940-0829 | Tropicalconservationscience.org
217
Worldclim database, formed by 18 global raster maps representing climatic variables,averaged between years 1950-2000 [33]. We included altitude from the Shuttle RadarTopography Mission (SRTM) digital elevation raster map, human population density in 2000,obtained from GPWv3 [34], and vegetation cover in 2012, measured as the NDVI from MODISsensors [35]. We also derived a raster map of percentage of water bodies from SRTM WaterBody vector Data [36]. The value of a cell equals how many of the 100 sub-cells were coveredby water body vectors. All maps had their resolution downgraded to 0.2 decimal, theminimum resolution available to all. All data, independent of source, were clipped betweennorthern Mexico to northern Argentina, the frontiers of the species’ current IUCN distribution(Fig. 1).
To test the suitability of existing Protected Areas (PAs) (see below), we used the vector mapWDPA Conservation Units [37]. This global database is a joint venture by UNEP-WCMC andIUCN World Commission on Protected Areas in collaboration with governments, NGOs,academia and industry. These data are constantly updated.
Model estimation / assessment of the quality of the model
Once the database was complete, we generated a Kernel density map (0.01555 bandwidth),considering 95% of distribution use. The Kernel was used to ensure that background samplingonly included areas where otter could exist (a SDM requirement) [21,25]. Within this interval,we selected 1,000 random locations to be used as background data for modeling.
MaxEnt 3.3.3k [25] estimates the probability distribution of the maximum entropy of eachenvironmental variable within the study area. This distribution is calculated with theconstraint that the expected value of each environmental variable under it matches theempirical average generated from environmental values associated with species occurrencedata [25]. When MaxEnt is applied to presence-only SDM, the pixels of the study area makeup the space on which the MaxEnt probability distribution is defined; pixels with knownspecies occurrence records constitute the sample points; and the features becomeenvironmental variables. We used 75% of the records for training the model and 25% for test.The best parameter estimate was calculated using 5,000 interactions with bootstrapreplication. We set the convergence threshold of 1.0 x 10⁻⁵ (i.e. increase in model fitness belowwhich the model stops). In addition, the model was replicated 15 times to calculate confidenceintervals, and model fitness was assessed based in the area under the curve [38].
Hypothesis-specific procedures
After identification of the most suitable areas for the occurrence of otters, a series oftransformations were required to address each hypothesis.
To describe otter potential distribution, we first generated a consensus map from the 15MaxEnt models using the weighted average method [39], which uses the AUC value of eachmodel as its weight. We then considered two approaches to derive binary presence–absencemaps from the continuous consensus map of suitability: one more restrictive andconservative, maximizing the sum of sensitivity and specificity (max SSS) (more details in [40]);and a second, less restrictive, with the lowest predicted value threshold (LPV) (see [25,28,41]).LPV is the lowest value of environmental suitability within an occurrence record, and Max SSSis an objective method that optimizes the discrimination between presence/absence in thesame way as that between presence/random points.
Mongabay.com Open Access Journal - Tropical Conservation Science Vol.7 (2): 214-229, 2014
Tropical Conservation Science | ISSN 1940-0829 | Tropicalconservationscience.org
218
Second, to test the efficiency of PAs, we compared the distribution of suitability values withinand outside PAs and ran a Kolmogorov-Smirnov (KS) test to verify if these two curves differsignificantly.
Last, to recommend regions for future studies and conservation initiatives, we reasoned thatplaces with high suitability for otter and far from previous studies have a better chance to bedifferent ecosystems/biomes and to have different environmental characteristics. Therefore,a study in those areas can explain if the otter uses different habitats in ways similar to thoseshown in previous studies. To accomplish this, we multiplied the suitability of a pixel by itsdistance to the nearest record, based on the assumption that ecological similarities decreasewith distance. The index was then divided by its highest value, to ensure it varies across themore intuitive scale of 0 to 1. Note that this index implies that distance and suitability areequally important, and therefore it may recommend areas with low suitability.
All analyses were performed, and figures made, in ArcMap 9.3 [42]. The Kolmogorov-Smirnovtest was conducted in the R Software [43].
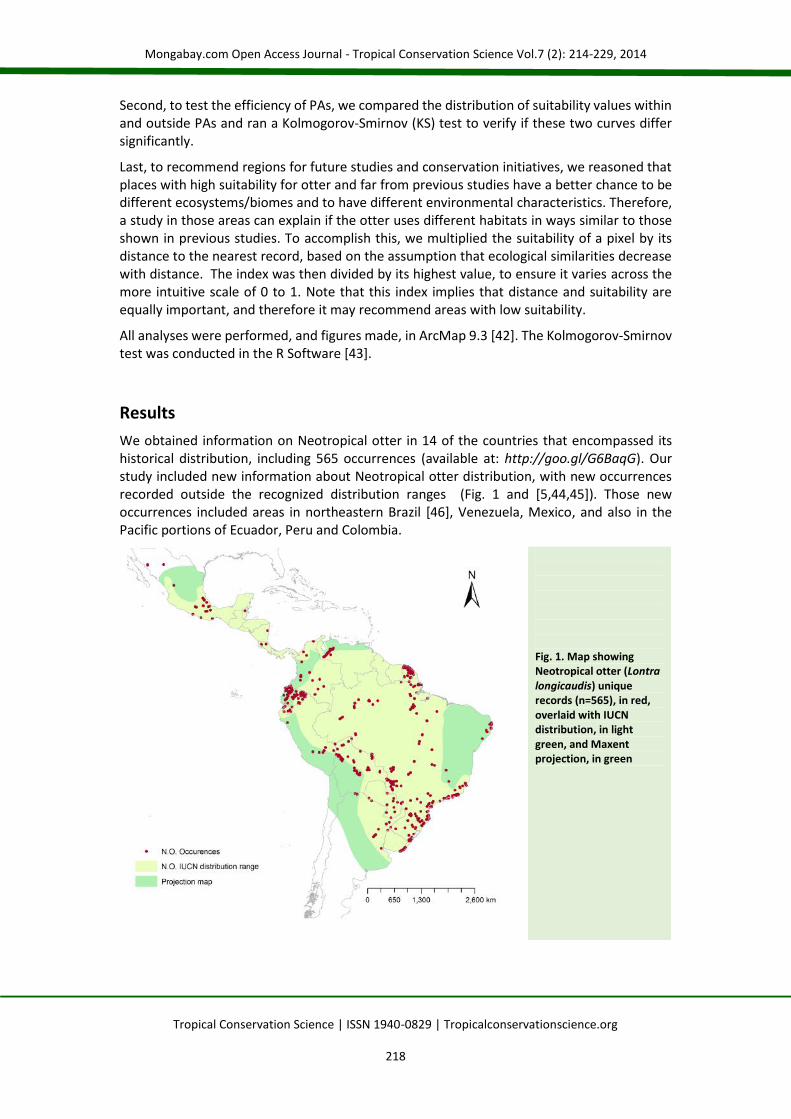
ResultsWe obtained information on Neotropical otter in 14 of the countries that encompassed itshistorical distribution, including 565 occurrences (available at: http://goo.gl/G6BaqG). Ourstudy included new information about Neotropical otter distribution, with new occurrencesrecorded outside the recognized distribution ranges (Fig. 1 and [5,44,45]). Those newoccurrences included areas in northeastern Brazil [46], Venezuela, Mexico, and also in thePacific portions of Ecuador, Peru and Colombia.
Fig. 1. Map showingNeotropical otter (Lontralongicaudis) uniquerecords (n=565), in red,overlaid with IUCNdistribution, in lightgreen, and Maxentprojection, in green
Mongabay.com Open Access Journal - Tropical Conservation Science Vol.7 (2): 214-229, 2014
Tropical Conservation Science | ISSN 1940-0829 | Tropicalconservationscience.org
219
Neotropical otter potential distribution
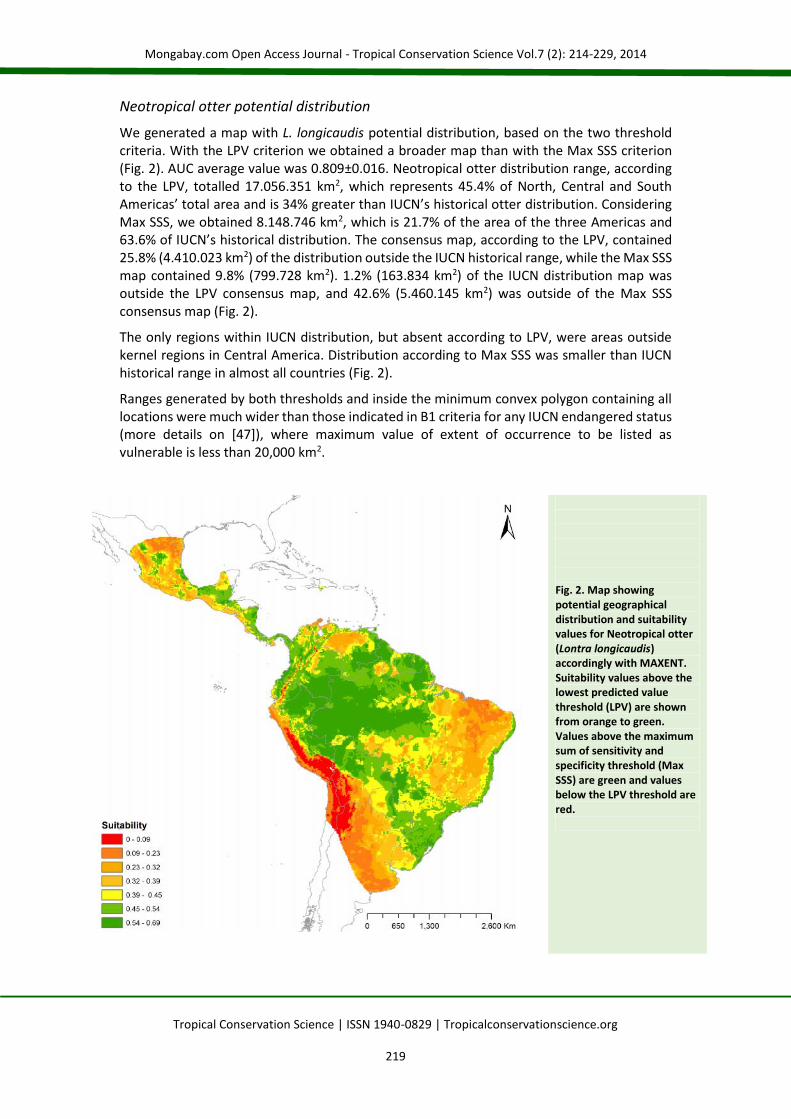
We generated a map with L. longicaudis potential distribution, based on the two thresholdcriteria. With the LPV criterion we obtained a broader map than with the Max SSS criterion(Fig. 2). AUC average value was 0.809±0.016. Neotropical otter distribution range, accordingto the LPV, totalled 17.056.351 km2, which represents 45.4% of North, Central and SouthAmericas’ total area and is 34% greater than IUCN’s historical otter distribution. ConsideringMax SSS, we obtained 8.148.746 km2, which is 21.7% of the area of the three Americas and63.6% of IUCN’s historical distribution. The consensus map, according to the LPV, contained25.8% (4.410.023 km2) of the distribution outside the IUCN historical range, while the Max SSSmap contained 9.8% (799.728 km2). 1.2% (163.834 km2) of the IUCN distribution map wasoutside the LPV consensus map, and 42.6% (5.460.145 km2) was outside of the Max SSSconsensus map (Fig. 2).
The only regions within IUCN distribution, but absent according to LPV, were areas outsidekernel regions in Central America. Distribution according to Max SSS was smaller than IUCNhistorical range in almost all countries (Fig. 2).
Ranges generated by both thresholds and inside the minimum convex polygon containing alllocations were much wider than those indicated in B1 criteria for any IUCN endangered status(more details on [47]), where maximum value of extent of occurrence to be listed asvulnerable is less than 20,000 km2.
Fig. 2. Map showingpotential geographicaldistribution and suitabilityvalues for Neotropical otter(Lontra longicaudis)accordingly with MAXENT.Suitability values above thelowest predicted valuethreshold (LPV) are shownfrom orange to green.Values above the maximumsum of sensitivity andspecificity threshold (MaxSSS) are green and valuesbelow the LPV threshold arered.
Mongabay.com Open Access Journal - Tropical Conservation Science Vol.7 (2): 214-229, 2014
Tropical Conservation Science | ISSN 1940-0829 | Tropicalconservationscience.org
220
Regarding the importance of each variable, annual temperature (60.5%) was the one thatmost contributed to the model: highest values of suitability were associated with higherannual temperatures. Human population density was identified as the second contributionvariable (29.9%), and was inversely related to otter suitability. However, higher humanpopulation densities were not completely unsuitable for otters (suitability=0.55 in lowdensities and 0.42 in higher population densities). Other variables had less than 2%contribution each. Vegetation, proportion of water, and altitude contributed 0%, 0.2% e 0.2%respectively.
Priority areas for future studies with Lontra longicaudis
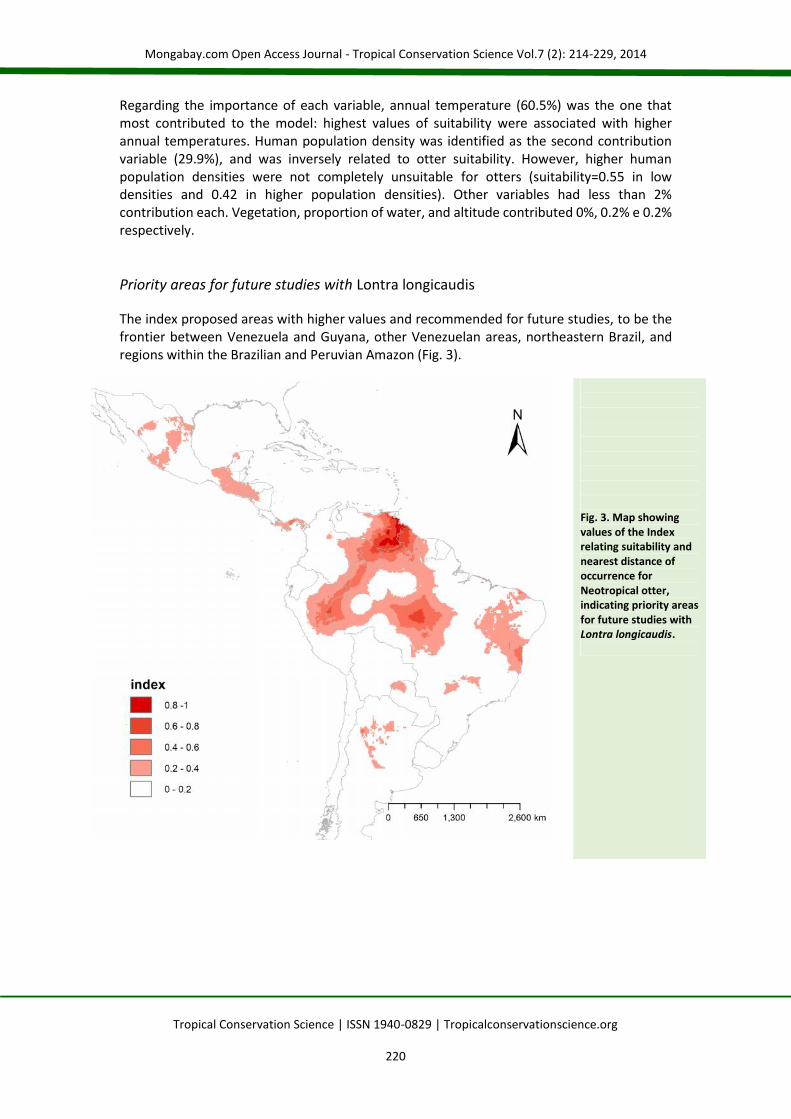
The index proposed areas with higher values and recommended for future studies, to be thefrontier between Venezuela and Guyana, other Venezuelan areas, northeastern Brazil, andregions within the Brazilian and Peruvian Amazon (Fig. 3).
Fig. 3. Map showingvalues of the Indexrelating suitability andnearest distance ofoccurrence forNeotropical otter,indicating priority areasfor future studies withLontra longicaudis.
Mongabay.com Open Access Journal - Tropical Conservation Science Vol.7 (2): 214-229, 2014
Tropical Conservation Science | ISSN 1940-0829 | Tropicalconservationscience.org
221
Suitability of Protected Areas vs Non-Protected Areas
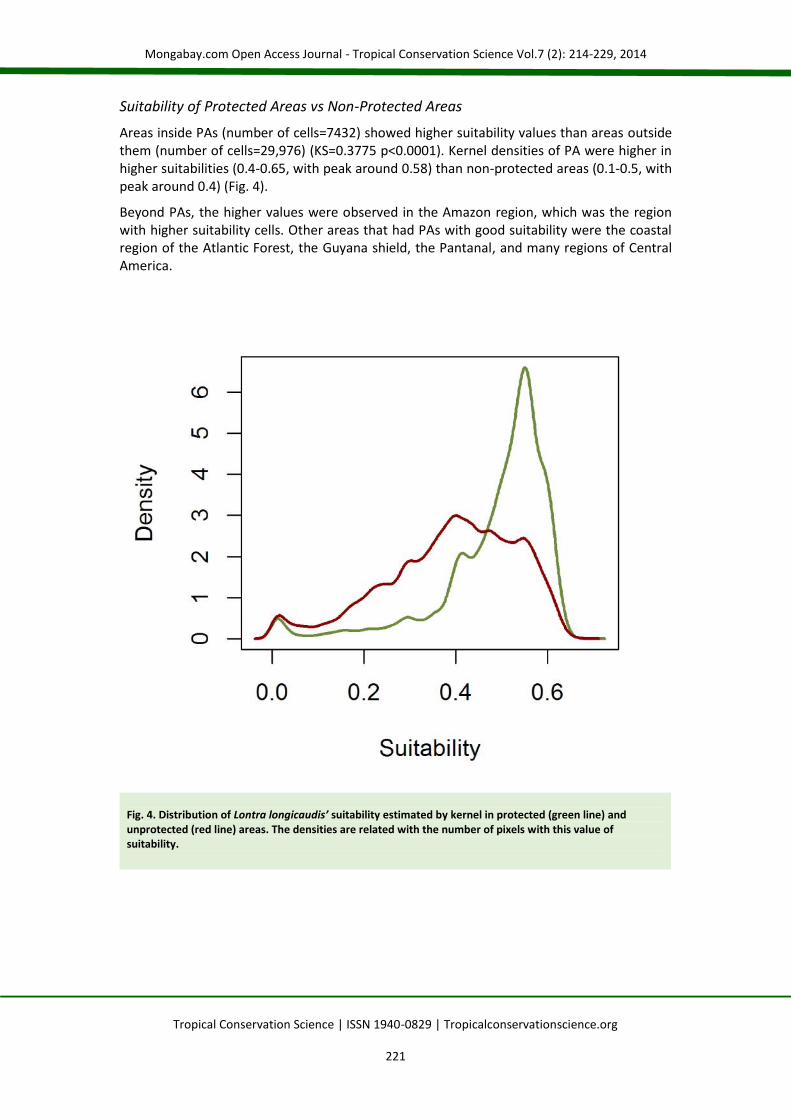
Areas inside PAs (number of cells=7432) showed higher suitability values than areas outsidethem (number of cells=29,976) (KS=0.3775 p<0.0001). Kernel densities of PA were higher inhigher suitabilities (0.4-0.65, with peak around 0.58) than non-protected areas (0.1-0.5, withpeak around 0.4) (Fig. 4).
Beyond PAs, the higher values were observed in the Amazon region, which was the regionwith higher suitability cells. Other areas that had PAs with good suitability were the coastalregion of the Atlantic Forest, the Guyana shield, the Pantanal, and many regions of CentralAmerica.
Fig. 4. Distribution of Lontra longicaudis’ suitability estimated by kernel in protected (green line) andunprotected (red line) areas. The densities are related with the number of pixels with this value ofsuitability.
Mongabay.com Open Access Journal - Tropical Conservation Science Vol.7 (2): 214-229, 2014
Tropical Conservation Science | ISSN 1940-0829 | Tropicalconservationscience.org
222
DiscussionIn this study, we tentatively propose a model for Neotropical otter Lontra longicaudis (Figure5) distribution. SDMs are powerful statistical techniques that can be used to describe species’geographic ranges [48]. There are several methods to model species distribution, but the mostcommonly used now is the maximum entropy approach (Maxent; [25]). The high average AUCindicates that our models had good predictive power and can be used to analyzeenvironmental suitability. Our results showed that different variables were important to thepotential distribution of this top-chain semiaquatic mammal, as shown before with anotherotter[49] and with another large Neotropical carnivore, the jaguar[28]. Annual temperatureand human population density were the most important predictors in our model forNeotropical otter in a large scale. Our model was innovative in two aspects: we demonstratedthat PAs have more suitable areas for L. longicaudis than non-protected areas, and weidentified the Peruvian and Brazilian Amazon, the borders between Venezuela and Guyana,and Northeastern Brazil as areas for future studies.
Our model indicated that areas with high annual temperatures are the most suitable, similarto what was described in the species’ revision[44]. The other important variable was humanpopulation density. Although suitability decreased with human density, its value was higheven in human-dense areas. These results appear to be consistent with the biology of variousotter species, as otters can occur in degraded and/or urban areas [3,50–53]. However, NDVIsmall contribution to the model did not support another previous hypothesis: that L.longicaudis requires good riparian vegetation and good den availability [54]. This differencebetween previous studies and our work is probably due to scaling, as we used a larger, lessaccurate scale (0.2 decimal degree cell size) to identify the fine scale of microhabitat selection.In microhabitat scale, there are evidences of Neotropical otter using more forested areas toselect their holts [55,56]. Another environmental variable previously suggested as important,but not supported by our model, is altitude. We had locations from sea level to 4,200m high(e.g. Peruvian Andes), with many occurrences above 1,500m or below 300m from sea level.Despite that range, altitude did not influence most of our model replicates, in disagreementwith previous studies that described Neotropical otter less abundant at high altitudes [44].
Considering the above variables, the Amazon, Atlantic Forest, and Pantanal are the mostsuitable environments for L. longicaudis, a challenge for Neotropical otter conservation. TheAtlantic Forest is one of the most threatened biomes of the world[57,58], and the Amazon,although well preserved in comparison with others, has been severely degraded in recentyears [59,60], with almost 20% of its Brazilian land cover (60% of total) converted to landuse[61]. Despite being less suitable, regions in Central America may justify the importance ofinvestments in them as there are well-preserved areas in several countries, and previousstudies have indicated the continent as a priority for carnivore conservation [62].
Categorizing the suitability values to estimate Neotropical otter distribution also providednovel insights. Distributions categorized by both LPV and Max SSS overlap substantially withdistributions described before (see [5,44]). However, even the distribution according to MaxSSS, the most restrictive one, included areas absent in IUCN’s map. This shows that the IUCNmap needs to be updated. New regions to be added include northeastern Brazil, the Andes (inPeru, Ecuador and Colombia), northern Mexico, western Colombia, and Bolivia. These newareas may provide valuable information about the species as well as insight on what reallylimits the species’ occurrence. The range increase beyond the IUCN northern limit seems tobe related to an increase in resolution. Models based in minimum convex polygon are coarserthan our distribution modeling (for comparisons with our map, see [5,44,63]). This expansion
Mongabay.com Open Access Journal - Tropical Conservation Science Vol.7 (2): 214-229, 2014
Tropical Conservation Science | ISSN 1940-0829 | Tropicalconservationscience.org
223
also indicates that L. longicaudis may expand its distribution to southern United States andthus overlap with L. canadensis distribution [64,65]. Further studies to identify this potentialinteraction or the barrier that separates both species are recommended. Another contributionof categorizing the suitability values, is to assess in which IUCN category the species should beallocated. The estimated species distribution is beyond 20,000 km2, in spite of the thresholdcriteria used. Consequently, the species cannot be considered vulnerable or any othercategory below, according to the IUCN species extent, and we suggest the species should bemoved to either Near Threatened or Least Concern.
In addition to estimating Neotropical otter distribution, we also compared the environmentalsuitability inside and outside PAs. In our study we showed that PAs are significantly moresuitable and can help in Neotropical otter conservation, even though they have not beencreated specifically to protect otters. The higher suitability values inside the PAs are notsurprising, as many of them were designed based on river basins or river courses [66,67].
PAs, mainly larger ones, reduce human influence and can retain populations and alsoassemblages [68]. PAs are especially important to conserve Amazonian ecosystems, as themajority of the remaining forests throughout the Amazon basin are within protected areasand only 1.5% of these PAs have been deforested [69]. Tropical PAs are ecologically linked totheir surrounding habitats, so it’s important to conserve not only the area within them, butalso surrounding areas in order to maintain local biodiversity [70].
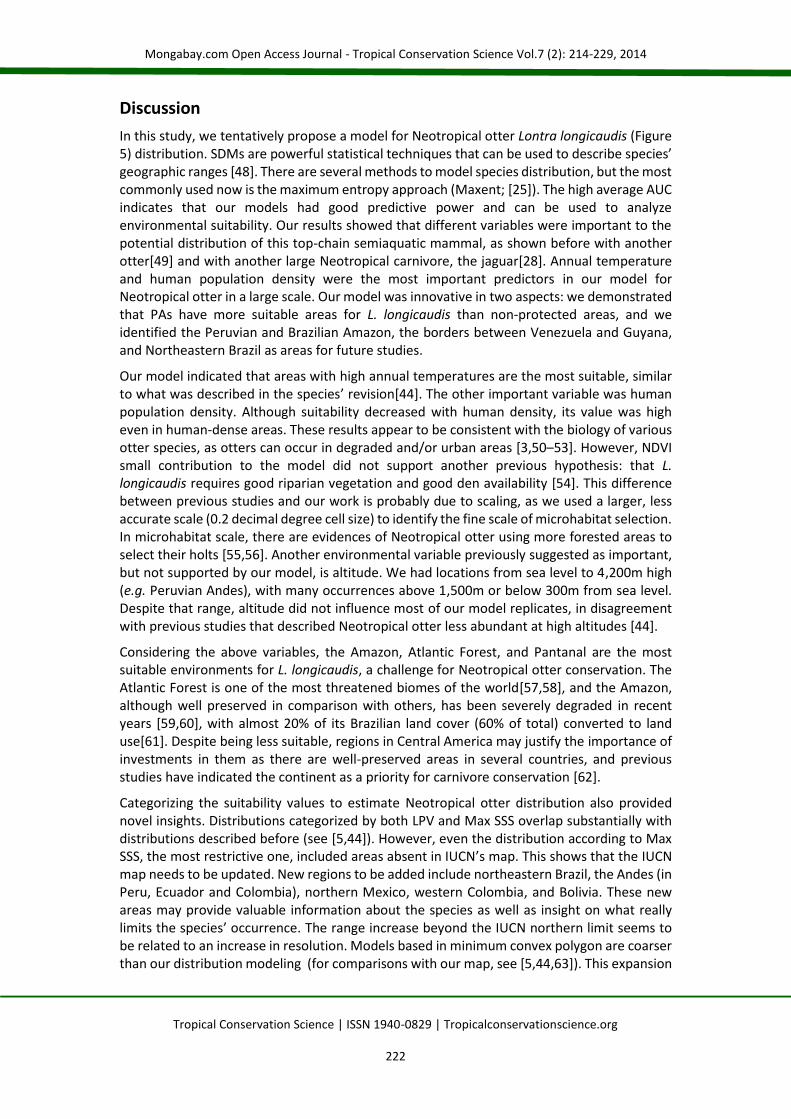
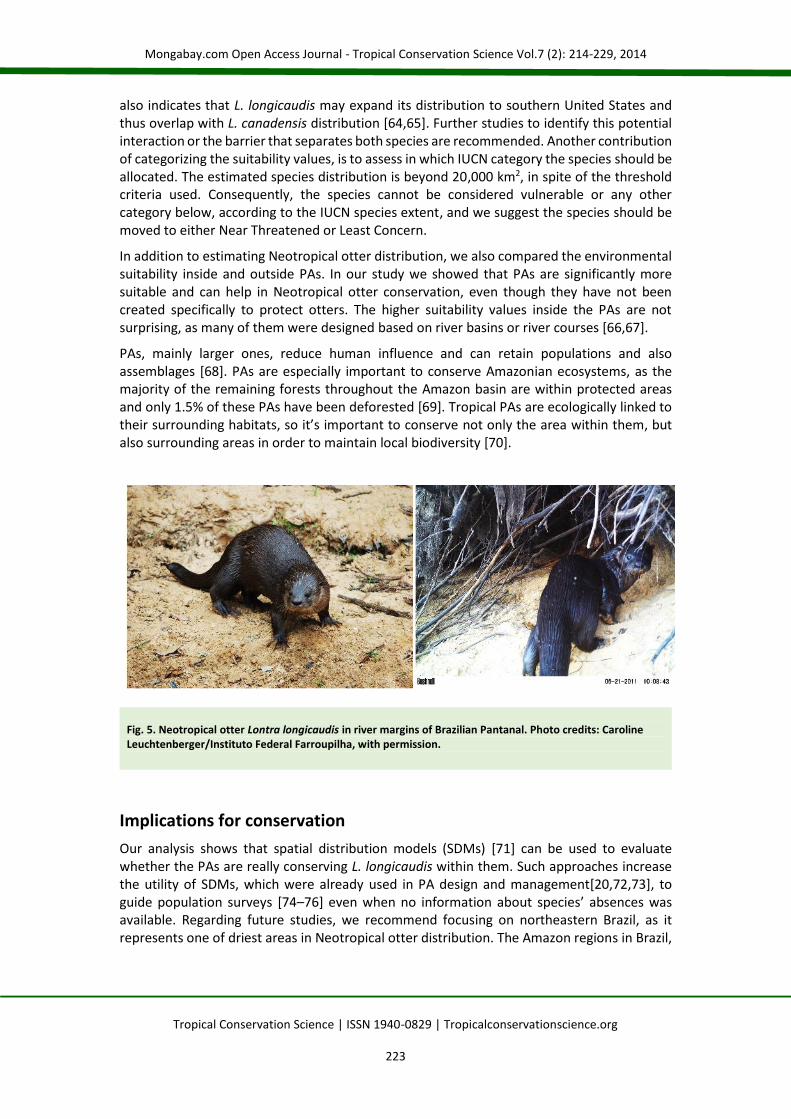
Fig. 5. Neotropical otter Lontra longicaudis in river margins of Brazilian Pantanal. Photo credits: CarolineLeuchtenberger/Instituto Federal Farroupilha, with permission.
Implications for conservationOur analysis shows that spatial distribution models (SDMs) [71] can be used to evaluatewhether the PAs are really conserving L. longicaudis within them. Such approaches increasethe utility of SDMs, which were already used in PA design and management[20,72,73], toguide population surveys [74–76] even when no information about species’ absences wasavailable. Regarding future studies, we recommend focusing on northeastern Brazil, as itrepresents one of driest areas in Neotropical otter distribution. The Amazon regions in Brazil,
Mongabay.com Open Access Journal - Tropical Conservation Science Vol.7 (2): 214-229, 2014
Tropical Conservation Science | ISSN 1940-0829 | Tropicalconservationscience.org
224
Guyana, and Venezuela and the Pantanal are also identified as informative regions due to theirlow human density, mostly warm climate, and well-preserved areas.
As lack of knowledge about a species’ distribution is one of the most important issues inmammal conservation [77], we suggest gathering and compiling otter occurrence data inArgentina, Suriname, Ecuador, Central America, Mexico, and Northeastern Brazil tocorroborate our model predictions that these regions are suitable for the species. DespiteNeotropical otters’ wide distribution range and their being well documented in most of theirdistribution, our study indicates that new research is necessary to obtain Neotropical otteroccurrences in areas with little information.
Despite some undocumented areas, our results suggest that we can move L. longicaudis fromData Deficient to Least Concern or Near Threatened Categories. We demonstrate here thatrudimentary and/or occasional data of occurrence can also be used in spatial distributionmodels and contribute to species conservation by better describing their distribution.
AcknowledgementsWe thank the IUCN OSG, specially the chair of the group Nicole Duplaix, for allowing thecontact with researchers as an official task and for providing information. We also thank toJordi Ruiz-Olmo and Luiz Gustavo Oliveira-Santos for suggestions in the manuscript andBernardo Araújo for the final review. We had the support of Graduate Program in Ecology ofthe Universidade Federal do Rio de Janeiro and PIBIC/UFRJ. This work would not have beenpossible without all of the Survey respondents who took the time to share their knowledgefor the benefit of the species: Andrés Pautasso, Laura Fasola, Claudio Chehébar and MarceloCassini (Argentina); Robert Wallace (WCS/Bolívia), Arturo Muñoz and Aidan Maccormick (NoelKempff Mercado Museum/Bolivia); Roberta Elize Silva, Patrícia Farias and Fernando Rosas(INPA/Brazil); Miriam Marmontel, Joana Silva Macedo, Henrique Lazzarotto and Danielle Lima(Instituto Mamirauá/ Brazil); Carlos Henrique Salvador, Everton Bernardo de Miranda, PamelaAntunes, Carlos André Zucco, Diogo Loretto and Luiz Gustavo Oliveira-Santos (UFRJ/Brazil);Caroline Leuchtenberger and Carolina Ribas (Embrapa Pantanal/Brazil); Helen Waldemarinand Vera de Ferran (Ecology and Environment do Brasil/Brazil); Manoel Comes Muanis(Associação Ecológica Ecomarapendi/Brazil); Tiago Gomes dos Santos (Universidade Federaldo Pampa/Brazil); Fernanda R. Rizzoto and Jaime Martinez (Universidade de PassoFundo/Brazil); Vinicius Galvão Bastazini, Fernando Marques Quintela, Luciane Dutra Colettiand Carlos Benhur Kasper (UFRGS/Brazil); Jorge José Cherem, Mauricio Graipel, HenriqueKrauser, Felipe Fantacini and Barbara Carpegianni (UFSC/Brazil); Marcelo Arasaki (ONGMAE/Brazil); Cláudia Cristina de Sousa de Melo (Museu Paraense Emilio Goeldi, Brazil); SilvanaCampello (Instituto Araguaia/Brazil), Oldemar Carvalho-Junior (Insituto Ekko Brasil/Brazil);Daniel Louzada-Silva (Secretaria de Educação DF/Brazil); Beatriz Beisiegel and Livia Rodrigues(CENAP ICMBio/Brazil); Marcelo Labruna (USP/Brazil); Julio Cesar Voltolini (Univ.Taubaté/Brazil); José Lailson Brito Junior (UERJ/Brazil); Marcelo F. G. Brito (Univ. FederalSergipe/Brazil); Marcelo Passamani (Univ. Federal Lavras/Brazil); David Costa Braga (Brazil);Maria Piedad Baptiste, Fernando Trujillo, Lida Marcela Franco Perez, Maria Fernanda CelyGarcia and Juan Carlos Botello (Colombia); Victor Utreras and Mario Quevedo (WCS Ecuador),Felix Manging (Universidad Guayaquil/Ecuador); Juan Pablo Gallo-Reynoso (IUCNOSG/Mexico); José L. Cartes, Hugo Del Castillo and Alberto Yanosky (AsociaciónGuyra/Paraguay); Rob Williams (Sociedad Zoologica de Francfort/Peru); and IldemaroGonzález (IUCN OSG/Venezuela).
Mongabay.com Open Access Journal - Tropical Conservation Science Vol.7 (2): 214-229, 2014
Tropical Conservation Science | ISSN 1940-0829 | Tropicalconservationscience.org
225
References[1] Brown, J. H. 1995. Macroecology. 270. University of Chicago Press, Chicago.[2] Brown, J. H., Stevens, G. C. and Kaufman, D. M. 1996. The geographic range: size,
shape, boundaries, and internal structure. Annual Review of Ecology and Systematics27: 597–623.
[3] Kruuk, H. 2006. Otters: Ecology, Behaviour and Conservation. 336. Oxford UniversityPress, Oxford.
[4] Rosas, F. C. W. 2004. Lontra, Lontra longicaudis (carnivora: mustelidae). In: HistóriaNatural, Ecologia e Conservação de Algumas Espécies de Plantas e Animais daAmazônia 330. Instituto de Pesquisa da Amazonia, Manaus.
[5] Waldemarin, H. F. and Alvarez, R. 2008. Lontra longicaudis.http://www.iucnredlist.org/details/12304/0
[6] Rheingantz, M. L., Waldemarin, H. F., Rodrigues, L. and Moulton, T. P. 2011. Seasonaland spatial differences in feeding habits of the neotropical otter Lontra longicaudis(carnivora: mustelidae) in a coastal catchment of southeastern brazil. Zoologia(Curitiba, Impresso) 28: 37–44.
[7] Estes, J. a, Terborgh, J., Brashares, J. S., Power, M. E., Berger, J. et al. 2011. Trophicdowngrading of planet Earth. Science 333: 301–6.
[8] Green, J., Green, R. and Jefferies, D. 1984. A radio-tracking survey of otters Lutra lutraon a perthshire river system. Lutra 27: 85–147.
[9] Bowyer, R. T., Testa, J. W. and Faro, J. B. 1995. Habitat selection and home ranges ofriver otters in a marine environment : effects of the Exxon Valdez oil spill. Journal ofMammalogy 76: 1–11.
[10] Blundell, G. M., Maier, J. A. K. and Debevec, E. M. 2014. Linear home ranges: effects ofsmoothing, sample size, and autocorrelation on kernel estimates. EcologicalMonographs 71: 469–489.
[11] Guisan, A. and Thuiller, W. 2005. Predicting species distribution: offering more thansimple habitat models. Ecology Letters 8: 993–1009.
[12] Zimmermann, N. E., Edwards, T. C., Graham, C. H., Pearman, P. B. and Svenning, J. C.2010. New trends in species distribution modelling. Ecography 33: 985–989.
[13] Fisher, D. and Dickman, C. 1993. Body size-prey relationships in insectivorousmarsupials: tests of three hypotheses. Ecology 74: 1871–1883.
[14] Oliveira, M. D., Hamilton, S. K., Calheiros, D. F., Jacobi, C. M. and Latini, R. O. 2000.Modeling the potential distribution of the invasive golden mussel Limnoperna fortuneiin the upper paraguay river system using limnological variables. Brazilian Journal ofBiology 70: 831–840.
[15] Osborne, P. E., Alonso, J. C. and Bryant, R. G. 2001. Modelling landscape-scale habitatuse using GIS and remote sensing: a case study with great bustards. Journal of AppliedEcology 38: 458–471.
[16] Corsi, F., Duprè, E. and Boitani, L. 1999. A large-scale model of wolf distribution in Italyfor conservation planning. Conservation Biology 13: 150–159.
[17] Cianfrani, C., Le Lay, G., Hirzel, A. H. and Loy, A. 2010. Do habitat suitability modelsreliably predict the recovery areas of threatened species? Journal of Applied Ecology47: 421–430.
[18] Colombo, a. F. and Joly, C. A. 2010. Brazilian atlantic forest lato sensu: the most ancientbrazilian forest, and a biodiversity hotspot, is highly threatened by climate change.Brazilian journal of biology = Revista brasleira de biologia 70: 697–708.
[19] Cassini, M. H. 2011. Ranking threats using species distribution models in the IUCN redlist assessment process. Biodiversity and Conservation 20: 3689–3692.
Mongabay.com Open Access Journal - Tropical Conservation Science Vol.7 (2): 214-229, 2014
Tropical Conservation Science | ISSN 1940-0829 | Tropicalconservationscience.org
226
[20] Traill, L. W. and Bigalke, R. C. 2006. A presence-only habitat suitability model for largegrazing african ungulates and its utility for wildlife management. African Journal ofEcology 45: 347–354.
[21] Clement, L., Catzeflis, F., Richard-Hansen, C., Barrioz, S., de Thoisy. 2014. Conservationinterest of spatial distribution modelling applied to large vagile mammals. TropicalConservation Science 7(2) xxx-xxx.
[22] Rondinini, C. and Boitani, L. 2007. Systematic conservation planning and the cost oftackling conservation conflicts with large carnivores in Italy. Conservation biology 21:1455–62.
[23] Pearson, R. G., Dawson, T. P. and Liu, C. 2004. Modelling species distributions in britain:a hierarchical integration of climate and land-cover data. Ecography 27: 285–298.
[24] Luoto, M., Virkkala, R. and Heikkinen, R. K. 2007. The role of land cover in bioclimaticmodels depends on spatial resolution. Global Ecology and Biogeography 16: 34–42.
[25] Phillips, S., Anderson, R. and Schapire, R. 2006. Maximum entropy modeling of speciesgeographic distributions. Ecological Modelling 190: 231–259.
[26] Wisz, M. S., Hijmans, R. J., Li, J., Peterson, A. T., Graham, C. H. et al. 2008. Effects ofsample size on the performance of species distribution models. Diversity andDistributions 14: 763–773.
[27] Riordan, E. C. and Rundel, P. W. 2009. Modelling the distribution of a threatenedhabitat: the California sage scrub. Journal of Biogeography 36: 2176–2188.
[28] Tôrres, N. M., De Marco, P., Santos, T., Silveira, L., de Almeida Jácomo, A. T. et al. 2012.Can species distribution modelling provide estimates of population densities? a casestudy with jaguars in the neotropics. Diversity and Distributions 18: 615–627.
[29] Hernández, L., Laundré, J. W. and Gurung, M. 2005. From the field : use of camera trapsto measure predation risk in a puma – mule deer system. Wildlife Society Bulletin 33:353–358.
[30] Elith, J., Graham, C. H., Anderson, R. P., Dudík, M., Ferrier, S. et al. 2006. Novel methodsimprove prediction of species’ distributions from occurrence data. Ecography 2: 129–151.
[31] DeMatteo, K. E. and Loiselle, B. a. 2008. New data on the status and distribution of thebush dog (Speothos venaticus): evaluating its quality of protection and directingresearch efforts. Biological Conservation 141: 2494–2505.
[32] Elith, J. and Leathwick, J. R. 2009. Species distribution models: ecological explanationand prediction across space and time. Annual Review of Ecology, Evolution, andSystematics 40: 677–697.
[33] Hijmans, R. J., Cameron, S. E., Parra, J. L., Jones, P. G. and Jarvis, A. 2005. Very highresolution interpolated climate surfaces for global land areas. International Journal ofClimatology 25: 1965–1978.
[34] CIESIN and CIAT 2005. Gridded population of the world, version 3 (gpwv3): populationdensity grid. http://sedac.ciesin.columbia.edu/data/set/gpw-v3-population-density
[35] NASA Land Processes Distributed Active Archive Center (LP DAAC). 2012. Terra/modisnet primary production yearly l4 global 1km.https://lpdaac.usgs.gov/products/modis_products_table/mod17a3
[36] Farr, T., Rosen, P. A., Caro, E., Crippen, R., Duren, R. et al. 2007. The shuttle radartopography mission. Review of Geophysics 45: 1–43.
[37] IUCN and UNEP. 2009. The world database on protected areas (wdpa).http://www.wdpa.org/
[38] Bradley, A. 1997. The use of the area under the ROC curve in the evaluation of machinelearning algorithms. Pattern recognition 30: 1145–1159.
Mongabay.com Open Access Journal - Tropical Conservation Science Vol.7 (2): 214-229, 2014
Tropical Conservation Science | ISSN 1940-0829 | Tropicalconservationscience.org
227
[39] Marmion, M., Parviainen, M., Luoto, M., Heikkinen, R. K. and Thuiller, W. 2009.Evaluation of consensus methods in predictive species distribution modelling. Diversityand Distributions 15: 59–69.
[40] Liu, C., White, M. and Newell, G. 2013. Selecting thresholds for the prediction of speciesoccurrence with presence-only data. Journal of Biogeography 40: 778–789.
[41] Liu, C., Berry, P. M., Dawson, T. P. and Pearson, R. G. 2005. Selecting thresholds ofoccurrence in the prediction of species distributions. Ecography 28: 385–393.
[42] ESRI. 2008. Arcgis 10. Environmental Research Institute, Redlands, CA.[43] R Core Team. 2013. R: a language and environment for statistical computing. R Core
Team, Vienna, Austria.[44] Larivière, S. 1999. Lontra longicaudis. Mammalian Species 609: 1–5.[45] Emmons, L. H. and Feer, F. 1997. Neotropical Rainforest Mammals: a Field Guide. 396.
University of Chicago Press, Chicago.[46] Astúa, D., Asfora, P. H., Aléssio, F. M. and Langguth, A. 2010. On the occurrence of the
neotropical otter ( Lontra longicaudis ) ( Mammalia: Mustelidae ) in northeastern Brazil.Mammalia 74: 213–217.
[47] IUCN. 2010. IUCN Red List of Threatened Species. version 2010.4.http://www.iucnredlist.org
[48] Hortal, J., Lobo, J. and Jiménez-Valverde, A. 2012. Basic questions in biogeography andthe (lack of) simplicity of species distributions: putting species distribution models inthe right place. Natureza & Conservação 10: 108–118.
[49] Cianfrani, C., Lay, G. Le, Maiorano, L., Satizábal, H. F., Loy, A. et al. 2011. Adaptingglobal conservation strategies to climate change at the european scale: the otter as aflagship species. Biological Conservation 144: 2068–2080.
[50] Pardini, R. and Trajano, E. 2008. Use of shelters by the neotropical river otter (lontralongicaudis) in an Atlantic Forest stream, southeastern Brazil. Journal of Mammalogy80: 600–610.
[51] Alarcon, G. G. and Simões-Lopes, P. C. 2003. Preserved versus degraded coastalenvironments: a case study of the neotropical otter in the environmental protectionarea of Anhatomirim, southern Brazil. IUCN Otter Specialist Group Bulletin 20: 1–10.
[52] Rheingantz, M. L., Oliveira-santos, L. G., Waldemarin, H. F. and Caramaschi, E. P. 2012.Are otters generalists or do they prefer larger, slower prey? feeding flexibility of theneotropical otter Lontra longicaudis in the Atlantic Forest. IUCN otter specialistbulleting 29: 80–94.
[53] Macdonald, S. M. and Mason, C. F. 1980. Observations on the marking behaviour of acoastal population of otters. Acta Theriologica 25: 245–253.
[54] Blacher, C. 1987. Ocorrência e preservação de lutra longicaudis (Mammalia -mustelidae) no literal de Santa Catarina. Boletim FBCN 22: 105–117.
[55] Quadros, J. and Monteiro-Filho, E. 2002. Sprainting sites of the neotropical otter, Lontralongicaudis, in an Atlantic Forest area of southern Brazil. Mastozoología neotropical 9:39–46.
[56] Kasper, C. and Bastazini, V. 2008. Trophic ecology and the use of shelters and latrinesby the neotropical otter (Lontra longicaudis) in the Taquari valley, southern Brazil.Iheringia. Série … 98: 469–474.
[57] Ranta, P., Blom, T., Niemelä, J., Joensuu, E. and Siitonen, M. 1998. The fragmentedAtlantic rain forest of Brazil: size, shape and distribution of forest fragments.Biodiversity and Conservation 7: 385–403.
Mongabay.com Open Access Journal - Tropical Conservation Science Vol.7 (2): 214-229, 2014
Tropical Conservation Science | ISSN 1940-0829 | Tropicalconservationscience.org
228
[58] Ribeiro, M. C., Metzger, J. P., Martensen, A. C., Ponzoni, F. J. and Hirota, M. M. 2009.The Brazilian Atlantic Forest: how much is left, and how is the remaining forestdistributed? Implications for conservation. Biological Conservation 142: 1141–1153.
[59] Shukla, J., Nobre, C. and Sellers, P. 1990. Amazon deforestation and climate change.Science 247: 1–4.
[60] Rosa, I. M. D., Purves, D., Souza, C. and Ewers, R. M. 2013. Predictive modelling ofcontagious deforestation in the brazilian Amazon. PloS one 8: e77231.
[61] Pereira, D., Santos, D., Vedoveto, M., Guimarães, J. and Veríssimo, A. 2010. FatosFlorestais Da Amazônia 2010. 124. Instituto do Homem e Meio Ambiente da Amazônia,Belém.
[62] Loyola, R. D., Oliveira-Santos, L. G. R., Almeida-Neto, M., Nogueira, D. M., Kubota, U. etal. 2009. Integrating economic costs and biological traits into global conservationpriorities for carnivores. PloS one 4: e6807.
[63] Eisenberg, J. and Redford, K. 1999. Mammals Of The Neotropics. V.3. The CentralNeotropics: Ecuador, Peru, Bolivia, Brazil. The University of Chicago Press, Chicago.
[64] Polechla, P. 1990. Action plan for north american otters. In: Otters: An action plan fortheir conservation Foster-Turley, P., Macdonald, S. and Mason, C.(Eds.) 126.International Union for the Conservation of Nature, Gland, Switzerland.
[65] Larivière, S. 1998. Lontra canadensis. Mammalian Species 587: 1–8.[66] Balana, B. B., Yatich, T. and Mäkelä, M. 2011. A conjoint analysis of landholder
preferences for reward-based land-management contracts in kapingazi watershed,eastern mount Kenya. Journal of environmental management 92: 2634–46.
[67] Shanahan, S. A., Nelson, S. M., Van Dooremolen, D. M. and Eckberg, J. R. 2011.Restoring habitat for riparian birds in the lower Colorado river watershed : an examplefrom the las vegas wash , nevada. Journal of Arid Environments 75: 1182–1190.
[68] Cantú-Salazar, L. and Gaston, K. J. 2013. Species richness and representation inprotected areas of the western hemisphere: discrepancies between checklists andrange maps. Diversity and Distributions 19: 782–793.
[69] Numata, I. and Cochrane, M. A. 2012. Forest fragmentation and its potentialimplications in the brazilian Amazon between 2001 and 2010. Open Journal of Forestry2: 265–271.
[70] Laurance, W. F., Useche, D. C., Rendeiro, J., Kalka, M., Bradshaw, C. J. a et al. 2012.Averting biodiversity collapse in tropical forest protected areas. Nature 489: 290–4.
[71] Guisan, A. and Zimmermann, N. E. 2000. Predictive habitat distribution models inecology. Ecological Modelling 135: 147–186.
[72] Loiselle, B. A., Howell, C. A., Graham, C. H., Goerck, J. M., Brooks, T. et al. 2003.Avoiding pitfalls of using species distribution models in conservation planning.Conservation Biology 17: 1591–1600.
[73] Wilson, K. A., Westphal, M. I., Possingham, H. P. and Elith, J. 2005. Sensitivity ofconservation planning to different approaches to using predicted species distributiondata. Biological Conservation 22: 99–112.
[74] Bourg, N. A., McShea, W. J. and Gill, D. E. 2005. Putting a cart before the search:successful habitat prediction for a rare forest herb. Ecology 86: 2793–2804.
[75] De Siqueira, M. F., Durigan, G., de Marco Júnior, P. and Peterson, A. T. 2009. Somethingfrom nothing: using landscape similarity and ecological niche modeling to find rareplant species. Journal for Nature Conservation 17: 25–32.
[76] Jackson, C. R. and Robertson, M. P. 2011. Predicting the potential distribution of anendangered cryptic subterranean mammal from few occurrence records. Journal forNature Conservation 19: 87–94.
Mongabay.com Open Access Journal - Tropical Conservation Science Vol.7 (2): 214-229, 2014
Tropical Conservation Science | ISSN 1940-0829 | Tropicalconservationscience.org
229
[77] Rondinini, C., Rodrigues, A. S. L. and Boitani, L. 2011. The key elements of acomprehensive global mammal conservation strategy. Philosophical transactions of theRoyal Society of London. Series B, Biological sciences 366: 2591–7.