Defining great customer experience. Investor Presentation Q3 10 August 24 2010.
34
Defining great customer experience. Investor Presentation Q3 10 August 24 2010
Transcript of Defining great customer experience. Investor Presentation Q3 10 August 24 2010.

Defining great customer experience.
Investor PresentationQ3 10
August 24 2010
2Strategic Highlights • August 24 • 2010
Forward Looking Statements & Non-GAAP MeasuresCaution Regarding Forward-Looking Statements
Bank of Montreal’s public communications often include written or oral forward-looking statements. Statements of this type are included in this document, and may be included in other filings with Canadian securities regulators or the U.S. Securities and Exchange Commission, or in other communications. All such statements are made pursuant to the safe harbour provisions of, and are intended to be forward-looking statements under, the United States Private Securities Litigation Reform Act of 1995 and any applicable Canadian securities legislation. Forward-looking statements may involve, but are not limited to, comments with respect to our objectives and priorities for 2010 and beyond, our strategies or future actions, our targets, expectations for our financial condition or share price, and the results of or outlook for our operations or for the Canadian and U.S. economies.
By their nature, forward-looking statements require us to make assumptions and are subject to inherent risks and uncertainties. There is significant risk that predictions, forecasts, conclusions or projections will not prove to be accurate, that our assumptions may not be correct and that actual results may differ materially from such predictions, forecasts, conclusions or projections. We caution readers of this document not to place undue reliance on our forward-looking statements as a number of factors could cause actual future results, conditions, actions or events to differ materially from the targets, expectations, estimates or intentions expressed in the forward-looking statements.
The future outcomes that relate to forward-looking statements may be influenced by many factors, including but not limited to: general economic and market conditions in the countries in which we operate; interest rate and currency value fluctuations; changes in monetary policy; the degree of competition in the geographic and business areas in which we operate; changes in laws; judicial or regulatory proceedings; the accuracy and completeness of the information we obtain with respect to our customers and counterparties; our ability to execute our strategic plans and to complete and integrate acquisitions; critical accounting estimates; operational and infrastructure risks; general political conditions; global capital market activities; the possible effects on our business of war or terrorist activities; disease or illness that impacts on local, national or international economies; disruptions to public infrastructure, such as transportation, communications, power or water supply; and technological changes.
We caution that the foregoing list is not exhaustive of all possible factors. Other factors could adversely affect our results. For more information, please see the discussion on pages 32 and 33 of BMO’s 2009 Annual Report, which outlines in detail certain key factors that may affect BMO’s future results. When relying on forward-looking statements to make decisions with respect to Bank of Montreal, investors and others should carefully consider these factors, as well as other uncertainties and potential events, and the inherent uncertainty of forward-looking statements. Bank of Montreal does not undertake to update any forward-looking statement, whether written or oral, that may be made, from time to time, by the organization or on its behalf, except as required by law. The forward-looking information contained in this document is presented for the purpose of assisting our shareholders in understanding our financial position as at and for the periods ended on the dates presented and our strategic priorities and objectives, and may not be appropriate for other purposes.
In concluding that we will complete the conversion of the operations acquired through the second quarter Rockford, Illinois-based bank transaction, we have assumed that no competing priorities emerge that take a priority claim to the needed staffing and technical resources and that no serious systems problems arise on the conversion.
Assumptions about the performance of the Canadian and U.S. economies as well as overall market conditions and their combined effect on the bank’s business, including those described under the heading Economic Outlook and Review in our Third Quarter 2010 Report to Shareholders, are material factors we consider when determining our strategic priorities, objectives and expectations for our business. In determining our expectations for economic growth, both broadly and in the financial services sector, we primarily consider historical economic data provided by the Canadian and U.S. governments and their agencies.
Non-GAAP Measures
Bank of Montreal uses both GAAP and certain non-GAAP measures to assess performance. Readers are cautioned that earnings and other measures adjusted to a basis other than GAAP do not have standardized meanings under GAAP and are unlikely to be comparable to similar measures used by other companies. Reconciliations of GAAP to non-GAAP measures as well as the rationale for their use can be found in Bank of Montreal’s Third Quarter 2010 Report to Shareholders and 2009 Annual Report to Shareholders all of which are available on our website at www.bmo.com/investorrelations. Examples of non-GAAP amounts or measures include: cash earnings per share, cash operating leverage, cash ROE and cash productivity; revenue and other measures presented on a taxable equivalent basis (teb); net income and cash productivity ratios measured on a core basis to exclude the impact of impaired loans, VISA litigation and acquisition integration costs; amounts presented net of applicable taxes and earnings which exclude the impact of provision for credit losses and taxes. Bank of Montreal provides supplemental information on combined business segments to facilitate comparisons to peers.

Defining great customer experience.
Bill DownePresident & Chief Executive Officer
BMO Financial Group
Strategic Highlights Q3 10
August 24 2010
4Strategic Highlights • August 24 • 2010
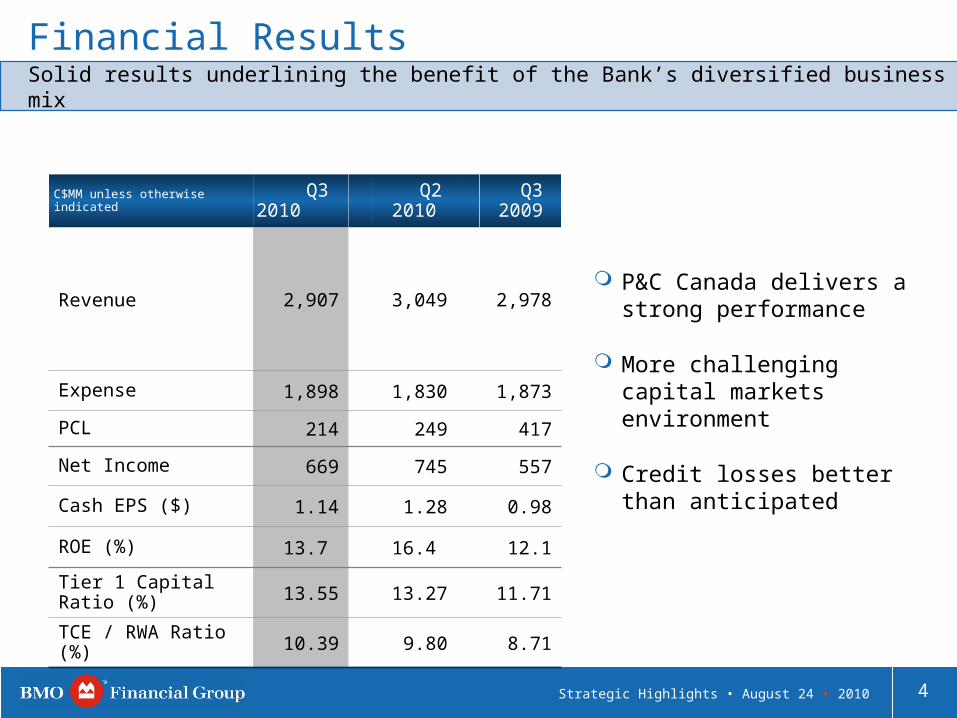
Financial Results
P&C Canada delivers a strong performance
More challenging capital markets environment
Credit losses better than anticipated
Solid results underlining the benefit of the Bank’s diversified business mix
C$MM unless otherwise indicated
Q3 2010
Q2 2010
Q3 2009
Revenue 2,907 3,049
2,978
Expense 1,898 1,830 1,873
PCL 214 249 417
Net Income 669 745 557
Cash EPS ($) 1.14 1.28 0.98
ROE (%) 13.7 16.4 12.1
Tier 1 Capital Ratio (%) 13.55 13.27 11.71
TCE / RWA Ratio (%) 10.39 9.80 8.71
5Strategic Highlights • August 24 • 2010
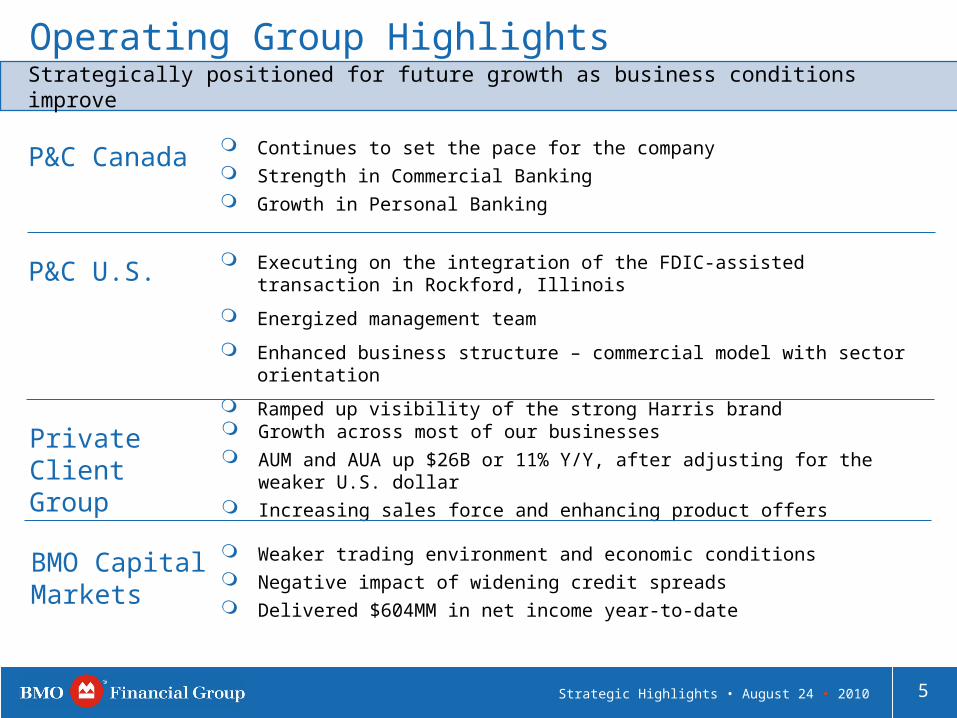
Operating Group HighlightsStrategically positioned for future growth as business conditions improve
P&C Canada Continues to set the pace for the company Strength in Commercial Banking Growth in Personal Banking
P&C U.S. Executing on the integration of the FDIC-assisted transaction in Rockford, Illinois
Energized management team
Enhanced business structure – commercial model with sector orientation
Ramped up visibility of the strong Harris brand
Private Client Group
Growth across most of our businesses AUM and AUA up $26B or 11% Y/Y, after adjusting for the weaker U.S.
dollar Increasing sales force and enhancing product offers
BMO Capital Markets
Weaker trading environment and economic conditions Negative impact of widening credit spreads Delivered $604MM in net income year-to-date
6Strategic Highlights • August 24 • 2010
Capital and Regulatory Changes
Open items expected to be resolved towards calendar year-end
Global framework will provide an appropriate transition period to ensure new rules, once implemented, do not jeopardize the recovery
Tier 1 Capital Ratio 13.55% and TCE / RWA Ratio 10.39%
Carefully monitoring all capital and regulatory changes that impact strategic expansion of US footprint
Prudent strategy of maintaining elevated capital and liquidity levels yields opportunities
7Strategic Highlights • August 24 • 2010
Looking Ahead…
BMO will continue to benefit from strong diversified business mix
Regulatory environment is manageable
GDP expected to remain positive supporting planned business growth
P&C Canada and PCG producing very good results
P&C US and BMO CM positioning businesses to benefit as the US economy gradually improves
Credit performance expected to continue to improve with some quarterly variability
Balance sheet is strong and committed to growth
Well positioned to increase our pace of growth

8Strategic Highlights • August 24 • 2010
Russ RobertsonChief Financial OfficerBMO Financial Group
Financial Results Q3 10
August 24 2010
9Strategic Highlights • August 24 • 2010
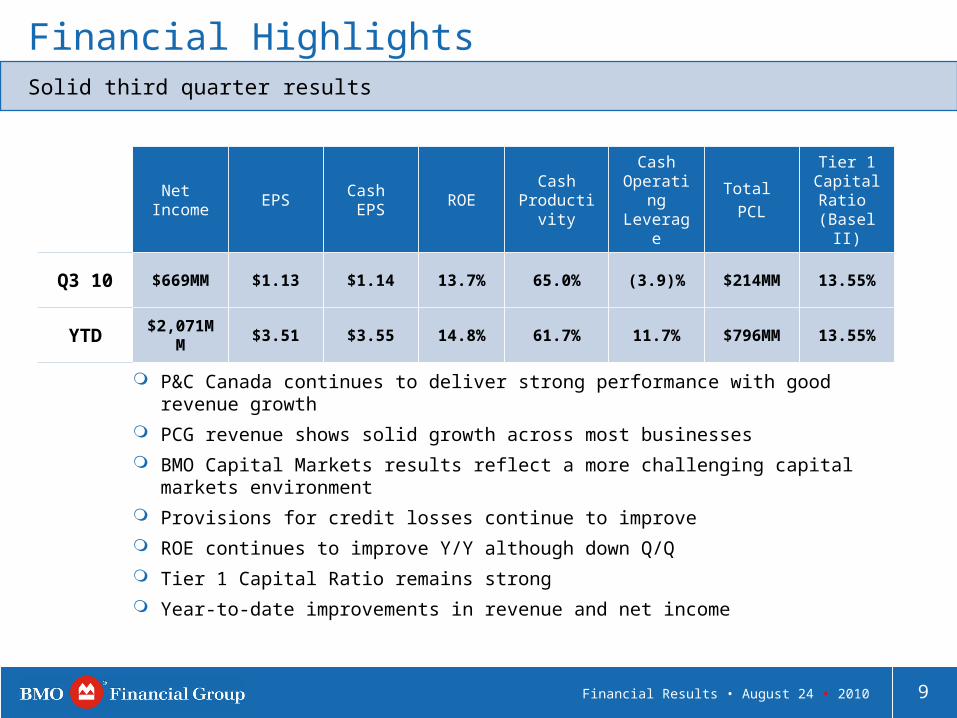
Financial Highlights
P&C Canada continues to deliver strong performance with good revenue growth
PCG revenue shows solid growth across most businesses
BMO Capital Markets results reflect a more challenging capital markets environment
Provisions for credit losses continue to improve
ROE continues to improve Y/Y although down Q/Q
Tier 1 Capital Ratio remains strong
Year-to-date improvements in revenue and net income
Solid third quarter results
Net Income
EPSCash EPS
ROECash
Productivity
Cash Operating Leverage
Total
PCL
Tier 1 Capital Ratio
(Basel II)
Q3 10 $669MM $1.13 $1.14 13.7% 65.0% (3.9)% $214MM 13.55%
YTD $2,071MM $3.51 $3.55 14.8% 61.7% 11.7% $796MM 13.55%
9Financial Results • August 24 • 2010
10Strategic Highlights • August 24 • 2010
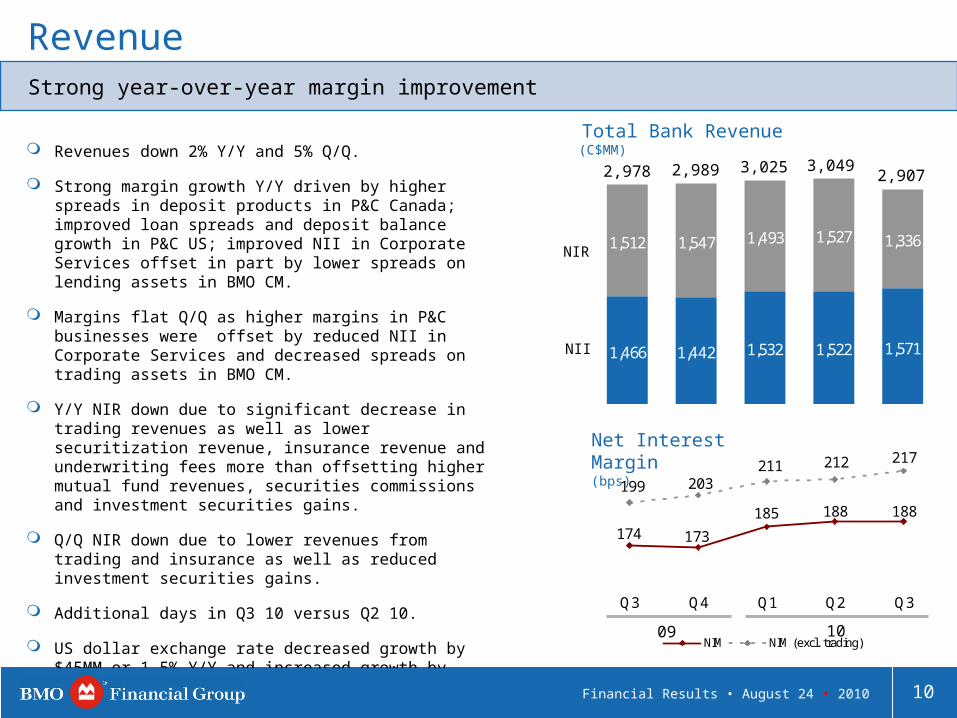
Revenues down 2% Y/Y and 5% Q/Q.
Strong margin growth Y/Y driven by higher spreads in deposit products in P&C Canada; improved loan spreads and deposit balance growth in P&C US; improved NII in Corporate Services offset in part by lower spreads on lending assets in BMO CM.
Margins flat Q/Q as higher margins in P&C businesses were offset by reduced NII in Corporate Services and decreased spreads on trading assets in BMO CM.
Y/Y NIR down due to significant decrease in trading revenues as well as lower securitization revenue, insurance revenue and underwriting fees more than offsetting higher mutual fund revenues, securities commissions and investment securities gains.
Q/Q NIR down due to lower revenues from trading and insurance as well as reduced investment securities gains.
Additional days in Q3 10 versus Q2 10.
US dollar exchange rate decreased growth by $45MM or 1.5% Y/Y and increased growth by $12MM or 0.4% Q/Q.
Revenue
1,466 1,442 1,532 1,522 1,571
1,512 1,547 1,493 1,527 1,336
NII
NIR
Total Bank Revenue (C$MM)
3,025 3,0492,9072,978 2,989
Strong year-over-year margin improvement
188188185
173174
217212211199 203
Q3 Q4 Q1 Q2 Q3
NIM NIM (excl. trading)
Net Interest Margin(bps)
09 10
10Financial Results • August 24 • 2010
11Strategic Highlights • August 24 • 2010
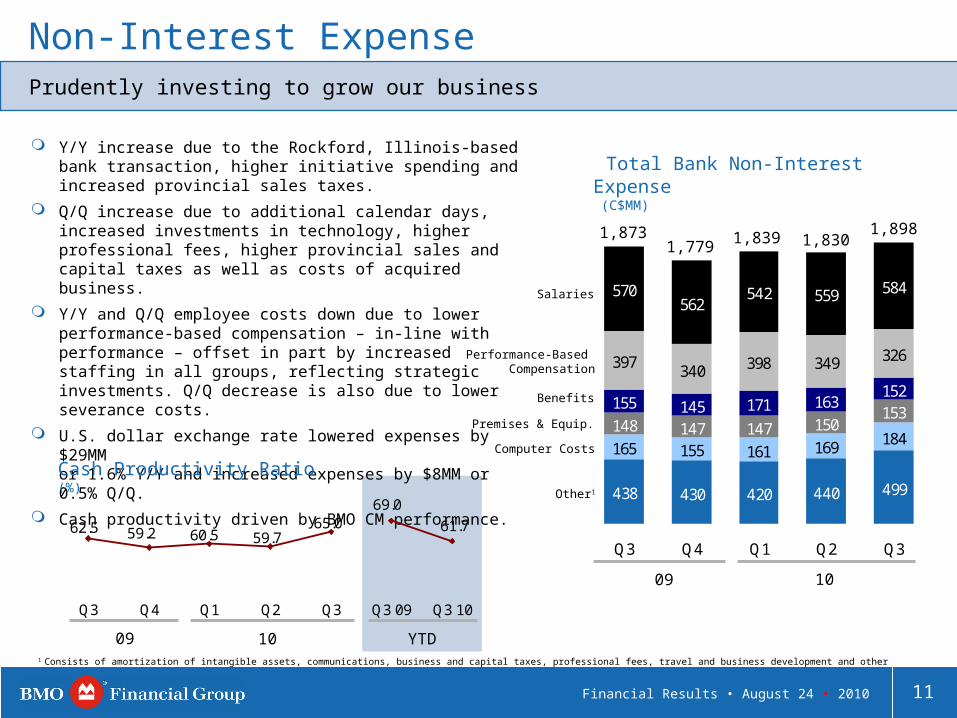
438 430 420 440 499
165 155 161 169 184148 147 147 150
153155 145 171 163
152
397 340 398 349 326
570562
542 559 584
Q3 Q4 Q1 Q2 Q3
10
Non-Interest Expense
09
1,839 1,8301,8981,873
1,779
Y/Y increase due to the Rockford, Illinois-based bank transaction, higher initiative spending and increased provincial sales taxes.
Q/Q increase due to additional calendar days, increased investments in technology, higher professional fees, higher provincial sales and capital taxes as well as costs of acquired business.
Y/Y and Q/Q employee costs down due to lower performance-based compensation – in-line with performance – offset in part by increased staffing in all groups, reflecting strategic investments. Q/Q decrease is also due to lower severance costs.
U.S. dollar exchange rate lowered expenses by $29MM or 1.6% Y/Y and increased expenses by $8MM or 0.5% Q/Q.
Cash productivity driven by BMO CM performance.
Prudently investing to grow our business
09 10
Cash Productivity Ratio (%)
Total Bank Non-Interest Expense (C$MM)
Computer Costs
Performance-Based Compensation
Benefits
Premises & Equip.
Salaries
Other1
1 Consists of amortization of intangible assets, communications, business and capital taxes, professional fees, travel and business development and other
YTD
11Financial Results • August 24 • 2010
61.7
69.0
62.5 59.2 60.5 59.765.0
Q3 Q4 Q1 Q2 Q3 Q3 09 Q3 10
12Strategic Highlights • August 24 • 2010
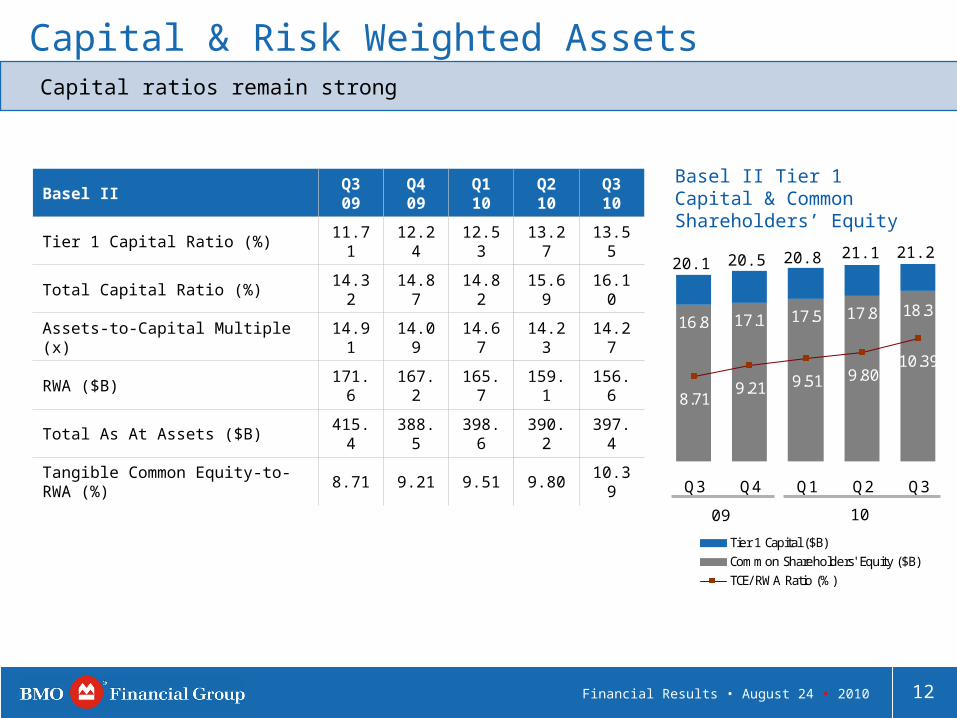
Capital & Risk Weighted Assets
Basel II Q3 09 Q4 09 Q1 10 Q2 10 Q3 10
Tier 1 Capital Ratio (%) 11.71 12.24 12.53 13.27 13.55
Total Capital Ratio (%) 14.32 14.87 14.82 15.69 16.10
Assets-to-Capital Multiple (x) 14.91 14.09 14.67 14.23 14.27
RWA ($B) 171.6 167.2 165.7 159.1 156.6
Total As At Assets ($B) 415.4 388.5 398.6 390.2 397.4
Tangible Common Equity-to-RWA (%)
8.71 9.21 9.51 9.80 10.39
16.8 17.1 17.5 17.8 18.3
10.399.80
9.218.71
9.51
Q3 Q4 Q1 Q2 Q3
Tier 1 Capital ($B)
Common Shareholders' Equity ($B)
TCE/ RWA Ratio (%)
09
20.5 20.8 21.120.1
21.2
10
Basel II Tier 1 Capital & Common Shareholders’ Equity
Capital ratios remain strong
12Financial Results • August 24 • 2010
13Strategic Highlights • August 24 • 2010
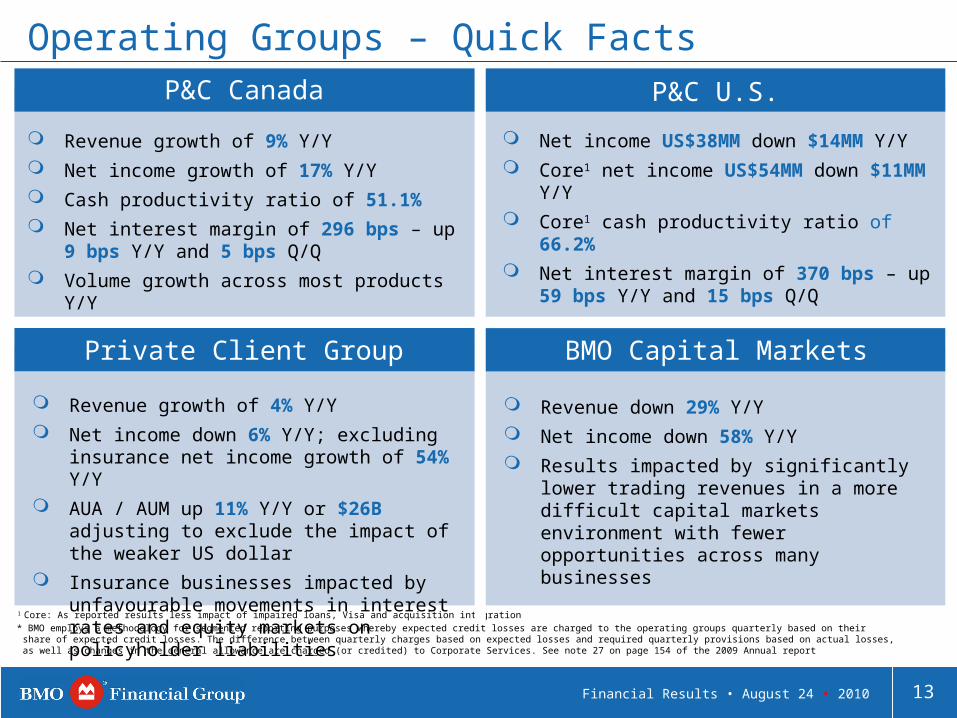
Revenue down 29% Y/Y
Net income down 58% Y/Y
Results impacted by significantly lower trading revenues in a more difficult capital markets environment with fewer opportunities across many businesses
Net income US$38MM down $14MM Y/Y
Core1 net income US$54MM down $11MM Y/Y
Core1 cash productivity ratio of 66.2%
Net interest margin of 370 bps – up 59 bps Y/Y and 15 bps Q/Q
Operating Groups – Quick FactsP&C Canada P&C U.S.
Revenue growth of 9% Y/Y
Net income growth of 17% Y/Y
Cash productivity ratio of 51.1%
Net interest margin of 296 bps – up 9 bps Y/Y and 5 bps Q/Q
Volume growth across most products Y/Y
Revenue growth of 4% Y/Y
Net income down 6% Y/Y; excluding insurance net income growth of 54% Y/Y
AUA / AUM up 11% Y/Y or $26B adjusting to exclude the impact of the weaker US dollar
Insurance businesses impacted by unfavourable movements in interest rates and equity markets on policyholder liabilities
1 Core: As reported results less impact of impaired loans, Visa and acquisition integration
Private Client Group BMO Capital Markets
* BMO employs a methodology for segmented reporting purposes whereby expected credit losses are charged to the operating groups quarterly based on their share of expected credit losses. The difference between quarterly charges based on expected losses and required quarterly provisions based on actual losses, as well as changes in the general allowance are charged (or credited) to Corporate Services. See note 27 on page 154 of the 2009 Annual report
13Financial Results • August 24 • 2010
14Strategic Highlights • August 24 • 2010
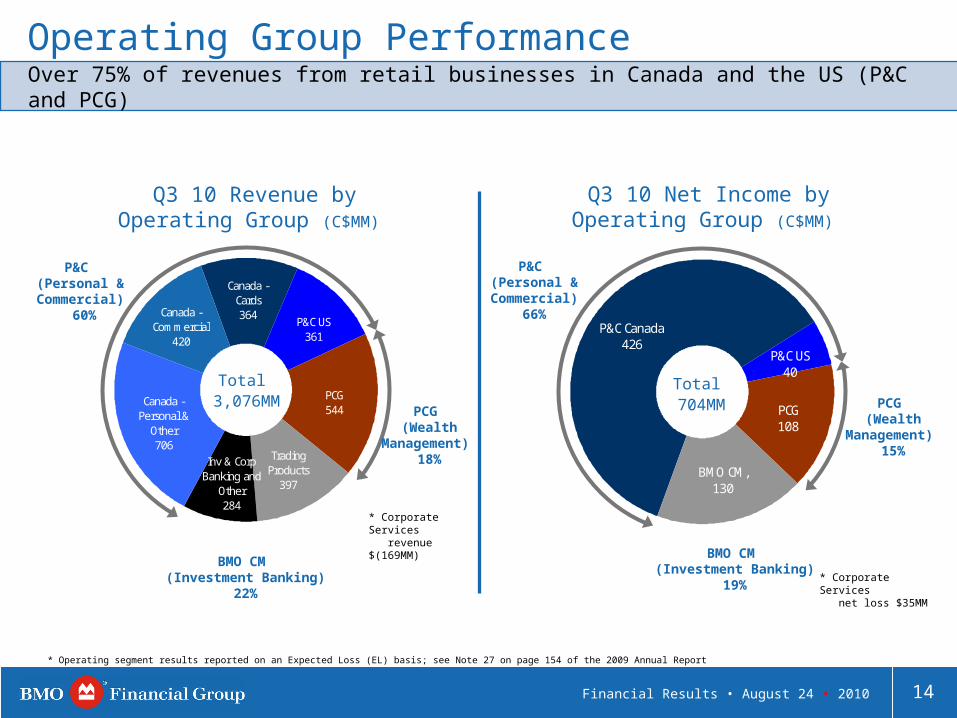
Operating Group Performance
Q3 10 Revenue by Operating Group (C$MM)
P&C (Personal & Commercial)
66%
Total 3,076MM
P&C (Personal & Commercial)
60%
BMO CM (Investment Banking)
22%
PCG (Wealth
Management) 18%
* Corporate Services revenue $(169MM)
Over 75% of revenues from retail businesses in Canada and the US (P&C and PCG)
Q3 10 Net Income by Operating Group (C$MM)
BMO CM (Investment Banking)
19%
PCG (Wealth
Management) 15%
* Corporate Services net loss $35MM
Total 704MM
* Operating segment results reported on an Expected Loss (EL) basis; see Note 27 on page 154 of the 2009 Annual Report
BMO CM, 130
PCG108
P&C US 40
P&C Canada 426
Inv & Corp Banking and
Other284
Trading Products
397
PCG 544
Canada - Commercial
420
Canada - Personal &
Other706
P&C US 361
Canada - Cards 364
14Financial Results • August 24 • 2010
15Strategic Highlights • August 24 • 2010
287 290295
291296
Q3 Q4 Q1 Q2 Q3
10
Personal & Commercial Banking - Canada
09
Net Interest Margin(bps)
As Reported ($MM)
Q3 09 Q4 09 Q1 10 Q2 10 Q3 10 Q/Q B/(W)
Y/Y B/(W)
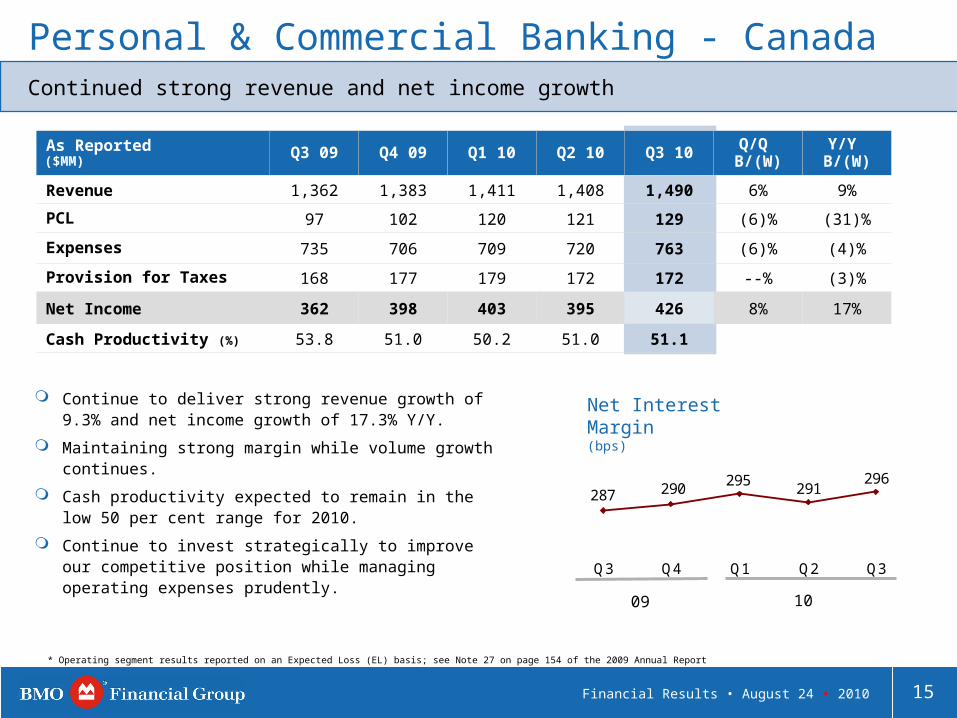
Revenue 1,362 1,383 1,411 1,408 1,490 6% 9%
PCL 97 102 120 121 129 (6)% (31)%
Expenses 735 706 709 720 763 (6)% (4)%
Provision for Taxes 168 177 179 172 172 --% (3)%
Net Income 362 398 403 395 426 8% 17%
Cash Productivity (%) 53.8 51.0 50.2 51.0 51.1
Continued strong revenue and net income growth
Continue to deliver strong revenue growth of 9.3% and net income growth of 17.3% Y/Y.
Maintaining strong margin while volume growth continues.
Cash productivity expected to remain in the low 50 per cent range for 2010.
Continue to invest strategically to improve our competitive position while managing operating expenses prudently.
* Operating segment results reported on an Expected Loss (EL) basis; see Note 27 on page 154 of the 2009 Annual Report
15Financial Results • August 24 • 2010
16Strategic Highlights • August 24 • 2010
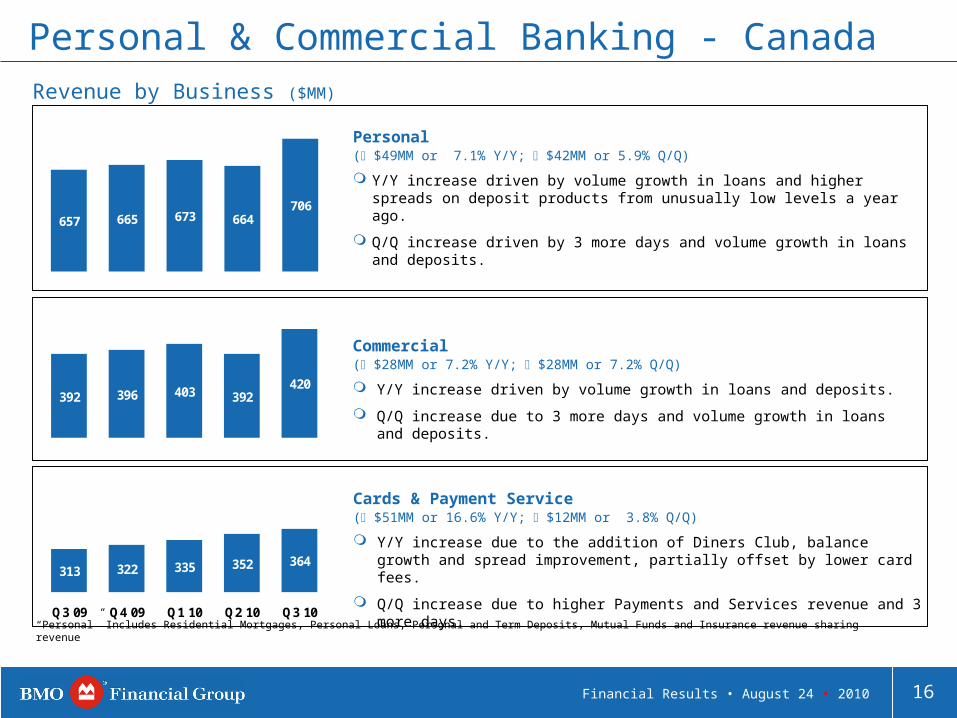
313 322 335 352 364
Q3 09 Q4 09 Q1 10 Q2 10 Q3 10
392 396 403 392420
657 665 673 664706
Revenue by Business ($MM)
“Personal” Includes Residential Mortgages, Personal Loans, Personal and Term Deposits, Mutual Funds and Insurance revenue sharing revenue
Personal & Commercial Banking - Canada
Personal ( $49MM or 7.1% Y/Y; $42MM or 5.9% Q/Q)
Y/Y increase driven by volume growth in loans and higher spreads on deposit products from unusually low levels a year ago.
Q/Q increase driven by 3 more days and volume growth in loans and deposits.
Commercial ( $28MM or 7.2% Y/Y; $28MM or 7.2% Q/Q)
Y/Y increase driven by volume growth in loans and deposits.
Q/Q increase due to 3 more days and volume growth in loans and deposits.
Cards & Payment Service ( $51MM or 16.6% Y/Y; $12MM or 3.8% Q/Q)
Y/Y increase due to the addition of Diners Club, balance growth and spread improvement, partially offset by lower card fees.
Q/Q increase due to higher Payments and Services revenue and 3 more days.
16Financial Results • August 24 • 2010
17Strategic Highlights • August 24 • 2010
370355
336320
311
Q3 Q4 Q1 Q2 Q3
10
Personal & Commercial Banking - U.S.
As Reported (US$MM)
Q3 09 Q4 09 Q1 10 Q2 10 Q3 10 Q/Q B/(W)
Y/Y B/(W)
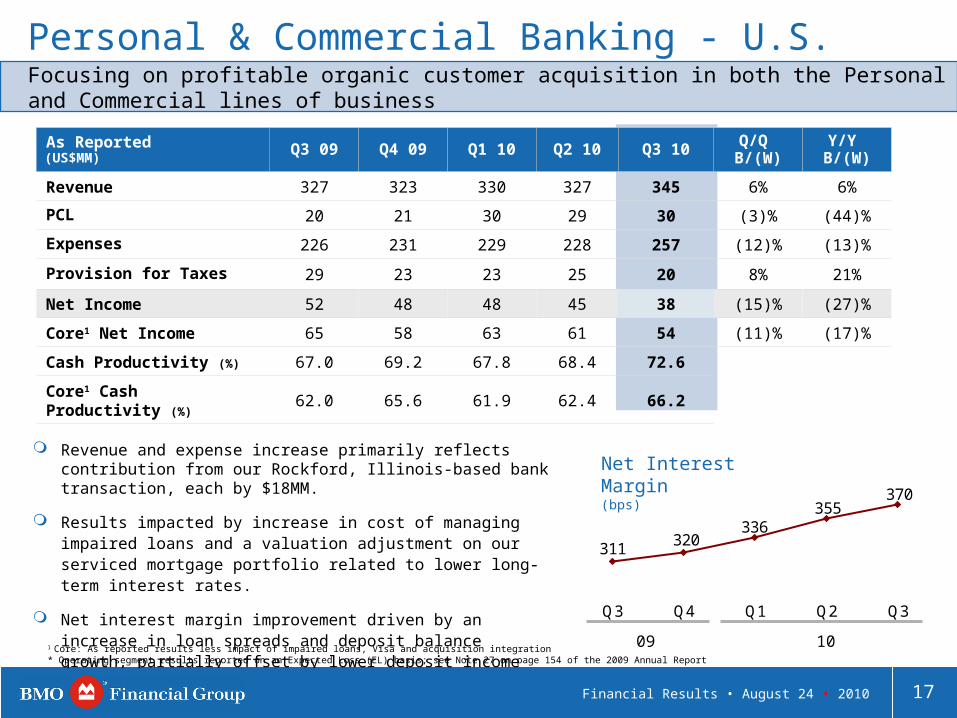
Revenue 327 323 330 327 345 6% 6%
PCL 20 21 30 29 30 (3)% (44)%
Expenses 226 231 229 228 257 (12)% (13)%
Provision for Taxes 29 23 23 25 20 8% 21%
Net Income 52 48 48 45 38 (15)% (27)%
Core1 Net Income 65 58 63 61 54 (11)% (17)%
Cash Productivity (%) 67.0 69.2 67.8 68.4 72.6
Core1 Cash Productivity (%) 62.0 65.6 61.9 62.4 66.2
09
Net Interest Margin(bps)
Focusing on profitable organic customer acquisition in both the Personal and Commercial lines of business
1 Core: As reported results less impact of impaired loans, Visa and acquisition integration
Revenue and expense increase primarily reflects contribution from our Rockford, Illinois-based bank transaction, each by $18MM.
Results impacted by increase in cost of managing impaired loans and a valuation adjustment on our serviced mortgage portfolio related to lower long-term interest rates.
Net interest margin improvement driven by an increase in loan spreads and deposit balance growth, partially offset by lower deposit income due to deposit spread compression.
* Operating segment results reported on an Expected Loss (EL) basis; see Note 27 on page 154 of the 2009 Annual Report
17Financial Results • August 24 • 2010
18Strategic Highlights • August 24 • 2010
Private Client Group
As Reported ($MM)
Q3 09 Q4 09 Q1 10 Q2 10 Q3 10 Q/Q B/(W)
Y/Y B/(W)
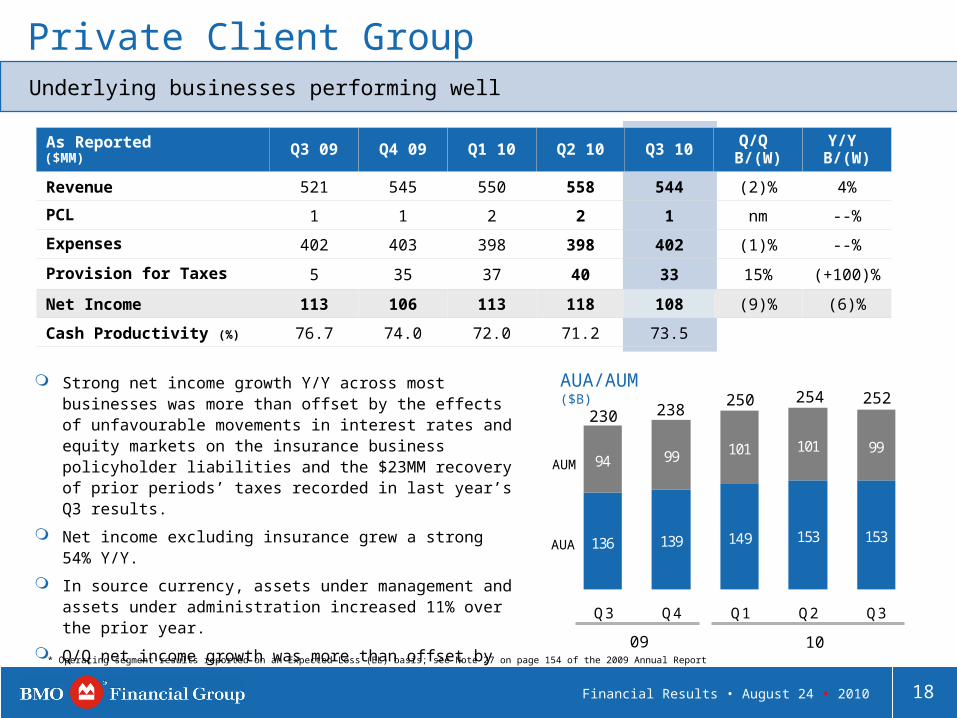
Revenue 521 545 550 558 544 (2)% 4%
PCL 1 1 2 2 1 nm --%
Expenses 402 403 398 398 402 (1)% --%
Provision for Taxes 5 35 37 40 33 15% (+100)%
Net Income 113 106 113 118 108 (9)% (6)%
Cash Productivity (%) 76.7 74.0 72.0 71.2 73.5
136 139 149 153 153
94 99 101 101 99
Q3 Q4 Q1 Q2 Q3
09 10
AUA/AUM ($B)
AUA
AUM
Underlying businesses performing well
230 238250 254 252
Strong net income growth Y/Y across most businesses was more than offset by the effects of unfavourable movements in interest rates and equity markets on the insurance business policyholder liabilities and the $23MM recovery of prior periods’ taxes recorded in last year’s Q3 results.
Net income excluding insurance grew a strong 54% Y/Y.
In source currency, assets under management and assets under administration increased 11% over the prior year.
Q/Q net income growth was more than offset by the effects of adverse market movements on the insurance business policyholder liabilities.
* Operating segment results reported on an Expected Loss (EL) basis; see Note 27 on page 154 of the 2009 Annual Report
18Financial Results • August 24 • 2010
19Strategic Highlights • August 24 • 2010
74
46
7364
70
Net Income by Business ($MM)
Private Client Group
34454342
67
Q3 09 Q4 09 Q1 10 Q2 10 Q3 10
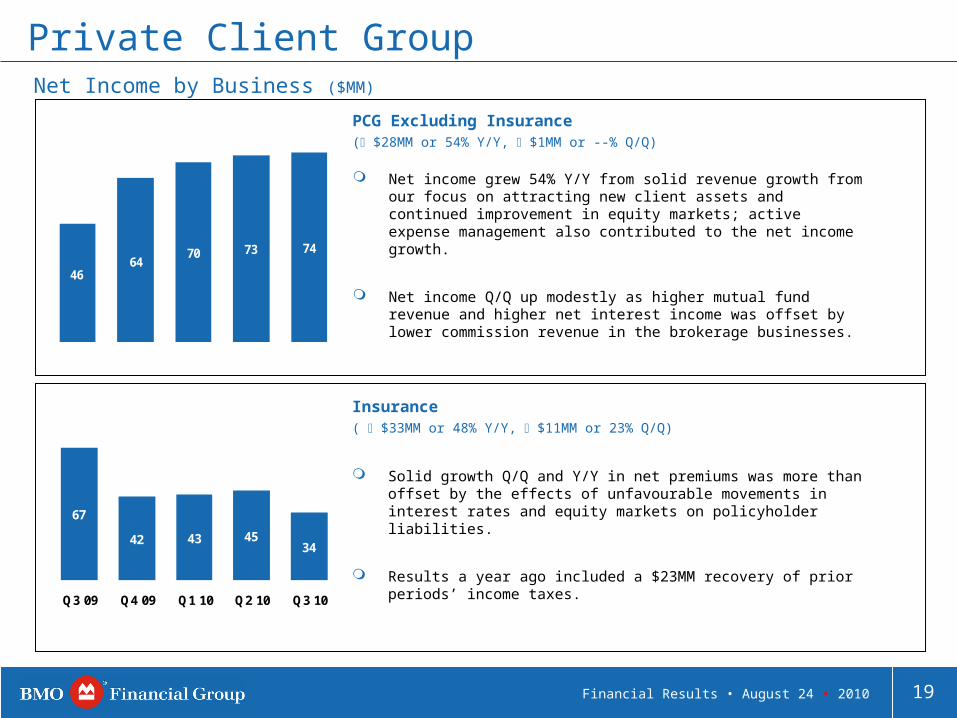
Insurance ( $33MM or 48% Y/Y, $11MM or 23% Q/Q)
PCG Excluding Insurance ( $28MM or 54% Y/Y, $1MM or --% Q/Q)
Solid growth Q/Q and Y/Y in net premiums was more than offset by the effects of unfavourable movements in interest rates and equity markets on policyholder liabilities.
Results a year ago included a $23MM recovery of prior periods’ income taxes.
Net income grew 54% Y/Y from solid revenue growth from our focus on attracting new client assets and continued improvement in equity markets; active expense management also contributed to the net income growth.
Net income Q/Q up modestly as higher mutual fund revenue and higher net interest income was offset by lower commission revenue in the brokerage businesses.
19Financial Results • August 24 • 2010
20Strategic Highlights • August 24 • 2010
BMO Capital Markets
09 10
Cash Return on Equity (%)
As Reported ($MM)
Q3 09 Q4 09 Q1 10 Q2 10 Q3 10 Q/Q B/(W)
Y/Y B/(W)
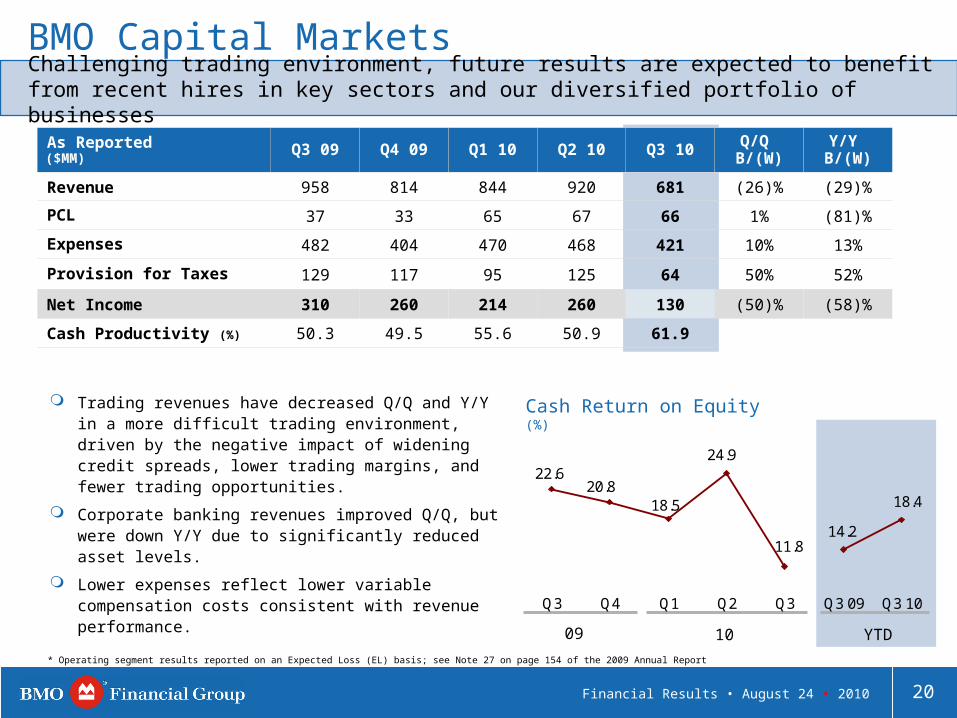
Revenue 958 814 844 920 681 (26)% (29)%
PCL 37 33 65 67 66 1% (81)%
Expenses 482 404 470 468 421 10% 13%
Provision for Taxes 129 117 95 125 64 50% 52%
Net Income 310 260 214 260 130 (50)% (58)%
Cash Productivity (%) 50.3 49.5 55.6 50.9 61.9
YTD
Trading revenues have decreased Q/Q and Y/Y in a more difficult trading environment, driven by the negative impact of widening credit spreads, lower trading margins, and fewer trading opportunities.
Corporate banking revenues improved Q/Q, but were down Y/Y due to significantly reduced asset levels.
Lower expenses reflect lower variable compensation costs consistent with revenue performance.
Challenging trading environment, future results are expected to benefit from recent hires in key sectors and our diversified portfolio of businesses
* Operating segment results reported on an Expected Loss (EL) basis; see Note 27 on page 154 of the 2009 Annual Report
20Financial Results • August 24 • 2010
18.4
14.2
22.620.8
18.5
24.9
11.8
Q3 Q4 Q1 Q2 Q3 Q3 09 Q3 10
21Strategic Highlights • August 24 • 2010
Revenue by Business ($MM)
BMO Capital Markets
284303317320270
Q3 09 Q4 09 Q1 10 Q2 10 Q3 10
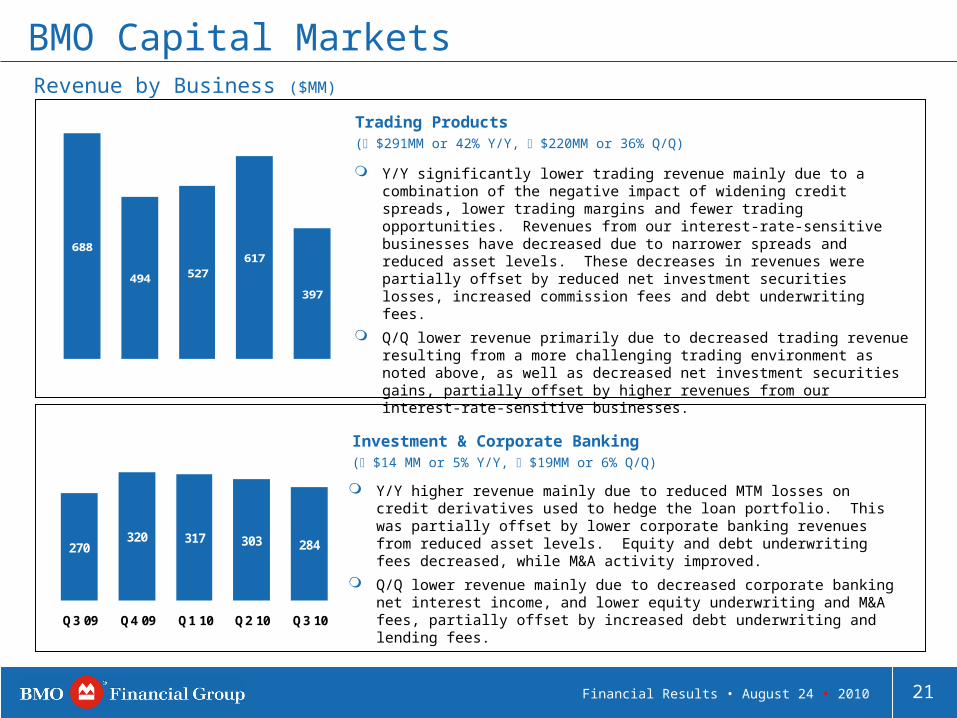
Investment & Corporate Banking ( $14 MM or 5% Y/Y, $19MM or 6% Q/Q)
Trading Products ( $291MM or 42% Y/Y, $220MM or 36% Q/Q)
Y/Y higher revenue mainly due to reduced MTM losses on credit derivatives used to hedge the loan portfolio. This was partially offset by lower corporate banking revenues from reduced asset levels. Equity and debt underwriting fees decreased, while M&A activity improved.
Q/Q lower revenue mainly due to decreased corporate banking net interest income, and lower equity underwriting and M&A fees, partially offset by increased debt underwriting and lending fees.
Y/Y significantly lower trading revenue mainly due to a combination of the negative impact of widening credit spreads, lower trading margins and fewer trading opportunities. Revenues from our interest-rate-sensitive businesses have decreased due to narrower spreads and reduced asset levels. These decreases in revenues were partially offset by reduced net investment securities losses, increased commission fees and debt underwriting fees.
Q/Q lower revenue primarily due to decreased trading revenue resulting from a more challenging trading environment as noted above, as well as decreased net investment securities gains, partially offset by higher revenues from our interest-rate-sensitive businesses.
397
617527494
688
21Financial Results • August 24 • 2010
22Strategic Highlights • August 24 • 2010
Corporate Services (Including Technology and Operations)
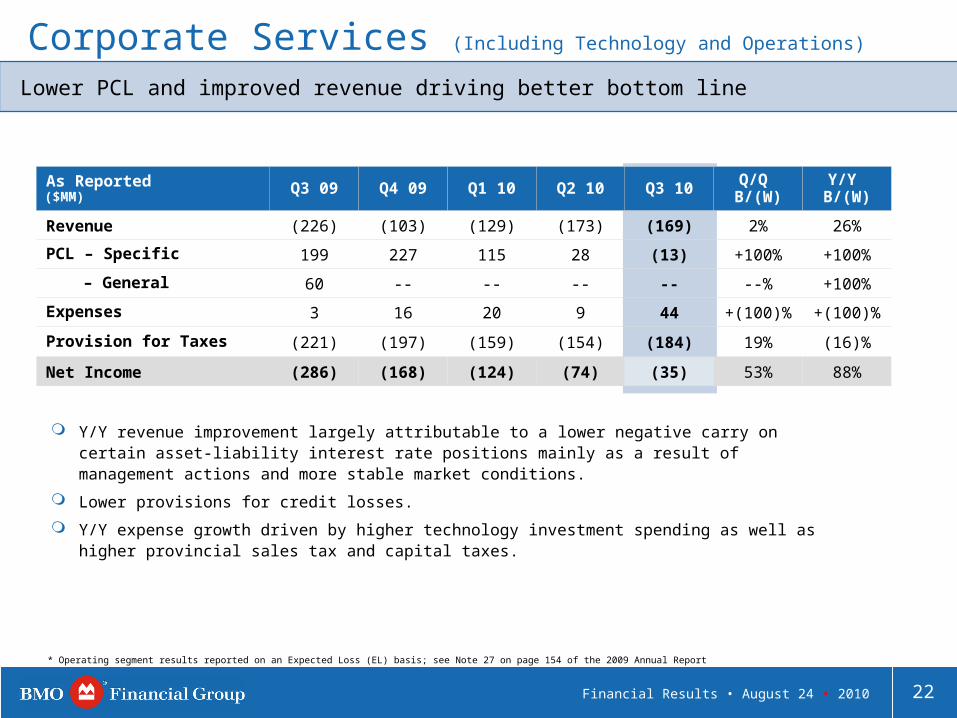
Lower PCL and improved revenue driving better bottom line
As Reported ($MM)
Q3 09 Q4 09 Q1 10 Q2 10 Q3 10 Q/Q B/(W)
Y/Y B/(W)
Revenue (226) (103) (129) (173) (169) 2% 26%
PCL – Specific 199 227 115 28 (13) +100% +100%
– General 60 -- -- -- -- --% +100%
Expenses 3 16 20 9 44 +(100)% +(100)%
Provision for Taxes (221) (197) (159) (154) (184) 19% (16)%
Net Income (286) (168) (124) (74) (35) 53% 88%
Y/Y revenue improvement largely attributable to a lower negative carry on certain asset-liability interest rate positions mainly as a result of management actions and more stable market conditions.
Lower provisions for credit losses.
Y/Y expense growth driven by higher technology investment spending as well as higher provincial sales tax and capital taxes.
* Operating segment results reported on an Expected Loss (EL) basis; see Note 27 on page 154 of the 2009 Annual Report
22Financial Results • August 24 • 2010
23Strategic Highlights • August 24 • 2010
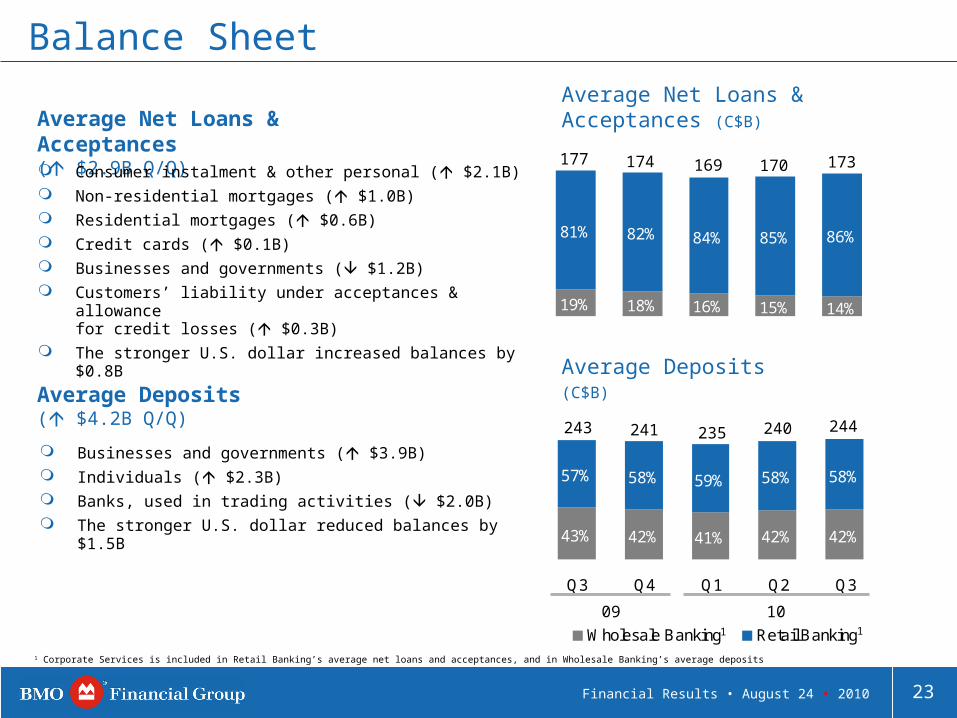
19% 18% 16% 15% 14%
81% 82% 84% 85% 86%
43% 42% 41% 42% 42%
57% 58% 59% 58% 58%
Q3 Q4 Q1 Q2 Q3
Wholesale Banking Retail Banking
09
Average Deposits (C$B)
241 235 240 244243
10
Average Net Loans & Acceptances (C$B)
174 169 170 173177
Balance Sheet
Average Deposits ( $4.2B Q/Q)
Average Net Loans & Acceptances ( $2.9B Q/Q)
Businesses and governments ( $3.9B) Individuals ( $2.3B) Banks, used in trading activities ( $2.0B) The stronger U.S. dollar reduced balances by $1.5B
Consumer instalment & other personal ( $2.1B) Non-residential mortgages ( $1.0B) Residential mortgages ( $0.6B) Credit cards ( $0.1B) Businesses and governments ( $1.2B) Customers’ liability under acceptances & allowance
for credit losses ( $0.3B) The stronger U.S. dollar increased balances by $0.8B
1 Corporate Services is included in Retail Banking’s average net loans and acceptances, and in Wholesale Banking’s average deposits
1 1
23Financial Results • August 24 • 2010
24Strategic Highlights • August 24 • 2010
Q3 10
August 24 2010
Tom FlynnExecutive Vice President & Chief Risk
OfficerBMO Financial Group
Risk Review
25Strategic Highlights • August 24 • 2010
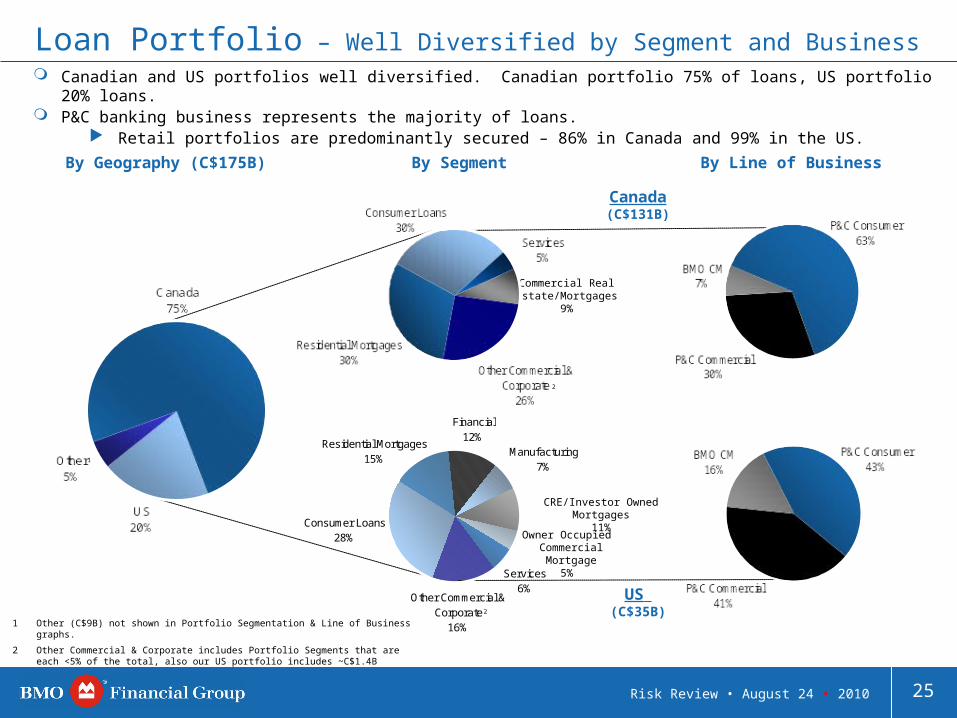
Manufacturing7%
Financial12%
Other Commercial & Corporate
16%
Consumer Loans28%
Residential Mortgages15%
Services6%
1 Other (C$9B) not shown in Portfolio Segmentation & Line of Business graphs.
2 Other Commercial & Corporate includes Portfolio Segments that are each <5% of the total, also our US portfolio includes ~C$1.4B related to the portfolio acquired in Q2 which contains both Consumer & Commercial loans.
Canada(C$131B)
US (C$35B)
By Line of BusinessBy SegmentBy Geography (C$175B)
Loan Portfolio – Well Diversified by Segment and Business Canadian and US portfolios well diversified. Canadian portfolio 75% of loans, US portfolio 20% loans. P&C banking business represents the majority of loans.
Retail portfolios are predominantly secured – 86% in Canada and 99% in the US.
1
2
2
Owner Occupied Commercial Mortgage
5%
CRE/Investor Owned Mortgages11%
Commercial Real Estate/Mortgages
9%
25Risk Review • August 24 • 2010
26Strategic Highlights • August 24 • 2010
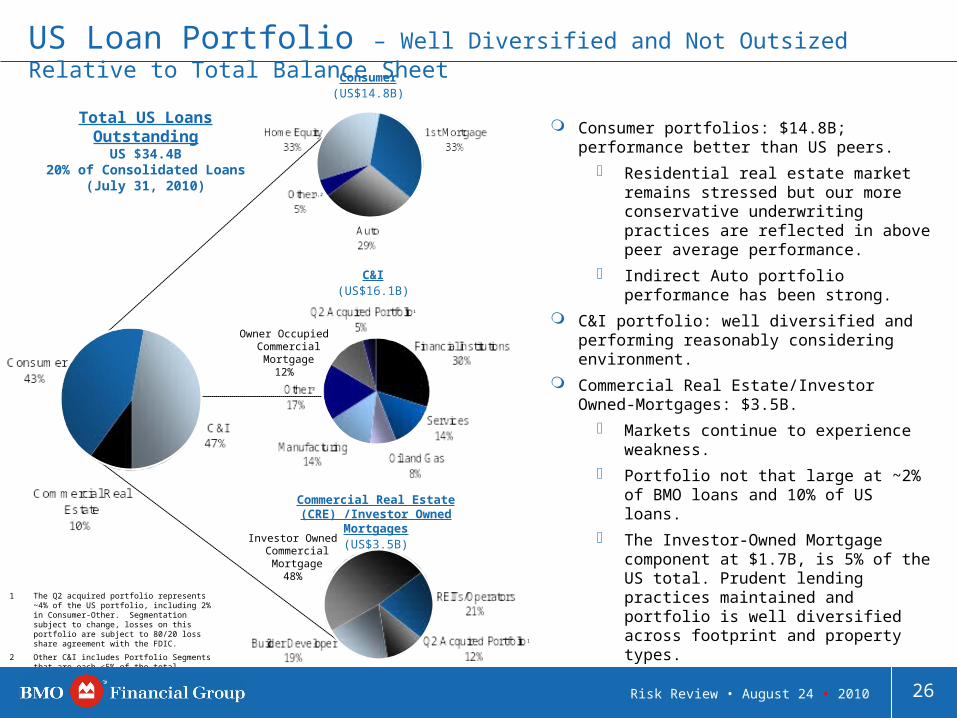
Consumer(US$14.8B)
Commercial Real Estate (CRE) /Investor Owned Mortgages
(US$3.5B)
US Loan Portfolio – Well Diversified and Not Outsized Relative to Total Balance Sheet
Total US Loans OutstandingUS $34.4B
20% of Consolidated Loans(July 31, 2010)
C&I(US$16.1B)
1 The Q2 acquired portfolio represents ~4% of the US portfolio, including 2% in Consumer-Other. Segmentation subject to change, losses on this portfolio are subject to 80/20 loss share agreement with the FDIC.
2 Other C&I includes Portfolio Segments that are each <5% of the total.
Consumer portfolios: $14.8B; performance better than US peers.
Residential real estate market remains stressed but our more conservative underwriting practices are reflected in above peer average performance.
Indirect Auto portfolio performance has been strong.
C&I portfolio: well diversified and performing reasonably considering environment.
Commercial Real Estate/Investor Owned-Mortgages: $3.5B.
Markets continue to experience weakness.
Portfolio not that large at ~2% of BMO loans and 10% of US loans.
The Investor-Owned Mortgage component at $1.7B, is 5% of the US total. Prudent lending practices maintained and portfolio is well diversified across footprint and property types.
Developer portfolio in particular has been challenged; continues to reduce and is ~2% of the total US portfolio.
2
1,2
1
1
Owner Occupied Commercial Mortgage
12%
26Risk Review • August 24 • 2010
Investor Owned Commercial Mortgage
48%
27Strategic Highlights • August 24 • 2010
CRE/Investor Owned Mortgages9%
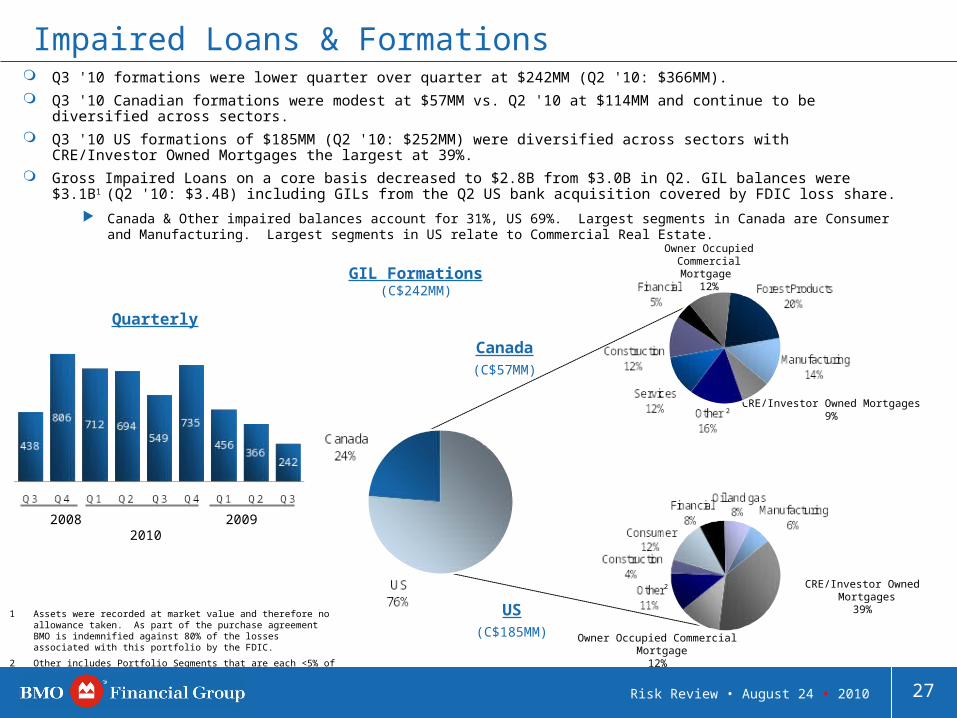
Impaired Loans & Formations Q3 '10 formations were lower quarter over quarter at $242MM (Q2 '10: $366MM).
Q3 '10 Canadian formations were modest at $57MM vs. Q2 '10 at $114MM and continue to be diversified across sectors.
Q3 '10 US formations of $185MM (Q2 '10: $252MM) were diversified across sectors with CRE/Investor Owned Mortgages the largest at 39%.
Gross Impaired Loans on a core basis decreased to $2.8B from $3.0B in Q2. GIL balances were $3.1B1 (Q2 '10: $3.4B) including GILs from the Q2 US bank acquisition covered by FDIC loss share.
Canada & Other impaired balances account for 31%, US 69%. Largest segments in Canada are Consumer and Manufacturing. Largest segments in US relate to Commercial Real Estate.
1 Assets were recorded at market value and therefore no allowance taken. As part of the purchase agreement BMO is indemnified against 80% of the losses associated with this portfolio by the FDIC.
2 Other includes Portfolio Segments that are each <5% of the total.
GIL Formations(C$242MM)
Canada(C$57MM)
US(C$185MM)
CRE/Investor Owned Mortgages39%
Owner Occupied Commercial Mortgage12%
Owner Occupied CommercialMortgage
12%
Quarterly
2008 2009 2010
2
2
27Risk Review • August 24 • 2010
28Strategic Highlights • August 24 • 2010
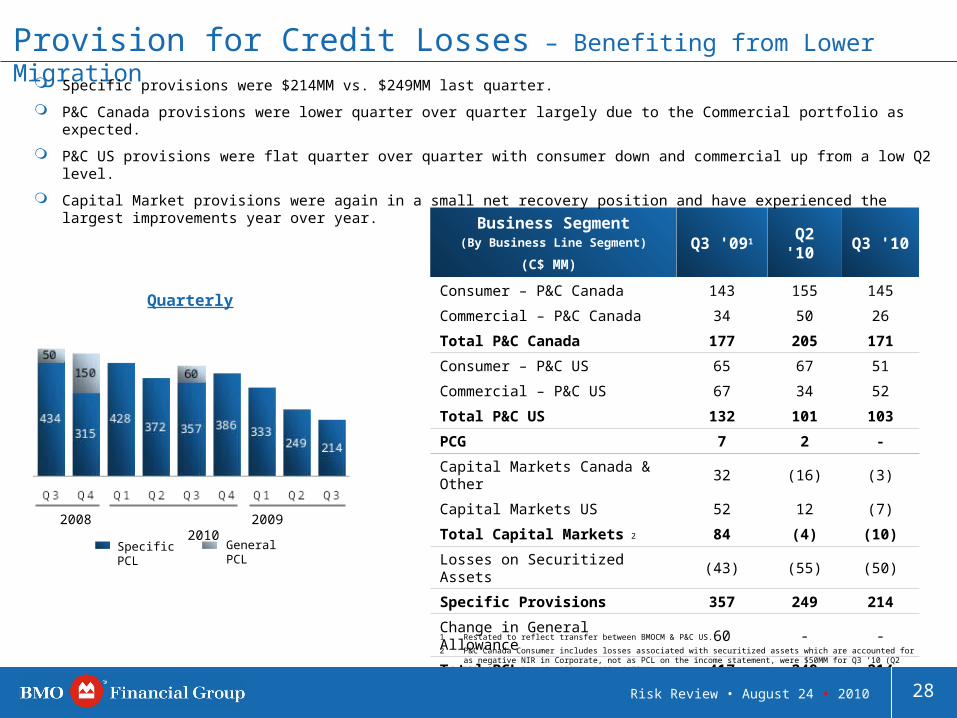
Provision for Credit Losses – Benefiting from Lower Migration
Business Segment(By Business Line Segment)
(C$ MM) Q3 '091 Q2 '10 Q3 '10
Consumer – P&C Canada 143 155 145
Commercial – P&C Canada 34 50 26
Total P&C Canada 177 205 171
Consumer – P&C US 65 67 51
Commercial – P&C US 67 34 52
Total P&C US 132 101 103
PCG 7 2 -
Capital Markets Canada & Other 32 (16) (3)
Capital Markets US 52 12 (7)
Total Capital Markets 84 (4) (10)
Losses on Securitized Assets (43) (55) (50)
Specific Provisions 357 249 214
Change in General Allowance 60 - -
Total PCL 417 249 214
Specific provisions were $214MM vs. $249MM last quarter.
P&C Canada provisions were lower quarter over quarter largely due to the Commercial portfolio as expected.
P&C US provisions were flat quarter over quarter with consumer down and commercial up from a low Q2 level.
Capital Market provisions were again in a small net recovery position and have experienced the largest improvements year over year.
Specific PCL General PCL
Quarterly
2
2008 2009 2010
1 Restated to reflect transfer between BMOCM & P&C US.
2 P&C Canada Consumer includes losses associated with securitized assets which are accounted for as negative NIR in Corporate, not as PCL on the income statement, were $50MM for Q3 ’10 (Q2 ’10: $55MM, Q1 '10: $53MM, F'09: $172MM).
28Risk Review • August 24 • 2010
29Strategic Highlights • August 24 • 2010
US(C$104MM)
Canada (C$110MM)
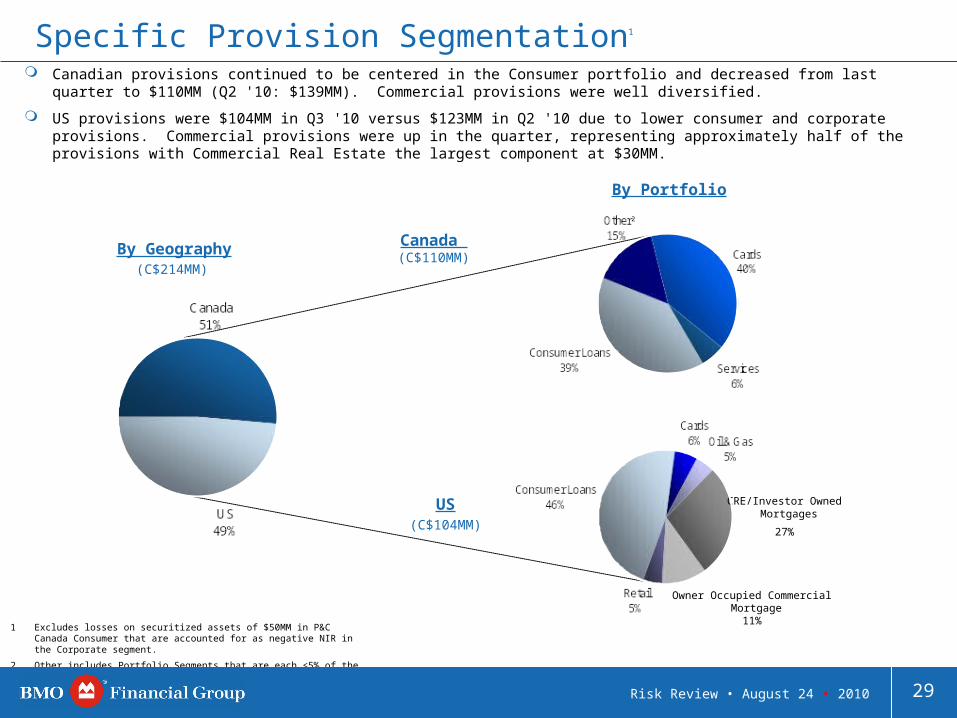
Specific Provision Segmentation1
By Portfolio
Canadian provisions continued to be centered in the Consumer portfolio and decreased from last quarter to $110MM (Q2 '10: $139MM). Commercial provisions were well diversified.
US provisions were $104MM in Q3 '10 versus $123MM in Q2 '10 due to lower consumer and corporate provisions. Commercial provisions were up in the quarter, representing approximately half of the provisions with Commercial Real Estate the largest component at $30MM.
1 Excludes losses on securitized assets of $50MM in P&C Canada Consumer that are accounted for as negative NIR in the Corporate segment.
2 Other includes Portfolio Segments that are each <5% of the total.
By Geography(C$214MM)
2
CRE/Investor Owned Mortgages
27%
29Risk Review • August 24 • 2010
Owner Occupied Commercial Mortgage
11%
30Strategic Highlights • August 24 • 2010
APPENDIX
30Financial Results • August 24 • 2010 30Financial Results • August 24 • 2010
31Strategic Highlights • August 24 • 2010
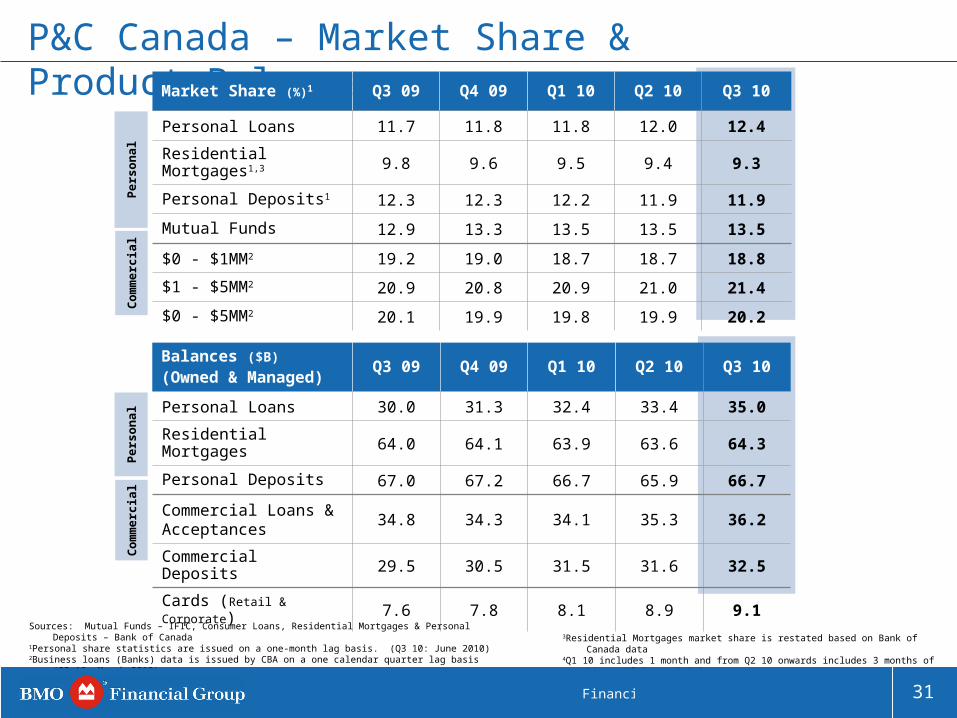
P&C Canada – Market Share & Product Balances Market Share (%)1 Q3 09 Q4 09 Q1 10 Q2 10 Q3 10
Personal Loans 11.7 11.8 11.8 12.0 12.4
Residential Mortgages1,3 9.8 9.6 9.5 9.4 9.3
Personal Deposits1 12.3 12.3 12.2 11.9 11.9
Mutual Funds 12.9 13.3 13.5 13.5 13.5
$0 - $1MM2 19.2 19.0 18.7 18.7 18.8
$1 - $5MM2 20.9 20.8 20.9 21.0 21.4
$0 - $5MM2 20.1 19.9 19.8 19.9 20.2
Balances ($B)
(Owned & Managed)Q3 09 Q4 09 Q1 10 Q2 10 Q3 10
Personal Loans 30.0 31.3 32.4 33.4 35.0
Residential Mortgages 64.0 64.1 63.9 63.6 64.3
Personal Deposits 67.0 67.2 66.7 65.9 66.7
Commercial Loans & Acceptances
34.8 34.3 34.1 35.3 36.2
Commercial Deposits 29.5 30.5 31.5 31.6 32.5
Cards (Retail & Corporate) 7.6 7.8 8.1 8.9 9.1
Per
so
nal
Co
mm
erc
ial
Per
so
nal
Co
mm
erc
ial
Sources: Mutual Funds – IFIC, Consumer Loans, Residential Mortgages & Personal Deposits – Bank of Canada1Personal share statistics are issued on a one-month lag basis. (Q3 10: June 2010)2Business loans (Banks) data is issued by CBA on a one calendar quarter lag basis (Q3 10: March 2010)
3Residential Mortgages market share is restated based on Bank of Canada data4Q1 10 includes 1 month and from Q2 10 onwards includes 3 months of Diners Club
acquisition
31Financial Results • August 24 • 2010

32Strategic Highlights • August 24 • 2010
Commercial Products – Average Balances (US$B)
Q3 09 Q4 09 Q1 10 Q2 10 Q3 10
Commercial Loans 13.5 12.3 11.8 11.5 11.7
Commercial Deposits 8.8 8.3 8.9 9.7 10.0
P&C U.S. – Product BalancesPersonal Products – Average Balances (US$B)
Q3 09 Q4 09 Q1 10 Q2 10 Q3 10
Mortgages 5.2 4.9 4.6 4.4 4.2
Other Personal Loans 5.2 5.2 5.2 5.3 5.3
Indirect Auto 4.1 4.1 4.2 4.2 4.3
Deposits 15.1 14.7 14.6 14.6 15.9
Personal Personal loan originations of $0.8B declined $0.2B or 18% Y/Y. However, the pipeline for mortgage and home equity is
22% higher than the beginning of the fiscal year with a 75% increase in the jumbo mortgage pipeline.
Decline in mortgage balances are primarily driven by amortization/run off of outstandings and new originations being sold in the secondary market.
Rockford, Illinois-based bank transaction contributed $0.2B of average loans and $1.2B of average deposits to personal.
Net new personal checking accounts of 2,407 in Q3 10 from a decline of (676) in Q3 09.
Commercial Excluding the Rockford, Illinois-based bank transaction’s $0.9B of average loans and $0.3B of average deposits,
commercial loans reflect impact of lower client loan utilization while deposits showing benefit of strategic sales efforts.
32Financial Results • August 24 • 2010
33Strategic Highlights • August 24 • 2010
-90
-65
-40
-15
10
35
60
85
03-May-10 14-May-10 28-May-10 10-Jun-10 23-Jun-10 07-Jul-10 20-Jul-10
C$
MM
(p
re-t
ax)
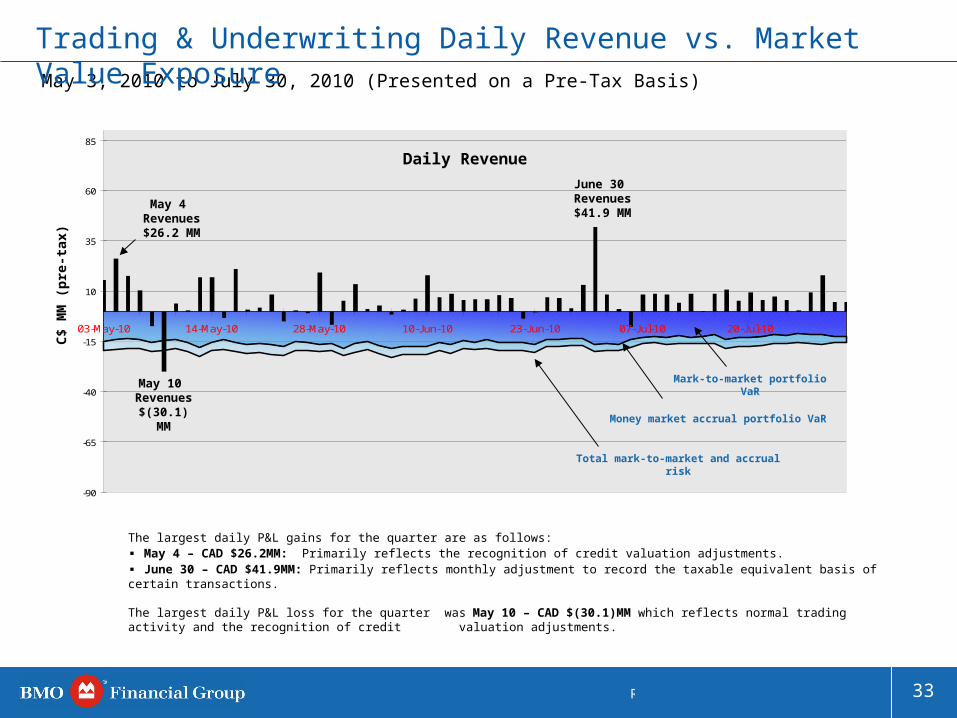
May 3, 2010 to July 30, 2010 (Presented on a Pre-Tax Basis)
Money market accrual portfolio VaR
Total mark-to-market and accrual risk
Mark-to-market portfolio VaR
Daily Revenue
May 4 Revenues$26.2 MM
May 10 Revenues$(30.1) MM
June 30 Revenues$41.9 MM
The largest daily P&L gains for the quarter are as follows: ▪ May 4 – CAD $26.2MM: Primarily reflects the recognition of credit valuation adjustments.▪ June 30 – CAD $41.9MM: Primarily reflects monthly adjustment to record the taxable equivalent basis of certain transactions.
The largest daily P&L loss for the quarter was May 10 – CAD $(30.1)MM which reflects normal trading activity and the recognition of credit valuation adjustments.
Trading & Underwriting Daily Revenue vs. Market Value Exposure
33Risk Review • August 24 • 2010

34Strategic Highlights • August 24 • 2010
Investor Relations Contact Information
VIKI LAZARISSenior Vice [email protected]
E-mail: [email protected]
www.bmo.com/investorrelations
Fax: 416.867.3367
STEVEN [email protected]
ANDREW CHINSenior [email protected]