Defense System Can Display Salt Tolerance of Salt ...
20
agronomy Article Chlorophyll Fluorescence Parameters and Antioxidant Defense System Can Display Salt Tolerance of Salt Acclimated Sweet Pepper Plants Treated with Chitosan and Plant Growth Promoting Rhizobacteria Muneera D. F. ALKahtani 1 , Kotb A. Attia 2 , Yaser M. Hafez 3 , Naeem Khan 4 , Ahmed M. Eid 5 , Mohamed A. M. Ali 6 and Khaled A. A. Abdelaal 7, * 1 Biology Department, College of Science, Princess Nourah bint Abdulrahman University, Riyadh POX 102275-11675, Saudi Arabia; [email protected] 2 Center of Excellence in Biotechnology Research, King Saud University, Riyadh POX 2455-11451, Saudi Arabia; [email protected] 3 Plant Pathology and Biotechnology Lab., Faculty of Agriculture, Kafrelsheikh University, Kafr El Sheikh 33516, Egypt; [email protected] 4 Department of Agronomy, Institute of Food and Agricultural Sciences, University of Florida, Gainesville, FL 32611, USA; naeemkhan@ufl.edu 5 Botany and Microbiology Department, Faculty of Science, Al-Azhar University, Nasr City 11884, Egypt; [email protected] 6 Department of Horticulture, Faculty of Agriculture, New Valley University, El-Kharga, New Valley 72511, Egypt; [email protected] 7 Excellence Center (EPCRS), Plant Pathology and Biotechnology Lab., Faculty of Agriculture, Kafrelsheikh University, Kafr El Sheikh 33516, Egypt * Correspondence: [email protected] Received: 15 July 2020; Accepted: 1 August 2020; Published: 12 August 2020 Abstract: Salinity stress deleteriously affects the growth and yield of many plants. Plant growth promoting rhizobacteria (PGPR) and chitosan both play an important role in combating salinity stress and improving plant growth under adverse environmental conditions. The present study aimed to evaluate the impacts of PGPR and chitosan on the growth of sweet pepper plant grown under different salinity regimes. For this purpose, two pot experiments were conducted in 2019 and 2020 to evaluate the role of PGPR (Bacillus thuringiensis MH161336 10 6–8 CFU/cm 3 ) applied as seed treatment and foliar application of chitosan (30 mg dm -3 ) on sweet pepper plants (cv. Yolo Wonder) under two salinity concentrations (34 and 68 mM). Our findings revealed that, the chlorophyll fluorescence parameter (Fv/Fm ratio), chlorophyll a and b concentrations, relative water content (RWC), and fruit yield characters were negatively affected and significantly reduced under salinity conditions. The higher concentration was more harmful. Nevertheless, electrolyte leakage, lipid peroxidation, hydrogen peroxide (H 2 O 2 ), and superoxide (O 2 - ) significantly increased in stressed plants. However, the application of B. thuringiensis and chitosan led to improved plant growth and resulted in a significant increase in RWC, chlorophyll content, chlorophyll fluorescence parameter (Fv/Fm ratio), and fruit yield. Conversely, lipid peroxidation, electrolyte leakage, O 2 - , and H 2 O 2 were significantly reduced in stressed plants. Also, B. thuringiensis and chitosan application regulated the proline accumulation and enzyme activity, as well as increased the number of fruit plant -1 , fruit fresh weight plant -1 , and total fruit yield of sweet pepper grown under saline conditions. Keywords: sweet pepper; salinity; Bacillus; chitosan; chlorophyll fluorescence; fruit yield Agronomy 2020, 10, 1180; doi:10.3390/agronomy10081180 www.mdpi.com/journal/agronomy
Transcript of Defense System Can Display Salt Tolerance of Salt ...

agronomy
Article
Chlorophyll Fluorescence Parameters and AntioxidantDefense System Can Display Salt Tolerance of SaltAcclimated Sweet Pepper Plants Treated withChitosan and Plant Growth Promoting Rhizobacteria
Muneera D. F. ALKahtani 1, Kotb A. Attia 2, Yaser M. Hafez 3, Naeem Khan 4 , Ahmed M. Eid 5,Mohamed A. M. Ali 6 and Khaled A. A. Abdelaal 7,*
1 Biology Department, College of Science, Princess Nourah bint Abdulrahman University,Riyadh POX 102275-11675, Saudi Arabia; [email protected]
2 Center of Excellence in Biotechnology Research, King Saud University,Riyadh POX 2455-11451, Saudi Arabia; [email protected]
3 Plant Pathology and Biotechnology Lab., Faculty of Agriculture, Kafrelsheikh University,Kafr El Sheikh 33516, Egypt; [email protected]
4 Department of Agronomy, Institute of Food and Agricultural Sciences, University of Florida,Gainesville, FL 32611, USA; [email protected]
5 Botany and Microbiology Department, Faculty of Science, Al-Azhar University, Nasr City 11884, Egypt;[email protected]
6 Department of Horticulture, Faculty of Agriculture, New Valley University, El-Kharga,New Valley 72511, Egypt; [email protected]
7 Excellence Center (EPCRS), Plant Pathology and Biotechnology Lab., Faculty of Agriculture,Kafrelsheikh University, Kafr El Sheikh 33516, Egypt
* Correspondence: [email protected]
Received: 15 July 2020; Accepted: 1 August 2020; Published: 12 August 2020�����������������
Abstract: Salinity stress deleteriously affects the growth and yield of many plants. Plant growthpromoting rhizobacteria (PGPR) and chitosan both play an important role in combating salinitystress and improving plant growth under adverse environmental conditions. The present studyaimed to evaluate the impacts of PGPR and chitosan on the growth of sweet pepper plant grownunder different salinity regimes. For this purpose, two pot experiments were conducted in 2019 and2020 to evaluate the role of PGPR (Bacillus thuringiensis MH161336 106–8 CFU/cm3) applied as seedtreatment and foliar application of chitosan (30 mg dm−3) on sweet pepper plants (cv. Yolo Wonder)under two salinity concentrations (34 and 68 mM). Our findings revealed that, the chlorophyllfluorescence parameter (Fv/Fm ratio), chlorophyll a and b concentrations, relative water content(RWC), and fruit yield characters were negatively affected and significantly reduced under salinityconditions. The higher concentration was more harmful. Nevertheless, electrolyte leakage, lipidperoxidation, hydrogen peroxide (H2O2), and superoxide (O2
−) significantly increased in stressedplants. However, the application of B. thuringiensis and chitosan led to improved plant growth andresulted in a significant increase in RWC, chlorophyll content, chlorophyll fluorescence parameter(Fv/Fm ratio), and fruit yield. Conversely, lipid peroxidation, electrolyte leakage, O2
−, and H2O2 weresignificantly reduced in stressed plants. Also, B. thuringiensis and chitosan application regulated theproline accumulation and enzyme activity, as well as increased the number of fruit plant−1, fruit freshweight plant−1, and total fruit yield of sweet pepper grown under saline conditions.
Keywords: sweet pepper; salinity; Bacillus; chitosan; chlorophyll fluorescence; fruit yield
Agronomy 2020, 10, 1180; doi:10.3390/agronomy10081180 www.mdpi.com/journal/agronomy

Agronomy 2020, 10, 1180 2 of 20
1. Introduction
Sweet pepper belongs to Solanacease family. It is an annual plant in the cultivated lands in manycountries, however it is grown as a perennial plant in tropical areas. It is one of the most widespreadand popular vegetables, and has a greatest economic importance worldwide [1]. It is the richestsource of different antioxidants and vitamins and has several health benefits [2]. However, salinity isa very significant factor that threatens the production of economic plants such as sweet pepper [1],strawberry plants [3], and cucumber plants [4]. Salinity damages plant growth and proliferation bycreating water stress and cytotoxicity due to the excess in uptake of ions, such as sodium and chloride.Furthermore, salinity is usually accompanied by oxidative stress due to the generation of reactiveoxygen species [5,6]. Salinity stress adversely affects morpho-physiological characters of sweet peppersuch as plant height and leaf area which are significantly reduced [7]. Likewise, chlorophyll a and bas well as RWC were reduced under salinity in cucumber [4]. Photosynthesis is harmfully affectedby salinity through the reduction in stomatal conductance. Also, salinity led to increased ion toxicityand negatively affected nutrients uptake, especially potassium uptake, so the salt stressed plantsshowed low membrane stability [8]. The chlorophyll fluorescence parameters were adversely affectedwith salinity and the content of chlorophyll pigments significantly decreased in cucumber [9]. Also,the study of Misra et al. [10] pointed out that salt stress causes photoinhibition in PSII and decreases itsactivity. Salt stress led to decreased chlorophyll concentrations, leaf area and mungbean yield [11]and led to an increase in the accumulation of Na+, decreasing the uptake of mineral nutrients such asnitrogen and potassium [12]. The high level of Na+ was associated with the ROS accumulation such asH2O2 and O2−. The excessive formation of ROS causes protein oxidation and lipid peroxidation underseveral stresses mainly under salinity stress [1,13]. Previous studies have shown that the adverseeffects of salinity stress on leaf number, plant length, fresh and dry weights of shoots, and plant yieldalso increases with the increase in NaCl concentration [14–16].
According to salinity concentrations, the plants are classified to euhalophytes or glycophytes.Euhalophytes have the salinity thresholds of 250 mM NaCl, i.e., euhalophytes are able to completetheir life cycle upon salinities exceeding 250 mM NaCl. Glycophytes cannot grow under high salinityconcentrations and their response to salinity differs in terms of osmotic regulation, photosyntheticelectron transport, chlorophyll content, and reactive oxygen species (ROS) formation as well asantioxidant defense system [1,7]. The excessive accumulation of ROS under stress, such as salinity [1,17],drought [18,19], and biotic stress factors [20–23], results in the activation of the enzymatic andnon-enzymatic antioxidant system to enhance stress tolerance in plants to cope with increasedaccumulation of ROS [24]. The antioxidative system also consists of some of the non-enzymatic systems,such as salicylic acid and carotenoids. Nonetheless, the enzymatic defense system contains ascorbateperoxidases (APX), glutathione reductases (GR), superoxide dismutases (SOD), catalases (CAT),and peroxidases (POD), which protect the plant tissues against stress factors [25]. Also, the plants haveadaptive mechanisms to salinity stress through morphological, anatomical, and biochemical changes.Euhalophytes can cope with salinity stress through different mechanisms, such as salt exclusion,salt elimination, salt succulence and salt redistribution [7]. Furthermore, EL%, lipid peroxidation,and ROS were increased significantly under salinity, as these parameters are signals to variousstresses, such as salinity, drought, and heat [26–29], that enable plants to respond to a particular stress.Some plants protect themselves from salinity stress by maintaining ion homeostasis and transportationof the excess salt to the vacuole or sequestering in the older tissues which ultimately are sacrificed,thereby defending itself from salinity stress [30]. Meanwhile, other plants keep the ion concentrationin the cytoplasm at a low level. Membranes along with their linked components play an essentialrole in retaining ion concentration within the cytosol during the period of stress by regulating ionuptake and transport [31,32]. Chlorophyll fluorescence is a fast method for photosynthetic processesmeasurements [33] and provides a lot of information about the plant status under abiotic andbiotic stresses to understand the mechanisms of photosynthesis and how plants respond to variousstresses [34]. Chlorophyll fluorescence parameters are important indicators used to measure the

Agronomy 2020, 10, 1180 3 of 20
quantum yield of photosystem II (PSII), display the plant response to stress and the harmful effects,particularly on photosynthesis and chlorophyll concentrations [35].
Chitosan or chitin is a natural polysaccharide consisting of two molecules of D-glucosamine andnaturally present in the cell walls of many organisms such as crabs, shrimp, fungi, and the exoskeletonof insects [36]. In the agricultural field, it improves the morpho-physiological parameters and alleviatesthe injurious effect of abiotic stresses through stress transduction pathway [37]. Application of chitosanled to increased plant tolerance to many stresses in various plants [38,39], enhance growth charactersand improve germination rate of many plants [38,40]. The fruit yield of tomato plants was improvedwith chitosan treatments [41]. Under drought, barley plants treated with chitosan showed a significantincrease in chlorophyll, RWC, total soluble sugar, and grain yield [42]. Plant growth-promotingrhizobacteria (PGPR) can prompt plant tolerance to stress through some chemical and physical changeswhich are identified as induced systemic tolerance [43]. The application of PGPR led to improvedgrowth and yield production [44]. Under stress conditions, PGPR can improve the injurious impactsand enhance the yield production under salt conditions [45], as a bio-fertilizer in sugar beet andsweet sorghum plants [20,46,47] and as a bio-control agent [48–50]. There are many PGPR strains,such as Bacillus, Azotobacter, Azospirillum, Pseudomonas, Rhizobium, and Serratia, which can be used inimproving plant growth even under various stress factors [51,52] by the production of antioxidants,phytohormones and vitamins [53]. There is a lot of information about the effect of PGPR, neverthelessstudies about chitosan and its effects on plants under salinity stress are still scarce and have not yet beenfully understood. Hence, in this research, we focus on the effect of chitosan and Bacillus thuringiensisMH161336 in alleviating the harmful effect of salinity to improve chlorophyll fluorescence parameters,chlorophyll concentration, enzymes activity, and fruit yield of sweet pepper.
2. Materials and Methods
2.1. Experiments Preparation and Plant Materials
Two pot experiments were conducted at Kafrelsheikh University, Agricultural Botany Departmentduring two summer seasons 2019 and 2020, to evaluate the effect of seed treatment with plantgrowth promoting rhizobacteria (B. thuringiensis MH161336 106–8 CFU/cm3) and foliar spray withchitosan 30 mg·dm−3 on sweet pepper plants under salinity (sodium chloride at 34 and 68 mM).The physio-biochemical characters were done at Plant Pathology & Biotechnology Lab., and EPECRSExcellence Center, Kafrelsheikh University. The seeds of sweet pepper (Capsicum annuum L.) cv. YoloWonder (obtained from a private agricultural company) were divided into three groups (the firstgroup was treated with B. thuringiensis and the others without treatments). Seed treatment was donewith B. thuringiensis. Thereby, the seeds underwent surface sterilization by sodium hypochlorite2.5% for 5 min, 70% ethanol for 1 min, and were then washed 5 times by sterile distilled water.B. thuringiensis MH161336 which was isolated from the halophytic plant Spergularia marina (obtainedfrom Dr. Ahmed Eid), B. thuringiensis pure cultures were grown in nutrient broth at 35± 2 ◦C on a shakerat 180× g. Bacterial cultures were diluted in sterilized distilled water to reach a final concentration of106–8 CFU/cm3 [54]. Sterilized seeds were incubated with bacterial suspensions at room temperaturefor 6 h and sown in the nursery in foam trays on 7th and 3rd January in the two seasons, respectively.After forty-five days from the sowing, the transplantation was done in pots 50 cm3 in diameter, eachone containing two seedlings and the pots were divided into three groups (control, B. thuringiensistreatment and chitosan treatment 30 mg·dm−3). The plants irrigated with two concentrations (34 and68 mM) of saline water (was prepared from NaCl) and the group of chitosan treatment was treated withchitosan 30 mg·dm−3 twice after 20 and 40 days from transplanting. The compound fertilizer containingnitrogen, phosphorus, and potassium (NPK) (135:40:35 kg·ha−1) was used as recommended in twodoses, the first dose after 12 days from transplanting and the second at the flowering stage initiation.The experiments were in a completely randomized design with 4 replicates, the physiological and

Agronomy 2020, 10, 1180 4 of 20
biochemical studies were done at 80 days from transplanting. The chemical and physical characters ofexperimental soil were determined [55] and are presented in Table 1.
Table 1. Chemical and physical characters of the experimental soil before conducting the experimentsin 2019 and 2020 seasons.
Seasons PH* ECDs/m
Mechanical AnalysisSoil Texture
OrganicMatter (%)
Total N (%)Total P(ppm)Sand% Silt% Clay%
2019 8.11 0.464 21.96 23.98 47.4 Clay 1.79 0.158 8.82020 8.16 0.483 22.17 24.29 46.8 Clay 1.82 0.149 8.2
SeasonsSoluble Cations Soluble Anions
Na+ K+ Ca++ Mg++ HCO3− SO4
−− Cl−
2019 2.14 0.18 2.02 2.4 4.2 2.07 0.62020 2.19 0.17 2.04 2.3 4.3 1.93 0.5
* EC = Electrical conductivity.
2.2. Biochemical and Physiological Characters
The physiological and biochemical characters were recorded at 80 days from transplanting.
2.2.1. Relative Water Content (RWC%)
According to Sanchez et al. [56], twenty leaf discs were used to determine RWC, the freshweight (FW) for the discs was determined, the same discs were saved in petri dishes containingdistilled water for 1 h to determine the turgid weight (TW), after that the discs were dried for 24 h at80 ◦C to determine the dry weight (DW). Relative water content (RWC%) was calculated as follows:RWC = (FW − DW)/(TW − DW) × 100.
2.2.2. Determination of Chlorophyll a and b Concentrations
The extraction was done using N-N Dimethyl formamide, whereby 5 cm3 N-N Dimethyl formamidewas added to 1 g fresh leaves and kept in the refrigerator overnight, and the absorbance was measuredat 647 and 664 nm according to Moran [57].
2.2.3. Electrolyte Leakage Assay (EL%)
Ten discs (1 cm2) of sweet pepper leaves were placed into flasks containing deionized water(25 cm3). Flasks were shaken for 20 h, initial electrical conductivity was recorded for each vial andthen flasks were immersed in a water bath at 80 ◦C for 1 h. The vials were shaken for 20 h at 21 ◦C.Final conductivity was measured for each flask. Electrolyte leakage % was calculated according toSzalai et al. [58] with the following formula: initial conductivity/final conductivity × 100.
2.2.4. Chlorophyll Fluorescence Parameter
Chlorophyll a fluorescence parameter (Fv/Fm ratio) was measured at 80 days from the sowingusing a chlorophyll fluorometer (PEA, Hansatech Instrument Ltd., version 1.21, Norfolk, UK).
According to Schreiber [59], middle-aged sweet pepper leaves were placed in the dark for 30 minto stimulate the reaction of photosystem II. The minimum chlorophyll fluorescence (Fo) was measuredusing a measuring beam of <0.1 µmol m−2
·s−1. The maximum fluorescence (Fm) was determined after a1 s saturating pulse (>3500 µmol·m−2
·s−1). Variable fluorescence (Fv) was determined by the differencebetween the maximum fluorescence and the minimum fluorescence (Fm − Fo). The maximum efficiencyof PSII was determined as the ratio of (Fv) to (Fm) as follows: Fv/Fm = (Fm − Fo)/Fm.

Agronomy 2020, 10, 1180 5 of 20
2.2.5. Proline Determination
According to Bates et al. [60], proline was assayed in sweet pepper plants, 0.5 g fresh leaf in 3%sulphosalicylic acid and centrifuged for 20 min at 3000× g. Then, 2 cm3 of glacial acetic acid and2 cm3 ninhydrin reagent was boiled with 2 cm3 supernatant for 1 h, the reaction was completed inan ice bath, and proline was separated using toluene. Proline was determined as µg·g−1 FW using aspectrophotometer at 520 nm.
2.2.6. Determination of Lipid Peroxidation
According to Davenport et al. [61], lipid peroxidation was measured as malondialdehyde (MDA) using100 mg fresh leaves in 1% trichloro acetic acid and centrifuged at 10,000× g for 5 min. 0.5% thiobarbituricacid was then added, and mixture was boiled at 95 ◦C for half an hour. The samples were placed on an icebath and centrifuged for 5 min at 5000× g, the measurements were done using spectrophotometer at 532 and600 nm. MDA (nmol·g−1 FW) = [6.45 × (A532 −A600) − (0.56 ×A450)] × V−1W, where V = volume (cm3);W = weight (g).
2.2.7. Determination of Superoxide (O2−) and Hydrogen Peroxide (H2O2)
Sweet pepper leaves were vacuum infiltrated with 10 mM potassium salicylate buffer containing0.1 w/v% nitro blue tetrazolium (NBT) or 0.1 w/v% 3,3-diaminobenzidine (DAB). The leaves wereincubated in the light for 140 min and two hours, respectively. The samples were cleared withtrichloroacetic acid in ethanol: chloroform 4:1 v/v for 1 day, the samples were washed and placed in50% glycerol. O2
− and H2O2 were determined as nmol·g−1 FW according to Huckelhoven et al. [62]using a ChemiImager 4000 digital imaging system (Alpha Innotech Corp., San Leandro, CA, USA).
2.2.8. Assay of Enzymes Activity
For the determination of enzymes, 0.5 g fresh leaves were homogenized in 3 cm3 of 50 mM Trisbuffer at 0–4 ◦C, containing 1 mM EDTA-Na2 and 7.5% polyvinyl pyrrolidone. The samples werecentrifuged 12,000× g for 20 min at 4 ◦C and the total soluble enzyme activities were measured usingspectrophotometer in the supernatant [63]. Catalase activity (CAT) was determined through thedecomposition of H2O2 by catalase results in the decrease of the ultraviolet absorption of H2O2 at240 nm, catalase activity can be calculated from this decrease. The reaction mixture contained 2.15 cm3,2 cm3 0.1 M Na-phosphate buffer, 100 µL H2O2, and 50 µL leaves extract. The solution is mixed, and theabsorptions were recorded at 240 nm according to Aebi [64]. Peroxidase activity (POX) was calculatedaccording to Hammerschmidt et al. [65]. The reaction mixture consisted of 2.9 cm3 of a 100 mM sodiumphosphate buffer containing 0.25% (v/v) guaiacol and 100 mM H2O2. The reaction was done withadding 100 µL of crude enzyme extract, the changes in absorbance were recorded every 30 s intervalsfor 3 min at 470 nm, the activity was determined for min−1
·g−1 fresh weight. Activity of superoxidedismutase (SOD) was measured according to Mishra et al. [66]. Then, we add 290 µL of a mixturecontaining 100 mM potassium phosphate buffer, 0.1 mM EDTA, 11 mm3 xanthine, cytochrome-c, and0.002 units of xanthine oxidase to 20 µg of protein extracts was prepared. Xanthine oxidase regulationproduced an increase in the absorbance due to the reduction of cytochrome-c (0.025 ± 0.005 min−1).Activity of SOD was stated by McCord and Fridovich [67]. According to Goldberg and Spooner [68],GR activity was measured, approximately 0.05 cm3 enzyme extract was mixed with 1 cm3 phosphatebuffer combined with EDTA, 0.1 cm3 glutathione, and 0.1 cm3 NADPH, the absorbance was determinedat 340 nm.
2.2.9. Fruit Yield
The harvest date starts at 120 days from transplanting to determine number of fruit plant−1, fruitfresh weight plant−1 (g), and total fruit yield (ton hectare−1).

Agronomy 2020, 10, 1180 6 of 20
2.3. Statistical Analysis
Statistical analysis was done using analysis of variance (ANOVA) procedures according to themethod of Gomez and Gomez [69] using the MSTAT-C statistical software package. The meansbetween treatments were compared by Duncan [70] when the difference was significant (P ≤ 0.05).The correlation analysis was done using XLSTAT 2014.5.03 statistical software.
3. Results
3.1. Effect on Relative Water Content (RWC%)
The presented results in Figure 1A showed a significant decrease in RWC in sweet pepperunder two salinity concentrations (57.6% at the low concentration (34 mM) (S1) and 52% at the highconcentration (68 mM) (S2) comparing with control plants (74.6%) as the mean of the two seasons.Likewise, the results in Figure 1 revealed that seed treatment with B. thuringiensis showed a significantincrease in RWC in stressed plants (65.7% compared with 57.6% at the low concentration and 60.8%compared with 52% at the high concentration). Furthermore, chitosan application at 30 mg dm−3
caused a significant increase in RWC (71.5% compared with 57.6% at the low concentration of salinity)and (67.1% compared with 52% at the high concentration) as a mean of both seasons in the stressedplants. The best treatment under salinity conditions was chitosan at 30 mg·dm−3 which achieved 71.5%when compared with control plants 74.6% without any significant difference.
3.2. Effect on Chlorophyll a and b Concentrations
It is obvious from the achieved results in Figure 1B–C that chlorophyll was significantlyreduced in stressed plants; chlorophyll a significantly decreased at low concentration of salinity(2 mg·g−1 FW−1) compared with control (2.85 mg·g−1 FW−1) as the mean of both seasons. Furthermore,the high salinity concentration caused a significant reduction in chlorophyll a (1.25 mg·g−1 FW−1) instressed plants compared to control (2.85 mg·g−1 FW−1). Similarly, salinity stress led to a significantdecrease in chlorophyll b concentration, the two concentrations caused significant decreases (0.84and 0.55 mg·g−1 FW−1 respectively) compared with control (2.85 mg·g−1 FW−1). Nonetheless, seedtreatment with B. thuringiensis and chitosan application led to significant increases in chlorophyll a andb. The greatest result was obtained with chitosan (S1 + Chitosan) treatment (2.85 mg·g−1 FW−1) inthe stressed plants with the low salinity concentration compared to the stressed plants (S1) withouttreatments (2 mg·g−1 FW−1).
3.3. Effect on Electrolyte Leakage (EL%)
The presented data in Figure 1D exhibited that EL% significantly increased in the stressed plants,the low salinity concentration caused significant increase (42.3%) comparing with control (13.8%) as themean of two seasons. Furthermore, the high salinity concentration was more harmfully effective andcaused a significant increase in EL% (52.6%) compared with control (13.8%). Nevertheless, chitosanapplication 30 mg dm−3 and seed treatment with B. thuringiensis led to significant decrease in EL%in the stressed plants under the two concentrations. Seed treatment with B. thuringiensis caused apositive effect and significant decrease in EL% (30.2% and 37.6%) in the stressed plants at the twoconcentrations compared with untreated plants (42.3% and 52.6%), respectively. Furthermore, EL%was reduced significantly in the stressed treated plants with chitosan 30 mg dm−3 (21.7% and 27.2%)that compared with the stressed untreated plants (42.3% and 52.6%).

Agronomy 2020, 10, 1180 7 of 20
Agronomy 2020, 10, x FOR PEER REVIEW 7 of 20
Figure 1. Effect of B. thuringiensis and chitosan on relative water content (A) chlorophyll a, (B) chlorophyll b, (C) and electrolyte leakage (D) under two salinity concentrations in sweet pepper plants during two seasons [first season (2019) and second season (2020)]. Data is the mean (±SE) of four replicates. Different letters above the data columns indicate significant differences between the samples determined by ANOVA, Duncan’s multiple range test at 0.05 level.
A
C
D
B
C
Figure 1. Effect of B. thuringiensis and chitosan on relative water content (A) chlorophyll a, (B) chlorophyllb, (C) and electrolyte leakage (D) under two salinity concentrations in sweet pepper plants duringtwo seasons [first season (2019) and second season (2020)]. Data is the mean (±SE) of four replicates.Different letters above the data columns indicate significant differences between the samples determinedby ANOVA, Duncan’s multiple range test at 0.05 level.

Agronomy 2020, 10, 1180 8 of 20
3.4. Effect on Proline Concentration
It could be noted from Figure 2A that the exposed plants to salinity at (S1) and (S2) caused asignificant increase in proline concentration, the high concentration of salinity (S2) achieved the highconcentration of proline (24 µg·g−1 FW) comparing to control (9.1 µg·g−1 FW) as the mean of bothseasons in sweet pepper. Application of seed treatment with B. thuringiensis and chitosan applicationin stressed plants led to regulate proline accumulation when compared with the control and thestressed untreated plants. B. thuringiensis seed treatment led to the regulation of proline accumulationin the stressed plants (12.7 µg·g−1 FW at the low concentration of salinity and 13.6 µg·g−1 FW at thehigh concentration comparing to the stressed untreated plants 17.4 and 24 µg·g−1 FW) at the twoconcentrations, respectively. Chitosan application had a significant effect on proline content (9.8and 12.2 µg·g−1 FW) compared with stressed untreated plants (17.4 and 24 µg·g−1 FW) at the twoconcentrations, respectively. The difference was not significant between the both seasons.
Agronomy 2020, 10, x FOR PEER REVIEW 8 of 20
3.4. Effect on Proline Concentration
It could be noted from Figure 2A that the exposed plants to salinity at (S1) and (S2) caused a significant increase in proline concentration, the high concentration of salinity (S2) achieved the high concentration of proline (24 μg·g−1 FW) comparing to control (9.1 μg·g−1 FW) as the mean of both seasons in sweet pepper. Application of seed treatment with B. thuringiensis and chitosan application in stressed plants led to regulate proline accumulation when compared with the control and the stressed untreated plants. B. thuringiensis seed treatment led to the regulation of proline accumulation in the stressed plants (12.7 μg·g−1 FW at the low concentration of salinity and 13.6 μg·g−1 FW at the high concentration comparing to the stressed untreated plants 17.4 and 24 μg·g−1 FW) at the two concentrations, respectively. Chitosan application had a significant effect on proline content (9.8 and 12.2 μg·g−1 FW) compared with stressed untreated plants (17.4 and 24 μg·g−1 FW) at the two concentrations, respectively. The difference was not significant between the both seasons.
Figure 2. Effect of B. thuringiensis and chitosan on proline content (A) and maximum efficiency of PSII (Fv/Fm) (B) under two salinity concentrations in sweet pepper during two seasons. Data is the mean (±SE) of four replicates. Different letters above the data columns indicate significant differences between the samples determined by ANOVA, Duncan´s multiple range test at 0.05 level.
3.5. Effect on Chlorophyll Fluorescence Parameter (Fv/Fm)
Our results in Figure 2B indicated that chlorophyll fluorescence parameters were adversely affected under salinity conditions. The maximum efficiency of PSII (Fv/Fm) significantly reduced in sweet pepper (0.790) at the low salinity concentration and (0.729) at the high salinity concentration, respectively comparing to the control (0.822). However, seed treatment with B. thuringiensis caused significant increase in Fv/Fm ratio in the stressed plants (0.791) at the low concentration of salinity and (0.769) at the high salinity concentration when compared with the stressed untreated plants (0.790) at the low concentration and (0.729) at the high salinity concentration. Likewise, under the
A
B
Figure 2. Effect of B. thuringiensis and chitosan on proline content (A) and maximum efficiency ofPSII (Fv/Fm) (B) under two salinity concentrations in sweet pepper during two seasons. Data is themean (±SE) of four replicates. Different letters above the data columns indicate significant differencesbetween the samples determined by ANOVA, Duncan´s multiple range test at 0.05 level.
3.5. Effect on Chlorophyll Fluorescence Parameter (Fv/Fm)
Our results in Figure 2B indicated that chlorophyll fluorescence parameters were adverselyaffected under salinity conditions. The maximum efficiency of PSII (Fv/Fm) significantly reduced insweet pepper (0.790) at the low salinity concentration and (0.729) at the high salinity concentration,respectively comparing to the control (0.822). However, seed treatment with B. thuringiensis causedsignificant increase in Fv/Fm ratio in the stressed plants (0.791) at the low concentration of salinity

Agronomy 2020, 10, 1180 9 of 20
and (0.769) at the high salinity concentration when compared with the stressed untreated plants(0.790) at the low concentration and (0.729) at the high salinity concentration. Likewise, under the twoconcentrations, chitosan caused a significant increase in Fv/Fm ratio. The best treatment was chitosanat the low salinity concentration (0.815) compared with control (0.822).
3.6. Effect on Lipid Peroxidation as Malondialdehyde
According to the findings in Figure 3, lipid peroxidation (MDA) significantly increased in sweetpepper (11.35 and 13.8 µmol·g−1 FW) at the two salinity concentrations, respectively as the mean ofboth seasons when compared with control plants (6.75 µmol·g−1 FW). Nevertheless, MDA significantlydecreased in the stressed plants according to seed treatment with B. thuringiensis and chitosan treatment.B. thuringiensis treatment had a positive effect on MDA and led to significant reduction in the MDAcontent at the two salinity concentrations (8.8 and 10.5 µmol·g−1 FW) when compared with the stresseduntreated plants (11.35 and 13.8 µmol·g−1 FW). The application of chitosan significantly reducedMDA content in sweet pepper under the two salinity concentrations (7 and 7.85 µmol·g−1 FW) whencompared with stressed untreated plants (11.35 and 13.8).
Agronomy 2020, 10, x FOR PEER REVIEW 9 of 20
two concentrations, chitosan caused a significant increase in Fv/Fm ratio. The best treatment was chitosan at the low salinity concentration (0.815) compared with control (0.822).
3.6. Effect on Lipid Peroxidation as Malondialdehyde
According to the findings in Figure 3, lipid peroxidation (MDA) significantly increased in sweet pepper (11.35 and 13.8 μmol·g−1 FW) at the two salinity concentrations, respectively as the mean of both seasons when compared with control plants (6.75 μmol·g−1 FW). Nevertheless, MDA significantly decreased in the stressed plants according to seed treatment with B. thuringiensis and chitosan treatment. B. thuringiensis treatment had a positive effect on MDA and led to significant reduction in the MDA content at the two salinity concentrations (8.8 and 10.5 μmol·g−1 FW) when compared with the stressed untreated plants (11.35 and 13.8 μmol·g−1 FW). The application of chitosan significantly reduced MDA content in sweet pepper under the two salinity concentrations (7 and 7.85 μmol·g−1 FW) when compared with stressed untreated plants (11.35 and 13.8).
Figure 3. Effect of B. thuringiensis and chitosan on lipid peroxidation (A), H2O2 (B) and O2− (C) under two salinity concentrations in sweet pepper during two seasons. Data is the mean (±SE) of four replicates. Different letters above the data columns indicate significant differences between the samples determined by ANOVA, Duncan´s multiple range test at 0.05 level.
A
C
B
Figure 3. Effect of B. thuringiensis and chitosan on lipid peroxidation (A), H2O2 (B) and O2− (C) under
two salinity concentrations in sweet pepper during two seasons. Data is the mean (±SE) of fourreplicates. Different letters above the data columns indicate significant differences between the samplesdetermined by ANOVA, Duncan´s multiple range test at 0.05 level.
Agronomy 2020, 10, 1180 10 of 20
3.7. Effect on O2− and H2O2
ROS, mainly O2− and H2O2 significantly increased under the both salinity concentrations (Figure 3).
O2− significantly increased (47.4 and 63 units) at the two salinity concentrations compared with control
(24.16 units). Conversely, B. thuringiensis treatment caused a significant decrease in O2− in the salt
stressed plants (38.3 and 52.3 units) in comparison with stressed untreated plants (47.4 and 63 units).Also, chitosan treatment caused a significant decrease in O2
− (31.7 and 48.3 units) when comparedwith the stressed untreated plants (47.4 and 63 units).
Salinity stress caused a significant increase in H2O2 in sweet pepper (16 and 18.1 units) at thetwo concentrations, respectively as compared to control (10.3 units). However, the levels of H2O2
were decreased significantly according to B. thuringiensis seed treatment and chitosan application inthe stressed plants at the two salinity concentrations. Chitosan application gave the best and mostsignificant results (10.3 and 11.8 units) compared to stressed untreated plants (16 and 18.1 units) at thetwo salinity concentrations, respectively.
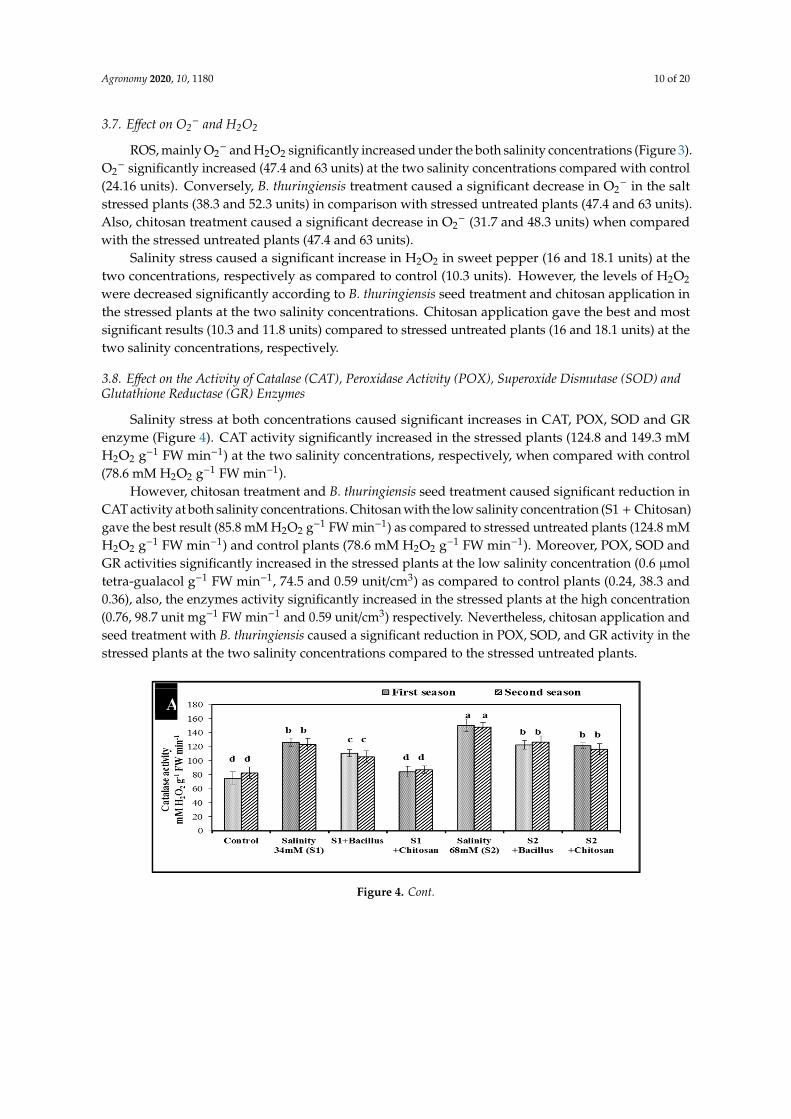
3.8. Effect on the Activity of Catalase (CAT), Peroxidase Activity (POX), Superoxide Dismutase (SOD) andGlutathione Reductase (GR) Enzymes
Salinity stress at both concentrations caused significant increases in CAT, POX, SOD and GRenzyme (Figure 4). CAT activity significantly increased in the stressed plants (124.8 and 149.3 mMH2O2 g−1 FW min−1) at the two salinity concentrations, respectively, when compared with control(78.6 mM H2O2 g−1 FW min−1).
However, chitosan treatment and B. thuringiensis seed treatment caused significant reduction inCAT activity at both salinity concentrations. Chitosan with the low salinity concentration (S1 + Chitosan)gave the best result (85.8 mM H2O2 g−1 FW min−1) as compared to stressed untreated plants (124.8 mMH2O2 g−1 FW min−1) and control plants (78.6 mM H2O2 g−1 FW min−1). Moreover, POX, SOD andGR activities significantly increased in the stressed plants at the low salinity concentration (0.6 µmoltetra-gualacol g−1 FW min−1, 74.5 and 0.59 unit/cm3) as compared to control plants (0.24, 38.3 and0.36), also, the enzymes activity significantly increased in the stressed plants at the high concentration(0.76, 98.7 unit mg−1 FW min−1 and 0.59 unit/cm3) respectively. Nevertheless, chitosan application andseed treatment with B. thuringiensis caused a significant reduction in POX, SOD, and GR activity in thestressed plants at the two salinity concentrations compared to the stressed untreated plants.Agronomy 2020, 10, x FOR PEER REVIEW 11 of 20
Figure 4. Effect of B. thuringiensis and chitosan on the activity of CAT (A), POX (B), SOD (C) and GR (D) under two salinity concentrations in sweet pepper during two seasons. Data is the mean (±SE) of four replicates. Different letters above the data columns indicate significant differences between the samples determined by ANOVA, Duncan´s multiple range test at 0.05 level.
3.9. Effect on Number of Fruit Plant−1, Fruit Fresh Weight Plant−1 and Total Fruit Yield (Ton Hectare−1).
In the present study, the results in Figure 5 point out that salinity at the both concentrations caused a significant decrease in number of fruit plant−1 (7.7 and 4.8 fruit), fresh weight of fruit plant−1 (524.5 and 356.4 g) and total fruit yield hectare−1 (7.05 and 5 ton) as the mean of the both seasons when compared to control plants (15.7 fruit plant−1, 974 g plant−1 and 14.9 ton hectare−1). However, B. thuringiensis and chitosan significantly increased the number of fruit plant−1, fruit fresh weight (g
A
C
D
Figure 4. Cont.

Agronomy 2020, 10, 1180 11 of 20
Agronomy 2020, 10, x FOR PEER REVIEW 11 of 20
Figure 4. Effect of B. thuringiensis and chitosan on the activity of CAT (A), POX (B), SOD (C) and GR (D) under two salinity concentrations in sweet pepper during two seasons. Data is the mean (±SE) of four replicates. Different letters above the data columns indicate significant differences between the samples determined by ANOVA, Duncan´s multiple range test at 0.05 level.
3.9. Effect on Number of Fruit Plant−1, Fruit Fresh Weight Plant−1 and Total Fruit Yield (Ton Hectare−1).
In the present study, the results in Figure 5 point out that salinity at the both concentrations caused a significant decrease in number of fruit plant−1 (7.7 and 4.8 fruit), fresh weight of fruit plant−1 (524.5 and 356.4 g) and total fruit yield hectare−1 (7.05 and 5 ton) as the mean of the both seasons when compared to control plants (15.7 fruit plant−1, 974 g plant−1 and 14.9 ton hectare−1). However, B. thuringiensis and chitosan significantly increased the number of fruit plant−1, fruit fresh weight (g
A
C
B
D
Figure 4. Effect of B. thuringiensis and chitosan on the activity of CAT (A), POX (B), SOD (C) and GR(D) under two salinity concentrations in sweet pepper during two seasons. Data is the mean (±SE) offour replicates. Different letters above the data columns indicate significant differences between thesamples determined by ANOVA, Duncan´s multiple range test at 0.05 level.
3.9. Effect on Number of Fruit Plant−1, Fruit Fresh Weight Plant−1 and Total Fruit Yield (Ton Hectare−1).
In the present study, the results in Figure 5 point out that salinity at the both concentrationscaused a significant decrease in number of fruit plant−1 (7.7 and 4.8 fruit), fresh weight of fruit plant−1
(524.5 and 356.4 g) and total fruit yield hectare−1 (7.05 and 5 ton) as the mean of the both seasonswhen compared to control plants (15.7 fruit plant−1, 974 g plant−1 and 14.9 ton hectare−1). However,B. thuringiensis and chitosan significantly increased the number of fruit plant−1, fruit fresh weight(g plant−1) and total fruit yield (ton hectare−1) in the stressed plants compared with untreated plants.Interestingly enough, under the both salinity concentrations, chitosan application gave the best resultsand significantly increased the number of fruit plant−1 (14.9 and 12.7), fruit fresh weight plant−1 (911and 527 g plant−1), and total fruit yield (14 and 10.8 ton hectare−1) as the mean of the both seasons.

Agronomy 2020, 10, 1180 12 of 20
Agronomy 2020, 10, x FOR PEER REVIEW 12 of 20
thuringiensis and chitosan significantly increased the number of fruit plant−1, fruit fresh weight (g plant−1) and total fruit yield (ton hectare−1) in the stressed plants compared with untreated plants. Interestingly enough, under the both salinity concentrations, chitosan application gave the best results and significantly increased the number of fruit plant−1 (14.9 and 12.7), fruit fresh weight plant−1 (911 and 527 g plant−1), and total fruit yield (14 and 10.8 ton hectare−1) as the mean of the both seasons.
Figure 5. Effect of B. thuringiensis and chitosan on number of fruit plant−1(A), fruit fresh weight plant−1 (B) and total fruit yield (ton hectare−1) (C) under two salinity concentrations in sweet pepper during two seasons. Data is the mean (±SE) of four replicates. Different letters above the data columns indicate significant differences between the samples determined by ANOVA, Duncan’s multiple range test at 0.05 level.
3.10. Correlation Studies
In the present study chlorophyll a was positively and significantly correlated with chlorophyll b (r = 0.99), number of fruits (r = 0.98), RWC (r = 0.97), GR (r = 0.80) and MDA (r = 0.75). Among the treatment it has a negative correlation with salinity stress @ 34 mM (r = −0.05), salinity stress @ 68 mM (r = −0.02), however, a positive correlation was noted among the chlorophyll a and treatments of Bacillus sp. and chitosan (Figure 6 and Supplementary Table S1). A similar trend of relationship was shown by chlorophyll b. Proline showed highly positive correlation with MDA (r = 0.98), H2O2 (r = 0.97), SOD (r = 0.96) and GR (r = 0.96) but was negatively correlated with the treatments Bacillus sp. (r = −0.04) and chitosan (r = −0.05). A very similar correlation was observed among all the studies.
A
B
C
Figure 5. Effect of B. thuringiensis and chitosan on number of fruit plant−1(A), fruit fresh weight plant−1
(B) and total fruit yield (ton hectare−1) (C) under two salinity concentrations in sweet pepper duringtwo seasons. Data is the mean (±SE) of four replicates. Different letters above the data columns indicatesignificant differences between the samples determined by ANOVA, Duncan’s multiple range test at0.05 level.
3.10. Correlation Studies
In the present study chlorophyll a was positively and significantly correlated with chlorophyll b(r = 0.99), number of fruits (r = 0.98), RWC (r = 0.97), GR (r = 0.80) and MDA (r = 0.75). Among thetreatment it has a negative correlation with salinity stress @ 34 mM (r = −0.05), salinity stress @ 68mM (r = −0.02), however, a positive correlation was noted among the chlorophyll a and treatmentsof Bacillus sp. and chitosan (Figure 6 and Supplementary Table S1). A similar trend of relationshipwas shown by chlorophyll b. Proline showed highly positive correlation with MDA (r = 0.98), H2O2
(r = 0.97), SOD (r = 0.96) and GR (r = 0.96) but was negatively correlated with the treatments Bacillus sp.(r = −0.04) and chitosan (r = −0.05). A very similar correlation was observed among all the studies.Antioxidant enzymes and H2O2 concentration that were highly correlated with each other also showeda negative correlation with the treatments of Bacillus sp. and chitosan. The number of fruits showeda highly significant correlation with chlorophyll a and b (r = 0.98) and with RWC (r = 0.95). However,

Agronomy 2020, 10, 1180 13 of 20
this trait was inversely related to the treatments of salinity @ 34 mM (r = − 0.15) and @ 68 mM(r = − 0.25).
1
Figure 6. Circle of correlation between variables and factors for sweet pepper.
GR
Chl.AChl.B
MDA
Proline
%RWC
SOD
H2O2
No. of Fruit
Treatment-Control
Treatment-Salinity 34mM (S1)
Treatment-S1+Bacillus
Treatment-S1 +Chitosan
Treatment-Salinity 68mM (S2)
Treatment-S2+Bacillus
Treatment-S2+Chitosan
Season-First season Season-Second season
Season-SD1Season-SD2
-1
-0.75
-0.5
-0.25
0
0.25
0.5
0.75
1
-1 -0.75 -0.5 -0.25 0 0.25 0.5 0.75 1
F2 (1
2.35
%)
F1 (86.70 %)
Variables (axes F1 and F2: 99.05 %)
Active variables Supplementary variables
Figure 6. Circle of correlation between variables and factors for sweet pepper.
4. Discussion
Salinity stress adversely affects plant growth, inhibiting plant development and reducing fruityield of sweet pepper. The present data revealed the deleterious effects of salinity at the two differentconcentrations (34 and 68 mM) on RWC. This might be due to the injurious influence of salinity onthe cell wall structure [71], thereby increasing ethylene concentration, which reduces the growth ofroots [44]. This effect causes changes in cell wall properties, the reduction in osmotic potential, and thedecrease in water balance [72], consequently reducing RWC in sweet pepper [1]. These deleteriousimpacts of salinity were overcome by seed treatment with B. thuringiensis and treating stressedsweet pepper with chitosan. The pivotal role of B. thuringiensis under salinity stress could be due tothe formation of Indole-acetic acid which causes enhancement of root growth and increased wateruptake [73]. Likewise, PGPR can produce exopolysaccharides (EPSs) which aggregate with soilparticles and improve soil structure as well as water uptake [74]. Further, the application of PGPR

Agronomy 2020, 10, 1180 14 of 20
causes a decay in the soil bulk density and enhances the availability of soil water. Chitosan applicationpositively affects RWC in stressed plants, this progressive effect of chitosan could be due to the positiverole of chitosan on water availability in stressed plants. These valuable effects were documented inbarley under drought [19].
Chlorophyll a and b are very important pigments in the process of photosynthesis, in this process,two reactions take place. One such reaction is the light reaction, in which NADPH and ATP are produced,and the second is the dark reaction, in which carbon dioxide is fixed [75]. Demonstrated data revealeda significant decrease in chlorophyll content under the two salinity concentrations, this decrease inchlorophyll was more considerable at the high concentration (68 mM) than at lower concentration(34.mM) and this might be due to the damaging effect of salinity on the chloroplast structure [3,76],that decrease energy transport from PSII to PSI [77] and, consequently, reduce the chlorophyll formationin stressed sweet pepper plants. The harmful effect of salinity on the content of chlorophyll was alsodue to reduction in stomatal conductance and destruction of biochemical processes [78]. These findingsare in accordance with those reported by Abdelaal et al. [1] in sweet pepper under salinity stress.Also, Asrar et al. [79] indicated that a high salinity concentration caused harmful effects on PSII anddecreased chloroplast proteins as well as chlorophyll concentrations. This decrease in chlorophyllconcentrations is related to the reduction in RWC under high salt concentration.
Conversely, inoculation of seeds with B. thuringiensis mitigates the adverse effects of salinityon the content of chlorophyll that improve the overall growth and proliferation of plants understressful environments [80]. Beside this, the application of chitosan had also synergistic effects on thecontents of chlorophyll a and b. This increase in the content of chlorophyll with the application ofchitosan may be attributed to the fact that chitosan is a rich source for amino acids which increasethe chloroplast number and chlorophyll formation. These results are in harmony with the findingsof Possingham [81]. During the present study, a significant increase was found in EL% under twodifferent salt concentrations mainly. The higher salt concentration was more effective and significantlyincreased the EL%. This negative influence of salinity on EL% may be due to its damaging impactson the cytoplasmic membrane and permeability process. Previously, a similar result was reportedby Abdelaal et al. [1] in sweet pepper. Contrariwise, EL% significantly reduced in stressed plants asa result of seed treatment with B. thuringiensis and chitosan, these valuable effects of B. thuringiensistreatment and chitosan application is attributed to the positive roles of B. thuringiensis and chitosan onmembrane stability and an improvement in the selective permeability of cell plasma membrane.
In the present study, the chlorophyll fluorescence parameter was adversely affected under twosalinity concentrations. Salinity stress causes a significant decrease to maximum efficiency of PSII (Fv/Fm).This adverse effect of salinity on (Fv/Fm) might be due to its role in the inhibition of electron transportand the reaction centers at the PSII sites as well as destroys the oxygen-evolving complex [82–84]. Also,salinity stress has a negative effect on enzymes activity and decreases the activity of water splittingenzyme complexes and electron transport chains resulting in decrease Fv/Fm [85]. However, seedtreatment with B. thuringiensis and the application of chitosan caused a significant increase Fv/Fm ratioin the stressed plants. These results are credited to the helpful role of B. thuringiensis and chitosanin increasing the production of protective metabolites, increasing N and K content as well as thenumber of chloroplasts under stress [81,86], and consequently, improving the chlorophyll fluorescenceparameter. The obtained results indicated that proline significantly increased in the stressed plantsunder both the salinity concentrations (34 and 68 mM). This impact of salinity may be due to its role inreducing the proline oxidation to glutamate, consequently increasing the proline content [87]. Prolineis one of the most important osmoprotectants, plays a key role in osmotic regulation, and protects theplants under stress [1,8]. Chitosan application and seed treatment with B. thuringiensis regulated prolinecontent under salinity conditions. Seed inoculation with B. thuringiensis positively regulated prolinecontent under stress because this species regulates the osmotic balance under saline conditions. Similarresults for proline production under saline conditions were also reported by Egamberdieva et al. [88].

Agronomy 2020, 10, 1180 15 of 20
Salinity could hamper plant growth and increase lipid peroxidation, O2−, and H2O2. A significant
increase was noted in the mentioned parameters during the present study. These reactive compoundscan damage lipids and proteins, essential for the process of photosynthesis and electron transport chain.Islam et al. [18] noted similar results in two wheat cultivars grown under saline conditions. However,in the present study, a significant decrease was noted in the lipid peroxidation upon treatment withchitosan. This may be due to the involvement of chitosan in cell protection from oxidative stress undersalinity conditions. Similarly, O2
− and H2O2 were significantly reduced with chitosan due to thepresence of hydroxyl and amino groups which react with ROS, thus chitosan can scavenge superoxideradicals [89]. Chitosan derived from the pathogen is recognized by a specific cellular receptor resultingin enhancing the defense response to abiotic and biotic stresses [90]. The positive effect of chitosan inthe plant cell protection was also noted in plants under drought stress [20]. Interestingly, seed treatmentwith B. thuringiensis led to improved cell membrane stability and decreased the formation of MDAin the stressed sweet pepper, this effect of B. thuringiensis is due to its improved phenol content anddefense enzyme system [91]. Also, B. thuringiensis causes decreases in O2
− and H2O2 by increasingreactive oxygen scavenging enzyme activity [92].
Enzymes up-regulation (CAT, POX, SOD, and GR) is involved in the mitigation of salinity stressin sweet peppers compared with control plants. The significant increase in these enzymes is a naturaldefense system, which helps to cope with salinity stress and reduces the osmotic and toxic effectsby scavenging ROS. Our results are in agreement with those reported by Abdelaal et al. [17] andFoyer et al. [93]. Nevertheless, it was clear from our results that the application of seed treatmentwith B. thuringiensis led to improved and regulated up-regulation of CAT, POX, SOD, and GR in thestressed sweet pepper. The induction of these enzymes is involved in the mitigation of salt stress insweet pepper treated with Bacillus. A similar trend of enzyme activity was recorded in the findingsof Kohler et al. [94]. Likewise, chitosan application causes an increase in enzymes activity to protectthe plant from oxidative damage and reduce lipid peroxidation as well as scavenge O2
− due to itsstructure and protective role in sweet pepper plants subjected to salinity stress. These results are inagreement with those reported by Hafez et al. [19]. The presented study showed that two salinityconcentrations caused a significant reduction in the number of fruit plant−1, fruit fresh weight plant−1,and total fruit yield. This harmful impact of salinity may be due to the decrease in reproductive organs,such as pollen grains in stressed plants [95], and also due to the decrease in water absorption, nutrientsuptake, and chlorophyll content [1,4], resulting in a significant decrease in fruit yield [96]. The vitalrole of B. thuringiensis might be due to the formation of growth regulators such as gibberellins, auxin,and cytokinins, as well as an increase in proline content [87], up-regulation of essential enzymes andsolubilization of nutrients [89], and an increase in the number of fruits and fruit yield hectar−1 insweet pepper. These findings are in agreement with the previous results reported by Hafez et al. [19],Katiyar et al. [36], and Hidangmayum et al. [37].
5. Conclusions
The present research concluded that seeds treated with B. thuringiensis and foliar applicationof chitosan 30 mg dm−3 on sweet pepper plants under two salinity concentrations (34 and 68 mM)led to an improvement of the adverse effects of salinity and enhanced the growth and yield of sweetpepper. RWC, chlorophyll a and b concentrations, chlorophyll fluorescence parameters, and fruityield characters significantly increased with B. thuringiensis and chitosan treatments in sweet pepperunder two salinity concentrations. Conversely, lipid peroxidation, electrolyte leakage, and reactiveoxygen species (O2
− and H2O2) were decreased significantly as a result of B. thuringiensis and chitosantreatments. Overall, seed treatment with B. thuringiensis and chitosan foliar application was an effectiveand cheaper approach to cope with the deleterious effects of salinity on sweet pepper by improvingthe chlorophyll fluorescence parameters, proline accumulation, and up-regulation of enzymes activityas well as the enhancement of fruit yield characters.

Agronomy 2020, 10, 1180 16 of 20
Supplementary Materials: The following are available online at http://www.mdpi.com/2073-4395/10/8/1180/s1,Table S1: Correlation matrix among different treatments and quantitative traits of sweet pepper.
Author Contributions: Conceptualization, K.A.A.A., Y.M.H., K.A.A., and M.D.F.A.; methodology, K.A.A.A.,Y.M.H., K.A.A., M.D.F.A., A.M.E., and M.A.M.A.; software, K.A.A.A., Y.M.H., K.A.A., M.D.F.A., and M.A.M.A.;formal analysis, K.A.A.A., Y.M.H., K.A.A., A.M.E., M.A., and N.K.; investigation, K.A.A.A., Y.M.H., K.A.A.,A.M.E., M.A.M.A., and N.K.; resources, K.A.A.A., Y.M.H., K.A.A., A.M.E., M.A.M.A., and N.K.; data curation,K.A.A.A., Y.M.H., K.A.A., A.M.E., M.A.M.A., and N.K.; writing-original draft preparation, K.A.A.A., Y.M.H.,K.A.A., A.M.E., M.A.M.A., M.D.F.A., and N.K.; writing-review and editing, K.A.A.A., Y.M.H., A.M.E., M.A., N.K.,and M.D.F.A.; visualization, K.A.A.A., Y.M.H., and K.A.A.; funding acquisition, M.D.F.A., K.A.A.A., M.A., A.M.E.,and K.A.A. All authors have read and agreed to the published version of the manuscript.
Funding: This research was funded by the Deanship of Scientific Research at Princess Nourah bint AbdulrahmanUniversity through the Fast-track Research Funding Program.
Acknowledgments: The authors extend their appreciation to all members of PPBL and EPCRS excellence center,Faculty of Agriculture, Kafrelsheikh University, and the Deanship of Scientific Research at Princess Nourah bintAbdulrahman University Fast-track Research Funding Program.
Conflicts of Interest: The authors declare no conflict of interest
References
1. Abdelaal, K.A.A.; EL-Maghraby, L.M.; Elansary, H.; Hafez, Y.M.; Ibrahim, E.I.; El-Banna, M.; El-Esawi, M.;Elkelish, A. Treatment of Sweet Pepper with Stress Tolerance-Inducing Compounds Alleviates Salinity StressOxidative Damage by Mediating the Physio-Biochemical Activities and Antioxidant Systems. Agronomy2020, 10, 26. [CrossRef]
2. Chavez-Mendoza, C.; Sanchez, E.; Muñoz-Marquez, E.; Sida-Arreola, J.P.; Flores-Cordova, M.A. Bioactivecompounds and antioxidant activity in different grafted varieties of bell pepper. Antioxidants 2015, 4, 427–446.[CrossRef] [PubMed]
3. El-Banna, M.F.; Abdelaal, K.A.A. Response of Strawberry Plants Grown in the Hydroponic System toPretreatment with H2O2 before Exposure to Salinity Stress. J. Plant Prot. Mansoura Univ. 2018, 9, 989–1001.[CrossRef]
4. Helaly, M.N.; Mohammed, Z.; El-Shaeery, N.I.; Abdelaal, K.A.A.; Nofal, I.E. Cucumber grafting ontopumpkin can represent an interesting tool to minimize salinity stress. Physiological and anatomical studies.Middle East J. Agric. Res. 2017, 6, 953–975.
5. Isayenkov, S.V.; Maathuis, F.J. Plant salinity stress: Many unanswered questions remain. Front. Plant Sci.2019, 10, 80. [CrossRef] [PubMed]
6. Hernández, J.A.; Almansa, M.S. Short-term effects of salt stress on antioxidant systems and leaf waterrelations of pea leaves. Physiol. Plant. 2002, 115, 251–257. [CrossRef]
7. Koyro, H.W. Effect of salinity of growth, photosynthesis, water relations and solute composition of thepotential cash crop halophyte Plantago coronopus (L.). Environ. Exp. Bot. 2006, 56, 136–146. [CrossRef]
8. Gorhman, J.; Hardy, C.; Wyn, R.G.; Jones, L.R.; Law, C.N. Chromosomal location of a K/Na discriminationcharacter in the D genome of wheat. Theor. Appl. Genet. 1987, 74, 584–588.
9. Harizanova, A.; Koleva-valkova, L. Effect of silicon on photosynthetic rate and the chlorophyll fluorescenceparameters at hydroponically grown cucumber plants under salinity stress. J. Cent. Eur. Agric. 2019, 20,953–960. [CrossRef]
10. Misra, N.; Ansari, M.; Gupta, A. Differential response of scavenging of reactive oxygen species in green gramgenotype grown under salinity stress. Am. J. Plant Physiol. 2006, 1, 41–53. [CrossRef]
11. Hasan, M.K.; El Sabagh, A.; Sikdar, M.S.; Alam, M.J.; Ratnasekera, D.; Barutcular, C.; Abdelaal, K.A.A.;Islam, M.S. Comparative adaptable agronomic traits of blackgram and mungbean for saline lands. Plant Arch.2017, 17, 589–593.
12. Carmen, B.; Roberto, D. Soil bacteria support and protect plants against abiotic stresses. In Abiotic Stress inPlants Mechanisms and Adaptations; Shanker, A., Ed.; Pub. In Tech: London, UK, 2011; pp. 143–170.
13. Islam, F.; Yasmeen, T.; Ali, S.; Ali, B.; Farooq, M.A.; Gill, R.A. Priming induced antioxidative responses intwo wheat cultivars under saline stress. Acta Physiol. Plant. 2015, 37, 153. [CrossRef]
14. Memon, S.A.; Hou, X.; Wang, L.J. Morphological analysis of salt stress response of pak Choi. Electron. J.Environ. Agric. Food Chem. 2010, 9, 248–254.

Agronomy 2020, 10, 1180 17 of 20
15. Khan, N.; Bano, A. Role of plant growth promoting rhizobacteria and Ag-nano particle in the bioremediationof heavy metals and maize growth under municipal wastewater irrigation. Int. J. Phytorem. 2016, 18, 211–221.[CrossRef]
16. Gama, P.B.S.; Inanaga, S.; Tanaka, K.; Nakazawa, R. Physiological response of common bean (Phaseolusvulgaris L.) seedlings to salinity stress. Afr. J. Biotechnol. 2007, 6, 79–88.
17. Abdelaal, K.A.; Mazrou, Y.S.; Hafez, Y.M. Silicon Foliar Application Mitigates Salt Stress in Sweet PepperPlants by Enhancing Water Status, Photosynthesis, Antioxidant Enzyme Activity and Fruit Yield. Plants2020, 9, 733. [CrossRef]
18. Abdelaal, K.A.; Hafez, Y.M.; Sabagh, A.E.L.; Saneoka, H. Ameliorative effects of Abscisic acid and yeaston morpho-physiological and yield characteristics of maize plant (Zea mays L.) under drought conditions.Fresenius Environ. Bull. 2017, 26, 7372–7383.
19. Hafez, Y.; Attia, K.; Alamery, S.; Ghazy, A.; Al-Doss, A.; Ibrahim, E.; Rashwan, E.; El-Maghraby, L.; Awad, A.;Abdelaal, K.A. Beneficial Effects of Biochar and Chitosan on Antioxidative Capacity, Osmolytes Accumulation,and Anatomical Characters of Water-Stressed Barley Plants. Agronomy 2020, 10, 630. [CrossRef]
20. Abdelaal, K.A.; Hafez, Y.M.; Badr, M.M.; Youseef, W.A.; Esmaeil, S.M. Biochemical, histological andmolecular changes in susceptible and resistant wheat cultivars inoculated with stripe rust fungusPuccinia striiformis f.sp. tritici. Egypt. J. Biol. Pest Control 2014, 24, 421–429.
21. Abdelaal, K.A.; Omara, I.R.; Hafez, Y.M.; Esmail, S.M.; EL Sabagh, A. Anatomical, biochemical andphysiological changes in some Egyptian wheat cultivars inoculated with Puccinia graminis f.sp. tritici.Fresenius Environ. Bull. 2018, 27, 296–305.
22. Esmail, S.M.; Omara, R.I.; Abdelaal, K.A.; Hafez, M. Histological and biochemical aspects of compatibleand incompatible wheat-Puccinia striiformis interactions. Physiol. Mol. Plant Pathol. 2019, 106, 120–128.[CrossRef]
23. Omara, R.I.; El-Kot, G.A.; Fadel, F.M.; Abdelaal, K.A.; Saleh, E.M. Efficacy of Certain Bioagents onPatho-Physiological Characters of Wheat Plants under Wheat Leaf Rust Stress. Physiol. Mol. Plant Pathol.2019, 106, 102–108. [CrossRef]
24. Hafez, Y.M.; Abdelaal, K.A. Investigation of susceptibility and resistance mechanisms of some Egyptianwheat cultivars (Triticum aestivum L.) inoculated with Blumeria graminis f.sp. tritici using certain biochemical,molecular characterization and SEM. J. Plant Prot. Path. Mansoura Univ. 2015, 6, 431–454.
25. Khan, N.; Bano, A.; Zandi, P. Effects of exogenously applied plant growth regulators in combination withPGPR on the physiology and root growth of chickpea (Cicer arietinum) and their role in drought tolerance.J. Plant Interact. 2018, 13, 239–247. [CrossRef]
26. Abdelaal, K.A.; Attia, K.A.; Alamery, S.F.; El-Afry, M.M.; Ghazy, A.I.; Tantawy, D.S.; Al-Doss, A.A.;El-Shawy, E.E.; Abu-Elsaoud, A.M.; Hafez Y., M. Exogenous Application of Proline and Salicylic Acidcan Mitigate the Injurious Impacts of Drought Stress on Barley Plants Associated with Physiological andHistological Characters. Sustainability 2020, 12, 1736. [CrossRef]
27. Abdelaal, K.A. Effect of Salicylic acid and Abscisic acid on morpho-physiological and anatomical charactersof faba bean plants (Vicia faba L.) under drought stress. J. Plant Prod. Mansoura Univ. 2015, 6, 1771–1788.[CrossRef]
28. Abdelaal, K.A.; Hafez, Y.M.; El-Afry, M.; Tantawy, D.S.; Alshaal, T. Effect of some osmoregulators onphotosynthesis, lipid peroxidation, antioxidative capacity, and productivity of barley (Hordeum vulgare L.)under water deficit stress. Environ. Sci. Pollut. Res. 2018, 25, 30199–30211. [CrossRef]
29. Elkelish, A.; Qari, S.H.; Mazrou, Y.M.; Abdelaal, K.A.; Hafez, Y.M.; Abu-Elsaoud, A.M.; Batiha, G.;El-Esawi, M.; El Nahhas, N. Exogenous Ascorbic Acid Induced Chilling Tolerance in Tomato Plants ThroughModulating Metabolism, Osmolytes, Antioxidants, and Transcriptional Regulation of Catalase and HeatShock Proteins. Plants 2020, 10, 431. [CrossRef]
30. Zhu, J.-K. Regulation of ion homeostasis under salt stress. Curr. Opin. Plant Biol. 2003, 6, 441–445. [CrossRef]31. Sairam, R.K.; Tyagi, A. Physiology and molecular biology of salinity stress tolerance in plants. Curr. Sci.
2004, 86, 407–421.32. Gupta, B.; Huang, B. Mechanism of salinity tolerance in plants: Physiological, biochemical, and molecular
characterization. Int. J. Genom. 2014, 18. [CrossRef] [PubMed]33. Maxwell, K.; Johnson, G.N. Chlorophyll fluorescence—A practical guide. J. Exp. Bot. 2000, 51, 659–668.
[CrossRef] [PubMed]

Agronomy 2020, 10, 1180 18 of 20
34. Murchie, E.H.; Lawson, T. Chlorophyll fluorescence analysis: A guide to good practice and understandingsome new applications. J. Exp. Bot. 2013, 64, 3983–3998. [CrossRef] [PubMed]
35. Kalaji, M.H.; Goltsev, V.; Zuk-Golaszewska, B.; Zivcak, M.; Brestic, M. Chlorophyll Fluorescence: UnderstandingCrop Performance-Basics and Applications; Taylor and Francis: New York City, NY, USA, USA 2017; p. 222.ISBN 9781498764490.
36. Katiyar, D.; Hemantaranjan, A.; Singh, B. Chitosan as a promising natural compound to enhance potentialphysiological responses in plant: A review. Indian J. Plant Physiol. 2015, 20, 1–9. [CrossRef]
37. Hidangmayum, A.; Dwivedi, P.; Katiyar, D.; Hemantaranjan, A. Application of chitosan on plant responseswith special reference to abiotic stress. Physiol. Mol. Biol. Plants 2019, 25, 313–326. [CrossRef] [PubMed]
38. Al-Tawaha, A.M.; Seguin, P.; Smith, D.L.; Beaulieu, C. Foliar application of elicitors alters isofl avoneconcentrations and other seed characteristics of field-grown soybean. Can. J. Plant Sci. 2006, 86, 677–684.[CrossRef]
39. Kim, H.J.; Chen, F.; Wang, X.; Rajapakse, N.C. Effect of chitosan on the biological properties of sweet basil(Ocimum basilicum L.). J. Agric. Food Chem. 2005, 53, 3696–3701. [CrossRef]
40. Balal, R.M.; Shahid, M.A.; Javaid, M.M.; Iqbal, Z.; Liu, G.D.; Zotarelli, L.; Khan, N. Chitosan alleviatesphytotoxicity caused by boron through augmented polyamine metabolism and antioxidant activities andreduced boron concentration in Cucumis sativus L. Acta Physiol. Plant. 2017, 39, 31. [CrossRef]
41. Monirul, I.M.; Humayun, K.M.; Mamun, A.N.K.; Monirul, I.; Pronabananda, D. Studies on yield and yieldattributes in tomato and chilli using foliar application of oligo-chitosan. GSC Biol. Pharm. Sci. 2018, 3,020–028.
42. Yang, J.; Kloepper, J.W.; Ryu, C.M. Rhizosphere bacteria help plants tolerate abiotic stress. Trends Plant Sci.2009, 14, 1–4. [CrossRef]
43. Noel, T.C.; Sheng, C.; Yost, C.K.; Pharis, R.P.; Hynes, M.F. Rhizobium leguminosarum as a plantgrowth-promoting rhizobacterium: Direct growth promotion of canola and lettuce. Can. J. Microbiol.1996, 42, 279–283. [CrossRef] [PubMed]
44. Mayak, S.; Tirosh, T.; Glick, B.R. Plant growth-promoting bacteria that confer resistance in tomato plants tosalt stress. Plant Physiol. Biochem. 2004, 42, 565–572. [CrossRef]
45. Abdelaal, K.A.; Tawfik, S.F. Response of Sugar Beet Plant (Beta vulgaris L.) to Mineral Nitrogen Fertilizationand Bio-Fertilizers. Int. J. Curr. Microbiol. App. Sci. 2015, 4, 677–688.
46. Abdelaal, K.A.; Badawy, S.A.; Abdel Aziz, R.M.; Neana, S.M.M. Effect of mineral nitrogen levels andbiofertilizer on morphophysiological characters of three sweet sorghum varieties (Sorghum bicolor L. Moench).J. Plant Prod. Mansoura Univ. 2015, 6, 189–203. [CrossRef]
47. Abdelaal, K.A. Pivotal Role of Bio and Mineral Fertilizer Combinations on Morphological, Anatomical andYield Characters of Sugar Beet Plant (Beta vulgaris L.). Middle East J. Agric. Res. 2015, 4, 717–734.
48. Hafez, Y.M.; Attia, K.; Kamel, S.; Alamery, S.; El-Gendyd, S.; Al-Doss, A.; Mehiar, F.; Ghazy, A.; Abdelaal, K.A.Bacillus subtilis as a bio-agent combined with nano molecules can control powdery mildew disease throughhistochemical and physiobiochemical changes in cucumber plants. Physiol. Mol. Plant Pathol. 2020, 111,101489. [CrossRef]
49. Khan, N.; Bano, A.; Ali, S.; Babar, M.A. Crosstalk amongst phytohormones from planta and PGPR underbiotic and abiotic stresses. Plant Growth Regul. 2020, 90, 189–203. [CrossRef]
50. Kousar, B.; Bano, A.; Khan, N. PGPR Modulation of Secondary Metabolites in Tomato Infested with Spodopteralitura. Agronomy 2020, 10, 778. [CrossRef]
51. Abou-Attia, F.A.M.; Abdelaal, K.A. Effect of Bio and Mineral fertilization on the main insect pests and somecharacters of sugar beet plants. J. Agric. Sci. Mansoura Univ. 2007, 32, 1471–1485.
52. Egamberdieva, D. Pseudomonas chlororaphis: A salt-tolerant bacterial inoculant for plant growth stimulationunder saline soil conditions. Acta Physiol. Plant. 2012, 34, 751–756. [CrossRef]
53. Khan, N.; Bano, A.M.; Babar, A. Impacts of plant growth promoters and plant growth regulators on rainfedagriculture. PLoS ONE 2020, 15, e0231426. [CrossRef] [PubMed]
54. Zhao, S.; Zhou, N.; Zhao, Z.-Y.; Zhang, K.; Wu, G.-H.; Tian, C.-Y. Isolation of endophytic plantgrowth-promoting bacteria associated with the halophyte Salicornia europaea and evaluation of their promotingactivity under salt stress. Curr. Microbiol. 2016, 73, 574–581. [CrossRef] [PubMed]
55. Page, A.L. Methods of Soil Analysis. Part 2, Chemical and Microbiological Properties, 2nd ed.; Soil Science Societyof America Inc.: Madison, WI, USA, 1982.
Agronomy 2020, 10, 1180 19 of 20
56. Sanchez, F.J.; de Andrés, E.F.; Tenorio, J.L.; Ayerbe, L. Growth of epicotyls, turgor maintenance and osmoticadjustment in pea plants (Pisum sativum L.) subjected to water stress. Field Crop. Res. 2004, 86, 81–90.[CrossRef]
57. Moran, R. Formulae for Determination of Chlorophyllous Pigments Extracted with N,N-Dimethylformamide 1.Plant Physiol. 1982, 69, 1376–1381. [CrossRef] [PubMed]
58. Szalai, G.; Janda, T.; Padi, E.; Szigeti, Z. Role of light in post-chilling symptoms in maize. J. Plant Physiol.1996, 148, 378–383. [CrossRef]
59. Schreiber, U. Pulse-Amplitude (RAM) Fluorometry and Saturation Pulse Method in Chlorophyll Fluorescence:A Signature of Photosynthesis; Papageorgiou, G., Govindjee, Eds.; Springer: Dordrecht, The Netherlands, 2004;pp. 279–319.
60. Bates, L.S.; Waldren, R.P.; Teare, I.D. Rapid determination of free proline for water-stress studies. Plant Soil1973, 39, 205–207. [CrossRef]
61. Davenport, S.B.; Gallego, S.M.; Benavides, M.P.; Tomaro, M.L. Behaviour of antioxidant defense system in theadaptive response to salt stress in Helianthus annuus L. cells. Plant Growth Regul. 2003, 40, 81–88. [CrossRef]
62. Huckelhoven, R.; Fodor, J.; Preis, C.; Kogel, K.H. Hypersensitive cell death and papilla formation in barleyattacked by the powdery mildew fungus are associated with hydrogen peroxide but not with salicylic acidaccumulation. Plant Physiol. 1999, 1119, 1251–1260. [CrossRef]
63. Hafez, Y.M.; Abdelaal, K.A.; Eid, M.E.; Mehiar, F.F. Morpho-physiological and biochemical responses ofbarley plants (Hordeum vulgare L.) against barley net blotch disease with application of non-traditionalcompounds and fungicides. Egypt. J. Biol. Pest Cont. 2016, 26, 261–268.
64. Aebi, H. Catalase in vitro. In Methods in Enzymology; Oxygen Radicals in Biological Systems; Academic Press:Cambridge, MA, USA, 1984; Volume 105, pp. 121–126.
65. Hammerschmidt, R.; Nuckles, E.M.; Kuc, J. Association of enhanced peroxidase activity with inducedsystemic resistance of cucumber to Colletotrichum lagenarium. Physiol. Plant Pathol. 1982, 20, 73–82. [CrossRef]
66. Mishra, N.P.; Mishra, R.K.; Singhal, G.S. Changes in the activities of anti-oxidant enzymes during exposureof intact what leaves to strong visible light at different temperatures in the presence of protein synthesisinhibitors. Plant Physiol. 1993, 102, 903–910. [CrossRef] [PubMed]
67. McCord, J.M.; Fridovich, I. Superoxide Dismutase: An enzymatic reaction for erythrocuprein (hemocuprein).J. Biol. Chem. 1969, 244, 6049–6055. [PubMed]
68. Goldberg, D.M.; Spooner, R.J. Methods of Enzymatic Analysis, 3rd ed.; Verlag Chemie: Weinheim, Germany,1983; pp. 258–265.
69. Gomez, K.A.; Gomez, A.A. Statistical Procedures for Agricultural Research, 2nd ed.; Wiley Inter Science: NewYork City, NY, USA, 1984; pp. 1–690.
70. Duncan, B.D. Multiple ranges and multiple F-test. Biometrics 1955, 11, 1–42. [CrossRef]71. Wang, Y.; Nil, N. Changes in chlorophyll, ribulose biphosphate carboxylase-oxygenase, glycine betaine
content, photosynthesis and transpiration in Amaranthus tricolor leaves during salt stress. J. Hortic.Sci. Biotechnol. 2000, 75, 623–627. [CrossRef]
72. Parvin, K.; Hasanuzzaman, M.; Bhuyan, M.H.M.B.; Nahar, K.; Mohsin, S.M.; Fujita, M. ComparativePhysiological and Biochemical Changes in Tomato (Solanum lycopersicum L.) under Salt Stress and Recovery:Role of Antioxidant Defense and Glyoxalase Systems. Antioxidants 2019, 8, 350. [CrossRef]
73. Wang, Y.; Li, K.; Li, X. Auxin redistribution modulates plastic development of root system architecture undersalt stress in Arabidopsis thaliana. J. Plant Physiol. 2009, 166, 1637–1645. [CrossRef]
74. Naseem, H.; Ahsan, M.; Shahid, M.A.; Khan, N. Exopolysaccharides producing rhizobacteria and their rolein plant growth and drought tolerance. J. Basic. Microbiol. 2018, 58, 1009–1022. [CrossRef]
75. Allakhverdiev, S.I.; Nishiyama, Y.; Miyairi, S.; Yamamoto, H.; Inagaki, N.; Kanesaki, Y.; Murata, N. Salt stressinhibits the repair of photodamaged photosystem II by suppressing the transcription and translation of psbAgenes in Synechocystis. Plant Physiol. 2002, 130, 1443–1453. [CrossRef]
76. Khan, N.; Bano, A.; Curá, J.A. Role of Beneficial Microorganisms and Salicylic Acid in Improving RainfedAgriculture and Future Food Safety. Microorganisms 2020, 8, 1018. [CrossRef]
77. Wang, W.; Wang, C.; Pan, D.; Zhang, Y.; Luo, B.; Ji, J. Effects of drought stress on photosynthesis andchlorophyll fluorescence images of soybean (Glycine max) seedlings. Int. J. Agric. Biol. Eng. 2018, 11, 196–201.[CrossRef]

Agronomy 2020, 10, 1180 20 of 20
78. Tavakkoli, E.; Rengasamy, P.; McDonald, G. High concentrations of Na+ and Cl− ions in soil solution havesimultaneous detrimental effects on growth of faba bean under salinity stress. J. Exp. Bot. 2010, 61, 4449–4459.[CrossRef] [PubMed]
79. Asrar, H.; Hussain, T.; Midhat, S.; Hadi, S.; Gul, B.; Nielsen, B.L.; Khan, M.A. Salinity induced changes inlight harvesting and carbon assimilating complexes of Desmostachya bipinnata (L.) staph. Environ. Exp. Bot.2017, 135, 86–95. [CrossRef]
80. Shah, G.; Jan, M.; Afreen, M.; Anees, M.; Rehman, S.; Daud, M.K.; Malook, I.; Jamil, M. Halophilic bacteriamediated phytoremediation of salt-affected soils cultivated with rice. J. Geochem. Explor. 2017, 174, 59–65.[CrossRef]
81. Possingham, J.V. Plastid replication and development in the life cycle of higher plants. Annu. Rev. Plant Physiol.1980, 31, 113–129. [CrossRef]
82. Plazek, A.; Rapacz, M.; Hura, K. Relationship between quantum efficiency of PSII and cold-induced plantresistance to fungal pathogens. Acta Physiol. Plant. 2004, 26, 141–148.
83. Mehta, P.; Jajoo, A.; Mathur, M.; Bharti, S. Chlorophyll a fluorescence study revealing effects of high saltstress on photosystem II in wheat leaves. Plant Physiol. Biochem. 2010, 48, 16–20. [CrossRef]
84. Kalaji, H.; Rastogi, A.; Živcgk, M.; Brestic, M. Prompt chlorophyll fluorescence as a tool for crop phenotyping:An example of barley landraces exposed to various abiotic stress factors. Photosynthetica 2018. [CrossRef]
85. Yang, D.L.; Lian, J.R.; Ping, C.X.; Wei, L. Quantitative Trait Loci Mapping for Chlorophyll Fluorescence andAssociated Traits in Wheat (Triticum aestivum). J. Integr. Plant Biol. 2007, 49, 646–654. [CrossRef]
86. Li, Z.; Zhang, Y.; Zhang, X.; Merewitz, E.; Peng, Y.; Ma, X.; Yan, Y. Metabolic pathways regulated by chitosancontributing to drought resistance in white clover. J. Proteome Res. 2017, 16, 3039–3052. [CrossRef]
87. Khan, N.; Bano, A.; Rahman, M.A.; Rathinasabapathi, B.; Babar, M.A. UPLC-HRMS-based untargetedmetabolic profiling reveals changes in chickpea (Cicer arietinum) metabolome following long-term droughtstress. Plant Cell Environ. 2019, 42, 115–132. [CrossRef]
88. Egamberdieva, D.; Davranov, K.; Wirth, S.; Hashem, A.; Abd_Allah, E.F. Impact of soil salinity on theplant-growth–promoting and biological control abilities of root associated bacteria. Saudi J. Biol. Sci. 2017,24, 1601–1608. [CrossRef] [PubMed]
89. Prashanth, H.K.V.; Dharmesh, S.M.; Rao, K.S.; Tharanathan, R.N. Free radical-induced chitosandepolymerized products protect calf thymus DNA from oxidative damage. Carbohydr. Res. 2007, 342,190–195. [CrossRef] [PubMed]
90. Malerba, M.; Cerana, R. Chitosan Effects on Plant Systems. Int. J. Mol. Sci. 2016, 23, 996. [CrossRef] [PubMed]91. Sharma, I.P.; Sharma, A.K. Physiological and biochemical changes in tomato cultivar PT-3 with dual
inoculation of mycorrhiza and PGPR against root-knot nematode. Symbiosis 2017, 71, 175–183. [CrossRef]92. Bianco, C.; Defez, R. Medicago truncatula improves salt tolerance when nodulated by an indole-3-acetic
acid-overproducing Sinorhizobium meliloti strain. J. Exp. Bot. 2009, 60, 3097–3107. [CrossRef]93. Foyer, C.H.; Descourvieres, P.; Kunert, K.J. Protection against oxygen radicals: An important defense
mechanism studied in transgenic plants. Plant Cell Environ. 1994, 17, 507–523. [CrossRef]94. Kohler, J.; Caravaca, F.; Roldàn, A. An AM fungus and a PGPR intensify the adverse effects of salinity on the
stability of rhizosphere soil aggregates of Lactuca sativa. Soil Biol. Biochem. 2010, 42, 429–434. [CrossRef]95. Hu, Y.; Yu, W.; Liu, T.; Shafi, M.; Song, L.; Du, X.; Huang, X.; Yue, Y.; Wu, J. Effects of paclobutrazol on cultivars
of Chinese bayberry (Myrica rubra) under salinity stress. Photosynthetica 2017, 55, 443–453. [CrossRef]96. Hayat, R.; Ali, S.; Amara, U.; Khalid, R.; Ahmed, I. Soil beneficial bacteria and their role in plant growth
promotion: A review. Ann. Microbiol. 2010, 60, 579–598. [CrossRef]
© 2020 by the authors. Licensee MDPI, Basel, Switzerland. This article is an open accessarticle distributed under the terms and conditions of the Creative Commons Attribution(CC BY) license (http://creativecommons.org/licenses/by/4.0/).