Defense Acquisition University Determining Management Reserve Using an Integrated Risk Management...
22
Defense Acquisition University Determining Management Reserve Using an Integrated Risk Management Approach International Federation of Operations Research Societies Presented by: Diane Williams, CPA Professor of Acquisition Management July 2005 1
Transcript of Defense Acquisition University Determining Management Reserve Using an Integrated Risk Management...

Defense Acquisition University
Determining Management Reserve Using an Integrated
Risk Management ApproachInternational Federation of
Operations Research Societies
Presented by:Diane Williams, CPA
Professor of Acquisition ManagementJuly 2005
1

Agenda
• Program Overview
• Issue – Budgeting for “Risk”
• Risk Management Overview
• Determining Management Reserve
• Benefits of Methodology
• Keys to Successful Implementation
• Summary
2

Defense System Description
Battery Ops Center
RemoteLauncher
BatteryLauncher
SystemSupportGroup
BatterySupportCenter
LauncherControl System / Comm Relay
RemoteLauncher
Radar
Launcher• HEMTT based• Highly mobile
Missile• Robust capability• Inertially
guided with in-flight updates
• On-board seeker acquires target for endgame homing
Radar• Extensive
detection / coverage
• Robust Discrimination • Target and interceptor track• Hit assessment• In-flight target updates to missile
Target Search
Threat Launcher
Acquisition
Track
Object Tasking
Discrimination
Commit
Acquire Missile
In-FlightUpdatesHoming
Designation
Intercept
Hit Assessment
BM/C3I
• Distributed operation
• Engagement planning & control
• Interoperability
UNCLASSIFIED3

Cost Estimating Issue
Issue: How should dynamic Department of Defense
(DoD) acquisition programs plan & budget for
anticipated program risks?
Proposed Solution: Integrate the technical and schedule risk assessments with the program’s cost estimating model
Schedule Assessment
Cost EstimateTechnical Assessment
5

Program Manager’s Challenge
Cost Risk
Technical Schedule
PM’s Mission:Balance the four major
program areasEffectively.
PM’s Dilemma:Fixed or increasing requirements
for technical, schedule, & cost performance are increasing program risk.
Technical• Fixed Requirements• Reducing technical
tasks dueto funding
Schedule• Complete flights• Begin Production• Field the system
Cost• Unstable
funding• Cost
Reduction & trade offpressures
Risk
Where is the tradespace?
Challenge: How to estimate the potential cost growth due to risk factors; especially challenging for DoD because of the long budget cycle
6

Risk Exposure Matrix
Risk Management Objectives
Risk Management
• Risk can be described as the possibility of an undesirable event
• RISK = Probability (Pf) + Consequence (Cf)
• Probability describes the likelihood of the event occurring
• Consequence denotes the magnitude of loss
• Program manager prioritizes dollars to mitigate risk
What is Risk & Risk Management
Risk Management Process
• Identify Program risks early to ensure appropriate mitigation
• Provide a decision making tool
• Provide a basis for management actions: balancing system, award fee criteria, management reserve application
• Provide a tracking and reporting system
RiskIdentification
Risk OptionsOptimize Return
on $Risk
Analysis
RiskHandling
IndependentResearch and
Analysis
RiskAssessment
Continuous Process
IncrementalRisk Mitigation
Approach
Simulations, Models & Lethality
Analysis
Low Impact Risks are Monitored
Revised Program
Risk Assessment
External: Factors Outside of the Organization’s Control- Funding - Safety Hazards- Treaties/Politics/Threat - Defense Industrial Base- Obsolescence - Environmental Considerations- Technology Insertion - Compressed Schedules
Internal: Factors Within an Organization’s Control- Design Stability - Prototype Re-work- Quality Control - Manufacturing Process- Shelf Lives - Increased Testing- Cost Growth Management – Experience Base
Types of Risk
Technical
Cost
Schedule
7
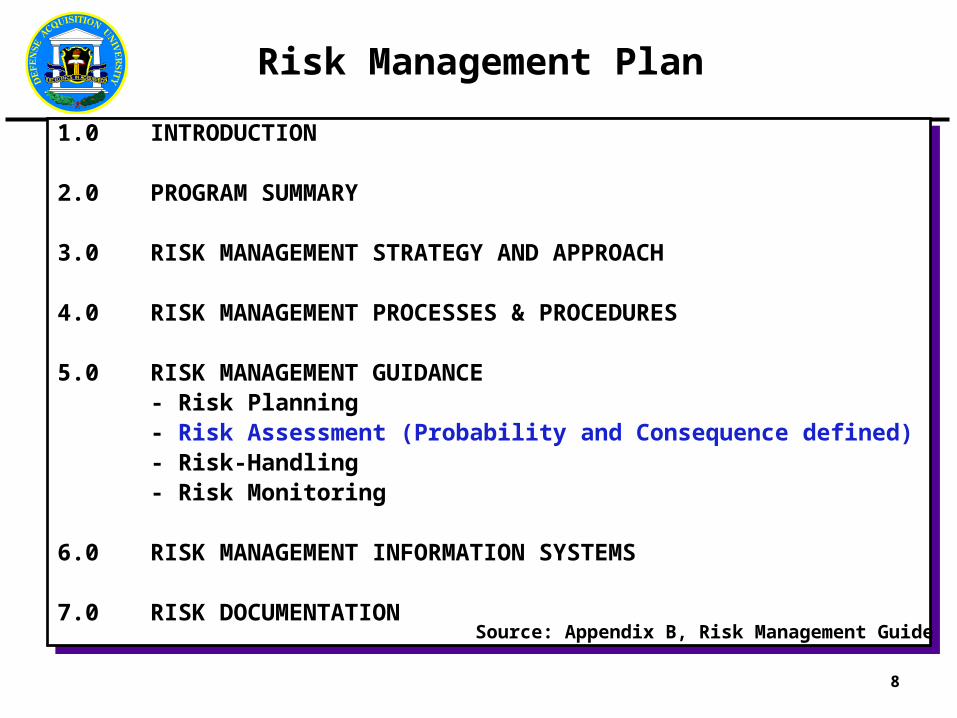
1.0 INTRODUCTION
2.0 PROGRAM SUMMARY
3.0 RISK MANAGEMENT STRATEGY AND APPROACH
4.0 RISK MANAGEMENT PROCESSES & PROCEDURES
5.0 RISK MANAGEMENT GUIDANCE- Risk Planning - Risk Assessment (Probability and Consequence defined)- Risk-Handling- Risk Monitoring
6.0 RISK MANAGEMENT INFORMATION SYSTEMS
7.0 RISK DOCUMENTATION
1.0 INTRODUCTION
2.0 PROGRAM SUMMARY
3.0 RISK MANAGEMENT STRATEGY AND APPROACH
4.0 RISK MANAGEMENT PROCESSES & PROCEDURES
5.0 RISK MANAGEMENT GUIDANCE- Risk Planning - Risk Assessment (Probability and Consequence defined)- Risk-Handling- Risk Monitoring
6.0 RISK MANAGEMENT INFORMATION SYSTEMS
7.0 RISK DOCUMENTATION Source: Appendix B, Risk Management Guide
Risk Management Plan
8

Risk Methodology - Probability
PROBABILITY RISK FACTOR RISK CATEGORY
COST VERY HIGH (81-100%)
Major uncertainties exist related to the scope /definition of the item to be estimated. Highly complex HW and SW. Achievement of cost estimate may be highly dependent on the success of other program, contractor, or government activities. Software application represents new development and no legacy can be applied to SLOC (source lines of code) estimation process.
HIGH (61-80%)
Cost estimate based on uncertainties in scope/definition of the item. Significant increase in complexity, major increase in software modules. Achievement of cost estimate may depend significantly on the success of other program, contractor, or government activities. Software application now represents new development and very little legacy can be applied to SLOC estimation process.
MODERATE (41-60%)
Results from a cost model in which the estimate is feasible and the scope of the system is adequate. Moderate increase in HW and SW complexity and/or performance requirements. Achievement of cost estimates may be dependent on the success of other program, contractor or government activities. SLOC estimates based on very little appropriate legacy and no prototyping activity.
LOW (21-40%)
Item cost estimate based on, or extrapolated from program actuals or supplier information for a very similar item that is already in production. Minor increase in HW and SW complexity or performance requirements. Achievement of cost estimate may be slightly dependent on the success of other program, contractor or government activities, SLOC estimates based on some appropriate legacy and minimal prototyping activity.
VERY LOW (1-20%)
Cost estimate based on vendor quotes for a well defined item, an off the shelf item or a catalog price for an item. No hardware or software change is required. Achieving cost estimates is independent of the success of any other efforts, SLOC estimates are based on significant legacy and prototyping activity.
P(f) based on:
• Basis of Estimate
• Results of Technical Risk Assessment 9

Cost Impact of “Penalty Factors”
0%
10%
20%
30%
40%
50%
60%
70%
80%
90%
100%
0.6 0.8 1 1.2 1.4 1.6 1.8 2 2.2 2.4 2.6 2.8
Factor ($M)
Prob
abili
ty
LOW MEDIUM HIGH HIGH (1.20) HIGH (1.40)
• Use ACEIT cost model to define the Cost Consequence• Apply penalty factors in ACEIT to determine a range of cost outcomes
No Risk Estimate
10

Risk Methodology - Consequence
C(f) Unique
• Defined in terms of the Engineer’s Work Breakdown Structure (WBS)
• Specific ranges defined in ACEIT (cost estimating model)
• Can be tailored for any program
Consequence Rating
Performance Factor Criteria
Schedule Factor Criteria
Cost Factor Criteria
Very high (5)
Issue will result in up to a 50% cost growth over the amount budgeted. Variances over 50% should be addressed in a narrative description.
High (4) Issue will result in up to a 36% cost growth over the amount budgeted for that WBS.
Moderate (3)
Issue will result in 17-23% cost growth over the amount budgeted for that WBS.
Low (2)
Issue will result in 11-16% cost growth over the amount budgeted for that WBS.
Very Low (1)
Item is expected to stay within budget, with no more than a 10% cost growth to the amount budgeted for that WBS.
NOTE: Tailor Definitions to match the cost model & expected overrun range.
11
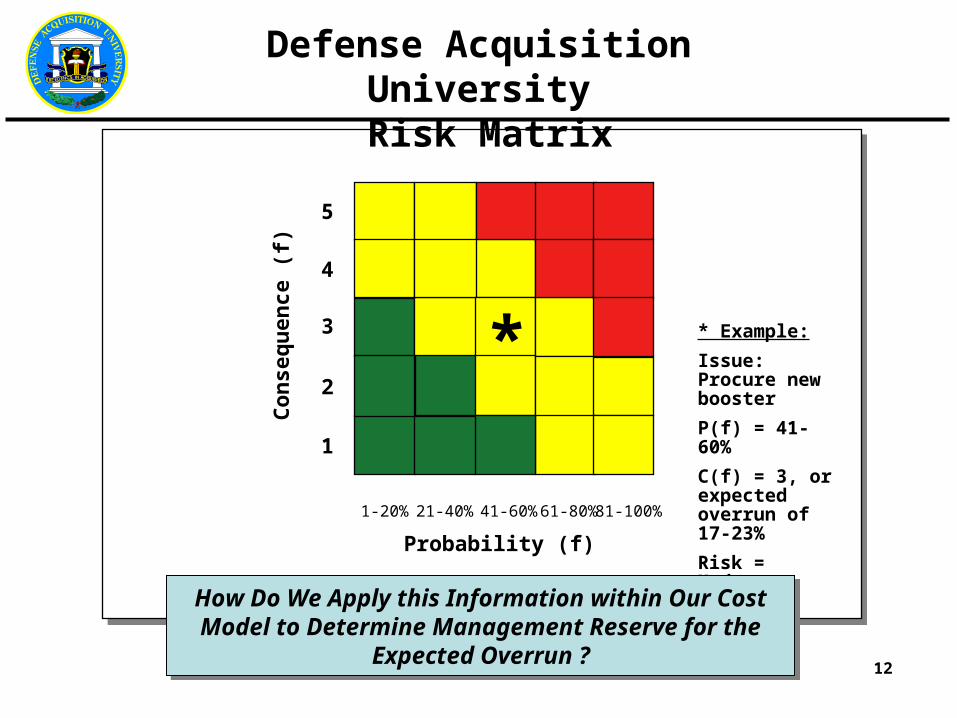
Defense Acquisition University Risk Matrix
Probability (f)
Con
sequ
ence
(f)
5
4
3
2
1
1-20% 21-40% 41-60% 61-80% 81-100%
* Example:
Issue: Procure new booster
P(f) = 41-60%
C(f) = 3, or expected overrun of 17-23%
Risk = Moderate
How Do We Apply this Information within Our Cost Model to Determine Management Reserve for the Expected Overrun ?How Do We Apply this Information within Our Cost Model to Determine Management Reserve for the Expected Overrun ?
*
12

Proposed “Risk Exposure” Matrix
Probability (f)
Con
sequ
ence
(f)
5
4
3
2
1
1 2 3 4 5
2 3 4 5 6
3 4 5 6 7
4 5 6 7 8
5 6 7 8 9
6 7 8 9 10
1-20% 21-40% 41-60% 61-80% 81-100%
Previous Example:
Procuring a new booster
P(f) = 41-60%, or 3
C(f) = 3, then
Risk Exposure =
P(f)3 + C(f) = 6
Risk Exposure = C(f) + P(f)Provides Input To Cost Model and Basis for Prioritizing Risk
Risk Exposure = C(f) + P(f)Provides Input To Cost Model and Basis for Prioritizing Risk
Percentages were normalized to a 1-5 scale
13

Boosters – Cost estimating
3 Booster DesignsWith Similar:•Thrust•Weight•Mission
Should we use the same parametric cost estimating relationship (CER) for all three?
Low RiskRisk Exp = 3
Low-Moderate RiskRisk Exp = 5
Moderate-High RiskRisk Exp = 8 14

Cost Impact of Risk Ratings
0%
10%
20%
30%
40%
50%
60%
70%
80%
90%
100%
0.6 0.8 1 1.2 1.4 1.6 1.8 2 2.2 2.4 2.6 2.8
Factor ($M)
Prob
abili
ty
LOW MEDIUM HIGH HIGH (1.20) HIGH (1.40)
2-3 4-5 6-7 8-9 10
Risk Exposure
• Cost curves used to define cost c(f) ranges• Directly relates the rater’s cost assessment with
the cost model results to determine budgets• Result: Budgets match Risk Level for each• Final Step: Re-assess acquisition strategy using
cost-benefit analysisBudget:• No Risk = $1.0M• Low Risk (3) = $1.1M• Low-Moderate Risk (5) = $1.175M• Moderate-High Risk (8) = $1.36M
No Risk Estimate
15
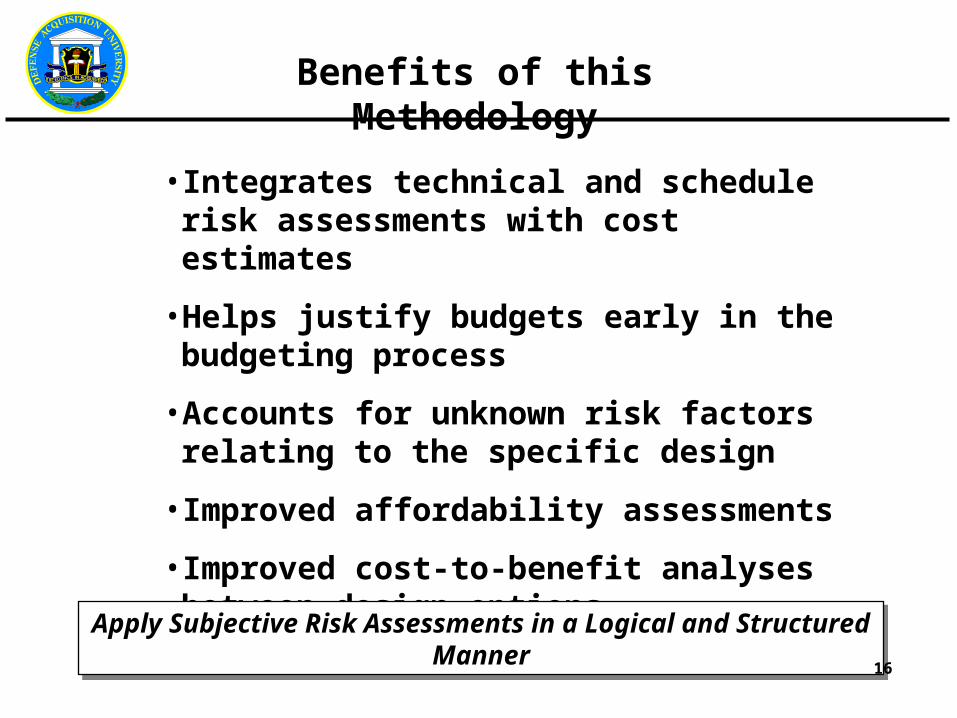
Benefits of this Methodology
• Integrates technical and schedule risk assessments with cost estimates
• Helps justify budgets early in the budgeting process
• Accounts for unknown risk factors relating to the specific design
• Improved affordability assessments
• Improved cost-to-benefit analyses between design options
Apply Subjective Risk Assessments in a Logical and Structured MannerApply Subjective Risk Assessments in a Logical and Structured Manner
16

Keys to Success
• Quality of assessment – Subject Experts and Basis of Assessments
• Any risk methodology must be used carefully
– Analysis is a must to see if the cost & schedule effects are compounding or mutually exclusive; is there an overlapping effect?
– Prioritizing risk mitigation resources requires careful consideration
• Properly define cost consequence to represent cost model results
• Identifying areas at the program level, not associated with a WBS
• Ability to justify and time-phase management reserve in the PPBE budget process
Apply Subjective Risk Assessments in a Logical and Structured MannerApply Subjective Risk Assessments in a Logical and Structured Manner
17

Summary
• Programs face many challenges fielding new systems
• Proposed approach builds on DoD 5000 & DAU risk methodology; helps PM balance competing requirements
• Risk exposure value is easily understood, allows prioritization of risks, and is a direct input for the cost model
• Determining management reserve will help DoD, services, and programs do more realistic affordability studies
Integrating Technical, Schedule, & Cost Assessments will Improve the Budgeting Forecasts & Provide a Valuable Decision Making ToolIntegrating Technical, Schedule, & Cost Assessments will Improve
the Budgeting Forecasts & Provide a Valuable Decision Making Tool
18

Questions & Answers
19

Author Biography
Diane Williams, GS-1101-15Professor of Acquisition ManagementDefense Acquisition University (DAU)
EducationBS degree, majors in: Math, Business, and Accounting – B’ham-Southern CollegeMaster of Arts degree in Financial Accounting - University of AlabamaSBLM Program - Army Management Staff College
Acquisition CertificationsCertified Public Accountant - 17 years Level III in Program ManagementLevel III in Business, Cost Estimating, & Financial ManagementLevel III in Systems Planning, Research, Development & EngineeringLevel II in Auditing
Work Experience3 years as Professor of Acquisition Management at DAU12 years in Program Management for Acquisition Category ID Programs2 years in South Central Bell Headquarters - Financial Strategies & Taxes2 years in Public Accounting - Price Waterhouse & KPMG Peat Marwick
20

DoD Risk Management Policy
DoD Directive 5000.1, The Defense Acquisition System, 12 May 2003
• Program risks and risk management plans shall be explicitly assessed at each milestone decision point
• Solicitation documents shall require contractors to identify risk and specify plans to assess and eliminate risks or reduce them to acceptable levels
• Program managers provide assessments of program status and risk in all presentations to higher authorities
DoD Directive 5000.2, Operation of the Defense Acquisition System, 12 May 2003
• A risk management program shall be established for each acquisition program to identify and control performance, cost, and schedule risks
• Industry participation in risk management is essential
21
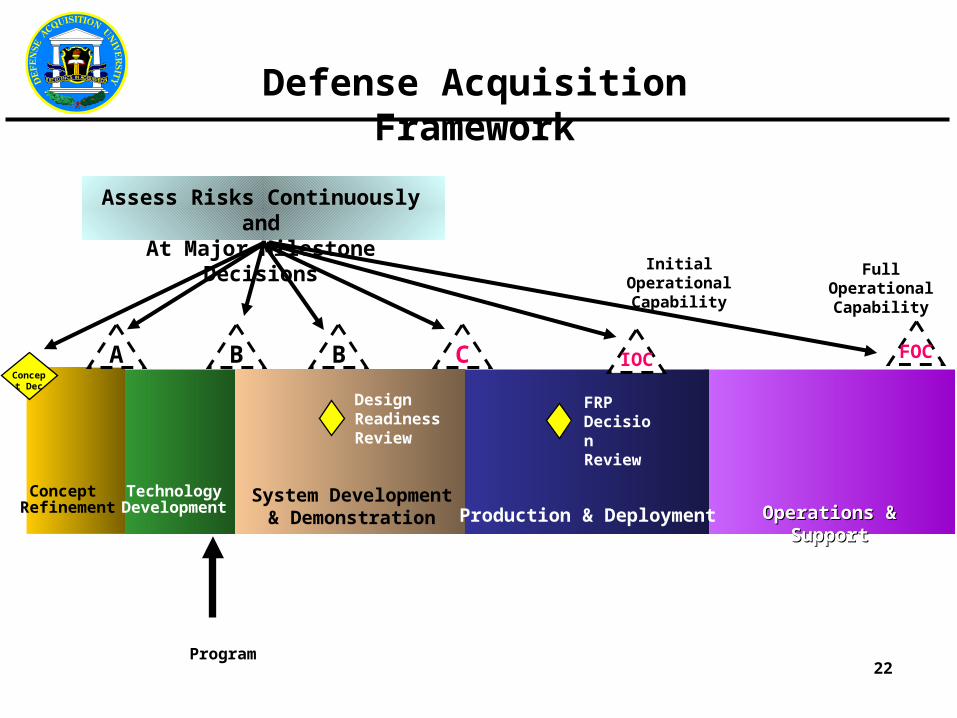
InitialOperationalCapability
B
System Development& Demonstration Production & Deployment Operations & SupportOperations & Support
Assess Risks Continuously andAt Major Milestone Decisions
Concept Refinement
TechnologyDevelopment
DesignReadinessReview
FRPDecisionReview
A B CConcept
Dec
IOC
FullOperationalCapability
FOC
Defense Acquisition Framework
Program22
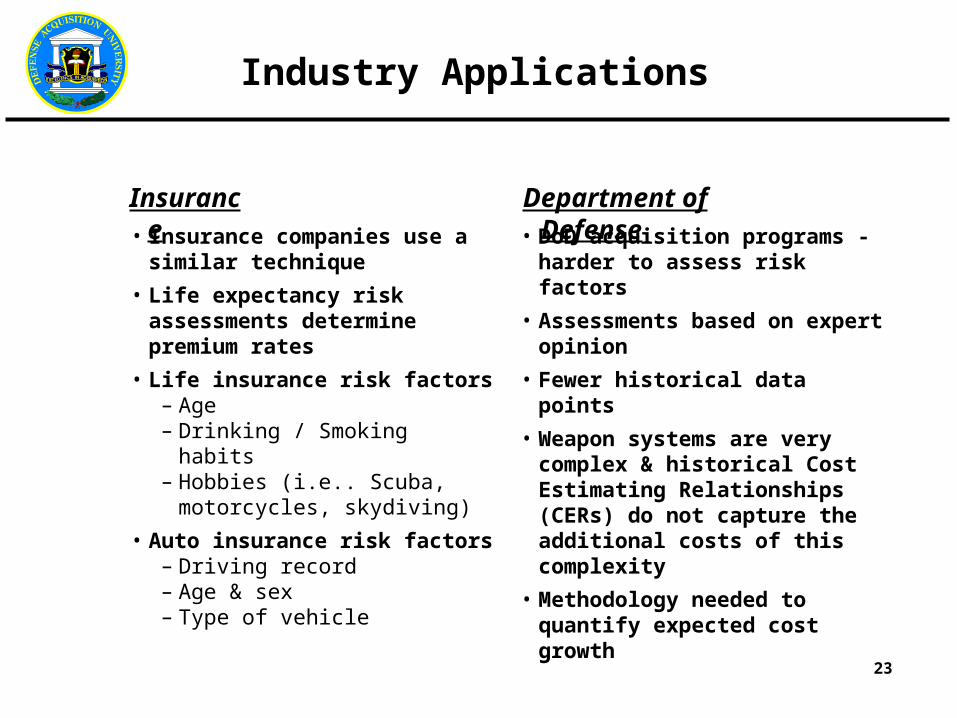
Industry Applications
• Insurance companies use a similar technique
• Life expectancy risk assessments determine premium rates
• Life insurance risk factors– Age– Drinking / Smoking habits– Hobbies (i.e.. Scuba, motorcycles,
skydiving)• Auto insurance risk factors
– Driving record– Age & sex– Type of vehicle
Insurance• DoD acquisition programs - harder to
assess risk factors
• Assessments based on expert opinion
• Fewer historical data points
• Weapon systems are very complex & historical Cost Estimating Relationships (CERs) do not capture the additional costs of this complexity
• Methodology needed to quantify expected cost growth
Department of Defense
23