Defects in 2021 Aluminum Alloy Welds - American...
9
Defects in 2021 Aluminum Alloy Welds Test results show a linear relationship between fracture strength and projected defect area in gas tungsten-arc welds BY THOMAS M. MORTON ABSTRACT. Tests have been conducted on 2021 aluminum alloy gas tungsten-arc weldments to determine the effect of de- fect size and distribution on fracture strength. The information may be used to scientifically develop weld accept/reject criteria. The data show that weld frac- ture strength decreases linearly with in- creasing projected defect area. The linear decrease is shown to be secondarily de- pendent on defect root radius. It is also demonstrated that strength depends on neither percent defective area nor net section stress. The spacing determined for two or more defects to act inde- pendently is three diameters. Introduction Objective The objective of this study is to characterize flaw behavior in 2021 aluminum alloy weldments at stresses approaching ultimate strength. Specifi- cally, static fracture behavior was evaluated in the presence of preexist- ing flaws of various geometries mod- elling weld defects. Background The fracture process in metallic materials consists of two stages. The first stage is crack nucleation; the second stage is a growth period wherein the crack enlarges. 1 The an- alysis of numerous metal pressure ves- sel failures have shown the origin to be preexisting flaws. Many of these tanks failed at stresses below the yield strength or had service lives shorter than expected for properly designed and manufactured tanks. These pre- mature tank failures exemplify the second stage of the fracture process, i.e., failure resulting from the exten- sion of an existing flaw. Flaws or defects are not an uncom- mon occurrence in welded pressure THOMAS M. MORTON is Senior Scientist. Lockheed Palo Alto Research Laboratory, Palo Alto. Calif. Paper presented at AIME-TMS Fall Meet- ing held in Cleveland. Ohio, during Oct. 19-22. 1970. vessels. They can occur during materi- al processing or tank fabrication and are usually in the form of gouges, scratches, or pits in the surface of the base metal; and as surface or subsur- face cracks, undercut, porosity, or in- clusions in the welds. Nondestructive inspection techniques can be employed to screen the structural components of a completed vessel for defects. When defects considered to be detrimental are detected, repairs can be at- tempted. If repair is not a practical remedy, the tank may have to be scrapped. While the application of these procedures will serve to detect and eliminate some of the salient de- fects, the fact remains that many de- fects can and do go undetected. Since it is not possible to guarantee a fabricated pressure vessel complete- ly free of initial flaws and defects, it is necessary to assess the vessel's ability to meet or exceed its service require- ments. Most pressure vessels must "guarantee" a minimum burst strength. Clearly, all vessels cannot be tested to verify this guaranteed burst strength. A small number of vessels are selected, therefore, to be pressurized to failure as examples that the design and fabri- cation procedures followed in vessel production result in a pressure vessel of the required strength. If these test vessels meet or exceed the burst strength requirement, and the same de- sign and fabrication procedures are followed on other vessels, the other vessels are assumed to likewise meet or exceed the burst strength require- ment. An important decision must be made regarding weld defects and their effect on the burst strength. Ideally, no defects are desired in a weld. Practically, defects are present and detectable in a weld. Economically, weld repairs are undesirable. There- fore, criteria are needed to determine when weld repair is essential to meet- ing the required burst strength, and when repair is not required to meet the burst strength. Fracture mechanics, per se, is of little use in developing weld defect accept-reject criteria—where that criteria must be based on the required burst strength (near the ultimate). The required burst strength in the case of the vessel studied by the author is 38 ksi; the weld accept-reject criteria are based on meeting a fracture stress of 41 ksi. Since these stress levels are well above the weldment yield strength (~ 32 ksi), it is expected that fracture mechanics cannot be di- rectly applied. However, some frac- ture mechanics concepts may be use- ful in interpretation of test results. Actual weld defects are typically nearly spherical pores. The "worst- case" approach of fracture mechanics —where a sharp crack is used—may provide an intolerable amount of con- servatism in the development of weld defect accept-reject criteria. Therefore, the most useful means of developing a sound accept-reject criteria is to perform laboratory tests on weldments containing defects of known sizes, shapes, and distribution. Through a correlation of the fac- tors known to determine fracture stress (from fracture mechanics tech- nology), a quantitative means of ac- cepting or rejecting a flaw detected in a vessel weld can be developed. The principal factors which will determine fracture stress are: 1. Defect dimension parallel to. and normal to, the surface. 2. Defect root radius of curvature. 3. Distance between defects. 4. Defect location in the weld with respect to the fusion line. The simplest means of controlling the pertinent variables is to introduce the weld defects by mechanical means. Thus, by evaluation of test specimens containing mechanically in- troduced weld defects, a technically sound weld accept-reject criteria can be developed. The vessel to which the findings of 304-s j JULY 1971
Transcript of Defects in 2021 Aluminum Alloy Welds - American...
Defects in 2021 Aluminum Alloy Welds
Test results show a linear relationship between fracture strength and projected defect area in gas tungsten-arc welds
BY T H O M A S M. M O R T O N
ABSTRACT. Tests have been conducted on 2021 aluminum alloy gas tungsten-arc weldments to determine the effect of defect size and distribution on fracture strength. The information may be used to scientifically develop weld accept/reject criteria. The data show that weld fracture strength decreases linearly with increasing projected defect area. The linear decrease is shown to be secondarily dependent on defect root radius. It is also demonstrated that strength depends on neither percent defective area nor net section stress. The spacing determined for two or more defects to act independently is three diameters.
Introduction Objective
The objective of this study is to characterize flaw behavior in 2021 aluminum alloy weldments at stresses approaching ultimate strength. Specifically, static fracture behavior was evaluated in the presence of preexisting flaws of various geometries modelling weld defects.
Background
The fracture process in metallic materials consists of two stages. The first stage is crack nucleation; the second stage is a growth period wherein the crack enlarges.1 The analysis of numerous metal pressure vessel failures have shown the origin to be preexisting flaws. Many of these tanks failed at stresses below the yield strength or had service lives shorter than expected for properly designed and manufactured tanks. These premature tank failures exemplify the second stage of the fracture process, i.e., failure resulting from the extension of an existing flaw.
Flaws or defects are not an uncommon occurrence in welded pressure
THOMAS M. MORTON is Senior Scientist. Lockheed Palo Alto Research Laboratory, Palo Alto. Calif.
Paper presented at AIME-TMS Fall Meeting held in Cleveland. Ohio, during Oct. 19-22. 1970.
vessels. They can occur during material processing or tank fabrication and are usually in the form of gouges, scratches, or pits in the surface of the base metal; and as surface or subsurface cracks, undercut, porosity, or inclusions in the welds. Nondestructive inspection techniques can be employed to screen the structural components of a completed vessel for defects. When defects considered to be detrimental are detected, repairs can be attempted. If repair is not a practical remedy, the tank may have to be scrapped. While the application of these procedures will serve to detect and eliminate some of the salient defects, the fact remains that many defects can and do go undetected.
Since it is not possible to guarantee a fabricated pressure vessel completely free of initial flaws and defects, it is necessary to assess the vessel's ability to meet or exceed its service requirements. Most pressure vessels must "guarantee" a minimum burst strength. Clearly, all vessels cannot be tested to verify this guaranteed burst strength. A small number of vessels are selected, therefore, to be pressurized to failure as examples that the design and fabrication procedures followed in vessel production result in a pressure vessel of the required strength. If these test vessels meet or exceed the burst strength requirement, and the same design and fabrication procedures are followed on other vessels, the other vessels are assumed to likewise meet or exceed the burst strength requirement.
An important decision must be made regarding weld defects and their effect on the burst strength. Ideally, no defects are desired in a weld. Practically, defects are present and detectable in a weld. Economically, weld repairs are undesirable. Therefore, criteria are needed to determine when weld repair is essential to meeting the required burst strength, and when repair is not required to meet
the burst strength. Fracture mechanics, per se, is of
little use in developing weld defect accept-reject criteria—where that criteria must be based on the required burst strength (near the ultimate). The required burst strength in the case of the vessel studied by the author is 38 ksi; the weld accept-reject criteria are based on meeting a fracture stress of 41 ksi. Since these stress levels are well above the weldment yield strength ( ~ 32 ksi), it is expected that fracture mechanics cannot be directly applied. However, some fracture mechanics concepts may be useful in interpretation of test results.
Actual weld defects are typically nearly spherical pores. The "worst-case" approach of fracture mechanics —where a sharp crack is used—may provide an intolerable amount of conservatism in the development of weld defect accept-reject criteria.
Therefore, the most useful means of developing a sound accept-reject criteria is to perform laboratory tests on weldments containing defects of known sizes, shapes, and distribution.
Through a correlation of the factors known to determine fracture stress (from fracture mechanics technology), a quantitative means of accepting or rejecting a flaw detected in a vessel weld can be developed. The principal factors which will determine fracture stress are:
1. Defect dimension parallel to. and normal to, the surface.
2. Defect root radius of curvature. 3. Distance between defects. 4. Defect location in the weld with
respect to the fusion line. The simplest means of controlling
the pertinent variables is to introduce the weld defects by mechanical means. Thus, by evaluation of test specimens containing mechanically introduced weld defects, a technically sound weld accept-reject criteria can be developed.
The vessel to which the findings of
304-s j J U L Y 1 9 7 1
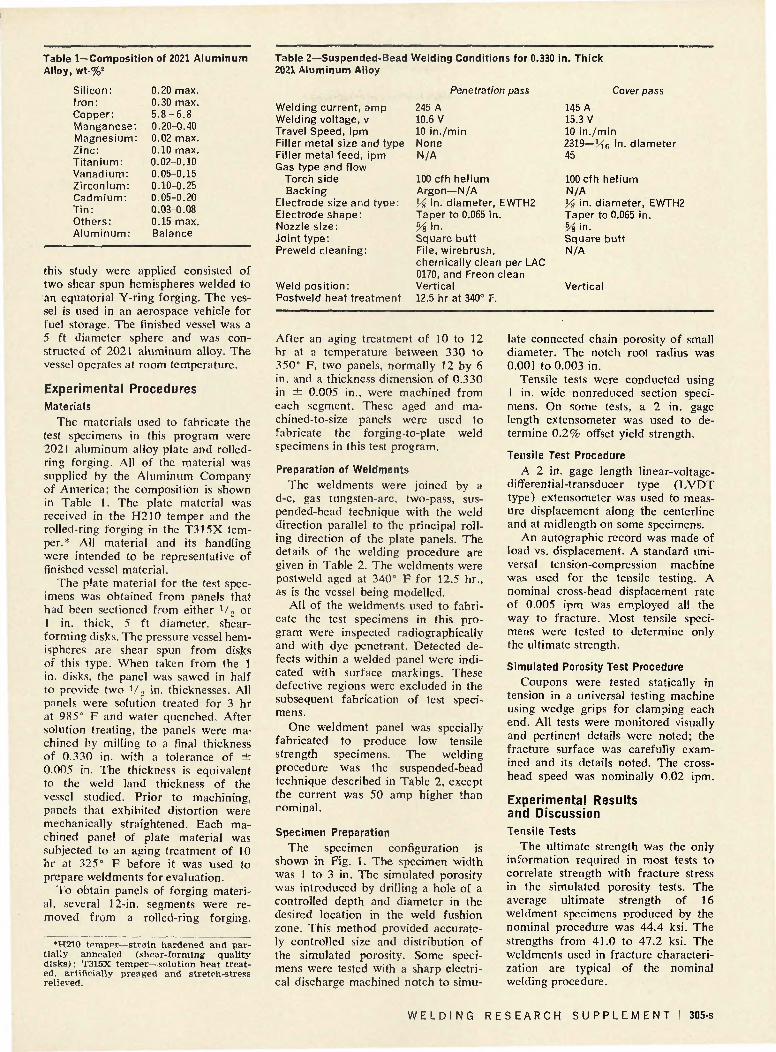
Table 1—Composition of 2021 Aluminum Alloy, wt-%2
Silicon: Iron: Copper: Manganese: Magnesium: Zinc: Titanium: Vanadium: Zirconium: Cadmium: Tin: Others: Aluminum:
0.20 max. 0.30 max. 5.8-6.8 0.20-0.40 0.02 max. 0.10 max. 0.02-0.10 0.05-0.15 0.10-0.25 0.05-0.20 0.03-0.08 0.15 max. Balance
this study were applied consisted of two shear spun hemispheres welded to an equatorial Y-ring forging. The vessel is used in an aerospace vehicle for fuel storage. The finished vessel was a 5 ft diameter sphere and was constructed of 2021 aluminum alloy. The vessel operates at room temperature.
Experimental Procedures Materials
The materials used to fabricate the test specimens in this program were 2021 aluminum alloy plate and rolled-ring forging. All of the material was supplied by the Aluminum Company of America; the composition is shown in Table 1. The plate material was received in the H210 temper and the rolled-ring forging in the T315X temper.* All material and its handling were intended to be representative of finished vessel material.
The plate material for the test specimens was obtained from panels that had been sectioned from either V 2 or 1 in. thick. 5 ft diameter, shear-forming disks. The pressure vessel hemispheres are shear spun from disks of this type. When taken from the 1 in. disks, the panel was sawed in half to provide two V 2 in. thicknesses. All panels were solution treated for 3 hr at 985° F and water quenched. After solution treating, the panels were machined by milling to a final thickness of 0.330 in. with a tolerance of ± 0.005 in. The thickness is equivalent to the weld land thickness of the vessel studied. Prior to machining, panels that exhibited distortion were mechanically straightened. Each machined panel of plate material was subjected to an aging treatment of 10 hr at 325° F before it was used to prepare weldments for evaluation.
To obtain panels of forging material, several 12-in. segments were removed from a rolled-ring forging.
Table 2—Suspended-Bead Welding Conditions for 0.330 2021 Aluminum Alloy
Weld ing current , amp Weld ing vol tage, v Travel Speed, ipm Fil ler meta l size and type Fi l ler meta l f eed , ipm Gas type and f low
Torch side Back ing
Electrode size and t ype : Electrode shape: Nozzle s ize : Jo in t t ype : Preweld c lean ing :
Weld pos i t ion : Postweld heat t r ea tmen t
Penetration
245 A 10.6 V 10 i n . /m in None N/A
100 cfh he l i um Argon—N/A
pass
Y% in . d iameter , EWTH2 Taper to 0.065 in . % i n . Square bu t t File, w i reb rush , chemica l l y clean 0170, and Freon cl Vert ical 12.5 hr at 340° F.
per LAC ean
in. Thick
Cover pass
145 A 15.3 V 10 i n . /m in 2319— l f 6 in . d iamete r 45
100 c fh he l i um N/A ys in . d iameter , EWTH2 Taper to 0.065 in . Vs in . Square bu t t N/A
Vert ical
•H210 temper—strain hardened and partially annealed (shear-forming quality disks); T315X temper—solution heat treated, artificially preaged and stretch-stress relieved.
After an aging treatment of 10 to 12 hr at a temperature between 330 to 350° F, two panels, normally 12 by 6 in. and a thickness dimension of 0.330 in ± 0.005 in., were machined from each segment. These aged and ma-chined-to-size panels were used to fabricate the forging-to-plate weld specimens in this test program.
Preparation of Weldments The weldments were joined by a
d-c, gas tungsten-arc, two-pass, suspended-bead technique with the weld direction parallel to the principal rolling direction of the plate panels. The details of the welding procedure are given in Table 2. The weldments were postweld aged at 340° F for 12.5 hr., as is the vessel being modelled.
All of the weldments used to fabricate the test specimens in this program were inspected radiographically and with dye penetrant. Detected defects within a welded panel were indicated with surface markings. These defective regions were excluded in the subsequent fabrication of test specimens.
One weldment panel was specially fabricated to produce low tensile strength specimens. The welding procedure was the suspended-bead technique described in Table 2, except the current was 50 amp higher than rominal.
Specimen Preparation The specimen configuration is
shown in Fig. 1. The specimen width was 1 to 3 in. The simulated porosity was introduced by drilling a hole of a controlled depth and diameter in the desired location in the weld fushion zone. This method provided accurately controlled size and distribution of the simulated porosity. Some specimens were tested with a sharp electrical discharge machined notch to simu
late connected chain porosity of small diameter. The notch root radius was 0.001 to 0.003 in.
Tensile tests were conducted using 1 in. wide n on reduced section specimens. On some tests, a 2 in. gage length extensometer was used to determine 0.2% offset yield strength.
Tensile Test Procedure
A 2 in. gage length linear-voltage-differential-transducer type (LVDT type) extensometer was used to measure displacement along the centerline and at midlength on some specimens.
An autographic record was made of load vs. displacement. A standard universal tension-compression machine was used for the tensile testing. A nominal cross-head displacement rate of 0.005 ipm was employed all the way to fracture. Most tensile specimens were tested to determine only the ultimate strength.
Simulated Porosity Test Procedure Coupons were tested statically in
tension in a universal testing machine using wedge grips for clamping each end. All tests were monitored visually and pertinent details were noted; the fracture surface was carefully examined and its details noted. The cross-head speed was nominally 0.02 ipm.
Experimental Results and Discussion Tensile Tests
The ultimate strength was the only information required in most tests to correlate strength with fracture stress in the simulated porosity tests. The average ultimate strength of 16 weldment specimens produced by the nominal procedure was 44.4 ksi. The strengths from 41.0 to 47.2 ksi. The weldments used in fracture characterization are typical of the nominal welding procedure.
W E L D I N G R E S E A R C H S U P P L E M E N T I 305-s
APPLIED TENSILE LOAD
i ,
REPRESENTATIVE LOCATION OF WELD '/.ONE. (NOTCH AT WELD CENTERLINE ILLUSTRATED)
APPLIED TENSILE STRESS
PLAN VIEW OF A WELD DEFECT
SECTION THROUGH ABOVE DEFECT (I.e., SHOWING THE POTENTIAL FRACTURE SURFACE)
A~DX
Fig. 1—Simulated weld defect specimen. The flaw illustrated may be a notch or a drilled hole. Tensile test specimens contained no simulated weld defect
Fig. 2—Sketch showing weld defect orientation and the notation used
In tensile tests of permissable current variation for the weld procedure.
+ 10 amp resulted in an average strength of 42.1 ksi (8 tests); - 1 0
48
« ~-
46
45
GROSS SECTION FRACTURE STRESS
44 -
°gim 4 3_
42 -
41
—'
*"
-
—
—
0 o
A 2 Q
0
$
0
• A
0
DEPTH (X )
X - D X - 2D
8
a A
$
= D/2
X = THROUGH THICKNESS
1 1 1 1
0
O
•
D
A
0 A
0
1 1 1 40 60 80
HOLE DIAMETER,
100
D (IO"3 In.)
120 140
Fig. 3—Data showing the effect of hole diameter on fracture stress in 0.33 in. thick 2021 aluminum welds. The holes are located at the center-line of the weld. No correlation is obvious
amp resulted in an average strength of 45.0 ksi (12 tests). The range was from 40.2 ( - 1 0 amp) to 47.4 ( + 10 amp) ksi. All specimens had less than the maximum permissable mismatch (0.03 in).
The average 0.2% offset yield strength in a suspended bead weldment is 32 ksi (9 tests), measured with a 2 in. gage length extensometer. Earlier measurements with a Vic m -gage length foil gage indicated the 0.2% offset yield strength was as low as 24 ksi in the weld fusion zone itself.-''- *
An important point is that all the nominal procedure tensile specimens fracture in the near heat-affected zone, approximately 0.005 to 0.010 in. from the fushion line. This region contains an apparently brittle intermetallic compound in the grain boundaries and is the region of lowest toughness.-"^5 When there is no post-weld aging treatment, fracture occurs in the weld nugget.5
Effect of Weld Defects on Fracture Stress in a 2021 Aluminum Weld
Effect of Single Defects on Weld Fracture Stress. The objective of this task was to assess the effect of mechanically introduced flaws (modeling porosity) on the ultimate tensile strength of 2021 weldments. Specifi-cally, the difference in fracture strength, if any, between welds containing a sharp crack and welds containing a
306-s I JU LY 1971
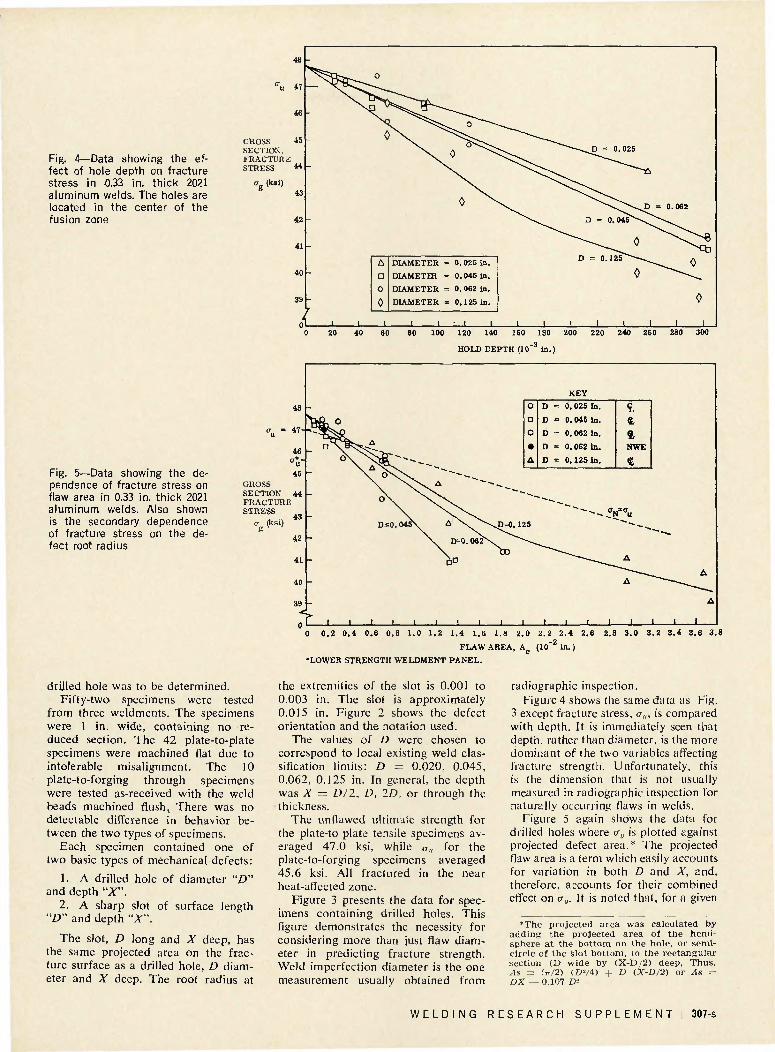
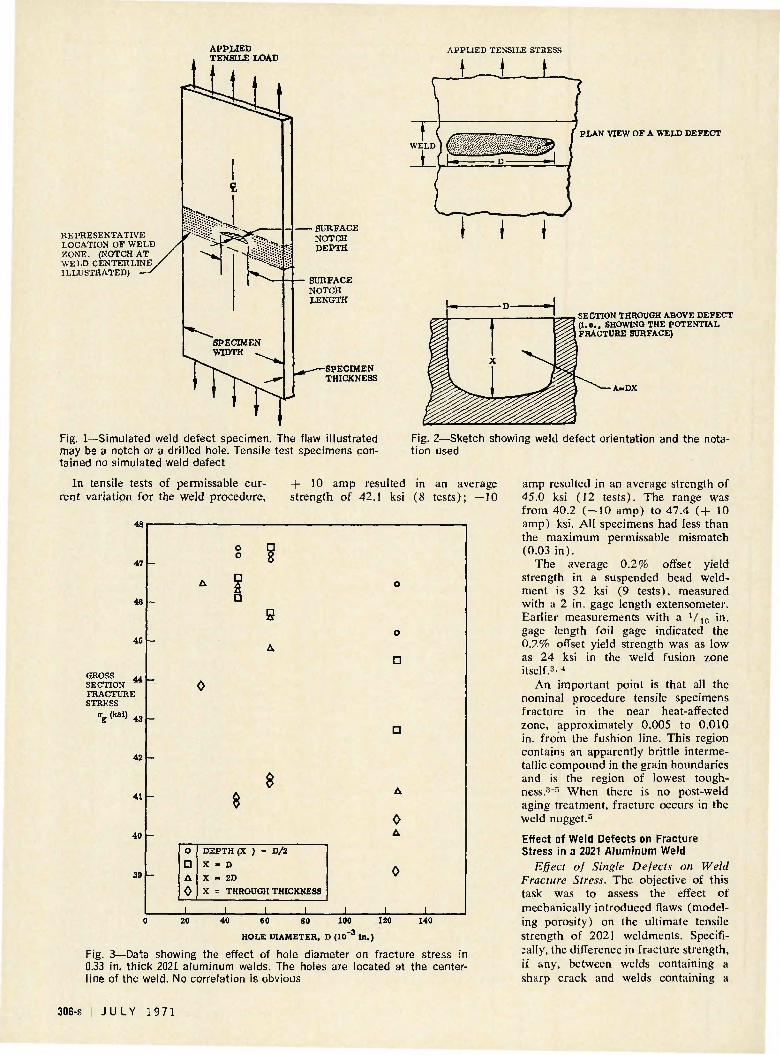
Fig. A—Data showing the effect of hole depth on fracture stress in 0.33 in. thick 2021 aluminum welds. The holes are located in the center of the fusion zone
Fig. 5—Data showing the dependence of fracture stress on flaw area in 0.33 in. thick 2021 aluminum welds. Also shown is the secondary dependence of fracture stress on the defect root radius
cr u
GROSS SECTION, FRACTURE STRESS
"g (ksi)
48
47
46
45
44
43
42
41
40
39
-
ol J - 1
0
> ^ ^ ^ 5 ^ ^ 0^~~~~-0 \ ^ ^ 5 ^
\ o \ > .
\ . 0 ^
0 ^
A
n o 0
DIAMETER = 0.025 in.
DIAMETHt = 0.045 in.
DIAMETER = 0. 062 in.
DIAMETER = 0.125 in.
i i I I i
v. , — \ D = 0.025
\ ^^-^^-5 " ^ • ^ ^ D = 0 . 0 4 5 ^ ^ ^
^ ^ ^ ^ \ 0 D = 0 . 1 2 ! ^ - ^ ^
0
= 0.062
~ ^ \ 0
0
1 1
80 100 120 140 160 180 200
HOLD DEPTH (IO-3 in.)
240 260 280 300
GROSS SECTION FRACTUR STRESS
o- (ksi)
48
47-
46 < 7 * -
u 45
44 E
43
42
41
40
39
n
*-
-
•
l
o
o \
i
A
1
o \ v
o \
D<0. 0 4 5 \
l 1
KEY
O
a O
• A
D = 0.025 In.
D = 0. 045 In.
D = 0.062 tn.
D = 0. 062 In.
D = 0 .125 In.
A \ ^ \ D = 0 . 1 2 5
\ D=0.062\. ^ ~ " - \ ^ ^
&• ^ ~ ~ — ^
1 1 l 1 1 1 l 1
5, ft 4 NWE
ft
^
A
A ..
1 1 1 1
A
A
1 0 0.2 0.4 0.6 0.8 1.0 1.2 1.4 1.6 1.8 2.0 2.2 2.4 2.6 2.8 3.0 3.2 3.4 3.6 3.8
FLAW AREA, A (10~2 in.)
'LOWER STRENGTH WELDMENT PANEL.
drilled hole was to be determined. Fifty-two specimens were tested
from three weldments. The specimens were 1 in. wide, containing no reduced section. The 42 plate-to-plate specimens were machined flat due to intolerable misalignment. The 10 plate-to-forging through specimens were tested as-received with the weld beads machined flush.. There was no detectable difference in behavior between the two types of specimens.
Each specimen contained one of two basic types of mechanical defects:
1. A drilled hole of diameter "D" and depth "X".
2. A sharp slot of surface length "£>" and depth "X".
The slot, D long and X deep, has the same projected area on the fracture surface as a drilled hole, D diameter and X deep. The root radius at
the extremities of the slot is 0.001 to 0.003 in. The slot is approximately 0.015 in. Figure 2 shows the defect orientation and the notation used.
The values of D were chosen to correspond to local existing weld classification limits: D = 0.020, 0.045, 0.062, 0.125 in. In general, the depth was X = D/2. D. 2D, or through the thickness.
The unflawed ultimate strength for the plate-to-plate tensile specimens averaged 47.0 ksi, while «•„ for the plate-to-forging specimens averaged 45.6 ksi. All fractured in the near heat-affected zone.
Figure 3 presents the data for specimens containing drilled holes. This figure demonstrates the necessity for considering more than just flaw diameter in predicting fracture strength. Weld imperfection diameter is the one measurement usually obtained from
radiographic inspection. Figure 4 shows the same data as Fig.
3 except fracture stress, cr„, is compared with depth. It is immediately seen that depth, rather than diameter, is the more dominant of the two variables affecting fracture strength. Unfortunately, this is the dimension that is not usually measured in radiographic inspection for naturally occurring flaws in welds.
Figure 5 again shows the data for drilled holes where cr„ is plotted against projected defect area.* The projected flaw area is a term which easily accounts for variation in both D and X, and, therefore, accounts for their combined effect on a,,. It is noted that, for a given
•The projected area was calculated by adding the projected area ot the hemisphere a t the bo t tom on the hole, or semicircle of the slot bot tom, to the rec tangular section (D wide by (X-D/2) deep. Thus . As = (TT/2) (D-/4) + D (X-D/2) or As = DX — 0.107 D-
W E L D I N G R E S E A R C H S U P P L E M E N T 307-s
GROSS SECTION FRACTURE, STRESS
30 -
KEY
X J_
A
a 0 0 • o
DEFECT
CRACK
HOLE
HOLE
SLOT
SLOT
SLOT
D
0 .25 -0 .43
0.045
0.020
0.062
0.062-
0.053
SPEC. WIDTH
2 . 4 Si 3 in.
1 In,
1 In.
1 in.
1 In.
1 In.
LOCATION
E ft £ ft NWE
1
J I [ I J_ 0 .2 0 .4 0.6 0 .8 1.0 1.2 1.4 1.6 1.8 2 .0 2 .2 2 . 4 2 .6 "2.8 3 .0 3 .2 3 . 4
FLAW AREA (IO" 2 in.2)
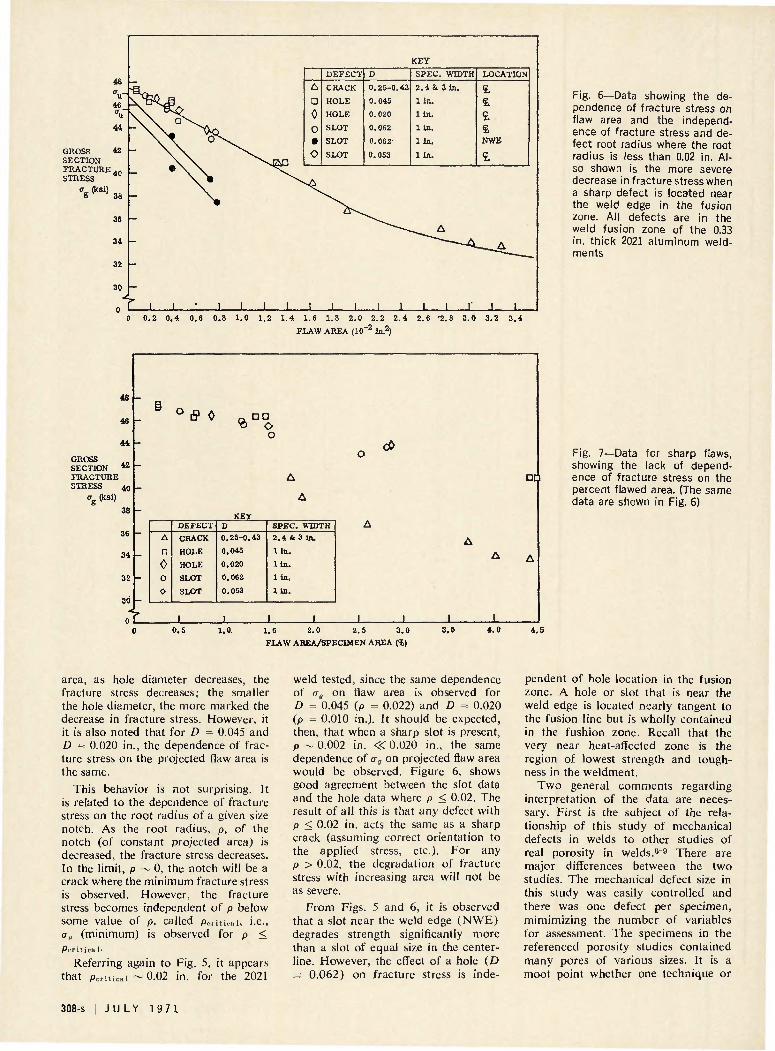
Fig. 6—Data showing the dependence of fracture stress on flaw area and the independence of fracture stress and defect root radius where the root radius is less than 0.02 in. Also shown is the more severe decrease in fracture stress when a sharp defect is located near the weld edge in the fusion zone. All defects are in the weld fusion zone of the 0.33 in. thick 2021 aluminum weldments
48
46
44
GROSS SECTION M
FRACTURE STRESS 4 0
<lg (ksi)
38
36
34
32
30
0 ,1
° & 0 o O D « O
o d>
KEY
A
• 0 o 0
DEFECT
CRACK
HOLE
HOLE
SLOT
SLOT
D
0 .25-0 .43
0.045
0.020
0.062
0.053
S P E C . WIDTH
2 . 4 & 3 in.
I in .
1 in.
1 in.
1 in.
J L 1.5 2 .0 2 . 5 3 . 0 FLAW AREA/SPECIMEN AREA (%)
3.5 4.0
DO
4 . 5
Fig. 7—Data for sharp flaws, showing the lack of dependence of fracture stress on the percent flawed area. (The same data are shown in Fig. 6)
area, as hole diameter decreases, the fracture stress decreases; the smaller the hole diameter, the more marked the decrease in fracture stress. However, it it is also noted that for D = 0.045 and D = 0.020 in., the dependence of fracture stress on the projected flaw area is the same.
This behavior is not surprising. It is related to the dependence of fracture stress on the root radius of a given size notch. As the root radius, p. of the notch (of constant projected area) is decreased, the fracture stress decreases. In the limit, p ~ 0, the notch will be a crack where the minimum fracture stress is observed. However, the fracture stress becomes independent of p below some value of p. called p,.ritirai, i.e., aa (minimum) is observed for p < P c r i t ica 1-
Referring again to Fig. 5, it appears that pcriucai - 0 . 0 2 in. for the 2021
weld tested, since the same dependence of <r„ on flaw area is observed for D = 0.045 (p = 0.022) and D = 0.020 (p = 0.010 in.). It should be expected, then, that when a sharp slot is present, p -0 .002 in. « 0 . 0 2 0 in., the same dependence of ag on projected flaw area would be observed. Figure 6, shows good agreement between the slot data and the hole data where p < 0.02. The result of all this is that any defect with p < 0.02 in. acts the same as a sharp crack (assuming correct orientation to the applied stress, etc.). For any p > 0.02, the degradation of fracture stress with increasing area will not be as severe.
From Figs. 5 and 6, it is observed that a slot near the weld edge (NWE) degrades strength significantly more than a slot of equal size in the center-line. However, the effect of a hole (D = 0.062) on fracture stress is inde
pendent of hole location in the fusion zone. A hole or slot that is near the weld edge is located nearly tangent to the fusion line but is wholly contained in the fushion zone. Recall that the very near heat-affected zone is the region of lowest strength and toughness in the weldment.
Two general comments regarding interpretation of the data are necessary. First is the subject of the relationship of this study of mechanical defects in welds to other studies of real porosity in welds."9 There are major differences between the two studies. The mechanical defect size in this study was easily controlled and there was one defect per specimen, mimimizing the number of variables for assessment. The specimens in the referenced porosity studies contained many pores of various sizes. It is a moot point whether one technique or
308-s : J U L Y 1971
the other is more respresentative of naturally occurring weld defects since both are produced artifically. Indeed, it is possible that the very technique used to artificially produce real porosity in a weld may alter the unflawed material properties. Thus, real porosity data should be regarded with caution in this respect.
The major point to be made about the studies involving real porosity is in reference to the analysis of fracture strength as a function of porosity. The data are frequently analyzed as a„ related to number of pores or <J„ related to percent of porous area. The former can be a valid measure if there is only one pore size to consider. Obviously, this is rarely the case. The latter, analyzing percent porous area as the primary independent variable, is extremely misleading.
As has been shown, the correlation in the 2021 welds studied exists between projected area and a,,. The correlation between percent area, porous area divided by gross area, is the result of using only one specimen size and/or testing cases of uniform porosity. If widths of 1, 2, and 3 in. were used, and the porosity confined to a given area. a„ is shown, by comparison of Figs. 6 and 7, to be a function of flaw area alone, and not a function of the percentage. (Of course, a specific flaw geometry should be used, fracture should occur after gross yielding, and flaw area should be less than 5 or 10% of gross specimen area.) Thus, in the case of actual weld defects, it would seem reasonable to develop criteria based on actual projected pore area for each occurrence, where each occurrence incorporates all poie area that can interact regardless of the percentage of the total area.
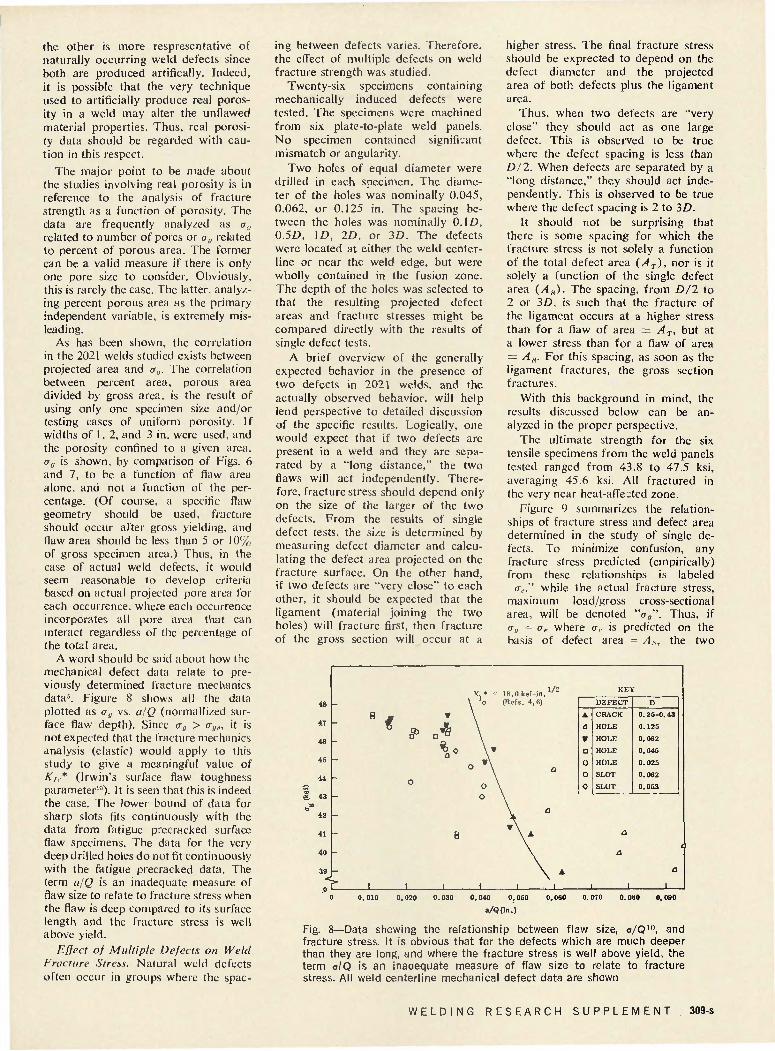
A word should be said about how the mechanical defect data relate to previously determined fracture mechanics data-"'. Figure 8 shows all the data plotted as <x„ vs. a/Q (normallized surface flaw depth). Since a,, > cr,,.,., it is not expected that the fracture mechanics analysis (elastic) would apply to this study to give a meaningful value of A";,* (Irwin's surface flaw toughness parameter1"). It is seen that this is indeed the case. The lower bound of data for sharp slots fits continuously with the data from fatigue precracked surface flaw specimens. The data for the very deep drilled holes do not fit continuously with the fatigue precracked data. The term a/Q is an inadequate measure of flaw size to relate to fracture stress when the flaw is deep compared to its surface length and the fracture stress is well above yield.
Effect of Multiple Defects on Weld Fracture Stress. Natural weld defects often occur in groups where the spac
ing between defects varies. Therefore, the effect of multiple defects on weld fracture strength was studied.
Twenty-six specimens containing mechanically induced defects were tested. The specimens were machined from six plate-to-plate weld panels. No specimen contained significant mismatch or angularity.
Two holes of equal diameter were drilled in each specimen. The diameter of the holes was nominally 0.045, 0.062, or 0.125 in. The spacing between the holes was nominally 0.1D, 0.5D, ID, 2D, or 3D. The defects were located at either the weld center-line or near the weld edge, but were wholly contained in the fusion zone. The depth of the holes was selected to that the resulting projected defect areas and fracture stresses might be compared directly with the results of single defect tests.
A brief overview of the generally expected behavior in the presence of two defects in 2021 welds, and the actually observed behavior, will help lend perspective to detailed discussion of the specific results. Logically, one would expect that if two defects are present in a weld and they are separated by a "long distance," the two flaws will act independently. Therefore, fracture stress should depend only on the size of the larger of the two defects. From the results of single defect tests, the size is determined by measuring defect diameter and calculating the defect area projected on the fracture surface. On the other hand, if two defects are "very close" to each other, it should be expected that the ligament (material joining the two holes) will fracture first, then fracture of the gross section will occur at a
higher stress. The final fracture stress should be exprected to depend on the defect diameter and the projected area of both defects plus the ligament area.
Thus, when two defects are "very close" they should act as one large defect. This is observed to be true where the defect spacing is less than D/2. When defects are separated by a "long distance," they should act independently. This is observed to be true where the defect spacing is 2 to 3D.
It should not be surprising that there is some spacing for which the fracture stress is not solely a function of the total defect area (AT), nor is it solely a function of the single defect area (AK). The spacing, from D/2 to 2 or 3D, is such that the fracture of the ligament occurs at a higher stress than for a flaw of area = Ar, but at a lower stress than for a flaw of area = As. For this spacing, as soon as the ligament fractures, the gross section fractures.
With this background in mind, the results discussed below can be analyzed in the proper perspective.
The ultimate strength for the six tensile specimens from the weld panels tested ranged from 43.8 to 47.5 ksi, averaging 45.6 ksi. All fractured in the very near heat-affected zone.
Figure 9 summarizes the relationships of fracture stress and defect area determined in the study of single defects. To minimize confusion, any fracture stress predicted (empirically) from these relationships is labeled
<r,," while the actual fracture stress, maximum load/gross cross-sectional area, will be denoted "<r„". Thus, if <rg = a,, where a, is predicted on the basis of defect area = AN, the two
47
46 -
45
44
j. 43
42
41
40
3>
X
DEFECT
A
a » • 0
o 0
CRACK
HOLE
HOLE
HOLE
HOLE
SLOT
SLOT
D
0.25-0.43
0.125
0.062
0.045
0.025
0.062
0.053
_L-
0.020 0.030 0. 040 0. 050
a/Q(in.)
0.060 0.070 0.080 0.090
Fig. 8—Data showing the relationship between flaw size, o/Q10, and fracture stress. It is obvious that for the defects which are much deeper than they are long, and where the fracture stress is well above yield, the term o/Q is an inadequate measure of flaw size to relate to fracture stress. All weld centerline mechanical defect data are shown
W E L D I N G R E S E A R C H S U P P L E M E N T j 309-s
S C A T T E R IN DATA
p=0 .062 ANYWHERE IN WELD
46
44
S. 42 <? u 0 40
38
As A 0 0 • o
KEY
A T
A
* • •
L/D
0.1-0.5
0.7-1.3
1.7-2.3
2.7-3.3
SINGLE DEFECT
A 0 A 0
s •
± s.
D E F E C T AREA P R O J E C T E D ON T H E F R A C T U R E SURFACE
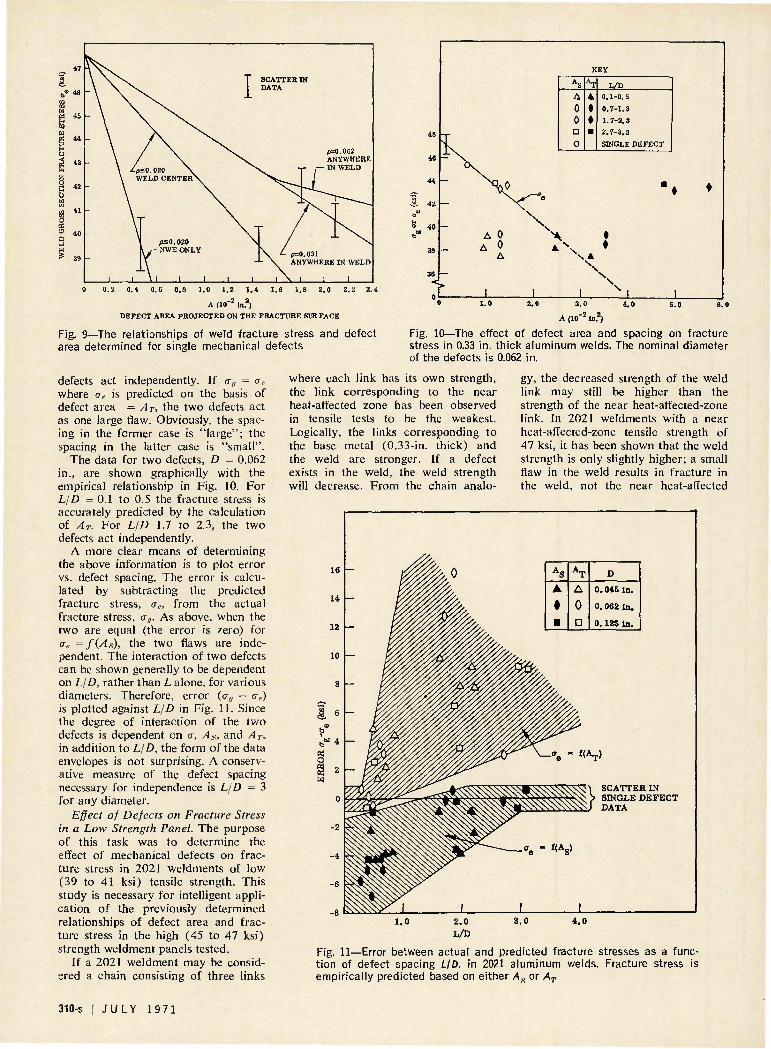
Fig. 9—The relationships of weld fracture stress and defect area determined for single mechanical defects
Fig. 10—The effect of defect area and spacing on fracture stress in 0.33 in. thick aluminum welds. The nominal diameter of the defects is 0.062 in.
defects act independently. If <r„ = <r,. where cre is predicted on the basis of defect area = A.T, the two defects act as one large flaw. Obviously, the spacing in the former case is "large"; the spacing in the latter case is "small".
The data for two defects, D = 0.062 in., are shown graphically with the empirical relationship in Fig. 10. For L/D = 0.1 to 0.5 the fracture stress is accurately predicted by the calculation of AT. For L/D 1.7 to 2.3, the two defects act independently.
A more clear means of determining the above information is to plot error vs. defect spacing. The error is calculated by subtracting the predicted fracture stress, <re, from the actual fracture stress, <r„. As above, when the two are equal (the error is zero) for ae =f(A,7), the two flaws are independent. The interaction of two defects can be shown generally to be dependent on L/D, rather than L alone, for various diameters. Therefore, error (au — a,.) is plotted against L/D in Fig. 11. Since the degree of interaction of the two defects is dependent on a, As, and AT, in addition to L/D, the form of the data envelopes is not surprising. A conservative measure of the defect spacing necessary for independence is L/D = 3 for any diameter.
Effect of Defects on Fracture Stress in a Low Strength Panel. The purpose of this task was to determine the effect of mechanical defects on fracture stress in 2021 weldments of low (39 to 41 ksi) tensile strength. This study is necessary for intelligent application of the previously determined relationships of defect area and fracture stress in the high (45 to 47 ksi) strength weldment panels tested.
If a 2021 weldment may be considered a chain consisting of three links
where each link has its own strength, the link corresponding to the near heat-affected zone has been observed in tensile tests to be the weakest. Logically, the links corresponding to the base metal (0.33-in. thick) and the weld are stronger. If a defect exists in the weld, the weld strength will decrease. From the chain analo
gy, the decreased strength of the weld link may still be higher than the strength of the near heat-affected-zone link. In 2021 weldments with a near heat-affected-zone tensile strength of 47 ksi, it has been shown that the weld strength is only slightly higher; a small flaw in the weld results in fracture in the weld, not the near heat-affected
As •
•
A T
A
0 a
D
0.046 in.
0.062 In.
0.125 in.
SCATTER IN SINGLE DEFECT DATA
Fig. 11—Error between actual and predicted fracture stresses as a function of defect spacing LID, in 2021 aluminum welds. Fracture stress is empirically predicted based on either As or AT
310-s ! J U L Y 1971
EMPIRICALLY PREDICTED FRACTURE STRESS (ROOT RADIUS LESS THAN 0.022 in . )
FRACTURE THROUGH 0. 022-in. ROOT RADIUS DEFECT FRACTURE IN NEAR HEAT-AFFECTED ZONE FRACTURE THROUGH NATURAL DEFECT (ROOT RADIUS LESS THAN 0. 022 in.)
4=
46
44'
42
k X
-> i
40
38
36
34
32
1
/ EMPIRICALLY PREDICTED FRACTURE STRESS / (ROOT RADIUS=0. 031 in.)
v • FRACTURE THROUGH >v 0.031-in. ROOT
N ^ RADIUS DEFECT
N v A FRACTURE NEAR \ HEAT-AFFECTED'
N . ZONE
N
1 1 1 1 1 1 1 1
2.0 3.0 4.0 5.0
DEFECT AREA (IO-2 in.2)
2.0
DEFECT AREA (10
3.0 2 in?,
•DASHED LINE DENOTES THE UNCERTAINTY IN THE PREDICTED FRACTURE STRESS DUE TO THE SPACING BETWEEN THE THREE HOLES FORMING THE DEFECT
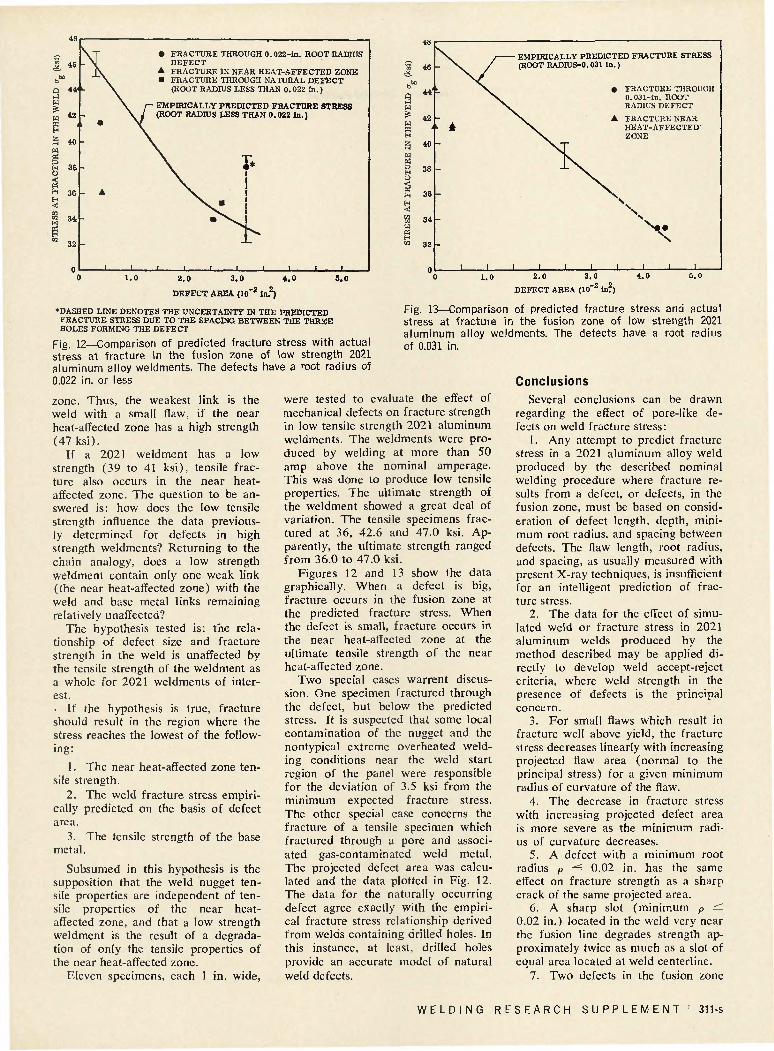
Fig. 12—Comparison of predicted fracture stress with actual stress at fracture in the fusion zone of low strength 2021 aluminum alloy weldments. The defects have a root radius of 0.022 in. or less
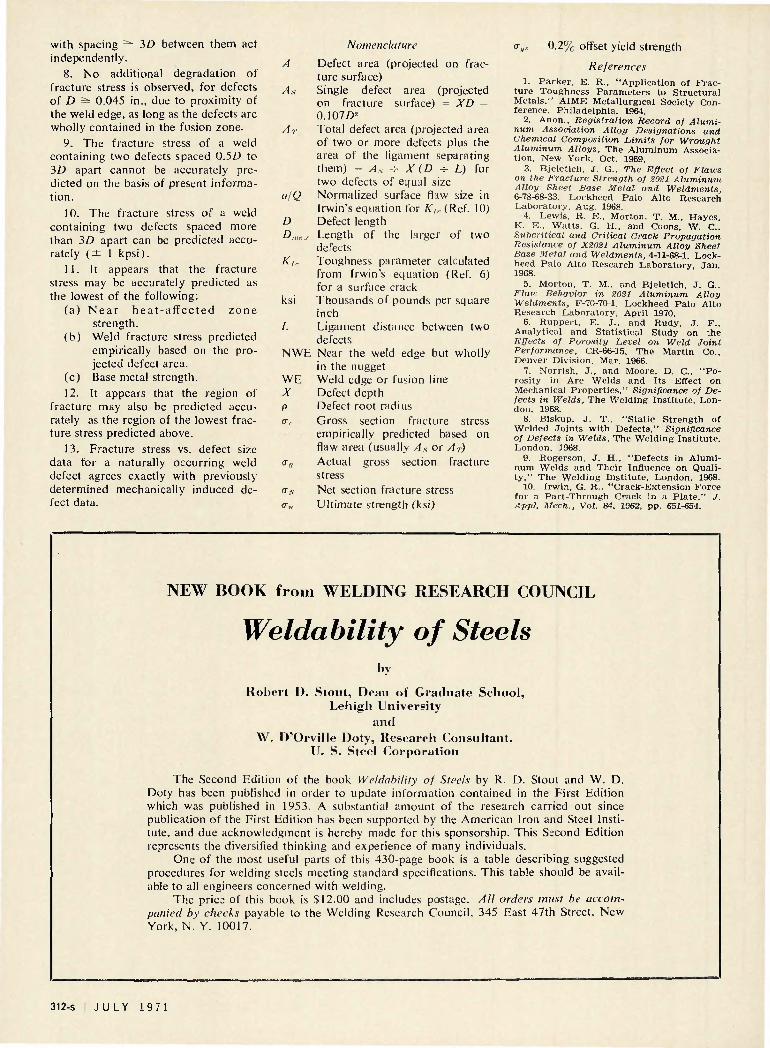
Fig. 13—Comparison of predicted fracture stress and actual stress at fracture in the fusion zone of low strength 2021 aluminum alloy weldments. The defects have a root radius of 0.031 in.
zone. Thus, the weakest link is the weld with a small flaw, if the near heat-affected zone has a high strength (47 ksi).
If a 2021 weldment has a low strength (39 to 41 ksi), tensile fracture also occurs in the near heat-affected zone. The question to be answered is: how does the low tensile strength influence the data previously determined for defects in high strength weldments? Returning to the chain analogy, does a low strength weldment contain only one weak link (the near heat-affected zone) with the weld and base metal links remaining relatively unaffected?
The hypothesis tested is: the relationship of defect size and fracture strength in the weld is unaffected by the tensile strength of the weldment as a whole for 2021 weldments of interest. • If the hypothesis is true, fracture should result in the region where the stress reaches the lowest of the following:
1. The near heat-affected zone tensile strength.
2. The weld fracture stress empirically predicted on the basis of defect area.
3. The tensile strength of the base metal.
Subsumed in this hypothesis is the supposition that the weld nugget tensile properties are independent of tensile properties of the near heat-affected zone, and that a low strength weldment is the result of a degradation of only the tensile properties of the near heat-affected zone.
Eleven specimens, each 1 in. wide,
were tested to evaluate the effect of mechanical defects on fracture strength in low tensile strength 2021 aluminum weldments. The weldments were produced by welding at more than 50 amp above the nominal amperage. This was done to produce low tensile properties. The ultimate strength of the weldment showed a great deal of variation. The tensile specimens fractured at 36, 42.6 and 47.0 ksi. Apparently, the ultimate strength ranged from 36.0 to 47.0 ksi.
Figures 12 and 13 show the data graphically. When a defect is big, fracture occurs in the fusion zone at the predicted fracture stress. When the defect is small, fracture occurs in the near heat-affected zone at the ultimate tensile strength of the near heat-affected zone.
Two special cases warrent discussion. One specimen fractured through the defect, but below the predicted stress. It is suspected that some local contamination of the nugget and the nontypical extreme overheated welding conditions near the weld start region of the panel were responsible for the deviation of 3.5 ksi from the minimum expected fracture stress. The other special case concerns the fracture of a tensile specimen which fractured through a pore and associated gas-contaminated weld metal. The projected defect area was calculated and the data plotted in Fig. 12. The data for the naturally occurring defect agree exactly with the empirical fracture stress relationship derived from welds containing drilled holes. In this instance, at least, drilled holes provide an accurate model of natural weld defects.
Conclusions Several conclusions can be drawn
regarding the effect of pore-like defects on weld fracture stress:
1. Any attempt to predict fracture stress in a 2021 aluminum alloy weld produced by the described nominal welding procedure where fracture results from a defect, or defects, in the fusion zone, must be based on consideration of defect length, depth, minimum root radius, and spacing between defects. The flaw length, root radius, and spacing, as usually measured with present X-ray techniques, is insufficient for an intelligent prediction of fracture stress.
2. The data for the effect of simulated weld or fracture stress in 2021 aluminum welds produced by the method described may be applied directly to develop weld accept-reject criteria, where weld strength in the presence of defects is the principal concern.
3. For small flaws which result in fracture well above yield, the fracture stress decreases linearly with increasing projected flaw area (normal to the principal stress) for a given minimum radius of curvature of the flaw.
4. The decrease in fracture stress with increasing projected defect area is more severe as the minimum radius of curvature decreases.
5. A defect with a minimum root radius p — 0.02 in. has the same effect on fracture strength as a sharp crack of the same projected area.
6. A sharp slot (minimum p =s 0.02 in.) located in the weld very near the fusion line degrades strength approximately twice as much as a slot of equal area located at weld centerline.
7. Two defects in the fusion zone
W E L D I N G R E S E A R C H S U P P L E M E N T 311-s
with spacing S= 3D between them act independently.
8. No additional degradation of fracture stress is observed, for defects of D s± 0.045 in., due to proximity of the weld edge, as long as the defects are wholly contained in the fusion zone.
9. The fracture stress of a weld containing two defects spaced 0.5D to 3D apart cannot be accurately predicted on the basis of present information.
10. The fracture stress of a weld containing two defects spaced more than 3D apart can be predicted accurately ( ± 1 kpsi).
11. It appears that the fracture stress may be accurately predicted as the lowest of the following:
(a) N e a r hea t -a f fec ted zone strength.
(b) Weld fracture stress predicted empirically based on the projected defect area.
(c) Base metal strength. 12. It appears that the region of
fracture may also be predicted accurately as the region of the lowest fracture stress predicted above.
13. Fracture stress vs. defect size data for a naturally occurring weld defect agrees exactly with previously determined mechanically induced defect data.
Nomenclature
A Defect area (projected on fracture surface)
As Single defect area (projected on fracture surface) = XD — 0.107D-
Ar Total defect area (projected area of two or more defects plus the area of the ligament separating them) = As * X (D -=- L) for two defects of equal size
a/Q Normalized surface flaw size in Irwin's equation for Kt, (Ref. 10)
D Defect length Dmas Length of the larger of two
defects Ki, Toughness parameter calculated
from I twin "s equation (Ref. 6) for a surface crack
ksi Thousands of pounds per square inch
L Ligament distance between two defects
NWE Near the weld edge but wholly in the nugget
WE Weld edge or fusion line X Defect depth p Defect root radius a, Gross section fracture stress
empirically predicted based on flaw area (usually As or AT)
a,. Actual gross section fracture stress
o-.v Net section fracture stress cr„ Ultimate strength (ksi)
o-„s 0.2% offset yield strength
References 1. Parker, E. R., "Application of Frac
ture Toughness Parameters to Structural Metals," AIME Metallurgical Society Conference. Philadelphia, 1964.
2. Anon.. Registration Record of Aluminum Association Alloy Designations and Chemical Composition Limits for Wrought Aluminum Alloys, The Aluminum Association. New York. Oct. 1969.
3. Bjeletich. J. G.. The Effect of Flans on the Fracture Strength of 2021 Aluminum Alloy Sheet Base Metal and Weldments, 6-78-68-33. Lockheed Palo Alto Research Laboratory, Aug. 1968.
4. Lewis, R. E., Morton. T. M., Hayes. K. E.. Watts. G. H., and Coons, W. C. Subcritical and Critical Crack Propagation Resistance of X2021 Aluminum Alloy Sheet Base Metal and Weldments, 4-11-68-1. Lockheed Palo Alto Research Laboratory Jan. 1968.
5. Morton. T. M.. and Bjeletich, J. G.. Flair Behavior in 2021 Aluminum Alloy Weldments, F-70-70-1, Lockheed Palo Alto Research Laboratory, April 1970.
6. Ruppert, E. J.. and Rudy, J. F.. Analytical and Statistical Study on the Effects of Porosity Level on Weld Joint Performance, CR-66-15, The Martin Co.. Denver Division. Mar. 1966.
7. Norrish. J., and Moore, D. C. "Porosity in Arc Welds and Its Effect on Mechanical Properties." Significance of Defects in Welds, The Welding Institute. London. 1968.
8. Biskup. J. T., "Static Strength of Welded Joints with Defects." Significance of Defects in Welds, The Welding Institute. London, 1968.
9. Rogerson, J. H.. "Defects in Aluminum Welds and Their Influence on Quality." The Welding Institute. London, 1968.
10. Irwin. G. R.. "Crack-Extension Force for a Part-Through Crack in a Plate." J. Appl, Mech., Vol. 84. 1962, pp. 651-654.
NEW BOOK from WELDING RESEARCH COUNCIL
Weldability of Steels by
Robert D. Stout, Dean of Graduate School , Lehigh University
and W. D'Orville Doty, Research Consultant,
U. S. Steel Corporation
The Second Edition of the book Weldability of Steels by R. D. Stout and W. D. Doty has been published in order to update information contained in the First Edition which was published in 1953. A substantial amount of the research carried out since publication of the First Edition has been supported by the American Iron and Steel Institute, and due acknowledgment is hereby made for this sponsorship. This Second Edition represents the diversified thinking and experience of many individuals.
One of the most useful parts of this 430-page book is a table describing suggested procedures for welding steels meeting standard specifications. This table should be available to all engineers concerned with welding.
The price of this book is $12.00 and includes postage. All orders must be accompanied by checks payable to the Welding Research Council, 345 East 47th Street, New York, N." Y. 10017.
312-s JULY 1971