Management of aquired mandibular defect / mandible defect management

Defect Collection & Analysis –The Basis of Software Quality Improvement
Joe Schofield,
Sandia National Laboratories
Albuquerque, N. M.
Sandia is a multiprogram laboratory operated by Sandia Corporation, a Lockheed Martin Company,for the United States Department of Energy under contract DE-AC04-94AL85000.

A Quick Look Back & Update on Recent IFPUG / ISMA Presentations
2002 Counting KLOCs – Software Measurement’s Ultimate Futility (I can't do this anymore, or who am I fooling?, or why not count ants?)The Statistically Unreliable Nature of Lines of Code; CrossTalk, April 2005 A Practical, Statistical, and Criminal Look at the Use of Lines of Code as a Software Sizing Measure ; N.M. SPIN; March, 2004
2003 Amplified Lessons from the Ant Hill –What Ants and Software Engineers Have in CommonLessons from the Ant Hill - What Ants and Software Engineers Have in Common; Information Systems Management, Winter 2003
2004 Applying Lean Six Sigma to Software EngineeringWhen Did Six Sigma Stop Being a Statistical Measure?; CrossTalk, April 2006Lean Six Sigma - Real Stories from Real Practitioners; Albuquerque, N.M.; N.M. SPIN; August 2005 Six Sigma & Software Engineering: Complement or Collision; Albuquerque, N.M.; N.M. SPIN; August, 2004
2005 Defect Collection & Analysis – The Basis of Software Quality ImprovementDefect Management through the Personal Software Process(SM); CrossTalk, September 2003The Team Software ProcessSM - Experiences from the Front Line; Software Quality Forum; Arlington, Virginia, March; 2003 Measuring Software Process Improvement - How to Avoid the Orange Barrels; System Development, December 2001Usable Metrics for Software Improvement within the CMM; Software Quality Forum 2000; Santa Fe, N.M.; April, 2000

Min and max values for “C” code compared to Function Point size over 9 programs (n = 49)
"C" Min/Max Function Point Range
0.00
0.50
1.00
1.50
2.00
1 2 3 4 5 6 7 8 9
Program
FP p
er L
OC
UFPs/minUFPs/max
2002
Largest min to max variance is > 22, smallest is almost 10, average is almost 15.
Note that in these three examples, variance and averages increased as the population increased.

Software engineers are smarter than ants, right?
Observation: When ants underestimate the size of a job, they compensate with waves of more ants. Most software projects cannot afford this tactic.
Lesson: Use reliable sizing measures like Function Points to assess progress. Avoid the practice of counting lines of code as a measure of size or progress.
Reference: A Practical, Statistical, and Criminal Look at the Use of Lines of Code as a Software Sizing Measure, Schofield, Structured Development Forum, March, 2003
2003

When Lean Six Sigma Isn’t (cont’d)
“What if” the sigma shift went to the right – a teraflop example:
TeraFlops machine1T floating point operations instructions per second = 3 defects per 100 seconds = 108 defects per hour = 18,144 per week = 943,488 DEFECTS per year =50M+ a year at “shifted 6 sigma” (4.5 sigma)(these numbers are rounded down)
1 PetaFlops machinepredicted to be ready by 2005 or 20061,000 times faster than a 1TFlop machine = 943,488,000 defects per year @ 7.5 sigma =50B (that’s BILLION) at “shifted 6 sigma”
PETAFLOP Imperative; Informationweek; June 21, 2004; pgs. 55 – 62
2 IBM’s Gene/L at Lawrence Livermore National Lab operates @ 70.72TFIBM will increase the speed to 360 TF in 2005
U.S. Regains Top Supercomputer Spots; Informationweek; November 15, 2004; pg. 28
Who can repair / afford / manage that many defects?
2004

(Back to Defects . . . )The Business Case for Defect Removal
Software defects cost the U.S. $59.6B a year1
38 percent of polled organizations have no SQA program2
Software technicians in Panama are charged with second degree murder after 27 patients received overdoses of gamma rays; 21 have died in 40 months3
BMW, DaimlerChrysler, Mitsubishi, and Volvo experience product malfunctions (engine stalls, gauges not illuminated, wiping intervals, wrong transmission gears) due to software4
A 2002 GAP report showed that spreadsheet errors at NASA contributed to a $644M misstatement in 19995
SPAM will cost the world $50B in lost productivity and other expenses . . . according to Ferris Research6
Medical staff report 38 percent defect rate while using computerized physician order entry (CPOE) systems in determining low dose for infrequently used medications.7
The FBI’s $170M virtual case file project went through 10 program managers before being cancelled.8
1 Informationweek, Behind the Numbers, March 29, 2004; pg 942 CIO, By the Numbers, December 1, 2003, pg 283 Baseline – The Project Management Center, We Did Nothing Wrong, March 4, 20044 Informationweek, Software Quality, March 15, 2004; pg 565 CIO, Essential Technology, May 15, 2005; pg 746 Informationweek, February 28, 2005; pg 187CIO, Medication Systems, June1, 2005; pg 288CIO, Why the G-Men Aren’t IT Men, June15, 2005; pg 44

Basic Measures for Defects
Defect – a product anomaly such as an omission or imperfection; faults in software sufficiently mature for test or operation. Adapted from the IEEE 982.1
Defect Attributes:
Defect injection
Defect detection
Defect removal cost
Defect type
Defect status
Defect severity
Peer Review times
Defect repair cost
Derivable Defect Measures:
Defect per Function Point
Average cost of defect by phase
Average cost of defect by work product
Defect leakage
Predicted number of defects (historic DFP)
Cost of Peer Reviews
Cost of defect removal
Cost of testing
ROI for defect removal (Cost of prevention and removal vs. cost of repair)

Applying DMAIC (Six Sigma) to Defect Data
Actual cost benefit figures for software development
Measures:
Define (opportunities)
Measure (performance)
Analyze (opportunity)
Improve (performance)
Control (performance)
An Organization Definition
Peer Reviews & DefectsMetrics
DataBase
Process Focus & Change
Defect List & Analysis
Sustained Measurement & Improvement
Whats Hows

Applying DMAIC to Defect Data (cont’d)
Injected Defects for 12 Projects
0 20 40 60 80 100 120
Planning
Analysis
Design
Impl.
Deploy.
Ops.
Distribution of Defect Cost to Repair
0 20 40 60 80 100 120 140 160
Less than or equal to $5
Less than or equal to $20
Less than or equal to $100
More than $100
Cost not recorded
Defect Types
0 50 100 150 200
Aesthetic
Functional
Failure
Measure / Record
Analyze

Applying DMAIC to Defect Data (cont’d)
Defect summary by How and
Where discoveredFindRemove
Prevent

Applying DMAIC to Defect Data (cont’d)
Defect summary by work product
FindRemove
Prevent
For defect removal, Tom Glib reports some inspection efficiencies as high as 88 percent. Jones, Software Quality, pg 215

Applying DMAIC to Defect Data (cont’d)
Given:
1 Peer Review is performed in Planning
2 Peer Reviews are performed in Analysis
3 Peer Reviews are performed in Design
1) How are so many defects removed in Implementation?
2) Does the organization need more Peer Reviews in Planning & Analysis?
3) How effective are Design Peer Reviews?
People Methods
Machine Material
Environment
Measurement
Effect
Look at Planning & Analysis
Defect Leakage by Phase and Cumulative Leakage
0
5
10
15
20
25
30
Plannin
g
Analys
is
Design
Imple
mentatio
n
Deploy
ment
Operat
ions
Perc
ent L
eaka
ge

Defects by Phase - Pareto Format
0
20
40
60
80
100
120
Analysis Design Implement Planning Deployment
Freq
uenc
y
Defect Costs - Histogram Format
020406080
100120140160
Less than or equalto $5
Less than or equalto $20
Less than or equalto $100
More than $100
Costs
Freq
uenc
y
Using Pareto Analysis and Histograms for Defect Data
Analyze (Derived)
Defect Types in Pareto Format
020406080
100120140160180
Functional Aesthetic Failure
Defect Types
Freq
uenc
y
Captured

Even Tools Require Thinking
Cost to Repair Defects in Operations based on Injection
0
200
400
600
800
1000
1200
1400
1600
Analysis Design Implementation Deployment Operations
Ave
rage
Rep
air $
Defects Detected by Phase - Pareto Format
0
20
40
60
80
100
120
Analysis Design Implement Planning Deployment
Freq
uenc
y
Defects Removal Cost by Phase - Pareto Format
02000400060008000
10000120001400016000
Imple
mentatio
n
Design
Analys
is
Plannin
g
Operat
ions
Deploy
ment
Tota
l Cos
t of D
efec
ts
Look at Analysis – first?
Look at Analysis & Design? Look at Implementation?
Defects Injected by Phase
0
5
10
15
20
25
30
Planning Analysis Design Implementation Deployment
Perc
ent I
njec
ted
Look at Analysis, Design, and Implementation?
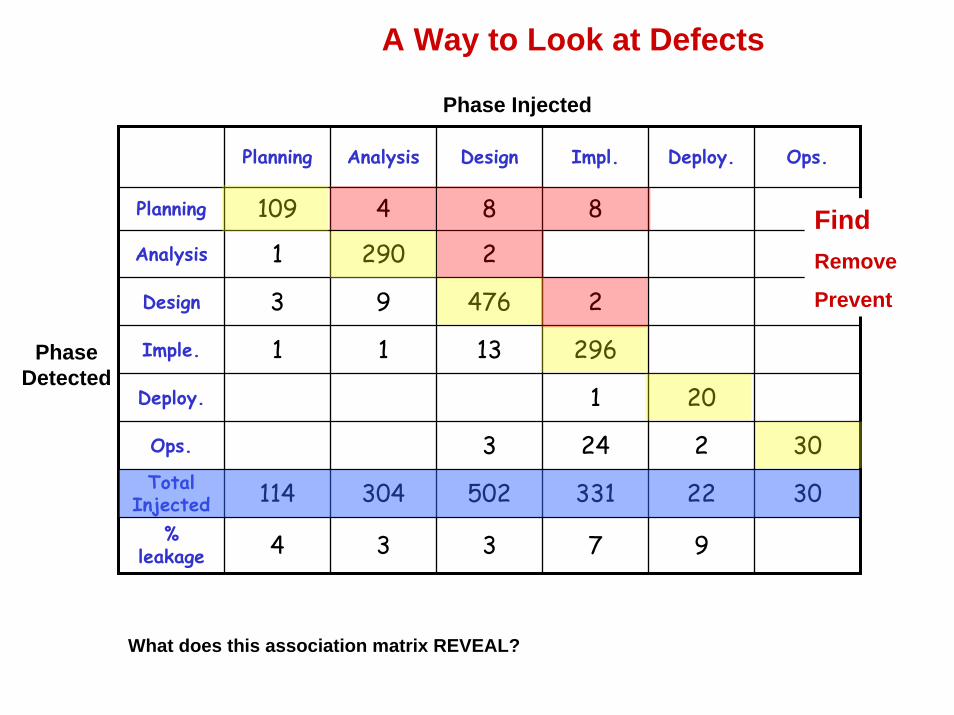
A Way to Look at Defects
Phase Injected
Planning Analysis Design Impl. Deploy. Ops.
Planning 109 4 8 8
Analysis 1 290 2
Design 3 9 476 2
Imple. 1 1 13 296
Deploy. 1 20
Ops. 3 24 2 30Total
Injected 114 304 502 331 22 30%
leakage 4 3 3 7 9
FindRemove
Prevent
Phase Detected
What does this association matrix REVEAL?

Some Statistical Analysis is Required for “Higher Level Maturity”
Find
Remove
Prevent
Special (Assignable) Cause removal required at CMMI® Level 4
How well the process is performed

Some Statistical Analysis is Required for “Higher Level Maturity”
Observation
Ind
ivid
ua
l V
alu
e
28252219161310741
15
10
5
0
-5
_X=4
UC L=13.59
LC L=-5.59
Observation
Mo
vin
g R
an
ge
28252219161310741
12
9
6
3
0
__MR=3.61
UC L=11.79
LC L=0
I-MR Chart Defects Discovered Per Peer Review Hour
Balancing the “voice of the customer” with the “voice of the process”
Causal analysis is required at CMMI® Level 5
How well the process is performs
Find
Remove
Prevent

Measurement-related Characteristics of “Higher Level Maturity” Organizations
• 85 percent of high maturity organization align process improvement with TQM initiatives at the enterprise level
• 85 percent of high maturity organizations have multiple process and quality improvement initiatives
• 81 percent of high maturity organizations also have ISO 9001 certification
• 50 percent using CMM, 42 percent using balanced scorecard, 42 percent using LSS, 25 percent using Baldrige
• 58 percent of high maturity organizations have established formal mentoring programs
• 15 - 21 percent decrease in effort for a one level increase
Higher Level Maturity with Statistics course (SEI)

Measurement-related Characteristics of “Higher Level Maturity” Organizations
Higher level maturity organizations:
• Use centralized measurement• Know why measurement are used, bring tables and charts to
interviews and explain them!• Describe “causal” analysis spontaneously during assessment
interviews• Have and supply ROI data• Use Pareto analysis• Use control charts• Use Six Sigma• Use orthogonal defect classification – and this means . . . • Require participation in the SQA Group and / or the SEPG prior
to promotion to management
The 2001 High Maturity Workshop (sponsored by the SEI)

Introducing defect pithy ‘tudes(a hostile attitude or disposition; that is, not defect friendly )
Defects persist in software; most of these come from executing a poor software development process or not executing a good one!
Defectectomy – Surgical defect removal, often evidenced in peer reviews
Defecticide – the killing off of defects, often evidenced in testing
Defect metastasization – the absence of Defectectomy and Defecticide practices
Q – Dr = F
Quality without defect (removal) is merely “faking it.”

Closing Reminders
“Higher maturity” organizations MUST use statistical tools for identifying assignable and common cause deviation.
Collecting and statistically analyzing defects is superior to merely counting defects and their origins.
SPC, Pareto, and Histogram charts are simple statistical tools for defect analysis and quantitative improvement.
These same tools can be used in other software development activities (estimated vs. actual, requirements volatility)
The following approaches have been found to be the best in class for defect prevention: JADs during requirements, prototypes during design, and reuse during coding and documentation. Jones, Software Quality, pg 160
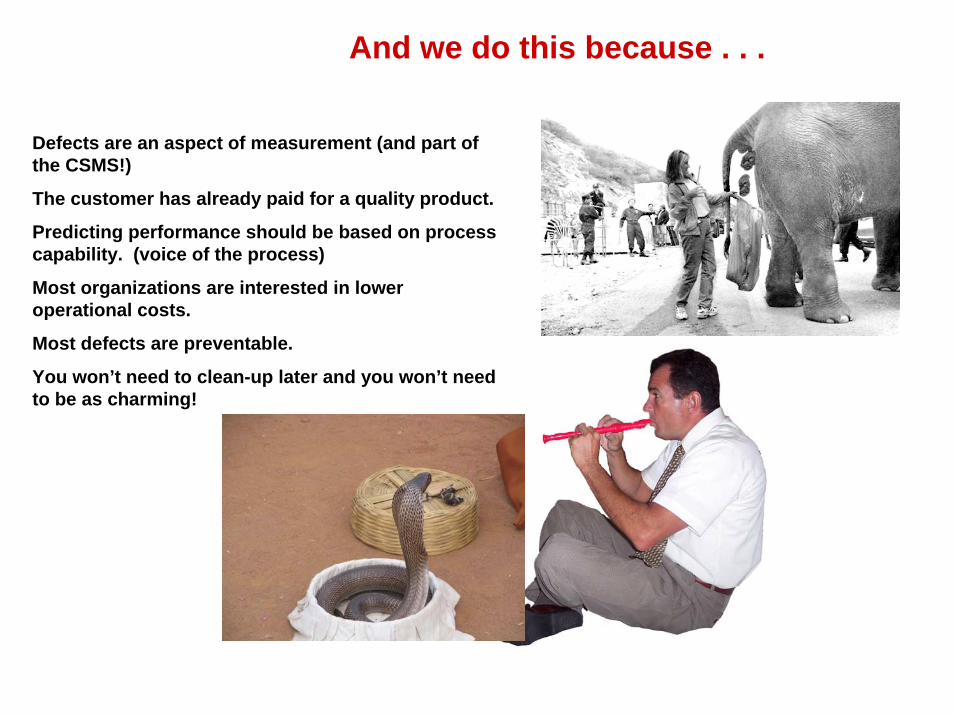
And we do this because . . .
Defects are an aspect of measurement (and part of the CSMS!)
The customer has already paid for a quality product.
Predicting performance should be based on process capability. (voice of the process)
Most organizations are interested in lower operational costs.
Most defects are preventable.
You won’t need to clean-up later and you won’t need to be as charming!