Default Values for Benefit Cost Analysis In British ... · Benefit Cost Analysis . In British...
26
Default Values for Benefit Cost Analysis In British Columbia 2018 Prepared for: BC Ministry of Transportation and Infrastructure Planning and Programming Branch 7 May, 2018 A A p p e e x x E E n n g g i i n n e e e e r r i i n n g g L L i i m m i i t t e e d d
Transcript of Default Values for Benefit Cost Analysis In British ... · Benefit Cost Analysis . In British...

Default Values for
Benefit Cost Analysis In British Columbia
2018
Prepared for: BC Ministry of Transportation and Infrastructure
Planning and Programming Branch
7 May, 2018 AAApppeeexxx EEEnnngggiiinnneeeeeerrriiinnnggg LLLiiimmmiiittteeeddd

i | P a g e A p e x E n g i n e e r i n g L i m i t e d
Table of Contents Page
1 Background ........................................................................................................ 1
2 Auto Operating Costs .......................................................................................... 3
2.1 General Assumptions .................................................................................... 3
2.2 Auto Use Related Depreciation ....................................................................... 3
2.3 Tires ............................................................................................................ 4
2.4 Auto Maintenance and Repair ........................................................................ 5
2.5 Summary of Auto Use Related Costs .............................................................. 5
2.6 Fuel Price ..................................................................................................... 6
2.7 Fuel Consumption ......................................................................................... 6
3 Truck Operating Costs ......................................................................................... 7
3.1 General Assumptions .................................................................................... 7
3.2 Truck Annual Utilization ................................................................................. 8
3.3 Truck Use Related Depreciation ..................................................................... 9
3.4 Truck Permits and Licenses .......................................................................... 10
3.5 Truck Administration .................................................................................... 10
3.6 Cargo Time Cost .......................................................................................... 11
3.7 Truck Tires .................................................................................................. 12
3.8 Truck Maintenance and Repair ...................................................................... 13
3.9 Summary of Truck Costs .............................................................................. 14
4 Value of Time ................................................................................................... 15
4.1 Auto Occupant Value of Time ....................................................................... 15
4.2 Truck Driver Value of Time ........................................................................... 17
5 Safety .............................................................................................................. 18
5.1 Collision Costs ............................................................................................. 18
5.2 Collision Rates and Severity .......................................................................... 21
6 Financial .......................................................................................................... 22
6.1 Capital Costs ............................................................................................... 22
6.2 Annual Maintenance Costs ............................................................................ 22
6.3 Resurfacing Costs ........................................................................................ 23
6.4 Residual Values ........................................................................................... 23
1 | P a g e A p e x E n g i n e e r i n g L i m i t e d
Default Values for Benefit Cost Analysis 2018
1 Background This edition updates the default values used for benefit cost analysis in British Columbia from 2012 to 2018 values. Historical – The original default economic data were developed by MoT Planning
Services Branch in 1992 as part of their program to develop tools for economic analysis of highway improvements. These values were integrated into the UBCS (User Benefit Cost Spreadsheets) model developed concurrently by the Ministry. In 1997 the default values were updated and the Microbencost model was implemented to replace UBCS. The default values were subsequently updated in 2003, 2007, 2012 and currently with the 2018 edition.
2007 edition – Truck depreciation was segregated into time related and distance
related components. The time related component was moved from the vehicle operating cost to the time cost default data so as to provide a more realistic estimate of time and vehicle operating cost (VOC) savings related to commercial traffic.
2012 edition – The most notable changes included:
• Gasoline prices increased 19% and diesel 30% since 2007 • Default collision rates are adjusted to reflect more detailed Provincial
collision data, disaggregated for signalized and unsignalized intersections. Previous data aggregated all intersections together.
• Better information for the collision cost estimates • Value of time for auto and bus derived from median hourly household
income

Default Values for Benefit Cost Analysis 2018
2 | P a g e A p e x E n g i n e e r i n g L i m i t e d
2018 edition – The table below highlights changes from the 2012 defaults:
• Default values for Microbencost were discontinued. • Road maintenance and resurfacing costs have increased • Injury costs have gone up as a result of switching to "made in Canada"
collision costs and with inflation • Gasoline prices increased 13% and diesel declined 4% since 2012 • Truck Driver time has increased • Truck vehicle time cost ($/hr) has decreased due to greater truck
utilization • Truck vehicle distance cost ($/km) has increased
2012 2018
Road Maintenance ($/Ln-km/yr) $3,839 $5,099 Mill and Fill Overlay ($/Ln-km) $65,000 $100,000 Value of Time ($/auto occupant) $15.94 $18.49 Truck Driver Payroll Cost($/veh) $29.16 $31.25 Cost/Collision
Fatal $6,385,999 $8,087,204 Injury $135,577 $302,636
PDO $11,367 $13,518 Fuel Price ($/L) excl. taxes
Car 0.898 $1.014 Composite Truck 0.978 $0.942
Other Vehicle Costs Car ($/km) $0.113 $0.135
Truck Time ($/hr) $19.78 $14.65 Truck Distance ($/km) $0.213 $0.257
Future editions – Potential improvements include:
• Research into allocation of the fixed costs of personal auto ownership. Current practice includes only the variable cost of personal vehicle use. Fixed costs are excluded from benefit cost analysis because they are considered sunk costs. Emerging models of vehicle ownership may change this.
• Review of collision costs to confirm values used for analysis in Canada.

Default Values for Benefit Cost Analysis 2018
3 | P a g e A p e x E n g i n e e r i n g L i m i t e d
2 Auto Operating Costs
2.1 General Assumptions
In social benefit cost, normal practice is to include auto costs directly related to the distance driven (use related depreciation, tires, fuel and maintenance and repairs) and to exclude transfers or fixed costs. Transfer payments such as taxes, tolls or interest are excluded on the basis that they move resources from one sector of society to another but do not consume them. Fixed costs are excluded on the basis that they are considered sunk costs under the current model of private car ownership and cannot be recovered by driving more or less distance. Fixed automobile costs include time related depreciation, insurance, licenses and registration. Time related depreciation is that portion of an automobiles market price that is attributable to age of the vehicle and independent of the kilometers on the vehicle.
2.2 Auto Use Related Depreciation
Depreciation in the value of an automobile is attributable to both time and distance. General practice is to use only the use (distance) related component in benefit cost analysis. The representative use related depreciation rate expressed as $/km was derived based on a regression of advertised price versus age and kilometers1 for three representative model types below. The composite value reflects a weighted average of the assumed fleet mix.
% of Fleet
Category Representative Vehicle
km/yr $/yr $/km
20% Compact Honda Civic 16,160 $634 $0.0433 40% Mid Size Toyota Camry 13,426 $918 $0.0409 40% SUV GMC Acadia 19,583 $1,885 $0.0615
Weighted Avg 16,390 $1,248 $0.0496
1 Autotrader.ca accessed April 2018

Default Values for Benefit Cost Analysis 2018
4 | P a g e A p e x E n g i n e e r i n g L i m i t e d
2.3 Tires
The following passenger vehicle tire prices were used to represent each vehicle category2.
Veh. Category Compact Mid-Size SUV Composite Vehicle
% of Fleet 20% 40% 40% 100% Brand Pirelli Pirelli BFGoodrich
Model all season P175/65R14
all season P225/60R16
P265/70R17
Qty 4 4 4
Per Tire $108 $146 $239 $176 Per Vehicle $432 $584 $955 $702
Tire Life 100,000 100,000 100,000 $/km $0.0043 $0.0058 $0.0096 $0.0070
2 Published Prices Canadian Tire April, 2018

Default Values for Benefit Cost Analysis 2018
5 | P a g e A p e x E n g i n e e r i n g L i m i t e d
2.4 Auto Maintenance and Repair
These costs are taken from the Canadian Automobile Association’s 2018 Vehicle Operating Cost Calculator3 using the input assumptions listed below. The average fleet age is now about 11 years in the United States4 but the oldest model year available in the CAA model is 2010. The maintenance costs exclude tires.
Category Compact Mid-Size SUV Composite
% of Fleet 20% 40% 40% 100%
Make Honda Toyota GMC
Model Civic Camry Acadia
Province BC BC BC Model Year 2010 2010 2010
Odometer 100,000 100,000 100,000 Highway/City 55%/45% 55%/45% 55%/45%
Mtce. And Repair ($/yr) $1,367 1867.39 1383.62 $1,574 Annual km 20,000 20,000 20,000
Mtce. & Repair ($/km) $0.0684 $0.0934 $0.0692 $0.0787
2.5 Summary of Auto Use Related Costs
These are the auto costs that vary with distance driven with the exception of fuel costs that are calculated separately. Use related cost have increased from $0.113 in the 2012 defaults to $0.135 in 2018. Compact Mid Size SUV Composite
% of Fleet 20% 40% 40% 100% Representative Vehicle Honda Toyota GMC Wt'd Avg.
Model Civic Camry Acadia Distance Related Depreciation ($/km) $0.0433 $0.0409 $0.0615 $0.0496
Maintenance and Repair $0.0684 $0.0934 $0.0692 $0.0787 Tires $0.0043 $0.0058 $0.0096 $0.0070
Total Use Related Cost ($/km) $0.1159 $0.1401 $0.1402 $0.1353
3 https://www.caa.ca/carcosts/, accessed April 16, 2018 4 http://www.autonews.com/article/20161122/RETAIL05/161129973/average-age-of-vehicles-on-road-hits-11.6-years, accessed April 2018

Default Values for Benefit Cost Analysis 2018
6 | P a g e A p e x E n g i n e e r i n g L i m i t e d
2.6 Fuel Price
The fuel price net of taxes5 is used for social cost benefit analysis. In social cost benefit, taxes are considered to be a transfer not a resource cost. Gasoline and diesel are used as proxy for car and truck fuel. The prices below are the average of Vancouver and Victoria, the two urban centers in BC for which Statistics Canada reports prices.
2018 ($/liter) Gasoline Diesel Fuel $1.014 $0.942 Taxes $0.312 $0.267 Total $1.326 $1.208 Increase from 2012 defaults
3.1% -8.6%
2.7 Fuel Consumption
Consumption is governed by a variety of vehicle, traffic and road related factors. For both auto and truck, the Shortben model accounts for:
• Average running speed including the effects of congestion but excluding stopped delay
• Stopped delay • Vehicle type (car or truck) each of which is made up of a composite
of several representative vehicle types. Grade has a strong influence on fuel consumption but is not accounted for in the model on the basis that excess fuel consumption upgrade is largely offset by reduced fuel consumption downgrade.
5 Statistics Canada. Table 326-0009 - Average retail prices for gasoline and fuel oil, by urban centre, monthly (cents per liter), average from March 2017 to Feb, 2018

Default Values for Benefit Cost Analysis 2018
7 | P a g e A p e x E n g i n e e r i n g L i m i t e d
3 Truck Operating Costs
3.1 General Assumptions
Trucks are generally operated on a commercial basis where both the fixed and variable costs of operation must be recovered through revenue. Social cost benefit however differs from financial analysis in that transfer payments such as interest on loans, tolls or taxes are excluded. The fixed costs which are allocated on a $/hr basis and include:
• Time related depreciation • Registration and Permits • Cargo time cost • Administration and interest on working capital
Insurance is excluded from operating costs on the basis that it is already included in collision costs.
Variable costs are allocated on a $/km basis and include:
• Distance related depreciation • Fuel • Tires, maintenance and repairs

Default Values for Benefit Cost Analysis 2018
8 | P a g e A p e x E n g i n e e r i n g L i m i t e d
3.2 Truck Annual Utilization
This is the number of annual kilometers driven and the number of annual hours in use of a truck. The annual hours are necessary to allocate fixed costs to a cost per hour basis. Straight truck utilization will vary depending on the type of service. Urban applications have shorter haul distance and more stops while inter-urban service has longer hauls with fewer stops. Inter-urban service is assumed for straight trucks. Tractor trailers are more consistently used for longer hauls. The typical utilization is estimated below.
Annual Utilization Tractor Trailer
Straight Truck
Annual km 160000 80000 Running Speed (km/hr) 80 60 Running Time (hr/yr) 2000 1333 Operating days/yr 280 250 km/day 571 320 Running Time (hr/trip) 7.50 3.33 Trip Length (km/trip) 600 200 Trips/yr 267 400 Wait, Load, Unload (hr/trip) 2.0 2.0 Wait, Load, Unload (hr/yr) 533 800 Total Annual Hours 2533 2133

Default Values for Benefit Cost Analysis 2018
9 | P a g e A p e x E n g i n e e r i n g L i m i t e d
3.3 Truck Use Related Depreciation
Depreciation in the value of a truck is related to both time and distance. The figures below are based on a regression of advertised prices of new and used equipment as a function of model year and kilometers6. The “composite” truck is a weighted average of 87% tractor trailers and 13% straight trucks7. The distance related component of depreciation makes up 35% of the “composite” truck depreciation.
Representative Vehicle Highway Tractor
Dry Freight Trailer
Tractor Trailer Total
Straight Box Truck
Composite Truck
New Price $120,054 $30,117 $150,171 $59,793 % of Fleet 87% 13% 100% Distance Related
km/yr 160,000 n/a 160,000 80,000 $/km $0.0310 n/a $0.0310 $0.0220 $0.0298
Total Annual Distance Related $4,967 $4,967 $1,758 $4,537
Time Related Annual Utilization (hr/yr) 2533 800 n/a 2133
$/hour $3.09 $1.57 $4.66 $1.43 $4.23 Total Annual Time Related $7,838 $1,253 $9,091 $3,052 $8,281.97
Total Annual Depreciation $12,805 $1,253 $14,058 $4,810 $12,819
6 Autotrader.ca, April 2018, Ryder Truck Sales 2018. 7 Sample of 97 trucks observed Highway 1, Kamloops to Salmon Arm using the BC MoTI 2015 Photolog.
Default Values for Benefit Cost Analysis 2018
10 | P a g e A p e x E n g i n e e r i n g L i m i t e d
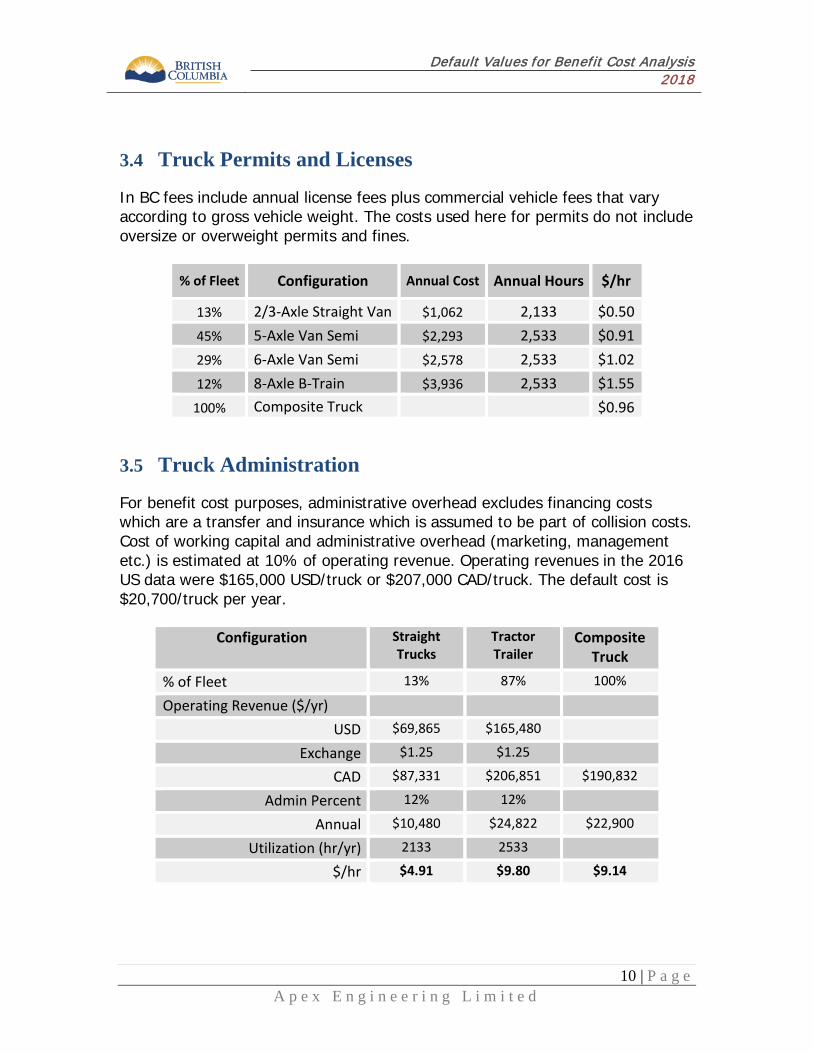
3.4 Truck Permits and Licenses
In BC fees include annual license fees plus commercial vehicle fees that vary according to gross vehicle weight. The costs used here for permits do not include oversize or overweight permits and fines.
% of Fleet Configuration Annual Cost Annual Hours $/hr
13% 2/3-Axle Straight Van $1,062 2,133 $0.50 45% 5-Axle Van Semi $2,293 2,533 $0.91 29% 6-Axle Van Semi $2,578 2,533 $1.02 12% 8-Axle B-Train $3,936 2,533 $1.55
100% Composite Truck
$0.96
3.5 Truck Administration
For benefit cost purposes, administrative overhead excludes financing costs which are a transfer and insurance which is assumed to be part of collision costs. Cost of working capital and administrative overhead (marketing, management etc.) is estimated at 10% of operating revenue. Operating revenues in the 2016 US data were $165,000 USD/truck or $207,000 CAD/truck. The default cost is $20,700/truck per year.
Configuration Straight Trucks
Tractor Trailer
Composite Truck
% of Fleet 13% 87% 100%
Operating Revenue ($/yr)
USD $69,865 $165,480
Exchange $1.25 $1.25
CAD $87,331 $206,851 $190,832
Admin Percent 12% 12%
Annual $10,480 $24,822 $22,900
Utilization (hr/yr) 2133 2533
$/hr $4.91 $9.80 $9.14

Default Values for Benefit Cost Analysis 2018
11 | P a g e A p e x E n g i n e e r i n g L i m i t e d
3.6 Cargo Time Cost
The value of cargo in transit is assumed to be the carrying cost of the inventory expressed as an hourly cost based on the social discount rate of 6%/year. The cargo time value proposed for analysis is presented below is based on some typical payload values and load factors.
Cargo Time Cost 2018 Straight Trucks
Tractor Trailer
Composite Truck
% of Fleet 13% 87% Payload Value $5,000 $75,000 $65,619
Load Factor 50% 70% Average Payload Value $2,500 $52,500 $45,799
Discount Rate 6% 6% Annual Inventory Cost $150 $3,150 $2,748
Hours/yr 8760 8760 Time Cost ($/hr) $0.017 $0.360 $0.314
The payload value assumed for straight trucks reflects both the smaller payload and the lower unit value. Values range widely from zero for excavated construction material to high value consumer goods.

Default Values for Benefit Cost Analysis 2018
12 | P a g e A p e x E n g i n e e r i n g L i m i t e d
3.7 Truck Tires
Typical tire costs are $563/tire and $313 per retread with a typical 2.5 retreads per tire. The combined life varies depending on the service cycle. The default values assume 300,000 km for Straight trucks and 550,000 for tractor trailers. The composite cost is the weighted average over the fleet distribution8.
% of Fleet
Truck Configuration
New
Tire
Retr
ead
Tire
Retr
eads
/t
ire
($/t
ire)
No.
Tire
s
Tota
l Cos
t
Tota
l Life
(k
m)
Cost
($
/km
)
7% 2 Axle $563 $313 2.5 $1,344 6 $8,063 300,000 $0.03 6% 3 Axle $563 $313 2.5 $1,344 10 $13,438 300,000 $0.04
45% 5 Axle Semi $563 $313 2.5 $1,344 18 $24,188 550,000 $0.04 29% 6 Axle Semi $563 $313 2.5 $1,344 22 $29,563 550,000 $0.05 12% 8 Axle B-Train $563 $313 2.5 $1,344 30 $40,313 550,000 $0.07 100%
Composite Truck
$0.049
8 Fleet distribution was based on a sample of 97 trucks taken from the Ministry’s 2015 photolog Kamloops to Salmon Arm.

Default Values for Benefit Cost Analysis 2018
13 | P a g e A p e x E n g i n e e r i n g L i m i t e d
3.8 Truck Maintenance and Repair
The most recent research efforts in this area were in 2011 in Canada9 and 2017 in the US10. The US data was adjusted for exchange and CPI and then the average $0.178/km of the Canadian and US data was used for the 2018 default value.
US 2016 Data US 2016 Data
Repair and Mtce Straight Trucks
Tractor Trailer
Composite Truck
% of Fleet 13% 87% Miles/yr 25,511 103,945
USD/mi $0.310 $0.157 USD/yr $7,908 $16,319 Exchange Rate $1.25 $1.25 CAD/yr $9,886 $20,399 km/yr 41,073 167,351 CAD/km $0.241 $0.122 $0.138
Canada 2011 Data
% of Fleet
Configuration Annual Cost km/yr Repairs & Mtce
13% 2-Axle Straight Van $13,460 80,000 $0.168 45% 5-Axle Van Semi $28,032 160,000 $0.175 29% 6-Axle Van Semi $34,224 160,000 $0.214 12% 8-Axle B-Train $40,144 160,000 $0.251
100% Composite Truck $0.195 2011 CPI 118.3
2018 CPI 132.6
2018 Repair &Mtce $0.218
9 “Operating Costs of Trucking and Surface Intermodal Transportation in Canada”, prepared for Transport Canada by Ray Barton and Associates In association with Logistics Solution Builders Inc. and The Research and Traffic Group, March 11, 2011 10 Hooper, A., Murray, D., “An Analysis of the Operational Costs of Trucking: 2017 Update” American Transportation Research Institute, Atlanta, Georgia, October, 2017
Default Values for Benefit Cost Analysis 2018
14 | P a g e A p e x E n g i n e e r i n g L i m i t e d
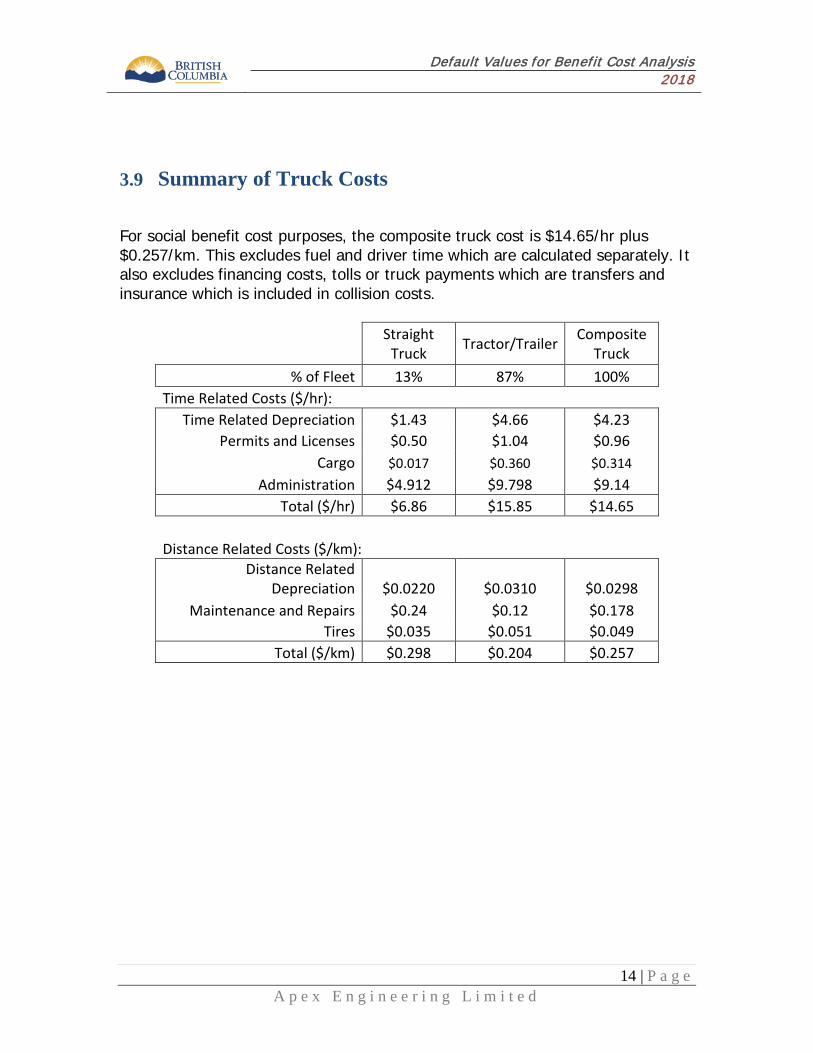
3.9 Summary of Truck Costs
For social benefit cost purposes, the composite truck cost is $14.65/hr plus $0.257/km. This excludes fuel and driver time which are calculated separately. It also excludes financing costs, tolls or truck payments which are transfers and insurance which is included in collision costs.
Straight Truck Tractor/Trailer Composite
Truck % of Fleet 13% 87% 100%
Time Related Costs ($/hr): Time Related Depreciation $1.43 $4.66 $4.23
Permits and Licenses $0.50 $1.04 $0.96 Cargo $0.017 $0.360 $0.314
Administration $4.912 $9.798 $9.14 Total ($/hr) $6.86 $15.85 $14.65
Distance Related Costs ($/km): Distance Related
Depreciation $0.0220 $0.0310 $0.0298 Maintenance and Repairs $0.24 $0.12 $0.178
Tires $0.035 $0.051 $0.049 Total ($/km) $0.298 $0.204 $0.257

Default Values for Benefit Cost Analysis 2018
15 | P a g e A p e x E n g i n e e r i n g L i m i t e d
4 Value of Time
4.1 Auto Occupant Value of Time
History - The original values of time used by BC MoT for economic analysis were developed in 1994 by Waters11 for use in the User Benefit Cost Spreadsheets (UBCS) model and were disaggregated by age group, driver, passenger, work/non-work and commercial/non-commercial. The weighted average of these values by user group was approximately $10/hr, which became the default 1997 value used in Microbencost for BC. Microbencost allowed value of time inputs for urban or rural, commercial/non-commercial and vehicle type. The original value of time work was closely related to average Provincial wages. The average Provincial wage was $610.70/week in 1997, $682.00 in March 2003 and $743.18 in March 2007, an increase of 9% from 2003. This increase is used to calculate the 2007 value of time of $12.17/person-hour. In 2012 BC MoT adopted a revised value of time for personal travel that of $15.94/hr which is equal to 50 percent of the B.C. median hourly Household income.
2018 Value of Time - Household annual income is collected by the census every
5 years. The last available figure from the 2016 census was for 2015 data and is $69,995 for BC. The 2018 BC median household income was estimated to be $76,923 based on a projection of available 2011 to 2015 median Family income which is collected annually (from CANSIM Table 111-0009) and correlates closely to household income. The 2018 household income divided by 2,080 employment hours per year is $36.98/hr and the value of travel time is estimated next page as 50% of the hourly income or $18.49/hr (in 2018 dollars).
50% of the wage rate is used as the value of non-work time. This is assumed to be the value of travel time savings for non-commercial vehicle occupants. The non-work value is used, based on the premise that travel time savings are generally used for additional non-work activity rather than work activity.
11 Waters W.G. et al, "The Value of Travel Time in British Columbia” prepared for the BC Ministry of Transportation and Highways, Planning Services Branch November 1994.

Default Values for Benefit Cost Analysis 2018
16 | P a g e A p e x E n g i n e e r i n g L i m i t e d
The Ministry recommends updating the value of time:
• Upon Statistics Canada’s release of B.C. median household income figures from each Census (scheduled to occur in 2021 for 2020 Census data); and
• One time between each Census update, preferably two or three years after the Census update.
Value of Travel Time Auto Occupants
Year Median Total Income, All
Families, BC 2011 $69,150 2012 $71,660 2013 $74,150 2014 $76,770 2015 $79,750
Annual Increase ($/yr) last 5 years $2,631 Estimated 2018 $87,643
Ratio 2018/2015 1.099 Tax Year Median Household Income
2015 $69,995 2018 est'd $76,923
full time hrs/yr 2080 Income/hr $36.98
non-work/work value of time 50% Value of Travel Time $18.49

Default Values for Benefit Cost Analysis 2018
17 | P a g e A p e x E n g i n e e r i n g L i m i t e d
4.2 Truck Driver Value of Time
History - The 1997 MicroBencost default values of time for heavy trucks included the driver’s wages plus a 25% wage burden yielding a total $25/hr for straight trucks and $28/hr for combination trucks. The comparable figures in the 2005 Trimac Report12 were $25.42 for combination trucks for wage plus payroll burden and no figure was given for Straight Trucks. The 1997 wage was overstated, reflecting an error in the 1997 Trimac report used to define wages. The figures for 2012 are taken from 2011 estimates prepared by Barton13 and adjusted to 2012 based on median income estimates.
2018 Truck Driver Value of Time - The average wage for truck drivers in BC is
$25/hr14. The payroll expense of 25% accounts for benefits packages, the costs of producing payroll and other payroll burden expenses. The total cost including payroll expenses is used for benefit cost.
Truck Driver $/hr 2018 Average Wage BC $25.00
25% Payroll Expenses $6.25 Total Payroll Cost $31.25
12 "Operating Costs of Trucks in Canada - 2005" Prepared by Trimac Logistics Ltd., Calgary, AB. for Transport Canada, Economic Analysis Directorate, Ottawa, ON. 13 “Operating Costs of Trucking and Surface Intermodal Transportation in Canada”, prepared for Transport Canada by Ray Barton and Associates In association with Logistics Solution Builders Inc. and The Research and Traffic Group, March 11, 2011 14 Federal Department of Employment and Social Development Canada - - Median Wage - BC, 2018

Default Values for Benefit Cost Analysis 2018
18 | P a g e A p e x E n g i n e e r i n g L i m i t e d
5 Safety
5.1 Collision Costs
History - Collision costs used for economic analysis in BC were originally developed in 1992 by Ted Miller of the Urban Institute for BC MoTH15. These were adjusted downward by one standard deviation for fatal collisions by MoTH Highway Safety Branch and then rounded off for use in economic analysis. The 1997 values were generated by taking the 1992 Miller values at a 4% discount rate and factoring them up using the CPI (1992 to 1997) of 1.09. In this case, the unit cost for fatal collisions was not adjusted downward as the Highway Safety Branch had done in 1992.
Historical Collision Costs
Fatal Injury PDO Notes
$3,870,324 $101,695 $5,974 Miller for BC MoTH 1992, 8% discount rate
$3,824,738 $89,061 $5,516 Miller for BC MoTH 1992, 4% discount rate
$2,900,000 $100,000 $6,000 Highway Safety Branch 1992
$4,170,000 $97,000 $6,000 1997
$5,693,954 $128,580 $7,342 2003 $6,063,419 $134,824 $7,759 2007 $6,385,999 $135,577 $11,367 2012
The 2003 values are based on collision costs derived by the US National Safety Council16 in 2002 and converted to Canadian values using the Canadian Dollar equivalent of the time of $1.37 CDN=$1.00 US. This exchange was at the high end of historical rates and likely overestimated the collision costs used in 2003 for BC. The 2007 default values were
15 Miller T.R. "Crash Costs for British Columbia, Contract034535" Letter from Ted Miller to Ross Harris, Planning Service Branch, BC MoTH, Victoria BC, 19 Feb, 1992. 16 Mei-Li Lin, et al.,"Injury Facts" annual report prepared by the US National Safety Council, Itasca Il., 2002

Default Values for Benefit Cost Analysis 2018
19 | P a g e A p e x E n g i n e e r i n g L i m i t e d
derived from the latest (2005) National Safety Council figures17 and converted to Canadian dollars using a 30 year (1977 to 2007) average exchange rate of $1.30 CDN = $1.00 US.
The 2012 default values were derived from work by DeLeur18 in Alberta which produced "made in Canada" values for collisions. The report looked extensively at the direct costs of crashes including other factors beyond simply the insurance claim cost and reviewed the literature on Statistical and Human Capital estimates for value of life and injury. This overcomes the issue of using US National Safety Council figures for economic and comprehensive collision costs19 and then applying a somewhat arbitrary exchange rates to convert to Canadian Dollars.
17 Mei-Li Lin, et al., “Injury Facts 2007 Edition”, annual report prepared by the US National Safety Council, Itasca Il., 2007 18 DeLeur, P., "Collision Cost Study", prepared for the Capital Region Intersection Safety Partnership, Edmonton, Alberta, 2010 19 “Injury Facts 2012 Edition” US National Safety Council, Itasca, Illinois, 2012

Default Values for Benefit Cost Analysis 2018
20 | P a g e A p e x E n g i n e e r i n g L i m i t e d
2018 Collision Costs - The 2018 default costs are presented below and are based
on the work by DeLeur, factored up to 2018 using the National CPI. The costs agree closely with the 2009 report20 from the Federal Government on mortality costs used for benefit cost.
2018 Collision Cost Calculations
Direct Costs Willingness-to-Pay Total
Per Victim 2007 dollars Fatality $178,499 $5,237,750 $5,416,249 Major Injury $113,624 $1,272,025 $1,385,649 Minor Injury $30,581 $0 $30,581 Property Damage $11,367 $0 $11,367
Victims Per Crash Fatal Injury PDO
2016 BC Data
Fatalities 1.05 0.00 0.0 Major Injuries 0.78 0.15 0.0 Minor Injuries 0.00 1.20 0.0 Property Damage 1.0 1.0 1.0
Direct Costs Willingness-to-Pay Total CPI Adjusted
from 2007 Per Crash 2007 dollars to 2018 dollars
Fatal $287,834 $6,512,493 $6,800,327 $8,087,204 Injury $65,116 $189,363 $254,479 $302,636 PDO $11,367 $0 $11,367 $13,518
The 2007 figures from DeLeur were adjusted to 2018 Canada using the National CPI. The number of injuries and deaths per crash were derived from 2016 ICBC data21 and used to convert cost per victim to cost per crash.
20 Chestnut, Lauraine G. and De Civita, Paul, "Economic Valuation of Mortality Risk Reduction: Review and Recommendations for Policy and Regulatory Analysis", Prepared for the Government of Canada, Policy Research Initiative, March 2009. 21 “Quick Statistics” ICBC Business Information Warehouse, August 2012

Default Values for Benefit Cost Analysis 2018
21 | P a g e A p e x E n g i n e e r i n g L i m i t e d
5.2 Collision Rates and Severity
Safety benefits generally make up the majority of benefits of a project and are worth some extra effort. A business case should consider:
• The historical safety performance • Future safety performance if a proposed project does not proceed • Future safety performance with the proposed project in place.
The tools available for this can be downloaded at:
http://www.th.gov.bc.ca/publications/planning and include: Safety Bencost This is the Provincial safety prediction model used to estimate
future safety performance. The model can combine historical data with internal prediction models to improve the estimated base case safety performance of an existing road particularly in cases where there is limited or no historical collision data. It can also predict the performance of improvements to an existing road or of a new road of a different service class.
Collision Modification Factors (CMF's)
Safety Bencost predicts a baseline safety performance for a "typical" service class and then uses CMF's to adjust performance when non-typical geometric or other features are added (or absent) from the facility. The "Collision Prediction Models and Collision Modification Factors" document is available at the URL above.
Default Collision Rates and Severity
These are based on Provincial data prepared by BC MoTI for 2009 to 2013 and updated periodically. They are collected from Provincial data for highway sections, signalized intersections, non-signalized intersections and five AADT ranges. Highway sections collision data are further disaggregated according to their operational class (RAU2, RAU4 etc). This data is already embedded in the Safety Bencost model but is still useful to refer to separately at times.
Default Values for Benefit Cost Analysis 2018
22 | P a g e A p e x E n g i n e e r i n g L i m i t e d
6 Financial
6.1 Capital Costs
There are no default values. For benefit cost purposes the relevant capital cost is the total project cost which includes all Ministry costs associated with a project as well as property, project management, planning, engineering and construction. Costs are generally developed using the standard costing models and previous contract data available from the Ministry. Typically as the design progresses, more detailed cost estimates are prepared based on design drawings.
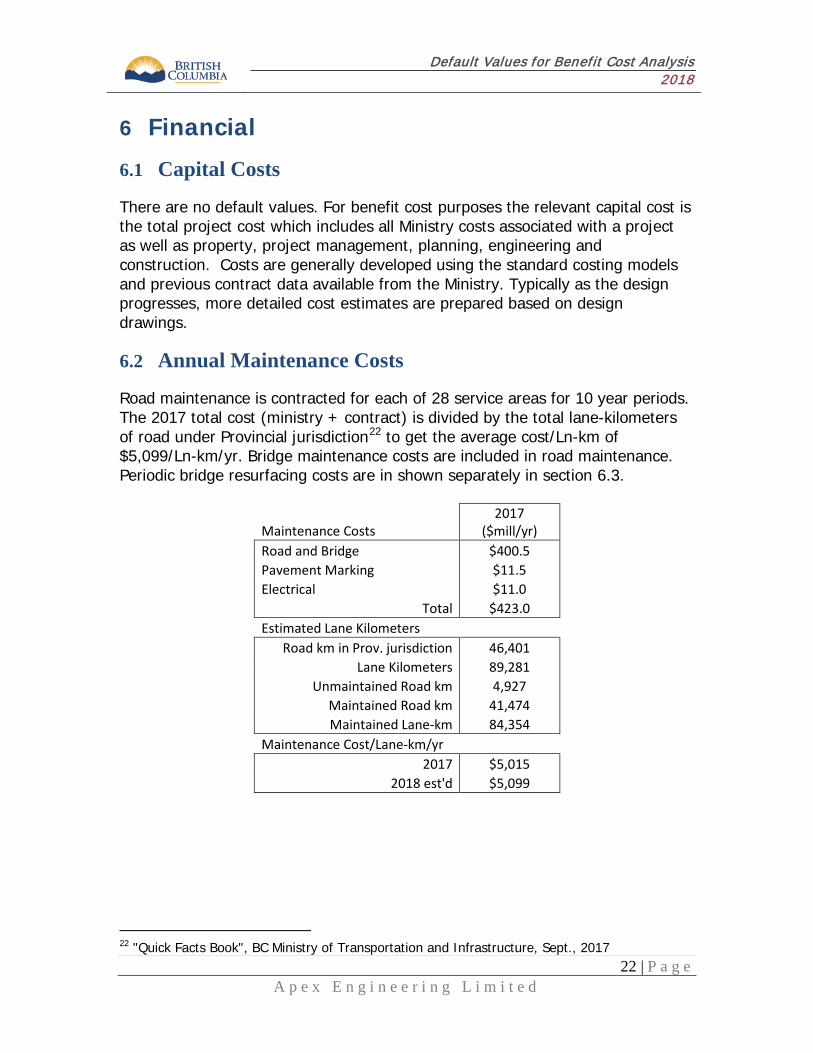
6.2 Annual Maintenance Costs
Road maintenance is contracted for each of 28 service areas for 10 year periods. The 2017 total cost (ministry + contract) is divided by the total lane-kilometers of road under Provincial jurisdiction22 to get the average cost/Ln-km of $5,099/Ln-km/yr. Bridge maintenance costs are included in road maintenance. Periodic bridge resurfacing costs are in shown separately in section 6.3.
Maintenance Costs 2017
($mill/yr) Road and Bridge $400.5 Pavement Marking $11.5 Electrical $11.0
Total $423.0 Estimated Lane Kilometers
Road km in Prov. jurisdiction 46,401 Lane Kilometers 89,281
Unmaintained Road km 4,927 Maintained Road km 41,474 Maintained Lane-km 84,354
Maintenance Cost/Lane-km/yr 2017 $5,015
2018 est'd $5,099
22 "Quick Facts Book", BC Ministry of Transportation and Infrastructure, Sept., 2017

Default Values for Benefit Cost Analysis 2018
23 | P a g e A p e x E n g i n e e r i n g L i m i t e d
6.3 Resurfacing Costs
Typical values for BC are shown below and total project costs including the value of the contract plus the associated Ministry costs.
Treatment Unit Cost Units Life (years) Mill and fill/Overlay $100,000 $/Ln-km 15 Hot In Place Recycling $65,000 $/Ln-km 8-10 Bridge Deck Resurfacing $1,500 $/m2 30
6.4 Residual Values
Residual values reflect the value of the asset continuing in its current use beyond the end of the analysis period. Benefit cost incorporates residual values as a recoverable in the last year of the analysis period. The analysis period is the construction period plus the benefit period. The residual values depend on the service life of the asset:
Category Service Life (yrs) Engineering and Project Management 0 Property 100 Major Structures 80 Grading and Drainage 60 Base & Sub-base 50 Surface 40
The approach used in the Shortben Model is similar to the MicroBencost model23. Consider the structure portion of a bridge project completed in 2021 followed by a 25 year benefit period. The planning period is 28 years and if the bridge is designed for 80 years and costs $100 million, then the residual value RV of the structure at the end of the planning period (year 28) is for example: RV = IC x (1+i)^(YH-YC) x (PWF i,SL -PWF i,N)/(PWFi,SL )
= $100m x (1+.06)^(2046- 2021) x (16.51 - 12.78)/(16.51) = $96.9 million
23 "Microcomputer Evaluation of Highway User Benefits", prepared for the US National Cooperative Highway Research Program, Project 7-12, October, 1993, Appendix pg A38.

Default Values for Benefit Cost Analysis 2018
24 | P a g e A p e x E n g i n e e r i n g L i m i t e d
Where: RV = Residual value in the horizon year (horizon year = base year +
analysis period). This value would be discounted back to the base year to get the present value of the recoverable.
IC = Initial cost of the asset $100 million
i = Discount rate 6%
YC = Year the asset is finished. 2021 in this case.
YSL = Service Life Year. This is the last year of the service life of the asset. For example if a the structure is completed in 2021 and has an 80 year service life then the service life year is 2021+80 = 2101.
YH = Horizon year (base year + analysis period) = 2018 + 28 = 2046
PWFSL = Uniform series present worth factor for discount rate i=.06 and the number of periods equal to the service life of the asset (80 yrs). Then PWFSL = 16.51
PWFN = Uniform series present worth factor for discount rate i = .06 and the number of years equal to (Horizon Year - Construction Complete Year) = 2046 - 2021 = 25 yrs. Then PWFN = 12.78
The structure portion has a residual value of $96.9 million in 2046. The present value in the 2018 base year is $96.9 mill /(1+.06)^(2046-2018) = $18.9 million which is a recoverable in the base year.