
Deep Retrofit: IHER Energy Services, European EPISCOPE Project
16
1 (2013-2016) Towards Zero Conference 22 nd June 2017 Michael Hanratty, IHER Energy Services Ltd "The sole responsibility for the content of this presentation lies with the authors. It does not represent the opinion of the Community. The European Commission is not responsible for any use that may be made of the information contained therein."
-
Upload
sustainable-energy-authority-ireland -
Category
Environment
-
view
99 -
download
2
Transcript of Deep Retrofit: IHER Energy Services, European EPISCOPE Project
1
(2013-2016)Towards Zero Conference
22nd June 2017
Michael Hanratty, IHER Energy Services Ltd
"The sole responsibility for the content of this presentation lies with the authors. It does not represent the opinion of the Community. The European Commission is not responsible for any use that may be made of the information contained therein."
2
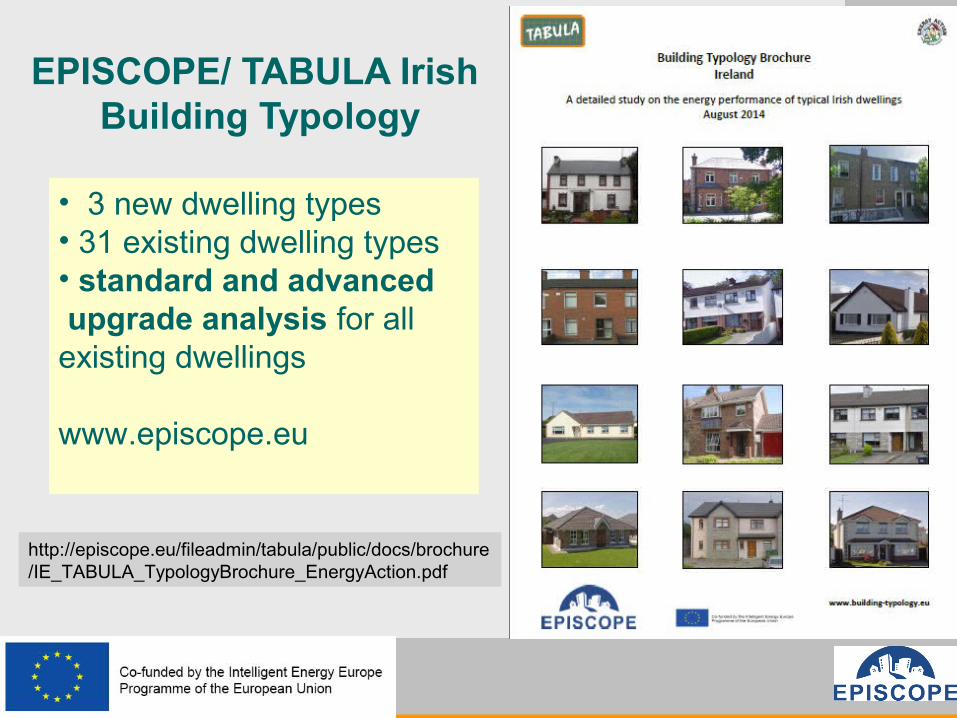
EPISCOPE/ TABULA Irish Building Typology
• 3 new dwelling types• 31 existing dwelling types• standard and advanced upgrade analysis for all existing dwellings
www.episcope.eu
http://episcope.eu/fileadmin/tabula/public/docs/brochure/IE_TABULA_TypologyBrochure_EnergyAction.pdf
3
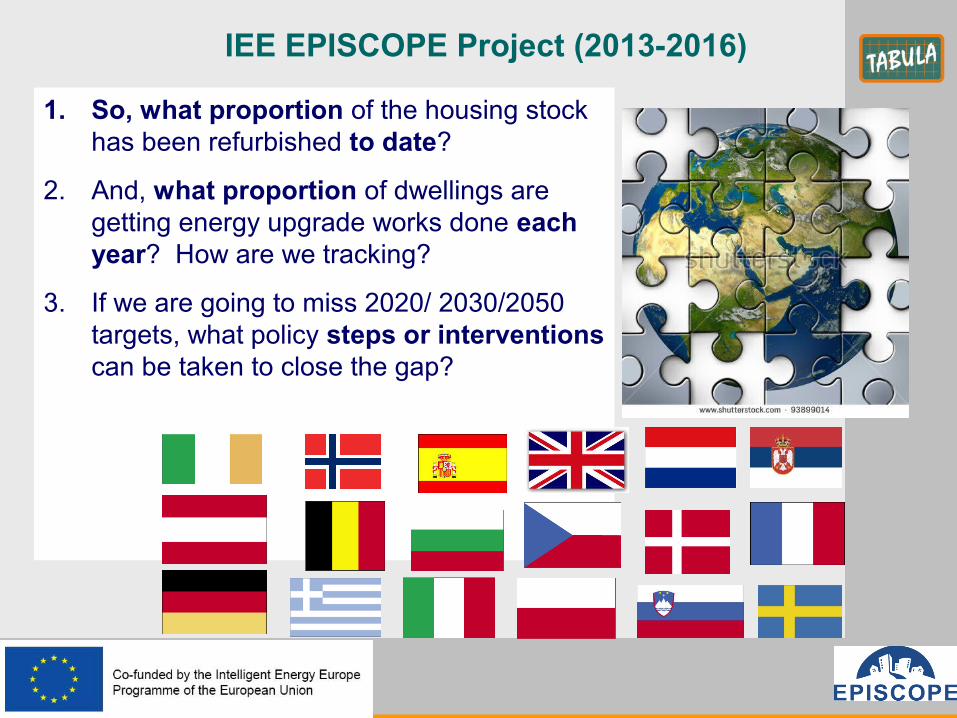
IEE EPISCOPE Project (2013-2016)
1. So, what proportion of the housing stock has been refurbished to date?
2. And, what proportion of dwellings are getting energy upgrade works done each year? How are we tracking?
3. If we are going to miss 2020/ 2030/2050 targets, what policy steps or interventions can be taken to close the gap?
4
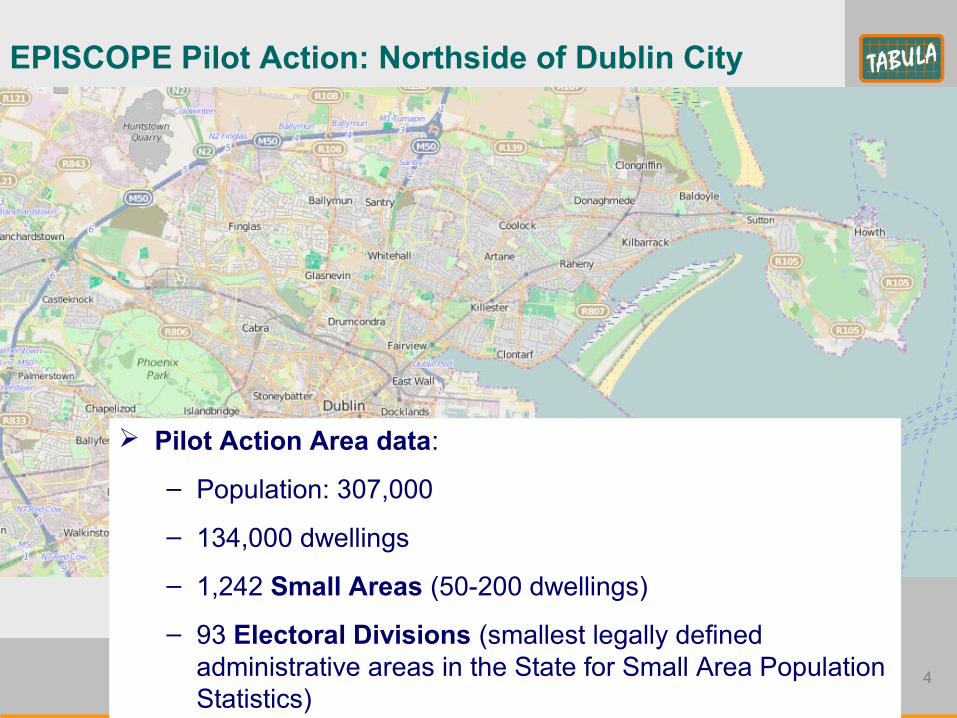
EPISCOPE Pilot Action: Northside of Dublin City
Pilot Action Area data:
– Population: 307,000
– 134,000 dwellings
– 1,242 Small Areas (50-200 dwellings)
– 93 Electoral Divisions (smallest legally defined administrative areas in the State for Small Area Population Statistics)
5
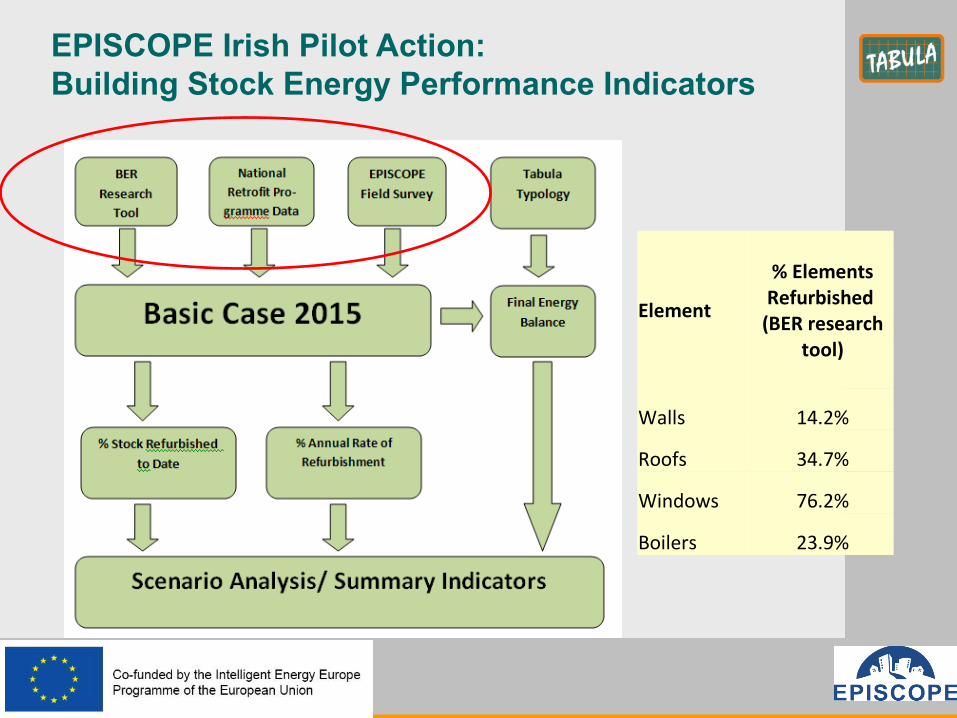
EPISCOPE Irish Pilot Action: Building Stock Energy Performance Indicators
Element
% Elements Refurbished
(BER research tool)
Walls 14.2%
Roofs 34.7%
Windows 76.2%
Boilers 23.9%
6
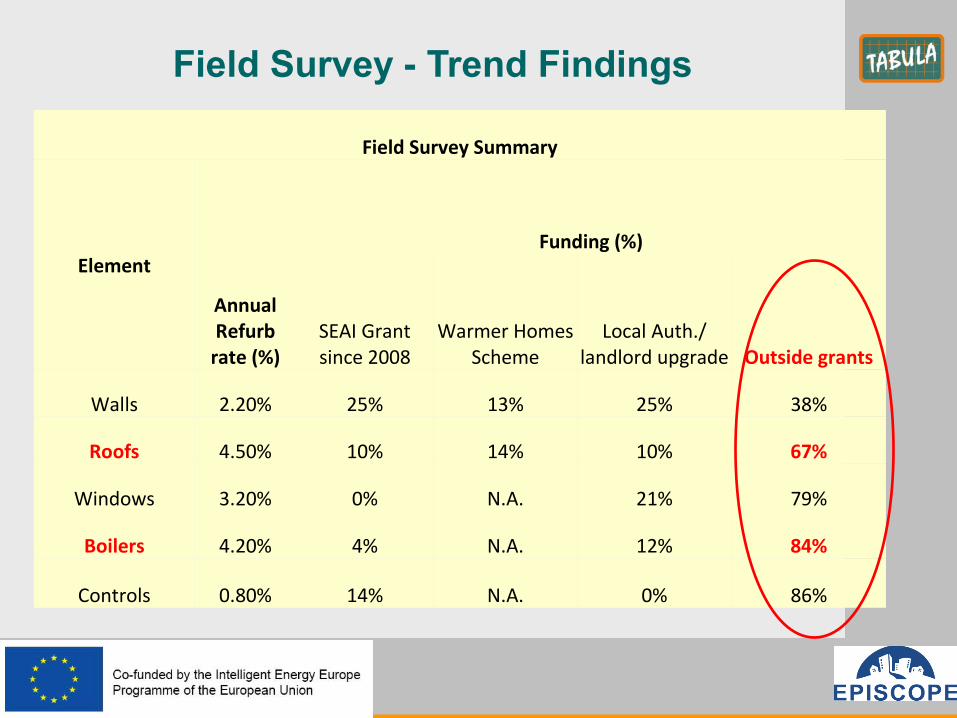
Field Survey - Trend Findings
Field Survey Summary
Element
Annual Refurb
rate (%)
Funding (%)
SEAI Grant since 2008
Warmer Homes Scheme
Local Auth./ landlord upgrade Outside grants
Walls 2.20% 25% 13% 25% 38%
Roofs 4.50% 10% 14% 10% 67%
Windows 3.20% 0% N.A. 21% 79%
Boilers 4.20% 4% N.A. 12% 84%
Controls 0.80% 14% N.A. 0% 86%
7
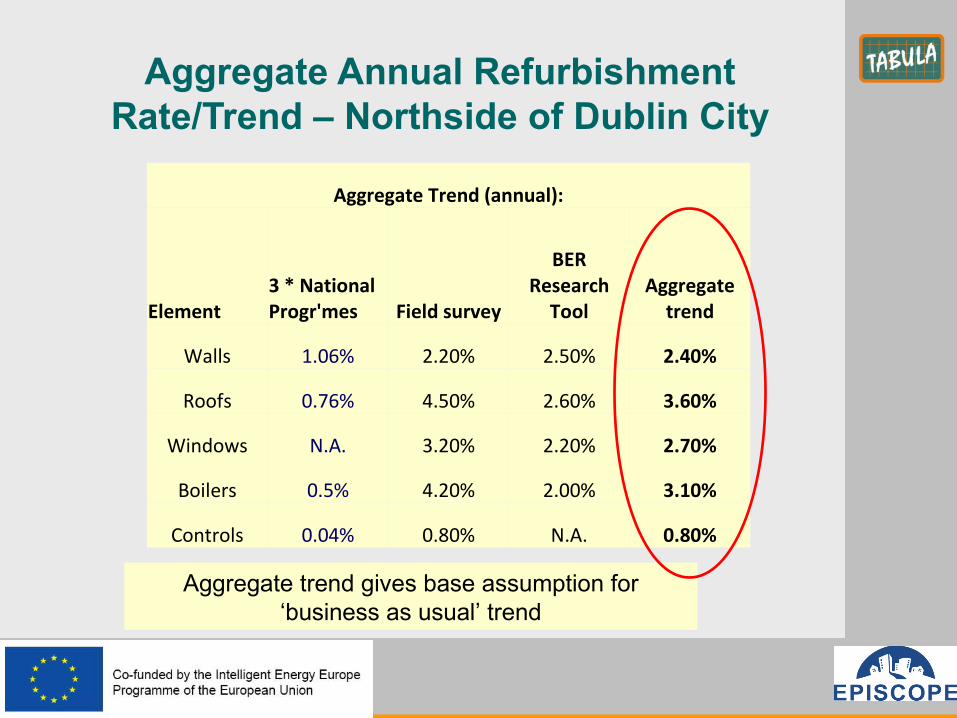
Aggregate Annual Refurbishment Rate/Trend – Northside of Dublin City
Aggregate trend gives base assumption for ‘business as usual’ trend
Aggregate Trend (annual):
Element3 * National Progr'mes Field survey
BER Research
ToolAggregate
trend
Walls 1.06% 2.20% 2.50% 2.40%
Roofs 0.76% 4.50% 2.60% 3.60%
Windows N.A. 3.20% 2.20% 2.70%
Boilers 0.5% 4.20% 2.00% 3.10%
Controls 0.04% 0.80% N.A. 0.80%
8
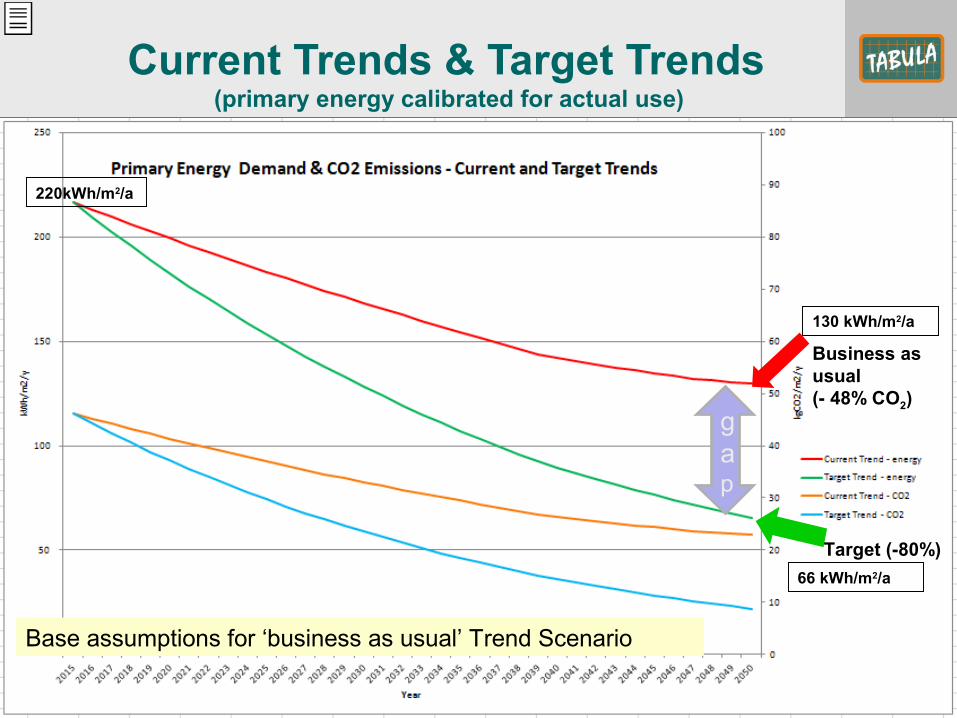
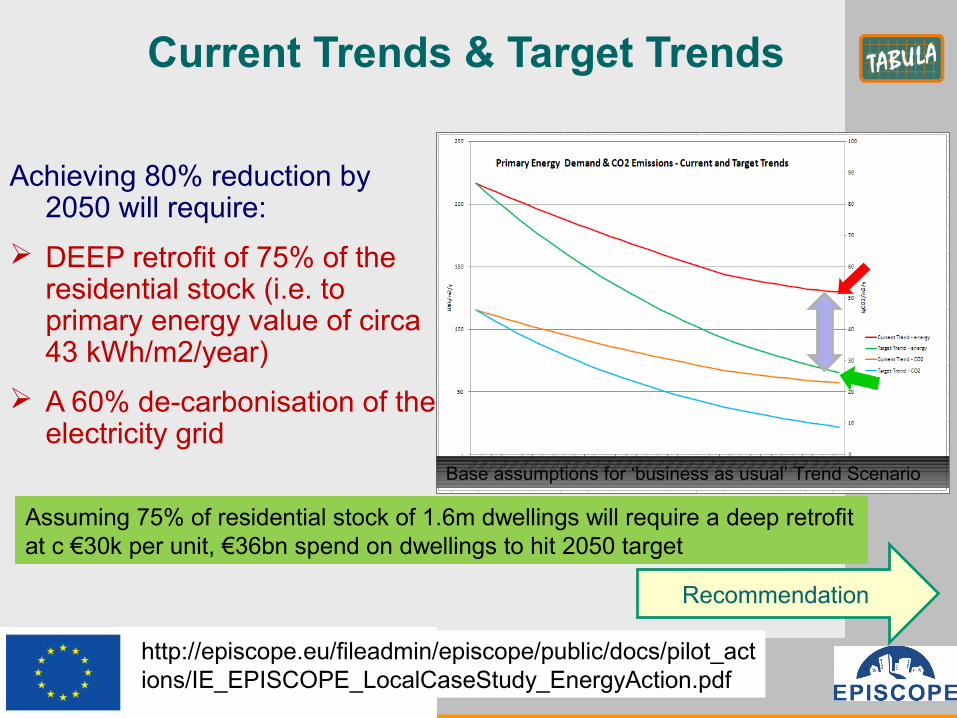
Current Trends & Target Trends (primary energy calibrated for actual use)
Base assumptions for ‘business as usual’ Trend Scenario
gap
Target (-80%)
Business as usual (- 48% CO2)
220kWh/m2/a
130 kWh/m2/a
66 kWh/m2/a
Uras Antonella, 04/03/2017
I propose to show this graph as part of the next slide. The graph is related to the text in slide 10. There is no time to appreciate all the figures in the graph and the concept is more important.
9
Base assumptions for ‘business as usual’ Trend Scenario
Achieving 80% reduction by 2050 will require:
DEEP retrofit of 75% of the residential stock (i.e. to primary energy value of circa 43 kWh/m2/year)
A 60% de-carbonisation of the electricity grid
Recommendation
Assuming 75% of residential stock of 1.6m dwellings will require a deep retrofit at c €30k per unit, €36bn spend on dwellings to hit 2050 target
Current Trends & Target Trends
http://episcope.eu/fileadmin/episcope/public/docs/pilot_actions/IE_EPISCOPE_LocalCaseStudy_EnergyAction.pdf
10
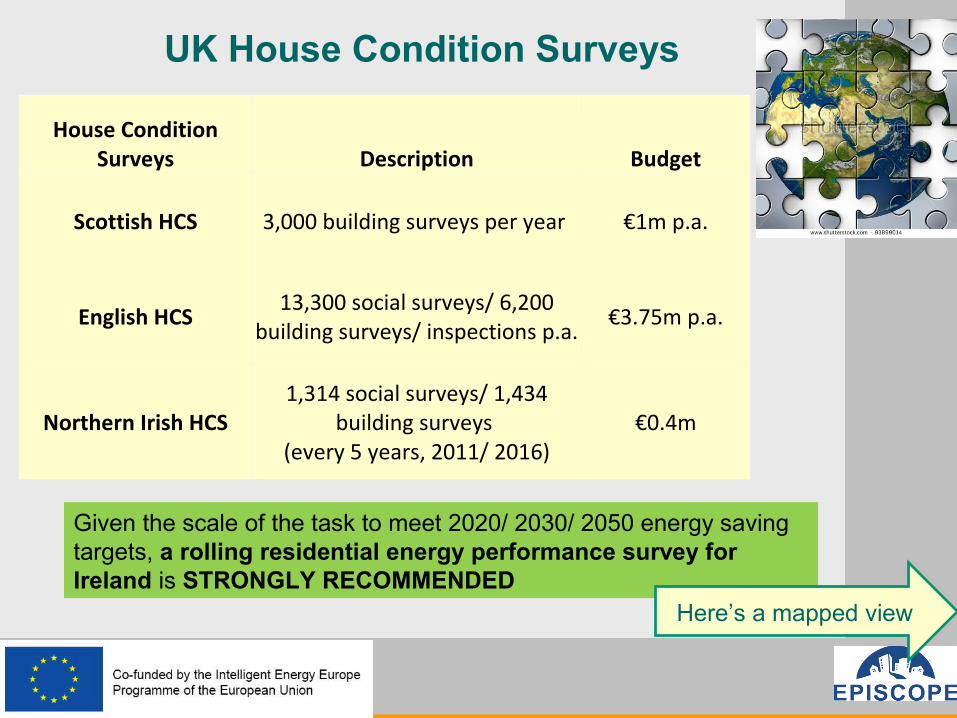
UK House Condition Surveys
House Condition Surveys Description Budget
Scottish HCS 3,000 building surveys per year €1m p.a.
English HCS13,300 social surveys/ 6,200
building surveys/ inspections p.a.€3.75m p.a.
Northern Irish HCS1,314 social surveys/ 1,434
building surveys (every 5 years, 2011/ 2016)
€0.4m
Given the scale of the task to meet 2020/ 2030/ 2050 energy saving targets, a rolling residential energy performance survey for Ireland is STRONGLY RECOMMENDED
Here’s a mapped view
11
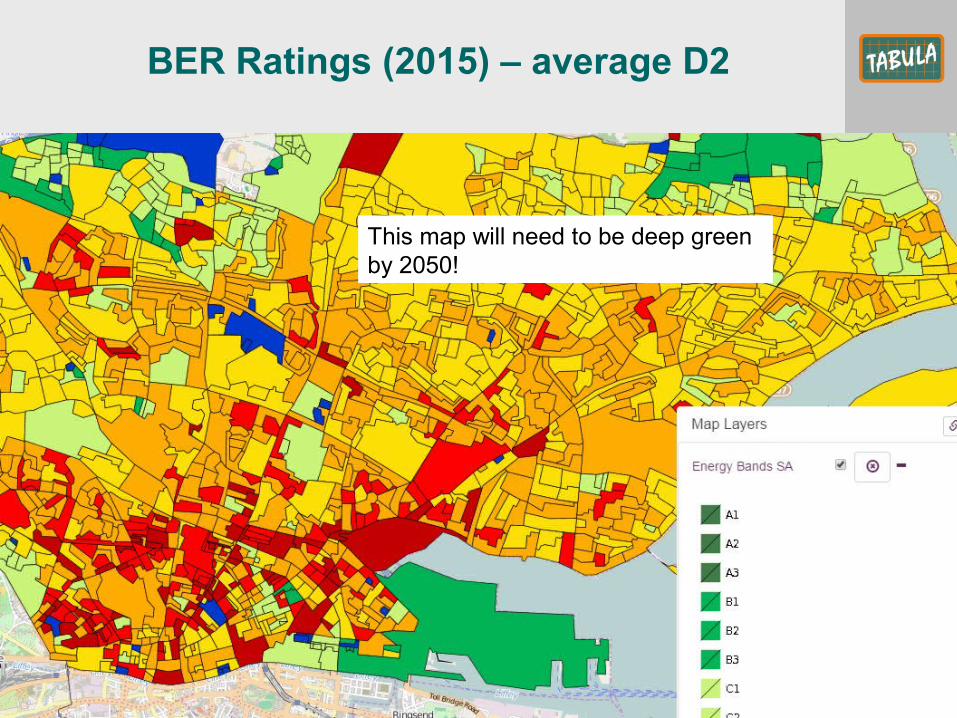
BER Ratings (2015) – average D2
This map will need to be deep green by 2050!
12
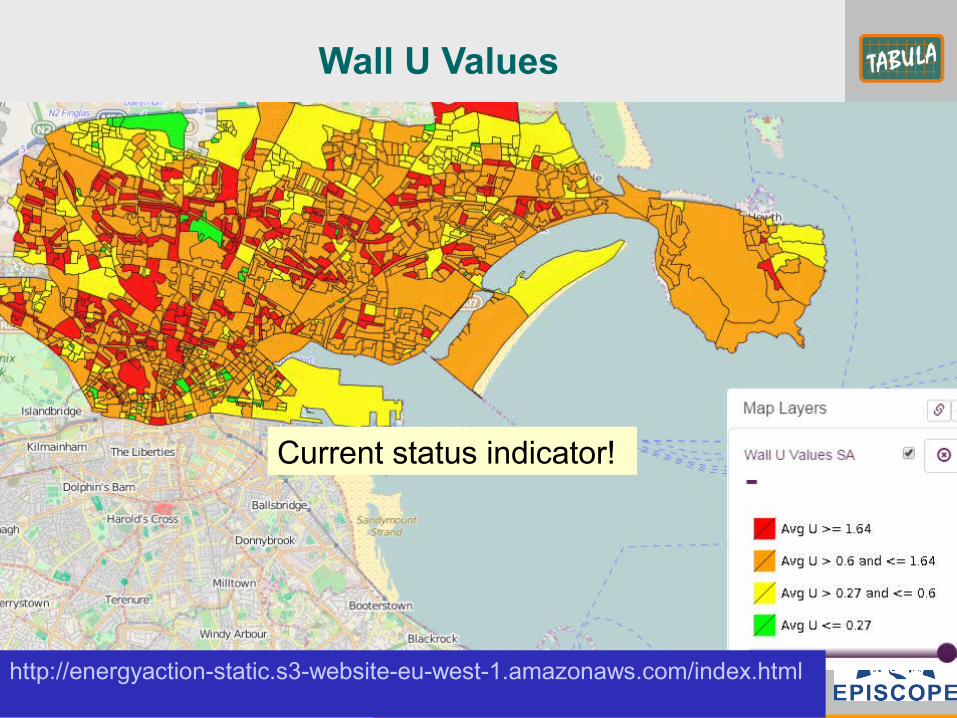
Wall U Values
Current status indicator!
http://energyaction-static.s3-website-eu-west-1.amazonaws.com/index.html
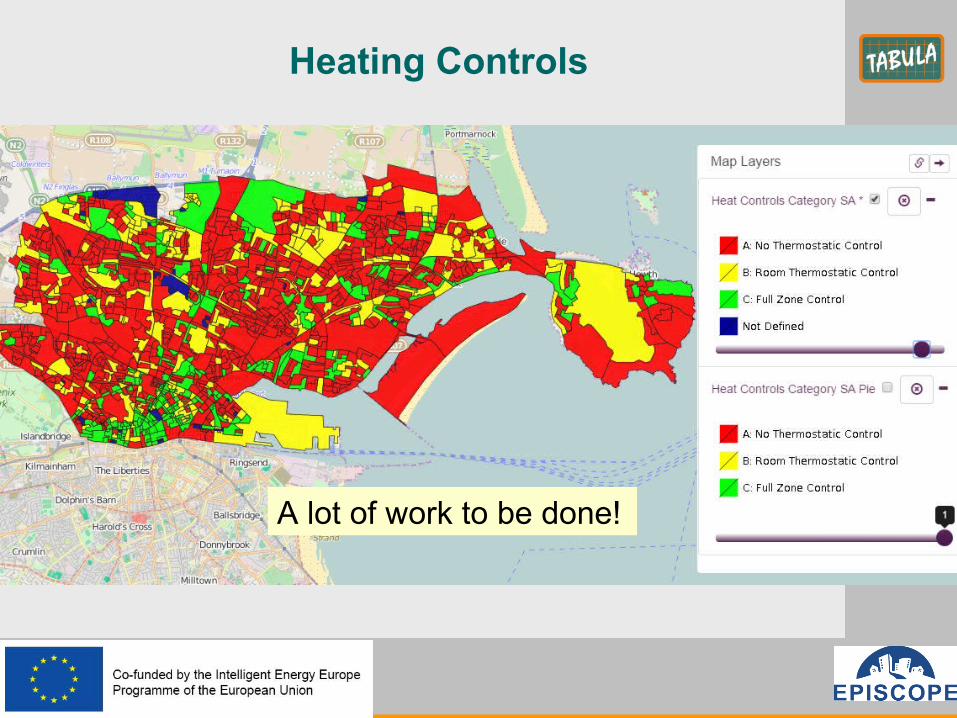
13
Heating Controls
A lot of work to be done!
14
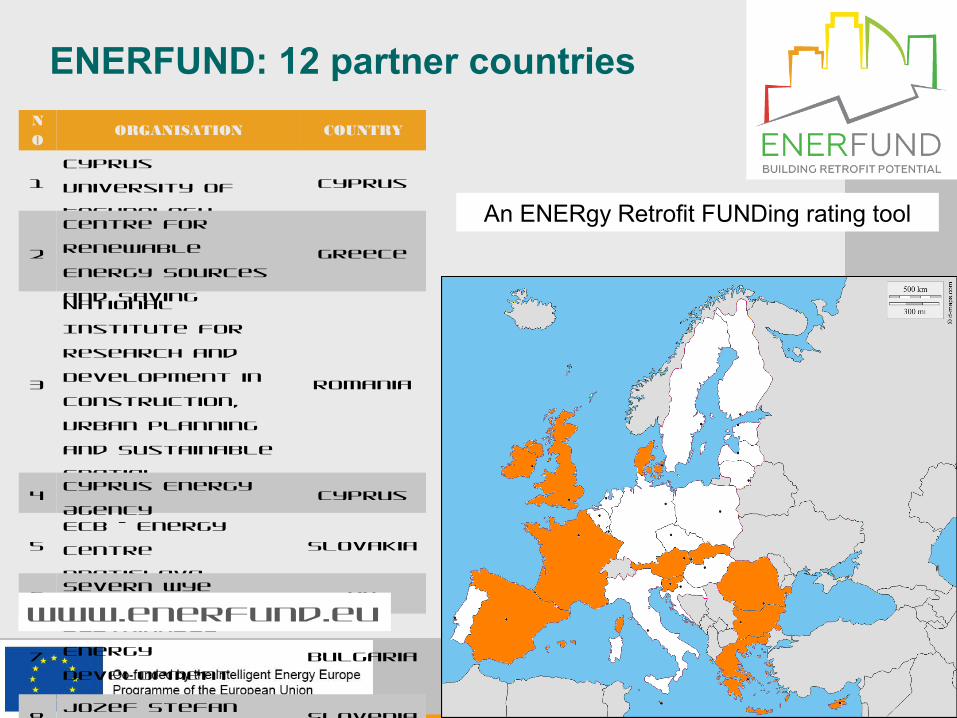
ENERFUND: 12 partner countriesNO
ORGANISATION COUNTRY
1Cyprus University of Technology
Cyprus
2
Centre for Renewable Energy Sources and Saving
Greece
3
National Institute for Research and Development in Construction, Urban Planning and Sustainable Spatial Development
Romania
4 Cyprus Energy Agency
Cyprus
5ECB – Energy Centre Bratislava
Slovakia
6 Severn Wye Energy Agency
UK
7
Sustainable Energy Development Agency
Bulgaria
8 Jozef Stefan Institute
Slovenia
9 Aalborg University
Denmark
10
Valencia Institute of Building
Spain
11
SERA energy & resources e.U
Austria
12
Energy Action Ltd
Ireland
13
ENERMAP Ltd Cyprus
14
Energies 2050 France
15
Ministry of Regional Development and Public Administration
Romania
An ENERgy Retrofit FUNDing rating tool
www.enerfund.eu
15
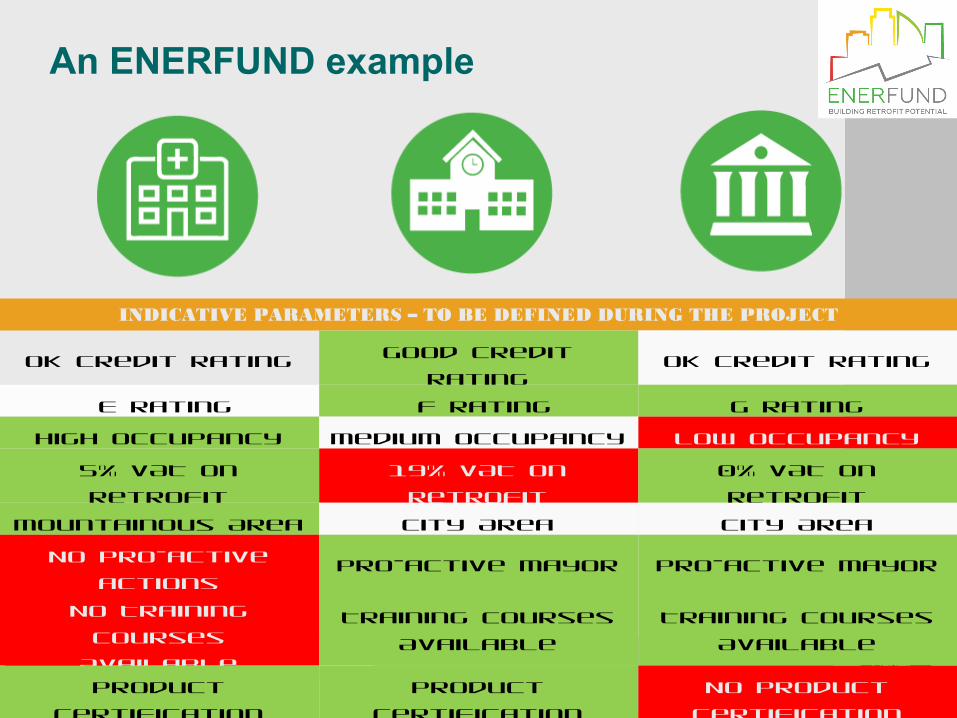
INDICATIVE PARAMETERS – TO BE DEFINED DURING THE PROJECT
OK Credit Rating Good Credit Rating
OK Credit Rating
E Rating F Rating G Rating High Occupancy Medium Occupancy Low Occupancy
5% VAT on retrofit
19% VAT on retrofit
0% VAT on retrofit
Mountainous Area City Area City AreaNo pro-active
actionsPro-active Mayor Pro-active Mayor
No Training Courses Available
Training Courses Available
Training Courses Available
Product Certification
Scheme
Product Certification
Scheme
No Product Certification
Scheme
An ENERFUND example
16"The sole responsibility for the content of this presentation lies with the authors. It does not represent the opinion of the Community. The European Commission is not responsible for any use that may be made of the information contained therein."
Thanks for [email protected]