Deep Panuke Offshore Gas Development · PDF fileDeep Panuke Offshore Gas Development ... gas...
200
Deep Panuke Offshore Gas Development Environmental Assessment Report November 2006 Volume 4
-
Upload
nguyendieu -
Category
Documents
-
view
213 -
download
1
Transcript of Deep Panuke Offshore Gas Development · PDF fileDeep Panuke Offshore Gas Development ... gas...

Deep Panuke Offshore Gas DevelopmentEnvironmental Assessment Report
Nov
embe
r 2
00
6
Volume 4

DEEP PANUKE OFFSHORE GAS DEVELOPMENT
ENVIRONMENTAL ASSESSMENT REPORT VOLUME 4
Document No.: DMEN-X00-RP-RE-00-0005 Rev 01U
Prepared by: EnCana Corporation
Suite 700, 1701 Hollis Street Halifax, Nova Scotia
B3J 3M8
November 2006

Deep Panuke Volume 4 (Environmental Assessment Report)• November 2006 1
PREFACE
This Environmental Assessment Report is the fourth of five documents comprising a Development Plan Application (DPA) for approval of the Deep Panuke Offshore Gas Development. The documents comprising the DPA are as follows:
Volume 1 Project SummaryVolume 2 Development PlanVolume 3 Canada-Nova Scotia Benefits PlanVolume 4 Environmental Assessment ReportVolume 5 Socio-Economic Impact Statement
Volume 1, the Project Summary, summarizes the DPA and provides a description of the Project for a general review.
Volume 2, the Development Plan, describes the development strategy and includes details on subsurface interpretation, drilling, processing, facilities, and environmental and safety management for the Project.
Volume 3, the Canada-Nova Scotia Benefits Plan, describes the processes to promote Canada and Nova Scotia benefits associated with the Project.
Volume 4, the Environmental Assessment (EA) Report, describes the physical and biological environment in which the Project will operate, provides an assessment of the potential environmental, and socio-economic effects of the Project, and identifies mitigation measures.
Volume 5, the Socio-Economic Impact Statement (SEIS) provides a summary of the existing socio-economic conditions and a summary of the potential impacts with the project.

Deep Panuke Volume 4 (Environmental Assessment Report) November 2006
ES-i
EXECUTIVE SUMMARY
In December 2002, EnCana Corporation (EnCana) received Ministerial approval for the Deep Panuke Comprehensive Study Report (CSR; approved 2002 CSR). Approval was based on a project comprising three offshore platforms producing 11.3 x 10⁶ m3/d [400 MMscfd] of sales gas through a dedicated 610 mm [24 inch], 176 km export pipeline with tie-in to Maritimes and Northeast Pipeline (M&NP) facilities. In February 2003, just prior to the public hearing process for application to the Canada-Nova Scotia Offshore Petroleum Board (CNSOPB) and National Energy Board (NEB), a project “time-out” was requested by EnCana to allow further review and refinement of the Project. Between 2003 and 2006, EnCana completed the re-evaluation phase and is now re-filing a Development Plan Application (DPA) and NEB application based on a new project basis (the Project).
As part of pre-filing consultation with regulators, EnCana identified elements of the previously approved 2002 CSR that are still valid for the revised Project. The Canadian Environmental Assessment Act (CEAA) permits the use of previously conducted assessments. Section 24 of CEAA requires that previous environmental assessments (EAs) be used to whatever extent is appropriate in conducting the EA of the revised Project.
Section 24 of CEAA reads as follows:
24. (1) Where a proponent proposes to carry out, in whole or in part, a project for which an environmental assessment was previously conducted and (a) the project did not proceed after the assessment was completed, (b) in the case of a project that is in relation to a physical work, the proponent proposes
an undertaking in relation to that work different from that proposed when the assessment was conducted,
(c) the manner in which the project is to be carried out has subsequently changed, or (d) the renewal of a licence, permit, approval or other action under a prescribed
provision is sought, the responsible authority shall use that assessment and the report thereon to whatever extent is appropriate for the purpose of complying with section 18 or 21.
(2) Where a responsible authority uses an environmental assessment and the report thereon pursuant to subsection (1), the responsible authority shall ensure that any adjustments are made to the report that are necessary to take into account any significant changes in the environment and in the circumstances of the project and any significant new information relating to the environmental effects of the project.
Deep Panuke Volume 4 (Environmental Assessment Report)• November 2006 ES-ii
Pursuant to Section 17 of CEAA, the Responsible Authorities (RAs) have delegated the conduct of the environmental assessment to the proponent. This environmental assessment report (EA Report) (DPA Volume 4) will also be submitted to the CNSOPB to form the Environmental Impact Statement (EIS) component of the DPA and to the NEB to form the EA component of the pipeline application. The EA Report will be distributed for public comment under the CSR process and will form the basis for the CSR to be prepared by the RAs following the public comment period.
EnCana filed a Project Description on August 28, 2006 to initiate provisions of the Federal Coordination Regulations pursuant to CEAA. A draft scoping document was released for public review in September 2006. A final scoping document was released in November 2006.
Project Overview
EnCana holds a majority working interest in and is the Operator of Deep Panuke, which is located approximately 250 km southeast of Halifax, Nova Scotia (NS) and about 48 km west of Sable Island on the Scotian Shelf. The Project design consists of a jack-up mobile offshore production unit (MOPU) in a water depth of approximately 44 m. The Project will initially include re-completing four previously drilled wells and drilling a new production well and a new acid gas injection well. Up to three additional subsea production wells could be drilled. All subsea wells will be tied back individually to the MOPU with subsea flowlines and control umbilicals.
The export system will consist of a single subsea pipeline delivering Deep Panuke sales product to one of two delivery points (collectively referred to as the “Proposed Project Options”):
• Goldboro, Nova Scotia, to an interconnection with M&NP (herein referred to as the “M&NP Option”); or
• the Sable Offshore Energy Project (SOEP) 660 mm [26 inch] export pipeline at a close point on the pipeline route to Goldboro (herein referred to as the “SOEP Subsea Option”).
The gas processing system will include inlet compression, separation, sweetening, dehydration, export compression and measurement. Deep Panuke is considered a sour gas reservoir with raw gas containing approximately 0.18% hydrogen sulphide (H2S); therefore, gas sweetening equipment is required. Acid gas processing will be performed offshore through application of an amine unit to remove H2S and carbon dioxide (CO2), collectively also known as acid gas. Subsequent to its removal from the raw gas stream, the acid gas will be disposed by injection into a suitable reservoir. Disposal of acid gas by injection compared to other potential disposal options (e.g., flaring) will result in an annual reduction of CO2 equivalent of 34 kilotonnes to the atmosphere and will reduce total sulphur emissions to negligiblelevels. Acid gas injection will yield an approximate 18% reduction in total annual CO2 equivalent emissions for the Project.

Deep Panuke Volume 4 (Environmental Assessment Report) November 2006
ES-iii
For the M&NP Option, hydrocarbon dewpointing is required on the MOPU. The condensate stream will be treated and used for fuel. Currently, it is estimated that there will be no surplus condensate produced beyond fuel usage; however, in the event that condensate must be injected, it will be disposed with the acid gas stream in the injection well. For the SOEP Subsea Option, treated condensate will be re-combined with the gas in the multi-phase export pipeline.
The production facility will have a design capacity of 8.5 x10⁶ m3/d [300 MMscfd] with turndown capability to 1.1 x10⁶ m3/d [40 MMscfd].
The major modifications between the revised Project basis and the Project basis for the approved 2002 CSR include:
production design capacity of 8.5 x 10⁶ m3/d [300 MMscfd] versus 11.3 x 10⁶ m3/d [400 MMscfd];subsea wellheads with subsea tie-backs versus platform wells; single integrated installation (MOPU) versus three fixed platforms; revised field centre location; additional export (multi-phase) pipeline option (SOEP Subsea Option); and greater produced water discharge rate.
Table ES.1 provides a more detailed comparison between the Project basis for the approved 2002 CSR and the revised Project basis.
Table ES.1 Comparison of Approved 2002 CSR Project Basis and the Revised Project Basis
Project Item Base Case (Approved 2002 CSR) M&NP Option SOEP Subsea Option
Well Count and Configuration
Maximum of 8 – platform wells 5-6 new drilled production wells: H08, PI1B, M79A, PP3C and 1-2 future wells 1-2 new drilled injection wells
Maximum of 9 – subsea wells 4 re-entry wells: H-08 (PL 2902), M-79A (PL 2902), F-70 (EL 2387), and D-41 (PL 2901) 1 new production well: H-99 (PL 2902) 1 new injection well D-70 (EL 2387) Up to three future wells (currently undefined locations on PL 2901, SDL 2255H, PL 2902 or EL 2387) Buried flowlines and umbilicals from wellheads to installation
Project Life Expected mean case: 11.5 years Expected mean case: 13.3 years Expected range: 8-17.5 years
Field Centre Base Case Relocated 3.6 km NNE

Deep Panuke Volume 4 (Environmental Assessment Report) November 2006
ES-iv
Table ES.1 Comparison of Approved 2002 CSR Project Basis and the Revised Project Basis
Project Item Base Case (Approved 2002 CSR) M&NP Option SOEP Subsea Option
Base Structure Three fixed platforms including: Production platform Utilities/quarters platform Wellhead platform
1 MOPU Integrated facility
Discharge of Muds / Cuttings for New Wells
Drilled from field centre WBM/cuttings overboard SBM/cuttings skipped and shipped or injected
Drilled from individual well locations WBM/cuttings overboard No SBM
Delivery Point M&NP tie-in Onshore, adjacent to SOEP gas plant
SOEP subsea tie-in SOEP 660 mm [26 inch] pipeline
Export Pipeline 610 mm [24 inch], 176 km Single phase Trenched ~ 50% of route
560 mm [22 inch], 176 km Single phase Trenched ~ 50% of route
510 mm [20 inch], 15 km Multi-phase Trenched 100% of route
Export Gas 11.3 x 10⁶ m3/day [400 MMscfd] Sales quality
8.5 x 10⁶ m3/day [300 MMscfd] Sales quality
8.5 x 10⁶ m3/day [300 MMscfd] Sweet and dehydrated
Export Condensate N/A Maximum of 220 m3/day Sweet and stabilized, commingled with gas
Condensate Use Fuel, surplus injected Sales product
Produced Water Maximum 1,100 to 1,600 m3/day [7,000 to 10,000 bpd] Discharged overboard
Maximum 6,400 m3/day [40,000 bpd] Discharged overboard
Acid Gas Dedicated injection well ~180 x 103 m3/day [6 MMscfd]
Dedicated injection well ~130 x 103m3/day [4.5 MMscfd]
Malfunctions and Accidental Events
EnCana has reviewed the various potential malfunctions and accidental events that may occur during the Project and has updated spill probability analysis, spill behaviour modelling and air quality modelling based on the new Project design and location. Spill probability remains low, with the highest frequency for smaller, platform spills (less than 1 bbl). The probability of a spill from a flowline or export pipeline is estimated to be 0.03% chance per year for spills between 1,000 and 10,000 barrels. In general, the spill behaviour modelling results present potential impact zones similar to or smaller than those identified in the approved 2002 CSR. EnCana has incorporated design features and procedures to

Deep Panuke Volume 4 (Environmental Assessment Report) November 2006
ES-v
virtually eliminate or minimize the risk of major releases. EnCana will also develop and implement safety, spill response and contingency plans to reduce adverse environmental effects in the unlikely event of such incidents.
Public Consultation and Aboriginal Communications
A substantial consultation process on the Project took place between 2000 and 2002 as part of the environmental assessment process leading to the Ministerial approval of the CSR in 2002. In 2006, EnCana initiated a public consultation program to seek public and stakeholder input to the current environmental assessment and Project planning process. Discussions with Aboriginal groups have been initiated with respect to the currently proposed Project and to highlight the findings and conclusions of the EA Report. Issues identified through these processes have been tracked for consideration in Project planning and the preparation of the EA Report. EnCana will continue to proactively communicate with interested stakeholders and will provide supplementary information as part of this ongoing public consultation process. EnCana remains committed to communication around public and stakeholder concerns and the development of mutually constructive relationships.
Scope of the Assessment
The scope of the assessment was defined based on differences between the Project basis for the approved 2002 CSR and the revised Project basis. As such, the EA Report focussed on Project modifications and regulatory, biophysical, and socio-economic updates since the approved 2002 CSR. These modifications and updates were identified through a review of the Proposed Project Options, regulatory and stakeholder consultation, background research, and professional judgment of the Study Team. The final scope of the assessment was provided by the relevant regulatory authorities in November 2006 following a period of public comment.
Biophysical Valued Environmental Components (VECs) selected for the approved 2002 CSR remained valid and were reselected for this EA Report. The socio-economic VECs selected for this EA Report were updated from the approved 2002 CSR and focussed on social components most likely to be affected by the Proposed Project Options.
Since the scope of this EA Report was limited to modifications and updates from the approved 2002 CSR, potential interactions which had been assessed previously did not require reassessment. Likewise, where a Project modification was predicted to result in a lower effect than that previously assessed (e.g.,smaller footprint, less emissions), in general, the effects analysis presented in the approved 2002 CSR was referenced and no further analysis was required.

Deep Panuke Volume 4 (Environmental Assessment Report) November 2006
ES-vi
Based on this scoping exercise, the following VECs were selected:
Air Quality Marine Water Quality Marine Benthos Marine Fish Marine Mammals and Turtles Marine Related Birds Sable Island Onshore Environment Land Use Economy Commercial Fisheries and Aquaculture Other Ocean Users
The scoping for the cumulative effects assessment (CEA) also focussed on Project modifications and regulatory, biophysical and socio-economic updates since the approved 2002 CSR. The activities considered in the CEA reconsidered those activities that have changed since 2002 such that the cumulative effects would differ from that originally predicted, or interact cumulatively with the revised Project options, resulting in different cumulative effects than originally predicted for the approved 2002 CSR.
Biophysical Assessment
In general, effects on biophysical VECs were predicted to be similar to or less than, those presented in the approved 2002 CSR. As was the case in the approved 2002 CSR, the only predicted significant adverse effect is the effect on air quality in the unlikely event of a well blowout or piping rupture resulting in the release of large amounts of acid gas. Such an event could have health and safety consequences for platform workers and passengers on vessels downwind. Design prevention measures, rendering such an event extremely unlikely, and emergency response contingency planning will further reduce the likelihood that workers or others would be seriously affected by emissions. Air quality modelling for accidental events indicates exposure levels to receptors on Sable Island remain not significant and have decreased from that originally predicted in the approved 2002 CSR. Spill modelling indicates that accidental releases of hydrocarbon from the Project will dissipate quickly without widespread effects and would not reach Sable Island.
Modelling studies of produced water discharges and drill wastes were updated to reflect Project modifications. Despite the greater volumes of produced water discharges, modelling has shown that

Deep Panuke Volume 4 (Environmental Assessment Report)• November 2006 ES-vii
these discharges are not expected to result in significant adverse effects on marine water quality or marine organisms. Project modifications will result in lower total WBM and cuttings discharges spread over a larger area (i.e., disposed at well sites, not a single platform location). Dispersion modelling of these discharges reveal an increased initial dispersion of drilling wastes, resulting in smaller cutting piles.
New Project related effects not considered in the approved 2002 CSR include potential effects on wetlands and freshwater habitat as a result of onshore components for the M&NP Option. EnCana is currently in discussions with landowners to finalize the routing of the onshore pipeline (and location of associated facilities). Through these discussions, EnCana will make every reasonable effort to minimize interactions with wetlands or any other sensitive onshore environmental features. Analysis of potential effects of the Project on the onshore environment assumed that EnCana may be unable to avoid wetlands and watercourse crossings. Mitigation and follow-up to minimize adverse effects on these features have been included and there are not predicted to be any significant residual adverse effects.
The biophysical CEA focussed largely on potential cumulative effects with the proposed Keltic Petrochemical Inc. petrochemical facility and LNG project (Keltic/Maple Project), which is planned to begin construction in the Goldboro Industrial Park in 2007. Spatial and temporal overlap between the Keltic/Maple Project and the Deep Panuke Project could result in cumulative effects on the nearshore and onshore environment. However, due to mitigation and monitoring/follow-up proposed by both proponents (EnCana and Keltic/Maple), these effects are not likely to be significant.
Socio-economic Assessment
The socio-economic impact assessment presented in this EA Report builds upon the socio-economic impact assessment prepared and filed in 2002. In this EA Report, the socio-economic impact assessment concentrated on offshore (Commercial Fisheries and Aquaculture, Other Ocean Users) and onshore (Land Use) effects. Economic impacts associated with the revised Project were presented in the Economy VEC.
The Deep Panuke Project is not likely to have significant adverse socio-economic effects. The Project will bring positive socio-economic benefits to the Province of Nova Scotia and represents an important step in the further development of the offshore oil and gas industry in Atlantic Canada. The Project is predicted to result in employment, business, and training opportunities, and contribute to economic stability and growth within the Province of Nova Scotia and for all Canadians. By bringing a second offshore natural gas field into production, the Project strengthens and diversifies the supply of natural gas in the Province and other domestic markets in Canada.

Deep Panuke Volume 4 (Environmental Assessment Report)• November 2006 ES-viii
EnCana and the Province of Nova Scotia have worked collaboratively to agree to commitments for potential development of Deep Panuke with respect to Nova Scotian opportunities and other issues including royalty treatment and funding of research and development, education and training, and programs for disadvantaged groups. These commitments were documented in the Offshore Strategic Energy Agreement (OSEA) signed on June 22, 2006. The Project will contribute positively to local and provincial employment, incomes and gross economic output. During the Deep Panuke Project, EnCana has committed to certain levels of economic activity within Nova Scotia. EnCana will continue to provide manufacturers, consultants, contractors, service companies in Nova Scotia and other parts of Canada with a full and fair opportunity to participate on a competitive basis in the supply of goods and services required for the Project.
Positive effects are predicted for Land Use and Economy as the Project will be consistent with designated use in the Goldboro Industrial Park and will contribute to economic development.
In the unlikely event of a pipeline rupture and fire associated with the onshore or landfall portion of EnCana’s pipeline (M&NP Option), there is potential to cause a significant adverse effect on land use if the Keltic/Maple facilities become involved causing large scale fire and/or release of dangerous materials. A detailed quantitative risk analysis considering potential risk synergies between the nearshore/onshore components of the Project with the proposed Keltic/Maple Project will be undertaken during detailed route design in conjunction with further Keltic/Maple Project planning and design. Compliance with all applicable design codes and standards will ensure that cumulative risks of hazard to land use and inhabitants between the two projects are extremely low.
The offshore pipeline route options will interact with an experimental sea cucumber fishery (M&NP Option only) and quahog fishery. Current plans are that quahogs will be harvested prior to construction, thereby limiting the potential for effects on this fishery. The potential effects on the sea cucumber fishery, if the fishery is indeed developed, are expected to be limited due the small area of overlap with Project activities and the low density of sea cucumbers.
Effects on marine navigation are predicted to be not significant given implementation of appropriate mitigation, including effective communication with other ocean users. The issuance of Notices to Mariners during installation activities and the charting of all Project infrastructure and safety zones will decrease the likelihood of interaction between vessels and Project components. No significant adverse effects are predicted on socio-economic VECs.
Similar to the biophysical CEA, the socio-economic CEA focussed largely on potential cumulative effects with the Keltic/Maple Project. The environmental assessment for the Keltic/Maple Project predicted significant economic benefits and significant demands on the local transportation infrastructure as a result of project development. There is predicted to be a positive cumulative effect on

Deep Panuke Volume 4 (Environmental Assessment Report) November 2006
ES-ix
the economy as a result of the two projects. The cumulative contribution of EnCana’s onshore construction activities (M&NP Option) and the Keltic/Maple Project to adverse effects on transportation infrastructure will be relatively small and mitigated. Proponents of the Keltic/Maple Project have also committed to working with local authorities to help mitigate transportation effects to non-significant levels.
The socio-economic CEA also considered cumulative effects associated with subsea infrastructure and safety (fishing exclusion) zones on commercial fisheries. The proposed safety zone for the Deep Panuke Project is not located within a heavily fished area. In summary, significant adverse cumulative socio-economic effects are not considered likely.
Effects of the Environment on the Project
As predicted in the approved 2002 CSR, effects of the environment on the Project are not considered to be significant. Project facilities will be designed and installed based on the appropriate environmental design criteria to ensure the safety and integrity of these facilities during severe environmental conditions. Monitoring and/or contingency planning will also serve to minimize adverse effects.
Environmental Management Features and Commitments
EnCana will honour all commitments made in the approved 2002 CSR except where a commitment is no longer valid due to Project design modifications or other updates. In addition, this EA Report identifies new commitments to minimize adverse effects that could occur as a result of these design modifications. Section 11 of this EA Report summarizes these exceptions and new commitments. The following is a list of key environmental management features of the Project and other commitments made by EnCana to minimize adverse environmental effects of the Project:
injection of waste acid gas into a suitable geological structure which will reduce potential atmospheric emissions of greenhouse gases (GHG) (by 18% ) and sulphur compounds ( >99%) during routine operations;an internal design target (25 mg/L) for oil in produced water which is lower than the regulatory limit (30 mg/L, 30-day rolling weighted average); in addition to a hydrocyclone, use of a dedicated full-time polishing unit (organophillic clay type) and stripping tower to reduce hydrocarbons (and potentially other chemicals) and H2Srespectively in produced water prior to discharge; co-operation with the Fisheries and Oceans (DFO) Centre for Offshore Oil and Gas Environmental Research (COOGER) on investigating fate and effects of produced water discharges from the MOPU;

Deep Panuke Volume 4 (Environmental Assessment Report) November 2006
ES-x
in addition to a separator tank, use of a dedicated full-time polishing unit (organophillic clay type) to reduce hydrocarbons (and potentially other chemicals) in deck drainage prior to discharge;use of water-based muds only; recovery of waste heat during offshore operations; use of surplus condensate for offshore power generation (M&NP Option); use of an existing pipeline corridor (M&NP Option) or pipeline (SOEP Option) for transporting gas to shore; design (protective concrete coating) and/or installation (burial) of pipelines/flowlines to minimize interactions with fishing activities; Project configuration and planned mitigation to avoid harmful alteration of fish habitat as defined under the Fisheries Act and disposal at sea as defined under the Canadian Environmental Protection Act (CEPA);no nearshore pipeline construction during lobster fishing season (April 19 to June 20) which also covers the period when the endangered Roseate Tern typically prospects for nests and lays eggs on nearby Country Island (May 1 to June 20); routing of the onshore pipeline to minimize interactions with sensitive environmental locations such as wetlands and major stream crossings where possible; and adherence to corporate Codes of Practice for Sable Island, Country Island and the Gully Marine Protected Area.
Conclusions
In conclusion, the Deep Panuke Project is not likely to have significant adverse effects on the environment. The Project will contribute positively to the Canadian and Nova Scotia economies by establishing a viable facility and operation. The Project will reduce adverse environmental effects to acceptable levels through the use of technically and economically feasible design and mitigation measures.

Deep Panuke Volume 4 (Environmental Assessment Report) November 2006 i
Table of Contents Page No.
EXECUTIVE SUMMARY ................................................................................................................ ES-1 1 INTRODUCTION........................................................................................................................... 1-1
1.1 Project Overview .................................................................................................................... 1-2 1.2 Purpose and Need for the Project............................................................................................ 1-6 1.3 Regulatory and Planning Context ........................................................................................... 1-6 1.4 Scope of the Assessment......................................................................................................... 1-8
1.5 Project Study Area .................................................................................................. 1-82 PROJECT DESCRIPTION ........................................................................................................... 2-1 2.1 Reservoir Description .............................................................................................................. 2-1 2.2 Project Infrastructure Components .......................................................................................... 2-3 2.2.1 Mobile Offshore Production Unit (MOPU)................................................................ 2-3 2.2.2 Subsea Wells and Flowlines ....................................................................................... 2-5 2.2.3 Export Pipeline............................................................................................................ 2-5 2.2.4 Onshore Pipeline and Facilities ................................................................................ 2-10 2.3 Construction and Installation ................................................................................................. 2-14 2.3.1 MOPU Facilities ....................................................................................................... 2-14 2.3.2 Export Pipeline.......................................................................................................... 2-16 2.3.3 Subsea Tie-In Facilities............................................................................................. 2-16 2.3.4 Subsea Flowlines and Umbilicals ............................................................................. 2-17 2.3.5 Construction Methods Involving Sediment Displacement ....................................... 2-18 2.3.6 Subsea Equipment and Associated Protection Structures......................................... 2-19 2.3.7 Onshore Facilities and Pipeline (M&NP Option Only)............................................ 2-22 2.3.8 Development Well Construction............................................................................... 2-22 2.3.9 Hydrostatic Testing................................................................................................... 2-29 2.4 Operations .............................................................................................................................. 2-31 2.4.1 Production................................................................................................................. 2-31 2.4.2 Utilities...................................................................................................................... 2-40 2.4.3 Support and Servicing............................................................................................... 2-42 2.4.4 Project Safety Zones ................................................................................................. 2-43 2.4.5 Onshore Facilities ..................................................................................................... 2-44 2.5 Decommissioning and Abandonment .................................................................................... 2-44 2.6 Project Schedule..................................................................................................................... 2-45 2.7 Emissions and Discharges...................................................................................................... 2-46 2.7.1 Air Emissions............................................................................................................ 2-46 2.7.2 Noise Emissions........................................................................................................ 2-52 2.7.3 Electromagnetic Emissions....................................................................................... 2-52

Deep Panuke Volume 4 (Environmental Assessment Report) November 2006 ii
2.7.4 Drill Waste Discharges ............................................................................................. 2-53 2.7.5 Effluent Discharges................................................................................................... 2-55 2.7.6 Naturally Occurring Radioactive Material (NORM)................................................ 2-57 2.7.7 Non-Hazardous Solid Wastes ................................................................................... 2-57 2.8 Hazardous Materials and Waste............................................................................................. 2-57 2.9 Environmental and Safety Protection Systems ...................................................................... 2-57 2.9.1 Equipment Inspection and Maintenance................................................................... 2-57 2.9.2 Pipeline Leak Prevention .......................................................................................... 2-58 2.9.3 Blowout Prevention Safeguards................................................................................ 2-58 2.9.4 Flowline Protection................................................................................................... 2-59 2.9.5 Subsea Protection Structures..................................................................................... 2-60 2.9.6 Project Safety Zones ................................................................................................. 2-60 2.10 Project Alternatives............................................................................................................... 2-60 2.10.1 Alternatives to the Project......................................................................................... 2-60 2.10.2 Alternatives Means of Carrying Out the Project....................................................... 2-603 MALFUNCTIONS AND ACCIDENTAL EVENTS ................................................................... 3-1 3.1 Potential Malfunctions and Accident Events.......................................................................... 3-1 3.1.1 Platform-based Spills ................................................................................................. 3-2 3.1.2 Collisions ................................................................................................................... 3-2 3.1.3 Malfunction of Acid Gas Management System......................................................... 3-2 3.1.4 Blowout Releases....................................................................................................... 3-3 3.1.5 Pipeline and Flowline Releases ................................................................................. 3-3 3.1.6 Effects of the Environment on the Project ................................................................. 3-3 3.2 Marine Spill Risk and Probability............................................................................................ 3-4 3.2.1 Platform-based Spills ................................................................................................. 3-4 3.2.2 Blowouts .................................................................................................................... 3-4 3.2.3 Spills from Pipelines and Flowline Operations ......................................................... 3-6 3.3 Onshore Pipeline Risk.............................................................................................................. 3-6 3.3.1 Accident Scenarios..................................................................................................... 3-6 3.3.2 Hazards ...................................................................................................................... 3-7 3.3.3 Risks........................................................................................................................... 3-7 3.4 Marine Spill Release Behaviour .............................................................................................. 3-8 3.4.1 Platform-based Spills .................................................................................................. 3-8 3.4.2 Blowouts and Pipeline/Flowline Ruptures................................................................ 3-10 4 ENVIRONMENTAL MANAGEMENT........................................................................................ 4-1 4.1 Environmental Management Framework ................................................................................. 4-1 4.1.1 Corporate Responsibility Policy ................................................................................. 4-2 4.1.2 EHS Best Practice Management System .................................................................... 4-3 4.1.3 Deep Panuke EHS Management System Guidance Manual....................................... 4-4
Deep Panuke Volume 4 (Environmental Assessment Report) November 2006 iii
4.2 Stakeholder Consultation........................................................................................................ 4-4 4.3 Deep Panuke Emergency Management Plan .......................................................................... 4-5 4.4 Deep Panuke Spill Reponse Plan............................................................................................ 4-5 4.5 Deep Panuke Environmental Effects Monitoring Plan........................................................... 4-5 4.6 Environmental Protection Plan ............................................................................................... 4-6 5 PUBLIC CONSULTATION PROGRAM..................................................................................... 5-1 5.1 Consultation Program Background and Objectives................................................................. 5-1 5.2 Consultation Activities............................................................................................................. 5-2 5.2.1 Public Consultation Stages ......................................................................................... 5-2 5.2.2 Phase I - Stakeholder Identification and Preliminary Communications..................... 5-2 5.2.3 Phase II – Consultation on the Project Description, Issues Identified and Scoping ... 5-5 5.2.4 Phase III - Follow-up and Ongoing Communication.................................................. 5-7 5.2.5 Aboriginal Communications....................................................................................... 5-7 5.3 Integration of Issues and Concerns into Project Planning ....................................................... 5-86 IMPACT ASSESSMENT SCOPE AND METHODS ................................................................. 6-1 6.1 Scope of the Assessment......................................................................................................... 6-1 6.2 Selection of Valued Environmental Components................................................................... 6-1 6.3 Potential Interaction between Project Activities and Valued Environmental Components.................................................................................................. 6-14 6.4 Environmental Effects Assessment Framework ................................................................... 6-14 6.5 Scoping of Cumulative Effects Assessment ......................................................................... 6-26 7 BIOPHYSICAL AND SOCIO-ECONOMIC SETTING............................................................ 7-1 7.1 Biophysical Setting ................................................................................................................. 7-1 7.1.1 Marine Physical Environment.................................................................................... 7-1 7.1.2 Marine Biological Environment ................................................................................ 7-2 7.1.3 Onshore Environment .............................................................................................. 7-16 7.1.4 Summary of Special Status Species......................................................................... 7-22 7.2 Socio-economic Setting ......................................................................................................... 7-27 7.2.1 Land Use ................................................................................................................... 7-27 7.2.2 Economy ................................................................................................................... 7-30 7.2.3 Fisheries and Aquaculture......................................................................................... 7-32 7.2.4 Other Ocean Users .................................................................................................... 7-44 8 BIOPHYSICAL IMPACT ASSESSMENT.................................................................................. 8-1 8.1 Air Quality .............................................................................................................................. 8-1 8.1.1 Boundaries ................................................................................................................. 8-1 8.1.2 Residual Environmental Effects Evaluation Criteria................................................. 8-1 8.1.3 Project Modifications and Potential Interactions....................................................... 8-4 8.1.4 Analysis, Mitigation, and Residual Environmental Effects Prediction ..................... 8-6 8.1.5 Follow-up and Monitoring....................................................................................... 8-26
Deep Panuke Volume 4 (Environmental Assessment Report) November 2006 iv
8.1.6 Sustainable Use of Renewable Resources ............................................................... 8-27 8.1.7 Summary of Residual Environmental Effects Assessment...................................... 8-27 8.2 Marine Water Quality ........................................................................................................... 8-33 8.2.1 Boundaries ............................................................................................................... 8-33 8.2.2 Residual Environmental Effects Evaluation Criteria............................................... 8-33 8.2.3 Project Modifications and Potential Interactions..................................................... 8-33 8.2.4 Analysis, Mitigation and Residual Environmental Effects Prediction .................... 8-35 8.2.5 Follow-up and Monitoring....................................................................................... 8-41 8.2.6 Sustainable Use of Renewable Resources ............................................................... 8-42 8.2.7 Summary of Residual Environmental Effects Assessment...................................... 8-42 8.3 Marine Benthos..................................................................................................................... 8-47 8.3.1 Boundaries ............................................................................................................... 8-47 8.3.2 Residual Environmental Effects Evaluation Criteria............................................... 8-47 8.3.3 Project Modifications and Potential Interactions..................................................... 8-48 8.3.4 Analysis, Mitigation and Residual Environmental Effects Prediction .................... 8-51 8.3.5 Follow-up and Monitoring....................................................................................... 8-61 8.3.6 Sustainable Use of Renewable Resources ............................................................... 8-62 8.3.7 Summary of Residual Environmental Effects Assessment...................................... 8-62 8.4 Marine Fish ........................................................................................................................... 8-66 8.4.1 Boundaries ............................................................................................................... 8-66 8.4.2 Residual Environmental Effects Evaluation Criteria............................................... 8-66 8.4.3 Project Modifications and Potential Interactions..................................................... 8-67 8.4.4 Analysis, Mitigation and Residual Environmental Effects Prediction .................... 8-69 8.4.5 Follow-up and Monitoring....................................................................................... 8-77 8.4.6 Sustainable Use of Renewable Resources ............................................................... 8-77 8.4.7 Summary of Residual Environmental Effects Assessment...................................... 8-77 8.5 Marine Mammals and Turtles................................................................................................ 8-82 8.5.1 Boundaries ............................................................................................................... 8-82 8.5.2 Residual Environmental Effects Evaluation Criteria............................................... 8-82 8.5.3 Project Modifications and Potential Interactions..................................................... 8-82 8.5.4 Analysis, Mitigation and Residual Environmental Effects Prediction .................... 8-85 8.5.5 Follow-up and Monitoring....................................................................................... 8-87 8.5.6 Sustainable Use of Renewable Resources ............................................................... 8-87 8.5.7 Summary of Residual Environmental Effects Assessment...................................... 8-88 8.6 Marine Related Birds ............................................................................................................ 8-92 8.6.1 Boundaries ............................................................................................................... 8-92 8.6.2 Residual Environmental Effects Evaluation Criteria............................................... 8-92 8.6.3 Project Modifications and Potential Interactions..................................................... 8-93 8.6.4 Analysis, Mitigation and Residual Environmental Effects Prediction .................... 8-95
Deep Panuke Volume 4 (Environmental Assessment Report) November 2006 v
8.6.5 Follow-up and Monitoring....................................................................................... 8-98 8.6.6 Sustainable Use of Renewable Resources ............................................................... 8-98 8.6.7 Summary of Residual Environmental Effects Assessment...................................... 8-98 8.7 Sable Island.......................................................................................................................... 8-102 8.7.1 Boundaries ............................................................................................................. 8-102 8.7.2 Residual Environmental Effects Evaluation Criteria............................................. 8-102 8.7.3 Project Modifications and Potential Interactions................................................... 8-103 8.7.4 Analysis, Mitigation and Residual Environmental Effects Prediction .................. 8-104 8.7.5 Follow-up and Monitoring..................................................................................... 8-105 8.7.6 Sustainable Use of Renewable Resources ............................................................. 8-105 8.7.7 Summary of Residual Environmental Effects Assessment.................................... 8-105 8.8 Onshore Environment ......................................................................................................... 8-107 8.8.1 Boundaries ............................................................................................................. 8-107 8.8.2 Residual Environmental Effects Evaluation Criteria............................................. 8-107 8.8.3 Project Modifications and Potential Interactions................................................... 8-107 8.8.4 Analysis, Mitigation and Residual Environmental Effects Prediction .................. 8-110 8.8.5 Follow-up and Monitoring..................................................................................... 8-115 8.8.6 Sustainable Use of Renewable Resources ............................................................. 8-116 8.8.7 Summary of Residual Environmental Effects Assessment.................................... 8-116 8.9 Biophysical Cumulative Effects Assessment...................................................................... 8-121 8.9.1 Air Quality ............................................................................................................. 8-121 8.9.2 Marine Water Quality ............................................................................................ 8-123 8.9.3 Marine Benthos...................................................................................................... 8-124 8.9.4 Marine Fish ............................................................................................................ 8-126 8.9.5 Marine Mammals and Turtles................................................................................ 8-128 8.9.6 Marine Related Birds ............................................................................................. 8-129 8.9.7 Sable Island............................................................................................................ 8-130 8.9.8 Onshore Environment ............................................................................................ 8-130 8.9.9 Summary ................................................................................................................ 8-131 9 SOCIOECONOMIC EFFECTS ASSESSMENT ........................................................................ 9-1 9.1 Land Use ................................................................................................................................. 9-1 9.1.1 Boundaries ................................................................................................................. 9-1 9.1.2 Residual Environmental Effects Evaluation Criteria................................................. 9-1 9.1.3 Project Modifications and Potential Interactions....................................................... 9-2 9.1.4 Analysis, Mitigation and Residual Environmental Effects Prediction ...................... 9-4 9.1.5 Follow-up and Monitoring......................................................................................... 9-5 9.1.6 Sustainable Use of Renewable Resources ................................................................. 9-6 9.1.7 Summary of Residual Environmental Effects Assessment........................................ 9-6

Deep Panuke Volume 4 (Environmental Assessment Report) November 2006 vi
9.2 Economy ............................................................................................................................... 9-11 9.2.1 Boundaries ............................................................................................................... 9-11 9.2.2 Residual Environmental Effects Evaluation Criteria............................................... 9-11 9.2.3 Project Modifications and Potential Interactions..................................................... 9-12 9.2.4 Analysis, Mitigation and Residual Environmental Effects Prediction .................... 9-17 9.2.5 Follow-up and Monitoring....................................................................................... 9-19 9.2.6 Sustainable Use of Renewable Resources ............................................................... 9-19 9.2.7 Summary of Residual Environmental Effects Assessment...................................... 9-19 9.3 Commercial Fisheries and Aquaculture................................................................................ 9-23 9.3.1 Boundaries ................................................................................................................ 9-23 9.3.2 Residual Environmental Effects Evaluation Criteria................................................ 9-24 9.3.3 Project Modifications and Potential Interactions...................................................... 9-24 9.3.4 Analysis, Mitigation and Residual Environmental Effects Prediction ..................... 9-27 9.3.5 Follow-up and Monitoring........................................................................................ 9-31 9.3.6 Sustainable Use of Renewable Resources ................................................................ 9-31 9.3.7 Summary of Residual Environmental Effects Assessment....................................... 9-31 9.4 Other Ocean Users ................................................................................................................. 9-37 9.4.1 Boundaries ................................................................................................................ 9-37 9.4.2 Residual Environmental Effects Evaluation Criteria................................................ 9-37 9.4.3 Project Modifications and Potential Interactions...................................................... 9-38 9.4.4 Analysis, Mitigation and Residual Environmental Effects Prediction ..................... 9-40 9.4.5 Follow-up and Monitoring........................................................................................ 9-41 9.4.6 Sustainable Use of Renewable Resources ................................................................ 9-41 9.4.7 Summary of Residual Environmental Effects Assessment....................................... 9-41 9.5 Socioeconomic Cumulative Effects Assessment ................................................................... 9-45 9.5.1 Land Use ................................................................................................................... 9-45 9.5.2 Economy ................................................................................................................... 9-46 9.5.3 Commercial Fisheries and Aquaculture.................................................................... 9-47 9.5.4 Other Ocean Users .................................................................................................... 9-47 9.5.5 Summary ................................................................................................................... 9-48 10 EFFECTS OF THE ENVIRONMENT ON THE PROJECT................................................. 10-1 11 CONCLUSIONS .......................................................................................................................... 11-1 11.1 Biophysical Impact Assessment ....................................................................................... 11-1 11.2 Socio-Economic Impact Assessment................................................................................ 11-2 11.3 Effects of the Environment on the Project ........................................................................ 11-4 11.4 Environmental Design, Mitigation and Monitoring Measures ......................................... 11-4 11.5 Residual Environmental Effects ..................................................................................... 11-11

Deep Panuke Volume 4 (Environmental Assessment Report) November 2006 vii
12 REFERENCES............................................................................................................................ 12-1 12.1 Literature Cited .................................................................................................................. 12-1 12.2 Personal Communications ............................................................................................... 12-12 LIST OF ACRONYMS .............................................................................................................................1
List of Tables Page No.
Table 1.1 Comparison of Approved 2002 CSR Project Basis and the Revised Project Basis ........... 1-5 Table 2.1 Export Pipeline ................................................................................................................... 2-5 Table 2.2 Construction Methods....................................................................................................... 2-20 Table 2.3 Pile Driving Details .......................................................................................................... 2-23 Table 2.4 Hydrostatic Fluid Discharge Summary............................................................................. 2-30Table 2.5 Acid Gas Injection System – Composition and Flow....................................................... 2-34 Table 2.6 Produced Water Production Rates .................................................................................... 2-37 Table 2.7 Water Composition ........................................................................................................... 2-38 Table 2.8 Routine Project Emissions/Effluents ................................................................................ 2-47 Table 2.9 Deep Panuke Potential Drilling Waste Discharge Summary............................................ 2-55 Table 2.10 Centre Substructure Type Alternatives............................................................................. 2-64 Table 2.11 Processing Location Alternatives ..................................................................................... 2-68 Table 2.12 Acid Gas Handling Development Alternatives ................................................................ 2-71 Table 2.13 Produced Water Disposal Alternatives ............................................................................. 2-73Table 2.14 Condensate Handling........................................................................................................ 2-77 Table 2.15 Acid Gas Injection Location Alternatives ........................................................................ 2-82Table 3.1 Predicted Number of Blowouts and Spills for the Deep Panuke Project............................ 3-5 Table 3.2 Comparison of New Modelling Results with Approved 2002 CSR Modelling Results .. 3-12 Table 5.1 Stakeholders Contacted During Phase I.............................................................................. 5-4 Table 5.2 Integration of Key Issues Overview ................................................................................... 5-9 Table 6.1 Project Modifications and Environmental Assessment Considerations ............................. 6-2 Table 6.2 Changes to Regulatory Environment since the Approved 2002 CSR ................................ 6-6 Table 6.3 Changes to the Biophysical Environment since the Approved 2002 CSR......................... 6-8 Table 6.4 Changes to the Socio-Economic Environment since the Approved 2002 CSR ................. 6-8 Table 6.5 Selection of VECs............................................................................................................. 6-10 Table 6.6 Project Interactions with Biophysical VECs .................................................................... 6-15Table 6.7 Project Interactions with Socio-economic VECs.............................................................. 6-22 Table 6.8 Scoping of Potential Cumulative Interactions with Biophysical VECs ........................... 6-31 Table 6.9 Scoping of Potential Cumulative Interactions with Socio-economic VECs..................... 6-33 Table 7.1 Marine Fish Species at Risk Offshore Nova Scotia............................................................ 7-6 Table 7.2 Rare and Sensitive Vascular Plant Species Potentially Present in the Project Area......... 7-18

Deep Panuke Volume 4 (Environmental Assessment Report) November 2006 viii
Table 7.3 At Risk Bird Species Potentially Present in the Onshore Study Area (ACCDC 2006).... 7-21 Table 7.4 Nova Scotia and Federal Species Rarity Rankings........................................................... 7-24 Table 7.5 Species of Special Status that May Occur in the Study Area ........................................... 7-24 Table 7.6 Age Distribution of Individuals within Nova Scotia, the Halifax Regional Municipality,
and the Municipal Districts of Guysborough and St. Mary’s, 2001 ................................. 7-30 Table 7.7 Summary of Selected Income and Labour Characteristics, 2001..................................... 7-31 Table 7.8 Summary of Labour Force by Industry, 2001................................................................... 7-32Table 7.9 Annual Catch (1992, 2002 to 2005) (tonnes) Within NAFO Unit Areas 4We, 4Wf, and 4Wh ......................................................................................................... 7-37 Table 7.10 Statistical District Landings for Nearshore Fisheries (tonnes) ......................................... 7-42 Table 7.11 Licensed Seasons for Key Fisheries in the Project Area .................................................. 7-43 Table 8.1 Nova Scotia Air Quality Regulations (Environment Act) and Canadian Environmental Protection Act Ambient Air Quality Objectives................................................................. 8-2 Table 8.2 Project Modifications and Potential Interactions Related to Air Quality ........................... 8-4 Table 8.3 Summary of Air Emissions during Project Operations (Normal Conditions,
Malfunctions and Accidental Events)................................................................................. 8-9 Table 8.4 Atmospheric Effects from Normal Production (Minimum Continuous Flaring) ............. 8-13 Table 8.5 Atmospheric Effects from Production with Routine Maintenance (Maximum Continuous Flaring) .......................................................................................................... 8-13 Table 8.6 Nova Scotia GHG Emissions (2003 or most recent) by Sector........................................ 8-14 Table 8.7 Malfunction – Acid Gas Flaring – H2S............................................................................. 8-17 Table 8.8 Malfunction – Acid Gas Flaring – SO2............................................................................. 8-17 Table 8.9 Flare Malfunction During Normal Operations (Venting) CH4......................................... 8-18 Table 8.10 Malfunction – Maximum Flaring – Atmospheric Effects ................................................ 8-19 Table 8.11 Malfunction – Emergency Depressurizing (Blowout) - Atmospheric Effects ................ 8-19 Table 8.12 Acid Gas Injection Well - Subsea Blowout – H2S........................................................... 8-20 Table 8.13 Production Well - Subsea Blowout –– CH4...................................................................... 8-21 Table 8.14 Production Well - Subsea Blowout – H2S ........................................................................ 8-21 Table 8.15 Residual Environmental Effects Assessment Matrix: Air Quality ................................... 8-29 Table 8.16 Residual Environmental Effects Summary: Air Quality .................................................. 8-32 Table 8.17 Project Modifications and Potential Interactions Related to Marine Water Quality ........ 8-34 Table 8.18 Summary of Discharged Water Far-Field Dispersion Modelling Results........................ 8-38 Table 8.19 Residual Environmental Effects Assessment Matrix: Marine Water Quality .................. 8-43 Table 8.20 Residual Environmental Effects Summary: Marine Water Quality ................................. 8-46 Table 8.21 Project Modifications and Potential Interactions Related to Marine Benthos.................. 8-48 Table 8.22 Comparison of Wells and Drill Waste Volumes Between the Revised Project and the .......... Project Basis in the Approved 2002 CSR........................................................................ 8-52 Table 8.23 Summary of Mud/Cutting Discharges .............................................................................. 8-52Table 8.24 Residual Environmental Effects Assessment Matrix: Marine Benthos............................ 8-63

Deep Panuke Volume 4 (Environmental Assessment Report) November 2006 ix
Table 8.25 Residual Environmental Effects Summary: Marine Benthos ........................................... 8-65 Table 8.26 Project Modifications and Potential Interactions Related to Marine Fish ........................ 8-67 Table 8.27 Residual Environmental Effects Assessment Matrix: Marine Fish .................................. 8-78 Table 8.28 Residual Environmental Effects Summary: Marine Fish ................................................. 8-81 Table 8.29 Project Modifications and Potential Interactions Related to Marine Mammals and Turtles ....................................................................................................... 8-83 Table 8.30 Residual Environmental Effects Assessment Matrix: Marine Mammals and Turtles...... 8-89 Table 8.31 Residual Environmental Effects Summary: Marine Mammals and Turtles ..................... 8-91 Table 8.32 Project Modifications and Potential Interactions Related to Marine Related Birds ......... 8-93 Table 8.33 Residual Environmental Effects Assessment Matrix: Marine Related Birds ................... 8-99 Table 8.34 Residual Environmental Effects Summary: Marine Related Birds ................................ 8-101 Table 8.35 Project Modifications and Potential Interactions Related to Sable Island...................... 8-103 Table 8.36 Residual Environmental Effects Summary: Sable Island ............................................... 8-106 Table 8.37 Project Modifications and Potential Interactions Related to Onshore Environment ...... 8-108 Table 8.38 Residual Environmental Effects Assessment Matrix: Onshore Environment ................ 8-117 Table 8.39 Residual Environmental Effect Summary: Onshore Environment................................. 8-120 Table 9.1 Project Modifications and Potential Interactions Related to Land Use .............................. 9-2 Table 9.2 Residual Environmental Effects Assessment Matrix: Land Use ........................................ 9-7 Table 9.3 Residual Environmental Effects Summary: Land Use ..................................................... 9-10 Table 9.4 Project Modifications and Potential Interactions Related to Economy ............................ 9-12 Table 9.5 Estimated Economic Impact from OSEA Commitments ................................................. 9-16 Table 9.6 Residual Environmental Effects Assessment Matrix: Economy ...................................... 9-20 Table 9.7 Residual Environmental Effects Summary: Economy ..................................................... 9-22 Table 9.8 Project Modifications and Potential Interactions Related to Commercial Fisheries and Aquaculture ................................................................................................................ 9-24 Table 9.9 Residual Environmental Effects Assessment Matrix: Commercial Fisheries and Aquaculture....................................................................................................................... 9-33 Table 9.10 Residual Environmental Effects Summary: Commercial Fisheries and Aquaculture..... 9-36 Table 9.11 Project Modifications and Potential Interactions Related to Other Ocean Users ............. 9-38 Table 9.12 Residual Environmental Effects Assessment Matrix: Other Ocean Users ....................... 9-42 Table 9.13 Residual Environmental Effects Summary: Other Ocean Users ...................................... 9-44 Table 11.1 Modified Commitments from Approved 2002 CSR......................................................... 11-6 Table 11.2 Summary of New Commitments for the Deep Panuke Project ...................................... 11-10 Table 11.3 Summary of Residual Environmental Effects ................................................................ 11-11

Deep Panuke Volume 4 (Environmental Assessment Report) November 2006 x
List of Figures Page No.
Figure 1.1 Deep Panuke Location Map ............................................................................................... 1-3 Figure 2.1 Generalized Stratigraphy, Offshore Nova Scotia ............................................................... 2-2Figure 2.2 Proposed Field Rendering .................................................................................................. 2-4 Figure 2.3 Proposed Offshore Pipeline Route ..................................................................................... 2-7 Figure 2.4 Proposed Offshore Pipeline Route Detail # 1..................................................................... 2-8Figure 2.5 Proposed Offshore Pipeline Route Detail # 2..................................................................... 2-9Figure 2.6 Revised Onshore Pipeline Corridor.................................................................................. 2-11 Figure 2.7 Typical Onshore Facility .................................................................................................. 2-13 Figure 2.8 Typical Production Well Schematic................................................................................. 2-26 Figure 2.9 Typical Acid Gas Injection Well Schematic .................................................................... 2-27Figure 2.10 Simplified Process Flow Diagram................................................................................... 2-32 Figure 4.1 Deep Panuke Environmental Management Framework.................................................... 4-2 Figure 6.1 Other Projects and Activities Relative to Deep Panuke Project Area ............................. 6-28 Figure 7.1 Existing Data Sources Consulted for the Characterization of Benthic Habitat................. 7-3 Figure 7.2 2003 DFO Ocean Quahog Distribution and Sea Cucumber Experimental Fishery Zone 1 ................................................................................................................... 7-4 Figure 7.3 Foraging Locations and Critical Habitat for the Roseate Tern........................................ 7-13 Figure 7.4 Land Use of the Goldboro Industrial Park ...................................................................... 7-28Figure 7.5 2002 Combined Fisheries Catch and Effort ..................................................................... 7-33Figure 7.6 2003 Combined Fisheries Catch and Effort ..................................................................... 7-34Figure 7.7 2004 Combined Fisheries Catch and Effort ..................................................................... 7-35Figure 7.8 2005 Combined Fisheries Catch and Effort ..................................................................... 7-36Figure 7.9 Nearshore Fisheries .......................................................................................................... 7-41 Figure 7.10 Country Harbour Aquaculture Lease Blocks ................................................................... 7-45

Deep Panuke Volume 4 (Environmental Assessment Report) November 2006 xi
List of Appendices
APPENDIX A Approved CSR APPENDIX B Scope of the Assessment APPENDIX C Concordance Table Between Approved 2002 CSR and Environmental Assessment Report APPENDIX D Produced Water and Drill Waste Dispersion Modelling APPENDIX E1 Marine Spill Probability Assessment APPENDIX E2 Spill Fate and Behaviour Modelling APPENDIX F Air Emissions Modelling APPENDIX G Information on EnCana’s Proposed Environmental Management Plans and Codes of Practice APPENDIX H Public Consultation Materials APPENDIX I Aboriginal Communications APPENDIX J Commercial Fisheries Mapping

Deep Panuke Volume 4 (Environmental Assessment Report) November 2006 1-1
1 INTRODUCTION
In December 2002, EnCana Corporation (EnCana) received Ministerial approval for the Deep Panuke Comprehensive Study Report (CSR; approved 2002 CSR). Approval was based on a project comprising three offshore platforms producing 11.3 x 10⁶m3/d [400 MMscfd] of sales gas through a dedicated 610 mm [24 inch], 176 km export pipeline with tie-in to Maritimes & Northeast Pipeline (M&NP) facilities. In February 2003, just prior to the public hearing for application to the Canada-Nova Scotia Offshore Petroleum Board (CNSOPB) and National Energy Board (NEB), a project “time-out” was requested by EnCana to allow further review and refinement of the Project. Between 2003 and 2006, EnCana completed the re-evaluation phase and is now re-filing a Development Plan Application (DPA) and NEB application based on a new project basis (the Project).
As part of pre-filing consultation with regulators, EnCana identified elements of the previously approved 2002 CSR that are still valid for the revised Project. The Canadian Environmental Assessment Act (CEAA) permits the use of previously conducted assessments. Section 24 of CEAA requires that previous environmental assessments (EAs) be used to whatever extent is appropriate in conducting the EA of the revised Project.
Section 24 of CEAA reads as follows:
24. (1) Where a proponent proposes to carry out, in whole or in part, a project for which an environmental assessment was previously conducted and (a) the project did not proceed after the assessment was completed, (b) in the case of a project that is in relation to a physical work, the proponent proposes
an undertaking in relation to that work different from that proposed when the assessment was conducted,
(c) the manner in which the project is to be carried out has subsequently changed, or (d) the renewal of a licence, permit, approval or other action under a prescribed
provision is sought, the responsible authority shall use that assessment and the report thereon to whatever extent is appropriate for the purpose of complying with section 18 or 21.
(2) Where a responsible authority uses an environmental assessment and the report thereon pursuant to subsection (1), the responsible authority shall ensure that any adjustments are made to the report that are necessary to take into account any significant changes in the environment and in the circumstances of the project and any significant new information relating to the environmental effects of the project.

Deep Panuke Volume 4 (Environmental Assessment Report) November 2006 1-2
Pursuant to Section 17 of CEAA, the Responsible Authorities (RAs) have delegated the conduct of the environmental assessment to the proponent. This environmental assessment report (EA Report) will also be submitted to the CNSOPB to form the Environmental Impact Statement (EIS) component of the Development Plan Application (DPA) and to the NEB to form the EA component of the pipeline application. The EA Report (DPA Volume 4) will be distributed for public comment under the CSR process and will form the basis for the CSR to be prepared by the Responsible Authorities (RAs) following the public comment period.
1.1 Project Overview
In 1996, EnCana purchased a 50 percent interest in and became the operator of the Cohasset Project near Sable Island. While producing oil from the Cohasset Project, EnCana was also conducting exploration drilling in the area. In February of 2000, EnCana announced the discovery of a potentially significant natural gas reservoir in the Deep Panuke location. Further delineation drilling results led EnCana to file a DPA with the CNSOPB and a pipeline application with the NEB in March 2002, and conduct an EA in the form of a Comprehensive Study under CEAA. A CSR was submitted by EnCana and later approved by the Minister of Environment in December 2002. The regulatory applications were withdrawn by EnCana in December 2003, prior to completion of the regulatory review, to allow further evaluation of the reservoir. Between 2003 and 2006, EnCana completed the re-evaluation phase and is re-filing the DPA and NEB application amended as necessary to include the changes from the original applications. The EA Report, conducted based on modifications between the Project basis of the approved 2002 CSR and the revised Project basis, is being filed under CEAA and as a component of the DPA and NEB application.
EnCana holds a majority working interest in and is the Operator of Deep Panuke, which is located approximately 250 km southeast of Halifax, Nova Scotia (NS) and about 48 km west of Sable Island on the Scotian Shelf. The revised Project design consists of a jack-up mobile offshore production unit (MOPU) in a water depth of approximately 44 m (Figure 1.1). The revised Project will initially include re-completing four previously drilled wells and drilling a new production well and a new acid gas injection well. Up to three additional subsea production wells could be drilled. All subsea wells will be tied back individually to the MOPU with subsea flowlines and control umbilicals.

6740
00
6740
00
6840
00
6840
00
6940
00
6940
00
7040
00
7040
00
4849000
4849000
4859000
4859000
4869000
4869000
DeepPanuke
LocationMap
02.
55
1.25
Kilo
met
ers
Map
Para
met
ers
Proj
ectio
n:U
TM-N
AD
83-Z
20Sc
ale
1:10
0,00
0D
ate:
Oct
ober
17,2
006
Proj
ectN
o.:1
0151
58
MapFeatures
SOE
PP
latfo
rms
Prod
uctio
nW
ells
Dee
pP
anuk
eM
OP
U
Star
t-up
Flow
lines
EnC
ana
22"E
xpor
tPip
elin
e(M
&N
PO
ptio
n)
SOE
PE
xpor
tPip
elin
e
EL2357
GRANDPRE
PL2901
COHASSET
EL2387
MARGAREE
PL2902
PANUKE
MAR
COH
D-4
1
MAR
GAR
EEF-
70
ACID
GAS
DIS
POSA
LW
ELL
D-7
0
Panu
keM
-79A
Panu
keH
-99
Panu
keH
-08
DEE
PPA
NU
KE
PLAT
FOR
M
EL2360
LOWER
MUSQUODOBOIT
SOE
P26
"PI
PEL
INE
TOSO
EPG
AS
PLA
NT
22"
EN
CA
NA
PIPE
LIN
EM
&N
PO
PTIO
N
20"
EN
CA
NA
PIPE
LIN
ESO
EP
SUB
SEA
OPT
ION
~36
km
Figure1.1
REG
ION
AL
VIE
WSC
OTI
AN
SHEL
F
DEE
PPA
NU
KE
VEN
TUR
E
SOU
THV
ENTU
RE
NO
RTH
TRIU
MPH
ALM
A
THEB
AU
D
SABL
EIS
LAN
DBA
NK
SAB
LEIS
LAN
D
010
020
050
Kilo
met
ers
SOEP
Gas
Plan
t
GO
LD
BOR
O
ProjectStudyAreaBoundary
EnC
ana
20"E
xpor
tPip
elin
e(S
OE
PSu
bsea
Opt
ion)
SDL2255H
DEEPCOHASSET
Nor
thea
stEx
trem
eLo
catio
nfo
rPot
entia
lFut
ure
Wel
ls

Deep Panuke Volume 4 (Environmental Assessment Report)• November 2006 1-4
The export system will consist of a single subsea pipeline delivering Deep Panuke sales product to one of two delivery points (collectively referred to as the “Proposed Project Options”):
• Goldboro, Nova Scotia, to an interconnection with M&NP (herein referred to as the “M&NP Option”); or
• Sable Offshore Energy Project (SOEP) 660 mm [26 inch] export pipeline at a close tie-in location on the pipeline route to Goldboro (herein referred to as the “SOEP Subsea Option”).
The gas processing system will include inlet compression, separation, sweetening, dehydration, export compression and measurement. Deep Panuke is considered a sour gas reservoir with raw gas containing approximately 0.18% hydrogen sulphide (H2S); therefore, gas sweetening equipment is required. Acid gas processing will be performed offshore through application of an amine unit to remove H2S and carbon dioxide (CO2), collectively also known as acid gas. Subsequent to its removal from the raw gas stream, the acid gas will be disposed by injection into a suitable reservoir.
For the M&NP Option, hydrocarbon dewpointing is required on the MOPU. The condensate stream will be treated and used for fuel. Currently, it is estimated that there will be no surplus condensate produced beyond fuel usage; however, in the event that condensate must be injected, it will be disposed with the acid gas stream in the injection well. For the SOEP Subsea Option, treated condensate will be re-combined with the gas in the multi-phase export pipeline.
The production facility will have a design capacity of 8.5 x 10⁶ m3/d [300 MMscfd] with turndown capability to 1.1 x 10⁶ m3/d [40 MMscfd].
The major modifications between the revised Project and the Project basis from the approved 2002 CSRinclude:
• production design capacity of 8.5 x 10⁶ m3/d [300 MMscfd] versus 11.3 x 10⁶ m3/d [400 MMscfd];
• subsea wellheads with subsea tie-backs versus platform wells;• single integrated installation (MOPU) versus three fixed platforms;• revised field centre location;• additional export (multi-phase) pipeline option (SOEP Subsea Option); and• greater produced water discharge rate.
Table 1.1 provides a more detailed comparison between the Project basis for the approved 2002 CSR and the revised Project basis.

Deep Panuke Volume 4 (Environmental Assessment Report) November 2006 1-5
Table 1.1 Comparison of Approved 2002 CSR Project Basis and the Revised Project Basis
Project Item Base Case (Approved 2002 CSR) M&NP Option SOEP Subsea Option
Well Count and Configuration
Maximum of 8 – platform wells 5-6 new drilled production wells: H08, PI1B, M79A, PP3C and 1-2 future wells 1-2 new drilled injection wells
Maximum of 9 – subsea wells 4 re-entry wells: H-08 (PL 2902), M-79A (PL 2902), F-70 (EL 2387), and D-41 (SDL 2255H) 1 new production well: H-99 (PL 2902) 1 new injection well D-70 (EL 2387) Up to three future wells (currently undefined locations on PL 2901, SDL 2255H, PL 2902 or EL 2387) Buried flowlines and umbilicals from wellheads to installation
Project Life Expected mean case: 11.5 years Expected mean case: 13.3 years Expected range: 8-17.5 years
Field Centre Base Case Relocated 3.6 km NNE
Base Structure Three fixed platforms including: Production platform Utilities/quarters platform Wellhead platform
1 MOPU Integrated facility
Discharge of Muds / Cuttings for New Wells
Drilled from field centre WBM/cuttings overboard SBM/cuttings skipped and shipped or injected
Drilled from individual well locations WBM/cuttings overboard No SBM
Delivery Point M&NP tie-in Onshore, adjacent to SOEP gas plant
SOEP subsea tie-in SOEP 660 mm [26 inch] pipeline
Export Pipeline 610 mm [24 inch], 176 km Single phase Trenched ~ 50% of route
560 mm [22 inch], 176 km Single phase Trenched ~ 50% of route
510 mm [20 inch], 15 km Multi-phase Trenched 100% of route
Export Gas 11.3 x 10⁶ m3/day [400 MMscfd] Sales quality
8.5 x 10⁶ m3/day [300 MMscfd] Sales quality
8.5 x 10⁶ m3/day [300 MMscfd] Sweet and dehydrated
Export Condensate N/A Maximum of 220 m3/day Sweet and stabilized, commingled with gas
Condensate Use Fuel, surplus injected Sales product
Produced Water Maximum 1,100 to 1,600 m3/day [7,000 to 10,000 bpd] Discharged overboard
Maximum 6,400 m3/day [40,000 bpd] Discharged overboard
Acid Gas Dedicated injection well ~180 x 103m3/day [6 MMscfd]
Dedicated injection well ~130 x 103m3/day [4.5 MMscfd]

Deep Panuke Volume 4 (Environmental Assessment Report)• November 2006 1-6
1.2 Purpose and Need for the Project
The purpose and need for the Project do not differ from that previously stated in the approved 2002 CSR. The primary purpose is to allow EnCana to exercise its rights under, and obtain economic benefits from, the licenses issued to it under the Canada-Nova Scotia Offshore Petroleum Resources Accord Actand the Canada-Nova Scotia Offshore Petroleum Resources Accord Implementation (Nova Scotia) Act(Accord Acts). By recovering the value of the resources that EnCana has obtained the rights under the Accord Acts, it can provide a return to its shareholders on the capital invested in the Project. The value of the Deep Panuke resources will be obtained by exploiting the opportunity presented by the considerable and growing demand for natural gas and other forms of energy in markets in Canada and the United States. The proximity of the Deep Panuke discovery to existing infrastructure serving these growing energy markets is one of the foundations of the Project. The Project will, therefore, provide further opportunity for Nova Scotians, and other Canadians, to participate in, and benefit from, the offshore oil and gas industry, thereby contributing to the economies of Nova Scotia and Canada.
1.3 Regulatory and Planning Context
The CNSOPB regulates offshore oil and gas activities under the Accord Acts and requires proponents to file a DPA for development projects.
Proposed production installations and development drilling for offshore oil and gas are subject to environmental assessment under CEAA. Amendments to the Federal Authorities Regulations in January 2001 designated the CNSOPB as a Federal Authority under CEAA. The CNSOPB will therefore be an RA for the environmental assessment. As required under the amended (2003) CSR process, the CEA Agency is the Federal Environmental Assessment Co-ordinator (FEAC) and, together with the CNSOPB, will lead the EA process for the Project.
Application of the Federal Coordination Regulations process under CEAA requires federal departments with decision making responsibility (under CEAA) or expert knowledge to declare their interest in the project. The potential RAs for this Project and potential respective CEAA “triggers” include:
• CNSOPB (approval of a development plan, under Section 143(4)(a) and authorization under Section 142 (1)(b) of the Accord Act, referred to as item 1.2 in Schedule I, Part I of the Law List Regulations);
• Fisheries and Oceans Canada (authorizations under Sections 32, 35 and 37 of the Fisheries Act, referred to as item 6 in Schedule I, Part I of the Law List Regulations);
• Environment Canada (Disposal at Sea permit under paragraph 127(1) of the Canadian Environmental Protection Act (CEPA), referred to as item 3 in Schedule I, Part I of the Law List Regulations);

Deep Panuke Volume 4 (Environmental Assessment Report) November 2006 1-7
Transport Canada (paragraph 5(1) of the Navigable Waters Protection Act, referred to as item 11 in Schedule I, Part I of the Law List Regulations); Industry Canada (paragraph 5(1)(f) of the Radiocommunication Act, referred to as item 13 in Schedule I, Part I of the Law List Regulations); and NEB (Certificate under Section 52 or Section 58 Order of the National Energy Board Act related to the pipelines, referred to as item 7 in Schedule II of the Law List Regulations).
Based on current discussions with regulators, EnCana does not expect that a DFO authorization related to harmful alteration or destruction of fish habitat under Sections 32, 35(2) or 37 of the Fisheries Act, or a Disposal at Sea permit from Environment Canada under Part 7, Division 3 (Sections 122 - 137) of the CEPA will be required, based on the configuration of the Project and planned mitigation. Specifically:
There will be no disposal of muds/cuttings from more than a single well at any specific location on Sable Island Bank; Betty's Cove Brook, the only permanent stream in the onshore pipeline corridor, will be crossed in the “dry” during pipeline installation;the MOPU will use standard spud cans or equivalent, similar to typical drilling jack-up rig footings; and all subsea equipment (i.e, wellheads, hot-tap and tie-in structures, sub-surface isolation valves) shall be protected by trawlable, cage-like, open tubular structures which allow for fish passage. In addition, there will be no blasting in the aquatic or marine environments. If required in the nearshore landfall area, any blasting will be carried out in the “dry” during periods of low tide; and The proposed Deep Panuke installation activities do not constitute “disposal” as that term is defined in CEPA.
Consultation with the regulatory agencies in respect of these requirements will continue as the information in respect of the Project is refined.
The CNSOPB requires an EIS as a condition of its approval process. The NEB requires an EA as a condition of its approval process. Based on pre-filing consultation with the regulators, EnCana’s CEAAEA Report will also form the EIS requirement of the DPA and the EA requirement for the NEB application.
In 2002, EnCana conducted an EA in the form of a comprehensive study under CEAA. EnCana submitted a CSR and received Ministerial approval in December 2002. In February 2003, EnCana requested a regulatory time-out to allow further evaluation of the Deep Panuke Project. In December 2003, EnCana withdrew regulatory applications with the CNSOPB and the NEB to allow further review and refinement of the Project.

Deep Panuke Volume 4 (Environmental Assessment Report) November 2006 1-8
Between 2003 and 2006, EnCana re-evaluated the reservoir and facilities to determine the optimum Project basis. As part of pre-filing consultation with the regulators, the FEAC and expected RAs have put together a draft work plan for the Deep Panuke Project in order to guide the regulatory review process. The draft work plan indicated that the assessment would be a new comprehensive study, but that it would solely address the variations between the Project basis of the approved 2002 CSR and the revised Project basis.
EnCana filed a Project Description on August 28, 2006 to initiate provisions of the FederalCoordination Regulations pursuant to CEAA. A draft scoping document was released for public review in September 2006. A final scoping document was released in November 2006.
1.4 Scope of the Assessment
In accordance with the work plan and Scope of Environmental Assessment (CEA Agency 2006), this EA Report has been prepared to assess the variations arising from the revised Project basis and the Project basis for the approved 2002 CSR. The EA must also consider relevant changes to the regulatory, biophysical and socio-economic environment that have occurred since the approved 2002 CSR. Section 6.1 contains additional information on the scoping process and identification of regulatory, biophysical and socio-economic updates to be incorporated in the EA Report.
More specifically, the Scope of Environmental Assessment (CEA Agency 2006) outlines the RA-specified requirements for the assessment of the Deep Panuke Project under the CEAA process. Refer to Appendix B for the Scope of Environmental Assessment and demonstration of the EA Report’s concordance with the Scope.
1.5 Project Study Area
Upon review of the revised Project options, it was determined that the Project Study Area defined in the approved 2002 CSR remains valid for this EA Report. Figure 1.1 shows the delineated study area around the revised Project Options. Refer to Section 1.5 of the approved 2002 CSR for a description of the study area and rationale for delineation.

Deep Panuke Volume 4 (Environmental Assessment Report) November 2006 2-1
2 PROJECT DESCRIPTION
This section provides an overview of the technical and operational considerations related to the Deep Panuke Project. A detailed description of the Project’s technical aspects is contained in the Development Plan (DPA Volume 2) is being submitted to the CNSOPB.
2.1 Reservoir Description
The Deep Panuke Project will produce natural gas from a porous carbonate reservoir located 3,500-4,000 m below the seafloor. The reservoir occurs in the margin of the carbonate platform (Abenaki formation) (refer to Figure 2.1) which formed along the East Coast of North America during the opening of the Atlantic Ocean in the Middle to Late Jurassic, approximately 170 to 128 million years ago. The Deep Panuke gas pool was discovered by EnCana drilling in 1998. Additional drilling in the Abenaki formation in 1999 and 2000 confirmed the presence of a significant gas accumulation. A detailed geological and geophysical description of the reservoir is contained in the Development Plan (DPA Volume 2).
Deep Panuke raw gas is very lean (i.e., with low volumes of associated gas liquids) and contains low levels of CO2 (approximately 3.5%). The raw gas contains a small amount of H2S and is therefore referred to as “sour gas”. H2S concentration in the raw gas is expected to be approximately 0.18% or 1,800 parts per million by weight (ppmw).
The components of the Deep Panuke raw gas are as follows:
Aromatics: Deep Panuke raw gas contains low levels of benzene, toluene, ethyl benzene, and xylene commonly known as BTEX. BTEX concentration in the raw gas is expected to be 0.17 mole% or 1,400 ppm. Trace Elements: Deep Panuke raw gas contains very low levels of mercury (Hg), measured at an average concentration of 0.5 g/m3 (microgram/m3).Metals: A metal analysis by method ASTM D5185 was conducted on a number of samples of produced condensate and heavy metals, such as barium, vanadium; and lead concentrations were less than the detection limit.

Fig
ure
2.1
Gen
era
lized
Str
ati
gra
ph
y, O
ffsh
ore
No
va S
co
tia
P:\
En
vSc
i\101xx
x\1015157 -
De
ep
Pa
nu
ke
\Gra
ph
ics\
Fig
ure
sFig
ure
2-0
1.c
dr

Deep Panuke Volume 4 (Environmental Assessment Report) November 2006 2-3
Potential Radioactive Components: The presence of radon, a Naturally Occurring Radioactive Material (NORM), was measured during well testing by an RDA 200 Radon Detector. Deep Panuke raw gas contains very low levels of radon (Rn), in the range of 50-100 Bq/m3, equivalent to 1.4-2.7 pCi/Litre (Conversion factor: 1Bq = 27.027 pCi).
The following sections describe the process by which EnCana proposes to develop this reservoir and produce market-ready gas.
2.2 Project Infrastructure Components
The main Project infrastructure components include a mobile offshore production unit (MOPU), subsea wells and flowlines, and a subsea pipeline to transport sales product to either Goldboro, NS (M&NP Option) or SOEP 660 mm [26 inch] pipeline tie-in (SOEP Subsea Option).
A rendering of the proposed layout is presented in Figure 2.2.
2.2.1 Mobile Offshore Production Unit (MOPU)
The MOPU comprises the hull and topsides facilities. The hull includes all facilities and equipment that would normally be supplied with a mobile jack-up unit including jacking systems, legs, foundations, accommodations, helideck and utilities. The topsides facility will include all equipment required for processing hydrocarbon fluids from the reservoir. The topsides equipment will generally be located on top of the main deck but may also include equipment located within the hull, such as the central control room.
The topsides facility will contain processing equipment to separate, measure, dehydrate, and sweeten the raw gas. Acid gas and water handling equipment will also be installed on the MOPU. Hydrocarbon dew pointing will be required for the M&NP Option and the condensate will be used as the primary fuel for power generation and compression. Currently, it is estimated that there will be no surplus condensate produced beyond fuel usage; however, in the event that condensate must be injected, it will be injected down-hole with the acid gas stream. For the SOEP Subsea Option, condensate separated from the gas will be dehydrated, sweetened, and recombined with the export gas for delivery to the tie-in for the SOEP Subsea Option. The production facility is designed to export 8.5 x 10⁶ m3/d [300 MMscfd].

Fig
ure
2.2
Pro
po
sed
Fie
ld R
en
deri
ng
P:\
En
vSc
i\101xx
x\1015157 -
De
ep
Pa
nu
ke
\Gra
ph
ics\
Fig
ure
sFig
ure
2-0
1.c
dr

Deep Panuke Volume 4 (Environmental Assessment Report) November 2006 2-5
2.2.2 Subsea Wells and Flowlines
The initial development well program will consist of re-completing four existing production wells (H-08, M-79A, F-70, and D-41), drilling one new injection well (D-70) in Margaree (EL 2387), and one new production well (H-99) in Panuke (PL 2902). Up to three new production wells could be drilled after first gas in Cohasset (PL 2901), Deep Cohasset (SDL 2255H), Panuke (PL 2902) or Margaree (EL 2387).
All wells will be completed with horizontal subsea trees and tied back to the MOPU with individual subsea flowlines and control umbilicals. All subsea flowlines and control umbilicals will be trenched and buried.
2.2.3 Export Pipeline
EnCana proposes to transport sales product via a subsea pipeline from the offshore processing facility to one of two delivery points:
Goldboro, Nova Scotia (M&NP Option) to an interconnection with M&NP; or SOEP 660 mm [26 inch] pipeline tie-in (SOEP Subsea Option) at a close point on the pipeline route.
The Deep Panuke export pipeline will have a capacity of 8.5 x 10⁶ m3/d [300 MMscfd] at mean environmental conditions. The proposed routes of the export pipeline will minimize its footprint by using existing pipeline and flowline corridors where practical. The pipeline details for both options are presented in Table 2.1. All values are approximate.
Table 2.1 Export Pipeline Pipeline Diameter
(mm [inch]) Pipeline Length (km) Pipeline Phases
M&NP Option 560 [22] 176 (including approximately 3 km
onshore)
Single phase
SOEP Subsea Option 510 [20] 15 Multi-phase
For the SOEP Subsea Option, the export pipeline tie-in point will be at a subsea location. The tie-in facility will likely consist of a hot tap tie-in assembly and a valve tie-in assembly. Each assembly will be secured to the seabed using piles and surrounded by a subsea protection structure. Final processing of the Deep Panuke fluids will be done by SOEP at the onshore plants near Goldboro, NS and Point Tupper, NS.

Deep Panuke Volume 4 (Environmental Assessment Report) November 2006 2-6
The pipeline will be trenched where the water depth is shallow, as dictated by design requirements. This will also reduce span correction and reduce the potential for sediment scour to the pipeline. The pipeline will be designed to withstand impacts from conventional mobile fishing gear in accordance with the Det Norske Veritas (DNV) Guideline No. 13, Interference Between Trawl Gear and Pipelines, September, 1997.
The proposed offshore pipeline routes for both the M&NP Option and the SOEP Subsea Option are presented on Figure 2.3. The following criteria were used to determine the proposed pipeline route:
Minimize the environmental effects, seabed disturbance, and effects to fisheries due to the installation and operation of the new pipeline. Minimize the pipeline route length where possible while still satisfying all other route criteria. Minimize the number of subsea pipeline and cable crossings. Where crossings are unavoidable, routing of the pipeline shall, where possible, have a crossing angle of greater than 30 .Consider any known future pipelines. Consider concerns raised by landowners and stakeholders. The pipeline route shall be such that “normal” pipelay operations (pipelay vessel) are not precluded and appropriate minimum horizontal radius of curvature (to be defined during detailed design, dependent on the pipeline size and water depth) could be kept. Consider approaches near the MOPU (which may be installed in advance of the pipeline installation) to ensure compliance with safety and layout requirements. The shore approach routing shall be such to enable shore pull-in systems to be as simple as possible. Due consideration shall be made of the existing SOEP pipeline in the close confines of the harbour. Within the limits of the lay corridor and SOEP pipeline proximity requirements, route selection shall minimize potential pre-lay works (pre-sweeping, etc.) and post-lay rectification requirements for freespans.

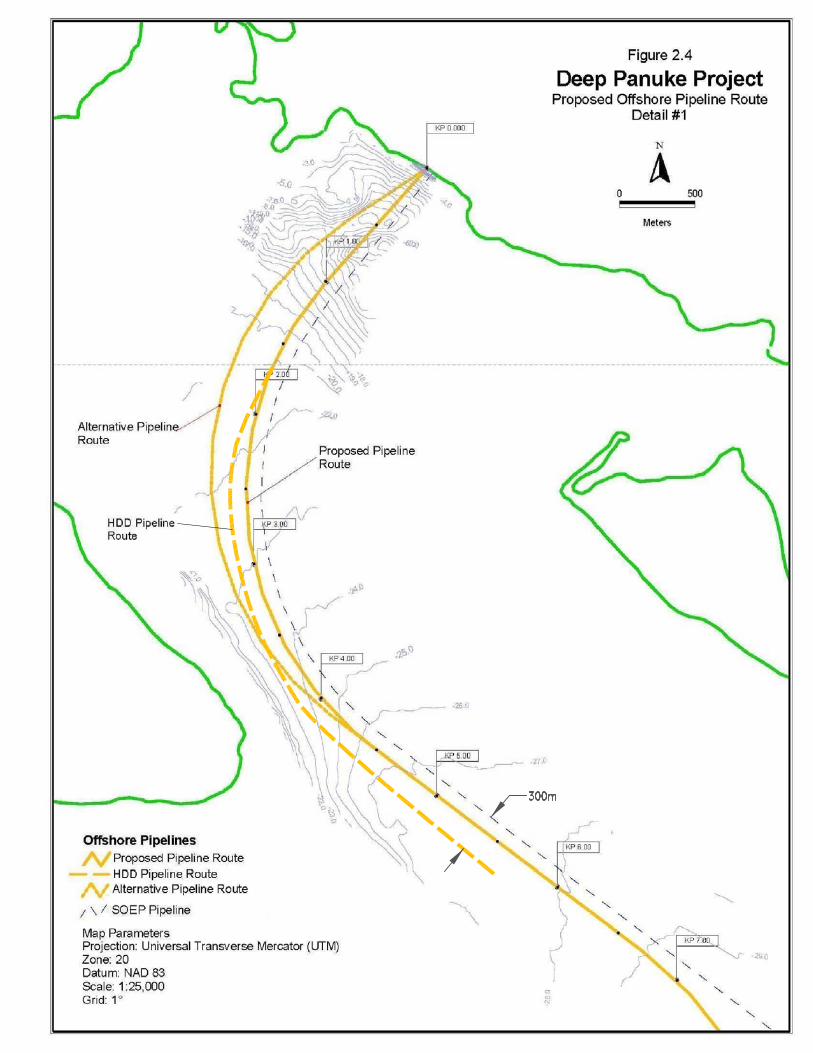


Deep Panuke Volume 4 (Environmental Assessment Report) November 2006 2-10
2.2.3.1 M&NP Option
The proposed pipeline route for the M&NP Option extends 173 km and closely follows the existing SOEP gas pipeline. With the exception of a slight route change offshore due to the revised location of the field centre, the offshore pipeline routing for this option remains unchanged from the route outlined in the approved 2002 CSR.
2.2.3.2 SOEP Subsea Option
The export pipeline to the SOEP Subsea Option tie-in point will be approximately 15 km in length. The water depth ranges from approximately 20 m to 45 m in depth and the seabed is relatively featureless. It is anticipated that the pipeline for SOEP Subsea Option will be buried. The pipeline will traverse a region of Sable Island Bank noted for its heterogeneous surficial geological characteristics. The dominant substrates along the proposed route are well-sorted Sable Island sand and, to a lesser extent, gravel. Sand ripples and mega-ripples are common due to the influence of waves and currents. The surficial sediments of the pipeline route are under the influence of dynamic sediment transport regimes, with large volumes of sand moved during storm events. In contrast to the M&NP option, the SOEP Subsea Option pipeline will not traverse areas of rock outcroppings, basins or other notable geological features.
2.2.4 Onshore Pipeline and Facilities
Onshore facilities are required for the M&NP Option only. In this option, EnCana’s onshore facility will consist of the physical components necessary for interconnection of EnCana’s natural gas pipeline with M&NP’s facility. EnCana will install a pig launcher/receiver facility and a safety/emergency shutdown valve system. The onshore facility will interface with the M&NP owned facility, which will include custody transfer meters, the final section of pipeline, and the tie-in to the existing M&NP pipeline. This facility is estimated to be 60 m x 45 m in area and will be enclosed by a security fence. The onshore pipeline will be located within the pipeline corridor indicated on Figure 2.6.
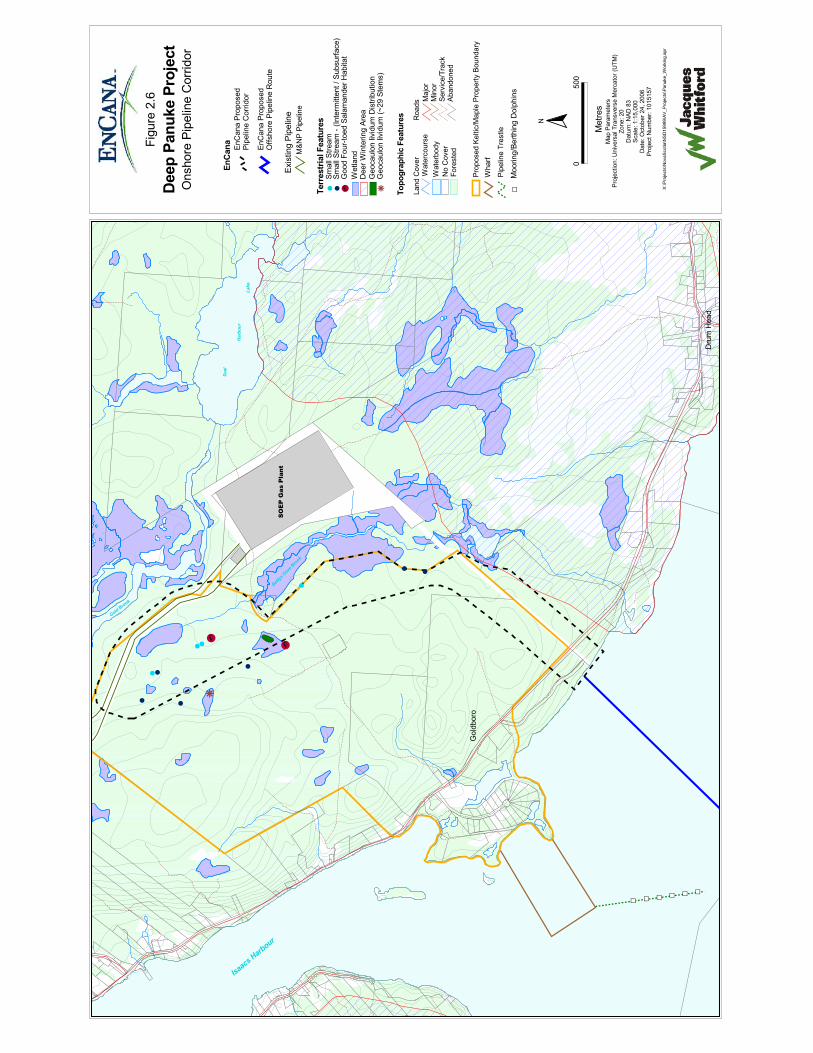
Deep Panuke Volume 4 (Environmental Assessment Report) November 2006 2-12
The onshore portion of the pipeline will be approximately 2 to 4 km in length. Design criteria for the onshore pipeline include the following:
consideration of physical features such as rock outcrops; minimizing environmental effects through avoidance of Deer Wintering Areas; minimizing pipeline length; minimizing impact on wetlands through avoidance where feasible; minimizing impact on stream crossing by use of dry crossing techniques; consideration of pipelay restriction, such as minimum horizontal radius of curvature;minimizing effects on landowners’ properties through which the pipeline will run; and ensuring best use of industrial park land consistent with the Municipality’s conceptual plan for the park.
The environmental constraints on the pipeline route and expected mitigation measures to manage these constraints will be included in the Request for Quote for the onshore pipeline installation package. Additionally, onshore environmental constraints will be considered in the Project’s Environmental Protection Plan (EPP).
An access road may be required which will likely run parallel to the new pipeline. The final location of the onshore facilities will depend on the final pipeline routing and access, as well as biophysical, socio-economic and engineering constraints. When additional survey work is completed, EnCana will consult with the land owners in the Goldboro Industrial Park to determine the location of the onshore facilities, as well as the onshore pipeline route.
Although layout of the onshore facilities is not complete at this time, Figure 2.7 is a schematic of the typical onshore facility that would be required for the Deep Panuke Project.
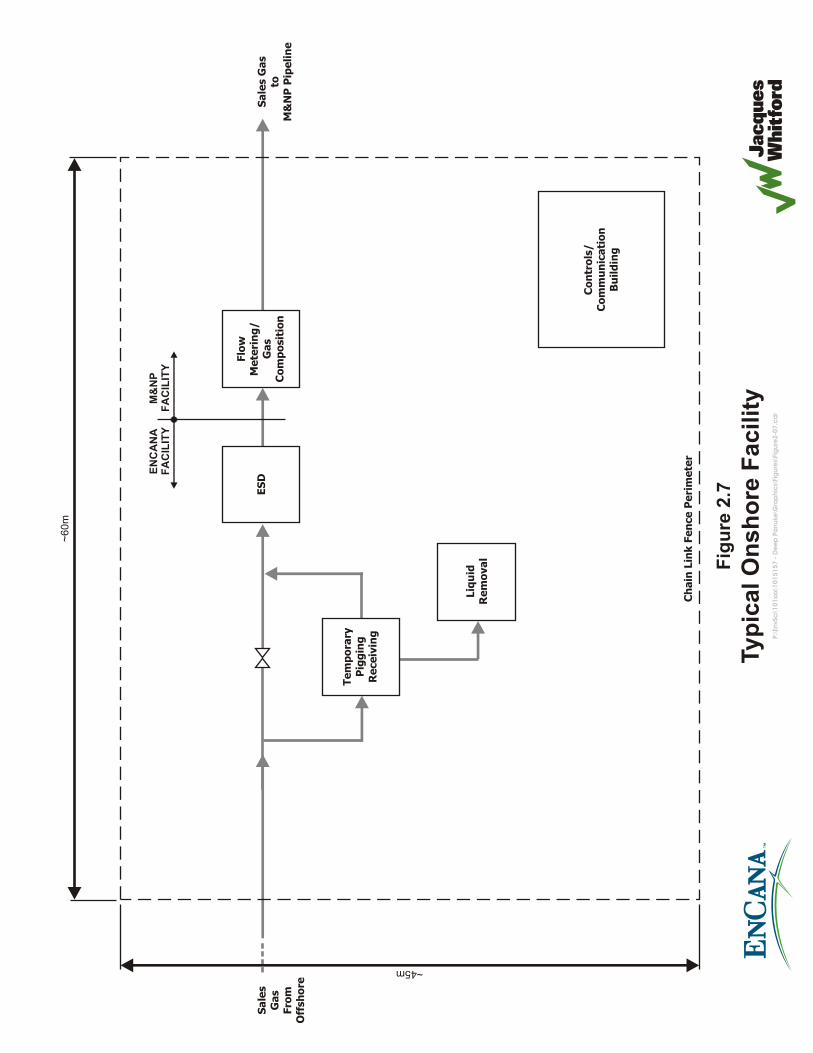
ES
D
Flo
wM
ete
rin
g/
Ga
sC
om
po
sit
ion
Te
mp
ora
ryP
igg
ing
Re
ce
ivin
g
Liq
uid
Re
mo
va
l
Sa
les
Ga
sFro
mO
ffsh
ore
Sa
les G
as
toM
&N
P P
ipe
lin
e
Co
ntr
ols
/C
om
mu
nic
ati
on
Bu
ild
ing
Ch
ain
Lin
k F
en
ce
Pe
rim
ete
r
Fig
ure
2.7
Ty
pic
al
On
sh
ore
Fa
cil
ity
P:\
En
vSc
i\101xx
x\1015157 -
De
ep
Pa
nu
ke
\Gra
ph
ics\
Fig
ure
s\Fig
ure
2-0
7.c
dr
EN
CA
NA
FA
CIL
ITY
M&
NP
FA
CIL
ITY
~45m
~6
0m
Deep Panuke Volume 4 (Environmental Assessment Report) November 2006 2-14
2.3 Construction and Installation
2.3.1 MOPU Facilities
The MOPU will be fabricated onshore, towed to the field, and jacked up on location. The MOPU will be situated on specifically designed footings, such as spud cans or equivalent, similar to typical drilling jack-up rig footings. The topsides facilities will be fabricated separately and installed on the MOPU at an atshore location. The Project has no requirement for an offshore heavy lift.
The hull portion of the MOPU is expected to utilize the basic design premise of an existing mobile offshore drilling unit (MODU) jackup design with the minimum number of changes required to accept the topsides production facilities. Some modifications are expected for additional safety and control systems, which must be integrated platform wide and other specific modifications, including appurtenances, risers, and umbilicals, which interface with the sea and seabed below. However, the intent will also be to minimize the deviations to the standard MODU design so that re-conversion of the unit back to a drilling unit in future can be readily accommodated if desired. The MOPU hull will be based upon a typical jack-up drilling rig fabrication method; however, the associated drilling equipment will not be installed.
The hull designs must be structurally capable of withstanding the environmental design conditions for offshore Nova Scotia on a year round basis; these MODUs are generally referred to a “harsh environment jack-up rigs”.
The production topsides will house all the production equipment and will be located on the hull in the areas where the drilling package is normally located. The topsides will be constructed in modular format. The expected weight of the production facilities is 6,000 tonnes and a single module is preferred from a construction and commissioning viewpoint. However, multiple modules can also be utilized should this be a better fit for the selected hull. Final arrangement will be determined during detailed design.
The modules will be designed to be lifted or skidded onto the hull structure and will be supported by the main girders within the hull.
The accommodations unit(s) will be designed to be constructed within Nova Scotia and therefore may have a design and build plan which will allow for transportation to the integration site and integration of the unit with the remainder of the MOPU, if required. Special considerations will include design of interface systems for power and utilities as well as load out and lifting considerations. The accommodations unit will be designed for a minimum of 68 persons on board (POB) and steady state POB of approximately 30 persons; however, it could also be larger if the MOPU contractor chooses to

Deep Panuke Volume 4 (Environmental Assessment Report) November 2006 2-15
use a standard MODU accommodations design to allow for easier conversion back to MODU operations in the future. Final accommodations size and layout will be determined during detailed design and will not impact the predictions of the EA Report.
The flare structure will also be designed to be constructed in Nova Scotia and therefore must also accommodate the loadout, transport, and installation considerations similar to the accommodations unit(s). The flare structure is expected to be a tubular lattice type structure and may be vertical or a boom type configuration. It will be in the order of 70 m above the topsides production facilities top most deck and will house the high pressure and low pressure flare lines and flare tips.
The topsides module(s) and the MOPU hull will likely be fabricated at separate locations and then brought to a common yard where they will be integrated. The topside(s) will be installed onto the MOPU hull and the remaining construction work will be completed. It is crucial to the effectiveness of the offshore phase that all the construction work is complete and commissioned as far as possible prior to the MOPU sailing away for installation.
Installation activities include the transportation and installation of the completed MOPU.
During the early stages of the detailed design phase of the Project, it will be important to ensure that the MOPU is designed to be transportable by the most economical means. Accordingly, until the MOPU fabrication yard is known, it will be essential to maintain design flexibility.
The actual installation of the MOPU at the offshore location is the same as the installation of a typical jack-up drilling rig. That is, the MOPU jacking system will be activated to raise the hull above the sea level to its final design elevation.
Installation will be in accordance with installation manuals which will provide full details of the sequence and content of each operation. The Project’s EPP will be integrated with the development of the installation manuals. The following summarizes the installation activity for the MOPU:
tow the MOPU to the offshore site; jack the MOPU legs down to the seafloor; jack the hull out of the water to the pre-loading elevation; perform pre-loading operations to jack the hull to the final design elevation; and installation of scour protection material (if required).

Deep Panuke Volume 4 (Environmental Assessment Report) November 2006 2-16
2.3.2 Export Pipeline
A proposed pipeline corridor has been selected as described in Sections 2.2.3 and 2.2.4 and shown on Figures 2.3 to 2.6.
For the M&NP Option, the route will head towards the existing SOEP pipeline and then follow the previously approved route paralleling the existing SOEP pipeline to shore. The two lines will be approximately 1 km apart, except where on bottom topography necessitates close proximity. In the near shore area, approximately 7 km from land, the two lines will be approximately 100 m apart.
For the SOEP Subsea Option, the route will head towards a close tie-in location.
Preliminary route studies for the SOEP Subsea Option as well as the M&NP Option pipeline route affected by the field centre change have been completed. Detailed route studies will be conducted during detailed design to confirm and refine preliminary routing and construction methods. Pipelines will be hydrostatically tested during commissioning.
Nearshore and offshore pipeline installation activities as presented in the approved 2002 CSR have not changed; therefore, these activities are not addressed in this section as there is no need to re-assess. However, further to the pipelay information provided in the approved 2002 CSR, refer to Section 2.3.5 which provides additional detail on methods involving sediment disposal.
2.3.3 Subsea Tie-In Facilities
For the SOEP Subsea Option, sales product is transferred from the Deep Panuke MOPU via a 15 km, 510 mm [20 inch] export pipeline to the existing SOEP 660 mm [26 inch] pipeline. The connection to the SOEP pipeline will be by a subsea tie-in, referred to as a “hot tap”. The hot tap process involves the connection of a tee (i.e., branch nipple) and an isolation valve onto the existing pipeline through which a “coupon” can be cut out of the existing pipeline while the pipeline is still operational. The branch nipple connection can either be attached by welding or installing a mechanical clamp.
“Welded” hot tap activities can be described as follows:
expose buried pipeline section by airlifting sediments; remove weight and corrosion coating; install and commission welding habitat; inspect pipeline; weld branch nipple onto pipeline; install reinforcement sleeve;

Deep Panuke Volume 4 (Environmental Assessment Report) November 2006 2-17
install branch nipple flange; install isolation valve; remove habitat; install “hot tap” machine; perform “hot tap”; remove “hot tap” machine; and install “hot tap” protection structure.
“Mechanical” hot tap activities can be described as follows:
expose buried pipeline section by airlifting sediments; remove weight and corrosion coating; inspect pipeline; install mechanical clamp; install “hot tap” machine; perform “hot tap”; remove “hot tap” machine; and install “hot tap” protection structure.
The “hot tap” structure is connected via a spool piece to a Deep Panuke tie-in structure which houses the equipment that will be required at the end of the Deep Panuke export pipeline. This equipment includes a manual isolation valve, a check valve and provision for a temporary subsea pig receiver. A protection structure will be placed around each of the SOEP pipeline hot tap equipment and the Deep Panuke pipeline tie-in equipment.
Refer to Section 2.3.5 which provides additional detail on methods involving sediment disposal with respect to the hot tap installation.
2.3.4 Subsea Flowlines and Umbilicals
A total of six to nine subsea flowlines will be installed on the seafloor to tie-in the five to eight production wells and one injection well. It is expected that the subsea production flowlines will be 200 to 250 mm [8 to 10 inches] in diameter and range from 1 to approximately 10 km in length. The injection flowline is expected to be 75 mm [3 inches] in diameter and approximately 1.7 km in length. The flowlines may be a flexible or rigid design and may be installed by reel-lay or s-lay pipelay methods. The flowlines will be trenched and buried. Flowline lengths, diameters, and installation method will be confirmed during detailed design.
Deep Panuke Volume 4 (Environmental Assessment Report) November 2006 2-18
A dedicated subsea umbilical will be required for each well in order to control, monitor, and supply chemicals to the wells. All umbilicals will be trenched and buried.
Offshore pipeline installation activities as presented in the approved 2002 CSR are applicable to the subsea flowline as well as umbilical installation and therefore are not addressed in this section as there is no need to re-assess. It should be noted that, while pipeline installation by reel-lay for flexible lines was not specifically addressed in the approved 2002 CSR, there is no change in the assessment as both reel-lay and s-lay pipelay methods simply refer to the methods used to feed the pipeline from the vessel to the seabed.
Further to the pipelay information provided in the approved 2002 CSR, refer to Section 2.3.5 which provides additional detail on methods involving sediment disposal with respect to subsea flowlines and umbilicals installation.
2.3.5 Construction Methods Involving Sediment Displacement
The Deep Panuke project has three infrastructure components that will require some form of sediment disturbance during the construction/installation phase. These components are as follows:
export pipeline (either M&NP Option or the SOEP Subsea Option); flowlines; and umbilicals.
The activities, location, techniques, duration and amount of sediment disturbance are described in Table 2.2 below. A summary for each component is described in the following paragraphs.
2.3.5.1 Export Pipeline
For the M&NP Option, the first kilometre from shore will be pre-trenched and covered with native material. Alternatively, this may be replaced by a horizontal directional drill (HDD) section where the cuttings will be disposed of onshore. Approximately 50% of the remaining 173 km offshore section will be trenched approximately 1 m into the seabed with natural or mechanical replacement of native sediments.
For the SOEP Subsea Option, the SOEP pipeline tie-in location will have to be exposed by airlift techniques. The 15 km Deep Panuke export pipeline will be trenched approximately 1 m into the seabed with natural or mechanical replacement of native sediments.

Deep Panuke Volume 4 (Environmental Assessment Report) November 2006 2-19
2.3.5.2 Flowlines
Flowlines for the five to eight production (18-31 km in total length) and one acid gas injection (1.7 km) will be trenched approximately 1 m into the seabed with natural or mechanical replacement of native sediments.
2.3.5.3 Umbilicals
Umbilicals for the five to eight production (18-31 km in total length), one acid gas injection (1.7 km) and gas buy-back valve, which forms part of the subsea isolation valve (SSIV) assembly (150 m), will be trenched approximately 1 m into the seabed with natural or mechanical replacement of native sediments.
2.3.6 Subsea Equipment and Associated Protection Structures
The following subsea equipment will be protected by dedicated protection structures:
wellhead (up to 9 in total); hot tap (SOEP Subsea Option only, see Section 2.3.3);tie-in (SOEP Subsea Option only, see Section 2.3.3); andSSIV skid (protection structure may not be required since SSIV is located in MOPU Safety Zone).
These shall be separately deployed structures. The protection structures shall be designed to allow adequate access to the wells for all planned diver and remotely operated vehicle (ROV) intervention tasks. The SSIV assembly shall be designed to support the piping and valves and to provide protection against dropped objects. All subsea protection structures will be trawlable, cage-like, open tubular construction. The protection structures footprint is expected to be approximately 10 m x 10 m for the wellheads, 10 m x 6 m for the hot tap, 20 m x 15 m for the tie-in, and 5 m x 5 m for the SSIV skid.

Dee
p Pa
nuke
Vol
ume
4 (E
nvir
onm
enta
l Ass
essm
ent R
epor
t) N
ovem
ber 2
006
2-20
Tab
le 2
.2 C
onst
ruct
ion
Met
hods
C
ateg
ory
Act
ivity
/Pur
pose
Loc
atio
nT
echn
ique
(s)
Dur
atio
nA
mou
ntEx
pose
the
exis
ting
SOEP
660
m
m [2
6 in
ch] p
ipel
ine
to p
erfo
rm
“hot
tap”
App
roxi
mat
ely
KP1
62 o
f SO
EP
pipe
line.
See
Fig
ure
2.3
Airl
ift
1-2
days
(for
mec
hani
cal
hot t
ap) o
r 2-4
day
s (fo
r w
elde
d ho
t tap
)
App
rox.
10m
x 1
0m x
3m
for w
elde
d ho
t tap
A
ppro
x. 5
m x
5m
x
3m fo
r mec
hani
cal h
ot
tap
Expo
rtPi
pelin
e –
SOEP
Opt
ion
Tren
chin
g of
the
expo
rt pi
pelin
e fo
r on-
botto
m st
abili
ty.
15 k
m le
ngth
from
MO
PU to
SO
EP h
ot ta
p lo
catio
n. S
ee F
igur
e 2.
3
Mul
ti pa
ss p
loug
h (M
PP),
MPP
with
se
para
te b
ack
fill p
loug
h (B
FP),
jetti
ng,
mec
hani
cal d
igge
r with
nat
ural
or
mec
hani
cal r
epla
cem
ent o
f nat
ive
sedi
men
ts
On
aver
age
150
to 4
00 m
/hr
(dep
ende
nt o
n so
il co
nditi
ons)
Tren
ch to
allo
w 1
m o
f co
ver
Hor
izon
tal d
irect
iona
l dril
ling*
or
trenc
h of
app
roxi
mat
ely
first
1km
of
pip
elin
e fr
om o
nsho
re fo
r on-
botto
m st
abili
ty a
nd p
rote
ctio
n.
KP0
to K
P1.0
. Se
e Fi
gure
2.4
Fo
r tre
nchi
ng, t
renc
h by
a d
ippe
r/flo
atin
g ba
ckho
e/flo
atin
g gr
ab d
redg
e. S
ome
blas
ting
may
be
requ
ired
in n
ears
hore
are
a (in
the
dry
durin
g pe
riods
of l
ow ti
de)
3 to
4 m
onth
s Pi
pelin
e w
ill b
e la
id in
pr
e-ex
cava
ted
trenc
h an
d co
vere
d w
ith
nativ
e m
ater
ial
Expo
rtPi
pelin
e –
M&
NP
Opt
ion
Tren
chin
g of
the
expo
rt pi
pelin
e fo
r on-
botto
m st
abili
ty.
App
rox.
KP1
.0 to
KP2
2.0
and
KP1
10.0
to th
e M
OPU
. Se
e Fi
gure
2.
3
MPP
, MPP
with
sepa
rate
BFP
, jet
ting,
m
echa
nica
l dig
ger w
ith n
atur
al o
r m
echa
nica
l rep
lace
men
t of n
ativ
e se
dim
ents
On
aver
age
150
to 4
00 m
/hr
(dep
ende
nt o
n so
il co
nditi
ons)
Tren
ch to
allo
w
appr
oxim
atel
y 1m
of
cove
r
Flow
lines
Tr
ench
ing
of a
ppro
x. 3
1 km
of
200
to 2
50 m
m [8
to 1
0 in
ch] a
nd
1.7
km o
f 75m
m [3
inch
] flo
wlin
es fo
r ins
ulat
ion,
pr
otec
tion
and
on-b
otto
m st
abili
ty
See
Figu
re 2
.2M
PP, M
PP w
ith se
para
te B
FP, j
ettin
g,
mec
hani
cal d
igge
r with
nat
ural
or
mec
hani
cal r
epla
cem
ent o
f nat
ive
sedi
men
ts
On
aver
age
150
to 4
00 m
/hr
(Dep
ende
nt o
n so
il co
nditi
ons)
Tren
ch to
allo
w
appr
oxim
atel
y 1m
of
cove
r
Um
bilic
als
Tren
chin
g of
app
roxi
mat
ely
31
km o
f 100
mm
[4 in
ch] u
mbi
lical
s fo
r flo
wlin
es a
nd b
uy-b
ack
gas
valv
e.
See
Figu
re 2
.2
MPP
, MPP
with
BFP
, jet
ting,
mec
hani
cal
digg
er w
ith n
atur
al o
r mec
hani
cal
repl
acem
ent o
f nat
ive
sedi
men
ts
On
aver
age
150
to 4
00 m
/hr
(dep
ende
nt o
n so
il co
nditi
ons)
Tren
ch to
allo
w
appr
oxim
atel
y 1m
of
cove
r
* H
oriz
onta
l dire
ctio
nal d
rillin
g of
this
sect
ion
wou
ld n
ot d
ispl
ace
surf
ace
sedi
men
ts.
HD
D c
uttin
gs w
ill b
e di
spos
ed o
f ons
hore
.

Deep Panuke Volume 4 (Environmental Assessment Report) November 2006 2-21
2.3.6.1 Pile Driving
The Project basis in the approved 2002 CSR comprised three bottom-founded platforms. Each platform was to be fastened to the seabed via 2100 mm [84 inch] diameter skirt piles driven 61 to 68 m below the seabed. The piles were to be driven with a Menck MHU-1700 Hammer (or equivalent). This hammer has a maximum energy output of 1.70 million Newton-meters (1.25 million foot-pounds). The piles were to be approximately 75 m in length and the water depth was approximately 37 m. As a result, approximately 40 to 45% of the hammer impacts would have occurred underwater with the remainder in air. The pile driving duration was estimated to be 4 to 6 hours per pile based upon previous experience with the Panuke and Cohasset platform piles.
In the approved 2002 CSR, a SSIV assembly was to be situated approximately 150 m from the production platform. It was anticipated that the SSIV assembly may have been pre-fabricated onto a skid for ease of installation and may have required a protection frame. The skid/protection frame may have been fastened to the seabed via four piles ranging in size from 610 mm [24 inch] to 910 mm [36 inch] driven approximately 8 to 12 m below seabed. These piles would be driven with an IHC S-90 (or equivalent) hammer which has a maximum energy output of 89,000 Newton-meters (66,000 foot-pounds). The actual pile driving duration is estimated to be 0.5 to 1 hours based upon previous experience with the Panuke platform docking piles.
The revised Project design basis is based upon having a MOPU with subsea production wells individually tied back to the MOPU. The MOPU does not require any piles for installation. There may be up to eight subsea production wells and one acid gas injection well. Each wellhead will require a protection structure. The sales product(s) will be either exported to shore (M&NP Option) or to the existing SOEP pipeline (SOEP Subsea Option). A SSIV assembly will be required for both options as per the design basis approved in the approved 2002 CSR. For the SOEP Subsea Option, the connection to the SOEP pipeline will be via a “hot tap” which will in turn be spool connected to a Deep Panuke “tie-in” structure.
As a result, the following subsea protection structures will be required for the revised Project design basis:
wellhead (up to 9 in total); SSIV assembly skid (1); hot tap (1) (SOEP Subsea Option only); and tie-in (1) (SOEP Subsea Option only).

Deep Panuke Volume 4 (Environmental Assessment Report) November 2006 2-22
These subsea structures may be fastened to the seabed via four piles ranging in size from 610 mm [24 inch] to 910 mm [36 inch] driven approximately 8 to 12 m below seabed. These piles would be driven with an IHC S-90 (or equivalent) hammer which has a maximum energy output of 89,000 Newton-meters (66,000 foot-pounds). The actual pile driving duration is estimated to be 0.5 to 1 hours based upon the previous experience of driving the Panuke platform docking piles.
Although the total number of piles has increased for the revised Project design basis, the diameter and length of the piles is smaller requiring an overall shorter duration of the activity with a lower energy hammer. As a result, the potential pile driving requirements associated with the 2006 Project basis is less than the Project basis approved in the 2002 CSR; refer to Table 2.3 for comparison.
2.3.7 Onshore Facilities and Pipeline (M&NP Option Only)
Onshore pipeline installation activities as presented in the original CSR have not changed; therefore, these activities are not addressed in this section as there is no need to re-state.
2.3.8 Development Well Construction
Development wells will include five to eight production wells and one injection well, all of which will be subsea. A jack-up drilling unit will be used to complete the existing wells and to drill the subsea wells. A jack-up drilling unit is a MODU that has legs that can be jacked up or down. Once towed to the site, the legs are jacked down until they are in contact with the seafloor, then the rig platform is elevated until it is approximately 25 m above the water surface. The jack-up drilling unit will remain on location during drilling and completion operations and then be removed. Well construction activities are expected to take approximately 430 days (five new drill wells at 60 days each plus four re-entry wells at 32 days each) in total to complete.
The normal drilling program for all Deep Panuke wells involves conventional hole and casing/pipe sizes. All casing designs are based on CNSOPB Offshore Petroleum Drilling Regulations.

Dee
p Pa
nuke
Vol
ume
4 (E
nvir
onm
enta
l Ass
essm
ent R
epor
t) N
ovem
ber 2
006
2-23
Tab
le 2
.3
Pile
Dri
ving
Det
ails
Proj
ect D
esig
n B
asis
of 2
002
App
rove
d 20
02 C
SR
No.
Pi
les
Size
[mm
(in)
] Pe
netr
atio
n [m
] H
amm
er S
ize
Max
. Ene
rgy
]N.m
(ft.
lbs)
] A
ctua
l Dri
ving
Dur
atio
n/Pi
le
Act
ual
Dri
ving
Dur
atio
nW
ellh
ead
Plat
form
4
2100
(84)
61
M
enck
MH
U-1
700
(o
r equ
ival
ents
) 1,
699,
000
(1,2
53,0
00)
4 to
6 h
r 16
hr -
24hr
Prod
uctio
nPl
atfo
rm8
2100
(84)
68
Sam
e as
WH
P 1,
699,
000
(1,2
53,0
00)
4 to
6 h
r 32
hr -
48hr
Util
ities
and
Q
uart
ers P
latf
orm
4
2100
(84)
65
Sam
e as
WH
P 1,
699,
000
(1,2
53,0
00)
4 to
6 h
r 16
hr -
24hr
SSIV
Ski
d1
4 61
0-91
0 (2
4-36
) 8
- 12
IHC
S-9
0
(o
r equ
ival
ents
) 89
,000
(66,
000)
0.5h
r - 1
hr
2hr -
4hr
Estim
ated
Tot
al D
urat
ion2 (M
enck
MH
U-1
700)
64
hr -
96hr
2.7
d –
4 d
Estim
ated
Tot
al D
urat
ion3 (I
HC
S-9
0)
2hr -
4hr
Rev
ised
Pro
ject
Bas
is
No.
Pi
les
Size
[mm
(in)
] Pe
netr
atio
n [m
] H
amm
er S
ize
Max
. Ene
rgy
[N.m
(ft.
lbs)
] A
ctua
l Dri
ving
Dur
atio
n/pi
le
Act
ual
Dri
ving
Dur
atio
n
Wel
lhea
dPr
otec
tion
(x9)
36
24
- 36
8
- 12
IHC
S-9
0
(o
r equ
ival
ents
) 89
,000
(66,
000)
0.
5hr -
1hr
18
hr -
36hr
Hot
Tap
4
24 -
36
8 - 1
2 Sa
me
as W
ellh
ead
89,0
00(6
6,00
0)0.
5hr -
1hr
2h
r - 4
hr
Tie
-in4
24 -
36
8 - 1
2 Sa
me
as W
ellh
ead
89,0
00(6
6,00
0)
0.5h
r - 1
hr
2hr -
4hr
SSIV
Ski
d14
24 -
36
8 - 1
2 Sa
me
as W
ellh
ead
89,0
00(6
6,00
0)
0.5h
r - 1
hr
2hr -
4hr
Estim
ated
Tot
al D
urat
ion3 (I
HC
S-9
0)
24hr
- 48
hr
1d -
2d
1 May
not
be
requ
ired
sinc
e in
Pla
tform
/MO
PU S
afet
y Zo
ne
2 App
roxi
mat
ely
40 to
45%
of t
he d
urat
ion
is u
nder
wat
er h
amm
er a
ctiv
ities
3 A
llth
e du
ratio
n is
und
erw
ater
ham
mer
act
iviti
es

Deep Panuke Volume 4 (Environmental Assessment Report) November 2006 2-24
For the new production and injection wells drilled, the conductor pipe (first string of pipe) will be set approximately 100 m below the seafloor. This is the same method that has been used on the existing suspended delineation wells. This section will be drilled primarily with seawater and viscosifiers to aid in ensuring cuttings removal from the wellbore. These cuttings are deposited at the seabed and are generally equivalent to the volume of the hole drilled, approximately 65 m³.
The conductor pipes will serve as the primary weather barrier to take environmental loading and protect the inner strings of casing (length of pipe) while drilling the well. The conductors also take the surface loading implied by the other strings of casing that are returned to the mudline suspension system. Once the drilling has been completed, the conductors will be removed and the well will be converted to a subsea wellhead. With the production tree installed, a high pressure riser will be required to tieback to the surface blowout preventor (BOP) stack. The high pressure riser will be designed to withstand the environmental loads as well as all internal design loads.
All wells, including production and injection, will set the surface casing into the Wyandot member at approximately 950 m below sea level in the general direction that the bottom of the well will be located. The BOP stack is then installed on top of the surface casing prior to drilling the intermediate hole section.
For the re-entry wells, an intermediate hole section has been drilled just into the top of the limestone at approximately 3200m true vertical depth (TVD). An intermediate casing string has been set 20 m into the Abenaki 7/6 formation and cemented back just above any potential hydrocarbon bearing sands (~2300 m). The new production well(s) will be similarly constructed to the existing suspended delineation wells. Prior to drilling the reservoir section and with the well secured, the surface wellhead and conductor will be removed and the well will be converted to a subsea wellhead. The production tree will be installed with high pressure riser connected back to the surface BOP stack.
A rotating BOP and an injection spool will be installed with the surface BOP stack in preparation for annular velocity control (AVC) drilling techniques and the main hole section will be drilled through the productive interval of the carbonate reef. On the re-activation wells, the reservoir section has been drilled to a total depth of circa 3650 m TVD which is about 150 m past the gas-water contact (GWC) at 3504 m TVD. On many of the delineation wells, this GWC was not clearly evident while drilling the section as the formation was not porous at this depth, however it was clearly identified while drilling the MarCoh D-41 well. On each of the wells to be re-used for production, a liner (string of pipe) has been installed across the reservoir section and cemented back to the previous casing shoe. For the new producing well(s), the reservoir section may be left open, with no liner in place, in order to maximize the flow potential of the well.

Deep Panuke Volume 4 (Environmental Assessment Report) November 2006 2-25
For re-entry of the existing wells, a “trash cap” will first be removed from the conductor stub 3 m above the seafloor. A “trash cap” is a cylinder device closed on one end that sets over the conductor to keep out marine organisms or falling debris. Once the trash cap has been removed, a running and retrieving tool is used to back off the temporary abandonment caps. Each of the wells then has a cement plug set that has to be drilled out.
The production wells will all be completed with a downhole packer (plus other ancillary downhole equipment), production tubing, surface controlled subsurface safety valve, a tubing hanger, and a subsea production tree. Once all hydrostatic tests and function tests are performed, the production wells will be opened for clean-up flow on the drilling rig. This will remove any water or debris from the wellbore prior to handover for production operations on the MOPU. See Figure 2.8 for details on the production wells.
The injection well will be drilled using similar processes and procedures as with the production wells. Once the surface casing is set in the Wyandot formation, the main well bore will be drilled vertically to the injection zone in the Upper Mississauga formation located at approximately 2400 m TVD. See Figure 2.9 for details on the injection well. Similar to the production well, the completion for the injection well will consist of tubing, downhole packer, subsurface safety valve, tubing hanger and injection tree.
For the M&NP Option, it is estimated that there will be no surplus condensate produced beyond fuel usage; however, the ability to inject condensate down-hole with the acid gas stream provides operational flexibility in times of maintenance and/or operational issues. It is currently planned to inject the condensate with the acid gas into the one injection well that will be drilled west of the MOPU field centre. Injection pumps on the main production platform will be used to pump the condensate down the well at the required pressures for injection into the downhole disposal zone.
This injection well for acid gas and condensate (if necessary) will be drilled into a porous and permeable zone in the Upper Mississauga Formation; the targeted injection zone is the Tidal-Fluvial Sandstone. The impermeable Naskapi shales located directly above will prevent any migration of injected acid gas or condensate. The Upper Mississauga Formation will be capable of containing the entire acid gas and surplus condensate volumes that will be produced over the life of the Project. Migration of injection fluids to other formations and/or to the surface is considered extremely unlikely. The possibility of acid gas injection souring the Panuke oil zone is also considered to be extremely unlikely. See Figures 2.8 and 2.9 for production and injection well schematics.

P:\EnvSci\101xxx\1015157 - Deep Panuke\Graphics\Figures\Fig2_8.cdr
Figure 2.8
Typical Production Well Schematic

P:\EnvSci\101xxx\1015157 - Deep Panuke\Graphics\Figures\1015157_Figure2-09.cdr
Figure 2.9
Acid Gas Injection Well Schematic

Deep Panuke Volume 4 (Environmental Assessment Report) November 2006 2-28
2.3.8.1 Drilling Fluid Program
Water-based muds (WBM) will be used in development drilling. These muds are used to protect and clean the drill hole, for overbalancing formation pressures, and for bringing cuttings to the surface. The selection of the drilling fluid is based on factors such as the hole angle, the formation types drilled (mudstone, sandstone, clays, etc.), and the time of exposure.
WBM is a suspension of solids and dissolved material in a carrier base fluid of water. WBM tends to be used for wells that are normally pressured or do not encounter difficult geology. Based on the experience gained while drilling the Deep Panuke delineation wells, it was determined that only WBM will be used for any new development drilling activities.
The typical composition of WBM (seawater gel mud type) for Deep Panuke are as follows:
barite;bentonite;potassium chloride (KCl); polymers; water;glycol;soda ash/sodium bicarbonate/lime; caustic soda; and salt (sodium chloride or calcium chloride).
During drilling of the new wells, the mud is circulated down the drillpipe from the drilling unit to the bottom of the wellbore and returned to the drilling unit in the annular space (between drill pipe and open hole/casing) carrying the cuttings from the well. Each hole section of a wellbore requires different fluid properties. Thus after each hole section, the mud is modified or changed out. WBM that is no longer required will be disposed of overboard, along with WBM cuttings in accordance with the Offshore Waste Treatment Guidelines (OWTG) (NEB et al. 2002).
For the wells to be re-entered and completed, some drilling is required to remove cement suspension plugs. This will be done using a viscosified brine solution and so traditional drilling mud will not be required. Prior to removal of the last suspension plug on the existing wells, the well will be displaced with filtered completion brine which will act as an overbalanced annulus fluid for setting the production packer. Some viscous pills of polymer gelled brine may be used to ensure removal of all solid particles in the wellbore. The completion fluid will be clear brine with additives for corrosion and oxygen inhibition as well as H2S scavengers.
Deep Panuke Volume 4 (Environmental Assessment Report) November 2006 2-29
Once the well completion is set and the production tree is in place, it will be necessary to flow the well to clean up and remove completion fluids from the reservoir. This operation will be done using a well test package installed on the drilling rig. In order to flow the well, it is necessary to provide an underbalance for the well to flow naturally. This underbalance can be achieved in a number of ways but, in general, involves lowering the density of the completion fluid inside the tubing string. It is typically not recommended to use fresh water to lower fluid density in a gas well as this can lead to the formation of hydrates. Circulating nitrogen into the completion tubing is one alternative to lowering fluid density but tends to be equipment intensive on the drilling rig. Another alternative is to displace some of the completion fluid in the tubing string with either diesel or glycol or a combination of both. This will likely be the method used for Deep Panuke wells. The underbalanced fluid column, also referred to as the “fluid cushion”, is caught by the well test equipment on the drilling rig and burned through the oil burner on the flare boom. Typically this represents a very small volume of diesel in the order of 20 to 30 m³.
Through the life of the field, workovers will be required in the wellbores. These workovers will require various pieces of equipment to be sent offshore to perform downhole work. Completions brines may be used during these processes. These brines will be composed of water and a salt formulation kept in suspension using a viscosifier (polymer).
2.3.9 Hydrostatic Testing
The export pipeline for both M&NP and SOEP Subsea Options and the production and injection flowlines will be hydrostatically tested. It may be necessary to treat the seawater introduced into the pipeline with corrosion inhibitors and biocides as these chemicals protect the interior surface of the pipeline if the time between the installation of the pipeline and its commissioning into service exceeds the timeframe allowed for leaving untreated seawater in the pipeline. Leaving untreated seawater in the pipeline for more than one month can establish conditions which permit corrosion to occur at a later stage in the life of the pipeline. The introduction of treatment chemicals is a safety measure for the prevention of corrosion over the life span of the pipeline.
The hydrostatic test plan for the export pipeline is detailed in Table 2.4 and the following paragraphs. For the export pipeline (M&NP Option), the discharge of hydrostatic fluids occurs at the MOPU. The cooling water pumps, running at 2400 m3/hr, will be flowing into the discharge caisson while discharging the hydrostatic fluid. This provides a dilution factor as outlined in the table below. There is no dilution for the export pipeline (SOEP Subsea Option) since the release point is at the tie-in location. For the flowlines, hydrostatic fluids may be discharged at the MOPU or at the individual subsea wellheads. This will be confirmed during detailed design. Therefore, no dilution for the flowlines is assumed as a worst case scenario.
Deep Panuke Volume 4 (Environmental Assessment Report) November 2006 2-30
Table 2.4 Hydrostatic Fluid Discharge Summary
Case Length [km]
Release Point Release Volume [m3]
Release Rate
[m3/hr]
Cooling Water Rate
[m3/hr]
DilutionFactor
Export Pipeline (M&NP Option)
176 Field Centre 43,200 400 2400 6:1
Export Pipeline (SOEP Subsea Option)
15 SOEP Subsea Tie-in location
3040 400 n/a n/a
Production Flowlines (at start-up)
18.2 Field Centre 590 175 n/a n/a
Production Flowlines (after start-up)
12.4 Field Centre 402 175 n/a n/a
Acid Gas Injection Flowline 1.7 Field Centre 8 24 n/a n/a
Although assessed in the previously approved 2002 CSR, hydrostatic testing must be re-assessed due to changes in dilution factors, location of release, and additional pipeline and flowlines scenarios.
For both the M&NP Option and the SOEP Subsea Option, the pipeline will be installed cleaned, gauged, flooded, and hydrotested. The pipeline spool between the pipeline and MOPU will be installed and the pipeline will be leak tested, dewatered, dried and nitrogen packed. For the M&NP Option, the fluid will be disposed at the MOPU location. For the SOEP Subsea Option, the fluid will be disposed at the SOEP subsea tie-in location.
The flowlines will be installed cleaned, gauged, flooded and hydrotested. The flowline spool between the pipeline and MOPU will be installed and the flowline leak tested. For the flowlines, it is unknown at this time whether the fluid will be discharged at the MOPU location or at the individual wellhead locations. This will be determined during detailed design.
All the water introduced into the line shall be thoroughly filtered to 50 microns. During filling, cleaning, gauging and hydrostatic testing, chemical inhibition package(s) will be continuously injected into the seawater. The chemical inhibition package may include: dye to aid in the detection of leaks; a biocide to control marine organisms and sulphate reducing bacteria; a corrosion inhibitor; and a dissolved oxygen scavenger to minimize corrosion on the interior of the pipeline. During the filling cycle, some spillage of this water may occur at the pig receiving station offshore. This occurs when excess hydrostatic water is required to push the pig into the pig receiver at the end of the pipeline.
The chemicals to be used in this application will be approved for discharge through the Offshore Chemical Selection Guidelines (OCSG) (NEB et al. 1999) and selected from a list of chemicals approved for use in Canada. Since the installation program for the pipeline is still under development and a supplier has not yet been selected, the definitive treatment chemicals cannot be specified.

Deep Panuke Volume 4 (Environmental Assessment Report) November 2006 2-31
A study, consisting of two components, will be undertaken to confirm predictions there will be minimal effects of the selected chemicals discharged into the environment. A toxicity bioassay program (first study component), will be undertaken prior to discharging these compounds. The bioassay will employ samples of the proposed chemical diluted in seawater to emulate the mixtures of chemicals and concentrations proposed for the hydrostatic test program. The results will be applied in a plume dispersion model (second study component) to confirm that there will be minimal effect to the marine environment around the platform. Prior to undertaking this study, the parameters and scope of the bioassay study will be discussed with Environment Canada and DFO.
The onshore section of the pipeline will also require hydrostatic testing, which may be conducted concurrently with the offshore section of the pipeline as discussed above, using the same seawater source and treatment chemicals.
Should the schedule of the onshore section of the pipeline installation be changed, then a separate hydrostatic test may be required. Under this circumstance, the hydrostatic test water could be left in the onshore pipeline until the offshore testing is completed and the hydrostatic test water discharged with the offshore hydrostatic test water.
2.4 Operations
2.4.1 Production
Production facilities on the MOPU will be operated to optimize production while maintaining environmental protection and high safety standards and minimizing environmental impact. The production facilities will be staffed on a 24-hour basis. Facility maintenance and inspection requirements will be managed through a maintenance management system that will incorporate proactive and predictive methods as well as intelligent condition monitoring techniques.
Production facilities will consist of equipment for separation, metering, amine sweetening, acid gas injection, dehydration, hydrocarbon dewpoint control (M&NP Option only), produced water treatment and disposal, condensate treatment, condensate injection (M&NP Option only), feed gas and export gas compression, and utilities. A simplified process flow diagram is presented as Figure 2.10.
For the M&NP Option, all production and treatment facilities are located offshore. For the SOEP Subsea Option, production and treatment facilities are primarily located offshore but the export gas and liquids will be routed to the existing SOEP facilities near Goldboro and, subsequently, Point Tupper for further processing.

Acid
Ga
sIn
jecti
on
Fe
ed
Ga
sC
om
pre
ssio
n
Ga
sS
we
ete
nin
gS
we
et
Ga
sD
eh
yd
rati
on
Co
nd
en
sa
teT
rea
tme
nt
Inle
tS
ep
ara
tio
n
Pro
du
ce
dW
ate
rT
rea
tme
nt
Wa
ter
Dis
po
sa
l
Po
ten
tia
lS
urp
lus
Co
nd
en
sa
teIn
jecti
on
(M&
NP
Op
tio
n)
Sa
les
Ga
s t
oT
hir
d P
art
yP
ipe
lin
e
Co
oli
ng
Wa
ter
Su
bse
aP
rod
ucti
on
We
lls
Hyd
roca
rbo
nD
ew
po
int
Co
ntr
ol
Sa
les/E
xp
ort
Ga
sC
om
pre
ssio
n
Sa
les/E
xp
ort
Ma
rin
eP
ipe
lin
e
Fu
el
Co
nd
en
sa
teFo
r P
latf
orm
En
erg
yG
en
era
tio
n(M
&N
P O
pti
on
)
On
sh
ore
Th
ird
Pa
rty
Ga
sP
roce
ssin
g(S
OE
P S
ub
se
aO
pti
on
)
Co
nd
en
sa
teFo
r E
xp
ort
(SO
EP
Su
bse
aO
pti
on
)
Fig
ure
2.1
0
Sim
pli
fie
d P
roc
es
s F
low
Dia
gra
mP:\
En
vSc
i\101xx
x\1015157 -
De
ep
Pa
nu
ke
\Gra
ph
ics\
Fig
ure
s\Fig
ure
2-1
0.c
dr

Deep Panuke Volume 4 (Environmental Assessment Report) November 2006 2-33
For the M&NP Option, the export gas will be “on specification” sales gas meeting the hydrocarbon dewpoint and water content requirements for the M&NP pipeline. As a result, there is no onshore treatment required. The sales gas will be routed to shore near Goldboro in a new 560 mm [22 inch] pipeline with a connection into the existing M&NP pipeline. Onshore facilities are related to metering/quality measurement and isolation valve requirements only. The liquids will be treated offshore and used as fuel. Currently it is estimated that there will be no surplus condensate produced beyond fuel usage. To allow flexibility in times of maintenance and/or operational issues, condensate will be commingled with the acid gas and re-injected for disposal.
For the SOEP Subsea Option, the export gas and condensate will be commingled and routed to the SOEP 660 mm [26 inch] pipeline and routed to the existing SOEP Goldboro gas plant. At Goldboro, the gas and liquids will be separated and the gas further processed into sales gas by SOEP and shipped via the existing M&NP pipeline to market. The liquids will be routed to the SOEP Point Tupper liquids plant for processing and sale.
2.4.1.1 Separation
The well fluids will be processed through the production or test separator for separation of the gas, condensate, and water.
2.4.1.2 Metering
The Deep Panuke production facilities will adhere to the applicable regulations and the Canada-Newfoundland Offshore Petroleum Board (CNOPB)/CNSOPB Measurement Guidelines, October 2003.
2.4.1.3 Amine Sweetening
The amine sweetening system, which uses methyldiethanolamine (amine), is designed to remove the H2S contained in the raw gas. The removal of the H2S and CO2 from raw gas results in a waste acid gas stream predominantly containing H2S and CO2. The H2S content of the raw gas during the life of the Project will vary. The amine sweetening system is designed to operate safely over the expected variation of H2S content in the raw gas.
The Deep Panuke gas contains up to 3.5 mole % CO2 and approximately 1,800 ppm H2S. The amine sweetening unit is designed to be fed with gas that contains up to 2,500 ppmv of H2S and up to 3.5 mole % CO2 to provide some operational design flexibility. The facility metallurgical design will be for 3,000 ppmv of H2S and 4.0 mole % CO2 to provide some metallurgical design flexibility. The sales gas specification requires the H2S content to be a maximum of 6 mg/m3 (approximately 4 ppmv) and 3.0 mole % CO2. The current design basis unit outlet is for an H2S level of 2 ppmv and CO2 at 2.8 mole %.

Deep Panuke Volume 4 (Environmental Assessment Report)• November 2006 2-34
Although the M&NP Option is the only option producing sales gas, the same product specification requirements will be met for SOEP Subsea Option as the SOEP facilities require a sweet feedstock.
The amine-sweetening unit is based on physical absorption using a solvent to absorb the impurities (H2S and CO2). The solvent is then regenerated via heating to release the absorbed impurities. The process is cyclic, in which the amine is continuously circulated through the absorber/contactor to pick up the impurities, then routed to a regenerator to release the impurities.
Remaining CO2 and H2S amounts not removed during the amine sweetening process remain in the sales gas, which is sent to market. The amine-sweetening unit is a closed loop system.
The amine solvent used in the sweetening unit will be methyldiethanolamine, which will improve the selectivity between H2S and CO2 absorption. The cyclic process can result in a build up of impurities in the amine solvent over time. If the amine solvent requires a change, whether complete or partial (dilute out the impurities), it is removed from the process and shipped to shore for reclaiming (manufacturer to clean and recycle). Production will be halted when a complete change-out of amine solvent is required. The change-out of the amine solvent will be subject to the EPP.
2.4.1.4 Acid Gas Handling
Acid gas from the amine regenerator will be compressed to approximately 15,100 kPa (from a feed pressure of 150 kPa) using a multi-stage compressor. Water condensing between the compressor stages recycled back to the processing facilities. The compressed acid gas will be injected into a suitable, subsurface reservoir. Table 2.5 describes the design flow and composition for the acid gas injection system.
The Project does have the capability to flare acid gas. The capability to flare the acid gas stream is required to provide operational flexibility in times of maintenance and/or operational issues.
Table 2.5 Acid Gas Injection System – Composition and FlowDescription Design Data
Mass Flow (kg/h) 8100STD Gas Flow (m3/hr) 5325Molar Flow (kgmole/hr) 230Pressure (kPa) 150Temperature (C) 56Component Mole %CO2 63.2H2S 18.5CH4 17.0C2+ 1.1H2O 0.24Note: The flow represents the total feed to the acid gas management system including acid gas from the amine system and H2S removed from the condensate fuel for the Mean Production Profile (Mean denotes the statistical Mean value of a probability distribution).

Deep Panuke Volume 4 (Environmental Assessment Report) November 2006 2-35
2.4.1.5 Dehydration
Sweet gas from the amine-sweetening unit contains water that must be removed prior to hydrocarbon dewpoint adjustment (M&NP Option) or prior to export (both options). The gas dehydration unit is a liquid desiccant process utilizing a solvent to absorb the water. The solvent, triethylene glycol (TEG), is then regenerated via heating to release the absorbed water. The process is cyclic in which the TEG is continuously circulated through the absorber/contactor to pick up the water then routed to a regenerator to release the water. A brief description of the process follows.
Treated gas from the amine unit is routed to the TEG system for dehydration. The gas first is routed to the TEG contactor in which the incoming gas flows counter current to the lean TEG. The lean TEG absorbs the entrained water in the gas stream and reduces the water content of the gas.
The rich TEG leaving the contactor cools the regenerator overheads and is routed to the TEG flash drum. The flashed gas from the flash drum is routed to the flare. The flash drum liquids then pass through the TEG charcoal filter (to remove trace hydrocarbons) and the TEG filter (to remove charcoal) before being heated in the TEG regenerator feed/effluent heat exchanger before entering the regenerator.
The bottoms of the regenerator are heated to remove the water from the rich TEG. A small amount of stripping gas is used to enhance the water removal of the regenerator. The regenerator overheads are cooled for tower top temperature control, with the overhead gas stream being routed to the flare.
The water removed from the sweet gas dehydration process is removed from the top of the TEG regenerator in the overhead gas stream and routed to the low-pressure (LP) flare header. A large portion of the water in the overhead gas stream will condense in the flare piping or drum. The flare drum liquids will be pumped into either the inlet or test separators and the water portion of the liquids in these separators is routed to the produced water treating facilities. Non-condensable hydrocarbons will be flared.
The lean glycol leaves the regenerator column, enters the TEG surge drum, then is cooled in the TEG regenerator feed/effluent heat exchanger. The lean TEG is further cooled in the lean TEG cooler (cooling medium cooler) before entering the TEG contactor.
The dry gas from the TEG contactor passes through a coalescer to reclaim any entrained TEG leaving the contactor in the overhead gas stream. The TEG is returned to the flash drum. The dehydration process is a closed loop system. The circulating TEG builds up contaminants, primarily salts. Once the levels build to a point, the risk of corrosion and or deposits increase to the point where removal of some/all the TEG is required and new TEG added. Rate of build up varies with the feed quality so it is difficult to predict how long before this happens.

Deep Panuke Volume 4 (Environmental Assessment Report) November 2006 2-36
Spent TEG has no measurable H2S and will be disposed of an approved facility.
2.4.1.6 Hydrocarbon Dewpoint Control
For the M&NP Option, the dehydrated gas from the TEG system is cooled via the Joule-Thompson (JT) effect by dropping the pressure of the gas. A portion of the gas stream condenses (condensate), which is then separated. This step will be done offshore as it is necessary to satisfy pipeline gas specification requirements.
For the SOEP Subsea Option, the export gas routed to the SOEP 660 mm [26 inch] pipeline need not meet sales gas specification requirements. For these cases, hydrocarbon dewpoint control operations will be done via the SOEP gas plant existing facilities.
2.4.1.7 Condensate Treatment for Fuel
Recovered condensate will be treated via stabilization to remove light ends and H2S. The light ends and H2S thus released are recycled back to the raw gas stream for processing.
For the M&NP Option, condensate is burned on the MOPU as the primary source of fuel. Operation of the condensate stabilizer will remove H2S in order to minimize air emissions and to produce a fuel meeting the turbine driver requirements. Given that the amount of condensate is a function of raw gas rate thus declining over the life of the Project, it will be supplemented with natural gas as necessary to maintain adequate fuel levels.
The SOEP Subsea Option, all recovered condensate will be routed to the shore based SOEP facilities for separation, processing, and sale.
Condensate production is based on the production profile for the Project. The production profile has been calculated for a range of reservoir gas compositions. The intent is that the MOPU will be designed for the entire possible range. Over the range, the facility will produce less condensate than that required for fuel thus no surplus condensate will exist for the M&NP Option.
The MOPU will have some minimal storage for condensate. This storage is, approximately 55 m3 and represents approximately five hours of consumption at full rate. The intention of this storage is to cover periodic production upsets with enough time to allow for short term troubleshooting and/or swinging fuel from condensate to either fuel gas or diesel. The storage tank is a pressure vessel that is pressured with inert gas with excess pressure routed to the flare.
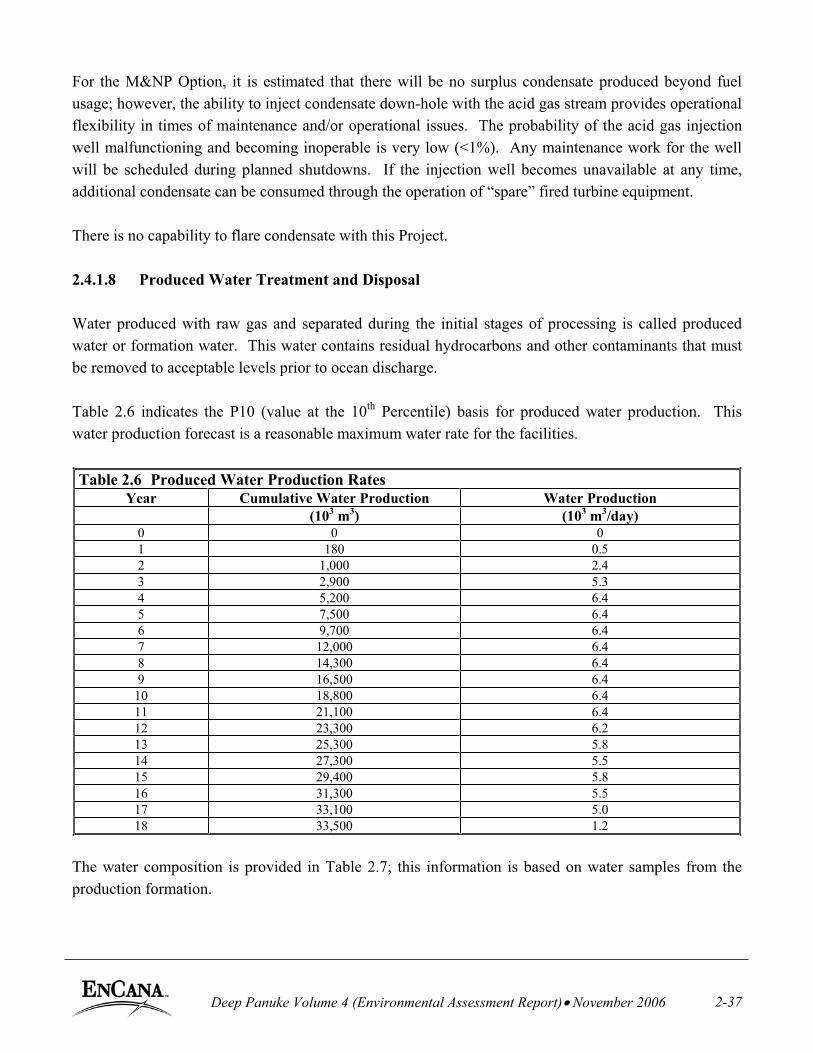
Deep Panuke Volume 4 (Environmental Assessment Report) November 2006 2-37
For the M&NP Option, it is estimated that there will be no surplus condensate produced beyond fuel usage; however, the ability to inject condensate down-hole with the acid gas stream provides operational flexibility in times of maintenance and/or operational issues. The probability of the acid gas injection well malfunctioning and becoming inoperable is very low (<1%). Any maintenance work for the well will be scheduled during planned shutdowns. If the injection well becomes unavailable at any time, additional condensate can be consumed through the operation of “spare” fired turbine equipment.
There is no capability to flare condensate with this Project.
2.4.1.8 Produced Water Treatment and Disposal
Water produced with raw gas and separated during the initial stages of processing is called produced water or formation water. This water contains residual hydrocarbons and other contaminants that must be removed to acceptable levels prior to ocean discharge.
Table 2.6 indicates the P10 (value at the 10th Percentile) basis for produced water production. This water production forecast is a reasonable maximum water rate for the facilities.
Table 2.6 Produced Water Production Rates Year Cumulative Water Production Water Production
(103 m3) (103 m3/day) 0 0 0 1 180 0.5 2 1,000 2.4 3 2,900 5.3 4 5,200 6.4 5 7,500 6.4 6 9,700 6.4 7 12,000 6.4 8 14,300 6.4 9 16,500 6.4
10 18,800 6.4 11 21,100 6.4 12 23,300 6.2 13 25,300 5.8 14 27,300 5.5 15 29,400 5.8 16 31,300 5.5 17 33,100 5.0 18 33,500 1.2
The water composition is provided in Table 2.7; this information is based on water samples from the production formation.

Deep Panuke Volume 4 (Environmental Assessment Report) November 2006 2-38
Table 2.7 Water Composition
Component Abenaki 5 Formation Water (mg/l) Na+ 29,163 K+ 513
Ca2+ 5,885 Mg2+ 950 Ba2+ 8 Sr2+ 448 Fe2+ 0 Mn2+ 0 Cl- 55,321
HCO3- 731
CO3- 0
SO42- 1,570
Produced water will be treated to a target dispersed oil concentration of 25 mg/L (30-day weighted average). The OWTG (NEB et al. 2002) specify a 30-day weighted average of 30 mg/L. The following is a brief description of the treatment process.
Prior to discharge, produced water is treated in several ways. Water from the inlet separator, test separator, condensate stabilizer surge drum, and stabilizer feed filter coalescers is commingled and routed directly into the produced water feed drum. Water from other LP vessels is typically routed to the closed drains header, which is routed to the LP flare drum. Liquids from the LP and high-pressure (HP) flare drums are routed to either the inlet or test separators.
The function of the water feed drum is to hold produced water until sufficient volume is available to route to the hydrocyclones. The small amount of gas from this drum is routed to the acid gas injection compressor. At the start of the field life, the water rates are anticipated to be very low, such that batch processing in the hydrocyclones is likely. As the water rates increase, the flow will be continuous.
The hydrocyclones will remove all but trace amounts of liquid hydrocarbons. The hydrocyclones oil outlet is routed to the closed drains. The water is continuously routed to cartridge-style produced water polishers to further reduce trace amounts of liquid hydrocarbons.
The water is then heated in the produced water stripper feed preheaters prior to entering the produced water stripper. The amount of heat will be adjusted to aid in the H2S removal capabilities of the stripper tower. The produced water stripper tower is a packed counter current gas/liquid stripping column in which sweet fuel gas flows upwards counter current to the water to remove H2S; preliminary indications suggest that H2S will be lowered to a concentration between 1 to 2 ppmw. The gas from the stripper is routed to the acid gas injection compressor.
Deep Panuke Volume 4 (Environmental Assessment Report) November 2006 2-39
The flow to the stripper column will change dramatically over the field life. It may be necessary to provide flow via recycle or process in batches during low flow periods.
The water outlet of the stripper is sampled for oil and H2S and routed overboard. The waste gas from the produced water stripper will be routed to the acid gas injection compressor for injection. This will be the normal mode of operation. The plant does have the capability to divert the produced water stripper gas to the flare in the event of a malfunction of the acid gas injection well and/or compressor. If the produced water stripper gas were flared, it would be a maximum of 980 kg/h of 19.7 MW gas containing 1.5 mole % H2S.
The concentrations of amine and TEG in produced water at the outlet to the sea are below those concentrations which would impact marine species. Studies on the eco-toxicity of methyldiethanolamine and TEG, undertaken by the manufacturers, indicate that these substances are of low toxicity to fish and invertebrates in the concentrations present in the produced water discharge and that these substances are readily bio-degradeable (Woodburn and Stott, undated).
Currently the design envisages platform-based laboratory facilities for verification of produced water measurements.
The produced water will be routed overboard via the discharge caisson where it will mix with approximately 2,400 m3/hr of seawater which is used for process cooling purposes.
2.4.1.9 Compression
For the M&NP Option, the sales gas will be compressed on the platform for delivery to shore. The expected sales gas discharge pressure on the platform is approximately 13,000 kPa. The Deep Panuke compressor system is composed of three 7 MW units for a total of 21 MW of compressor power. The compressors will be used for sales gas export and feed gas. The feed gas service will be to account for declining reservoir pressure. These compressors will be tri-fuel (condensate, fuel gas, and diesel).
For the SOEP Subsea Option, the export gas will be compressed on the platform for delivery to the existing SOEP 660 mm [26 inch] pipeline and subsequently routed to shore. The expected export gas discharge pressure on the platform is approximately 13,000 kPa. Like the M&NP Option, the Deep Panuke compressor system is composed of three 7 MW units for a total of 21 MW of compression power. The compressors will be used for gas export and feed gas. The feed gas service will be to account for declining reservoir pressure. These compressors will be dual-fuel (fuel gas and diesel).
Deep Panuke Volume 4 (Environmental Assessment Report) November 2006 2-40
2.4.2 Utilities
2.4.2.1 Electrical Power Generation
Electrical power generation for the Deep Panuke MOPU will be provided by multiple redundant fuel turbine generating sets. For the M&NP Option, the turbines will be tri-fuel (condensate, fuel gas, and diesel). For the SOEP Subsea Option, the turbines will be dual-fuel (fuel gas and diesel). For the first production start-up, sufficient quantity of diesel will be available for power generation.
Emergency power will be provided by a diesel engine driven generator set as per CNSOPB regulations. The design requires the use of diesel fuel for emergency situations (emergency generator, firewater pumps), for certain start up scenarios (i.e., when buy back gas is not available), and for certain maintenance scenarios (i.e., power generators when no buy back gas is available).
The transfer of diesel from ships to the MOPU storage tanks will occur via loading hose. Bulk transfer/hose-handling procedures will be outlined in the EPP.
Battery back-up will be provided for critical emergency services.
2.4.2.2 Platform Fuel
For the M&NP Option, condensate will be used as fuel. Fuel gas may also be used as supplemental fuel, as required. For the SOEP Subsea Option, fuel gas will be the primary fuel source. Diesel will be used as fuel for the crane and the emergency generator. Diesel will also be used for start-up and shutdown of the compressor and power generation turbines. The MOPU will have a storage capacity of approximately 70 m3 for diesel. The area around the diesel storage will be “bunded” or “dyked” to collect diesel fuel in the unlikely event of a leak/spill. The bunded area will be routed to the open drains system within which the hydrocarbon is recovered. There is no capability to flare diesel on the MOPU.
All fuel will be metered.
2.4.2.3 Heating Medium System
The processing facilities require heat input for a number of systems including amine regeneration, TEG regeneration, condensate stabilization, and produced water processing. The heating system is a “closed circuit” system in which a heating medium (essentially the same solution as per the cooling medium except it contains some stabilization additives) is pumped through waste heat recovery units (WHRUs). There are three WHRUs, one installed on each turbine exhaust of the compressors. The heating
Deep Panuke Volume 4 (Environmental Assessment Report) November 2006 2-41
medium, circulating through the WHRUs, extracts heat that would be destined as waste to ambient and routes to various users.
2.4.2.4 Cooling Medium System
Cooling water for process and utility systems will be done via an indirect seawater/cooling medium system. Seawater will be pumped through a filter then a heat exchanger. The exchanger will cool a mixture of ethylene glycol and water (cooling medium). The cooling medium will then be distributed to the equipment and the plant requiring cooling. The once through seawater is returned to the ocean via the discharge caisson.
2.4.2.5 Deck Drainage
Deck drainage will be collected and treated according to the OWTG (NEB et al. 2002). Drainage from equipment areas on platforms will be directed through a header system to a collection tank to an oil/water separator treatment unit on the MOPU. Petroleum hydrocarbons and sludge in the oil/water separator will be transferred into containers for shipment to shore for disposal. The water from the oil/water separator will be treated using a cartridge-style water polisher and tested prior to discharge to ensure compliance with the discharge criteria of 15 mg/L or less.
The deck drainage system does have overflows to permit water to be routed directly overboard in the event of a deluge event or rain water in excess of the design condition.
2.4.2.6 Relief and Blowdown System
Safety systems and devices will be designed to meet Project standards and the requirements of all applicable standards, codes, and local regulations, including:
API B31.3 – Piping; API 14C – Cause and Effects; API 520, 521 – PSV’s/Rupture Discs; IEC 61508 – Functional Safety System; ANSI/ISA-84.01-1996 – Safety Instrumented Systems; NFPA 72E – Automatic Fire Detectors; and NORSOK-1-002 – Safety and Automation System.
The principal elements of the relief and blowdown system include the pressure relief devices, flare piping system, flare separator, flare structure and the flare burner. The flare design will take place during detailed design. Application of all relevant codes will be followed for the system design. The system

Deep Panuke Volume 4 (Environmental Assessment Report) November 2006 2-42
will be designed considering emergency shutdowns, blocked discharges, fire exposure, tube rupture, control valve failure, thermal expansion and utility failures.
Scheduled activation of the relief and blowdown system will occur for planned tests and inspection or maintenance work. When the system is commissioned and activated, hydrocarbons will be safely directed to the flare system. The flare will be designed to prevent any impact on the helideck and the living quarters during worst-case weather scenarios.
2.4.2.7 Inert Gas System
The Project will include an inert gas system. Inert gas is necessary for commissioning and start-up exercises as well as ongoing operations. The main use of the inert gas is in the gas compressor seals. The inert gas may also be used as a blanketing or purging gas to displace hydrocarbon vapours and reduce the risk of explosion and fire.
2.4.2.8 Instrument Air
Instrument air will be produced by electric driven air compressors and used in the instrumentation and controls system. The air will be dried.
2.4.2.9 Breathing Air
A breathing air system will be included in the design of the Project. Breathing air will be required for emergency purposes and for routine maintenance activities.
2.4.3 Support and Servicing
Supply vessels and helicopters will be used to supply personnel, fuel, food, well construction equipment and other materials required to maintain production, construction, and well construction operations. Typically, helicopters will be used for regular crew changes, visits from regulatory agencies, service personnel and other visitors that need to be transported to and from the offshore facilities.
2.4.3.1 Support Vessels
Supply vessels will be used to provide the platform operations with materials. Supply vessels will hold liquid drill mud, drill water, potable water, barite (weighting material), fuel, cement, bentonite (fresh water gel), drill pipe, casing and various equipment necessary for well construction operations, production operations and construction. It is anticipated that supply vessels will make periodic round trips from a dockside shorebase in Nova Scotia to the platform operation between two and four times a

Deep Panuke Volume 4 (Environmental Assessment Report) November 2006 2-43
week during normal operations. It is anticipated that there will be approximately six trips a week during construction and heavy maintenance periods. In addition, a standby vessel is required near the platform at all times as per CNSOPB regulations.
2.4.3.2 Helicopters
Personnel will be transported to and from the offshore facilities via helicopters from the heliport located at the Halifax International Airport. During pipelay and heavy lift activities, the frequency of helicopter activity is estimated to be two to three trips per week. During hook-up and commissioning, the frequency is estimated to be seven to ten trips per week. The frequency will reduce to approximately six to ten flights per month during operations. These helicopters are used primarily to transport crew members, company personnel and service personnel. In some cases, small equipment and parts are transported via air transportation.
2.4.4 Project Safety Zones
EnCana will consult with the appropriate regulatory authorities to develop a safety zone around the Deep Panuke facilities in accordance with the Nova Scotia Offshore Petroleum Drilling Regulations and the Nova Scotia Offshore Area Petroleum Production and Conservation Regulations. This zone will include, as a minimum, an area extending 500 m around the MOPU and will likely also include the interfield flowlines and wellheads. The exact configuration of the safety zone will be determined based on safety risk assessment studies and consultations with the regulatory agencies. There will also be a temporary 500 m safety zone around the drilling rig when it is on location for development drilling. A Notice to Mariners will be issued and appropriate mariner charts will be updated for the installations through the Canadian Hydrographic Service.
Standard operating procedures will be developed to lessen the risk of collisions between ships and Project infrastructure. These would include, but are not limited to, the following:
presence of structures and safety zones would be indicated on nautical charts; Coast Guard Notice to Mariners would apply during construction; and radio operators would notify approaching vessels of the presence of the structures. The distance at which mariners would be notified would be dependent on a number of factors, including the direction and speed of the approaching vessel and weather conditions.
Although there are no regulations under the CNSOPB that provide a similar safety zone around a pipelaying vessel, EnCana will request the Coast Guard issue a Notice to Mariners with regard to this temporary construction activity. Mariners will be informed as to the status of the pipelaying operation and the vessels taking part in the activity. The export pipeline’s design takes into consideration fishing activity in the area so that once the pipeline is laid, there will be no restrictions with regard to safety

Deep Panuke Volume 4 (Environmental Assessment Report)• November 2006 2-44
zones over the pipeline although there will be fishing restrictions over the subsea connection to the SOEP pipeline for the SOEP Subsea Option. As with the installation and interfield flowlines, nautical charts will be updated for the export pipeline through the Canadian Hydrographic Service.
2.4.5 Onshore Facilities
In addition to the onshore pipeline, other onshore facilities will include a pig launcher/receiver facility and a safety/emergency shutdown valve system. Periodic mechanical, electrical, instrumentation and general housekeeping maintenance will be performed. For example, valves, piping, or general lighting will require routine maintenance. Site visits will take place periodically.
EnCana will take care to avoid use of invasive species in post-construction revegetation efforts and will place a clear priority on the use of native species. Vegetation management will be conducted mainly by mechanical means and will be confined to the RoW. Herbicide use will be restricted to valve sites and meter stations and will involve low application rates of compounds with low persistence and low ecological toxicity. Herbicides will not be used within close proximity (e.g., 30 m) of watercourses or wetlands.
2.5 Decommissioning and Abandonment
The mean production life of the Project is anticipated to be 13.3 years; however, the resource forecast show a probable production life ranging from 8 to 17.5 years. The design life is 20 years for the topsides and 25 years for the remaining Project structures. As is common in the industry, facility life could be extended beyond 20 years with appropriate technical and maintenance activities in the event reservoir productivity or additional resources prolong the life of the Project.
The following facilities will require decommissioning and abandonment:
• MOPU;• subsea production and injection wells;• subsea facilities;• offshore gas export pipeline;• onshore pipeline (M&NP Option only); and• onshore facilities (M&NP Option only).
Decommissioning and abandonment of these facilities will be performed in accordance with the regulatory requirements applicable at the time of such activities. An action plan for decommissioning will be submitted to the appropriate authorities for approval prior to commencement of decommissioning and abandonment activities.

Deep Panuke Volume 4 (Environmental Assessment Report) November 2006 2-45
Requirements for eventual removal of facilities will be taken into account during detailed design. Although regulatory requirements could change prior to the time of decommissioning and abandonment, current practices would see the facility degassed, degreased and cleaned to applicable standards, the MOPU towed to another location for re-use or retrofit, the wells abandoned and conductors cut below the seafloor, and the pipeline, flowlines and umbilicals flushed, cleaned, and abandoned in place. The potential presence of contaminants that could be encountered during recovery and transportation of the facilities will be taken into account. Potential reuse of the MOPU will be considered on an economic basis.
Wells will be abandoned in compliance with applicable drilling regulations and according to standard industry practices.
With the exception of the pipeline, onshore facilities will be removed and the land restored in accordance with applicable regulations. Buried onshore pipelines will be flushed, capped, and abandoned in place. The onshore pipeline RoW will be allowed to return to a natural state. Any above- ground structures associated with onshore pipelines will be removed. A Decommissioning Plan will be developed for the Project, which will provide detailed procedures for decommissioning onshore facilities.
2.6 Project Schedule
The Project Offshore Strategic Energy Agreement (OSEA), signed in June 2006, initiated the start of the next Project phase. Consisting primarily of the regulatory approval process, major contract tendering and negotiations, and a field centre bid competition, this phase is expected to be completed in the third quarter of 2007, with an expectation of project sanction in the third quarter of 2007. Assuming sanction and after contract awards, the Project will engage in detailed engineering and procurement. Subsequent onshore fabrication at existing facilities will occur prior to installation offshore.
Hull and topsides fabrication is scheduled to commence third quarter 2008, with the MOPU hull and topsides ready for at-shore integration first quarter 2010.
It is anticipated that the onshore and offshore sections of the export pipeline will be constructed either in 2009 or 2010. The tie-ins to the MOPU and to either the M&NP facilities or to the SOEP pipeline will be completed after the MOPU and the export pipeline installation is complete. Hook-up and offshore commissioning activities will commence third quarter 2010 once the MOPU has been transported to the field centre. First gas is anticipated to be produced in the fall of 2010.
Well construction and completions will be completed with a separate mobile offshore drilling unit and will be scheduled between 2008 and 2010.

Deep Panuke Volume 4 (Environmental Assessment Report) November 2006 2-46
2.7 Emissions and Discharges
EnCana will adhere to the OWTG (NEB et al. 2002) and all applicable regulations for emissions and waste management. Where no standards exist, best industry practice will guide EnCana. EnCana will minimize, to the extent practical, both the volumes of wastes being discharged and the concentration of contaminants entering the environment. A Waste Management Plan (WMP) (included in the EPP) will be developed for the Project that will address all phases of the Project including construction, installation, operation, decommissioning, and abandonment. The goal of this plan is to minimize offshore wastes, discharges, and emissions and identify appropriate mitigative measures.
Estimated quantities of wastes, discharges, and emissions that will be generated for both the construction/installation/drilling and production/operation phases of the Project are summarized in Table 2.8. The table also includes summary descriptions of the characteristics of the waste discharges and disposal procedures to meet regulatory compliance standards.
2.7.1 Air Emissions
Sources and types of air emissions during routine Project construction and operation will include:
exhaust from supply and stand-by vessels; short-term flaring of the produced fluid from production wells during clean-up; exhaust from machinery on the platform (e.g., gas turbines); fugitive emissions (e.g., emission of volatile organic compounds from valves, filter changeouts, storage of hydrocarbons, etc.); emissions associated with processing operations including continuous flaring for processing by-products from TEG and produced water treatment systems; and flaring of the full acid gas stream during routine maintenance of the acid gas management system (approximately 2% of operating time).
The gas vented from the TEG regenerator must be continuously flared to prevent emissions of aromatic hydrocarbons (BTEX) from the system. If the produced water stripping unit is required to remove residual H2S prior to disposal, the waste gas from this unit will be injected into the acid gas disposal well.
Refer to Appendix F for details on the atmospheric modelling undertaken for their Project. Further information on routine air emissions, including generation rates, is presented in Table 2.8 and Section 8.1. Information on air emissions during malfunctions and accidental events is provided in Section 8.1.4.4.

Dee
p Pa
nuke
Vol
ume
4 (E
nvir
onm
enta
l Ass
essm
ent R
epor
t) N
ovem
ber 2
006
2-47
Tab
le 2
.8 R
outin
e Pr
ojec
t Em
issi
ons/
Eff
luen
ts
Typ
e E
mis
sion
/Eff
luen
t E
stim
ated
Qua
ntity
C
hara
cter
istic
s D
ispo
sal S
tand
ard
Cons
truct
ion/
Insta
llatio
n/D
rillin
g G
ener
ator
, eng
ine
and
utili
ties e
xhau
sts
Tem
pora
ry, m
inor
C
O2,
SO2,
NO
x, TS
P A
tmos
pher
ic e
mis
sion
s will
com
ply
with
the
Air Q
ualit
y Re
gula
tions
(Nov
a Sc
otia
Env
iron
men
t Act
) and
Am
bien
t Air
Qua
lity
Obj
ectiv
es
(CEP
A).
Atm
osph
eric
E
mis
sion
s
Flar
ing
durin
g w
ell
clea
n-up
and
com
plet
ion
Expe
cted
~1/
2 da
y pe
r pr
oduc
tion
(new
and
re-e
ntry
) w
ell,
unle
ss o
ther
wis
e re
quire
d by
ope
ratin
g re
quire
men
ts.
Poss
ible
NO
x, C
H4,
TSP,
SO
2, C
O2,
TPH
, H2S
Com
plia
nce
with
CN
SOPB
Pro
duct
ion
and
Con
serv
atio
n Re
gula
tions
(Sec
tion
32),
Air Q
ualit
y Re
gula
tions
(Nov
a Sc
otia
Env
iron
men
t Act
)an
d A
mbi
ent A
ir Q
ualit
y O
bjec
tives
(CEP
A).
WB
M
Bul
k su
rfac
e re
leas
e of
ap
prox
imat
ely
700
m3 o
f WB
M
for p
rodu
ctio
n w
ell;
600
m3 fo
r in
ject
ion
wel
l. W
BM
on
cutti
ngs i
s exp
ecte
d to
be
244
m3 fo
r eac
h pr
oduc
tion
wel
l an
d 23
3 m
3 for i
njec
tion
wel
l.
Typi
cal c
onst
ituen
ts
incl
ude:
bar
ite, b
ento
nite
, K
Cl,
poly
mer
s, N
aHC
O3,
lime,
cau
stic
soda
, sal
t, an
d w
ater
WB
M w
ill b
e di
spos
ed o
verb
oard
.1
WB
M a
ssoc
iate
d cu
tting
s A
ppro
xim
atel
y 55
8 m
3of
WB
M a
ssoc
iate
d cu
tting
s di
scha
rged
for e
ach
new
pr
oduc
tion
wel
l to
be d
rille
d;
487
m3 fo
r inj
ectio
n w
ell.
Roc
k cu
tting
s coa
ted
with
W
BM
WB
M a
ssoc
iate
d cu
tting
s will
be
disp
osed
ove
rboa
rd.1
Dri
ll W
aste
D
isch
arge
s
Com
plet
ion
brin
e A
ppro
xim
atel
y 10
00 m
3 of
com
plet
ion
brin
e w
ill b
e di
scha
rged
at t
he su
rfac
e fo
r ea
ch n
ew p
rodu
ctio
n w
ell t
o be
dr
illed
; 300
m3 fo
r eac
h w
ell
re-e
ntry
and
the
inje
ctio
n w
ell
com
plet
ion.
Wat
er-b
ased
brin
e, p
ossi
bly
visc
osifi
ers
Com
plet
ion
fluid
will
be
disc
harg
ed o
verb
oard
as p
erm
itted
by
the
CN
SOPB
.1
Liq
uid
Eff
luen
t fo
r O
cean
D
isch
arge
Sani
tary
and
food
was
te
Max
imum
cap
acity
of t
he
faci
lity
durin
g op
erat
ion
is
appr
oxim
atel
y 68
per
sons
with
an
est
imat
ed v
olum
e of
20
L pe
r per
son
per d
ay; a
mou
nts
will
incr
ease
dur
ing
cons
truct
ion
phas
e w
ith
incr
ease
d pr
esen
ce o
f ves
sels
an
d cr
ews.
Mac
erat
ed fo
od, g
rey
wat
er
and
sani
tary
was
te
Sani
tary
and
food
was
te w
ill b
e m
acer
ated
to a
par
ticle
size
of 6
mm
or
less
prio
r to
ocea
n di
scha
rge.
1

Dee
p Pa
nuke
Vol
ume
4 (E
nvir
onm
enta
l Ass
essm
ent R
epor
t) N
ovem
ber 2
006
2-48
Tab
le 2
.8 R
outin
e Pr
ojec
t Em
issi
ons/
Eff
luen
ts
Typ
e E
mis
sion
/Eff
luen
t E
stim
ated
Qua
ntity
C
hara
cter
istic
s D
ispo
sal S
tand
ard
Dec
k dr
aina
ge
As g
ener
ated
Po
ssib
le o
ily w
ater
with
so
me
parti
cula
te m
atte
r R
oof d
rain
age
will
be
dire
cted
ove
rboa
rd.1
Dec
k dr
aina
ge w
ill b
e tre
ated
to re
duce
its o
il co
ncen
tratio
n to
mee
t reg
ulat
ory
requ
irem
ents
oc
ean
disc
harg
e.1
Bilg
e/ba
llast
wat
er
(Con
stru
ctio
n/Su
ppor
t ves
sels
)
As r
equi
red
Wat
er w
ith h
ydro
carb
ons
Bilg
e/ba
llast
wat
er w
ill b
e tre
ated
as n
eces
sary
to re
duce
its o
il co
ncen
tratio
n to
15
mg/
L or
less
prio
r to
ocea
n di
scha
rge.
1
Hyd
rost
atic
test
flui
ds
(Pip
elin
e co
mm
issi
onin
g w
ater
)
47,2
40 m
3 (ove
r sev
eral
day
s)
see
Sect
ion
2.3.
4 fo
r mor
e de
tails
.
Seaw
ater
con
tain
ing
bioc
ide
and
corr
osio
n in
hibi
tors
The
disc
harg
e of
hyd
rote
st fl
uids
will
requ
ire p
re-a
ppro
val f
rom
En
viro
nmen
t Can
ada.
Solid
Was
teM
isce
llane
ous s
olid
w
aste
s (tra
nspo
rted
to
shor
e)
As r
equi
red
Con
stru
ctio
n m
ater
ials
, br
oken
equ
ipm
ent
com
pone
nts,
pack
agin
g an
d sh
ippi
ng m
ater
ials
, da
mag
ed c
onta
iner
s and
ge
nera
l deb
ris a
nd re
fuse
as
soci
ated
with
co
nstru
ctio
n
Was
tes w
ill b
e so
rted
and
disp
osed
acc
ordi
ng to
loca
l reg
ulat
ory
regi
me
of th
e sh
ore
base
, inc
ludi
ng th
e N
ova
Scot
ia S
olid
Was
te-
Reso
urce
Man
agem
ent R
egul
atio
ns a
nd m
unic
ipal
requ
irem
ents
. M
etal
s will
be
salv
aged
.
Prod
uctio
n/O
pera
tion
Flar
ing
(aci
d ga
s dur
ing
rout
ine
mai
nten
ance
) re
fer t
o Ta
ble
8.3
H2S
, SO
2, N
Ox,
CO
2 A
tmos
pher
ic e
mis
sion
s will
com
ply
with
the
Air Q
ualit
y Re
gula
tions
(Nov
a Sc
otia
Env
iron
men
t Act
) and
Am
bien
t Air
Qua
lity
Obj
ectiv
es
(CEP
A).
Nor
mal
Geo
turb
ine
oper
atio
nsre
fer t
o Ta
ble
8.3
SO2,
NO
x, C
O2
Atm
osph
eric
em
issi
ons w
ill c
ompl
y w
ith th
e Ai
r Qua
lity
Regu
latio
ns(N
ova
Scot
ia E
nvir
onm
ent A
ct) a
nd A
mbi
ent A
ir Q
ualit
y O
bjec
tives
(C
EPA)
.
Air
Em
issi
ons
Prod
uced
wat
er
refe
r to
Tabl
e 2.
6H
ydro
carb
on, H
2S in
wat
er
(sou
r wat
er)
Prod
uced
wat
er w
ill b
e tre
ated
to a
targ
et d
ispe
rsed
oil
conc
entra
tion
of
25 m
g/L
(30-
day
wei
ghte
d av
erag
e).
The
OW
TG sp
ecify
a 3
0-da
y w
eigh
ted
aver
age
of 3
0 m
g/L.
1
Coo
ling
wat
er
2,40
0 m
3 /hC
hlor
inat
ed w
ater
; te
mpe
ratu
re 2
0C
abo
ve
ambi
ent (
befo
re m
ixin
g in
ca
isso
n)
Mix
ed w
ith p
rodu
ced
wat
er b
efor
e di
scha
rge.
Tot
al re
sidu
al fr
ee
chlo
rine
in c
oolin
g w
ater
will
not
nor
mal
ly e
xcee
d 0.
25 p
pm.
Liq
uid
Eff
luen
t fo
r O
cean
D
isch
arge
Dec
k dr
aina
ge
Pum
p ca
paci
ty is
150
m3 /h
Rai
n an
d de
luge
wat
er, m
ay
cont
ain
oily
wat
er w
ith
som
e pa
rticu
late
s
Roo
f dra
inag
e flo
ws d
irect
ly o
verb
oard
as p
erm
itted
by
CN
SOPB
gu
idel
ines
.1 D
eck
drai
nage
will
be
treat
ed to
redu
ce h
ydro
carb
ons t
o <1
5 m
g/L.
1

Dee
p Pa
nuke
Vol
ume
4 (E
nvir
onm
enta
l Ass
essm
ent R
epor
t) N
ovem
ber 2
006
2-49
Tab
le 2
.8 R
outin
e Pr
ojec
t Em
issi
ons/
Eff
luen
ts
Typ
e E
mis
sion
/Eff
luen
t E
stim
ated
Qua
ntity
C
hara
cter
istic
s D
ispo
sal S
tand
ard
Bilg
e/ba
llast
wat
er
As r
equi
red
Wat
er w
ith h
ydro
carb
ons
Bilg
e/ba
llast
wat
er w
ill b
e tre
ated
as n
eces
sary
to re
duce
oil
conc
entra
tion
to 1
5 m
g/L
or le
ss p
rior t
o oc
ean
disc
harg
e.1
Wel
l tre
atm
ent f
luid
s/
Wel
l com
plet
ion
and
wor
kove
r flu
id
As r
equi
red
Wel
l com
plet
ion
fluid
s ha
ve si
mila
r pro
perti
es to
W
BM
Flui
ds w
ill b
e tre
ated
to a
n oi
l con
cent
ratio
n of
40
mg/
L or
less
prio
r to
disc
harg
e.1
Wat
er fo
r fire
con
trol
syst
ems
As r
equi
red
Exce
ss d
eck
drai
nage
wat
er
Dis
char
ged
over
boar
d w
ithou
t tre
atm
ent.1
Des
alin
atio
n br
ine
13 m
3 /hr
Estim
ated
salin
ity o
f 35-
40
ppt
Dis
char
ged
over
boar
d w
ithou
t tre
atm
ent.1
Was
te p
rodu
ctio
n flu
ids
and
by-p
rodu
cts
As r
equi
red
Was
te re
sidu
es in
the
prod
uctio
n sy
stem
in
clud
ing
oily
slud
ge, s
cale
, fil
ters
and
filte
r res
idue
s an
d ch
emic
al w
aste
s
Haz
ardo
us w
aste
s w
ill b
e ac
cum
ulat
ed i
n su
itabl
e co
ntai
ners
and
pl
aced
in
appr
opria
te s
hipp
ing
cont
aine
rs f
or r
etur
n to
sho
re f
or
disp
osal
and
col
lect
ed b
y lic
ence
d w
aste
hau
lers
. Pro
vinc
ial r
egul
atio
ns
for
the
stor
age,
dis
posa
l, tra
nspo
rt an
d m
anag
emen
t of
use
d oi
l pr
oduc
ts w
ill b
e fo
llow
ed a
s w
ell a
s th
e Tr
ansp
orta
tion
of D
ange
rous
G
oods
Act
as a
pplic
able
. H
azar
dous
L
iqui
ds fo
r O
nsho
re
Dis
posa
l
Mis
cella
neou
s sol
id
was
te (t
rans
porte
d to
sh
ore)
As r
equi
red
Dom
estic
solid
was
te a
nd
non-
haza
rdou
s sol
ids s
uch
as p
acki
ng m
ater
ial
Was
tes w
ill b
e so
rted
and
disp
osed
acc
ordi
ng to
loca
l reg
ulat
ory
regi
me
of th
e sh
oreb
ase,
incl
udin
g th
e N
ova
Scot
ia S
olid
Was
te-
Reso
urce
Man
agem
ent R
egul
atio
ns a
nd o
ther
mun
icip
al re
quire
men
ts.
Solid
Was
te
Mis
cella
neou
s sol
id
was
te (t
rans
porte
d to
sh
ore)
As r
equi
red
Dom
estic
solid
was
te a
nd
non-
haza
rdou
s sol
ids s
uch
as p
acki
ng m
ater
ial
Was
tes w
ill b
e so
rted
and
disp
osed
acc
ordi
ng to
loca
l reg
ulat
ory
regi
me
of th
e sh
oreb
ase,
incl
udin
g th
e N
ova
Scot
ia S
olid
Was
te-
Reso
urce
Man
agem
ent R
egul
atio
ns a
nd o
ther
mun
icip
al re
quire
men
ts.

Deep Panuke Volume 4 (Environmental Assessment Report) November 2006 2-50
2.7.1.1 Air Pollutants
The following describes criteria air pollutants (i.e., regulated by federal guidelines or provincial limits) emitted by the Project, although some may be emitted in minor amounts and may not necessarily result in the effects described below unless otherwise indicated in Section 8.1.
Nitrogen Oxides
Nitrogen oxides are produced in most combustion processes, and almost entirely made up of nitric oxide (NO) and nitrogen dioxide (NO2). Together, they are often referred to as NOx. NO2 is an orange to reddish gas that is corrosive and irritating. Most NO2 in the atmosphere is formed by the oxidation of NO, which is emitted directly by combustion processes, particularly those at high temperature and pressure, such as diesel engines. NO2 is the regulated form of NOx. NO is a colourless gas with no direct effects on health or vegetation at ambient levels. The levels of NO and NO2, and the ratio of the two gases, together with the presence of hydrocarbons and sunlight are the most important factors in the formation of ground-level ozone and other oxidants. Further oxidation, and combination with water in the atmosphere, contributes to the production of “acid rain”.
Generally NO2 constitutes 5 to 10% of the initial total emissions of NOx, and the conversion of the majority of NO occurs after emission to the atmosphere. Emissions information on boilers usually refers only to total NOx, partly because the conversion rate of NO to NO2 is somewhat site specific. For instance, the amount of NO2 generated by a stationary combustion turbine can be calculated using the National Emission Guidelines for Stationary Combustion Turbines set by the Canadian Council of Ministers of the Environment (CCME). This is accomplished by taking into account the turbine’s power output and heat output, which could potentially be recovered. Other methods for the assessment of NOx
effects include the ozone limiting method.
For this Project, nitrogen oxides are produced primarily in the generation of power for electrical loads and compressors. It is estimated that the compression load of 14 to 21 MW and expected electrical load of 7 MW will be met through the use of combustion turbines.
Sulphur Dioxide
Sulphur dioxide (SO2) is a colourless gas with a distinctive pungent sulphur odour. It is produced in combustion processes by the oxidation of sulphur in the fuel. SO2 can, at high enough concentrations, cause damage to vegetation and adverse health effects impacting the respiratory system.
This Project incorporates a sulphur management system that removes H2S from the gas stream and injects it into a disposal well. In the event of maintenance requiring downtime, or a malfunction of the

Deep Panuke Volume 4 (Environmental Assessment Report) November 2006 2-51
acid gas injection system, the gas stream will be redirected to the flare which will result in limited emissions of SO2.
Total Suspended Particulate Matter
Total suspended particulate matter (TSP) is a measure of the particles in the atmosphere that are too small to settle out quickly, but remain suspended for significant periods of time. Generally, this means particles with an aerodynamic diameter of less than 44 µm. TSP is produced by mechanical processes, such as the abrasion of vehicle tires on unpaved roads, and by combustion processes. Most particulate matter formed by combustion is either mineral ash from the fuel, or hydrocarbons formed by incomplete combustion.
This Project will result in construction-related emissions of particulate matter for necessary onshore components of the Project; these emissions will be similar in type and scale to those created by other medium to large sized construction projects. Offshore, the vessel exhausts will contain some particulate matter; these emissions are no more critical than those of similar vessels in everyday operation.
Fine and Respirable Particulate Matter
Although TSP is an excellent measure of the loading of particulate matter in the air, it does not necessarily reflect the health risks of the particulate matter. Large aerodynamic particles are trapped by the upper airways, and do not enter the lungs. Smaller diameter particles make their way to the lungs, and may become lodged there. Over the past few years, greater concern with regard to these fine particles has led to research resulting in new sampling methods and criteria. In June, 2000, the CCME adopted in principle Canada Wide Standards for particulate matter. Although these standards are not yet applicable, they will be relevant in the future. These standards provide for a proposed PM2.5 standard of 30 µg/m3 for particulate <2.5 µm and a proposed PM10 standard of 65 µg/m3 for particulate <10 µm, with the current objective of meeting the standard by 2010. It should be noted that TSP includes the PM2.5 and PM10 fractions. If the TSP reading is less than 30 µg/m3, the PM2.5 standard is attained, likely by a considerable margin. The concentration of PM2.5 is typically of greater concern since it represents the finest particles, which are more critical to health effects. The fine particulate matter is discussed for completeness; however, the total emissions of particulate matter from the Project activities are low.
Hydrogen Sulphide
H2S is a colourless, poisonous gas with a characteristic odour of rotten eggs at low concentrations. Humans are particularly sensitive to the odour of H2S at low concentrations; however, the gas causes rapid fatiguing of the olfactory system at higher concentrations. Environmental exposures are generally to the noxious odours. At higher exposures, such as in industrial operations, low concentrations can

Deep Panuke Volume 4 (Environmental Assessment Report) November 2006 2-52
result in eye irritation, respiratory system irritation, and higher concentrations can result in asphyxia. H2S is a by-product of decomposition of sulphur-containing organic material, and is associated with certain natural gas deposits, including this Project. H2S has been safely managed in the natural gas resource sector. The relatively low levels of acid gas and the acid gas management system for this Project will result in the removal and elimination of H2S from the gas stream. In the unlikely event of a failure of the injection system and the extinguishing of the flare, there may be a brief period of controlled H2S emissions to atmosphere from this Project. In the event of the even much less likely scenario of a blowout of the injection well, there will be a release of H2S to the environment. In the event of a blowout from a production well, H2S will be released as a component of the raw gas.
2.7.1.2 Air Emissions Modelling
In order to predict the dispersion and subsequent effect of air emissions from the Project, a simulation was conducted using a mathematical computer model of atmospheric transport. This method provides quantitative results and enables direct comparison of the simulated project effects with regulatory criteria. For certain sources where the quantitative releases are too difficult to predict, an assessment has been made based on the relative likelihood of releases, and the potential consequences. Modelling results and environmental effects associated with significant air emissions are presented in Appendix F and Section 8.1.
2.7.2 Noise Emissions
Noise emissions will mainly be generated offshore during pile driving, blasting, and drilling operations. Other noise generating activities will include ship and air traffic of materials and personnel to offshore facilities. Onshore noise will be limited primarily to construction of the pipeline and other onshore facilities. The discussion presented in the approved 2002 CSR regarding noise emissions (offshore and onshore) remains valid (refer to Section 2.7.2 of the approved 2002 CSR). An updated discussion on noise associated with pile driving is presented in Section 2.3.6.
2.7.3 Electromagnetic Emissions
The description of electromagnetic emissions presented in the approved 2002 CSR remains valid. Refer to Section 2.7.3 of the approved 2002 CSR.

Deep Panuke Volume 4 (Environmental Assessment Report) November 2006 2-53
2.7.4 Drill Waste Discharges
2.7.4.1 Use of Drill Muds
All drilling fluids (mud) go through a cyclic process during the drilling of a well. Prior to drilling a specific hole section, the required type of mud must be prepared. It is either prepared onshore and brought to the rig, or the required base products are brought to the rig and it is prepared onboard. Once the mud is ready for use, the drilling may begin for that hole section. The following describes the simple cycle that all drilling fluids follow:
1. The mud is pumped down the drillpipe to the bit on the bottom. 2. The mud comes out the bit and picks up the cuttings that the bit has produced and carries these
cuttings back to the rig on the outside of the drillpipe. 3. Once back on the drilling rig, the cuttings (solid materials) are separated from the mud using solids
control equipment. Linear vibrating shakers plus periodic use of centrifuges are the main components of the solids control equipment used to separate solids (cuttings from the wellbore) from the drilling mud.
4. The clean mud returns to the original tanks for any minor modifications (additional products) before starting the cycle again.
5. The cycle continues until the hole section reaches final depth.
Once the final depth of the hole section is achieved, the mud is cleaned for re-use on the next hole section or it is removed from the rig to allow for the next drilling fluid for the subsequent operation. Bulk mud releases will be minimized by re-using mud on the next hole section or well if possible. WBM will be released overboard during bulk releases.
Typically, a conventional production well would be installed as follows:
1. Drill and case the conductor hole, then prepare WBM and change drilling tools.2. Drill and case the surface hole, then change the mud system and drilling tools. 3. Drill and case the intermediate hole section, then change the drilling tools. 4. Drill and case the main hole section re-using the mud system from the intermediate hole section. 5. Circulate the well to clean out drilling solids, displace drilling fluid from the wellbore to completion
fluid and install the completion tubing / equipment. 6. Provide underbalance and allow the well to flow to surface removing all completion fluids until
burnable gas at surface prior to handover to production. 7. Secure the well and move the rig to the next well location and repeat the process.

Deep Panuke Volume 4 (Environmental Assessment Report) November 2006 2-54
Typically, a re-entry and completion of existing wells will be conducted as follows:
1. Remove temporary abandonment caps and convert mudline suspension system to subsea wellhead. 2. Install high pressure riser to rig tension deck and BOP stack.3. Drill out 340mm casing cement plugs and pull bridge plugs using suspension brine. 4. Confirm well is secure and remove high pressure riser and BOP stack and install subsea production
tree.5. Drill out 245mm casing cement plugs and pull bridge plugs using suspension brine, change tools. 6. Drill out 178mm casing cement plugs and pull bridge plugs using suspension brine. 7. Filter and clean suspension brine to completion fluid specifications. 8. Install the completion tubing/equipment. 9. Provide underbalance and allow the well to flow to surface removing all completion fluids until
burnable gas at surface prior to handover to production. 10. Secure the well and move the rig to the next well location and repeat the process.
Spent WBM and associated drill cuttings will be discharged in accordance with the OWTG (NEB et al.2002).
The conservative case of five new wells using WBM for all hole sections has been modelled with results presented in Appendix D.
2.7.4.2 Drill Waste Discharge Behaviour and Modelling
When cuttings and mud are discharged, the fine materials in the discharge form a turbidity plume near the sea surface, but the bulk of the material (cuttings) drops to the seabed with the fine materials being stripped from the plume as it descends. Typically, a cuttings pile forms on the seabed near the discharge point. However, in high energy environments, like the Deep Panuke site, cuttings and fine particles and associated metals, such as barium, are more likely to disperse rather than settle (refer to Appendix D).
Barite is typically used to increase the density of the drilling fluid. It is also used to build small volumes of high density slugs used to trip drill pipe out of the hole dry. The type of drilling fluids used for Deep Panuke wells will be salt-based and the density will be adjusted by increasing the concentration of salt in the drilling fluid. Therefore, the use of barite will be minimized and generally only used for the preparation of high density slugs to pull the drill pipe out of the hole dry.
Oceanographic plume modelling for discharge of mud and cuttings at sea was conducted for surface discharge of WBM. See Section 2.3.4 for further details. The modelling of drill mud and cuttings discharges is based on the following assumed operational processes and volumes shown in Table 2.9. Modelling results of ocean disposal of drill waste discharges are presented in Appendix D.

Deep Panuke Volume 4 (Environmental Assessment Report) November 2006 2-55
Table 2.9 Deep Panuke Potential Drilling Waste Discharge Summary
Each New Production Well
One New Injection Well
Each Re-entry Production Well
Total Discharges
Seabed release of WBM associated cuttings (m3)
131 131 0 656
Surface release of WBM associated cuttings (m3)
427 356 0 2062
Seabed release of WBM on cuttings (m3)
180 180 0 900
Surface release of WBM on cuttings (m3)
64 53 0 309
Surface release of WBM (bulk mud release) (m3)
700 600 0 3400
Surface release of completion fluid (m3)
1000 300 300 5500
Notes:All volumes are approximations that represent each well’s discharges. Using a conservative approach to dispersion modelling, it is assumed four existing wells will be re-completed using completion fluid (“re-entry” production wells), and four new production wells and one new injection well will be drilled using WBM with overboard discharge. The completion fluid is a brine (NaCl) with various additives for oxygen scavengers, H2S scavengers and corrosion protection in some cases. Prior to use, all chemicals will be screened using the CNSOPB Offshore Chemical Selection Guidelines
2.7.5 Effluent Discharges
2.7.5.1 Produced Water
Produced water management is described in Section 2.4.1.8. Produced water will be treated to a target dispersed oil concentration of 25 mg/L (30-day weighted average). The OWTG specify a 30-day weighted average of 30 mg/L. Refer to Appendix D for results of produced water dispersion modelling.
2.7.5.2 Cooling Water
The cooling system will use seawater to indirectly cool a circulating medium (40% ethylene glycol, 60% water (volume)) solution. The cooling water flow rate will be constant at 2,400 m3/hr and will have a temperature approximately 15°C above background water temperature. It will be mixed with produced water before discharge.
The seawater is treated with chlorine generated by a sodium hypochlorite generator to prevent/reduce the growth of marine biological growth. The design chlorine concentration at the seawater lift pump inlet is 2 ppm (1 ppm during normal operation with an increase during periods of high larval mussel concentration). The residual free chlorine concentration at the outlet will normally be below 0.25 ppm. The combined produced water and cooling water stream exit temperature will not exceed 25 oC above ambient.

Deep Panuke Volume 4 (Environmental Assessment Report) November 2006 2-56
2.7.5.3 Deck Drainage
During construction and installation, prior to operation of the drains system, deck drainage will be discharged overboard. Deck drainage water might contain traces of petroleum hydrocarbons, such as lube oils, helicopter fuel, and diesel fuel. Every effort will be made to prevent chemical contamination on decks, which could be entrained into deck drainage. Storage areas for totes containing chemicals and petroleum products will have secondary containment to prevent discharge onto deck surfaces.
During the operation phase, deck drainage will be collected and treated according to the OWTG (NEB etal 2002). Drainage from equipment areas on the topsides will be directed through a header system to a collection tank to an oil/water separator treatment unit on the MOPU. Petroleum hydrocarbons and sludge in the oil/water separator will be transferred into containers for shipment to shore for disposal. The water from the oil/water separator will be treated using cartridge-style water polishers and tested prior to discharge to ensure compliance with the discharge criteria of 15 mg/L or less. The deck drainage system does have overflows to permit water to be routed directly overboard in the event of a deluge event or rain water in excess of the design condition.
Any spills of petroleum products (or other chemicals) will be cleaned up immediately and reported. Oil absorbent pads and “oil dry” compounds will be available, at all times, in spill kits located at strategic sites on the platforms, to remove petroleum products from deck surfaces. The used absorbent materials and any other oily wastes will be placed in sealed containers and returned to shore for treatment and disposal at an approved waste management facility.
EnCana will develop a Deep Panuke Emergency Management Plan (DPEMP) for the Project which will include a Spill Response Plan (refer to Appendix G) that will be submitted to the regulators for review and approval. It is the responsibility of all EnCana employees and contractors to report any accidents, incidents or spills to the Offshore Installation Manager for immediate action. The standby vessel in the field will also be tasked as part of their regular duties to observe and report any spills from the facilities.
2.7.5.4 Other Ocean Discharges
Other ocean discharges (e.g., bilge/ballast, sanitary/food waste/testing waters, etc.) are summarized in Table 2.6 for the construction and operations phases of the Project. Those wastes, which are identified in the OWTG (NEB et al. 2002) and other regulations, are included along with the compliance standard. Each waste stream will be treated or managed to make sure the discharges comply with the respective regulatory limits and EnCana’s environmental protection policies.

Deep Panuke Volume 4 (Environmental Assessment Report) November 2006 2-57
2.7.6 Naturally Occurring Radioactive Material (NORM)
The description of NORM and appropriate management procedures presented in the approved 2002 CSR remain valid. Refer to Section 2.7.6 of the approved 2002 CSR.
2.7.7 Non-Hazardous Solid Wastes
The discussion of non-hazardous solid wastes presented in the approved 2002 CSR remains valid. Refer to Section 2.7.7 of the approved 2002 CSR.
2.8 Hazardous Materials and Waste
The discussion of management of hazardous materials and waste presented in the approved 2002 CSR remains valid. This includes, but is not limited to, commitments by EnCana to adhere to all applicable federal and provincial codes and regulations for the handling and transport materials. Refer to Section 2.8 of the approved 2002 CSR.
2.9 Environmental and Safety Protection Systems
2.9.1 Equipment Inspection and Maintenance
All Project equipment will meet the requirements of industry standards, and be certified as being safe and fit for its intended use. Purchase orders for such equipment will be suitably monitored during the manufacturing and testing processes for strict compliance to these standards and to all applicable regulations as set out by the CNSOPB. Where required, the Certifying Authority (CA) may provide additional surveillance. Once installed, equipment will be operated and maintained in accordance with documented processes and procedures. EnCana will submit inspection and monitoring programs, a maintenance program and a weight control program to the CA for approval. These regular inspection and maintenance programs will ensure continued equipment reliability and integrity. Necessary critical spares will be maintained should equipment change-out be required. Subsea inspection programs allow for regular monitoring of critical subsea components such as pipelines.
As part of the maintenance of the Certificate of Fitness for the MOPU, the CA is required to conduct inspections and surveys during the operation phase of the Project (Annual Surveys). These surveys will verify that installations is being operated in accordance with the approved programs noted above and provide further assurance that safety and protection of the environment are being upheld.

Deep Panuke Volume 4 (Environmental Assessment Report) November 2006 2-58
2.9.2 Pipeline Leak Prevention
The pipeline design philosophy, in accordance with CNSOPB regulations, incorporates designs for: internal pressure containment; dropped objects protection; fatigue; spanning; and hook, pull or snag loads due to fishing activities. The pipeline will be designed to withstand impacts from conventional mobile fishing gear in accordance with the Det Norske Veritas (DNV) Guideline No. 13, Interference Between Trawl Gear and Pipelines, September, 1997. During the operational phase, inspections are carried out as part of the Annual Survey to ensure that the pipeline integrity is maintained.
Leak detection for the pipeline will be carried out by the use of mass balancing. This method uses process conditions at either end of the pipeline along with gas composition to calculate the mass entering the pipeline and exiting it. The M&NP custody transfer meter along with onshore instruments will be utilized to gather flow, temperature and pressure measurements. Similarly on the MOPU, the flow, temperature, and pressure will be used in conjunction with the gas composition to calculate the mass entering the pipeline. The onshore measurements along with the offshore gas composition will be used to calculate the mass exiting the pipeline. The mass entering and exiting the pipeline will be used to detect leaks. The leak detection system will be designed accordingly for the export option selected.
In the event that a leak is confirmed, the pipeline has a series of shutdown valves that will isolate the pipeline from the M&NP pipeline and the MOPU to prevent additional hydrocarbons from entering the system.
2.9.3 Blowout Prevention Safeguards
There are many safeguards in place to prevent blowouts or uncontrolled releases of hydrocarbons during the various stages of a wellbore’s life cycle. The equipment used to drill, complete and workover a wellbore is essentially the same regardless of whether it is an injection or production well. Also, there is a separate set of permanently installed equipment that is used during the production or injection phase of the life cycle.
The objective during the drilling of the well is to provide a wellbore through the selected reservoir interval in the safest and most efficient manner. Several strings of pipe (casing) are set at increasingly deeper depths to achieve this goal. The first section of pipe, the conductor, is set to approximately 75 m below the seafloor with no well control or blowout prevention equipment. For the next hole section (surface hole), a large diverter assembly is installed on top of the conductor pipe. This provides a means to divert any shallow gas that may be encountered over the side of the rig in a controlled manner until the mud weight can be increased to control the flow. The probability of encountering shallow gas during this hole section is unlikely since the rig is positioned to avoid any shallow gas anomalies based on a shallow seismic survey.

Deep Panuke Volume 4 (Environmental Assessment Report) November 2006 2-59
Once the surface section has been drilled and cased, blowout preventers are installed which can withstand/holdback the reservoir pressures expected during the drilling process should a well control incident occur. The primary method of well control is the hydrostatic pressure exerted by the column of mud in the wellbore. The density of the mud that is used to drill the hole section is tailored to ensure that the ingress of wellbore hydrocarbons is prohibited. If the density of this fluid is too low a “kick” occurs by which an amount of reservoir fluid enters the wellbore. As soon as this kick is detected, the well is shut in and monitored to determine the conditions surrounding the kick. The BOPs are used to shut in the well. Once the well is shut in, the mud is circulated to bring the reservoir fluids to surface. The hydrocarbons are vented or burnt at the flare in a controlled manner. The density of the mud is increased the appropriate amount and the drilling process may begin again.
These blowout prevention safeguards are well-known operational procedures for which standard industry practices are in place. EnCana’s Well Control Manual deals with these types of situations and is constantly updated based on the most recent technological innovations. All personnel are trained on a continuous basis and exercises and drills are routinely performed during operations on the drilling rig.
During the production or injection life of a well, there are several safety measures in place to insure no uncontrolled release of hydrocarbons occur. The primary prevention mechanism within an offshore wellbore is the surface-controlled subsurface safety valve (SC-SSSV). The fail-close valve has a control line to surface that is constantly pressured to keep the valve open. In the case of an accident, the ESD procedure would have the valve close as soon as the hydraulic pressure is removed from the line. All reservoir fluids are contained within the production or injection tree on top of the wellhead. This tree (series of fail-close surface valves) is connected to the tubing string within the wellbore that is used to transport the fluids to or from the reservoir. The SC-SSSV is an integral part of the tubing string usually located at a depth below the seafloor. At the bottom of the tubing string, a production packer is placed between the tubing and casing to prevent migration of reservoir fluids in the annulus (space between the tubing and casing). This equipment provides a fit for purpose design conduit for the fluids to be removed from or injected into the reservoir.
2.9.4 Flowline Protection
The flowlines design philosophy, in accordance with CNSOPB regulations, incorporates designs for internal pressure containment, dropped objects protection, fatigue and spanning. The flowlines will be buried to avoid impacts from conventional mobile fishing gear and their locations will be charted. During the operational phase, inspections will be carried out as part of the Annual Survey to ensure that the pipeline integrity is maintained. Environmental and safety protection systems, such as emergency shutdown (ESD) valves, will be provided on the flowlines.

Deep Panuke Volume 4 (Environmental Assessment Report)• November 2006 2-60
2.9.5 Subsea Protection Structures
The production and acid gas injection well trees and the hot tap (SOEP Subsea Option) will be protected by dedicated protection structures. These shall be separately deployed structures and designed to withstand impacts from conventional mobile fishing gear. They will also serve as dropped objects protection and shall be designed to allow adequate access to the wells for all planned diver and ROV intervention tasks. The wells and hot tap locations will be charted.
2.9.6 Project Safety Zones
Refer to Section 2.4.4 for information.
2.10 Project Alternatives
2.10.1 Alternatives to the Project
The Alternatives to the Project as presented in the approved 2002 CSR have not changed. Accordingly, alternatives to the Project are not addressed in this section as there is no need to re-assess.
2.10.2 Alternatives Means of Carrying Out the Project
Since the approval of the CSR in 2002, EnCana has investigated options and alternatives that are more economically feasible based on resource estimates which are lower than those predicted in 2002. The Project, as conceived at present, shares many similarities with the original Project concept; however, some aspects have changed.
This section describes the Project design basis as originally conceived in 2002 and discusses the alternatives that were studied leading to the final concept selection.
The 2002 Project basis was designed to produce a sour gas reservoir via an offshore processing concept and transport sales quality gas to market via a 610 mm [24 inch] 176 km pipeline with an onshore tie-in to the M&NP pipeline near Goldboro, NS. The producing reservoir was located in a relatively small areal plot enabling production to be sourced from a cluster of directionally-drilled wells from a central wellhead platform. Offshore processing was to be performed on a second bridge-linked production platform. The production platform contained the main process-related utility systems. The main elements that formed the process were as follows:
• H2S removal; • condensate recovery and processing as the primary source for fuel on the platform;• gas dehydration;

Deep Panuke Volume 4 (Environmental Assessment Report)• November 2006 2-61
• gas dewpointing;• produced water treatment and disposal; and• extraction and disposal of acid gas and surplus condensate.
The process plant also required inlet and export compression to maximize resource recovery and to transport sales gas through the offshore pipeline to market. The production platform was bridge-linked to a third platform which housed the central control room, non-hazardous utilities, and accommodations for offshore workers.
The 2002 Project basis was designed to process 400 MMscfd at peak capacity with design allowances to allow peak production year round. This overall concept required significant infrastructure with a total topsides weight of approximately 13,000 tonnes to accommodate all the required facilities offshore. The topsides were to be built as three separate integrated decks and installed offshore by means of a semi-submersible crane vessel.
Key similarities in the design basis between the current Project basis and the Project basis for the approved 2002 CSR are as follows:
• fluid composition and properties;• offshore gas processing;• acid gas injection into a subsea reservoir;• produced water treatment and ocean disposal; and• condensate handling, (for the M&NP Option only).
Compared to the Project basis for the approved 2002 CSR, the current Project design basis has:
• a larger reservoir area requiring subsea completions with tie-backs;• reduced resource estimate;• reduced peak production capacity;• increased volume of produced water; and• a MOPU replacing the three fixed platforms.
2.10.2.1 Alternative Assessment Methodology
The following methodology was used to assess Project alternatives:
• review the alternatives and supporting work for the 2002 DPA and determine which fundamental principles and decisions are still valid for the revised resource forecast and current concepts;

Deep Panuke Volume 4 (Environmental Assessment Report) November 2006 2-62
consider concept alternatives for reduced peak production capacity(5.7 x 10⁶ m3/d and 8.5 x 10⁶ m3/d [200 MMscfd and 300 MMscfd]); consider a subsea tie-in to the SOEP pipeline as a product export option;consider platform and processing facilities which could be leased to reduce capital expenditures; andreassess safety/occupational health and environmental criteria in light of revised concepts.
The decision to proceed with the development basis described herein was based on evaluation of the following criteria:
technical suitability (including operational factors, flexibility and ease of decommissioning); capital and operating costs, taking into consideration leased arrangements of some infrastructure; commercial risk; concept deliverability; safety; and environmental considerations.
If an alternative was deemed to be technically and economically unfeasible, further assessment of that alternative using other criteria was not considered.
As a precursor to the formal evaluation of various development alternatives against selected evaluation criteria, it is also worth noting that development alternatives which will not allow EnCana to take advantage of the infrastructure installed by M&NP were not evaluated due to economic reasons. Examples of development options which fell outside the Project’s central development concept (and hence were determined not to be economically feasible) are alternatives involving landfall sites other than Goldboro, and the use of technologies requiring substantial new infrastructure such as liquefied natural gas (LNG) or compressed natural gas (CNG) technologies. The following development alternatives were evaluated:
substructure type; topsides type; total number of platforms; re-use of existing platform processing location; acid gas handling; produced water disposal; condensate handling; production capacity alternatives; field centre structure type;

Deep Panuke Volume 4 (Environmental Assessment Report) November 2006 2-63
export pipeline alternatives; subsea tie-back alternatives; and acid gas injection location.
For the 2002 Project basis, consideration was given to using, in addition to WBM, oil-based muds, due to the drilling conditions associated with directionally drilled wells. However, based on the experience gained while drilling the Deep Panuke delineation wells, it was determined that only WBM will be used for any new development drilling activities. Therefore, the disposal options for oil-based mud drilling cuttings described in the approved 2002 CSR are no longer applicable to the Deep Panuke Project.
2.10.2.2 Substructure Type
The environmental conditions at the field centre location are considered harsh, by offshore standards, but are well within the criteria which fit many world-wide accepted design solutions for substructures. Several types of substructures were investigated and were classed into three groups; 1) floating structures; 2) permanent bottom founded structures; and 3) mobile structures. Each option was evaluated against the evaluation criteria summarized in Table 2.10 and these are discussed in the following sections.
Floating Structures
The floating type structure evaluated was the semi-submersible type which requires a fixed mooring system with fluids being conveyed on and off the structure through a series of subsea flexible risers. This type of structure is not well suited for the relatively shallow water depth at the field centre location and has not been proven for use in harsh, shallow water applications. It would be technically challenging to provide a mooring and riser design that would meet the project environmental conditions. Also, there have been some unfavourable experiences in other projects using a semi-submersible as a gas production platform. Therefore, this concept was eliminated for technical reasons.
Bottom-Founded Structures
Two types of permanent bottom-founded structures were investigated: gravity-based and jacket structures. The gravity-based concept was deemed to be technically acceptable; however, it was rejected due to higher commercial risk imposed by limited suppliers in the world market.

Dee
p Pa
nuke
Vol
ume
4 (E
nvir
onm
enta
l Ass
essm
ent R
epor
t) N
ovem
ber 2
006
2-6
4
Tab
le 2
.10
Cen
tre
Subs
truc
ture
Typ
e A
ltern
ativ
es
Alte
rnat
ive
Tec
hnic
al S
uita
bilit
y C
ost/L
ease
C
omm
erci
al R
isk
Tec
hnic
ally
and
E
cono
mic
ally
Fea
sibl
e C
once
ptD
eliv
erab
ility
Safe
ty
Env
iron
men
tal I
mpa
ct
New
bui
ld
jack
up
Exis
ting
prov
en d
esig
ns a
re a
vaila
ble
for
the
Dee
p P
anuk
e si
te c
ondi
tions
C
apita
l cos
t slig
htly
hi
gher
than
jack
ets
Leas
e av
aila
ble
Low
Y
es
Bes
t N
o sp
ecifi
c co
ncer
nsLo
w/n
eglig
ible
sim
ilar t
o ot
her a
ltern
ativ
es
Ref
it ex
istin
g ja
ckup
Exis
ting
hars
h en
viro
nmen
t dril
l rig
s exi
st,
alth
ough
non
e pr
esen
tly id
entif
ied
as
avai
labl
e.
Cap
ital c
ost h
ighe
r th
an n
ew b
uild
ja
ckup
Leas
e no
t ava
ilabl
e
Hig
h co
st &
sche
dule
ove
rrun
s to
be e
xpec
ted
Yes
Po
or
Exis
ting
rig m
ay
requ
ire si
gnifi
cant
up
grad
es to
mee
t re
gula
tions
Low
/neg
ligib
le si
mila
r to
othe
r alte
rnat
ives
Jack
deck
R
elat
ivel
y ne
w c
once
pt, n
o pr
oven
ex
perie
nce
in th
ese
envi
ronm
enta
l co
nditi
ons
Tech
nica
lly a
ccep
tabl
e , w
ith ri
sk
Cap
ital c
ost h
ighe
r th
an n
ew b
uild
jack
up
Med
ium
(ne
w d
esig
n co
uld
lead
to
ove
rrun
s, po
tent
ially
sin
gle
sour
ce su
pplie
r)
Yes
R
isk
invo
lved
N
o sp
ecifi
c co
ncer
nsLo
w/n
eglig
ible
sim
ilar t
o ot
her a
ltern
ativ
es
Jack
et
Prov
en fo
r Dee
p Pa
nuke
site
con
ditio
ns
Leas
e op
tion
not
avai
labl
eLo
w
Tech
nica
lly fe
asib
le; n
ot
econ
omic
ally
feas
ible
Stee
l Sem
i-Su
bmer
sibl
e H
ull
Tech
nica
l con
cern
s rel
ated
to ri
ser d
esig
n an
d m
oorin
g, a
djac
ent t
o ot
her p
latfo
rms
and
riser
des
ign
Lack
of e
xper
ienc
e in
shal
low
/har
sh
cond
ition
s
Onl
y on
e se
mi i
n us
e fo
r gas
pro
duct
ion
(dee
per w
ater
)
Slig
htly
hig
her t
han
jack
et o
ptio
n G
reat
er t
han
jack
et
No
Con
cret
e G
BS
Gra
vity
bas
ed sy
stem
(GB
S) w
idel
y us
ed –
si
x ex
ampl
es in
wat
er th
is sh
allo
w
Insh
ore
tops
ide
anal
ysis
avo
ids l
arge
cra
ne
requ
irem
ent
Mos
t exp
ensi
ve
Sing
le so
urce
of s
uppl
y co
uld
lead
to h
igh
cost
s N
o

Deep Panuke Volume 4 (Environmental Assessment Report) November 2006 2-65
Jacket-type structures piled into the sea floor are the most common solution world-wide for the environmental conditions experienced at the Project site. This concept is currently in use in Nova Scotia by SOEP. The concept has the advantage of offering the lowest cost, technically acceptable solution with acceptable commercial risk. However, the disadvantage is that fixed structures have little to no residual value at the end of a project as they are unlikely to be reused on another project. Since this option does not fit with EnCana’s financing objectives for the projected life of the Deep Panuke Project, it was rejected based on commercial considerations.
Mobile Structures
Two types of mobile structures were investigated; a jack-deck structure and a jack-up type structure. Each of these configurations can be used to construct a MOPU. The MOPU concept provides a facility that is designed to self-install, produce oil or gas at a given location and then demobilize for reuse at another location. This concept is in use world-wide for fields that have marginal reserves or are expected to have a short production life. Also, contractors may offer these types of structures on a lease basis; therefore the capital cost can be amortized over more than one project.
Both the jack-deck and the jack-up concept are quite similar, each employing a three-legged structure supporting a production topsides. The MOPU is brought to the field centre where it self elevates by jacking up on location. Risers for production fluids and export pipeline are connected to the structure for conveying produced fluids on and off the structure. At the end of the field life, the risers are disconnected from the flowlines and pipeline, legs are retracted and the platform jacked down for removal from the field. The structure can potentially be relocated and reused at another field.
The main difference between the jack-deck and the jack-up structure is in the design of the deck. The jack-deck is a custom engineered lattice-type structure designed to house the specific production equipment needed for the specific application. Because it is a lattice-type structure, it cannot float and therefore is brought to and removed from location on a barge. The jack-up type structure incorporates a floating hull so it does not require a barge for transportation. The jack-up carries a purpose-built topsides to provide the necessary production equipment. The jack-up hull design concept is used extensively for mobile offshore drilling rigs.
The jack-deck concept was investigated and deemed to be technically feasible. However, it had some distinct disadvantages when compared to the jack-up concept. First, this concept requires a custom design where the topsides are fully integrated into the supporting leg structure. Further, the legs and foundations are custom engineered for the specific application. Thus, at the end of the Project life, the chance of reuse for this type of structure at another location is greatly reduced, thus affecting the residual value of the MOPU. The majority of the cost must be amortized over one project. Also, this structure type must be transported on an installation barge. The on-site installation using a barge scheme

Deep Panuke Volume 4 (Environmental Assessment Report) November 2006 2-66
is much more weather-dependent than using a floating hull type installation and requires a calmer sea state. This could impact the project by adding cost and time for schedule impacts due to unfavorable weather. The cost of the jack-deck is also more expensive than other solutions and leasing options were not available. As a result of the economic disadvantages compared to the jack-up solution, this option was rejected.
Two approaches for executing the jack-up concept were investigated: 1) build a new jack up-hull to a ‘harsh environment’ drill rig specification to accommodate a new purpose-built topsides or 2) refit/modify an existing harsh environment MODU to accommodate a new purpose built topsides. The jack-up structure was selected as the best option for the Project, the final concept of a new build or re-fitted jack-up structure will be confirmed during the MOPU bid competition.
2.10.2.3 Topsides Type
The type of topsides for the revised Deep Panuke Project has not yet been confirmed. It will be largely dependent on the hull design of the jack-up structure. This design will be conducted by the MOPU contractor, selected through a competitive bid process, who will engineer all elements of the MOPU, including the topsides.
2.10.2.4 Total Number of Platforms
Offshore installations are generally designed to be built as the largest components possible to maximize construction, hookup and commissioning activities onshore, which greatly reduces cost. Multiple structures are used when the size of the structure exceeds lifting capabilities for heavy lift vessels or there are other specific requirements that dictate the use of multiple platforms. As per the Project design basis for the approved 2002 CSR, the preferred development alternative for number of platforms was three separate platforms for wellheads, processing, and living quarters/utilities based on concept deliverability criteria, reduced drilling and installation flexibility, as well as safety.
For the revised Project, the size of the topsides required for the revised 8.5 x 10⁶ m3/d [300 MMscfd] production capacity is well within the weight and size limitations for placement on one jack-up type structure. However, EnCana had specific concerns regarding personnel safety offshore because of the presence of H2S in the fluids stream. A twin-platform arrangement employing a production platform and separate bridge-linked accommodations and control room platform was investigated, but was found to increase capital cost significantly.

Deep Panuke Volume 4 (Environmental Assessment Report) November 2006 2-67
A single platform solution was investigated on a single jack-up type structure. Target levels of safety were identified that are consistent for offshore installations within the industry. All types of hazards for the installation were identified, including fire, explosion, ship collision, helicopter crashes, and sour gas leaks. The work concluded that the Project facilities could be safely placed on one platform offshore, provided additional special measures are put in place to protect workers against the effects of a potential sour gas leak. The special measures include a combination of infrastructure, such as portable breathing air apparatus, and work procedures for personnel offshore. Thus, the Project has selected a single-platform solution to support the topsides facilities.
2.10.2.5 Re-Use of Existing Platform
In the approved 2002 CSR, re-use of the existing Panuke platform, which was installed as part of the Cohasset Project was examined and rejected as a Project option. In any event, the Panuke jacket was removed during the decommissioning of the Cohasset Project in 2005, and therefore, re-use of the Panuke platform is no longer a valid alternative that can be assessed.
2.10.2.6 Processing Location
Onshore versus offshore processing was reviewed to determine which alternative provided the best option for the evaluation criteria noted above. Onshore versus offshore processing was assessed in 2002 with the following cases considered:
full offshore processing; onshore processing with minimal offshore processing to allow transportation only; and split onshore/offshore processing (intermediate case).
Between 2002 and 2006, the following additional alternative was considered:
full onshore processing via a long subsea tie-back.
The alternatives are summarized in Table 2.11 and are discussed below.
Full Offshore Processing
Full offshore processing involves gas sweetening, acid gas injection, TEG dehydration, gas dewpointing, gas compression, produced water treatment and disposal, and condensate treatment/usage for platform fuel offshore. Market-ready natural gas is shipped to shore in a subsea pipeline.
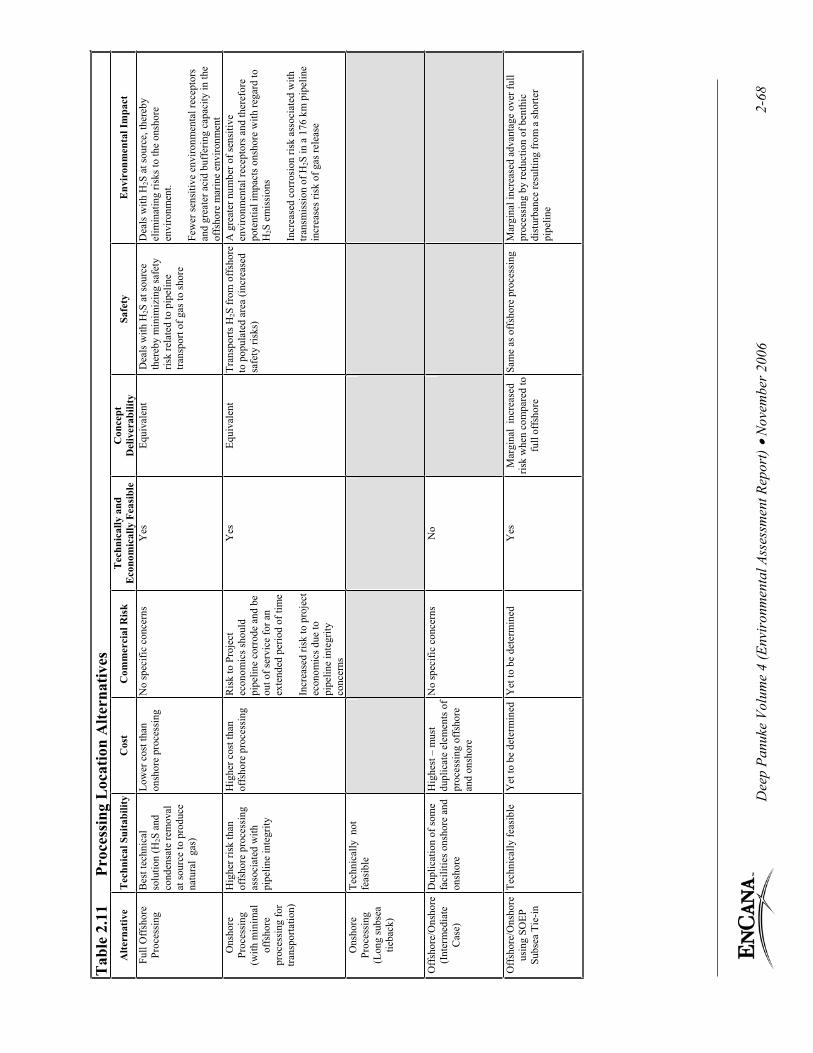
Dee
p Pa
nuke
Vol
ume
4 (E
nvir
onm
enta
l Ass
essm
ent R
epor
t) N
ovem
ber 2
006
2-68
Tab
le 2
.11
Pro
cess
ing
Loc
atio
n A
ltern
ativ
esA
ltern
ativ
e T
echn
ical
Sui
tabi
lity
Cos
t C
omm
erci
al R
isk
Tec
hnic
ally
and
E
cono
mic
ally
Fea
sibl
e C
once
ptD
eliv
erab
ility
Safe
ty
Env
iron
men
tal I
mpa
ct
Full
Off
shor
e Pr
oces
sing
B
est t
echn
ical
so
lutio
n (H
2S a
nd
cond
ensa
te re
mov
al
at so
urce
to p
rodu
ce
natu
ral
gas)
Low
er c
ost t
han
onsh
ore
proc
essi
ng
No
spec
ific
conc
erns
Y
es
Equi
vale
nt
Dea
ls w
ith H
2S a
t sou
rce
ther
eby
min
imiz
ing
safe
ty
risk
rela
ted
to p
ipel
ine
trans
port
of g
as to
shor
e
Dea
ls w
ith H
2S a
t sou
rce,
ther
eby
elim
inat
ing
risks
to th
e on
shor
e en
viro
nmen
t.
Few
er se
nsiti
ve e
nviro
nmen
tal r
ecep
tors
an
d gr
eate
r aci
d bu
ffer
ing
capa
city
in th
e of
fsho
re m
arin
e en
viro
nmen
t O
nsho
re
Proc
essi
ng
(with
min
imal
of
fsho
re
proc
essi
ng fo
r tra
nspo
rtatio
n)
Hig
her r
isk
than
of
fsho
re p
roce
ssin
g as
soci
ated
with
pi
pelin
e in
tegr
ity
Hig
her c
ost t
han
offs
hore
pro
cess
ing
Ris
k to
Pro
ject
ec
onom
ics s
houl
d pi
pelin
e co
rrod
e an
d be
ou
t of s
ervi
ce fo
r an
exte
nded
per
iod
of ti
me
Incr
ease
d ris
k to
pro
ject
ec
onom
ics d
ue to
pi
pelin
e in
tegr
ity
conc
erns
Yes
Equi
vale
nt
Tran
spor
ts H
2S fr
om o
ffsh
ore
to p
opul
ated
are
a (in
crea
sed
safe
ty ri
sks)
A g
reat
er n
umbe
r of s
ensi
tive
envi
ronm
enta
l rec
epto
rs a
nd th
eref
ore
pote
ntia
l im
pact
s ons
hore
with
rega
rd to
H
2S e
mis
sion
s
Incr
ease
d co
rros
ion
risk
asso
ciat
ed w
ith
trans
mis
sion
of H
2S in
a 1
76 k
m p
ipel
ine
incr
ease
s ris
k of
gas
rele
ase
Ons
hore
Pr
oces
sing
(L
ong
subs
ea
tieba
ck)
Tech
nica
lly n
ot
feas
ible
Off
shor
e/O
nsho
re
(Int
erm
edia
te
Cas
e)
Dup
licat
ion
of so
me
faci
litie
s ons
hore
and
on
shor
e
Hig
hest
– m
ust
dupl
icat
e el
emen
ts o
f pr
oces
sing
off
shor
e an
d on
shor
e
No
spec
ific
conc
erns
N
o
Off
shor
e/O
nsho
re
usin
g SO
EP
Subs
ea T
ie-in
Tech
nica
lly fe
asib
le
Yet
to b
e de
term
ined
Yet
to b
e de
term
ined
Y
es
Mar
gina
l in
crea
sed
risk
whe
n co
mpa
red
to
full
offs
hore
Sam
e as
off
shor
e pr
oces
sing
M
argi
nal i
ncre
ased
adv
anta
ge o
ver f
ull
proc
essi
ng b
y re
duct
ion
of b
enth
ic
dist
urba
nce
resu
lting
from
a sh
orte
r pi
pelin
e

Deep Panuke Volume 4 (Environmental Assessment Report) November 2006 2-69
Onshore Processing with Minimal Offshore Facilities
Onshore processing with minimal offshore processing was based on minimally treating the gas such that the gas and the condensate could be transported, in a common pipeline, for processing onshore. Onshore processing involves some processing offshore including dehydrating the gas and separating the water from the condensate so that the pipeline may be operated free of water. The removal of water is necessary for corrosion control and hydrate prevention. The offshore facilities for the onshore processing alternative include separation, TEG dehydration, condensate treatment, produced water handling and a multiphase export pipeline for the combined gas and condensate streams. The associated onshore facilities include a slugcatcher, separation, gas sweetening, sulphur recovery, TEG dehydration, gas compression, gas dewpointing, condensate treatment, and sour water handling. Onshore processing is more expensive than the offshore processing due to the duplication of facilities at both the offshore and onshore locations including separation, TEG dehydration, condensate treatment, compression, and sour water handling. Due to economic reasons, the onshore processing case was rejected.
Full Onshore Processing with Long Subsea Tie-Back
Another alternative for providing full onshore processing would be to use a “long subsea tie-back”. This alternative involves using only the reservoir pressure to push reservoir fluids to shore via a 176 km corrosion-resistant pipeline. An offshore subsea gathering system, with a subsea manifold, collects all the fluids produced from the subsea wells and transports them to shore via a multiphase pipeline. The onshore plant provides full processing of the reservoir fluids and contains all the process equipment similar to the offshore processing alternative plus a slugcatcher, sulphur recovery plant and sour water handling equipment.
Onshore processing creates additional safety and human health risk associated with handling sour gas onshore near populated areas. The probability of a large-scale accidental release of sour gas from a processing facility, albeit remote, is a serious concern. While the oil and gas industry has proven capable of handling sour gas in populated areas, EnCana submits that the most prudent approach is to minimize risk by locating sour gas facilities away from populated areas.
While proven and effective mitigation measures exist to address safety/occupational health and environmental concerns, EnCana’s preferred approach for this Project is to deal with the sour gas at source to minimize overall risk. While population density in the onshore project area is low, there would nevertheless be some added risk to the public with an onshore compared to offshore acid gas handling site. In general, there are many more environmental receptors onshore and acidic buffering capacity is far greater in the marine environment.

Deep Panuke Volume 4 (Environmental Assessment Report) November 2006 2-70
After carefully considering the concept, EnCana rejected the onshore processing with subsea tie-back option as not technically feasible. There is no precedent of tie-backs of this length anywhere world-wide to date. In addition, the lack of inlet compression offshore would impact the recovery of the resource and result in a larger unrecoverable portion of the resource when compared to an offshore solution. These technical issues and reduced resource recovery contributed to the rejection of the onshore processing with subsea tie-back option.
Split Onshore/Offshore Processing (Intermediate Case)
An intermediate case for onshore processing was also reviewed. The intermediate case requires dehydration and H2S removal offshore, transportation to shore in a dedicated multi-phase pipeline, and separation, dewpointing and condensate treatment occurring at the onshore facility. Under this scenario, condensate must also be treated offshore for H2S removal since the pipeline and the onshore facility are designed for processing sweet gas. Treating condensate offshore requires the same facilities as full offshore processing plus, additional, duplicative facilities onshore. There is no technical or economic advantage in recombining the gas and condensate for multiphase transport since duplicate facilities for condensate separation and treatment would be required onshore. Accordingly, the intermediate case was rejected based on technical and economical considerations.
EnCana’s proposed solution is offshore processing. The alternate pipeline case will dictate the final configuration - full offshore processing under the M&NP Option or partial processing under the SOEP Subsea Option.
In summary, offshore processing was selected as the preferred option based on the following:
treating and disposing of sour gas as close to source as possible and thereby reducing risk to the local population and environment near Goldboro; offshore injection of acid gas minimizes safety and environmental risk due to the buffering capacity of the marine environment and the few receptors in the offshore project area; reduced risk related to subsea pipeline integrity with the removal of both water and H2S prior to transport to shore; and capital and operating costs.
2.10.2.7 Acid Gas Handling
Removal of H2S from the inlet gas stream results in a concentrated waste stream to be handled offshore. The FEED study investigated four options for handling acid gas offshore including flaring, seawater scrubbing, offshore sulphur recovery, and acid gas injection. The alternative chosen for the Project is the acid gas injection technology. A summary of the investigation is included below and summarized in Table 2.12.

Dee
p Pa
nuke
Vol
ume
4 (E
nvir
onm
enta
l Ass
essm
ent R
epor
t) N
ovem
ber 2
006
2-71
Tab
le 2
.12
Aci
d G
as H
andl
ing
Dev
elop
men
t Alte
rnat
ives
Alte
rnat
ive
Tec
hnic
al S
uita
bilit
y C
ost
Com
mer
cial
Ris
k T
echn
ical
ly a
nd
Eco
nom
ical
ly
Feas
ible
Con
cept
Del
iver
abili
ty
Safe
ty
Env
iron
men
tal I
mpa
ct
Aci
d ga
s in
ject
ion
Prov
en te
chno
logy
Use
d ex
tens
ivel
y in
Wes
tern
C
anad
a –
EnC
ana
has
exis
ting
inst
alla
tions
App
roxi
mat
ely
$45
MM
No
sign
ifica
nt c
once
rns
Yes
M
oder
ate
risk
– sp
ecia
lized
eq
uipm
ent a
nd a
dditi
onal
sa
fety
con
cern
s
Incr
emen
tal r
isk
over
fla
ring
due
to h
andl
ing
of
high
pre
ssur
e ac
id g
as
Sign
ifica
ntly
redu
ces a
ir em
issi
ons a
nd m
arin
e di
scha
rges
co
mpa
red
with
oth
er fe
asib
le
optio
ns
Flar
ing
Prov
en te
chno
logy
Use
d w
orld
wid
e
App
roxi
mat
ely
$1 M
M*
Fuel
gas
requ
ired
to
ensu
re e
ffic
ient
op
erat
ion
Not
app
licab
le
Yes
Le
ast r
isk
So
me
risk
asso
ciat
ed w
ith
hand
ling
acid
gas
H
ighe
st a
ir em
issi
ons
Seaw
ater
sc
rubb
er
Tech
nolo
gy n
o lo
nger
av
aila
ble
Not
ass
esse
d N
ot a
pplic
able
N
o
Off
shor
e su
lphu
r re
cove
ry
Off
shor
e fo
otpr
int r
equi
red
mak
es O
ptio
n un
econ
omic
al
Ver
y hi
gh
Not
app
licab
le
No
Not
e: *
Bas
ed o
n es
timat
es p
repa
red
in 2
002.

Deep Panuke Volume 4 (Environmental Assessment Report) November 2006 2-72
Flaring acid gas consists of directing the acid gas stream to a flare system for incineration and emission to the atmosphere. Flaring is a relatively low-cost option and is widely used for this type of acid gas. There are SO2 emissions resulting from the incineration process, which while permissible, can impact air quality. In this case the amount of SO2 released is within air quality guidelines. This alternative was not ruled out, but was considered less preferable than acid gas injection, where economic and operable.
The seawater scrubbing option consists of an incinerator and a scrubber. The unit accepts acid gas from the incinerator that has converted the H2S to SO2. The SO2 is subsequently removed by seawater absorption in a packed column. The acid gas leaving the incinerator flows up the column contacting the seawater counter currently. The spent seawater flows by gravity to a mixing device, where it is combined with other plant discharge water (cooling water, produced water, etc.) and returned to the ocean.
Seawater scrubbing technology has been used in some onshore facilities such as power plants, but has very limited experience in offshore applications. Two offshore applications were identified, and both installations do not have established performance records. Further, an environmental review of this technology performed in 2002 identified that the discharge stream would likely be considered to be deleterious to marine life. Further recent investigation has found that equipment vendors are no longer offering this type of equipment. The seawater scrubbing was rejected on the basis of being a technically unproven and unacceptable alternative.
Offshore sulphur recovery was considered as an alternative for acid gas handling. After preliminary review of the option, it was determined that it was not economically feasible due to the size of the platform required for the process and the logistics of handling the sulphur product.
2.10.2.8 Produced Water Disposal
EnCana identified four potential alternatives for produced water disposal on the Deep Panuke Project. These alternatives were treatment and discharge overboard, injection into a dedicated well, simultaneous injection into the condensate/acid gas injection well, and injection into the annular space of an existing well. Each alternative carries different types and levels of risk to the Project (further information provided in Table 2.13). After a thorough review of the alternatives, the treatment and discharge overboard option was deemed the best technical and commercial option.
Discharge Overboard
Treatment and discharge overboard is a proven technology that is used world-wide in offshore oil and gas facilities, including offshore Nova Scotia. The treatment technology proposed for the Project will ensure that the prescribed CNSOPB limits for produced water discharge are met or improved upon.

Dee
p Pa
nuke
Vol
ume
4 (E
nvir
onm
enta
l Ass
essm
ent R
epor
t) N
ovem
ber 2
006
2-73
Tab
le 2
.13
Prod
uced
Wat
er D
ispo
sal A
ltern
ativ
es
Alte
rnat
ive
Tec
hnic
alSu
itabi
lity
Cos
t C
omm
erci
al R
isk
Tec
hnic
ally
and
E
cono
mic
ally
Fea
sibl
e C
once
ptD
eliv
erab
ility
Sa
fety
E
nvir
onm
enta
l Im
pact
Trea
tmen
t and
di
spos
alov
erbo
ard
Prov
en te
chno
logy
Cur
rent
ly u
sed
wor
ldw
ide
in o
ffsh
ore
oil a
nd g
as fa
cilit
ies
Mee
ts p
ublis
hed
CN
SOPB
gui
delin
es
Bas
e ca
se fo
r cap
ital
cost
s
Ann
ual o
pera
ting
cost
s fo
r env
ironm
enta
l m
onito
ring
No
sign
ifica
nt c
once
rns
Yes
N
o si
gnifi
cant
con
cern
s N
o si
gnifi
cant
co
ncer
nsLi
kely
no
sign
ifica
nt im
pact
to
the
mar
ine
envi
ronm
ent d
ue to
hy
drod
ynam
ical
ly a
ctiv
e di
scha
rge
loca
tion
Wat
er w
ill b
e tre
ated
and
di
spos
ed a
ccor
ding
to e
xist
ing
regu
latio
ns
Inje
ctio
n in
to
dedi
cate
d w
ell
Prov
en te
chno
logy
on
shor
e
Will
requ
ire d
uplic
atio
n of
ove
rboa
rd e
quip
men
t in
cas
e w
ell g
oes d
own
Bas
e co
st fo
r dis
posa
l ov
erbo
ard
plus
ap
prox
imat
ely
60 M
M
Add
ition
al o
pera
tiona
l co
sts f
or w
ell
inte
rven
tions
, inj
ectio
n ch
emic
als,
and
pow
er fo
r pu
mpi
ng
No
sign
ifica
nt c
once
rns
Tech
nica
lly fe
asib
le
Una
ttrac
tive
econ
omic
ally
, ad
d un
nece
ssar
y co
st a
nd
com
plex
ity
Sim
ulta
neou
s in
ject
ion
with
ac
id g
as in
to
acid
gas
in
ject
ion
wel
l
Con
cept
is n
ot
tech
nica
lly fe
asib
le, d
ue
to v
arie
d pr
oduc
ed
wat
er v
olum
es
Not
ass
esse
d N
ot a
sses
sed
No

Dee
p Pa
nuke
Vol
ume
4 (E
nvir
onm
enta
l Ass
essm
ent R
epor
t) N
ovem
ber 2
006
2-74
Tab
le 2
.13
Prod
uced
Wat
er D
ispo
sal A
ltern
ativ
es
Alte
rnat
ive
Tec
hnic
alSu
itabi
lity
Cos
t C
omm
erci
al R
isk
Tec
hnic
ally
and
E
cono
mic
ally
Fea
sibl
e C
once
ptD
eliv
erab
ility
Sa
fety
E
nvir
onm
enta
l Im
pact
Inje
ctio
n in
to a
n an
nulu
sC
once
pt h
as si
gnifi
cant
te
chni
cal r
isks
If c
orro
sion
pro
blem
oc
curs
, will
shut
dow
n a
prod
ucer
wel
l
Add
ition
al c
apita
l cos
t fo
r inj
ectio
n eq
uipm
ent,
addi
tiona
l pip
ing,
wel
l co
nstru
ctio
n, a
nd
wel
lhea
d m
odifi
catio
ns
Add
ition
al o
pera
tiona
l co
sts f
or in
ject
ion
chem
ical
s
Pote
ntia
l ris
k of
shut
-do
wn
of p
rodu
ctio
n w
ell
that
is b
eing
inje
cted
into
(c
orro
sion
)
Unc
erta
inty
with
rega
rd
to a
suita
ble
inje
ctio
n zo
ne
No

Deep Panuke Volume 4 (Environmental Assessment Report) November 2006 2-75
Injection into a Dedicated Well
Water injection into a dedicated well is a proven technology on offshore oil developments and is normally done for reservoir pressure maintenance. This concept would involve the use of all equipment for the overboard disposal scheme plus the addition of a dedicated flowline, a dedicated umbilical, a new injection well, injection pumps, and filters. For this concept, the capability to discharge produced water overboard would be required to provide operational flexibility in times of maintenance and/or operational issues. The concept, while technically feasible, is considerably more expensive than the simpler overboard disposal concept. Since the overboard disposal concept provides a proven, environmentally acceptable alternative at a significantly lower cost, the dedicated injection well was rejected based on economic considerations.
Simultaneous Injection of Acid Gas and Produced Water
Simultaneous injection of produced water into the condensate/acid gas well is not commonly practiced offshore due to risks associated with phase separation. Although the design rate of 6,400 m3/d [40,000 bpd] is sufficient to dissolve 130 x 103 m3/d [4.5 MMscfd] of acid gas, the rate of produced water varies between 0 and 6,400 m3/d [40,000 bpd] and cannot be predicted with certainty at this time. Therefore, this option cannot be considered as a reliable solution for produced water disposal and was rejected.
Injection of Produced Water into an Annular Space
Injection into the annular space of an existing well is not widely practiced. This concept involves injecting the produced water into an annular space between the surface and production casing strings. The concept will require injection pumps and equipment on the topsides similar to the dedicated well concept as well as a special dual completion type wellhead and production tree arrangement. This concept has the following technical challenges:
the annular space on any of the existing production wells will not have sufficient cross-sectional area to accept up to 6,400 m3/d [40,000 bpd]. Therefore, none of the existing wells could be re-used;well construction to accommodate this concept for either of the two new drill wells (H-99 or D-70) will be difficult and technically challenging because a special oversized surface casing will be needed along with a custom wellhead and production tree; and injection of the total expected quantity of produced water over the field life into a non-permeable zone, where the surface casing terminates, is questionable. There may be operational issues with this concept.

Deep Panuke Volume 4 (Environmental Assessment Report) November 2006 2-76
Therefore, injection into an annular space was rejected on the basis of high risk of deliverability of this concept.
2.10.2.9 Condensate Handling
The method employed for condensate handling is directly tied to the export tie-in alternatives. For the M&NP Option, three options were investigated for handling condensate. The preferred option is to use the condensate as primary fuel for the turbine drivers offshore. The rationale for this selection is described below.
For the SOEP Subsea Option, the condensate is transported to SOEP via the export pipeline and commingled with the export gas. Final condensate handling is done onshore at the SOEP gas plant at Goldboro and the fractionation plant at Point Tupper.
Handling of the condensate stream either as the primary fuel on the platform or processing at the SOEP facilities are both technically feasible. Final selection of the condensate handling alternative will be made when discussions between EnCana and ExxonMobil are concluded.
The following three options for condensate handling were evaluated for the M&NP Option:
1. the use of a dedicated pipeline to shore; 2. use of condensate as a fuel; and3. condensate storage and shipment by tanker.
The three alternatives were identified as technically feasible with different types and levels of risk (refer to Table 2.14); however, options 1 and 3 were deemed not to be economically feasible. After reviewing the alternatives, it was determined that use of condensate handling as the primary fuel is the preferred alternative for the M&NP Option.
The maximum expected volume of condensate that will be produced with Deep Panuke gas at peak production is approximately 220 m3/day [1400 bpd].

Dee
p Pa
nuke
Vol
ume
4 (E
nvir
onm
enta
l Ass
essm
ent R
epor
t) N
ovem
ber 2
006
2-77
Tab
le 2
.14
Con
dens
ate
Han
dlin
g
Alte
rnat
ive
Tec
hnic
alSu
itabi
lity
Cos
t C
omm
erci
al R
isk
Tec
hnic
ally
and
E
cono
mic
ally
Fe
asib
le
Con
cept
Del
iver
abili
ty
Safe
ty
Env
iron
men
tal I
mpa
ct
Ded
icat
edpi
pelin
e to
shor
e Pr
oven
tech
nolo
gy
Hig
h ca
pita
l cos
ts
No
sign
ifica
nt c
once
rns
No
Use
of
cond
ensa
te a
s a
fuel
Tri-f
uel u
sage
(g
as/c
onde
nsat
e/di
esel
) not
w
idel
y us
ed in
off
shor
e pr
oduc
tion,
but
feas
ible
Leas
t exp
ensi
ve
No
sign
ifica
nt c
once
rns
Yes
Sp
ecia
lized
equ
ipm
ent
whi
ch is
not
ava
ilabl
e in
C
anad
a ha
s lon
g le
ad
deliv
ery
Req
uire
s spe
cial
des
ign
cons
ider
atio
ns h
owev
er,
tech
nica
lly a
chie
vabl
e
Red
uced
tran
sfer
s of d
iese
l (r
equi
red
as a
bac
kup
fuel
) si
nce
a tri
-fue
l sys
tem
will
be
in u
se
Stor
age
and
ship
men
t by
tank
er
Prov
en te
chno
logy
H
igh
capi
tal c
osts
N
o si
gnifi
cant
con
cern
s N
o

Deep Panuke Volume 4 (Environmental Assessment Report) • November 2006 2-78
Use of a dedicated condensate pipeline to shore would necessitate the construction of onshore condensate handling facilities such as storage tanks which would result in substantial capital costs. The pipeline would have to be buried over its entire length (not easily accomplished over rocky areas) to meet regulatory requirements and to protect it from possible damage from mobile fishing gear. In addition, the condensate pipeline would not be protected from clam dredges unless deeply buried. The potential environmental effects associated with rupture of such a condensate pipeline would also be a concern. The quantities of condensate to be produced from the Deep Panuke field do not justify the costs associated with a dedicated condensate pipeline. Thus, a dedicated condensate pipeline to shore was deemed not economically feasible and was therefore rejected.
The use of condensate as the primary fuel on the MOPU was also considered. Using condensate as fuel eliminates the substantial capital and operating costs associated with a condensate pipeline to shore and associated onshore handling facilities. The use of condensate as fuel on the platform conserves the resource by maximizing the quantity of natural gas exported to shore and by utilizing all components of the Deep Panuke resource.
A seafloor subsea storage tank for holding a six-month volume of condensate offshore was also considered. While subsea storage tanks have been used at other offshore facilities, there is a high risk for potential seafloor scour due to the relatively shallow water at the Deep Panuke site. That would necessitate large quantities of rock protection around the tank. The prohibitive costs of such an installation resulted in this option being considered not economically feasible.
2.10.2.10 Production Capacity Alternatives
The 2002 Project basis for production capacity was 11.3 x 10⁶ m3/d [400 MMscfd]; however, alternatives for smaller facilities with peak production capacities of 8.5 x 10⁶ m3/d [300 MMscfd] and 5.7 x 10⁶ m3/d [200 MMscfd] were also considered. Concepts were initially developed for jacket-supported structures for each alternative. It was found that the platform footprint, weight, and cost reduced considerably when the production capacity was reduced from 11.3 x 10⁶ m3/d [400 MMscfd] to 8.5 x 10⁶ m3/d [300 MMscfd]. However, the reduction in topsides weight (and cost) when the production capacity was further reduced to 5.7 x 10⁶ m3/d [200 MMscfd] is marginal since the size of processing equipment does not decrease in the same proportion as production capacity. The economic modelling case at the 5.7 x 10⁶ m3/d [200 MMscfd] production rates showed that the payout period was too lengthy at this rate, severely impacting the economics. It was concluded that the 8.5 x 10⁶ m3/d [300 MMscfd] plant size is more economically feasible for the Mean reservoir case and therefore was selected for the plant production capacity rating.

Deep Panuke Volume 4 (Environmental Assessment Report) • November 2006 2-79
2.10.2.11 Export Pipeline Alternatives
There are two alternatives for the export pipeline. EnCana proposes to transport product for sale via a subsea pipeline from the offshore processing facility to one of two delivery points:
• Goldboro, Nova Scotia (M&NP Option); or• SOEP 660 mm [26 inch] pipeline tie-in (SOEP Subsea Option).
Both export pipeline alternatives are technically feasible and routes have been chosen to minimize environmental impact. The selected alternative will be determined pending the outcome of commercial discussions between the operator of SOEP, ExxonMobil, and EnCana.
2.10.2.12 Subsea Tie-back Alternatives
The Deep Panuke reservoir areal extent has changed substantially from the 2002 Project basis of one license, PL2902, to the current Project basis covering PL2902, EL2387, SDL2255H, PL2901 and EL2360. The pool size estimate requires a minimum of five production wells for the P90 case (value at 90th Percentile) and a maximum of eight production wells for the P10 case (value at 10th Percentile) to effectively deplete the resources. The large extent of the pool necessitates the use of a subsea solution.
The Project plans to utilize four suspended wells from the exploration drilling program as production wells which allows for reduced capital costs and environmental interactions. One new production well will be drilled for the Project start-up. Up to three additional production wells could be drilled in future. A subsea tie-back study was carried out to determine the optimal method of tying in the wells to the field centre. It should be noted that a new acid gas injection well must also be tied back to the field centre; however, the geology in the area allows numerous options for the location of this well so this was not considered as a driver for the lay-out study.
From a layout consideration, it was determined that a tie-back of individual wells to the field centre was the best technical solution. The proposed well locations do not suit a template or manifold arrangement. The field centre location was determined by minimizing the tie-back lengths of the wells to lower capital costs and improve flow assurance.
Three alternative methods for flowline installation were considered: 1) “S-lay” barge method; 2) “reel lay” technique; and 3) flexible flowline method. The “S-lay” lay barge method involves the use of an offshore barge to weld and then lay lengths of rigid pipe on the seabed by means of a “stinger” overhanging the stern of the barge. Subsequently, the pipe is trenched using a subsea trenching or ploughing spread. The “reel lay” method involves pre-welding rigid pipe lengths together at a specialized “spool base” onshore and then reeling the entire flowline onto a large diameter reel. The reel
Deep Panuke Volume 4 (Environmental Assessment Report) November 2006 2-80
is taken offshore on a special lay vessel where it is straightened and laid on the seabed as a continuous length. The flowline is trenched in a similar manner to the lay barge method. The “flexible” solution uses a flowline of non-rigid type. Each flowline is manufactured in one single piece at a specialized factory and coiled on a large reel and taken offshore. A special lay vessel uncoils the flowline and lays it on the sea bed. Trenching methods are similar to the other schemes. Hook-ups for all three alternatives are carried out by diver/ROV operations.
All three methods are technically acceptable with similar environmental effects and the preferred solution will be chosen following the competitive bidding process.
2.10.2.13 Acid Gas Injection Location
As indicated in Section 2.10.2.7, the option chosen for acid gas handling for the Project is the acid gas injection technology. The location chosen for the acid gas injection well is D-70. An alternative location considered for the acid gas injection well was H-82. A summary of the investigation is included below and summarized in Table 2.15.
Both acid gas well locations are technically and economically feasible. However, the distance from the MOPU to H-82 is longer than the distance to D-70 (4.8 km versus 1.7 km), which would result in an additional cost of approximately $1 MM to $2 MM for the extra length of flowline and umbilical for H-82.
The possibility of acid gas injection souring the Panuke oil sands is considered to be extremely unlikely for both the D-70 and H-82 locations; the likelihood of souring is only slightly greater for the D-70 location.
The longer flowline for an acid gas injection well at H-82 results in an increased operational risk associated with a higher risk of hydrate formation in the flowline. In addition, there is also an increased safety risk in the very unlikely event of an acid gas injection flowline rupture due to the larger volumes of acid gas contained in the longer flowline to H-82.
The environmental impact from both locations would be very similar, although the H-82 location is expected to have a slightly higher environmental impact due to the following:
longer flowline resulting in larger benthic footprint (greater area of benthic disturbance); larger safety zone area to include H-82 well and flowline location, resulting in higher impact on fisheries (especially quahog fishery) and other ocean users; and increased impact to air quality in the unlikely event of acid gas flowline rupture due to larger volume of acid gas contained in the longer flowline to H-82.

Deep Panuke Volume 4 (Environmental Assessment Report) November 2006 2-81
However, these differences are not likely to result in significant environmental effects and the assessment presented in this EA Report (DPA Volume 4) for the D-70 location is expected to be applicable to the H-82 location.
Based on the fact that both acid gas well locations are very similar in terms of technical feasibility and environmental impact, the acid gas well injection location at D-70 was selected due to lower costs and slightly lower risks associated with concept deliverability and safety.
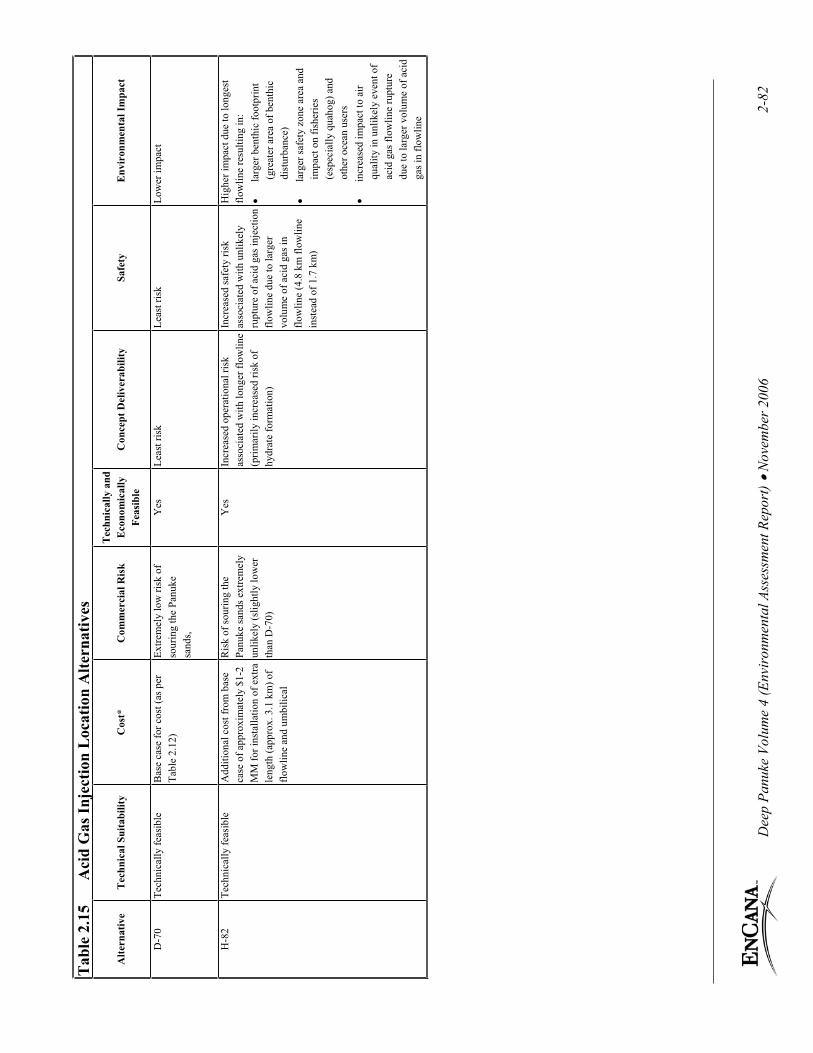
Dee
p Pa
nuke
Vol
ume
4 (E
nvir
onm
enta
l Ass
essm
ent R
epor
t) N
ovem
ber 2
006
2-82
Tab
le 2
.15
Aci
d G
as In
ject
ion
Loc
atio
n A
ltern
ativ
es
Alte
rnat
ive
Tec
hnic
al S
uita
bilit
y C
ost*
C
omm
erci
al R
isk
Tec
hnic
ally
and
E
cono
mic
ally
Fe
asib
leC
once
pt D
eliv
erab
ility
Sa
fety
E
nvir
onm
enta
l Im
pact
D-7
0 Te
chni
cally
feas
ible
B
ase
case
for c
ost (
as p
er
Tabl
e 2.
12)
Extre
mel
y lo
w ri
sk o
f so
urin
g th
e Pa
nuke
sa
nds,
Yes
Le
ast r
isk
Leas
t ris
k Lo
wer
impa
ct
H-8
2 Te
chni
cally
feas
ible
A
dditi
onal
cos
t fro
m b
ase
case
of a
ppro
xim
atel
y $1
-2
MM
for i
nsta
llatio
n of
ext
ra
leng
th (a
ppro
x. 3
.1 k
m) o
f flo
wlin
e an
d um
bilic
al
Ris
k of
sour
ing
the
Panu
ke sa
nds e
xtre
mel
y un
likel
y (s
light
ly lo
wer
th
an D
-70)
Yes
In
crea
sed
oper
atio
nal r
isk
asso
ciat
ed w
ith lo
nger
flow
line
(prim
arily
incr
ease
d ris
k of
hy
drat
e fo
rmat
ion)
Incr
ease
d sa
fety
risk
as
soci
ated
with
unl
ikel
y ru
ptur
e of
aci
d ga
s inj
ectio
n flo
wlin
e du
e to
larg
er
volu
me
of a
cid
gas i
n flo
wlin
e (4
.8 k
m fl
owlin
e in
stea
d of
1.7
km
)
Hig
her i
mpa
ct d
ue to
long
est
flow
line
resu
lting
in:
larg
er b
enth
ic fo
otpr
int
(gre
ater
are
a of
ben
thic
di
stur
banc
e)
larg
er sa
fety
zon
e ar
ea a
nd
impa
ct o
n fis
herie
s (e
spec
ially
qua
hog)
and
ot
her o
cean
use
rs
incr
ease
d im
pact
to a
ir qu
ality
in u
nlik
ely
even
t of
acid
gas
flow
line
rupt
ure
due
to la
rger
vol
ume
of a
cid
gas i
n flo
wlin
e

Deep Panuke Volume 4 (Environmental Assessment Report) November 2006 3-1
3 MALFUNCTIONS AND ACCIDENTAL EVENTS
This section provides an overview of potential malfunctions and accidental events that, while unlikely, may occur during the Project, with an emphasis on the effects of these events. Spill risk and behaviours have been modelled to determine the probability and extent of impacts (Appendix E). While a significant spill or release of gas is extremely unlikely, the potential consequences of such an event need to be understood so that safety, emergency response and contingency planning can be completed to ensure the risk is further minimized.
Accidental air emission and marine spill modelling presented in the approved 2002 CSR required updating due to the following Project modifications:
re-location of the field centre; new production and acid gas injection subsea wells and flowlines;new multi-phase pipeline (carrying condensate) for SOEP Subsea Option; and revised Project life.
To minimize confusion and improve readability, this discussion is being presented in its entirety as originally presented in the approved 2002 CSR, with updated scenarios and results noted.
3.1 Potential Malfunctions and Accidental Events
Malfunctions and upset conditions having potential environmental effects include: platform-based spills; malfunction of the acid gas management system; blowouts and pipeline/flowline ruptures; and collisions.
Routine operations can be conducted with sufficient mitigation to ensure that effects on the environment and human health and safety are not significant. There is potential for significant adverse environmental effects to occur in the extremely unlikely event of a blowout of an injection or production well, or an acid gas flowline rupture. Design, inspection, maintenance and integrity assurance programs, as well as proven engineering techniques, will be in place to prevent such events from occurring. All safety procedures will be documented and in place prior to the commencement of routine operations.
All fuel, chemicals and wastes will be handled in a manner that minimizes or eliminates routine spillage and accidents. EnCana’s EPP will include safe chemical handling and storage procedures as well as Project-specific spill response measures (refer to Appendix G). EnCana’s Deep Panuke Spill Response Plan includes general measures for preparing for and responding to spills, including the use of cleanup equipment, training of personnel and identification of personnel to direct cleanup efforts, lines of communications and organizations that could assist cleanup operations (refer to Appendix G).

Deep Panuke Volume 4 (Environmental Assessment Report) November 2006 3-2
3.1.1 Platform-based Spills
Platform-based spills were discussed in Section 3.1.1 of the approved 2002 CSR. Given the change in Project life and MOPU location, spill risk probability analysis and spill behaviour modelling have been updated (refer to Appendix E) and summarized in Section 3.2.1 and 3.4.1, respectively.
3.1.2 Collisions
The risk of collision between platforms and vessels is anticipated to be extremely low based on compliance with standard procedures. A safety zone will be established in accordance with CNSOPB regulations and will most likely encompass the MOPU, subsea well, flowlines and umbilicals. For further detail, refer to Section 2.4.4. Surface facilities will contain navigational aids and anti-collision radar will provide early warning of a potential collision hazard. In the unlikely event that a collision cannot be avoided, EnCana’s DPEMP would address response procedures.
3.1.3 Malfunction of Acid Gas Management System
Under normal operations, waste acid gas will be injected into a dedicated injection well. Malfunctions of compressors or other equipment associated with acid gas management could lead to conditions that require diversions of the acid gas to the MOPU flare. Equipment downtime and flaring will also be required for routine maintenance and is expected to be a brief period (e.g., a few days or a week). In the unlikely event of major equipment malfunctions, equipment downtime and associated flaring could last approximately one year (in the event that a new injection well needs to be drilled). Flaring of acid gas results in emissions of SO2; however, a flare malfunction resulting in failure to ignite, will result in emissions of H2S. Air emissions during upset conditions are described in detail in Section 8.1.4.4.
The acid gas injection well will be drilled into a suitable geological formation. The intended reservoir for disposal of the acid gas does not contain sulphur; therefore it is anticipated that a blowout during drilling of the injection well would not contain significant amounts of H2S. The primary prevention mechanism within the wellbore is the SC-SSSV. This is a failsafe valve that must be maintained open by hydraulic pressure on a line from the surface. Interruption of pressure on this valve, either through control action on the platform, or by accidental event, results in rapid closure of the valve. This would limit the potential discharge to the volume of gas within the pipe. Sections 3.4.2.1 and 8.1.4.4 describe the fate and behaviour of a blowout of the acid gas injection well.

Deep Panuke Volume 4 (Environmental Assessment Report)• November 2006 3-3
3.1.4 Blowout Releases
There are two basic kinds of offshore oil/gas well blowouts. The first is a subsea blowout in which the discharging oil and gas emanates from the subsea well and rises through the water column to the water surface. The other possibility is an above-surface blowout in which oil and gas discharges into the atmosphere from some point on the platform above the water surface, and subsequently falls on the water surface some distance downwind.
Probability of blowouts is discussed in Section 3.2.2. Spill behaviour is discussed in Section 3.4.2. Atmospheric emissions related to well blowout are discussed in detail in Section 8.1.4.4. Design features to be used by EnCana to prevent or greatly minimize the chances of a serious spill are described in Section 2.9.
3.1.5 Pipeline and Flowline Releases
The export pipeline (both options) will be designed to withstand impacts from conventional mobile fishing gear in accordance with the DNV Guideline No. 13, Interference between Trawl Gear and Pipelines, September 1997. The subsea tie-in structures for the SOEP Subsea Option will be trawlable.
A leak system will be provided on the natural gas pipeline. In the event that a leak is confirmed, the pipeline has valves that will isolate the pipeline from either the M&NP pipeline or the SOEP pipeline and the MOPU to prevent additional hydrocarbons from entering the system. Section 2.9.2 provides additional detail on pipeline leak prevention.
Flowlines will be buried to avoid impacts from conventional mobile fishing gear and their locations will be charted. It is also likely that the safety zone will also encompass all wellhead flowlines and umbilicals. Environmental and safety protection systems, such as ESD valves, will be provided on the flowlines. Section 2.9.4 provides additional detail on flowline protection.
Risks of onshore pipeline and subsea pipeline/flowline releases are described in Sections 3.3 and 3.4, respectively. Atmospheric emissions related to subsea pipeline and flowline failures are discussed in Section 8.1.4.4.
3.1.6 Effects of the Environment on the Project
Effects of the environment on the Project (e.g., extreme waves, sea ice) which may cause upset conditions are discussed in Section 10.

Deep Panuke Volume 4 (Environmental Assessment Report) November 2006 3-4
3.2 Marine Spill Risk and Probability
A detailed discussion of spill risk and probability associated with the Project is presented in Appendix E. The calculated spill frequencies for the Project are summarized in Table 3.1.
3.2.1 Platform-based Spills
Small and medium platform-based spills could contain diesel oil, hydraulic fluid, lubricants, other refined oils, or mineral oil. The highest frequencies for all spills are for the smaller, platform-based spills (<1 bbl). Statistics for these small spills are often difficult to interpret due to inconsistent reporting practices. The Project’s design will build upon lessons learned from previous spill events in order to minimize potential risk for spills, including small platform-based spills. Spill prevention measures will include state-of-the-art environmental protection systems (Section 2.9) and treatment systems for the MOPU’s effluents, including deck drainage (Section 2.7.5). One spill in the 1 to 49.9 barrels (bbl) range might occur over the course of the Project, although its average size can be expected to be less than 10 barrels. There is about a 5% chance that a platform-based spill larger than 50 barrels might occur over the course of the entire Project.
The annual probability of having a large (>1000 bbl) or very large (>10,000 bbl) spill as a result of an accident on a platform is one in 10,000 and one in 28,000 respectively. This is calculated on the basis of United States Outer Continental Shelf (US OCS) experience. This means that if the Project were to continue forever, one platform-based spill larger than 1,000 barrels might occur every 10,000 years. Similarly, very large platform spills (>10,000 bbl) might occur once every 28,000 years.
3.2.2 Blowouts
During the 12 months needed to drill five wells, the chances of an extremely large (>150,000 bbl) and very large (>10,000 bbl) oil well blowout from development drilling are extremely small. If this drilling rate were to continue forever, one could conservatively expect one extremely large spill every 7,500 years; a very large spill might occur every 3,700 years. For similar sized blowouts from production activities and workovers that might occur over the 17.5-year production period, one might expect one extremely large oil well blowout every 20,000 years, and one very large oil well blowout every 7,800 years of production. These predictions are based on worldwide blowout data which includes variability in regulatory standards and application.
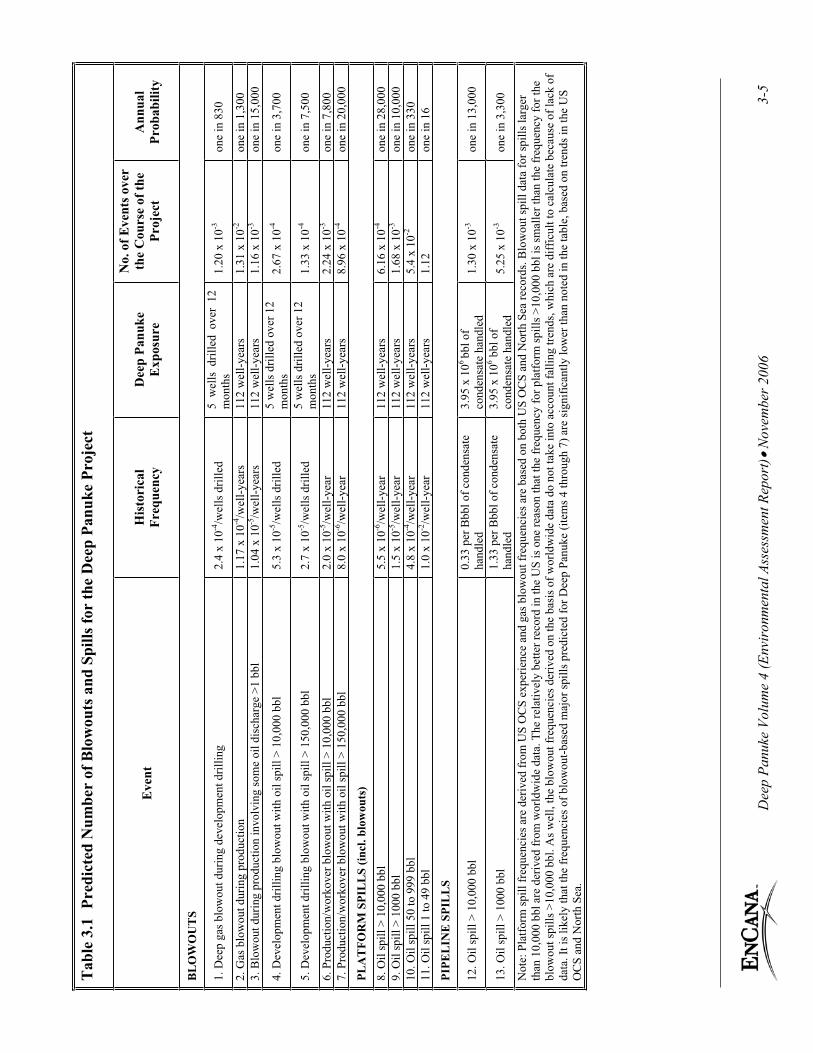
Dee
p Pa
nuke
Vol
ume
4 (E
nvir
onm
enta
l Ass
essm
ent R
epor
t) N
ovem
ber 2
006
3-5
Tab
le 3
.1 P
redi
cted
Num
ber
of B
low
outs
and
Spi
lls fo
r th
e D
eep
Panu
ke P
roje
ct
Eve
nt
His
tori
cal
Freq
uenc
y D
eep
Panu
ke
Exp
osur
e
No.
of E
vent
s ove
r th
e C
ours
e of
the
Proj
ect
Ann
ual
Prob
abili
ty
BL
OW
OU
TS
1. D
eep
gas b
low
out d
urin
g de
velo
pmen
t dril
ling
2.4
x 10
-4/w
ells
dril
led
5 w
ells
dril
led
over
12
mon
ths
1.20
x 1
0-3
one
in 8
30
2. G
as b
low
out d
urin
g pr
oduc
tion
1.17
x 1
0-4/w
ell-y
ears
11
2 w
ell-y
ears
1.
31 x
10-2
on
e in
1,3
00
3. B
low
out d
urin
g pr
oduc
tion
invo
lvin
g so
me
oil d
isch
arge
>1
bbl
1.04
x 1
0-5/w
ell-y
ears
11
2 w
ell-y
ears
1.
16 x
10-3
on
e in
15,
000
4. D
evel
opm
ent d
rillin
g bl
owou
t with
oil
spill
> 1
0,00
0 bb
l 5.
3 x
10-5
/wel
ls d
rille
d 5
wel
ls d
rille
d ov
er 1
2 m
onth
s2.
67 x
10-4
on
e in
3,7
00
5. D
evel
opm
ent d
rillin
g bl
owou
t with
oil
spill
> 1
50,0
00 b
bl
2.7
x 10
-5/w
ells
dril
led
5 w
ells
dril
led
over
12
mon
ths
1.33
x 1
0-4
one
in 7
,500
6. P
rodu
ctio
n/w
orko
ver b
low
out w
ith o
il sp
ill >
10,
000
bbl
2.0
x 10
-5/w
ell-y
ear
112
wel
l-yea
rs
2.24
x 1
0-3
one
in 7
,800
7.
Pro
duct
ion/
wor
kove
r blo
wou
t with
oil
spill
> 1
50,0
00 b
bl
8.0
x 10
-6/w
ell-y
ear
112
wel
l-yea
rs
8.96
x 1
0-4
one
in 2
0,00
0
PLA
TFO
RM
SPI
LL
S (in
cl. b
low
outs
) 8.
Oil
spill
> 1
0,00
0 bb
l 5.
5 x
10-6
/wel
l-yea
r 11
2 w
ell-y
ears
6.
16 x
10-4
on
e in
28,
000
9. O
il sp
ill >
100
0 bb
l 1.
5 x
10-5
/wel
l-yea
r 11
2 w
ell-y
ears
1.
68 x
10-3
on
e in
10,
000
10. O
il sp
ill 5
0 to
999
bbl
4.
8 x
10-4
/wel
l-yea
r 11
2 w
ell-y
ears
5.
4 x
10-2
on
e in
330
11
. Oil
spill
1 to
49
bbl
1.0
x 10
-2/w
ell-y
ear
112
wel
l-yea
rs
1.12
on
e in
16
PIPE
LIN
E S
PIL
LS
12. O
il sp
ill >
10,
000
bbl
0.33
per
Bbb
l of c
onde
nsat
e ha
ndle
d3.
95 x
106
bbl o
f co
nden
sate
han
dled
1.
30 x
10-3
on
e in
13,
000
13. O
il sp
ill >
100
0 bb
l 1.
33 p
er B
bbl o
f con
dens
ate
hand
led
3.95
x 1
06 bbl
of
cond
ensa
te h
andl
ed
5.25
x 1
0-3
one
in 3
,300
Not
e: P
latfo
rm sp
ill fr
eque
ncie
s are
der
ived
from
US
OC
S ex
perie
nce
and
gas b
low
out f
requ
enci
es a
re b
ased
on
both
US
OC
S an
d N
orth
Sea
reco
rds.
Blo
wou
t spi
ll da
ta fo
r spi
lls la
rger
th
an 1
0,00
0 bb
l are
der
ived
from
wor
ldw
ide
data
. The
rela
tivel
y be
tter r
ecor
d in
the
US
is o
ne re
ason
that
the
freq
uenc
y fo
r pla
tform
spill
s >10
,000
bbl
is sm
alle
r tha
n th
e fr
eque
ncy
for t
he
blow
out s
pills
>10
,000
bbl
. As w
ell,
the
blow
out f
requ
enci
es d
eriv
ed o
n th
e ba
sis o
f wor
ldw
ide
data
do
not t
ake
into
acc
ount
falli
ng tr
ends
, whi
ch a
re d
iffic
ult t
o ca
lcul
ate
beca
use
of la
ck o
f da
ta. I
t is l
ikel
y th
at th
e fr
eque
ncie
s of b
low
out-b
ased
maj
or sp
ills p
redi
cted
for D
eep
Panu
ke (i
tem
s 4 th
roug
h 7)
are
sign
ifica
ntly
low
er th
an n
oted
in th
e ta
ble,
bas
ed o
n tre
nds i
n th
e U
S O
CS
and
Nor
th S
ea.

Deep Panuke Volume 4 (Environmental Assessment Report) November 2006 3-6
Considering experience in the North Sea and the US Gulf of Mexico and taking into account the trend toward fewer and fewer blowouts, the prediction for Deep Panuke is that, during the initial 12 months when five wells will be drilled, the probability is 0.12% chance per year (one-in-830) of having a deep blowout (one that could involve sour gas). Similarly, during production at Deep Panuke, gas blowouts might be expected to occur every 1,300 years, and blowouts involving small amounts of discharged oil (>1 bbl) might be expected to occur once every 15,000 years.
3.2.3 Spills from Pipelines and Flowline Operations
Based on the maximum volume of condensate that may be handled as part of the Deep Panuke Project, and using historical spill frequencies from US offshore production data, the probability of a spill from interfield flowlines and export pipeline (SOEP Subsea Option) is estimated to be a 0.03% (one in 3,300) chance per year for spills greater than 1,000 barrels, and a 0.007% (one in 13,000) chance per year for spills greater than 10,000 barrels.
The US OCS data does not differentiate between interfield flowlines and export pipelines, nor is there any data specific to acid gas flowline failures. Spills from production and export pipelines are lumped together and calculated based on the broad exposure of total volume handled, rather than pipeline length, size, or other parameters.
3.3 Onshore Pipeline Risk
A detailed risk assessment of the onshore portion of the pipeline has been updated to reflect the new proposed adjacent industrial land uses in the onshore study area (i.e., proposed Keltic Petrochemical and Maple LNG facilities) (Bercha Engineering Limited 2006). However, EnCana has also identified the requirement to conduct a detailed quantitative risk analysis considering potential risk synergies between the nearshore/onshore components of the Project with the proposed adjacent petrochemical and LNG facilities. This analysis will occur during detailed route design as it requires specific information on relative layout of project components (for both projects). The following information summarizes some of the key findings of the updated assessment considering only risks associated with the Deep Panuke Project.
3.3.1 Accident Scenarios
The only accident scenarios associated with the onshore pipeline posing any threat to safety or environmental quality are accidental losses of containment. Although accidental losses of containment are extremely unlikely, it is important that the potential consequences of such an event are understood so that safety, emergency response and contingency planning can be completed to ensure the risk is further minimized.

Deep Panuke Volume 4 (Environmental Assessment Report) November 2006 3-7
An accidental release of natural gas would result in either dispersion or ignition of the flammable gas. Dispersion without ignition poses no hazard to people or the environment. The size of a potential pipeline release can vary from a small corrosion pinhole leak to a full rupture across the pipeline diameter. In order to represent the range of potential release sizes, losses of containment have been characterized as leaks (very small hole), holes, or ruptures. The likelihood of each of these is as follows:
Leaks – 1 in 600 per year; Holes – 1 in 1,500 per year; and Ruptures – 1 in 5,000 per year.
3.3.2 Hazards
The released gas only becomes hazardous in the instance that it is ignited. Based on the population density and level of industrial activity in the direct vicinity of the pipeline, leaks can be ignited with a probability of 5%, while holes or ruptures are associated with probabilities of ignition of approximately 35% and 60%, respectively. A portion of this probability of ignition is auto-ignition, from the energy released and possible sparks generated in the occurrence of the hole or rupture.
In the case of immediate ignition, a jet fire would result, involving the generation of a flame up to several hundred metres in length for full ruptures. In the case that ignition is delayed, under the most unfavourable atmospheric and release conditions, a natural gas cloud could extend several hundred meters, until it ignites from an ignition source. The gas cloud would then ignite, flashing back to the origin, and resulting in a jet fire, lasting until the gas in the entire pipeline has been depleted.
The probability of occurrence of the above mentioned jet fires or flash fires from holes or ruptures gives probabilities for potentially harmful scenarios (i.e., associated with ignition) as follows:
Holes with release ignition – 1 in 10,000 per year; and Ruptures with release ignition – 1 in 15,000 per year.
3.3.3 Risks
In the instance of either a jet fire or a flash fire, environmental damage would likely result in the form of ignition and/or burning of vegetation. Such damage, however, would only result over the footprint of the jet or flash fire, unless humidity and wind conditions were conducive to secondary fire escalation. Because the pipeline contains only market-ready gas, there would be no pipeline releases of hydrocarbon liquids that could pool and affect ecosystem components, such as streams and wetlands.
In regard to public or third-party worker safety, the combination of the likelihood of the occurrence of an initiating accident, ignition probability, and likelihood of people being exposed results in individual

Deep Panuke Volume 4 (Environmental Assessment Report) November 2006 3-8
specific risks in the slightly over 1 in 1 million-per-year at the pipeline, reducing to an insignificant level below 1 in 1 million-per-year within 200 m of the pipeline.
In summary, it can be stated that risks from the proposed onshore pipeline segment, are low both for public and worker safety and environmental integrity.
3.4 Marine Spill Release Behaviour
The following is a summary of the spill behaviour modelling results presented in Appendix E. Refer to Appendix E for a detailed description of the environmental data and modelling approach used.
3.4.1 Platform-based Spills
Small batch spills of diesel fuel or condensates from hose ruptures during transfer operations from a supply vessel or from platform storage facilities may occur. These spills are considered instantaneous events and are modelled by considering the surface spreading, evaporation, dispersion, emulsification and drift of a single patch or slick of oil. The Project’s design will build upon lessons learned from previous spill events in order to minimize potential risk for spills, including small platform-based spills. Spill prevention measures will include state-of-the-art environmental protection systems (Section 2.9) and treatment for the MOPU’s effluents, including deck drainage (Section 2.7.5).
Batch spill fate modelling was conducted for diesel fuel spill and condensate (10 and 100 barrels spill scenarios for both). There was found to be very little difference in the behaviour of the winter and summer oil spill scenarios. The small differences that do exist can be attributed to the warmer summer temperatures and slightly higher evaporation amounts prior to the full dispersion of the slicks. The following summaries provide descriptions of the fate of the various spill scenarios that apply to both seasons.
3.4.1.1 Diesel
The diesel spill fate results using the new MOPU location are very similar to those presented in the approved 2002 CSR. The only differences are in the distances traveled by the surface slicks and the dispersed oil clouds. These differences are not due to the change in platform location but rather due to errors that have since been identified in the approved 2002 CSR modelling. Most of the distances are shorter in the new model results when compared to those reported in the approved 2002 CSR; the only case where the distance has increased is in the dispersed oil cloud travel distance for the 100 barrel winter spill scenario.

Deep Panuke Volume 4 (Environmental Assessment Report) November 2006 3-9
The 100-barrel batch spill of diesel will also lose about 30% through evaporation, persist as a slick for about 19 hours and travel about 18 km prior to the complete loss of the surface oil. The maximum dispersed oil concentration for this spill will be about 4 ppm and this will drop to 0.1 ppm within about 43 hours. The dispersed oil cloud will travel about 54 km and have a maximum width of about 4 km. Prevailing water currents would take the dispersed condensate cloud in a southwest direction away from Sable Island (located approximately 48 km from Deep Panuke). Therefore, no diesel is predicted to reach the shores of Sable Island.
The 10-barrel batch spill of diesel will lose about 30% through evaporation, persist as a slick for about 13 hours and travel about 12 km prior to the complete loss of the surface oil. The maximum dispersed oil concentration for this spill will be about 2 ppm and this will drop to 0.1 ppm within about 16 hours. The concentration of 0.1 ppm of total petroleum hydrocarbon is the exposure concentration below which no significant biological effects are expected, based on historical laboratory research. The dispersed oil cloud will travel about 14 km and have a maximum width of about 1 km.
3.4.1.2 Condensate
The condensate spill fate results using the new MOPU location are very similar to those presented in the approved 2002 CSR. The only differences are in the distances traveled by the surface slicks and the dispersed condensate clouds. These differences are not due to the change in platform location but rather due to errors that have since been identified in the approved 2002 CSR modelling. Most of the distances are shorter in the new, updated, model results when compared to those reported in the approved 2002 CSR; the only cases where the distance has increased are in the dispersed condensate cloud travel distance for the 10-barrel and 100-barrel winter spill scenarios.
Both the 10- and 100-barrel batch spills of condensate will evaporate and disperse very quickly. These batch spills are likely to persist on the surface for less than half an hour and travel only 400 to 700 m from the release point prior to dissipation under average wind conditions. The maximum condensate concentrations from these spills are estimated to be between 28 to 45 ppm. The dispersed oil concentration for the 10-barrel spill will drop to 0.1 ppm within about 15 hours. The dispersed condensate cloud will travel about 7 km and reach a maximum width of about 1 km. The dispersed oil concentration for the 100-barrel spill will drop to 0.1 ppm within about 41 hours. The condensate cloud for the larger release will travel about 24 km and reach a maximum width of 4 km.

Deep Panuke Volume 4 (Environmental Assessment Report) November 2006 3-10
3.4.2 Blowouts and Pipeline/Flowline Ruptures
The blowout liquid and gas flow rates were reduced for the new Deep Panuke modelling when compared to the approved 2002 CSR. Overall, lower flow rates reduced the size of potential impact zones. The spill fate described below can be applied to all of the well locations being considered in the Deep Panuke project. Only very minor differences in the fate of the condensate from spills at F-70, D-41, M-79A, H-08, H-99, and D-70 wells as well the northeast extreme location for future wells were evident when the subsea blowout scenario was run at these locations. The summary provided below in Section 3.4.2.1 is representative of the typical subsea blowout from all these sites. Pipeline and flowlines failure scenarios have been modelled as mini subsea blowouts, and are therefore also included in that section.
3.4.2.1 Fate and Behaviour of Subsea Well Blowout and Pipeline/Flowline Ruptures
The results of the production well subsea blowout modelling from the Deep Panuke formation indicate that thin condensate slicks or sheen will form initially over a width of about 1.8 km. The slicks will be about 3 µm thick and will disperse within minutes under average winds. The initial in-water condensate concentrations from these releases will be less than 0.2 ppm. Condensate concentrations will drop to 0.1 ppm within 8 hours if the modelled evaporation estimates (27-34%) are used. If 50% of the condensate is assumed to evaporate (a more likely estimate), the in-water condensate concentrations will drop to 0.1 ppm within about 4 hours. The width of the condensate cloud will be 2 to 2.5 km when it reaches 0.1 ppm.
The fate of the acid gas injection well subsea blowouts will be similar to the production well blowouts. These slicks will start out about 900 m wide and 8 µm thick and persist on the surface for a very short time. The initial in-water condensate concentrations from these releases will be about 0.6 ppm and will drop to 0.1 ppm within 15 hours. The width of the condensate cloud will be about 2 km when it reaches 0.1 ppm after traveling between 4 and 6 km from the release point.
The pipeline failure modelling assumes full production flow rates for the gas and condensate. The results of the modelling are valid for the case where the pipeline or flowline are not shut in and continue to flow for an extended period. This would be considered a worst case scenario. For example, a flowline could be ruptured and the SSIV in the well or valves on the subsea well tree fail when attempts are made to shut in the well feeding the flowline. The flowline would release product until the well flow is stopped. This would be a very low probability event.
The fate of the subsea production flowline releases will also be similar to the well subsea blowouts. These surface slicks will start out about 1340 m wide and 7 µm thick and persist on the surface for a very short time. The initial in-water condensate concentrations from these releases will be about 0.5 ppm

Deep Panuke Volume 4 (Environmental Assessment Report) November 2006 3-11
and will drop to 0.1 ppm within 19 hours. The width of the condensate cloud will be about 3 km when it reaches 0.1 ppm after traveling for between 5 and 8 km from the release site.
The fate of the subsea acid gas injection flowline releases will also be similar to the well subsea blowouts. These slicks will start out somewhat narrower (520 m wide) and thicker (20 µm thick) but will also persist on the surface only for a very short time. The initial in-water condensate concentrations from these releases will be about 1.3 ppm and will drop to 0.1 ppm within 16 hours. The width of the condensate cloud will be about 2 km when it reaches 0.1 ppm after traveling for between 4 and 7 km from the release site.
The fate of the SOEP Subsea Option pipeline release will also be similar to the other subsea releases modelled. These slicks will start out about 1.5 km wide and 6.5 µm thick and persist on the surface for a very short time. The initial in-water condensate concentrations from these releases will be about 0.5 ppm and will drop to 0.1 ppm within 19 hours. The width of the condensate cloud will be about 3 km when it reaches 0.1 ppm after traveling about 5 km from the release site.
3.4.2.2 Surface Blowout Fate and Behaviour
Surface blowouts associated with production wells will generate relatively narrow (about 200 m wide) and relatively thin (7 µm) slicks. About 70% of the condensate will evaporate in the air prior to reaching the water surface and the remaining condensate will disperse into the water within minutes, under average wind conditions. The resulting dispersed condensate clouds will diffuse to 0.1 ppm condensate concentration in 4 hours and have a width of about 500 m at this point about 1 km from the release point. The surface slicks will persist for only several minutes prior to dispersing; therefore, no condensate will reach the shores of Sable Island or mainland Nova Scotia.
The fate of the acid gas injection well surface blowouts will be very similar to the production well blowouts. The initial slicks will be about 150 m wide and 15 µm thick. About 70% of the condensate will evaporate in the air prior to reaching the water surface and the remaining condensate will quickly disperse into the water. The resulting dispersed condensate clouds will diffuse to 0.1 ppm condensate concentration in 5-7 hours and have a width of about 600 m at this point about 1 to 2 km from the release point.
No condensate is predicted to reach the shores of Sable Island (approximately 48 km away) or mainland Nova Scotia. The distance the surface condensate slick will travel is a function of the evaporation and dispersion rate, and the surface drift speed of the slick. The condensate release from the Uniacke G-72 incident is an example of an accidental event where there was no detectable condensate (surface slicks, aerosols or in-water condensate) at distances greater than 10 km from the source (Martec Limited 1984).

Deep Panuke Volume 4 (Environmental Assessment Report) November 2006 3-12
The Uniacke blowout occurred February 22, 1984 and continued for 10 days. The gas and condensate aerosol plume was estimated to rise approximately 10 m above its point of exit at the rotary table on the drilling floor. The slick that formed from the condensate fallout was approximately 300 m wide near the source and spread to a width of approximately 500 m. It was estimated that between 50 to 70% of the condensate volume evaporated in the air prior to reaching the water. Seventy-five percent of the slick area was estimated to be 1.8 m thick. Condensate was detected in the upper 20 m of the water column, up to 10 km from the well, in concentrations generally below 100 ppb. The maximum in-water condensate concentration measured was 1.5 ppm. The slick was observed to physically dissipate once the well was capped and there were no visual observations of a residual slick on over-flights the day after capping (day 11 after the blowout) (Martec Limited 1984).
3.4.2.3 Comparison of Modelling Results with Approved 2002 CSR
A general comparison of the new offshore spill modelling results with those presented in the approved 2002 CSR is provided in Table 3.2. In general, the new modelling results present potential impact zones similar to or smaller than those identified in the approved 2002 CSR.
Table 3.2 Comparison of New Modelling Results with Approved 2002 CSR Modelling Results
Spill Scenario New Spill Fate Results Compared to Approved 2002 CSR
Batch Diesel - 10 and 100 barrel Different travel distances (less in most cases) of surface slicks and oil clouds; otherwise fate of oil as in approved 2002 CSR
Batch Condensate - 10 and 100 barrel Different travel distances of surface slicks and oil clouds; otherwise fate of oil as in approved 2002 CSR
Subsea Well Blowouts (various sites) Lower condensate and gas flow rate reduces impact zone sizes when compared to approved 2002 CSR New locations and depths result in insignificant differences in general fate and trajectory when compared to approved 2002 CSR
Surface Well Blowouts (various sites) Lower condensate and gas flow rates reduce impact zone sizes when compared to approved 2002 CSR New locations and depths result in insignificant differences in general fate and trajectory when compared to approved 2002 CSR
Acid Gas Injection Well Blowouts (subsea and surface)
Smaller condensate and gas flows reduce impact zone compared to approved 2002 CSR
Subsea Production Flowline Release Modelled as a mini blowout of full flowline flow release - short-lived event Impact zone sizes similar to new subsea blowout results that are smaller than those presented in the approved 2002 CSR
Subsea Acid Gas Injection Flowline Release Modelled as a mini blowout of full flowline flow release - short-lived event Impact zone sizes similar to new subsea blowout results that are smaller than those presented in the approved 2002 CSR
SOEP Subsea Option Pipeline Release Modelled as a mini blowout of full pipeline flow release - short-lived event Impact zone sizes similar to new subsea blowout results that are smaller than those presented in the approved 2002 CSR

Deep Panuke Volume 4 (Environmental Assessment Report) November 2006 4-1
4 ENVIRONMENTAL MANAGEMENT
Environmental protection is fundamental to EnCana’s operations and forms an integral part of its Environment, Health and Safety (EHS) Management System. EnCana is committed to the implementation of the international best practices for Environmental Management Systems. This section outlines EnCana’s commitment to health, safety and environmental management, with an emphasis on environmental management for the Deep Panuke Project.
4.1 Environmental Management Framework
EnCana’s environmental management framework, shown in Figure 4.1, shows Project-specific plans as an integral part of EnCana’s corporate responsibility policy framework. These plans will be developed and continually revised as the Project moves through the phases of design, construction, installation, production, and decommissioning. Inherent in the environmental management system is the provision for continual improvement, and adaptability to allow the system to respond to environmental challenges so that predicted and actual effects are managed effectively.
Proposed tables of contents for the following plans are provided in Appendix G:
Deep Panuke Spill Response Plan; Deep Panuke Emergency Management Plan (DPEMP); Environmental Effects Monitoring Plan (EEMP); and Environmental Protection Plan (EPP).
This list of environmental plans for the Project has been modified from that presented in Appendix G of the approved 2002 CSR to accurately reflect the current Deep Panuke environmental management system. The EPP will cover practices (referred to as plans in the approved 2002 CSR) such as waste and chemical management, physical environmental monitoring, and activities associated with onshore and offshore construction and decommissioning. EnCana’s Codes of Practice for Sable Island, Country Island and the Gully MPA will also be included in the EPP. The EPP will also affirm EnCana’s adherence to the CNSOPB Compensation Guidelines Respecting Damages Relating to Offshore Petroleum Activity.
Details of the above-mentioned plans will be finalized once the Project design is finalized. The plans will be developed in consultation with the applicable regulatory agencies to ensure that their concerns are addressed in the planning process. Full versions of these plans will be provided to the regulators prior to Project start-up.

Deep Panuke Volume 4 (Environmental Assessment Report) November 2006 4-2
Figure 4.1 Deep Panuke Environmental Management Framework
4.1.1 Corporate Responsibility Policy
EnCana’s Corporate Responsibility Policy is built on the following eight areas of commitment that reflect existing and emerging benchmarks of Corporate Responsibility:
1. Leadership Commitment; 2. Sustainable Value Creation; 3. Governance & Business Practice; 4. Human Rights; 5. Labour Practices; 6. Environment, Health & Safety; 7. Stakeholder Engagement; and 8. Socio-Economic & Community Development.
Under this Policy, EnCana is committed to:
a) safeguarding the environment and operating in a manner consistent with recognized global industry standards in environment, health, and safety;
Corporate Responsibility Policy
EnCana EHS Best Practices Management System
Deep Panuke EHS Management System Guidance Manual
Stakeholder Consultation
Deep Panuke Environmental Effects
Monitoring Plan
Deep Panuke Emergency Management Plan
Deep Panuke EnvironmentalProtection Plan
Deep Panuke Spill Response Plan

Deep Panuke Volume 4 (Environmental Assessment Report) November 2006 4-3
b) striving to make efficient use of resources, to minimize its environmental footprint, and to conserve habitat diversity and the plant and animal populations that may be affected by its operations; and
c) striving to reduce its emissions intensity and increase its energy efficiency.
4.1.2 EHS Best Practice Management System
The EnCana EHS Best Practice Management System is a corporate-wide safety and environmental management system designed to guide all levels of employees, contractors and sub-contractors in achieving the desired level of EHS performance. The ten elements that make up the best practices focus on areas that are applicable to all operating entities within EnCana, and consist of:
1. Leadership; 2. Managing risk; 3. Emergency preparedness and response; 4. Assuring competency; 5. Conducting our business responsibly; 6. Ensuring contractor and supplier performance; 7. Managing incidents; 8. Documentation management; 9. Reporting EHS performance; and 10. Evaluating system effectiveness.
By following the programs, practices and procedures stemming from the best practices, the company meets its required accountabilities and in turn demonstrates sound EHS performance to its stakeholders.
Environmental management expectations and requirements are outlined for each of the ten elements and include the following:
setting of environmental goals and performance objectives, and measurement and communication of performance; environmental risk assessment; emergency response planning and preparedness; training and competency to ensure that employees are aware of and trained on the environmental responsibilities associated with their job activities;practices to ensure environmentally-sound performance throughout the lifecycle of the asset; compliance with permits, regulations and legal requirements; evaluation and selection of third party goods and services for conformance with environmental standards and requirements;

Deep Panuke Volume 4 (Environmental Assessment Report) November 2006 4-4
reporting, investigation and follow-up of environmental incidents; and system audit to identify opportunities for continuous improvement.
4.1.3 Deep Panuke EHS Management System Guidance Manual
The Deep Panuke EHS Management System Guidance Manual provides guidance to project staff in implementing the expectations and requirements of the corporate EHS management system. The environmental component will provide an umbrella for environmental protection planning, environmental monitoring, and stakeholder consultations. It will provide a framework to document, evaluate and communicate Project environmental performance.
4.2 Stakeholder Consultation
Inherent in the EnCana EHS Management System is the provision for stakeholder consultation, especially in relation to environmental issues. Stakeholders for the Deep Panuke Project include regulatory agencies, the fishing industry, non-government organizations, and the general public. With respect to environmental management, effective consultation is crucial for issues such as environmental assessment, EEM, environmental protection, emergency response and compensation.
The objectives of the consultation program for the Deep Panuke Project are as follows:
provide information to the public and interested stakeholders about the proposed Project in a timely fashion; provide opportunities for the public to have input into the Project to identify issues and concerns; provide early and adequate notice of these opportunities for involvement and input; seek advice from the scientific community to enhance environmental management; and develop relationships with the First Nations and Aboriginals and with stakeholders that can lead, where appropriate, to mutually beneficial relationships throughout the life of the Project, and also contribute to communications around other EnCana activities.
Section 5 and Appendices H and I of this EA Report describe the Project’s public consultation and communication program during various stages of the Project.

Deep Panuke Volume 4 (Environmental Assessment Report) November 2006 4-5
4.3 Deep Panuke Emergency Management Plan
The Deep Panuke Emergency Management Plan DPEMP will contain specific provisions for the notification, assessment and response to environmental incidents. Specifically, the DPEMP will provide emergency response command and control functions for both onshore and offshore emergency situations and will cover foreseeable emergencies during all phases of the Deep Panuke Project lifecycle. The DPEMP will take into account hazard identification and assessment, environmental considerations, consultation with government agencies, incorporation of industry best practice and use of external support resources.
4.4 Deep Panuke Spill Response Plan
The Deep Panuke Spill Response Plan will be subset of the DPEMP; the table of contents is shown in Appendix G. The purpose of this plan is to respond to spills that may result during offshore activities related to the development of the Deep Panuke Project. The plan will include planning considerations, response, and spill environmental effects monitoring. EnCana will make arrangements with third-party contractors for onshore spill response and clean-up.
4.5 Deep Panuke Environmental Effects Monitoring Plan
As part of its commitment to adaptive ecosystem management, EnCana will implement an EEMP for the lifecycle of the Project. The EEMP will take into account:
environmental effects predictions in the approved 2002 CSR and this EA Report and resulting CSR;findings of the EEM program; mitigation measures for various effects, and issues that may arise regarding environmental sustainability. The issues to be addressed by EnCana include but are not limited to:
- development of follow-up program principles; - refining the EEMP with updated information on marine birds; - management of spills and effects on marine birds; - influence of lighting and flaring on birds; - development of a program to monitor project effects on the roseate terns; - development of a program to discourage all-terrain vehicle traffic on the pipeline RoW; - verification of the absence of species of special concern; - verification of the impacts of drilling muds and cuttings; - applicability of the national pollutant release inventory;

Deep Panuke Volume 4 (Environmental Assessment Report) November 2006 4-6
- verification of the impacts of produced water discharges; and - consideration of resident organisms in the vicinity of the Project and contaminant
transport.
Specific programs to address these issues will be developed in consultation with the regulatory authorities having jurisdiction in such matters. It is anticipated that this planning process will be managed by the CNSOPB.
4.6 Environmental Protection Plan
EnCana will implement environmental protection measures, which will be documented in an EPP, to mitigate potential environmental effects from its activities. The EPP for EnCana’s Deep Panuke Project will be developed during the detailed engineering phase of the Project in consultation with regulators and key stakeholders. It will be developed to ensure the implementation of EnCana’s environmental commitments. The EPP will be updated as required over the life of the Project and will be consistent with the requirements of the CNSOPB’s regulations and guidelines.
The EPP will include environmental protection procedures for general activities common to all phases in the Project lifecycle. The EPP will cover the various Project phases/activities/procedures to provide clear and specific instruction and guidance to employees and contractors during these short term, but critical, phases of Project development. The EPP will cover practices (referred to as plans in the approved 2002 CSR) such as spill response, waste and chemical management; activities associated with onshore and offshore construction and decommissioning and compensation for fishing and aquaculture vessel and gear damage. Corporate environmental Codes of Practice will also be included in the EPP. The strategy and overall approach to spill response will be dealt with in the DPEMP.
Objectives
The EPP will be developed to provide detailed guidance, in particular for Project personnel (including contractors), on methods of eliminating or minimizing and mitigating adverse environmental effects from the Project. Specific objectives will be to:
ensure that EnCana’s commitments to minimize environmental effects are met; document environmental concerns, applicable legislative requirements and appropriate
protection measures; provide clear and specific guidance to employees and contractors regarding procedures for
protecting the environment and minimizing environmental effect; provide a field-usable, reference document for personnel when planning and/or conducting
specific activities;
Deep Panuke Volume 4 (Environmental Assessment Report) November 2006 4-7
provide for appropriate training of employees/contractors; communicate changes in procedures through the specified revision process; and provide procedures for monitoring compliance with applicable regulations.
Scope
This document is applicable to all EnCana Deep Panuke operations, both offshore and onshore. All EnCana and third party personnel working on the Deep Panuke Project will be required to adhere to the requirements of the EPP. The EPP will be reviewed at least annually during the life of the Project to ensure its effectiveness.
Integration with Deep Panuke EHS Management System
The EPP will be a practical document containing environmental protection requirements and will serve as an important tool in staff orientation and training, and an integral component of environmental inspection under EnCana's Deep Panuke EHS Management System.
Environmental performance will be reviewed throughout the life of the Project. The EPP will reflect the commitments that EnCana has made in the EA Report and other DPA documentation, regulatory conditions of approval, and other regulatory requirements of the Project, and will be a critical tool in understanding and evaluating these commitments.
EPP Requirements
An important aspect of the EPP is environmental compliance monitoring (ECM), which ensures compliance with all regulatory requirements and self-imposed environmental commitments. EnCana will use ECM to monitor performance standards developed for the Project. ECM will primarily involve monitoring for conformance with the discharge limits identified in the OWTG (NEB et al. 2002) and targets set by EnCana.
ECM procedures will be clearly defined in the EPP including sampling protocols, responsibilities, requirements for training, and reporting. The plan will address routine and abnormal conditions and emergencies that can reasonably be anticipated. Specifically, the CNSOPB’s Nova Scotia Offshore Area Petroleum Production and Conservation Regulations stipulate the development of a program to monitor the effects on the natural environment of routine operations of a production installation, and identification of the measures adopted to minimize or mitigate these effects. Compliance monitoring programs ensure that the composition of operational discharges is in accordance with the limits specified in the EPP.

Deep Panuke Volume 4 (Environmental Assessment Report) November 2006 4-8
Contractors’ environmental protection measures for particular scopes of work such as those related to construction and installation activities, will comply with the EPP.
The EPP will also include EnCana’s Codes of Practice for Sable Island, the Gully MPA and Country Island. The intent is to provide requirements for the development and implementation of the Deep Panuke Project so that sensitive and valued local environmental components are protected. All EnCana personnel and its contractors must comply with these Codes. For further detail on these Codes, refer to Appendix G.
Responsibilities
To ensure the successful implementation of environmental protection procedures, the EPP will include a clear description of the roles and responsibilities of all personnel having environmental responsibilities. This description will provide clear direction related to accountability, lines of communication and reporting relationships.
Deep Panuke Volume 4 (Environmental Assessment Report) November 2006 5-1
5 PUBLIC CONSULTATION PROGRAM
5.1 Consultation Program Background and Objectives
A substantial consultation process on the Project took place between 2000 and 2002 as part of the process culminating in the environmental assessment and the submission, review, and Ministerial approval of the CSR in December 2002. A diverse variety of groups and individuals participated, including nearshore and offshore fishing interests, local municipalities and regional development authorities, residents and businesses in the Guysborough County area, scientists, regulatory agencies, environmental non-governmental organizations (ENGOs), and the interested general public. This consultation program facilitated stakeholder input to the preparation of the approved 2002 CSR and Project planning.
Seeking public and stakeholder input remains a core principle of EnCana’s management approach and is a requisite component of CEAA environmental assessment process. Therefore in 2006, as part of the regulatory process for the current application for the revised Project and in accordance with its management practices, EnCana initiated a public consultation program. The purpose of the 2006 round of consultations was to ensure that stakeholders and the interested public received up-to-date information, specifically on the changes proposed by EnCana to the Project. In addition, the consultations were designed to offer the public an opportunity to respond to these Project changes and provide input into Project planning, including finalization of the EA Report.
The consultation program also sought to update information on stakeholder groups relevant to the Project and identify any changes in stakeholders’ activities or areas of interest (commercial, ecological, administrative, or regulatory) since the previous round of consultation four years ago. This process was also intended to advise stakeholders of future opportunities to engage in the regulatory process and form the basis for ongoing communication and consultation during the application review, post application follow-up process, and ultimately, Project construction, operation and decommissioning. EnCana will continue to provide information about the Project to interested stakeholders and to solicit input to avoid or minimize potential adverse effects and enhance positive effects of the Project. In particular, the EA regulatory review will include a public review of the draft Scoping Document from the RAs, an Information Request period on the Deep Panuke regulatory filings, including the EA, and public comments on the 2006 draft CSR.
The 2006 consultation program for the preparation of the EA was largely conducted between July and October 2006. It targeted a similar set of stakeholders as the previous process, but also included several new or emerging organizations that had not been previously consulted. The communications and consultation process involved various forms of interaction including electronic communication, phone contact and interviews, face-to-face interviews and meetings with individuals and small groups, group

Deep Panuke Volume 4 (Environmental Assessment Report) November 2006 5-2
presentations and discussions, as well as a public open house in Isaacs Harbour.1 The consultation program involved activities by EnCana staff and its consultants (the Study Team).
The objectives of the EA consultation program are summarized below:
provide information to the public and interested stakeholders about the proposed Project, with specific focus on Project modifications since the previous round of consultations, in a timely fashion;provide opportunities for the public to have input into the Project to identify issues and concerns, with focus on Project modifications; provide early and adequate notice of these opportunities for involvement and input; obtain updated information on relevant stakeholder activities for Project planning; seek advice from the scientific community to enhance environmental management; and contribute to communications around EnCana activities and to the development of mutually constructive relationships with all EnCana stakeholders.
5.2 Consultation Activities
5.2.1 Public Consultation Stages
In accordance with timelines of the Project development, environmental assessment, and regulatory processes, the public consultation program for the EA was largely concentrated over approximately two months (July to October 2006) and consisted of the following three phases:
Phases I Stakeholder Identification and Preliminary Communications;Phases II Consultation on the Project Description, Issues Identification and Scoping; and Phases III Follow-up and Ongoing Communication.
5.2.2 Phase I - Stakeholder Identification and Preliminary Communications
Identification of stakeholders was based on information gained during the previous consultation process updated by consultation with relevant industry, community and ENGO organizations. This stage included discussion with the Nova Scotia Environmental Network (NSEN) to update identification and invitation of ENGOs to the consultation process. Recommendations from the DFO and the Fisheries Advisory Committee (FAC) of the CNSOPB assisted in providing current information on fisheries and Aboriginal fishing interests. Similarly, communication with the Municipality of the District of Guysborough and the Guysborough County Regional Development Authority (GCRDA) served to
1 An additional Open House is planned for the town of Guysborough, NS on November 8, 2006.

Deep Panuke Volume 4 (Environmental Assessment Report) November 2006 5-3
update information on local community and business stakeholders. This stage of the consultation program involved the following:
establishing initial stakeholder contact; confirming stakeholder contact information and consultation interest; sharing information about the Project, including a preliminary outline and scope of the proposed
Project, and specific identification of new or revised Project elements; providing consultation guides that outline and suggest a consistent format for information
gathering, issues identification and communication of concerns or opinions; identifying and scheduling of appropriate and preferred methods of consultation; and providing early notice of upcoming opportunities for consultation on the Project.
Contact was initiated with most stakeholders through telephone conversations and/or email. A Project overview package consisting of a draft Project description, map, and table summarizing the differences between the approved 2002 CSR Project basis and the revised Project basis (Appendix H) was distributed to all targeted stakeholders. In addition, a consultation guide consisting of a set of preparatory questions for interviews or consultation meetings was customized for various stakeholder groups and sent to them prior to the interviews or consultation session(s) (Appendix H). A consultation record was developed to keep track of all contact with stakeholders and topics raised in consultation to ensure that this input was communicated to the Study Team and EnCana staff.
In general, there was a high degree of success in contacting, communicating with, and scheduling subsequent consultation sessions. Most groups were interested and able to participate during the EA. In some cases, for example with the Sable Island Green Horse Society, it was not possible to arrange in person or phone interviews, but alternative means of sharing Project information and inviting comments were identified. The Ecology Action Centre, a provincial ENGO which had participated in the 2000-2002 consultation process, declined to participate citing frustration with the previous Provincial and Federal regulatory processes regarding energy projects and a decision that costs (both time and personnel) to engage outweighed perceived benefits.
Table 5.1 lists stakeholders contacted during Phase I.

Deep Panuke Volume 4 (Environmental Assessment Report) November 2006 5-4
Table 5.1 Stakeholders Contacted During Phase I Fisheries Groups Area 24 Crab Fisherman’s Association Atlantic Aqua Farms, NS Limited (Country Harbour Sea Farms Ltd) Atlantic Herring Co-operative Clearwater Seafoods Limited Partnership Eastern Fishermen's Federation Eastern Shore Fishermens Protective Association Maritime Fisherman’s Union Local 6Guysborough County Inshore Fishermen's Association Shelburne County Quota Group Nova Scotia Sword Fishermen’s Association Seafood Producers Association of Nova Scotia (SPANS) Sambro Fisheries Limited Nova Scotia Fixed Gear 45-65 Scotia Fundy Mobile Gear Fishermen’s Association Sea urchin harvester (McGrath, Manthorne) Environmental Non-Governmental Groups (ENGOs) Canadian Parks and Wilderness Society Clean Nova Scotia Foundation Coastal Coalition Coastal Communities Network Ecology Action Centre World Wildlife Fund Sierra Club of Canada Sable Island Green Horse Society Sable Island Stakeholder Committee Nova Scotia Leatherback Turtle Working Group Nova Scotia Environmental Network Government Natural Resources Canada Department of Fisheries and Oceans Nova Scotia Department of Agriculture and Fisheries Guysborough County Regional Development Authority Municipality of the District of Guysborough Aboriginal Groups Maritime Aboriginal Aquatic Resources Secretariate Each of the Chiefs of the thirteen (13) Bands in Nova Scotia (Appendix I) Confederacy of Mainland Mi’kmaq (Appendix I) Union of Nova Scotia Indians (Appendix I)

Deep Panuke Volume 4 (Environmental Assessment Report) November 2006 5-5
5.2.3 Phase II – Consultation on the Project Description, Issues Identified and Scoping
Consultations with stakeholders took place largely between late July and October 2006. To the degree feasible, consultation sessions were customized to the needs, interests and preferences of the stakeholders, both in terms of format and content. The main content of the consultation sessions consisted of the following:
explaining the scope of the revised Project and alterations or refinements in design compared to the approved 2002 CSR Project basis; outlining the two Project options for gas (and potentially condensate) export currently under consideration and their implications; identifying the relationship between Project revisions and associated prospective changes to environmental or socio-economic impacts and mitigation measures; discussing the environmental and socio-economic assessment, and regulatory processes with most attention to issues identification and scoping;gathering information about ways in which the needs and interests of stakeholders might have changed since the last round of consultations; gathering information about any new or priority concerns or issues stakeholders might have regarding the Project; recording and communicating the issues identified by stakeholders to the appropriate members of the Study Team and to EnCana staff, for consideration, response, clarification or action;outlining the future regulatory process and schedule, including informing stakeholders as to future opportunities to offer input into this process; andclarifying expectations regarding future and ongoing communications.
A summary of the consultation activities is provided below; details are provided in Appendix H:
Two meetings were held with DFO (July 25 and August 9, 2006) to introduce the Project, address any comments, and determine the best way to gather information required for the EA, as well as how best to consult with other fisheries, scientific and other stakeholders.
Several meetings were held with the Municipality of Guysborough and the GCRDA (between August and October 2006) to discuss Project plans, particularly the evaluation of routing options onshore, interactions with other land uses and plans, economic benefits and potential local access to gas for further industrial development.

Deep Panuke Volume 4 (Environmental Assessment Report) November 2006 5-6
A meeting was held with ENGO representatives (August 15, 2006) to review the Project plan and discuss design and implementation of Project options, with particular focus on potential interactions with or impacts on valued environmental components. A number of questions, concerns and issues were brought forward. Some were discussed or answered during the meeting. Others were referred for future response or directed to the Study Team or EnCana staff for consideration and potential inclusion in assessment studies. Eight of ten invited ENGOs were represented at this meeting.
Fisheries and aquaculture interests were interviewed via telephone and in person meetings. Approximately ten substantive phone conversations or interviews were conducted and six face-to-face consultation meetings or group presentations (in Halifax, Goldboro, Truro, and Sherbrooke) took place with fishing stakeholders to inform them of the revised Project design and solicit input.
One Open House was advertised and held in the Goldboro area (Isaacs Harbour Fire Hall) on September 13, 2006. The presentation included story boards and maps of the Project; including key facts, figures and processes, and of the existing onshore and nearshore environment. These encompassed offshore and onshore Project facilities, pipelines and tie-ins (for both options), Project location and spatial extent, data on fisheries and aquaculture in the Project area, regulatory processes and timelines. Approximately 75 participants attended and were provided takeaway information on the Project and given the opportunity to provide comment through conversation with members of the Study Team and EnCana staff and/or through written comments. Staff in attendance recorded comments and questions for consideration in Project planning, environmental and socio-economic assessment, or to ensure follow-up. An additional Open House is to be held in the town of Guysborough on November 8, 2006. A meeting was held with the FAC of the CNSOPB on September 13, 2006. An update was provided on the Project plan, including a discussion of design and implementation of Project options. Discussions with fisheries stakeholders focussed on the regulatory process, consultation, environmental management, and environmental effects monitoring (EEM).
The input and comments received through this program were broad ranging and reflected a variety of perspectives about the value, need and scope of the Project, and about oil and gas development offshore Nova Scotia generally. Various perspectives were also recorded regarding preference or issues associated with the two export pipeline options. This input was incorporated into the environmental and socio-economic assessment process. Key topics raised are listed in Section 5.3 and addressed as appropriate in the relevant EA sections.

Deep Panuke Volume 4 (Environmental Assessment Report) November 2006 5-7
5.2.4 Phase III - Follow-up and Ongoing Communication
Pursuant to the initial set of consultations, EnCana staff and the Study Team continued follow-up and ongoing communication. Follow-up consisted primarily of responses to requests for information or concerns raised during the consultations. During the consultations, EnCana informed stakeholders as to the ways in which they can continue to give input into the Project during subsequent stages in the regulatory process (e.g., review of the EA Report). EnCana will continue to proactively communicate about the Project with interested stakeholders and will provide supplementary information as part of this ongoing process. In general, EnCana remains committed to communication concerning public and stakeholder concerns and the development of mutually constructive relationships.
5.2.5 Aboriginal Communications
The goal of communications with Aboriginal groups is to establish relationships and initiate discussions with respect to the currently proposed Project and to highlight the findings and conclusions of the approved 2002 CSR, respecting Aboriginal related matters, as well as EnCana’s commitments on Aboriginal matters in its 2002 Project submissions. EnCana’s current Aboriginal communication program (the Program) has been undertaken with the advice and recommendation of the Province of Nova Scotia, with guidance from the Province’s draft policy on consultations with the Mi’kmaq, dated June 14, 2006.
The first phase of the Program was to identify the Aboriginal groups who may have an interest in the Project and establishing initial contact with such groups. For that purpose, introductory letters (see Appendix I) were sent to the following organizations in July, 2006:
each of the Chiefs of the thirteen (13) Bands in Nova Scotia (Appendix I); the Confederacy of Mainland Mi’kmaq (Appendix I); and the Union of Nova Scotia Indians (Appendix I).
EnCana received a reply (see Appendix I) to the introductory letters to the aforementioned groups from the Lead Negotiator for the Planning and Priorities Committee of the Assembly of Nova Scotia Mi’kmaq Chiefs, advising that the legal entities entitled to engage in consultation issues are the 13 First Nations through their Chiefs and Councils and that the Lead Negotiator acts on their behalf in such matters through a delegated authority granted by Band Council Resolution by one or more Chief and Councils.
Deep Panuke Volume 4 (Environmental Assessment Report) November 2006 5-8
EnCana replied to the Lead Negotiator (see Appendix I) advising, among other things, of a prior Technical and Ecological Knowledge survey carried out in an area where the Deep Panuke onshore pipeline is anticipated to be located and of EnCana's commitments to Aboriginal people in its approved 2002 CSR to include Aboriginal representatives in pipeline right-of-way inspections.
EnCana also consulted with the Maritime Aboriginal Aquatic Resources Secretariate (MAARS) with respect to potential fisheries interactions with the Project.
5.3 Integration of Issues and Concerns into Project Planning
Through the preliminary communications, stakeholder meetings (including fisheries and ENGO sessions), phone conversations, written submissions, and Open House, EnCana gathered a wide range of questions, issues and concerns. EnCana was able to identify a number of key issues requiring further evaluation and attention. The key topics raised were organized into the following categories:
acid gas injection technology and sour gas; offshore pipeline/flowlines routing and installation; onshore pipeline routing and installation; drilling activities and use of drilling muds; effects on fishing activities; offshore safety zone, dimensions and fishing restrictions; effects on the ecosystem, particularly benthic communities, species at risk and commercial
species; air quality impacts; impacts associated with greater levels of produced water; health and safety of workers and nearby fishers; large scale or consequential accidental or emergency events and spills; cumulative effects such as climate change; economic benefits, employment and training; monitoring of impacts; and residual effects resulting from and following decommissioning.

Deep Panuke Volume 4 (Environmental Assessment Report) November 2006 5-9
Questions, issues and concerns identified through the consultation process were tracked and forwarded to the appropriate EnCana personnel and consultants for consideration in Project planning and the environmental assessment. These inputs have been utilized to:
identify the environmental and socio-economic issues of concern and to incorporate relevant issues into the assessment;
improve Project planning and/or Project design; and supplement information and knowledge of the biophysical and socio-economic environment to
enhance mitigation strategies.
EnCana has responded to issues and concerns brought forward by stakeholders in a variety of ways, including immediate response at Open Houses and meetings, follow-up communications, and within the EA Report. Table 5.2 outlines the means by which issues and concerns have been addressed. As detailed planning proceeds, EnCana is committed to continuing discussions with stakeholders and the public.
Table 5.2 Integration of Key Issues Overview
Issue and Primary Concerns ResponseNeed to retain access to the quahog resource and concern over potential contamination.
The impact on the new quahog fishery is assessed in Section 9.3. Clearwater has indicated that quahogs would be harvested intensively from the offshore project area on Sable Island Bank prior to the start of construction. The potential for effects on this fishery will be limited due to the long period (15-20 years) for quahogs to reach commercial size.
Maintaining access to the fisheries is a primary concern. The main pipeline should be trawlable.
The impact on fisheries due to potential loss of access is assessed in Section 9.3. During operations, the safety zone around the MOPU, flowlines and subsea wellheads will exclude fishing activity, and this zone will be marked on nautical charts. The portions of the M&NP Option pipeline from landfall to KP22 and from KP110 to the MOPU (see Section 2) will be buried, as will the entire SOEP Subsea Option pipeline. With respect to exposed sections, the export pipeline is designed to withstand impacts from conventional mobile fishing gear in accordance with the DNV Guideline No. 13, Interference Between Trawl Gear and Pipelines, September 1997. There will be no fishing restrictions over the export pipeline (except the area immediately around the subsea connection to the SOEP pipeline for the SOEP Subsea Option). In the event there is hang-up or damage to gear, EnCana will adopt the CNSOPB Compensation Guidelines Respecting Damages Relating to Offshore Petroleum Activity.

Deep Panuke Volume 4 (Environmental Assessment Report) November 2006 5-10
Table 5.2 Integration of Key Issues Overview
Issue and Primary Concerns ResponseNeed to evaluate impacts of accidental release of hydrogen sulphide from the injection well and/or feeder line. Concern over potential impact on fish.
The potential effects of an accidental release of hydrogen sulphide on Air Quality (Section 8.1) and Marine Fish (Section 8.4) were evaluated. A blowout resulting in the release of large quantities of acid gas from an injection well and/or their corresponding flowlines could result in a significant adverse short-term effect to air quality, and could result in important consequences affecting the health and safety of workers on the MOPU and vessels within up to 6 km. However, such an event would be both extremely unlikely (see Section 3.2) and of short duration, with the probability of occurrence further reduced through good design practices and maintenance. EnCana will develop and implement the DPEMP (see Appendix G) to minimize the potential adverse effects on air quality and human health and safety. Any H2S in solution would be rapidly diluted to background levels and oxidized into less toxic chemical species. Therefore, as stated in Section 8.2.4.4, a subsea release of H2S is unlikely to cause significant adverse effects on marine fish and invertebrates.
Potential concern over produced water impacts on marine biota, including fish reproduction and development. Produced water discharge should be monitored regularly.
The potential effects of produced water on water quality (Section 8.2), marine benthos (Section 8.3), marine fish (Section 8.4) and marine related birds (Section 8.6) were assessed. Produced water will be treated on several levels on the platform prior to disposal (Section 2.4.1.9). The target dispersed oil concentration after treatment is 25 mg/L (30-day weighted average), below the OWTG limit of 30 mg/L. Also, the concentrations of amines and TEG in the produced water at the discharge outlet are below those concentrations that would impact marine species. Prior to discharge, the produced water will mix with approximately 2,400 m3/hr of seawater, further greatly reducing the concentrations of potential deleterious substances.
Need to make EEM reports and monitoring data available to the public as soon as possible.
EnCana will develop the offshore EEMP in collaboration with key regulatory agencies led by the CNSOPB. The EEM data will be required to be made public.
If horizontal directional drilling (HDD) is chosen in nearshore landfall area, there is concern that vibration will affect the lobster catch rates.
There is uncertainty regarding the impacts of HDD on lobster distribution and behaviour because of a lack of research; thus, EnCana will commit to avoiding the use of HDD during the nearshore lobster fishing season.
During construction and operations, need to communicate plans early with fishing companies including vessel captains so that fisheries can be better coordinated around EnCana's activities.
During construction, a Notice to Mariners will be issued to advise all ship captains of EnCana’s schedule and areas of activity. In addition, EnCana will communicate this information directly to managers of fishing organisations to facilitate fisheries planning. During operations, the safety zone around the MOPU, flowlines, and subsea wellheads excludes fishing activity. There will be no safety zones over the export pipeline, although there will be fishing restrictions over the subsea connection to the SOEP pipeline (SOEP Subsea Option). These zones will be marked on nautical charts.
Issue with pipes and flowlines remaining in the ground after decommissioning, rather than complete removal of all infrastructure.
Although regulatory requirements could change prior to the time of decommissioning and abandonment, current plans are for the pipeline, flowlines and umbilicals to be abandoned in place in compliance with applicable drilling and offshore regulations and according to standard international practice.
Multi-stakeholder monitoring advisory system desired.
EnCana will develop an offshore EEMP in collaboration with key regulatory agencies led by the CNSOPB.

Deep Panuke Volume 4 (Environmental Assessment Report) November 2006 5-11
Table 5.2 Integration of Key Issues Overview
Issue and Primary Concerns ResponsePotential impacts of drill mud and cuttings, including concern with the use of barite and the impacts of bio-available forms of mercury (methyl mercury) on the food chain.
The potential effects of barite used in drilling muds on the marine benthos were previously assessed in the approved 2002 CSR (see Section 6.3.3.4). The effects were predicted to be not significant. The results of the assessment remain valid. Barite is typically used to increase the density of drilling fluid. The type of drilling fluids used for Deep Panuke will be salt-based and the density will be adjusted by increasing the concentration of salt in the drilling fluid. Therefore, the use of barite will be minimized and generally only used for the preparation of high density slugs to pull the drill pipe out of the hole. Mercury occurs naturally in very small quantities in barite. The levels of mercury measured at drilling and production sites off the East Coast of Canada have consistently been very low. Furthermore, studies from the Florida Institute of Technology (Trefry et al. 1996) concluded that mercury introduced with barite during offshore drilling cannot be directly linked to enhanced levels of its bioavailable form, methyl mercury.
Request for an EnCana funded independent environmental monitoring program.
EnCana will develop the offshore EEMP in collaboration with key regulatory agencies led by the CNSOPB.
Need for EA to assess cumulative impacts such as impacts of the project on climate change and impacts of climate change on the Project.
The CEA Agency’s Guidelines for Incorporating Climate Change Considerations in Environmental Assessments requires that climate change be taken into consideration in the EA. The cumulative effect of the Project on climate change due to the emission of greenhouse gases is evaluated in Section 8.9. The estimated contribution of the Deep Panuke Project to total estimated GHG by all Canadian human-made sources is extremely small (0.3% of 2003 Canadian totals). Of note, the choice of acid gas injection incorporates permanent disposal of a significant quantity of CO2 that would otherwise be emitted to the atmosphere during hydrocarbon production. EnCana is committed to investigating other GHG reduction opportunities that arise during the Project. With respect to the effects of the environment on the Project (Section 10), facilities will be designed and installed based on the appropriate environmental design criteria to ensure the safety and integrity of these facilities during severe environmental conditions. The design of the structures incorporates an adequate factor to safely deal with anticipated changes in weather severity during the lifetime of the Project, including storms and sea level rise associated with climate change.
Impacts on biologic communities associated with authigenic-carbonates (communities and ecosystems that have been found to thrive on the natural off-gassing of oil and gas from the bottom of the ocean).
There are no known biologic communities associated with authigenic-carbonates in the Study Area, nor are there any known areas that could potentially support such communities.
Impacts of flares on migratory birds and consideration of protective shielding.
The potential impact of flaring events on marine related birds was assessed in the approved 2002 CSR (see Section 6.3.6.4), and predicted to be not significant.
Monitoring of invertebrate and other migrating pelagic species (e.g., jellyfish, mackerel, and herring) as an important part of the food chain to species at risk such as the leatherback turtles.
Observers will be used to monitor project activities, as required. In addition, it is expected that the EEM program will include monitoring of sentinel species, including fish and invertebrate species that may aggregate around the MOPU.
Observer data not always adequate (turtles have been grossly underestimated through aerial surveys). Options such as remote subsurface surveys should be considered.
In addition to observer data, there will be periodic ROV platform and pipeline videocamera surveys. Any sightings of species encountered will be reported as part of the EEM program.

Deep Panuke Volume 4 (Environmental Assessment Report) • November 2006 5-12
Table 5.2 Integration of Key Issues Overview
Issue and Primary Concerns ResponseDemonstrating the relationship between EnCana and the ESSIM process goals.
The Project is consistent with the current ESSIM work, including the defined management actions and strategies. Furthermore, EnCana’s continued active involvement in the ESSIM process will help ensure that Project activities take place in the larger context of integrated ocean management planning and activities of other ocean users.
Pipeline is a concern as it may affect marine life. This includes disturbance of the sea bottom during construction and the potential for the release of toxic sediments.
The potential effects of the installation of the export pipeline on the marine benthos are evaluated in the approved 2002 CSR and in Section 8.3. Adverse effects are predicted to be not significant. New information has become available with respect to nearshore sediment contamination in Isaacs Harbour. Research conducted by NRCan to determine the impacts of historical mine tailings disposal on marine sediments show that the sediments at some sampling sites contain elevated levels of arsenic and mercury (see Section 7.1). However, the sampling points nearest the proposed nearshore pipeline corridor show much lower concentrations, and sampling during the 2001 nearshore pipeline route survey found no evidence of sediment contamination. Therefore, it is not expected that contaminated sediments will be encountered.
Potential interference between the proposed EnCana routing onshore and Keltic/Maple facilities. Corridor reserved for EnCana may overlap with Keltic/Maple land option and existing wetlands.
EnCana is in discussions with landowner(s) to finalize the routing of the onshore pipeline and location of associated onshore facilities. EnCana’s preference is to minimize environmental effects through avoidance of wetlands and other sensitive onshore environmental features. EnCana will ensure that all contractors adhere to an EPP during installation of the onshore facilities.
Introduction of exotic species (e.g.tunicates) via foreign vessels, which are known to foul mussel aquaculture gear. Require that vessels clean hulls before they come into coastal areas.
To date, there are no confirmed records of fouling of mussel aquaculture gear by tunicates in the nearshore Goldboro area (B. Hancock, Aqua Sea Farms, pers.comm. 2006). EnCana will ensure that all foreign vessels will replace their ballast water at sea before entering Canadian waters. It is neither feasible nor required for foreign vessels to have their hulls cleaned before they enter Canadian coastal waters.
Concerned that air quality be maintained, and avoiding the release of sulphur into the environment.
The potential effects of the Project on air quality were evaluated (Section 8.1). The only predicted significant adverse effect is with respect to the unlikely event of a well blowout or piping rupture resulting in the release of large amounts of acid gas. Such an event could have health and safety consequences for platform workers and individuals on vessels downwind. Design prevention measures, rendering such an event extremely unlikely, and emergency response contingency planning will further reduce the likelihood of significant adverse effects.
EnCana should work toward an agreement on principles of cooperation with fisheries interests.
EnCana’s public communications and consultation program will continue through all phases of the Project. EnCana prefers to continue its commitment to consult with stakeholders, including fisheries interests, and respond to inquiries as appropriate.

Deep Panuke Volume 4 (Environmental Assessment Report) • November 2006 5-13
Table 5.2 Integration of Key Issues Overview
Issue and Primary Concerns ResponseAboriginal use of the study area for traditional purposes - of particular interest is underwater archaeology, especially in the nearshore landfall area
The Mi’kmaq Ecological Knowledge Study included in the Keltic/Maple EA reported that Mi’kmaq people currently undertake traditional use activities throughout the onshore study area (e.g., fishing, hunting, overnight camps.Experts from the Mi’kmaq Fish and Wildlife Commission, the Membertou Corporate Division, and Davis Archaeological Consultants have indicated that the proposed Deep Panuke onshore pipeline corridor and marine landfall area were not of high importance for traditional land use by the Mi’kmaq primarily since this site is far removed from the concentrations of Mi’kmaq population and the very short (2-4 km) onshore pipeline route should not pose any concerns. EnCana will invite aboriginal groups to review the applicability of these Mi’kmaq land use studies/opinions for the revised Deep Panuke Project and to arrange for a representative to monitor onshore and nearshore marine pipeline construction activities in conjunction with a professional archaeologist.
Economic benefits/opportunities for Mi'kmaq communities and people
EnCana will contract an Aboriginal liaison person/company to work with Aboriginal communities, businesses and individuals to ensure fair opportunity for contracts and services – based on competitiveness and the ability to meet EnCana’s standards.

Deep Panuke Volume 4 (Environmental Assessment Report) November 2006 6-1
6 IMPACT ASSESSMENT SCOPE AND METHODS
This EA Report has been prepared to meet the requirements of CEAA as well as the Scope of Environmental Assessment (CEA Agency 2006). In particular, the assessment addresses the specific requirements for a CSR pursuant to CEAA.
6.1 Scope of the Assessment
As discussed in Section 1.4, this EA Report has been prepared to address the following scope:
Variations between the revised Project basis and the Project basis presented in the approved 2002 CSR (Table 6.1); Changes to the regulatory environment since the approved 2002 CSR (Table 6.2); Changes to the biophysical environment since the approved 2002 CSR (Table 6.3); and Changes to the socio-economic environment since the approved 2002 CSR (Table 6.4).
Tables 6.1 to 6.4 present these variations and updates from the approved 2002 CSR. These variations and updates were identified through a review of the revised Project options, regulatory and stakeholder consultation (refer to Section 5), background research, and professional judgement of the Study Team. The purpose of this scoping exercise was to clearly define the scope of the assessment (i.e., identify gaps from the approved 2002 CSR) and identify issues that require reconsideration in the updated EA Report.
6.2 Selection of Valued Environmental Components
An important part of the assessment process is the early identification of key biophysical and socio-economic issues, known collectively as the valued environmental components (VECs) upon which the assessment will be focussed. Issues scoping is an important part of the VEC identification process. The issues scoping exercise for this EA Report included a review of Project changes, regulatory updates, biophysical updates, and socio-economic updates, as defined in Section 6.1. Issues scoping also included regulatory and stakeholder consultation; background research; and professional judgment of the Study Team. Table 6.5 presents the rationale for the selection of VECs, along with other scoping considerations.
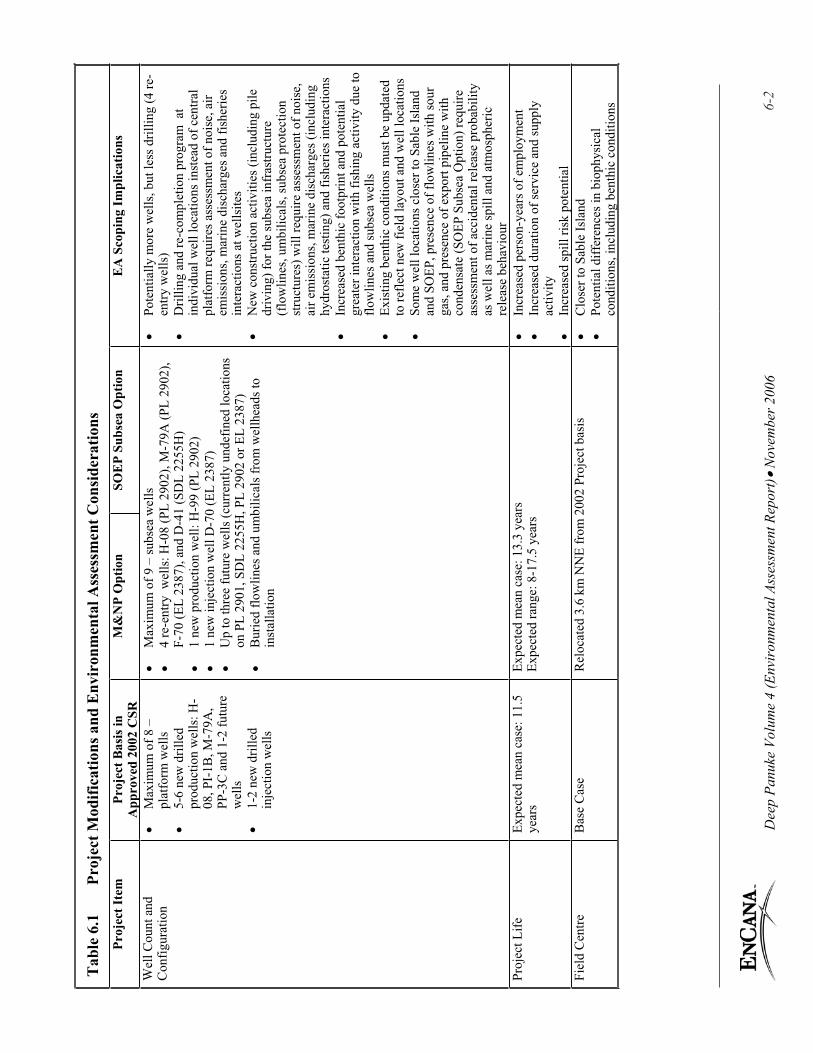
Dee
p Pa
nuke
Vol
ume
4 (E
nvir
onm
enta
l Ass
essm
ent R
epor
t) N
ovem
ber 2
006
6-2
Tab
le 6
.1
Proj
ect M
odifi
catio
ns a
nd E
nvir
onm
enta
l Ass
essm
ent C
onsi
dera
tions
Pr
ojec
t Ite
m
Proj
ect B
asis
in
App
rove
d 20
02 C
SR
M&
NP
Opt
ion
SOE
P Su
bsea
Opt
ion
EA
Sco
ping
Impl
icat
ions
Wel
l Cou
nt a
nd
Con
figur
atio
n M
axim
um o
f 8 –
pl
atfo
rm w
ells
5-
6 ne
w d
rille
d pr
oduc
tion
wel
ls: H
-08
, PI-
1B, M
-79A
, PP
-3C
and
1-2
futu
re
wel
ls1-
2 ne
w d
rille
d in
ject
ion
wel
ls
Max
imum
of 9
– su
bsea
wel
ls
4 re
-ent
ry w
ells
: H-0
8 (P
L 29
02),
M-7
9A (P
L 29
02),
F-70
(EL
2387
), an
d D
-41
(SD
L 22
55H
) 1
new
pro
duct
ion
wel
l: H
-99
(PL
2902
) 1
new
inje
ctio
n w
ell D
-70
(EL
2387
) U
p to
thre
e fu
ture
wel
ls (c
urre
ntly
und
efin
ed lo
catio
ns
on P
L 29
01, S
DL
2255
H, P
L 29
02 o
r EL
2387
) B
urie
d flo
wlin
es a
nd u
mbi
lical
s fro
m w
ellh
eads
to
inst
alla
tion
Pote
ntia
lly m
ore
wel
ls, b
ut le
ss d
rillin
g (4
re-
entry
wel
ls)
Dril
ling
and
re-c
ompl
etio
n pr
ogra
m a
t in
divi
dual
wel
l loc
atio
ns in
stea
d of
cen
tral
plat
form
requ
ires a
sses
smen
t of n
oise
, air
emis
sion
s, m
arin
e di
scha
rges
and
fish
erie
s in
tera
ctio
ns a
t wel
lsite
s N
ew c
onst
ruct
ion
activ
ities
(inc
ludi
ng p
ile
driv
ing)
for t
he su
bsea
infr
astru
ctur
e (f
low
lines
, um
bilic
als,
subs
ea p
rote
ctio
n st
ruct
ures
) will
requ
ire a
sses
smen
t of n
oise
, ai
r em
issi
ons,
mar
ine
disc
harg
es (i
nclu
ding
hy
dros
tatic
test
ing)
and
fish
erie
s int
erac
tions
In
crea
sed
bent
hic
foot
prin
t and
pot
entia
l gr
eate
r int
erac
tion
with
fish
ing
activ
ity d
ue to
flo
wlin
es a
nd su
bsea
wel
ls
Exis
ting
bent
hic
cond
ition
s mus
t be
upda
ted
to re
flect
new
fiel
d la
yout
and
wel
l loc
atio
ns
Som
e w
ell l
ocat
ions
clo
ser t
o Sa
ble
Isla
nd
and
SOEP
, pre
senc
e of
flow
lines
with
sour
ga
s, an
d pr
esen
ce o
f exp
ort p
ipel
ine
with
co
nden
sate
(SO
EP S
ubse
a O
ptio
n) re
quire
as
sess
men
t of a
ccid
enta
l rel
ease
pro
babi
lity
as w
ell a
s mar
ine
spill
and
atm
osph
eric
re
leas
e be
havi
our
Proj
ect L
ife
Expe
cted
mea
n ca
se: 1
1.5
year
sEx
pect
ed m
ean
case
: 13.
3 ye
ars
Expe
cted
rang
e: 8
-17.
5 ye
ars
Incr
ease
d pe
rson
-yea
rs o
f em
ploy
men
t In
crea
sed
dura
tion
of se
rvic
e an
d su
pply
ac
tivity
In
crea
sed
spill
risk
pot
entia
l Fi
eld
Cen
tre
Bas
e C
ase
Rel
ocat
ed 3
.6 k
m N
NE
from
200
2 Pr
ojec
t bas
is
Clo
ser t
o Sa
ble
Isla
nd
Pote
ntia
l diff
eren
ces i
n bi
ophy
sica
l co
nditi
ons,
incl
udin
g be
nthi
c co
nditi
ons

Dee
p Pa
nuke
Vol
ume
4 (E
nvir
onm
enta
l Ass
essm
ent R
epor
t) N
ovem
ber 2
006
6-3
Tab
le 6
.1
Proj
ect M
odifi
catio
ns a
nd E
nvir
onm
enta
l Ass
essm
ent C
onsi
dera
tions
Pr
ojec
t Ite
m
Proj
ect B
asis
in
App
rove
d 20
02 C
SR
M&
NP
Opt
ion
SOE
P Su
bsea
Opt
ion
EA
Sco
ping
Impl
icat
ions
Bas
e St
ruct
ure
Thre
e fix
ed p
latfo
rms
incl
udin
g:
Prod
uctio
n pl
atfo
rm
Util
ities
/qua
rters
pl
atfo
rm
Wel
lhea
d pl
atfo
rm
1 M
OPU
In
tegr
ated
faci
lity
MO
PU c
lose
r to
Sabl
e Is
land
than
pla
tform
s in
200
2 Pr
ojec
t bas
is
Less
ves
sel/h
elic
opte
r tra
ffic
dur
ing
cons
truct
ion
and
deco
mm
issi
onin
g Sh
orte
r dur
atio
n of
con
stru
ctio
n an
d de
com
mis
sion
ing
activ
ities
Sm
alle
r ben
thic
foot
prin
t N
o pi
le d
rivin
g w
ith M
OPU
inst
alla
tion
N
ew fl
are
heig
ht /
loca
tion
requ
ires n
ew a
ir di
sper
sion
mod
ellin
g D
isch
arge
of M
uds /
C
uttin
gs fo
r New
Wel
ls
Dril
led
from
fiel
d ce
ntre
WB
M/c
uttin
gs
over
boar
d SB
M/c
uttin
gs sk
ippe
d an
d sh
ippe
d or
in
ject
ed
Dril
led
from
indi
vidu
al w
ell l
ocat
ions
W
BM
/cut
tings
ove
rboa
rd
No
SBM
Smal
ler i
ndiv
idua
l cut
tings
pile
s loc
ated
at
indi
vidu
al w
ell l
ocat
ions
rath
er th
an la
rger
pi
le a
t the
fiel
d ce
ntre
O
vera
ll sm
alle
r vol
ume
of d
isch
arge
d m
ud
and
cutti
ngs
Del
iver
y Po
int
M&
NP
tie-in
O
nsho
re, a
djac
ent t
o SO
EP
SOEP
subs
ea ti
e-in
SO
EP 6
60 m
m [2
6 in
ch] p
ipel
ine
SOEP
subs
ea ti
e-in
requ
ires a
sses
smen
t of
nois
e em
issi
ons (
pile
driv
ing)
, fis
herie
s in
tera
ctio
n an
d sp
ill e
xpos
ure
Ons
hore
pip
elin
e co
rrid
or h
as b
een
mod
ified
du
e to
pla
nned
Kel
tic/M
aple
Pro
ject
nea
r G
oldb
oro;
how
ever
, will
stay
with
in th
e as
sess
ed O
nsho
re S
tudy
Are
a/G
oldb
oro
Indu
stria
l Par
k in
the
appr
oved
200
2 C
SR

Dee
p Pa
nuke
Vol
ume
4 (E
nvir
onm
enta
l Ass
essm
ent R
epor
t) N
ovem
ber 2
006
6-4
Tab
le 6
.1
Proj
ect M
odifi
catio
ns a
nd E
nvir
onm
enta
l Ass
essm
ent C
onsi
dera
tions
Pr
ojec
t Ite
m
Proj
ect B
asis
in
App
rove
d 20
02 C
SR
M&
NP
Opt
ion
SOE
P Su
bsea
Opt
ion
EA
Sco
ping
Impl
icat
ions
Expo
rt Pi
pelin
e 61
0 m
m [2
4 in
ch],
176
km
Sing
le p
hase
Tr
ench
ed ~
50%
of
rout
e
560
mm
[22
inch
], 17
6 km
Si
ngle
pha
se
Tren
ched
~ 5
0% o
f ro
ute
510
mm
[20
inch
], 15
km
M
ulti-
phas
e Tr
ench
ed 1
00%
of
rout
e
Con
stru
ctio
n ac
tiviti
es fo
r the
SO
EP S
ubse
a O
ptio
n pi
pelin
e an
d ne
w p
ortio
n of
pip
elin
e ro
ute
for t
he M
&N
P O
ptio
n w
ill re
quire
as
sess
men
t of n
oise
, air
emis
sion
s, m
arin
e di
scha
rges
, im
pact
on
bent
hic
habi
tat a
nd
fishe
ries i
nter
actio
ns
SOEP
Sub
sea
Opt
ion
pipe
line
and
new
po
rtion
of p
ipel
ine
rout
e fo
r the
M&
NP
Opt
ion
(due
to n
ew lo
catio
n of
fiel
d ce
ntre
) in
tera
ct w
ith n
ew fi
shin
g gr
ound
SO
EP S
ubse
a O
ptio
n m
ulti-
phas
e (c
onde
nsat
e/ga
s) p
ipel
ine
requ
ires a
sses
smen
t fo
r spi
ll ris
k pr
obab
ility
and
spill
fa
te/b
ehav
iour
N
ew re
leas
e po
ints
for h
ydro
stat
ic te
st w
ater
s of
pip
elin
e du
e to
fiel
d ce
ntre
relo
catio
n an
d SO
EP su
bsea
tie-
in; i
ncre
ased
con
cent
ratio
ns
of h
ydro
stat
ic te
st w
ater
s (e.
g., n
o di
lutio
n at
su
bsea
tie-
in re
leas
e po
int)
Expo
rt G
as
11.3
x 1
06m
3 /day
[4
00 M
Msc
fd]
Sale
s qua
lity
8.5
x 10
6m3 /d
ay [3
00
MM
scfd
] [at
pla
teau
pr
oduc
tion
rate
] Sa
les q
ualit
y
8.5
x 10
6 m
3 /day
[3
00 M
Msc
fd]
Swee
t and
deh
ydra
ted
N/A
Expo
rt C
onde
nsat
e N
/A
Max
imum
of 2
20
m3 /d
ay
Swee
t and
stab
ilize
d,
com
min
gled
with
gas
SOEP
Sub
sea
Opt
ion
mul
ti-ph
ase
pipe
line
will
requ
ire sp
ill ri
sk a
sses
smen
t
Con
dens
ate
Use
Fu
el, s
urpl
us in
ject
ed
Sale
s pro
duct
SO
EP S
ubse
a O
ptio
n w
ill p
rovi
de c
onde
nsat
e to
be
proc
esse
d as
val
ue-a
dded
pro
duct

Dee
p Pa
nuke
Vol
ume
4 (E
nvir
onm
enta
l Ass
essm
ent R
epor
t) N
ovem
ber 2
006
6-5
Tab
le 6
.1
Proj
ect M
odifi
catio
ns a
nd E
nvir
onm
enta
l Ass
essm
ent C
onsi
dera
tions
Pr
ojec
t Ite
m
Proj
ect B
asis
in
App
rove
d 20
02 C
SR
M&
NP
Opt
ion
SOE
P Su
bsea
Opt
ion
EA
Sco
ping
Impl
icat
ions
Prod
uced
wat
er
Max
imum
1,1
00 to
1,
600
m3 /d
ay [7
000
to
10,0
00 b
pd]
Dis
char
ged
over
boar
d
Max
imum
6,4
00 m
3 /day
[40,
000
bpd]
D
isch
arge
d ov
erbo
ard
Pote
ntia
lly h
ighe
r pro
duce
d w
ater
dis
char
ge
rate
requ
ires n
ew d
ispe
rsio
n m
odel
ling
and
cons
ider
atio
n in
term
s of e
ffec
ts o
n m
arin
e V
ECs
New
rele
ase
poin
t due
to fi
eld
cent
re
relo
catio
n
Dilu
tion
with
coo
ling
wat
er h
as c
hang
ed d
ue
to g
reat
er p
rodu
ced
wat
er ra
te a
nd lo
wer
co
olin
g w
ater
rate
A
cid
Gas
D
edic
ated
inje
ctio
n w
ell
~180
x 1
03 m3 /d
ay [6
M
Msc
fd]
Ded
icat
ed in
ject
ion
wel
l ~1
30 x
103 m
3 /day
[4.5
MM
scfd
] In
ject
ion
into
new
geo
logi
c fo
rmat
ion
requ
ires n
ew m
odel
ling
for a
ccid
enta
l spi
lls
and
air e
mis
sion
s

Deep Panuke Volume 4 (Environmental Assessment Report) November 2006 6-6
Table 6.2 Changes to Regulatory Environment since the Approved 2002 CSR Regulatory Update EA Scoping Considerations
Species at Risk Act (SARA) SARA was passed in December 2002, proclaimed in June 2003, and the last sections of the Act (prohibition and enforcement) came into force on June 1, 2004. The purpose of SARA is to prevent Canadian wildlife species from becoming extinct or extirpated, by providing for the recovery of endangered or threatened species, and encouraging the management of species of special concern.
SARA protects the plants and animals included in the List of Wildlife Species at Risk (Schedule 1 of SARA). Under SARAit is an offence to kill, harm, harass, capture or take, and to damage the residence of a listed endangered, threatened or extirpated species. A permit can be granted for an activity that would otherwise be a SARA offence, as long as measures are taken to minimize the impact, and the activity does not jeopardize the survival or recovery of the species. No clear definition has yet been provided for what constitutes “harassment” or “take” of an animal.
Effects of the Project on all marine and onshoreVEC species within the study area (including species now designated “at risk”) were assessed for the approved 2002 CSR. The EA Report addresses potential Project interactions with species at risk, as follows:
impact from the new Project components on Species at Risk; and updated information on species at risk, such as new species at risk, new information provided by species status reports and recovery plans/strategies, as applicable.
Environment Canada’s Environmental Assessment Best Practice for Wildlife at Risk in Canada (CWS 2004) has also been consulted with regard to evaluation of effects on species at risk.
Canadian Environmental Assessment Act (CEAA) Amendments to the Federal Authorities Regulations in January 2001 designated the CNSOPB as a Federal Authority (FA) under CEAA. On July 28, 2003, a number of amendments to regulations pursuant to CEAA came into force. These include amendments to the Inclusion List Regulations, Exclusion List Regulations, Law List Regulations and the Comprehensive Study List Regulations.Key changes include the following:
Work authorizations issued under paragraph 142(1)(b) of the Canada-Nova Scotia Offshore Petroleum Resources Accord Implementation Act are included in the Law List Regulations. This means that a CEAAenvironmental assessment must be completed for each work authorization issued by the CNSOPB, with the CNSOPB as a Responsible Authority. Section 11 of the Comprehensive Study Regulations was amended to clarify requirements of assessment for an offshore oil or gas production facility. The CEA Agency has an advisory role for all comprehensive studies and serves as the FEAC.
Section 1.3 of this EA Report indicates the expected Federal Authorities and Responsible Authorities for this Project and the requirement for a CSR under CEAA.
Gully Marine Protected Area (MPA) Regulations The Gully MPA Regulations came into force in May 2004. The MPA is divided into three management zones. The regulations prohibit the "disturbance, damage, destruction or removal of any living organism or part of its habitat [or] any part of the seabed within the MPA". Activities may be permitted within Zone 3 (the shallow banks on either side of the canyon) provided they do not impact Zones 1 and 2 and do not result in effects within Zone 3 "beyond natural variation of the area". An MPA Management Plan is being developed to provide guidelines for the implementation of the regulations (including approval and control of activities).
Because of the location of the Deep Panuke project (>100 km away from MPA boundary at northeast extreme location for future wells) and EnCana’s Gully MPA Code of Practice, no interaction is expected with the Gully MPA, hence the new MPA regulations are not expected to affect the Project. Nonetheless, the description of the Gully (Section 7.1.2.6) has been updated to acknowledge these regulations.

Deep Panuke Volume 4 (Environmental Assessment Report) November 2006 6-7
Table 6.2 Changes to Regulatory Environment since the Approved 2002 CSR Regulatory Update EA Scoping Considerations
Management of Sable Island Sable Island management was returned to the federal government on April 1, 2005. The Departments of Environment and Fisheries & Oceans are resuming management from a private organization, the Sable Island Preservation Trust (created in 1998). The federal government committed to maintaining a protective human presence on the island and will assume responsibility for staffing and operating the station. This resulted in a new structure for stakeholder consultation (a new Sable Island Stakeholder Committee was established in 2005 and includes representation by EnCana).
This regulatory update does not have a direct impact on the project and will not in itself require assessment. Section 7.1.2.6 of the EA Report acknowledges this update and stakeholder consultation included the Sable Island Stakeholder Committee (refer to Section 5).
Guidelines for Climate Change Considerations in Environmental Assessment In November 2003, the CEA Agency developed guidelines for EA practitioners regarding the incorporation of climate change considerations in environmental assessment. These guidelines include: methods that can be used to obtain and evaluate information concerning a project’s GHG emissions and the impacts of climate change on a project; key sources of information that practitioners can use to address climate change considerations in project EA; and methodology to encourage the consistent consideration of climate change in the EA process across federal, provincial and territorial jurisdictions and institutions of public government responsible for EA.
Section 8.1 (Air Quality) and Section 10 (Effects of the Environment on the Project) acknowledge these guidelines and have incorporated them as they are relevant.
Migratory Birds Convention Act (MBCA) Environment Canada’s recent review of the MBCA has resulted in some updates. The most relevant of which include a strengthening of Environment Canada’s authority to prosecute violations and formalizing the Act’s jurisdiction over the offshore area.
Section 7.1.2.5 acknowledges this updates to the Migratory Birds Convention Act however, it is unlikely that these updates have a direct impact on the Project.

Deep Panuke Volume 4 (Environmental Assessment Report) November 2006 6-8
Table 6.3 Changes to the Biophysical Environment since the Approved 2002 CSR Biophysical Update EA Scoping Considerations SARA and Species at Risk The biophysical impact analysis focusses on species at risk, particularly with
regard to marine fish, birds, mammals and sea turtles. Section 7.1.4 updates the approved 2002 CSR with respect to species at risk.
For the purpose of this EA Report, species at risk are defined as: “native wildlife species that are—or have become—most sensitive to human activity due to their rare occurrence, restricted range in Canada, dependence on specialized habitats or declining population or distribution” (CWS 2004). These may include species listed by SARA, COSEWIC, or NSNDR. ACCDC data has also been used as an early warning system to help identify some species that could be listed in the future. Although emphasis will be placed on SARA Schedule 1 species, it is important to be aware of additional species which have been identified through other mechanisms in order to take a more precautionary approach.
Where species recovery strategies or management plans have been developed or updated since the approved 2002 CSR (e.g., Roseate Tern, Ipswich Sparrow), these have been reviewed and discussed as appropriate to ensure the Project does not interfere with recovery of these species. Additional literature review has been conducted with respect to species at risk to provide further insight to status and behaviour of species and existing pressures on the populations (e.g., Rock 2005).
Scientific Research EnCana and the Study Team have conducted consultations with scientific and regulatory authorities to identify relevant research studies (e.g., produced water research, lobster/snow crab pipeline study, NRCan mine tailings contamination research) that have occurred since the approved 2002 CSR. This research has been used to enhance the effects analysis of biophysical VECs.
Table 6.4 Changes to the Socio-Economic Environment since the Approved 2002 CSR Socio-economic Update EA Scoping Considerations Offshore Strategic Energy Agreement (OSEA)
In June 2006, EnCana and the province of Nova Scotia announced an Offshore Strategic Energy Agreement (OSEA) that establishes the framework for Deep Panuke royalties, employment and industrial benefits, and funding for research and education. The socio-economic impact analysis presented in this EA Report (Section 9) updates the socio-economic information presented in the 2002 approved 2002 CSR, referencing the OSEA where relevant.
Fisheries Updates (General) EnCana and the Study Team have consulted with fisheries stakeholders (including nearshore fisheries and aquaculture license holders in the Goldboro landfall area) in the study area. The EA Report updates fisheries data, including maps, based on 2002-2005 effort and catch data and revises the impact analysis on fisheries and aquaculture accordingly.
New Quahog Fishery on Sable Island Bank A new quahog fishery opened on Sable Bank in 2005, although harvesting has yet to begin. This is the main expected fishery in the vicinity of the MOPU, wells, flowlines, SOEP Subsea Option, export pipeline and new portion of M&NP Option pipeline route (due to re-location of field centre) not previously assessed in the CSR. On Sable Island Bank, the flowlines and export pipeline will be buried deeper than 30 cm, which is considered to be the maximum depth for clam dredging. However, to ensure further protection during production, a safety zone will likely be established around the flowlines (which are considered vulnerable to mobile fishing gear), and wellhead subsea completions. The EA Report assesses direct and cumulative effects of subsea infrastructure on the new quahog fishery (refer to Section 9.3).

Deep Panuke Volume 4 (Environmental Assessment Report) November 2006 6-9
Table 6.4 Changes to the Socio-Economic Environment since the Approved 2002 CSR Socio-economic Update EA Scoping Considerations Sea Cucumber Experimental Fishery Consultations with DFO identified a sea cucumber experimental fishery on
Sable Island Bank, which overlaps the pipeline corridor for the M&NP Option. This area is identified on Figure 7.2.
Sea Urchin Licenses in Country Harbour/Isaacs Harbour Area
Consultations with DFO identified sea urchin licenses in the nearshore area in the vicinity of the nearshore pipeline route (M&NP Option). EnCana and the Study Team have consulted with the sea urchin license holders and these licenses are identified on Figure 7.9.
Eastern Scotian Shelf Integrated Management (ESSIM) Plan
A revised draft ESSIM Plan was released in July 2006 for public review. This Plan has been reviewed in context of compatibility of the Project within the Plan. Refer to Section 7.2.4 (Other Ocean Users) for additional information on ESSIM and its relevance to the Project.
Other Ocean Users EnCana and the Study Team have consulted with other ocean users (e.g.,DND, DFO, petroleum industry) to update information on their activities that could potentially interact with the Project. This information has been integrated into Sections 7.2.4 and 9.4 of the EA Report.
Preliminary discussions with Transport Canada and the CNSOPB indicated that the Project would require an application under the Navigable WatersProtection Act (NWPA). Potential impacts on navigation are included in Section 9.4.
Proposed Keltic Petrochemical Plant and Maple LNG Facility in Goldboro (Keltic/Maple Project)
Keltic Petrochemicals Inc. (in association with Maple LNG) has proposed construction and operation of a petrochemicals plant and LNG facilities directly adjacent to EnCana’s proposed onshore pipeline corridor (M&NP Option). These projects are currently undergoing environmental assessment under CEAA and the Nova Scotia Environment Act.
The onshore pipeline corridor identified for the approved 2002 CSR will likely change due to the planned Keltic Petrochemicals Project near Goldboro; however, it will remain within the assessed Onshore Study Area in the approved 2002 CSR. The EA Report updates the description of current and planned land uses in the landfall area (Section 7.2.2) and considers effects on this proposed land use (Section 9.1). The cumulative effects assessment (Sections 8.9 and 9.5) also considers the proposed Keltic and Maple facilities.
Traditional Land Use The 2002 approved CSR reported no evidence of traditional land use occurring in the study area. However, a Mi’kmaq Ecological Knowledge Study recently undertaken in support of the environmental assessment for the Keltic Petrochemicals Inc. Proposed LNG and Petrochemical Facilities (AMEC 2006) indicates current use of lands for traditional purposes (e.g.,fishing, hunting, overnight camps) within the Goldboro Industrial Park. It is assumed for the purpose of this assessment that current use of lands for traditional purposes could occur in the study area for this Project. As stated in the approved 2002 CSR, EnCana has committed to include Aboriginal representatives in pipeline RoW inspections.
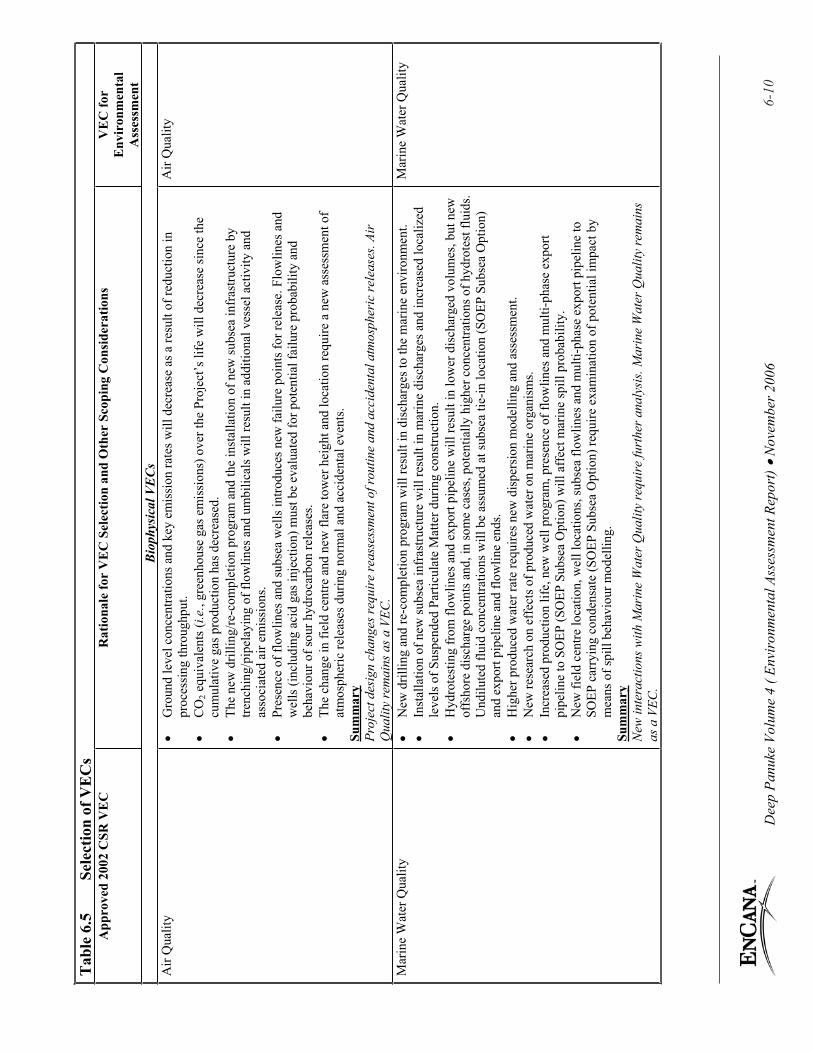
Dee
p Pa
nuke
Vol
ume
4 ( E
nvir
onm
enta
l Ass
essm
ent R
epor
t) N
ovem
ber 2
006
6-10
Tab
le 6
.5
Sele
ctio
n of
VE
Cs
App
rove
d 20
02 C
SR V
EC
R
atio
nale
for
VE
C S
elec
tion
and
Oth
er S
copi
ng C
onsi
dera
tions
V
EC
for
Env
iron
men
tal
Ass
essm
ent
Biop
hysic
al V
ECs
Air
Qua
lity
Gro
und
leve
l con
cent
ratio
ns a
nd k
ey e
mis
sion
rate
s will
dec
reas
e as
a re
sult
of re
duct
ion
in
proc
essi
ng th
roug
hput
. C
O2 e
quiv
alen
ts (i
.e.,
gree
nhou
se g
as e
mis
sion
s) o
ver t
he P
roje
ct’s
life
will
dec
reas
e si
nce
the
cum
ulat
ive
gas p
rodu
ctio
n ha
s dec
reas
ed.
The
new
dril
ling/
re-c
ompl
etio
n pr
ogra
m a
nd th
e in
stal
latio
n of
new
subs
ea in
fras
truct
ure
by
trenc
hing
/pip
elay
ing
of fl
owlin
es a
nd u
mbi
lical
s will
resu
lt in
add
ition
al v
esse
l act
ivity
and
as
soci
ated
air
emis
sion
s. Pr
esen
ce o
f flo
wlin
es a
nd su
bsea
wel
ls in
trodu
ces n
ew fa
ilure
poi
nts f
or re
leas
e. F
low
lines
and
w
ells
(inc
ludi
ng a
cid
gas i
njec
tion)
mus
t be
eval
uate
d fo
r pot
entia
l fai
lure
pro
babi
lity
and
beha
viou
r of s
our h
ydro
carb
on re
leas
es.
The
chan
ge in
fiel
d ce
ntre
and
new
flar
e to
wer
hei
ght a
nd lo
catio
n re
quire
a n
ew a
sses
smen
t of
atm
osph
eric
rele
ases
dur
ing
norm
al a
nd a
ccid
enta
l eve
nts.
Su
mm
ary
Proj
ect d
esig
n ch
ange
s req
uire
reas
sess
men
t of r
outin
e an
d ac
cide
ntal
atm
osph
eric
rele
ases
. Air
Q
ualit
y re
mai
ns a
s a V
EC.
Air
Qua
lity
Mar
ine
Wat
er Q
ualit
y N
ew d
rillin
g an
d re
-com
plet
ion
prog
ram
will
resu
lt in
dis
char
ges t
o th
e m
arin
e en
viro
nmen
t.
Inst
alla
tion
of n
ew su
bsea
infr
astru
ctur
e w
ill re
sult
in m
arin
e di
scha
rges
and
incr
ease
d lo
caliz
ed
leve
ls o
f Sus
pend
ed P
artic
ulat
e M
atte
r dur
ing
cons
truct
ion.
H
ydro
test
ing
from
flow
lines
and
exp
ort p
ipel
ine
will
resu
lt in
low
er d
isch
arge
d vo
lum
es, b
ut n
ew
offs
hore
dis
char
ge p
oint
s and
, in
som
e ca
ses,
pote
ntia
lly h
ighe
r con
cent
ratio
ns o
f hyd
rote
st fl
uids
. U
ndilu
ted
fluid
con
cent
ratio
ns w
ill b
e as
sum
ed a
t sub
sea
tie-in
loca
tion
(SO
EP S
ubse
a O
ptio
n)
and
expo
rt pi
pelin
e an
d flo
wlin
e en
ds.
Hig
her p
rodu
ced
wat
er ra
te re
quire
s new
dis
pers
ion
mod
ellin
g an
d as
sess
men
t. N
ew re
sear
ch o
n ef
fect
s of p
rodu
ced
wat
er o
n m
arin
e or
gani
sms.
Incr
ease
d pr
oduc
tion
life,
new
wel
l pro
gram
, pre
senc
e of
flow
lines
and
mul
ti-ph
ase
expo
rt pi
pelin
e to
SO
EP (S
OEP
Sub
sea
Opt
ion)
will
aff
ect m
arin
e sp
ill p
roba
bilit
y.
New
fiel
d ce
ntre
loca
tion,
wel
l loc
atio
ns, s
ubse
a flo
wlin
es a
nd m
ulti-
phas
e ex
port
pipe
line
to
SOEP
car
ryin
g co
nden
sate
(SO
EP S
ubse
a O
ptio
n) re
quire
exa
min
atio
n of
pot
entia
l im
pact
by
mea
ns o
f spi
ll be
havi
our m
odel
ling.
Su
mm
ary
New
inte
ract
ions
with
Mar
ine
Wat
er Q
ualit
y re
quir
e fu
rthe
r ana
lysi
s. M
arin
e W
ater
Qua
lity
rem
ains
as
a V
EC.
Mar
ine
Wat
er Q
ualit
y

Dee
p Pa
nuke
Vol
ume
4 ( E
nvir
onm
enta
l Ass
essm
ent R
epor
t) N
ovem
ber 2
006
6-11
Tab
le 6
.5
Sele
ctio
n of
VE
Cs
App
rove
d 20
02 C
SR V
EC
R
atio
nale
for
VE
C S
elec
tion
and
Oth
er S
copi
ng C
onsi
dera
tions
V
EC
for
Env
iron
men
tal
Ass
essm
ent
Mar
ine
Ben
thos
R
eloc
atio
n of
fiel
d ce
ntre
, wel
l loc
atio
ns, s
ubse
a eq
uipm
ent,
SOEP
Sub
sea
Opt
ion
pipe
line
and
new
por
tion
of M
&N
P pi
pelin
e w
ill re
quire
upd
atin
g ex
istin
g be
nthi
c co
nditi
ons,
incl
udin
g co
mm
erci
al sp
ecie
s (e.
g., q
uaho
g).
New
dril
ling
prog
ram
and
inst
alla
tion
of n
ew su
bsea
infr
astru
ctur
e w
ill re
sult
in in
crea
sed
bent
hic
habi
tat d
istu
rban
ce d
urin
g co
nstru
ctio
n ov
er a
larg
er g
eogr
aphi
c ar
ea.
Sum
mar
yN
ew p
oten
tial i
nter
actio
ns w
ith M
arin
e Be
ntho
s req
uire
furth
er a
naly
sis.
Mar
ine
Bent
hos r
emai
ns a
s a
VEC
with
em
phas
is o
n co
mm
erci
al b
enth
ic sp
ecie
s.
Mar
ine
Ben
thos
Mar
ine
Fish
A
lso
refe
r to
cons
ider
atio
ns fo
r Mar
ine
Wat
er Q
ualit
y an
d M
arin
e B
enth
os.
Less
reef
and
refu
ge e
ffec
ts a
ssoc
iate
d w
ith o
ne in
stal
latio
n (M
OPU
) (in
stea
d of
thre
e pl
atfo
rms)
, su
bsea
infr
astru
ctur
e an
d re
late
d sa
fety
zon
e.
New
dril
ling/
re-c
ompl
etio
n pr
ogra
m a
nd in
stal
latio
n of
new
subs
ea in
fras
truct
ure
will
resu
lt in
no
ise
emis
sion
s. Th
ere
will
be
low
er n
oise
em
issi
ons a
ssoc
iate
d w
ith p
ile d
rivin
g (s
ubse
a pr
otec
tion
stru
ctur
es) d
istri
bute
d ov
er a
wid
er a
rea.
H
addo
ck B
ox is
loca
ted
appr
oxim
atel
y 49
km
from
the
Proj
ect a
rea
and
is n
ot e
xpec
ted
to in
tera
ct
with
the
Proj
ect.
Sum
mar
yN
ew p
oten
tial i
nter
actio
ns w
ith M
arin
e Fi
sh re
quir
e fu
rther
ana
lysi
s. M
arin
e Fi
sh re
mai
ns a
s a V
EC
with
em
phas
is o
n m
arin
e fis
h sp
ecie
s at r
isk
and
com
mer
cial
fish
spec
ies.
Mar
ine
Fish
Mar
ine
Mam
mal
s A
lso
refe
r to
cons
ider
atio
ns fo
r Mar
ine
Wat
er Q
ualit
y.
The
new
dril
ling/
re-c
ompl
etio
n pr
ogra
m a
nd th
e in
stal
latio
n of
new
subs
ea in
fras
truct
ure
will
re
sult
in n
oise
em
issi
ons.
Ther
e w
ill b
e lo
wer
noi
se e
mis
sion
s ass
ocia
ted
with
pile
driv
ing
(wel
lhea
d pr
otec
tion
stru
ctur
es) d
istri
bute
d ov
er a
wid
er a
rea.
C
onst
ruct
ion
and
deco
mm
issi
onin
g of
one
inst
alla
tion
(MO
PU) i
nste
ad o
f thr
ee p
latfo
rms w
ill
resu
lt in
less
ves
sel a
nd h
elic
opte
r tra
ffic
, the
reby
redu
cing
noi
se e
mis
sion
s. Su
mm
ary
In re
cogn
ition
of S
ARA,
the
asse
ssm
ent w
ill fo
cus o
n m
arin
e m
amm
al sp
ecie
s at r
isk.
The
re is
po
tent
ial f
or se
a tu
rtle
s at r
isk
to o
ccur
in th
e st
udy
area
. Thi
s VEC
is re
vise
d as
Mar
ine
Mam
mal
s an
d Tu
rtle
s and
focu
sses
on
spec
ies a
t ris
k.
Mar
ine
Mam
mal
s and
Tu
rtles

Dee
p Pa
nuke
Vol
ume
4 ( E
nvir
onm
enta
l Ass
essm
ent R
epor
t) N
ovem
ber 2
006
6-12
Tab
le 6
.5
Sele
ctio
n of
VE
Cs
App
rove
d 20
02 C
SR V
EC
R
atio
nale
for
VE
C S
elec
tion
and
Oth
er S
copi
ng C
onsi
dera
tions
V
EC
for
Env
iron
men
tal
Ass
essm
ent
Mar
ine
Rel
ated
Bird
s Th
e SO
EP S
ubse
a O
ptio
n w
ill re
sult
in e
limin
atio
n of
a d
edic
ated
exp
ort p
ipel
ine
to sh
ore,
th
ereb
y el
imin
atin
g Pr
ojec
t int
erac
tion
with
the
Cou
ntry
Isla
nd T
ern
popu
latio
n.
Con
stru
ctio
n an
d de
com
mis
sion
ing
of o
ne in
stal
latio
n (M
OPU
) ins
tead
of t
hree
pla
tform
s will
re
sult
in le
ss v
esse
l and
hel
icop
ter t
raff
ic, t
here
by re
duci
ng p
oten
tial i
nter
actio
n w
ith m
arin
e bi
rds.
The
new
dril
ling/
re-c
ompl
etio
n pr
ogra
m a
nd th
e in
stal
latio
n of
new
subs
ea in
fras
truct
ure
(incl
udin
g tre
nchi
ng/p
ipel
ayin
g of
flow
lines
and
um
bilic
als)
will
nee
d to
be
asse
ssed
for
inte
ract
ion
with
mar
ine
bird
s. R
efer
to c
onsi
dera
tions
for M
arin
e W
ater
Qua
lity
with
rega
rd to
mar
ine
spill
s. Th
ere
is n
ew in
form
atio
n av
aila
ble
on sp
ecie
s at r
isk
(e.g
. Ros
eate
Ter
n, Ip
swic
h Sp
arro
w) w
hich
ar
e cl
osel
y as
soci
ated
with
Sab
le Is
land
. Su
mm
ary
New
pot
entia
l int
erac
tions
with
Mar
ine
Rela
ted
Bird
s req
uire
furt
her a
naly
sis.
This
VEC
shal
l foc
us
on sp
ecie
s at r
isk.
Mar
ine
Rel
ated
Bird
s
Sabl
e Is
land
R
eloc
atio
n of
the
field
cen
tre, p
rodu
ctio
n w
ells
and
aci
d ga
s inj
ectio
n w
ell,
pres
ence
of f
low
lines
an
d, fo
r the
SO
EP S
ubse
a O
ptio
n, a
mul
ti-ph
ase
pipe
line
to S
OEP
, res
ult i
n ne
w p
oten
tial
scen
ario
s for
mar
ine
spill
s whi
ch a
re c
lose
r to
Sabl
e Is
land
, hen
ce, a
ccid
enta
l rel
ease
pro
babi
lity
and
beha
viou
r mod
ellin
g ne
ed to
be
reas
sess
ed w
ith c
onsi
dera
tion
to p
oten
tial i
nter
actio
n w
ith
Sabl
e Is
land
. R
efer
to c
onsi
dera
tions
for M
arin
e R
elat
ed B
irds w
ith re
gard
to S
able
Isla
nd.
Sum
mar
yTh
is V
EC a
naly
sis w
ill fo
cus o
n Pr
ojec
t int
erac
tions
ass
ocia
ted
with
acc
iden
tal e
vent
s.
Sabl
e Is
land
Ons
hore
Env
ironm
ent
The
onsh
ore
pipe
line
corr
idor
has
bee
n m
odifi
ed w
ithin
the
prev
ious
ly a
ppro
ved
stud
y ar
ea
(M&
NP
Opt
ion)
. Th
ere
are
new
(lis
ted
sinc
e 20
02) o
nsho
re sp
ecie
s at r
isk
that
requ
ire c
onsi
dera
tion.
Th
e pr
opos
ed p
ipel
ine
rout
e m
ay re
quire
cro
ssin
g w
etla
nd a
reas
. Th
e pr
opos
ed p
ipel
ine
rout
e m
ay re
quire
cro
ssin
g B
etty
’s C
ove
Bro
ok.
Ther
e is
new
dat
a av
aila
ble
on se
dim
ent c
onta
min
atio
n fr
om h
isto
ric m
inin
g ac
tivity
in th
e ne
arsh
ore
and
onsh
ore
area
.Su
mm
ary
This
VEC
ana
lysi
s will
focu
s on
spec
ies a
t ris
k an
d po
tent
ial i
mpa
ct o
n fr
eshw
ater
reso
urce
sand
wet
land
s.
Ons
hore
Env
ironm
ent
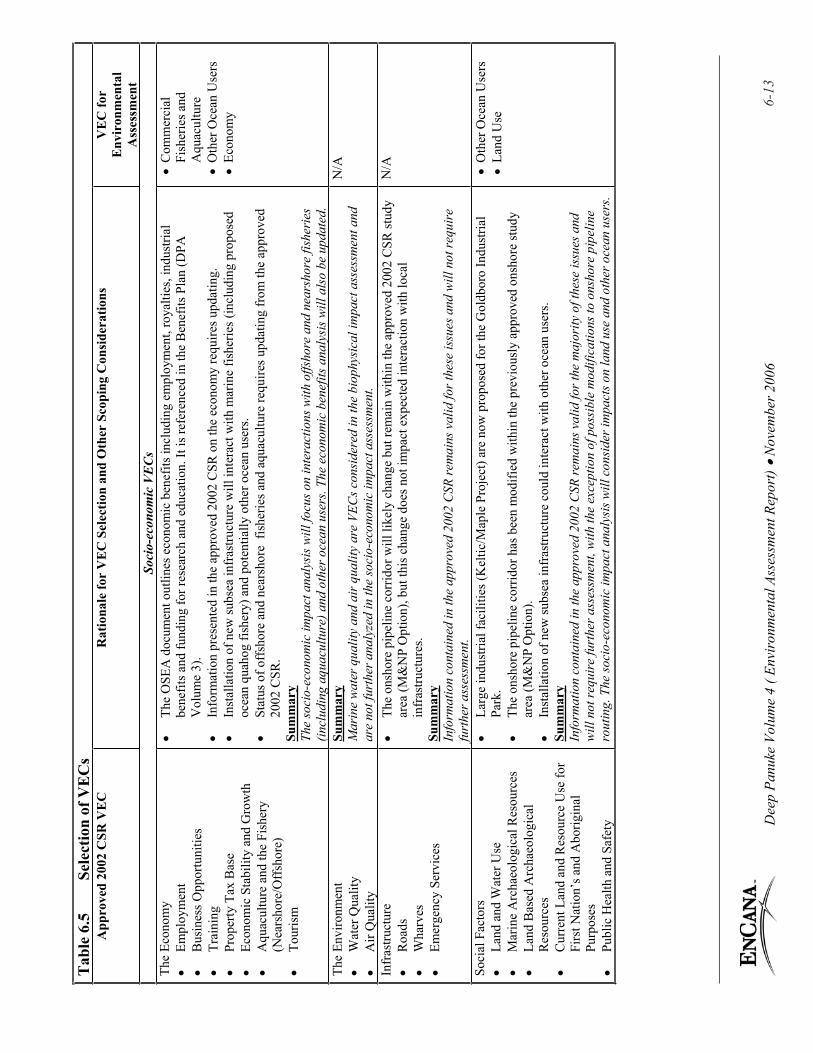
Dee
p Pa
nuke
Vol
ume
4 ( E
nvir
onm
enta
l Ass
essm
ent R
epor
t) N
ovem
ber 2
006
6-13
Tab
le 6
.5
Sele
ctio
n of
VE
Cs
App
rove
d 20
02 C
SR V
EC
R
atio
nale
for
VE
C S
elec
tion
and
Oth
er S
copi
ng C
onsi
dera
tions
V
EC
for
Env
iron
men
tal
Ass
essm
ent
Soci
o-ec
onom
ic V
ECs
The
Econ
omy
Empl
oym
ent
Bus
ines
s Opp
ortu
nitie
s Tr
aini
ngPr
oper
ty T
ax B
ase
Econ
omic
Sta
bilit
y an
d G
row
th
Aqu
acul
ture
and
the
Fish
ery
(Nea
rsho
re/O
ffsh
ore)
To
uris
m
The
OSE
A d
ocum
ent o
utlin
es e
cono
mic
ben
efits
incl
udin
g em
ploy
men
t, ro
yalti
es, i
ndus
trial
be
nefit
s and
fund
ing
for r
esea
rch
and
educ
atio
n. It
is re
fere
nced
in th
e B
enef
its P
lan
(DPA
V
olum
e 3)
. In
form
atio
n pr
esen
ted
in th
e ap
prov
ed 2
002
CSR
on
the
econ
omy
requ
ires u
pdat
ing.
In
stal
latio
n of
new
subs
ea in
fras
truct
ure
will
inte
ract
with
mar
ine
fishe
ries (
incl
udin
g pr
opos
ed
ocea
n qu
ahog
fish
ery)
and
pot
entia
lly o
ther
oce
an u
sers
. St
atus
of o
ffsh
ore
and
near
shor
e fi
sher
ies a
nd a
quac
ultu
re re
quire
s upd
atin
g fr
om th
e ap
prov
ed
2002
CSR
. Su
mm
ary
The
soci
o-ec
onom
ic im
pact
ana
lysi
s will
focu
s on
inte
ract
ions
with
offs
hore
and
nea
rsho
re fi
sher
ies
(incl
udin
g aq
uacu
lture
) and
oth
er o
cean
use
rs. T
he e
cono
mic
ben
efits
ana
lysi
s will
als
o be
upd
ated
.
Com
mer
cial
Fi
sher
ies a
nd
Aqu
acul
ture
O
ther
Oce
an U
sers
Ec
onom
y
The
Envi
ronm
ent
Wat
er Q
ualit
y A
ir Q
ualit
y
Sum
mar
yM
arin
e w
ater
qua
lity
and
air q
ualit
y ar
e VE
Cs c
onsi
dere
d in
the
biop
hysi
cal i
mpa
ct a
sses
smen
t and
ar
e no
t fur
ther
ana
lyze
d in
the
soci
o-ec
onom
ic im
pact
ass
essm
ent.
N/A
Infr
astru
ctur
e R
oads
W
harv
es
Emer
genc
y Se
rvic
es
The
onsh
ore
pipe
line
corr
idor
will
like
ly c
hang
e bu
t rem
ain
with
in th
e ap
prov
ed 2
002
CSR
stud
y ar
ea (M
&N
P O
ptio
n), b
ut th
is c
hang
e do
es n
ot im
pact
exp
ecte
d in
tera
ctio
n w
ith lo
cal
infr
astru
ctur
es.
Sum
mar
yIn
form
atio
n co
ntai
ned
in th
e ap
prov
ed 2
002
CSR
rem
ains
val
id fo
r the
se is
sues
and
will
not
requ
ire
furt
her a
sses
smen
t.
N/A
Soci
al F
acto
rs
Land
and
Wat
er U
se
Mar
ine
Arc
haeo
logi
cal R
esou
rces
La
nd B
ased
Arc
haeo
logi
cal
Res
ourc
esC
urre
nt L
and
and
Res
ourc
e U
se fo
r Fi
rst N
atio
n’s a
nd A
borig
inal
Pu
rpos
esPu
blic
Hea
lth a
nd S
afet
y
Larg
e in
dust
rial f
acili
ties (
Kel
tic/M
aple
Pro
ject
) are
now
pro
pose
d fo
r the
Gol
dbor
o In
dust
rial
Park
.Th
e on
shor
e pi
pelin
e co
rrid
or h
as b
een
mod
ified
with
in th
e pr
evio
usly
app
rove
d on
shor
e st
udy
area
(M&
NP
Opt
ion)
. In
stal
latio
n of
new
subs
ea in
fras
truct
ure
coul
d in
tera
ct w
ith o
ther
oce
an u
sers
. Su
mm
ary
Info
rmat
ion
cont
aine
d in
the
appr
oved
200
2 C
SR re
mai
ns v
alid
for t
he m
ajor
ity o
f the
se is
sues
and
w
ill n
ot re
quir
e fu
rthe
r ass
essm
ent,
with
the
exce
ptio
n of
pos
sibl
e m
odifi
catio
ns to
ons
hore
pip
elin
e ro
utin
g. T
he so
cio-
econ
omic
impa
ct a
naly
sis w
ill c
onsi
der i
mpa
cts o
n la
nd u
se a
nd o
ther
oce
an u
sers
.
Oth
er O
cean
Use
rs
Land
Use

Deep Panuke Volume 4 (Environmental Assessment Report) November 2006 6-14
6.3 Potential Interaction between Project Activities and Valued Environmental Components
Tables 6.6 and 6.7 summarize the potential interactions between biophysical VECs and socio-economic VECs, respectively. Where interactions are not indicated, it is considered that negligible (similar to normal variation in background conditions) or no interactions will occur. The specific nature and extent of these interactions are discussed and evaluated for each VEC in Sections 8 and 9. Where existing knowledge (e.g., the approved 2002 CSR) indicates than an interaction is not likely to result in an effect, certain issues may not warrant further analysis. Since the scope of this EA Report is limited to variations from the approved 2002 CSR, potential interactions which have been assessed previously do not require reassessment. Likewise, where a Project modification results in a lower effect than that previously assessed (e.g., smaller footprint, less noise disturbance), the effects analysis presented in the approved 2002 CSR is referenced and no further analysis is required. New commitments as a result of this EA or commitments revised from the approved 2002 CSR for mitigation, follow-up and monitoring made by EnCana are presented in Section 11.
6.4 Environmental Effects Assessment Framework
The environmental effects assessment framework presented in the approved 2002 CSR has also been used for this EA Report. Each VEC undergoes analysis using the same framework:
VEC identification and description of context; definition of boundaries; establishment of residual environmental effects evaluation criteria; Project modifications and potential interactions; analysis, mitigation and residual environmental effects prediction; follow-up and monitoring; consideration of sustainable use of renewable resources; andsummary of residual environmental effects assessment.
Each of these steps is described in Section 6.2.3 of the approved 2002 CSR. One difference between the methodology used previously in the approved 2002 CSR and this EA Report is that the cumulative effects assessment does not appear within each VEC analysis, but is instead presented in separate sections (Section 8.9 for biophysical and Section 9.5 for socio-economic). Additional information on the cumulative effects assessment is provided in Section 6.5.

Dee
p Pa
nuke
Vol
ume
4 (E
nvir
onm
enta
l Ass
essm
ent R
epor
t) N
ovem
ber 2
006
6-1
5
Tab
le 6
.6
Proj
ect I
nter
actio
ns w
ith B
ioph
ysic
al V
EC
s B
ioph
ysic
al V
EC
s Pr
ojec
t C
ompo
nent
Proj
ect
Mod
ifica
tion
Air
Qua
lity
Mar
ine
Wat
er
Qua
lity
Mar
ine
Ben
thos
M
arin
e Fi
sh
Mar
ine
Mam
mal
s and
T
urtle
s
Mar
ine
Rel
ated
B
irds
Sabl
e Is
land
O
nsho
re
Env
iron
men
t
Cons
truct
ion
and
Insta
llatio
nO
ffsh
ore
Prod
uctio
nFa
cilit
ies
1 in
stal
latio
n (M
OPU
) in
stea
d of
3 p
latfo
rms
Less
air
emis
sion
s fr
om v
esse
l/ he
licop
ter t
raff
ic
Less
ves
sel
disc
harg
esSm
alle
r be
nthi
cfo
otpr
int i
n ne
arby
lo
catio
n
Less
ves
sel
disc
harg
esLe
ss v
esse
l/ he
licop
ter
traff
ic; l
ess
vess
el
disc
harg
es
Less
ve
ssel
/hel
icop
ter
traff
ic; l
ess
vess
el li
ghts
and
di
scha
rges
N/A
N
/A
Flow
lines
, um
bilic
als,
subs
ea p
rote
ctio
n st
ruct
ures
(wel
ls, S
SIV
sk
id, a
nd h
ot ta
p an
d tie
-in fo
r SO
EP S
ubse
a O
ptio
n)
Gre
ater
air
emis
sion
s fro
m
incr
ease
d pi
pela
ying
/tren
chin
g ac
tivity
Gre
ater
su
spen
ded
parti
cula
tem
atte
r (SP
M)
from
incr
ease
d pi
pela
ying
/ tre
nchi
ng
activ
ity
Gre
ater
be
nthi
cfo
otpr
int f
rom
in
crea
sed
pipe
layi
ng/
trenc
hing
ac
tivity
Gre
ater
SPM
an
d no
ise
dist
urba
nce
from
incr
ease
d pi
pela
ying
/ tre
nchi
ng
activ
ity
Gre
ater
noi
se
dist
urba
nce
from
incr
ease
d pi
pela
ying
/ tre
nchi
ng
activ
ity; g
reat
er
vess
el p
rese
nce
Gre
ater
noi
se
dist
urba
nce
from
incr
ease
d pi
pela
ying
/ tre
nchi
ng
activ
ity; g
reat
er
vess
el p
rese
nce
N/A
N
/A
Cha
nge
in d
ilutio
n ra
te
and
rele
ase
loca
tion
for
hydr
osta
tic te
st w
ater
s fr
om e
xpor
t pip
elin
e an
d flo
wlin
es
N/A
W
ater
qua
lity
degr
adat
ion
from
dis
char
ge
of h
ydro
stat
ic
test
wat
er
Pote
ntia
l co
ntam
inat
ion
of b
enth
os
from
disc
harg
e of
hy
dros
tatic
te
st w
ater
Wat
er q
ualit
y de
grad
atio
nfr
om d
isch
arge
of
hyd
rost
atic
te
st w
ater
Wat
er q
ualit
y de
grad
atio
nfr
om d
isch
arge
of
hyd
rost
atic
te
st w
ater
Wat
er q
ualit
y de
grad
atio
nfr
om d
isch
arge
of
hyd
rost
atic
te
st w
ater
N/A
N
/A
Subs
eaEq
uipm
ent
Pile
driv
ing
for h
ot ta
p st
ruct
ure
(SO
EP
Subs
ea O
ptio
n) a
nd
wel
lhea
d/pr
otec
tion
stru
ctur
es; i
nvol
ves
muc
h sm
alle
r pile
s ov
er w
ider
are
a th
an
for o
rigin
al p
latfo
rms
Min
or a
ir em
issi
ons
over
a la
rger
ge
ogra
phic
are
a
Min
or S
PM
over
a la
rger
ge
ogra
phic
are
a
Less
noi
se
and
dura
tion
of d
istu
rban
ce
over
a la
rger
ge
ogra
phic
area
Less
noi
se a
nd
dura
tion
of
dist
urba
nce
over
a
larg
er
geog
raph
ic a
rea
Less
noi
se a
nd
dura
tion
of
dist
urba
nce
over
a la
rger
ge
ogra
phic
area
Less
noi
se a
nd
dura
tion
of
dist
urba
nce
over
a
larg
er
geog
raph
ic a
rea
N/A
N
/A

Dee
p Pa
nuke
Vol
ume
4 (E
nvir
onm
enta
l Ass
essm
ent R
epor
t) N
ovem
ber 2
006
6-1
6
Tab
le 6
.6
Proj
ect I
nter
actio
ns w
ith B
ioph
ysic
al V
EC
s B
ioph
ysic
al V
EC
s Pr
ojec
t C
ompo
nent
Proj
ect
Mod
ifica
tion
Air
Qua
lity
Mar
ine
Wat
er
Qua
lity
Mar
ine
Ben
thos
M
arin
e Fi
sh
Mar
ine
Mam
mal
s and
T
urtle
s
Mar
ine
Rel
ated
B
irds
Sabl
e Is
land
O
nsho
re
Env
iron
men
t
Expo
rt Pi
pelin
e to
SO
EP (S
OEP
Su
bsea
Opt
ion)
Con
stru
ctio
n of
new
pi
pelin
e to
SO
EP
subs
ea ti
e-in
Low
er a
ir em
issi
ons
from
equ
ipm
ent t
o in
stal
l sho
rter e
xpor
t pi
pelin
e in
new
lo
catio
n
Low
er S
PM (i
n ne
w lo
catio
n)
from
inst
alla
tion
of sh
orte
r exp
ort
pipe
line
Ove
rall
smal
ler
bent
hic
foot
prin
t (17
6 km
to 1
5 km
); bu
t rou
te
thro
ugh
new
ar
ea; n
o bl
astin
g re
quire
d
Less
SPM
and
no
ise
from
in
stal
latio
n of
sh
orte
r exp
ort
pipe
line
but i
n ne
w lo
catio
n
Less
noi
se a
nd
vess
el a
ctiv
ity
(in n
ew
loca
tion)
from
sh
orte
r exp
ort
pipe
line
Less
noi
se a
nd
vess
el a
ctiv
ity
(in n
ew
loca
tion)
from
sh
orte
r exp
ort
pipe
line;
no
inte
ract
ion
with
C
ount
ry Is
land
R
osea
te T
erns
N/A
N
/A
Expo
rt Pi
pelin
e to
Sh
ore
(M&
NP
Opt
ion)
Cha
nge
in e
xpor
t pi
pelin
e lo
catio
n du
e to
ne
w fi
eld
cent
re
N/A
N
/A
Min
or
redu
ctio
n in
be
nthi
cfo
otpr
int (
< 1
km) b
ut n
ew
loca
tion;
ro
utin
g w
ill
pass
thro
ugh
quah
ogfis
hing
grou
nds a
nd
rece
ntly
es
tabl
ishe
d ex
perim
enta
lse
a cu
cum
ber
fishi
ng a
rea
N/A
N
/A
N/A
N
/A
N/A

Dee
p Pa
nuke
Vol
ume
4 (E
nvir
onm
enta
l Ass
essm
ent R
epor
t) N
ovem
ber 2
006
6-1
7
Tab
le 6
.6
Proj
ect I
nter
actio
ns w
ith B
ioph
ysic
al V
EC
s B
ioph
ysic
al V
EC
s Pr
ojec
t C
ompo
nent
Proj
ect
Mod
ifica
tion
Air
Qua
lity
Mar
ine
Wat
er
Qua
lity
Mar
ine
Ben
thos
M
arin
e Fi
sh
Mar
ine
Mam
mal
s and
T
urtle
s
Mar
ine
Rel
ated
B
irds
Sabl
e Is
land
O
nsho
re
Env
iron
men
t
Dev
elop
men
tW
ell
Con
stru
ctio
n
Max
imum
tota
l num
ber
of w
ells
has
incr
ease
d to
9, b
ut d
urat
ion
of
drill
ing
and
com
plet
ion
activ
ities
has
de
crea
sed;
four
re-
entry
wel
ls in
clud
ed in
to
tal –
min
imal
dril
ling
to c
ompl
ete
Min
or d
ecre
ase
in
air e
mis
sion
s fro
m
shor
ter d
urat
ion
of
wel
l dril
ling
and
com
plet
ion
Low
er to
tal
volu
mes
of
WB
Mdi
scha
rges
and
as
soci
ated
cu
tting
s at
indi
vidu
al w
ell
loca
tions
inst
ead
of fi
eld
cent
re;
elev
ated
SPM
; gr
eate
r vol
ume
of d
isch
arge
d br
ine
for w
ell
re-c
ompl
etio
n
Low
er to
tal
WB
Mdi
scha
rges
and
asso
ciat
ed
cutti
ngs;
m
ore,
but
sm
alle
r cu
tting
s pile
s at
indi
vidu
al
wel
l loc
atio
ns
inst
ead
of
field
cen
tre;
grea
ter
volu
me
of
brin
e fo
r wel
l re
-co
mpl
etio
n;
loca
lized
sm
othe
ring
of
bent
hos;
pote
ntia
l in
gest
ion
of
cont
amin
ants
Low
er to
tal
WB
Mdi
scha
rges
and
as
soci
ated
cu
tting
s;di
scha
rges
at
indi
vidu
al w
ell
loca
tions
inst
ead
of fi
eld
cent
re;
grea
ter v
olum
e of
brin
e fo
r wel
l re
-com
plet
ion
disc
harg
ed;
elev
ated
SPM
; po
tent
ial
inge
stio
n of
co
ntam
inan
ts
Shor
ter
dura
tion
of
drill
ing
nois
e sp
read
ove
r a
wid
er a
rea
Shor
ter d
urat
ion
of d
rillin
g no
ise
spre
ad o
ver
wid
er a
rea
N/A
N
/A
Ons
hore
Pip
elin
e an
d Fa
cilit
ies
Mod
ifica
tion
to
onsh
ore
pipe
line
corr
idor
(M&
NP
Opt
ion)
N/A
N
/A
N/A
N
/A
N/A
N
/A
N/A
N
oise
and
ph
ysic
al
dist
urba
nce
to
terr
estri
al
habi
tat;
pote
ntia
l in
tera
ctio
n w
ith w
etla
nds
and
fres
hwat
er
reso
urce
s(i.
e., B
etty
’s
Cov
e B
rook
)

Dee
p Pa
nuke
Vol
ume
4 (E
nvir
onm
enta
l Ass
essm
ent R
epor
t) N
ovem
ber 2
006
6-1
8
Tab
le 6
.6
Proj
ect I
nter
actio
ns w
ith B
ioph
ysic
al V
EC
s B
ioph
ysic
al V
EC
s Pr
ojec
t C
ompo
nent
Proj
ect
Mod
ifica
tion
Air
Qua
lity
Mar
ine
Wat
er
Qua
lity
Mar
ine
Ben
thos
M
arin
e Fi
sh
Mar
ine
Mam
mal
s and
T
urtle
s
Mar
ine
Rel
ated
B
irds
Sabl
e Is
land
O
nsho
re
Env
iron
men
t
Ope
ratio
ns1
inst
alla
tion
(MO
PU)
inst
ead
of 3
pla
tform
s N
/A
N/A
Sm
alle
r be
nthi
cfo
otpr
int;
smal
ler r
eef
effe
ct
Few
er
reef
/refu
ge
effe
cts
Few
er
reef
/refu
ge
effe
cts f
or
prey
; sm
alle
r st
ruct
ure
foot
prin
t
Less
dis
char
ges
and
light
ing;
fe
wer
pla
tform
s fo
r col
oniz
atio
n,
shel
ter,
etc.
N/A
N
/A
Low
er p
rodu
ctio
n flo
w; l
ower
thro
ughp
ut
Less
rout
ine
emis
sion
s fro
m
flarin
g an
d ex
haus
t en
gine
s
N/A
N
/A
N/A
N
/A
N/A
N
/A
N/A
Off
shor
ePr
oduc
tion
Long
er p
rodu
ctio
n pe
riod
Gre
ater
tem
pora
l bo
unda
ries f
or
inte
ract
ion
Gre
ater
te
mpo
ral
boun
darie
s for
in
tera
ctio
n
Gre
ater
te
mpo
ral
boun
darie
sfo
r int
erac
tion
Gre
ater
te
mpo
ral
boun
darie
s for
in
tera
ctio
n
Gre
ater
te
mpo
ral
boun
darie
s for
in
tera
ctio
n
Gre
ater
te
mpo
ral
boun
darie
s for
in
tera
ctio
n
N/A
N
/A
Rel
ocat
ion
of fi
eld
cent
re
Cha
nge
in lo
catio
n of
sour
ce o
f air
emis
sion
s
Cha
nge
in
loca
tion
of
mar
ine
disc
harg
es
Cha
nge
in
loca
tion
of
bent
hic
foot
prin
t
Cha
nge
in
loca
tion
of
reef
/refu
ge
effe
cts;
cha
nge
in lo
catio
n of
m
arin
edi
scha
rges
Cha
nge
in
loca
tion
of
reef
/refu
ge
effe
cts f
or
prey
; cha
nge
in
loca
tion
of
mar
ine
disc
harg
es
Cha
nge
in
loca
tion
of
light
s/di
scha
rges
Clo
ser t
o Sa
ble
Isla
nd;
grea
ter
pote
ntia
l for
in
tera
ctio
n as
soci
ated
w
ithat
mos
pher
ic
and
acci
dent
al
mar
ine
rele
ases
N/A
Gre
ater
pro
duce
d w
ater
di
scha
rges
N/A
G
reat
er w
ater
qu
ality
de
grad
atio
n
Pote
ntia
l co
ntam
inat
ion
of b
enth
os
Gre
ater
wat
er
qual
ity
degr
adat
ion
and
pote
ntia
l to
xici
ty to
m
arin
eor
gani
sms
Gre
ater
wat
er
qual
ity
degr
adat
ion;
cont
amin
atio
nof
food
sour
ces
Con
tam
inat
ion
of fo
od so
urce
s N
/A
N/A

Dee
p Pa
nuke
Vol
ume
4 (E
nvir
onm
enta
l Ass
essm
ent R
epor
t) N
ovem
ber 2
006
6-1
9
Tab
le 6
.6
Proj
ect I
nter
actio
ns w
ith B
ioph
ysic
al V
EC
s B
ioph
ysic
al V
EC
s Pr
ojec
t C
ompo
nent
Proj
ect
Mod
ifica
tion
Air
Qua
lity
Mar
ine
Wat
er
Qua
lity
Mar
ine
Ben
thos
M
arin
e Fi
sh
Mar
ine
Mam
mal
s and
T
urtle
s
Mar
ine
Rel
ated
B
irds
Sabl
e Is
land
O
nsho
re
Env
iron
men
t
Subs
eaEq
uipm
ent
Flow
lines
, um
bilic
als
and
wel
lsN
/A
N/A
G
reat
er
refu
ge e
ffec
t as
soci
ated
w
ith la
rger
sa
fety
zon
e;
grea
ter r
eef
effe
ctas
soci
ated
w
ithad
ditio
nal
stru
ctur
es o
n se
aflo
or
Gre
ater
refu
ge
effe
ct a
ssoc
iate
d w
ith la
rger
sa
fety
zon
e;
grea
ter r
eef
effe
ct a
ssoc
iate
d w
ith a
dditi
onal
st
ruct
ures
on
seaf
loor
Gre
ater
food
su
pply
as
soci
ated
with
re
ef/re
fuge
ef
fect
s rel
ated
to
the
pres
ence
of
exp
osed
su
bsea
stru
ctur
es a
nd
safe
ty z
one
N/A
N
/A
N/A
Expo
rt Pi
pelin
e Pi
pelin
e to
SO
EP
subs
ea ti
e-in
(SO
EP
Subs
ea O
ptio
n)
N/A
N
/A
Pote
ntia
l re
ef/re
fuge
ef
fect
asso
ciat
ed
with
subs
ea
conn
ectio
nst
ruct
ures
Pote
ntia
l re
ef/re
fuge
ef
fect
ass
ocia
ted
with
subs
ea
conn
ectio
nst
ruct
ures
N/A
N
/A
N/A
N
/A
Ons
hore
Pip
elin
e an
d Fa
cilit
ies
Mod
ifica
tion
to
onsh
ore
pipe
line
corr
idor
N/A
N
/A
N/A
N
/A
N/A
N
/A
N/A
N
oise
and
ot
her
dist
urba
nce
of te
rres
trial
ha
bita
t and
w
ildlif
e du
ring
mai
nten
ance
of
pip
elin
e an
d R
oWD
ecom
miss
ioni
ng
1 in
stal
latio
n (M
OPU
) in
stea
d of
3 p
latfo
rms
Low
er a
ir em
issi
ons
Less
phy
sica
l di
stur
banc
e an
d SP
M
N/A
Le
ss p
hysi
cal
dist
urba
nce
and
SPM
; les
s noi
se
dist
urba
nce
Less
noi
se
dist
urba
nce
Less
noi
se
dist
urba
nce
N/A
N
/A
Proj
ect F
acili
ties
Dec
omm
issi
onin
g
Bur
ied
pipe
line,
flo
wlin
es a
nd
umbi
lical
s
N/A
Pr
esen
ce o
f ab
ando
ned
subs
east
ruct
ures
Pres
ence
of
aban
done
d su
bsea
stru
ctur
es
Pres
ence
of
aban
done
d su
bsea
stru
ctur
es
N/A
N
/A
N/A
N
/A

Dee
p Pa
nuke
Vol
ume
4 (E
nvir
onm
enta
l Ass
essm
ent R
epor
t) N
ovem
ber 2
006
6-2
0
Tab
le 6
.6
Proj
ect I
nter
actio
ns w
ith B
ioph
ysic
al V
EC
s B
ioph
ysic
al V
EC
s Pr
ojec
t C
ompo
nent
Proj
ect
Mod
ifica
tion
Air
Qua
lity
Mar
ine
Wat
er
Qua
lity
Mar
ine
Ben
thos
M
arin
e Fi
sh
Mar
ine
Mam
mal
s and
T
urtle
s
Mar
ine
Rel
ated
B
irds
Sabl
e Is
land
O
nsho
re
Env
iron
men
t
M
odifi
catio
n to
on
shor
e pi
pelin
e co
rrid
or
N/A
N
/A
N/A
N
/A
N/A
N
/A
N/A
N
oise
and
m
inor
phys
ical
di
stur
banc
e to
te
rres
trial
ha
bita
t
Mal
func
tions
and
Acc
iden
tal E
vent
s Lo
nger
pro
duct
ion
perio
dG
reat
er
blow
out/s
pill
risk
expo
sure
Gre
ater
spill
risk
ex
posu
reG
reat
er sp
ill
risk
expo
sure
bu
t pot
entia
l im
pact
s on
bent
hos
equi
vale
nt to
20
02 P
roje
ct
basi
s
Gre
ater
spill
risk
ex
posu
reG
reat
er sp
ill
risk
expo
sure
G
reat
er sp
ill ri
sk
expo
sure
Gre
ater
spill
ris
kex
posu
re
N/A
Off
shor
ePr
oduc
tion
Rel
ocat
ion
of fi
eld
cent
re
Cha
nge
in lo
catio
n of
sour
ce o
f air
emis
sion
s
Cha
nge
in sp
ill
loca
tion
N/A
C
hang
e in
spill
lo
catio
n
Cha
nge
in sp
ill
loca
tion
Cha
nge
in sp
ill
loca
tion
C
lose
r to
Sabl
e Is
land
; gr
eate
r po
tent
ial o
f in
tera
ctio
n as
soci
ated
w
ith sp
ills
and
ups
et
atm
osph
eric
re
leas
es
N/A
Subs
eaEq
uipm
ent
Flow
lines
, um
bilic
als,
wel
ls a
nd su
bsea
pr
otec
tion
New
risk
of s
ubse
a fa
ilure
resu
lting
in
atm
osph
eric
re
leas
es
New
risk
of
subs
ea fa
ilure
re
sulti
ng in
ac
cide
ntal
m
arin
e sp
ills
N/A
N
ew ri
sk o
f su
bsea
failu
re
resu
lting
in
acci
dent
al
mar
ine
spill
s
New
risk
of
subs
ea fa
ilure
re
sulti
ng in
ac
cide
ntal
m
arin
e sp
ills
New
risk
of
subs
ea fa
ilure
re
sulti
ng in
ac
cide
ntal
m
arin
e sp
ills
New
risk
of
subs
eafa
ilure
re
sulti
ng in
ac
cide
ntal
at
mos
pher
ic
rele
ases
and
m
arin
e sp
ills
N/A
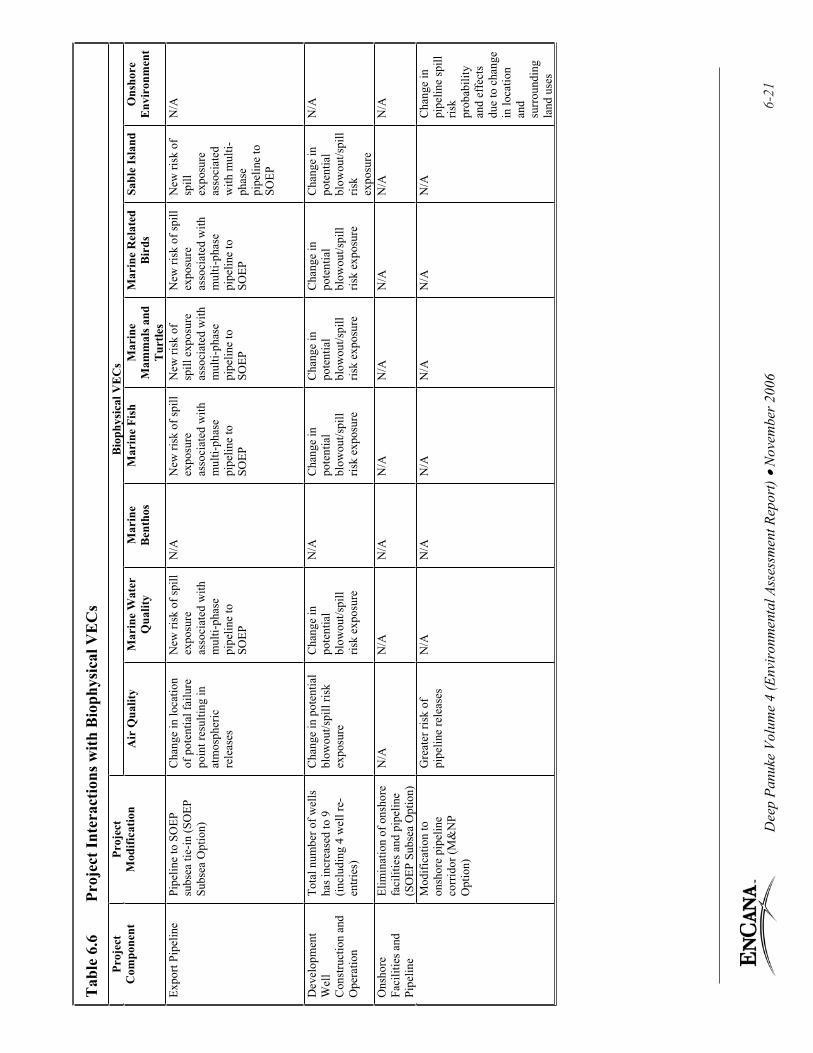
Dee
p Pa
nuke
Vol
ume
4 (E
nvir
onm
enta
l Ass
essm
ent R
epor
t) N
ovem
ber 2
006
6-2
1
Tab
le 6
.6
Proj
ect I
nter
actio
ns w
ith B
ioph
ysic
al V
EC
s B
ioph
ysic
al V
EC
s Pr
ojec
t C
ompo
nent
Proj
ect
Mod
ifica
tion
Air
Qua
lity
Mar
ine
Wat
er
Qua
lity
Mar
ine
Ben
thos
M
arin
e Fi
sh
Mar
ine
Mam
mal
s and
T
urtle
s
Mar
ine
Rel
ated
B
irds
Sabl
e Is
land
O
nsho
re
Env
iron
men
t
Expo
rt Pi
pelin
e Pi
pelin
e to
SO
EP
subs
ea ti
e-in
(SO
EP
Subs
ea O
ptio
n)
Cha
nge
in lo
catio
n of
pot
entia
l fai
lure
po
int r
esul
ting
in
atm
osph
eric
re
leas
es
New
risk
of s
pill
expo
sure
asso
ciat
ed w
ith
mul
ti-ph
ase
pipe
line
to
SOEP
N/A
New
risk
of s
pill
expo
sure
asso
ciat
ed w
ith
mul
ti-ph
ase
pipe
line
to
SOEP
New
risk
of
spill
exp
osur
e as
soci
ated
with
m
ulti-
phas
e pi
pelin
e to
SO
EP
New
risk
of s
pill
expo
sure
asso
ciat
ed w
ith
mul
ti-ph
ase
pipe
line
to
SOEP
New
risk
of
spill
expo
sure
asso
ciat
ed
with
mul
ti-ph
ase
pipe
line
to
SOEP
N/A
Dev
elop
men
tW
ell
Con
stru
ctio
n an
d O
pera
tion
Tota
l num
ber o
f wel
ls
has i
ncre
ased
to 9
(in
clud
ing
4 w
ell r
e-en
tries
)
Cha
nge
in p
oten
tial
blow
out/s
pill
risk
expo
sure
Cha
nge
in
pote
ntia
l bl
owou
t/spi
llris
k ex
posu
re
N/A
C
hang
e in
po
tent
ial
blow
out/s
pill
risk
expo
sure
Cha
nge
in
pote
ntia
l bl
owou
t/spi
llris
k ex
posu
re
Cha
nge
in
pote
ntia
l bl
owou
t/spi
llris
k ex
posu
re
Cha
nge
in
pote
ntia
l bl
owou
t/spi
llris
kex
posu
re
N/A
Elim
inat
ion
of o
nsho
re
faci
litie
s and
pip
elin
e (S
OEP
Sub
sea
Opt
ion)
N/A
N
/A
N/A
N
/A
N/A
N
/A
N/A
N
/A
Ons
hore
Faci
litie
s and
Pi
pelin
eM
odifi
catio
n to
on
shor
e pi
pelin
e co
rrid
or (M
&N
P O
ptio
n)
Gre
ater
risk
of
pipe
line
rele
ases
N
/A
N/A
N
/A
N/A
N
/A
N/A
C
hang
e in
pi
pelin
e sp
ill
risk
prob
abili
ty
and
effe
cts
due
to c
hang
e in
loca
tion
and
surr
ound
ing
land
use
s

Dee
p Pa
nuke
Vol
ume
4 (E
nvir
onm
enta
l Ass
essm
ent R
epor
t) N
ovem
ber 2
006
6-
22
Tab
le 6
.7
Proj
ect I
nter
actio
ns w
ith S
ocio
-eco
nom
ic V
EC
s
Soci
o-ec
onom
ic V
EC
s Pr
ojec
t Com
pone
nt
Proj
ect M
odifi
catio
n L
and
Use
E
cono
my
Com
mer
cial
Fish
erie
s an
d A
quac
ultu
re
Oth
er O
cean
Use
rs
Cons
truct
ion
and
Insta
llatio
n O
ffsh
ore
Prod
uctio
n Fa
cilit
ies
1 in
stal
latio
n (M
OPU
) ins
tead
of
3 p
latfo
rms
N/A
Ec
onom
ic a
ctiv
ity
(em
ploy
men
t and
inco
me)
fr
om P
roje
ct c
onst
ruct
ion
Less
inte
rfer
ence
with
fis
hing
act
iviti
es d
ue to
m
ore
loca
lized
act
ivity
for
the
inst
alla
tion
of th
e M
OPU
N/A
Flow
lines
, um
bilic
als,
subs
ea
prot
ectio
n st
ruct
ures
(wel
ls,
SSIV
skid
, and
hot
tap
and
tie-in
for S
OEP
Sub
sea
Opt
ion)
N/A
Ec
onom
ic a
ctiv
ity
(em
ploy
men
t and
inco
me)
fr
om P
roje
ct c
onst
ruct
ion
Pote
ntia
l for
inte
rfer
ing
with
fish
erie
s act
iviti
es
due
to P
roje
ct v
esse
l ac
tivity
dur
ing
inst
alla
tion
of su
bsea
equ
ipm
ent;
pote
ntia
l phy
sica
l eff
ects
on
ben
thic
hab
itat
Pote
ntia
l int
erfe
renc
e fr
om
subs
ea e
quip
men
t ins
talla
tion
activ
ities
with
mar
ine
trans
porta
tion,
subm
arin
e ca
bles
, mili
tary
use
, and
oil
and
gas a
ctiv
ity; p
oten
tial
conf
lict w
ith th
e D
raft
ESSI
M
Plan
Subs
ea E
quip
men
t
Pile
driv
ing
for h
ot-ta
p st
ruct
ure
(SO
EP S
ubse
a O
ptio
n) a
nd
wel
lhea
d/pr
otec
tion
stru
ctur
es
N/A
N
/A
Effe
cts o
n fis
h ca
tcha
bilit
y fr
om u
nder
wat
er p
ile
driv
ing
nois
e (lo
wer
soun
d le
vels
but
at s
ever
al
loca
tions
inst
ead
of fi
eld
cent
re)
Pote
ntia
l int
erfe
renc
e w
ith
mili
tary
act
ivity
from
un
derw
ater
pile
driv
ing
nois
e (lo
wer
soun
d le
vel b
ut a
t se
vera
l loc
atio
ns in
stea
d of
on
e fie
ld c
entre
)
Expo
rt Pi
pelin
e to
SO
EP
(SO
EP S
ubse
a O
ptio
n)
Con
stru
ctio
n of
new
pip
elin
e to
SO
EP su
bsea
tie-
in
N/A
Ec
onom
ic a
ctiv
ity
(em
ploy
men
t and
inco
me)
fr
om P
roje
ct c
onst
ruct
ion;
le
ss e
cono
mic
act
ivity
as
soci
ated
with
shor
ter
pipe
line
(com
pare
d w
ith
M&
NP
Opt
ion)
but
ons
hore
co
nden
sate
pro
cess
ing
Pote
ntia
l for
inte
rfer
ence
w
ith fi
shin
g ac
tiviti
es d
ue
to P
roje
ct v
esse
l act
ivity
du
ring
pipe
line
inst
alla
tion;
pot
entia
l ph
ysic
al e
ffec
ts o
n qu
ahog
s and
ben
thic
ha
bita
t; el
imin
atio
n of
po
tent
ial i
nter
actio
ns w
ith
near
shor
e fis
herie
s and
aq
uacu
lture
Pote
ntia
l int
erfe
renc
e fr
om
pipe
line
inst
alla
tion
activ
ities
w
ith m
arin
e tra
nspo
rtatio
n,
subm
arin
e ca
bles
, mili
tary
us
e, a
nd o
il an
d ga
s act
ivity
; po
tent
ial c
onfli
ct w
ith th
e D
raft
ESSI
M P
lan

Dee
p Pa
nuke
Vol
ume
4 (E
nvir
onm
enta
l Ass
essm
ent R
epor
t) N
ovem
ber 2
006
6-
23
Tab
le 6
.7
Proj
ect I
nter
actio
ns w
ith S
ocio
-eco
nom
ic V
EC
s
Soci
o-ec
onom
ic V
EC
s Pr
ojec
t Com
pone
nt
Proj
ect M
odifi
catio
n L
and
Use
E
cono
my
Com
mer
cial
Fish
erie
s an
d A
quac
ultu
re
Oth
er O
cean
Use
rs
Expo
rt Pi
pelin
e to
Sho
re
(M&
NP
Opt
ion)
M
odifi
catio
n of
ons
hore
and
of
fsho
re p
ipel
ine
rout
e (d
ue
to re
loca
tion
of fi
eld
cent
re)
Enha
ncem
ent o
f lan
d us
e co
nsis
tent
with
pla
nnin
g de
sign
atio
n; p
oten
tial i
nter
actio
n du
ring
cons
truct
ion
of th
e pr
opos
ed M
aple
LN
G a
nd K
eltic
Pe
troch
emic
al fa
cilit
ies;
min
or
dist
urba
nces
to n
earb
y la
nd u
ses
(e.g
., tra
ffic
, noi
se, d
ust)
N/A
Po
tent
ial i
nter
actio
n w
ith
new
fish
erie
s (e.
g. q
uaho
g an
d se
a cu
cum
ber)
Pote
ntia
l int
erfe
renc
e w
ith
othe
r use
r act
iviti
es (e
.g.,
ESSI
M, m
arin
e tra
nspo
rtatio
n)
Dev
elop
men
t Wel
l C
onst
ruct
ion
Tota
l num
ber o
f wel
ls h
as
incr
ease
d to
9 b
ut in
clud
es 4
re
-ent
ries
N/A
Ec
onom
ic a
ctiv
ity
(em
ploy
men
t and
inco
me
) fr
om P
roje
ct c
onst
ruct
ion
Gre
ater
spat
ial b
ut sh
orte
r te
mpo
ral b
ound
arie
s for
po
tent
ial i
nter
actio
n w
ith
com
mer
cial
fish
erie
s
Pote
ntia
l int
erfe
renc
e fr
om
wel
l con
stru
ctio
n (in
clud
ing
drill
ing)
with
mar
ine
trans
porta
tion,
subm
arin
e ca
bles
, mili
tary
use
, and
oil
and
gas a
ctiv
ity; p
oten
tial
conf
lict w
ith th
e D
raft
ESSI
M
Plan
O
pera
tions
1 in
stal
latio
n (M
OPU
) ins
tead
of
3
N/A
N
/A
Larg
er sa
fety
zon
e ar
ound
M
OPU
, flo
wlin
es,
umbi
lical
s and
subs
ea
prot
ectio
n st
ruct
ures
N/A
Off
shor
e Pr
oduc
tion
Long
er p
rodu
ctio
n pe
riod
N/A
Ec
onom
ic a
ctiv
ity
(em
ploy
men
t and
inco
me)
as
soci
ated
with
faci
lity
oper
atio
ns a
nd m
aint
enan
ce
Cha
nge
in te
mpo
ral
boun
darie
s for
inte
ract
ion
with
com
mer
cial
fish
erie
s
Cha
nge
in te
mpo
ral
boun
darie
s for
inte
ract
ion
w
ith m
arin
e tra
nspo
rtatio
n,
mili
tary
use
, and
oil
and
gas
activ
ity
R
eloc
atio
n of
fiel
d ce
ntre
N
/A
N/A
C
hang
e in
loca
tion
of
pote
ntia
l int
erac
tions
with
of
fsho
re fi
sher
ies
Cha
nge
in lo
catio
n of
po
tent
ial i
nter
actio
n w
ith
mar
ine
trans
porta
tion,
mili
tary
us
e, a
nd o
il an
d ga
s act
ivity
; po
tent
ial c
onfli
ct w
ith D
raft
ESSI
M P
lan

Dee
p Pa
nuke
Vol
ume
4 (E
nvir
onm
enta
l Ass
essm
ent R
epor
t) N
ovem
ber 2
006
6-
24
Tab
le 6
.7
Proj
ect I
nter
actio
ns w
ith S
ocio
-eco
nom
ic V
EC
s
Soci
o-ec
onom
ic V
EC
s Pr
ojec
t Com
pone
nt
Proj
ect M
odifi
catio
n L
and
Use
E
cono
my
Com
mer
cial
Fish
erie
s an
d A
quac
ultu
re
Oth
er O
cean
Use
rs
G
reat
er p
rodu
ced
wat
er
disc
harg
esN
/A
N/A
G
reat
er w
ater
qua
lity
degr
adat
ion
near
MO
PU
N/A
Subs
ea E
quip
men
t Fl
owlin
es, u
mbi
lical
s and
w
ells
N/A
Ec
onom
ic a
ctiv
ity
(em
ploy
men
t and
inco
me)
as
soci
ated
with
faci
lity
oper
atio
ns a
nd m
aint
enan
ce
Larg
er sa
fety
zon
e ar
ound
M
OPU
, flo
wlin
es,
umbi
lical
s and
subs
ea
prot
ectio
n st
ruct
ures
Pote
ntia
l int
erfe
renc
e w
ith
othe
r oce
an u
sers
rela
ted
to
subs
ea st
ruct
ures
and
safe
ty
zone
; eff
ects
on
mar
ine
navi
gatio
nEx
port
Pipe
line
to S
hore
(S
OEP
Sub
sea
Opt
ion)
Pr
esen
ce o
f new
pip
elin
e to
SO
EP
N/A
N
/A
Pote
ntia
l int
erfe
renc
e w
ith
antic
ipat
ed q
uaho
g fis
hing
ac
tiviti
es
N/A
Mod
ifica
tion
to o
ffsh
ore
pipe
line
rout
e (d
ue to
re
loca
tion
of fi
eld
cent
re)
N/A
N
/A
Pote
ntia
l int
erfe
renc
e w
ith
antic
ipat
ed q
uaho
g fis
hing
ac
tiviti
es
N/A
Expo
rt Pi
pelin
e to
Sho
re
(M&
NP
Opt
ion)
Mod
ifica
tion
to o
nsho
re
pipe
line
corr
idor
En
hanc
emen
t of l
and
use
cons
iste
nt w
ith p
lann
ing
desi
gnat
ion;
pot
entia
l con
stra
ints
on
the
loca
tion
and
oper
atio
n of
th
e M
aple
LN
G a
nd K
eltic
Pe
troch
emic
al fa
cilit
ies
N/A
N
/A
N/A
Dec
omm
issio
ning
Pr
ojec
t Fac
ilitie
s D
ecom
mis
sion
ing
1 in
stal
latio
n (M
OPU
) ins
tead
of
3 p
latfo
rms
N/A
Ec
onom
ic a
ctiv
ity
(em
ploy
men
t and
inco
me)
as
soci
ated
with
faci
lity
deco
mm
issi
onin
g
Less
inte
rfer
ence
with
of
fsho
re fi
sher
ies
Red
uced
inte
rfer
ence
with
ot
her o
cean
use
rs
B
urie
d flo
wlin
es a
nd
umbi
lical
sN
/A
Econ
omic
act
ivity
(e
mpl
oym
ent a
nd in
com
e)
asso
ciat
ed w
ith fa
cilit
y de
com
mis
sion
ing
Pote
ntia
l int
erfe
renc
e w
ith
dred
ge fi
sher
ies (
e.g.
,qu
ahog
s)
N/A
A
band
onm
ent o
f pip
elin
e to
SO
EP su
bsea
tie-
in
N/A
Ec
onom
ic a
ctiv
ity
(em
ploy
men
t and
inco
me)
as
soci
ated
with
faci
lity
deco
mm
issi
onin
g
Pote
ntia
l int
erfe
renc
e w
ith
dred
ge fi
sher
ies (
e.g.
,qu
ahog
s)
N/A
Mal
func
tions
and
Acc
iden
tal E
vent
s O
ffsh
ore
Prod
uctio
n Lo
nger
pro
duct
ion
perio
d N
/A
N/A
G
reat
er sp
ill ri
sk e
xpos
ure
G
reat
er sp
ill ri
sk e
xpos
ure
to
mar
ine
trans
porta
tion,
mili
tary
us
e, a
nd o
il an
d ga
s act
ivity

Dee
p Pa
nuke
Vol
ume
4 (E
nvir
onm
enta
l Ass
essm
ent R
epor
t) N
ovem
ber 2
006
6-
25
Tab
le 6
.7
Proj
ect I
nter
actio
ns w
ith S
ocio
-eco
nom
ic V
EC
s
Soci
o-ec
onom
ic V
EC
s Pr
ojec
t Com
pone
nt
Proj
ect M
odifi
catio
n L
and
Use
E
cono
my
Com
mer
cial
Fish
erie
s an
d A
quac
ultu
re
Oth
er O
cean
Use
rs
R
eloc
atio
n of
fiel
d ce
ntre
N
/A
N/A
C
hang
e in
loca
tion
of
acci
dent
al sp
ill/
atm
osph
eric
rele
ases
Cha
nge
in lo
catio
n of
ac
cide
ntal
spill
/atm
osph
eric
re
leas
es p
oten
tially
aff
ectin
g m
arin
e tra
nspo
rtatio
n, m
ilita
ry
use,
and
oil
and
gas a
ctiv
ity
Flow
lines
, um
bilic
als,
wel
ls
and
subs
ea p
rote
ctio
n N
/A
N/A
C
hang
e in
loca
tion
of
acci
dent
al sp
ill/
atm
osph
eric
rele
ases
; in
crea
sed
spill
/air
rele
ase
risk
expo
sure
Gre
ater
spill
/atm
osph
eric
re
leas
e ris
k ex
posu
re to
m
arin
e tra
nspo
rtatio
n, m
ilita
ry
use,
and
oil
and
gas a
ctiv
ity
Subs
ea E
quip
men
t
Pipe
line
to S
OEP
subs
ea ti
e-in
(SO
EP S
ubse
a O
ptio
n O
nly)
N/A
N
/A
New
spill
/atm
osph
eric
re
leas
e ris
k ex
posu
re;
pote
ntia
l int
erac
tions
with
qu
ahog
fish
ery
and
othe
r fis
hing
act
iviti
es
New
spill
/atm
osph
eric
rele
ase
risk
expo
sure
pot
entia
lly
affe
ctin
g m
arin
e tra
nspo
rtatio
n, m
ilita
ry u
se,
and
oil a
nd g
as a
ctiv
ity
Ons
hore
Pip
elin
e M
odifi
catio
n to
ons
hore
pi
pelin
e co
rrid
or
Pote
ntia
l int
erac
tion
with
exi
stin
g an
d pl
anne
d la
nd u
ses (
e.g.
, Kel
tic
Petro
chem
ical
Fac
ility
and
Map
le
LNG
Fac
ility
) inc
ludi
ng g
reat
er
prob
abili
ty o
f an
acci
dent
al e
vent
N/A
N
/A
N/A

Deep Panuke Volume 4 (Environmental Assessment Report) November 2006 6-26
6.5 Scoping of Cumulative Effects Assessment
Environmental effects from individual projects can accumulate and interact to result in cumulative environmental effects. This EA considers cumulative environmental effects for each VEC as required by CEAA and the scoping document prepared by the RAs.
Project cumulative effects (i.e., those due to the accumulation and/or interaction of the Project’s own environmental effects) have been previously considered in the assessment for each VEC. This section focusses on the cumulative effects of the Project in combination with other relevant projects and activities.
The region’s natural and human environments have been affected by past and ongoing human activities. The description of the existing (baseline) environment in the approved 2002 CSR (Sections 6.1 and 7.2) and this document (Section 7) reflects the effects of these other anthropogenic pressures. The evaluation of cumulative environmental effects considers the nature and degree of change from these baseline environmental conditions as a result of the revised Project, in combination with other on-going and planned projects and activities.
An environmental assessment pursuant to CEAA must include consideration of the cumulative environmental effects for "reasonably foreseeable" projects or activities if they may affect the VECs and there is enough information about them to assess their effects (Cumulative Effects Assessment Working Group and AXYS Environmental Consulting Ltd. 1999). A critical step in the environmental assessment, therefore, is determining what other projects or activities have reached a level of certainty (e.g., “reasonably foreseeable”) such that they must be considered in the EA. The other projects and activities considered in this assessment are those that are ongoing or likely to proceed, and have been issued permits, licenses, leases or other forms of approval or entered the regulatory approvals process.
It is helpful to consider the clarification provided by the Joint Review Panel for the Express Pipeline Project in Alberta. Following an analysis of subsection 16(1)(a) of CEAA, that Joint Review Panel determined that certain requirements must be met for the Panel to consider cumulative environmental effects:
there must be a measurable environmental effect of the project being proposed; environmental effect must be demonstrated to operate cumulatively with the environmental effects from other projects or activities; and it must be known that the other projects or activities have been, or will be, carried out and are not hypothetical (NEB and CEA Agency 1996).

Deep Panuke Volume 4 (Environmental Assessment Report) November 2006 6-27
Furthermore, the Joint Review Panel indicated that it is an additional requirement that the cumulative environmental effects is likely to occur, that is, there must be some probability, rather than a mere possibility, that the cumulative environmental effect will occur. These criteria were used to guide the assessment of cumulative environmental effects for this Project.
A scoping exercise has been conducted to identify other past, present, and future projects and activities, the effects of which may interact cumulatively with those of the Project. These are limited to those projects and activities that have or will likely occur (e.g., seeking regulatory approvals) within the study area (Figure 6.1). As any measurable Project-related effects will occur within this study area, it is also reasonable to assume that any potential for cumulative effects will also occur within this study area.
These projects have been selected based on a review of those projects and activities considered in the approved 2002 CSR and updated accordingly. The Blue Atlantic Transmission System, Hudson Energy Company Power Project and Neptune Subsea Electrical Transmission System have not been reconsidered in this assessment as these projects have either been cancelled or put on hold indefinitely. The Sable Island Wind Turbine Project is proceeding, with the installation of wind turbines in March 2006 (previously reported to be constructed in 2002). However, operation of the turbines has yet to begin as of October 2006. New projects that have emerged since the approved 2002 CSR include the Keltic Petrochemical Plant and Maple LNG Facility in Goldboro. A list of these projects and brief description is provided below. These projects are also depicted on Figure 6.1.
Cohasset Project – The Cohasset Project began oil production in 1992 and produced 44.5 million barrels of oil over its 7.5 year production life. Decommissioning of the Cohasset facilities has been completed in accordance with EnCana’s decommissioning plan which involved removal of the platforms and subsea equipment which could pose a snagging hazard, and abandonment of buried flowlines, cables and mattresses in situ. EnCana plans to conduct a final field close out survey in fall 2006. A follow-up survey is planned by fall 2009.
Sable Offshore Energy Project – This natural gas development project consists of offshore platforms (manned central processing complex at Thebaud; unmanned satellite platforms at other locations), subsea interfield flowlines, export pipeline to shore (Goldboro), and onshore facilities (gas plant in Goldboro and fractionation plant in Point Tupper, interconnected by a natural gas liquids (NGL) pipeline). Tier I development included development of the Thebaud, North Triumph and Venture fields along with associated pipelines and onshore facilities. First gas flowed in December 1999. Tier II development has included installation and commissioning of platforms at Alma (2004) and South Venture (2005) fields as the installation of associated pipelines. A compression platform was installed as a part of the Thebaud complex in May/June 2006 with commissioning expected to be completed by year end.

5440
00
5440
00
6440
00
6440
00
7440
00
7440
00
8440
00
8440
00
4849000
4849000
4949000
4949000
OtherProjects&
ActivitiesRelativeto
DeepPanuke
ProjectArea
025
5012
.5
Kilo
met
ers
Map
Para
met
ers
Proj
ectio
n:U
TM-N
AD
83-Z
20Sc
ale
1:1,
000,
000
Dat
e:O
ctob
er20
,200
6Pr
ojec
tNo.
:101
5157
Figure6.1
SableIsland
NOVA
SCOTIA
DeepPanukeMOPU
CohassetProject
DeepPanukeProject
Dee
pP
anuk
eM
OPU
SOEP
Subs
eaO
ptio
nP
ipel
ine
M&
NP
Opt
ion
Pip
elin
e
Star
t-up
Flow
lines
SOEP
Facilities
SOEP
Plat
form
s
SOEP
Expo
rtan
dIn
terfi
eld
Pipe
lines
OffshorePetroleumInterests
Cur
rent
Exp
lora
tion
Lice
nse
Past
Exp
lora
tion
Lice
nse
Sign
ifica
ntD
isco
very
orP
rodu
ctio
nLi
cens
e
Keltic/MapleProject
Proj
ectL
ocat
ion:
See
Inse
t
Gol
dbor
o
ProposedKeltic
Petrochemicals
Plant&
Maple
LNGFacility
SOEP GAS
PLANT
Isaacs
Harbou
rGoldboro
020
4010
Kilo
met
ers
OnshoreFacilities
M&
NP
Mai
nlin
e
SOEP
NG
LLi
nean
dM
&NP
Poin
tTup
perL
ater
al
Subs
eaTe
leco
mm
unic
atio
nsC
able
s
EnC
ana
Prop
osed
Ons
hore
Cor
ridor
Prev
ious
Wel
lLoc
atio
ns(C
NS
OP
BW
ellD
irect
ory
(May
2006
))
Dec
omm
issi
onin
gLo
catio
n:Se
eIn
set
Dat
aS
ourc
e:w
ww
.cns
opb.
ns.c
a/
PL2902
PL2901
DeepPanukeMOPU
Flowline
Flowline
Flowlines
PowerCable
M&NP O
ption Pi
peline
SOEPSubs
eaOptionP
ipeline
100m
COHASSET
DECOMMISSIONINGINSET
04
82
Kilometers
KELTIC/MAPLEPROJECTINSET

Deep Panuke Volume 4 (Environmental Assessment Report) November 2006 6-29
Maritimes & Northeast Pipeline (M&NP) Gas Transmission- The M&NP system is a 1,300-kilometre transmission pipeline system built in 1999 to transport natural gas from developments offshore Nova Scotia to markets in Atlantic Canada and the northeastern United States. The M&NP system consists of 760 mm [30 inch]/600 mm [24 inch] mainline that runs from the SOEP gas plant at landfall in Goldboro, through Nova Scotia and New Brunswick, to the northeastern United States. The M&NP Option for the Deep Panuke Project involves tie-in to an M&NP custody transfer station bypassing the SOEP gas plant.
Keltic Petrochemicals Inc. and Maple LNG Project (Keltic/Maple Project) – Keltic Petrochemicals Inc. proposes to construct and operate a petrochemical and LNG facility near Goldboro, NS. The Project components include a LNG regasification facility, a petrochemical complex, a marginal wharf, a marine LNG terminal, LNG storage and an electric co-generation facility. The processing facilities will require approximately 300 ha of land zoned for industrial use in the Goldboro Industrial Park. Maple LNG will acquire 100% of the LNG portion of the project. Pending regulatory approval, project construction is planned to occur from Spring 2007 to the end of 2009, with commissioning to occur in Winter 2010. This project is currently undergoing environmental assessment under the Nova Scotia Environment Act and CEAA. The draft environmental assessment report (AMEC 2006) predicts several significant benefits to the local and regional economy. It also predicts a loss of terrestrial habitat (>700 ha, including impoundment of Meadow Lake), significant changes to freshwater aquatic habitat (due to creation of reservoir at Meadow Lake), and significant additional demands on local and regional roadways.
In addition to specific projects, the following activities (past, present and future) could interact cumulatively with the Project:
offshore petroleum exploration drilling (past, present, and future activity); seismic exploration (past, present, and future activity); research surveys (past, present, and future activity); shipping (domestic and international) (past, present, and future activity); commercial fishery (past, present, and future activity); commercial whaling (past activity); tourism (past, present, and future activity); military exercises (past, present, and future activity); use and occupation of Sable Island (past, present, and future activity); long-range transport of air pollutants; andtelecommunication cables (past, present, and future activity).

Deep Panuke Volume 4 (Environmental Assessment Report) November 2006 6-30
These activities were considered in the cumulative effects assessment (CEA) for biophysical VECs presented in the approved 2002 CSR (Section 6.3.9). The CEA contained in this EA Report only reconsiders those activities that:
have changed since 2002 such that the cumulative effects would differ than that originally predicted; or
interact cumulatively with the revised Project options, resulting in different cumulative effects than originally predicted for the 2002 Project basis.
Tables 6.8 and 6.9 consider potential interactions of the above projects and activities with the biophysical and socio-economic VECs, respectively. These interactions are discussed further within the respective cumulative effects sections (Section 8.9 and 9.5).

Dee
p Pa
nuke
Vol
ume
4 (E
nvir
onm
enta
l Ass
essm
ent R
epor
t) N
ovem
ber 2
006
6-3
1
Tab
le 6
.8
Scop
ing
of P
oten
tial C
umul
ativ
e In
tera
ctio
ns w
ith B
ioph
ysic
al V
EC
s B
ioph
ysic
al V
EC
O
ther
Pro
ject
s and
A
ctiv
ities
(Pas
t, Pr
esen
t, Fu
ture
) w
ith P
oten
tial f
or
Cum
ulat
ive
Effe
cts
Scop
ing
Con
side
ratio
ns
Air Quality
Marine Water Quality
Marine Benthos
Marine Fish
Marine Mammals and Turtles
Marine Related Birds
Sable Island
Onshore Environment
Pote
ntia
l Int
erac
tions
Coh
asse
t Pro
ject
(P
ast,
Pres
ent,
Futu
re)
Proj
ects
hav
e ov
erla
ppin
g fo
otpr
ints
.C
umul
ativ
e in
tera
ctio
ns w
ith
past
eff
ects
con
side
red
in
appr
oved
200
2 C
SR.
CEA
will
focu
s on
pote
ntia
l ov
erla
p be
twee
n C
ohas
set
deco
mm
issi
oned
stru
ctur
es
and
Proj
ect i
nfra
stru
ctur
e.
Pr
esen
ce o
f bur
ied
pipe
line,
inte
rfie
ld fl
owlin
es,
umbi
lical
s and
mat
tress
es; r
eef a
nd re
fuge
eff
ects
on
fish
and
ben
thic
org
anis
ms
Sabl
e O
ffsh
ore
Ener
gy P
roje
ct
(Pas
t, Pr
esen
t, Fu
ture
)
CEA
in a
ppro
ved
2002
CSR
re
quire
s upd
ate
with
resp
ect
to c
hang
es in
air
emis
sion
s, be
nthi
c ef
fect
s, an
d ch
ange
in
ons
hore
Pro
ject
loca
tion.
Air
emis
sion
s; e
ffec
ts o
n se
dim
ent a
nd b
enth
ic
com
mun
ities
; los
s of t
erre
stria
l hab
itat
M&
NP
Gas
Tr
ansm
issi
on (P
ast,
Pres
ent,
Futu
re)
CEA
in a
ppro
ved
2002
CSR
re
quire
s upd
ate
to re
flect
ch
ange
in o
nsho
re c
orrid
or
and
cust
ody
trans
fer s
tatio
n.
Lo
ss o
f ter
rest
rial h
abita
t; er
osio
n an
d se
dim
enta
tion;
sens
ory
dist
urba
nce
to w
ildlif
e
Sabl
e Is
land
Win
d Tu
rbin
e Pr
ojec
t C
EA in
app
rove
d 20
02 C
SR re
mai
ns v
alid
des
pite
Pro
ject
mod
ifica
tions
. No
furth
er a
sses
smen
t nec
essa
ry.
Kel
tic
Petro
chem
ical
Pla
nt
and
Map
le L
NG
Fa
cilit
y (P
ropo
sed)
CEA
requ
ires u
pdat
e to
in
clud
e th
is n
ew p
roje
ct in
on
shor
e/ne
arsh
ore
stud
y ar
ea.
Loss
of t
erre
stria
l hab
itat;
eros
ion
and
sedi
men
tatio
n; tr
affic
; sen
sory
dis
turb
ance
to
wild
life;
air
emis
sion
s; d
istu
rban
ce to
nea
rsho
re
bent
hos;
acc
iden
tal e
vent
s
Off
shor
eEx
plor
atio
n D
rillin
gC
EA in
app
rove
d 20
02 C
SR re
mai
ns v
alid
des
pite
Pro
ject
mod
ifica
tions
. No
furth
er a
sses
smen
t nec
essa
ry.
Seis
mic
Exp
lora
tion
CEA
in a
ppro
ved
2002
CSR
rem
ains
val
id d
espi
te P
roje
ct m
odifi
catio
ns. N
o fu
rther
ass
essm
ent n
eces
sary
. Sh
ippi
ng
CEA
in a
ppro
ved
2002
CSR
rem
ains
val
id d
espi
te P
roje
ct m
odifi
catio
ns. N
o fu
rther
ass
essm
ent n
eces
sary
.
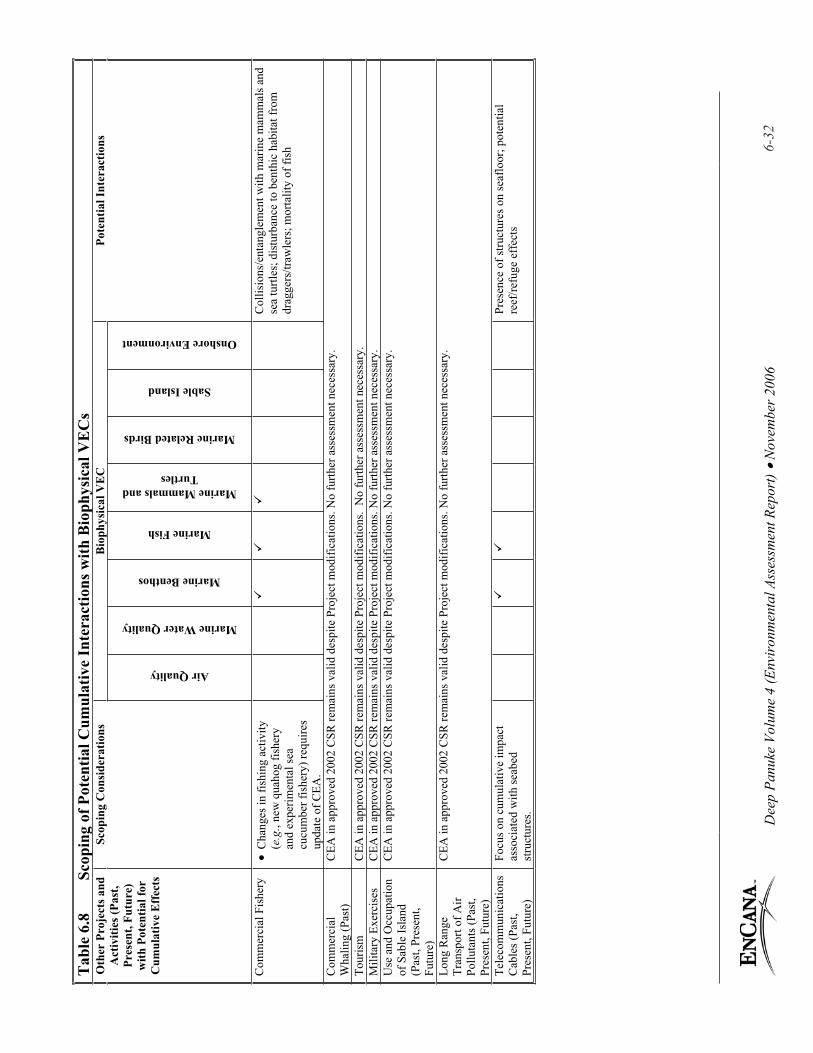
Dee
p Pa
nuke
Vol
ume
4 (E
nvir
onm
enta
l Ass
essm
ent R
epor
t) N
ovem
ber 2
006
6-3
2
Tab
le 6
.8
Scop
ing
of P
oten
tial C
umul
ativ
e In
tera
ctio
ns w
ith B
ioph
ysic
al V
EC
s B
ioph
ysic
al V
EC
O
ther
Pro
ject
s and
A
ctiv
ities
(Pas
t, Pr
esen
t, Fu
ture
) w
ith P
oten
tial f
or
Cum
ulat
ive
Effe
cts
Scop
ing
Con
side
ratio
ns
Air Quality
Marine Water Quality
Marine Benthos
Marine Fish
Marine Mammals and Turtles
Marine Related Birds
Sable Island
Onshore Environment
Pote
ntia
l Int
erac
tions
Com
mer
cial
Fis
hery
C
hang
es in
fish
ing
activ
ity
(e.g
., ne
w q
uaho
g fis
hery
an
d ex
perim
enta
l sea
cu
cum
ber f
ishe
ry) r
equi
res
upda
te o
f CEA
.
C
ollis
ions
/ent
angl
emen
t with
mar
ine
mam
mal
s and
se
a tu
rtles
; dis
turb
ance
to b
enth
ic h
abita
t fro
m
drag
gers
/traw
lers
; mor
talit
y of
fish
Com
mer
cial
W
halin
g (P
ast)
CEA
in a
ppro
ved
2002
CSR
rem
ains
val
id d
espi
te P
roje
ct m
odifi
catio
ns. N
o fu
rther
ass
essm
ent n
eces
sary
.
Tour
ism
C
EA in
app
rove
d 20
02 C
SR re
mai
ns v
alid
des
pite
Pro
ject
mod
ifica
tions
. N
o fu
rther
ass
essm
ent n
eces
sary
. M
ilita
ry E
xerc
ises
C
EA in
app
rove
d 20
02 C
SR re
mai
ns v
alid
des
pite
Pro
ject
mod
ifica
tions
. No
furth
er a
sses
smen
t nec
essa
ry.
Use
and
Occ
upat
ion
of S
able
Isla
nd
(Pas
t, Pr
esen
t, Fu
ture
)
CEA
in a
ppro
ved
2002
CSR
rem
ains
val
id d
espi
te P
roje
ct m
odifi
catio
ns. N
o fu
rther
ass
essm
ent n
eces
sary
.
Long
Ran
ge
Tran
spor
t of A
ir Po
lluta
nts (
Past
, Pr
esen
t, Fu
ture
)
CEA
in a
ppro
ved
2002
CSR
rem
ains
val
id d
espi
te P
roje
ct m
odifi
catio
ns. N
o fu
rther
ass
essm
ent n
eces
sary
.
Tele
com
mun
icat
ions
Cab
les (
Past
, Pr
esen
t, Fu
ture
)
Focu
s on
cum
ulat
ive
impa
ct
asso
ciat
ed w
ith se
abed
st
ruct
ures
.
Pres
ence
of s
truct
ures
on
seaf
loor
; pot
entia
l re
ef/re
fuge
eff
ects

Dee
p Pa
nuke
Vol
ume
4 (E
nvir
onm
enta
l Ass
essm
ent R
epor
t) N
ovem
ber 2
006
6-3
3
Tab
le 6
.9
Scop
ing
of P
oten
tial C
umul
ativ
e In
tera
ctio
ns w
ith S
ocio
-eco
nom
ic V
EC
s So
cio-
econ
omic
VE
C
Oth
er P
roje
cts a
nd
Act
iviti
es (P
ast,
Pres
ent,
Futu
re) w
ith
Pote
ntia
l for
C
umul
ativ
e E
ffect
s
Scop
ing
Con
side
ratio
ns
Land Use
Economy
Commercial Fisheries and Aquaculture
Other Ocean Users
Pote
ntia
l Int
erac
tions
Coh
asse
t Pro
ject
(Pas
t an
d Pr
esen
t) So
cio-
econ
omic
CEA
in
appr
oved
200
2 C
SR d
id n
ot
expl
icitl
y in
clud
e C
ohas
set
Proj
ect.
C
EA w
ill fo
cus o
n pr
esen
ce o
f sa
fety
zon
e an
d ov
erla
p be
twee
n C
ohas
set
deco
mm
issi
oned
stru
ctur
es a
nd
Proj
ect i
nfra
stru
ctur
e.
Pres
ence
of s
afet
y (n
o fis
hing
) zon
e; p
rese
nce
of st
ruct
ures
on
the
seaf
loor
; ef
fect
s on
publ
ic n
avig
atio
n an
d fis
hing
act
iviti
es
Sabl
e O
ffsh
ore
Ener
gy
Proj
ect (
Past
, Pre
sent
, Fu
ture
)
Soci
o-ec
onom
ic C
EA in
ap
prov
ed 2
002
CSR
add
ress
ed
cum
ulat
ive
econ
omic
eff
ects
. C
EA re
quire
s upd
ate
with
re
spec
t to
cum
ulat
ive
effe
cts
on fi
sher
ies a
nd o
ther
oce
an
user
s, an
d to
refle
ct c
hang
e in
on
shor
e Pr
ojec
t loc
atio
n (la
nd
use)
.
Pres
ence
of s
afet
y (n
o fis
hing
) zon
e; e
ffec
ts o
n pu
blic
nav
igat
ion;
reef
/refu
ge
effe
cts f
or fi
sh; i
ndus
trial
land
use
in st
udy
area
M&
NP
Gas
Tr
ansm
issi
on (P
ast,
Pres
ent,
Futu
re)
CEA
in a
ppro
ved
2002
CSR
re
quire
s upd
ate
to re
flect
ch
ange
in o
nsho
re c
orrid
or a
nd
cust
ody
trans
fer s
tatio
n.
In
dust
rial l
and
use
in st
udy
area
Kel
tic P
etro
chem
ical
Pl
ant a
nd M
aple
LN
G
Faci
lity
(Pro
pose
d)
CEA
requ
ires u
pdat
e to
incl
ude
this
new
pro
ject
in
onsh
ore/
near
shor
e st
udy
area
.
Con
tribu
tion
to p
rovi
ncia
l eco
nom
y; e
ffec
ts o
n ne
arsh
ore
fishe
ries a
nd
aqua
cultu
re; i
ndus
trial
land
use
in st
udy
area
; mar
ine
traff
ic; r
isk
for a
ccid
enta
l ev
ent
Off
shor
e Pe
trole
um
Expl
orat
ion
Dril
ling
(Pas
t, Pr
esen
t, Fu
ture
)
CEA
in a
ppro
ved
2002
CSR
rem
ains
val
id d
espi
te P
roje
ct m
odifi
catio
ns. N
o fu
rther
ass
essm
ent n
eces
sary
.

Dee
p Pa
nuke
Vol
ume
4 (E
nvir
onm
enta
l Ass
essm
ent R
epor
t) N
ovem
ber 2
006
6-3
4
Tab
le 6
.9
Scop
ing
of P
oten
tial C
umul
ativ
e In
tera
ctio
ns w
ith S
ocio
-eco
nom
ic V
EC
s So
cio-
econ
omic
VE
C
Oth
er P
roje
cts a
nd
Act
iviti
es (P
ast,
Pres
ent,
Futu
re) w
ith
Pote
ntia
l for
C
umul
ativ
e E
ffect
s
Scop
ing
Con
side
ratio
ns
Land Use
Economy
Commercial Fisheries and Aquaculture
Other Ocean Users
Pote
ntia
l Int
erac
tions
Seis
mic
Exp
lora
tion
CEA
in a
ppro
ved
2002
CSR
rem
ains
val
id d
espi
te P
roje
ct m
odifi
catio
ns. N
o fu
rther
ass
essm
ent n
eces
sary
. C
omm
erci
al F
ishe
ry
(Pas
t, Pr
esen
t, Fu
ture
) C
hang
es in
fish
ing
activ
ity
(e.g
., ne
w q
uaho
g fis
hery
and
ex
perim
enta
l sea
cuc
umbe
r fis
hery
) req
uire
s upd
ate
of
CEA
.
Con
tribu
tion
to p
rovi
ncia
l eco
nom
y; d
egra
datio
n of
mar
ine
bent
hos;
fish
m
orta
lity;
mar
ine
traff
ic
Mili
tary
Exe
rcis
es
(Pas
t, Pr
esen
t, Fu
ture
) C
EA to
con
side
r ves
sel t
raff
ic
and
hydr
oaco
ustic
s.M
arin
e tra
ffic
; noi
se; i
nter
actio
ns w
ith fi
sher
ies
Use
and
Occ
upat
ion
of
Sabl
e Is
land
(Pas
t, Pr
esen
t, Fu
ture
)
CEA
in a
ppro
ved
2002
CSR
rem
ains
val
id d
espi
te P
roje
ct m
odifi
catio
ns. N
o fu
rther
ass
essm
ent n
eces
sary
.
Tele
com
mun
icat
ions
Cab
les (
Past
, Pre
sent
, Fu
ture
)
Focu
s on
cum
ulat
ive
impa
ct
asso
ciat
ed w
ith se
abed
stru
ctur
es
Pr
esen
ce o
f stru
ctur
es o
n se
aflo
or p
oten
tially
aff
ectin
g co
mm
erci
al fi
sher
ies

Deep Panuke Volume 4 (Environmental Assessment Report) November 2006 7-1
7 BIOPHYSICAL AND SOCIO-ECONOMIC SETTING
7.1 Biophysical Setting
7.1.1 Marine Physical Environment
The description of the marine physical environment presented in the approved 2002 CSR remains valid for the purposes of this assessment (refer to Section 6.1.1 of the approved 2002 CSR). In particular, descriptions of climatology, air quality, physical oceanography, water quality, sediment quality and marine geology and geomorphology remain generally applicable and do not require updates, considering the change in field centre location and proposed pipeline associated with the SOEP Subsea Option.
However, new information has become available with respect to nearshore sediment contamination in Isaacs Harbour. In May and August 2004, Natural Resources Canada (NRCan) and DFO carried out a collaborative field program to determine impacts of historical mine tailings disposal on marine sediments and water in the Isaacs and Seal Harbour areas. Although these findings have yet to be published, consultation with NRCan has revealed some sampling sites in Isaacs Harbour show sediments containing elevated levels of arsenic and mercury up to 60 ppm and 470 ppb, respectively (C. Lockett, NRCan, pers. comm. 2006). These reported levels are in excess of the CCME Interim Marine Sediment Quality Guidelines, which stipulate that concentrations of arsenic and mercury in sediments should not exceed 7.24 ppm and 130 ppb, respectively (CCME 2005).
Arsenic and mercury concentrations in surface sediments at the sampling point nearest EnCana’s proposed nearshore pipeline corridor indicated arsenic levels between 4-10 ppm and mercury concentrations between 5-43 ppb (C. Lockett, NRCan, pers. comm. 2006). Furthermore, sampling during the Deep Panuke 2001 nearshore pipeline route survey found no evidence of sediments contaminated from old mine tailings (refer to Section 6.3.9.3 of the approved 2002 CSR). Therefore, it is not expected that sediments contaminated by old mine tailings will be encountered during construction of the M&NP Option pipeline.
Deep Panuke Volume 4 (Environmental Assessment Report) November 2006 7-2
7.1.2 Marine Biological Environment
7.1.2.1 Marine Benthos
Benthic Habitat and Communities in the Offshore Environment
The evaluation of benthic communities and habitat in the offshore Project area in the approved 2002 CSR (Section 6.1.2.1) was derived from information presented in the SOEP EIS (SOEP 1996a, 1996b), data collected for the Cohasset Project (John Parsons & Associates 1994), and site specific benthic habitat surveys (JWEL 2000a, 2000b; JWEL 2003). These data remain valid for the description of benthic habitat and communities for the new proposed Project Options. In addition, the Study Team reviewed wellsite surveys conducted by EnCana on Sable Island Bank. These wellsite surveys (refer to Figure 7.1 for coverage) are of high relevance in terms of facilitating the assessment of benthic communities and habitats in the new proposed Project footprint. A more detailed description of benthic habitat is provided in the updated Baseline Benthic Report (JW 2006).
The relocation of the field centre by approximately 3.6 km to the northeast of the original production platform location as per the approved 2002 CSR Project basis and the new field subsea structures (subsea wells, flowlines, and umbilicals) will not require changes to the description of benthic habitat and communities. Benthic communities contained within the footprints of the MOPU and subsea equipment are expected to be similar to the habitat described in the approved 2002 CSR in the area surrounding the 2002 Project location due to the habitat homogeneity of the area, and similar depth and close spatial proximity to the previously approved Project location.
The M&NP Option consists of a dedicated pipeline from the MOPU to shore, partially paralleling the SOEP pipeline. This route is relatively unchanged from the approved 2002 CSR Project basis, with the exception of the first 37 km from the new field centre. As discussed above, a review of data collected in the general Project area suggests the description of existing conditions provided in the approved 2002 CSR (Section 6.1.2.1) for the offshore pipeline route remains valid despite the minor modification in the offshore pipeline route, primarily due to the habitat homogeneity of the Sable Bank. However, since the publication of the approved 2002 CSR, an experimental sea cucumber (Cucumaria frondosa) fishery zone has been designated in an area that will be transected by the M&NP Option export pipeline (refer to Figure 7.2). Although the approved 2002 CSR identified this species as being present in the Project area, benthic surveys and seafloor video reconnaissance in this area have not revealed the presence of sea cucumbers in large numbers. The export pipeline options are in close proximity to concentrations of ocean quahog (Arctica islandica)identified as being present in the Project area in the approved 2002 CSR on Sable Island Bank. More information on sea cucumbers and quahogs commercial fishing activities is provided in Section 7.3.

6740
00
6740
00
6840
00
6840
00
6940
00
6940
00
7040
00
7040
00
4849000
4849000
4859000
4859000
4869000
4869000
ExistingData
Sourcesfor
Characterization
ofMarineBenthos
02.
55
1.25
Kilo
met
ers
Map
Para
met
ers
Proj
ectio
n:U
TM-N
AD
83-Z
20Sc
ale
1:10
0,00
0D
ate:
Oct
ober
17,2
006
Proj
ectN
o.:1
0151
58
MapFeatures
Dee
pPa
nuke
Subs
eaW
ells
Star
t-up
Flow
lines
EnC
ana
22"E
xpor
tPip
elin
e(M
&NP
Opt
ion)
EnC
ana
20"E
xpor
tPip
elin
e(S
OEP
Subs
eaO
ptio
n)
SOEP
Expo
rtPi
pelin
ePreviousWellsiteSurveys
EnC
ana
Wel
lsite
Surv
eys
(200
2)
EnC
ana
Wel
lsite
Surv
eys
(200
0-01
)
Form
erD
eep
Panu
kePl
atfo
rmC
entre
Surv
ey(2
002)
Prev
ious
Dee
pPa
nuke
Pipe
line
Rou
teSu
rvey
s
EL2357
GRANDPRE
PL2901
COHASSET
EL2387
MARGAREE
PL2902
PANUKE
MAR
COH
D-4
1
MAR
GAR
EEF-
70
ACID
GAS
DIS
POSA
LW
ELL
D-7
0
Panu
keM
-79A
Panu
keH
-99
Panu
keF-
09(F
JG,2
000)
EL2360
LOWER
MUSQUODOBOIT
SOE
P26
"PI
PEL
INE
TOSO
EPG
AS
PLA
NT
22"
EN
CA
NA
PIPE
LIN
EM
&N
PO
PTIO
N
20"
EN
CA
NA
PIPE
LIN
ESO
EP
SUB
SEA
OPT
ION
Figure7.1
(FugroJacquesGeoSurveysInc.)
Panu
keH
-08
(FJG
,200
0)
Que
ensl
and
M-8
8(F
JG,2
000)
Panu
keM
-79
(FJG
,200
0)
Coha
sset
(FJG
,200
2)
EnC
ana
EEM
Mas
terS
ampl
ing
Grid
s(J
WEL
2003
)
TOSO
EPPL
ATFO
RM
S
Form
erD
eep
Pan
uke
Expo
rtPi
pelin
e&
M79
and
H08
Flow
line
Surv
ey(2
001)
PREVIOUSDEEPPANUKEPIPELINE
ROUTE
SURVEY
PREVIOUSDEEPPANUKEPIPELINE
ROUTE
SURVEY

MiddleBank
SableIslandBank
6440
00
6440
00
7440
00
7440
00
4849000
4849000
2003DFO
OceanQuahog
Distribution&
SeaCucumber
Experim
ental
FisheryZone1
010
205 K
ilom
eter
s
Map
Par
amet
ers
Proj
ectio
n:U
TM-N
AD
83-Z
20Sc
ale
1:60
0,00
0D
ate:
Oct
ober
25,2
006
Proj
ectN
o.:1
0151
57D
ata
Sou
rce:
DFO
2003DFO
SurveyResearch
OceanQuahogDensities
Kg/1000m²
<1 1 250
750
1500
2500Figure7.2
SableIsland
ProjectComponents
Dee
pP
anuk
eM
OPU
Dee
pP
anuk
eSu
bsea
Wel
ls
SOEP
Pla
tform
s
EnC
ana
22"E
xpor
tPip
elin
e(M
&NP
Opt
ion)
EnC
ana
20"E
xpor
tPip
elin
e(S
OEP
Sub
sea
Opt
ion)
SOEP
Exp
ortP
ipel
ine
Star
t-up
Flow
lines
Gul
lyM
PA
DeepPanuke
Sea
Cuc
umbe
rExp
erim
enta
lFi
sher
yZo
ne1

Deep Panuke Volume 4 (Environmental Assessment Report) November 2006 7-5
The SOEP Subsea Option consists of subsea tie-in to the existing SOEP 660 mm [26 inch] pipeline downstream of the Thebaud complex. This pipeline would cross a 15 km area of Sable Island Bank that was not sampled during previous benthic surveys conducted in support of the approved 2002 CSR. Sable Island Bank is known to be an area of relatively homogeneous, sandy benthic habitat (Amos and Nadeau 1988; Breeze et al. 2002; Carter et al. 1985; JWEL 2000a, 2000b; JWEL 2003; John Parsons & Associates Biological Consultants 1994). As a result of the regional homogeneity of surficial sediment characteristics coupled with similar physical, chemical and biological conditions, the benthic communities in the area of the SOEP Subsea Option export pipeline are expected to be similar as those described in the approved 2002 CSR for the offshore (Sable Island Bank) environment. As such, the description of existing conditions for marine benthos provided in the approved 2002 CSR remains valid. However, similar to the M&NP Option, this export pipeline option is known to be in close proximity to concentrations of ocean quahog.
Benthic Habitat and Communities in the Nearshore Environment
Benthic sampling was conducted in 2002 to characterize the benthic habitat along the nearshore sections of the pipeline route to shore. The current proposed pipeline route to shore (M&NP Option) follows the same general route as the 2002 Base Case pipeline. As such, the description of existing conditions for the 2002 Project basis remains valid. Please refer to Section 6.1.2.1 of the approved 2002 CSR for a description of marine benthos in the nearshore environment. Refer also to updated information on potential sediment contamination in the vicinity of the nearshore pipeline route.
7.1.2.2 Marine Fish
The description of marine fish contained in the approved 2002 CSR (Section 6.1.2.2) remains valid for this EA Report with the exception of the designation of some fish species at risk. Since the publication of the approved 2002 CSR, there have been updates to the list of fish species at risk. Table 7.1 lists the fish species at risk and their current designation. None of these species are common to the Project area, nor is there any appreciable evidence of spawning activity by any of these species within the immediate Project area (COSEWIC 2003a, b, 2004, 2005, 2006a, b; Campana et al. 2005; Kulka and Simpson 2004; Simon et al. 2003).

Dee
p Pa
nuke
Vol
ume
4 (E
nvir
onm
enta
l Ass
essm
ent R
epor
t) N
ovem
ber 2
006
7-6
Tab
le 7
.1
Mar
ine
Fish
Spe
cies
at R
isk
Off
shor
e N
ova
Scot
ia
Mar
ine
Fish
Sp
ecie
sC
OSE
WIC
/ SAR
ASt
atus
Dis
trib
utio
n H
abita
t Sp
awni
ng
Atla
ntic
Cod
(G
adus
mor
hua)
(Mar
itim
e Po
pula
tion)
CO
SEW
IC
Spec
ies o
f Spe
cial
C
once
rn (2
003)
SARA
Rec
omm
ende
d to
not
be
liste
d un
der S
ARA
(200
5)
Inha
bit a
ll w
ater
s ove
r the
co
ntin
enta
l she
lves
of t
he
Nor
thw
est a
nd N
orth
east
Atla
ntic
O
cean
(CO
SEW
IC 2
003a
)
Adu
lts fo
und
in d
iver
se h
abita
ts
incl
udin
g co
asta
l wat
ers a
nd
offs
hore
ban
ks (C
OSE
WIC
20
03a)
It is
not
kno
wn
if co
d ha
ve
spec
ific
spaw
ning
hab
itats
and
is
hig
hly
unlik
ely
that
sp
awni
ng h
abita
t is l
imiti
ng
(CO
SEW
IC 2
003a
) Eg
gs a
re b
uoya
nt
Spaw
ning
occ
urs o
n Sa
ble
Isla
nd B
ank
from
Sep
tem
ber t
o M
ay w
ith a
pea
k in
Nov
embe
r, an
d th
roug
h w
inte
r, ad
ditio
nal
peak
in M
ay/J
une
Atla
ntic
Wol
ffis
h (A
narh
icha
s lu
pus)
(Atla
ntic
Po
pula
tion)
CO
SEW
IC
Spec
ies o
f Spe
cial
C
once
rn (2
000)
SARA
Sp
ecia
l Con
cern
, Sc
hedu
le 1
(200
2)
Wid
ely
dist
ribut
ed a
cros
s the
N
orth
Atla
ntic
and
eas
t coa
st o
f N
orth
Am
eric
a (E
nviro
nmen
t C
anad
a 20
06c)
Prim
ary
habi
tat i
nclu
des c
old
deep
wat
er o
f the
con
tinen
tal
shel
f with
rock
y or
har
d cl
ay
botto
ms
Rar
ely
uses
are
as w
ith sa
ndy
or
mud
dy b
otto
ms (
Envi
ronm
ent
Can
ada
2006
b)
Spaw
n in
shal
low
insh
ore
wat
ers i
n sp
ring
and
Sept
embe
r (E
nviro
nmen
t Can
ada
2006
c)
No
evid
ence
of s
paw
ning
has
be
en re
porte
d in
the
Proj
ect a
rea
Spot
ted
Wol
ffis
h (A
narh
icha
s m
inor
)
(Atla
ntic
Po
pula
tion)
CO
SEW
IC
Thre
aten
ed (2
001)
SARA
Thre
aten
ed, S
ched
ule
1 (2
002)
Nor
th A
tlant
ic fr
om S
cotla
nd to
C
ape
Bre
ton
and
in th
e A
rctic
O
cean
In W
este
rn N
orth
Atla
ntic
it
prim
arily
occ
urs o
ff n
orth
east
N
ewfo
undl
and
(Env
ironm
ent
Can
ada
2006
c)
Dem
ersa
l; in
col
d co
ntin
enta
l sh
elf a
nd sl
ope
wat
ers r
angi
ng
in d
epth
from
20
to 6
00 m
on
sand
subs
trate
s with
larg
e bo
ulde
rs (E
nviro
nmen
t Can
ada
2006
c)
Spaw
ns in
sum
mer
, lar
ge e
ggs
depo
site
d en
mas
s on
sand
y bo
ttom
. You
ng re
mai
n ne
ar
botto
m (E
nviro
nmen
t Can
ada
2006
a)
No
evid
ence
of s
paw
ning
has
be
en re
porte
d in
the
Proj
ect a
rea
Nor
ther
n W
olff
ish
(Ana
rhic
has
dent
icul
atus
)
(Atla
ntic
Po
pula
tion)
CO
SEW
IC
Thre
aten
ed (2
001)
SARA
Thre
aten
ed, S
ched
ule
1 (2
002)
Nor
way
to S
outh
ern
New
foun
dlan
d (E
nviro
nmen
t C
anad
a 20
06d)
In o
ffsh
ore
cold
wat
ers <
5o C
Dep
ths o
f sur
face
to 9
00 m
pr
imar
ily >
100
m
(Env
ironm
ent C
anad
a 20
06d)
Spaw
ning
occ
urs l
ate
in th
e ye
ar
with
larg
e eg
gs la
id in
nes
ts a
nd
guar
ded
No
evid
ence
of s
paw
ning
has
be
en re
porte
d in
the
Proj
ect a
rea

Dee
p Pa
nuke
Vol
ume
4 (E
nvir
onm
enta
l Ass
essm
ent R
epor
t) N
ovem
ber 2
006
7-7
Tab
le 7
.1
Mar
ine
Fish
Spe
cies
at R
isk
Off
shor
e N
ova
Scot
ia
Mar
ine
Fish
Sp
ecie
sC
OSE
WIC
/ SAR
ASt
atus
Dis
trib
utio
n H
abita
t Sp
awni
ng
Cus
k (B
rosm
e br
osm
e)
(Atla
ntic
Po
pula
tion)
CO
SEW
IC
Thre
aten
ed (2
003)
SARA
Ref
erre
d ba
ck to
C
OSE
WIC
for f
urth
er
cons
ider
atio
n (2
005)
Inha
bits
suba
rctic
and
bor
eal
wat
ers
Cen
tre o
f abu
ndan
ce in
the
wes
tern
Atla
ntic
bet
wee
n 41
and
44
o N (C
OSE
WIC
200
3b)
Occ
urs o
n ha
rd, r
ough
, and
ro
cky
subs
trate
s sel
dom
on
smoo
th sa
ndy
botto
ms
(CO
SEW
IC 2
003b
)
Spaw
ning
from
Apr
il to
July
w
ith p
eak
in la
ter J
une
on th
e Sc
otia
n Sh
elf
Buo
yant
egg
s La
rvae
in u
pper
wat
er c
olum
n (C
OSE
WIC
200
3b)
No
evid
ence
of s
paw
ning
has
be
en re
porte
d in
the
Proj
ect a
rea
Porb
eagl
e Sh
ark
(Lam
na n
asus
)
(Atla
ntic
Po
pula
tion)
CO
SEW
IC
Enda
nger
ed (2
004)
SARA
Pend
ing
publ
ic
cons
ulta
tion
for
addi
tion
to S
ched
ule
1 lis
ting
date
Mar
ch 2
006
Dis
tribu
ted
acro
ss th
e N
orth
A
tlant
ic a
nd in
a c
ircum
glob
al
band
in th
e so
uthe
rn A
tlant
ic,
sout
hern
Indi
an, s
outh
ern
Paci
fic
and
Ant
arct
ic O
cean
s
(C
OSE
WIC
200
4a)
Spec
ies i
s a p
elag
ic, e
pipe
lagi
c or
litto
ral s
hark
mos
t com
mon
on
con
tinen
tal s
helv
es
In C
anad
ian
wat
ers t
hey
occu
r in
wat
ers
betw
een
5-10
o C(C
OSE
WIC
200
4a)
Gra
vid
fem
ales
are
pre
sent
from
la
te S
epte
mbe
r to
Dec
embe
r on
the
Scot
ian
Shel
f and
Gra
nd
Ban
ks
Mat
ing
in th
e N
orth
wes
t A
tlant
ic o
ccur
s fro
m la
te
Sept
embe
r to
Nov
embe
r with
pa
rturit
ion
eigh
t to
nine
mon
ths
late
r
(C
OSE
WIC
200
4a)
No
evid
ence
of b
reed
ing
has
been
repo
rted
in th
e Pr
ojec
t are
a Sh
ort-f
in M
ako
(I
suru
s ox
yrub
chus
)
(Atla
ntic
Po
pula
tion)
CO
SEW
IC
Thre
aten
ed (2
006)
SARA
Not
list
ed
Circ
umgl
obal
ly in
all
tropi
cal a
nd
tem
pera
te o
cean
s (D
. Mill
ar,
DFO
, per
s. co
mm
. 200
6)
Pref
er te
mpe
rate
to tr
opic
al,
litto
ral t
o ep
ipel
agic
wat
ers a
nd
are
rare
ly fo
und
in w
ater
s of l
ess
than
16o C
(D
. Mill
ar, D
FO,
pers
. com
m. 2
006)
Birt
h la
ter w
inte
r to
mid
-su
mm
er a
fter a
15
to 1
8 m
onth
ge
stat
ion
perio
d (D
. Mill
ar,
DFO
, per
s. co
mm
. 200
6)
No
evid
ence
of b
reed
ing
has
been
repo
rted
in th
e Pr
ojec
t are
a B
lue
Shar
k (P
rion
ace
glau
ca)
(Atla
ntic
Po
pula
tion)
CO
SEW
IC
Spec
ial C
once
rn (2
006)
SARA
Not
list
ed
Wor
ldw
ide
dist
ribut
ion
Abu
ndan
ce p
eaks
in w
este
rn
Can
adia
n w
ater
s in
late
sum
mer
an
d fa
ll (D
. Mill
ar, D
FO,p
ers.
com
m. 2
006)
Off
shor
e be
twee
n su
rfac
e an
d 35
0 m
(D. M
illar
, DFO
, per
s. co
mm
. 200
6)
Mat
ing
sprin
g to
ear
ly su
mm
er.
Ges
tatio
n 9
-12
mon
ths (
D.
Mill
ar, D
FO, p
ers.
com
m. 2
006)
N
o ev
iden
ce o
f spa
wni
ng h
as
been
repo
rted
in th
e Pr
ojec
t are
a

Dee
p Pa
nuke
Vol
ume
4 (E
nvir
onm
enta
l Ass
essm
ent R
epor
t) N
ovem
ber 2
006
7-8
Tab
le 7
.1
Mar
ine
Fish
Spe
cies
at R
isk
Off
shor
e N
ova
Scot
ia
Mar
ine
Fish
Sp
ecie
sC
OSE
WIC
/ SAR
ASt
atus
Dis
trib
utio
n H
abita
t Sp
awni
ng
Whi
te S
hark
(C
arch
arod
on
carc
haria
s)
(Atla
ntic
Po
pula
tion)
CO
SEW
IC
Enda
nger
ed (2
006)
SARA
Not
list
ed
Glo
bally
sub-
pola
r to
tropi
cal s
eas
(D. M
illar
, DFO
,per
s. co
mm
. 20
06)
Pela
gic;
insh
ore
to o
ffsh
ore
wat
ers;
surf
ace
to 1
280
m (D
. M
illar
, DFO
, per
s. co
mm
. 20
06)
Littl
e kn
own
of sp
awni
ng a
nd
poss
ible
pup
ping
gro
unds
off
th
e ea
st c
oast
of N
orth
Am
eric
a in
clud
es th
e M
id-A
tlant
ic B
ight
(D
. Mill
ar, D
FO, p
ers.
com
m.
2006
) N
o ev
iden
ce o
f bre
edin
g ha
s be
en re
porte
d in
the
Proj
ect a
rea
Win
ter S
kate
(L
euco
raja
oc
elat
ta)
(Eas
tern
Sco
tian
Shel
f Pop
ulat
ion)
CO
SEW
IC
Thre
aten
ed (2
005)
SARA
Pend
ing
publ
ic
cons
ulta
tion
for
addi
tion
to S
ched
ule
1
Gul
f of S
t. La
wre
nce
and
sout
hern
N
ewfo
undl
and
to C
ape
Hat
tera
s in
dept
hs o
f 1 to
371
m (S
imon
et a
l.20
03)
Ben
thic
feed
ers,
usua
lly fo
und
on sa
nd a
nd g
rave
l in
dept
hs o
f 1
to 3
71 m
(CO
SEW
IC 2
005a
)
Egg
rele
ase
late
sum
mer
and
ea
rly fa
ll w
est o
f Sab
le Is
land
(S
imon
et a
l. 20
03)
No
evid
ence
of s
paw
ning
has
be
en re
porte
d in
the
imm
edia
te
Proj
ect a
rea
Skat
e eg
g pu
rses
hav
e be
en
iden
tifie
d in
the
sea
cucu
mbe
r ex
perim
enta
l fis
hery
zon
e 1

Deep Panuke Volume 4 (Environmental Assessment Report) November 2006 7-9
7.1.2.3 Sea Turtles
The description of existing conditions for sea turtles in the approved 2002 CSR (Section 6.1.2.3) remains valid with the exception of recognizing the listing of leatherback sea turtle as endangered by SARA (refer to Section 7.1.4 for more information on SARA and requirements for listed species). As a result of this SARA listing additional information on this species has become available for reference.
In 2006, a proposed recovery strategy for leatherback sea turtle was proposed (Atlantic Leatherback Turtle Recovery Team 2006). The strategy outlines basic biology, recovery goals, objectives and performance indicators, identifies knowledge gaps, discusses permitted activities, and anticipated challenges for recovery. The recovery strategy acknowledges that the population likely exceeds several hundred thousand individuals and model results suggest that the population can sustain human induced mortality up to about 1%. A review by DFO concluded that there was scope for human-induced mortality without jeopardizing survival or recovery of the species (Atlantic Leatherback Turtle Recovery Team 2006). The primary threat to leatherback turtles in Canadian waters is entanglement in fishing gear. There is little risk for entanglement in Project subsurface infrastructure as the structures are placed far enough apart such that there are few, if any spaces for head or flipper entanglement.
Peak leatherback occurrences in Canadian waters are during August-September but there are records for leatherbacks in Canadian waters for most months of the year (McAlpine et al. 2004, cited in Atlantic Leatherback Turtle Recovery Team 2006). Adult leatherbacks enter Canadian waters to feed on their preferred prey of jellyfish and other pelagic, soft-bodied invertebrates such as salps (family Salpidae). James et al. (2006) reveals a broad distribution of leatherbacks on the Scotian Shelf throughout the foraging seasons with most reported sightings occuring inshore from the continental shelf break. This recent study suggests that coastal and slope waters of the western Atlantic should be considered critical foraging habitat for the species. It is unlikely that juveniles venture into Atlantic Canadian waters, preferring to remain in waters warmer than 26 C until they exceed 100 cm (Atlantic Leatherback Turtle Recovery Team 2006).
7.1.2.4 Marine Mammals
The description of existing conditions for marine mammals presented in the approved 2002 CSR (Section 6.1.2.4) remains valid with the exception of the updated SARA and COSEWIC status for the species discussed in Section 7.1.4. Specific changes since the approved 2002 CSR include a status downgrade of the harbour porpoise and an elevated ranking status for the northern bottlenose whale.
There are three endangered marine mammal species that could potentially be present in the study area: blue whale, North Atlantic right whale, and northern bottlenose whale.
Deep Panuke Volume 4 (Environmental Assessment Report) November 2006 7-10
There is no reliable population estimate for the blue whale population in the western North Atlantic, however, it is thought to be in the low hundreds. The biggest factor responsible for low numbers of blue whales is the historical take in commercial whaling. Threats since the end of commercial whaling include ship strikes, disturbance from increasing whale watch activity, entanglement in fishing gear, and pollution. They may also be vulnerable to long-term changes in climate change as a result of change in abundance of prey (e.g., zooplankton) (Sears and Calambokidis 2002).
The North Atlantic right whale also suffered high mortality due to whaling. The total population is currently estimated to be about 322 individuals and continues to experience high mortality from ship strikes and entanglement in fishing gear. It has been estimated that the population could become extinct in about 200 years (COSEWIC 2003c).
The COSEWIC Assessment Summary for Northern Bottlenose Whale (Scotian Shelf Population)(COSEWIC 2002) states the reason for elevating this population to endangered status is primarily due to the threat of oil and gas development in and around the prime habitat (i.e., the Gully). It does, however, acknowledge there is little information as to how this species is, or is not, affected by oil and gas development activities. The COSEWIC assessment states that noise, chemical pollution and other disturbance of oil/gas exploration and production activities might lead the whales to abandon the Gully, potentially endangering the population. The Deep Panuke Project (including new potential well locations) is more than 100 km from the Gully MPA and EnCana will abide by the Code of Practice for the Gully, thereby minimizing any interaction with this population.
7.1.2.5 Marine Related Birds
The description of existing conditions of marine related birds in the approved 2002 CSR (Section 6.1.2.5) remains valid with the exception of the updated SARA and COSEWIC status for the species discussed in Section 7.1.4.
Two bird species at risk not mentioned in the approved 2002 CSR are Barrow’s Goldeneye and Ivory Gull. Ivory Gull was, however, addressed in the Additions and Errata for the Deep Panuke Comprehensive Study Report (EnCana 2002). Based on CWS expert opinion, it was determined that the Ivory Gull could potentially occur within the area influenced by the Project. EnCana committed to consider this species for protection in environmental management plans for the Project as applicable.

Deep Panuke Volume 4 (Environmental Assessment Report) November 2006 7-11
The Ivory Gull breeds in high-Arctic coastal areas with permanent pack ice and open water (Environment Canada 2006e). The Ivory Gull breeds in colonies of a few to more than 150 pairs. Nesting success is determined by weather conditions, predation and human disturbances. For example, they may abandon eggs if approached by low-flying aircraft (Environment Canada 2006e). The diet of the gull consists of leftover carcasses of fish and other marine species, and of marine mammals killed by polar bears. No traditional nesting grounds have been identified in the study area and their presence in the study area is expected to be incidental as they may arrive on ice flows; therefore limited interaction with Project activities is predicted.
Barrow’s Goldeneye is a diving duck that breeds and winters in Canada, although the only confirmed breeding records are from Quebec. Small numbers of this population (about 400) winter in the Maritime Provinces and along the northern Atlantic coastline in the United States. Specific population trends are unknown, but it is believed that the eastern population has been declining since the 20th Century. Population threats include oil spills and sediment contamination of key wintering areas. Hunting and forest exploitation (e.g., loss of breeding habitat), and degradation of lakes through stocking of brook trout also serve as population threats (Environment Canada 2006f). Therefore, limited interaction with Project activities is predicted.
The remaining species listed in Table 7.5 were addressed in the approved 2002 CSR. However, with the enactment of SARA, there have been specific recovery strategies and/or management plans developed to help protect some of these species at risk. A recovery strategy is a planning document that identifies what needs to be done to arrest or reverse the decline of a species. A management plan is an action-oriented planning document that identifies conservation activities and land use measures needed to ensure, at a minimum, that a species of special concern does not become threatened or endangered (Environment Canada 2006g).
The Management Plan for the Ipswich (Savannah) Sparrow (Environment Canada 2006h) aims to maintain the current breeding population at the current level, maintain the current breeding habitat, and remove or reduce threats to Ipswich Sparrows and their breeding and wintering habitat. The Ipswich Sparrow nests almost exclusively on Sable Island and is the dominant landbird on the island. The species’ localized distribution makes it particularly vulnerable to potential threats such as chance events (e.g., harsh weather and disease during breeding season), predation, human activity, and habitat loss. Available evidence suggests that aside from chance events, none of these factors currently threatens this particular population. The Plan also indicates that to date, offshore petroleum development near Sable Island has had no known effect on the sparrow or its habitat.
A Canadian Recovery Plan for the Roseate Tern was first developed in 1993 (Locke et al. 1993). Since then, more data has become available on the biology and distribution of the species. The 2006 proposed Recovery Strategy for the Roseate Tern (Environment Canada 2006g) takes advantage of this new
Deep Panuke Volume 4 (Environmental Assessment Report) November 2006 7-12
information. This Recovery Strategy has been reviewed and found to present information consistent with existing conditions for the species presented in the approved 2002 CSR (Section 6.1.2.5). This includes the confirmation that activities associated with the SOEP (i.e., laying of the pipe and support flights for offshore platforms) did not disturb or cause other adverse effects to Roseate Terns
The proposed Recovery Strategy for the Roseate Tern (Environment Canada 2006g) is the first recovery strategy for a migratory bird posted on the SARA Public Registry to identify “critical habitat” as defined in the Act. The Recovery Strategy recommends that critical habitat be identified as:
1. Sites that currently support more than 15 pairs of Roseate Terns (The Brothers, NS and Country Island, NS); and
2. Tern colonies in areas that have supported small but persistent numbers of nesting Roseate Terns for over 30 years (Sable Island, Magdalen Islands, Chenal Island).
This designation includes the entire terrestrial habitat of all islands as well as aquatic habitat out 200 m seaward from the mean high tide line of each island. The exception is Sable Island, where the terrestrial habitat designation is limited to polygons encompassing entire individual nesting tern colonies on the island. The 200 m is based on recommended buffer zones around tern colonies.
Additional information on critical habitat designation is provided in Section 7.1.2.6 with respect to Sable Island and Country Island.
In addition to the Recovery Strategy, the Study Team has also reviewed a recent study on foraging habits of Roseate Terns (Rock 2005). Information contained within the document is consistent with existing conditions information presented in the approved 2002 CSR, including the recognition that shallow coastal areas are important for foraging and that an oil spill close to nesting areas during the breeding season could have serious implications. New information presented indicates that Roseate Terns use Harbour Island and Goose Island as foraging areas. No foraging areas for Roseate Tern were identified at or in close proximity to the proposed landfall area of the pipeline for the M&NP option, or the existing SOEP pipeline (Rock 2005). Figure 7.3 has been prepared based on information contained in Rock (2005) and the proposed Recovery Strategy for the Roseate Tern (Environment Canada 2006g).

5990
00
5990
00
6040
00
6040
00
6090
00
6090
00
6140
00
6140
00
4994000
4994000
4999000
4999000
5004000
5004000
ForagingLocations
&CriticalHabitatfor
theRoseateTern
01,
500
3,00
075
0
Met
ers
Map
Para
met
ers
Proj
ectio
n:U
TM-N
AD
83-Z
20Sc
ale
1:65
,000
Dat
e:O
ctob
er05
,200
6Pr
ojec
tNo.
:101
0515
7
Topography
Brid
gePa
ved
Roa
dU
npav
edR
oad
Wat
erco
urse
Con
tour
(5m
)W
ater
bodyFigure7.3
ProjectCom
ponents
EnC
ana
Ons
hore
Pipe
line
Cor
ridor
EnC
ana
22"E
xpor
tPip
elin
e(M
&NP
Opt
ion)
SOEP
Expo
rtPi
pelin
e
M&N
PM
ainl
ine
SOEP
NG
LLi
nean
dM
&NP
Poin
tTup
perL
ater
al
Isaacs
Harbour
CountryHarbour
FishermansHarbour
SealHarbour
CoddlesHarbour
SealHarbour
Lake
GooseIsland
Harbour
Island
Country
Island
IsaacsHarbour
Goldboro
CoddlesHarbour
FishermansHarbour
316
DrumHead
SOEP Gas Pl
ant
ToAntigonish
SableIsland
RoseateTernCriticalHabitatonSableIsland
Des
igna
ted
Crit
ical
Hab
itat(
unde
rSAR
A)
Ros
eate
Tern
Nes
ting
Hab
itat
200m
Aqua
ticBu
fferZ
one
Foraging
Locations
(AdaptedFrom
Rock2005)
Ros
eate
Tern
Arct
icTe
rn
Com
mon
Tern
ToSableIsland
Des
igna
ted
Crit
ical
Hab
itat(
unde
rSAR
A)
Ros
eate
Tern
Nes
ting
Hab
itat
200m
Aqua
ticBu
fferZ
one
DesignatedCriticalHabitatFortheRoseateTern
(Env
ironm
entC
anad
a20
06)
Not
e:D
esig
natio
nof
Crit
ical
Hab
itat
for
the
Ros
eate
Tern
onSa
ble
Isla
ndis
defin
edas
poly
gons
enco
mpa
ssin
gen
tire
indi
vidu
alne
stin
gte
rnco
loni
eson
the
isla
ndan
da
200m
buffe
rar
ound
each
poly
gon.
For
the
purp
ose
ofen
viro
nmen
tal
asse
ssm
ent,
this
defin
ition
has
been
inte
rpre
ted
toin
clud
eth
een
tire
isla
ndw
itha
200m
buffe
rto
incl
ude
aqua
ticha
bita
t.
010
205
Kilo
met
ers
1:500,000

Deep Panuke Volume 4 (Environmental Assessment Report) November 2006 7-14
Environment Canada has recently undertaken a review of the Migratory Birds Convention Act which has resulted in some updates. The most relevant updates are a strengthening of Environment Canada’s authority to prosecute violations of the Act and formalization of the application of the Act over the offshore area.
7.1.2.6 Special Places
Sable Island
The physical and biological description of Sable Island provided in the approved 2002 CSR (Section 6.1.2.6) remains valid. There have been updates, however, in terms of the administration and designation of the Island.
On April 1, 2005, DFO and Environment Canada resumed management of Sable Island from the Sable Island Preservation Trust (SIPT) (created in 1998). The federal government committed to maintaining a protective human presence on the island and will assume responsibility for staffing and operating the station (see Table 6.2). Another administrative update is the designation of Sable Island as “critical habitat” for the Roseate Tern.
The proposed Recovery Strategy for the Roseate Tern (Environment Canada 2006g) recognizes that Sable Island has supported small but persistent numbers of nesting Roseate Terns for over 30 years and identifies a 200 m buffer encompassing nesting tern colonies on the Island as “critical habitat” for the species. SARA defines critical habitat as: “…the habitat that is necessary for the survival or recovery of a listed wildlife species and that is identified as the species’ critical habitat in the recovery strategy or in an action plan for the species”.
As per section 58(2) of SARA, within 90 days after posting the final version of this proposed recovery strategy, the Minister of Environment will publish in the Canada Gazette a description of the critical habitat that is on Sable Island. Ninety days after that description is published, prohibitions on critical habitat destruction will apply to that critical habitat (Environment Canada 2006g). Based on the recommended definition of critical habitat, section 58(1) prohibitions would immediately be enacted on Sable Island (and Country Island, see below) and in aquatic habitat identified around specific sites. Regulations may be enacted to legislate what can and cannot be done on critical habitat, including when and how activities must be conducted (Environment Canada 2006g).
Sable Island is located approximately 48 km from the revised field centre. There is no predicted interaction with Sable Island during routine Project operations. In the unlikely event that landing of vessels or aircraft or other activity is required near the Island, EnCana’s Code of Practice and the existing Sable Island Emergency Contingency Plan (Canadian Coast Guard 1994) will be adhered to for Sable Island.
Deep Panuke Volume 4 (Environmental Assessment Report) November 2006 7-15
Gully MPA
The description of the Gully provided in the approved 2002 CSR remains valid, but there are updates with respect to conservation status (see Table 6.2). DFO designated the Gully as a Marine Protected Area (MPA) in May 2004, in part to reduce ship collisions and noise disturbance to the whales. GullyMarine Protected Area Regulations (Oceans Act) were published in the Canada Gazette in December 2003. The purpose of the MPA designation for the Gully serves to conserve and protect the natural biological diversity within the protected area and to ensure its long-term health. The 2,364 square kilometres that define the Gully include three management zones, each with varying levels of protection based on the conservation objectives and ecological vulnerability.
Zone 1 consists of the deepest sections of the canyon and is preserved in a near-natural state with full ecosystem protection. This zone is highly restricted with few activities permitted. Zone 2 provides strict protection for the canyon sides and outer area of the Gully. Some fisheries are allowed in this region. Zone 3 includes the shallow water and sandy banks that are prone to regular natural disturbance. Some compatible uses are allowed subject to stringent review.
Fishing for halibut, tuna, shark and swordfish have been allowed in Zones 2 and 3 provided the activities are conducted under a federal fishing license and approved management plan. Scientific research and monitoring may be approved in all three zones provided a plan is submitted and the research meets all regulatory requirements. Other activities may be permitted in Zone 3 provided they do not cause disturbance beyond the natural variability of the ecosystem and are subject to plan submission and Ministerial approval.
Given the location of the Gully relative to Deep Panuke (approximately 113 km from MOPU site and more than 100 km from the northeast extreme location for future wells) and EnCana’s Code of Practice for the Gully MPA and commitment to avoid the Gully, there are not likely to be any Project interactions with the Gully.
Country Island
The description of Country Island and EnCana’s Code of Practice for Country Island presented in the approved 2002 CSR, remain valid. Country Island has not yet been designated a Migratory Bird Sanctuary under the Migratory Birds Convention Act. However, it has been identified as “critical habitat” for the Roseate Tern in a proposed Recovery Strategy for the Roseate Tern (Environment Canada 2006g). This designation includes the entire terrestrial habitat of the island as well as aquatic habitat out 200 m seaward from the mean high tide line. Refer to Section 7.1.2.5 for specific update

Deep Panuke Volume 4 (Environmental Assessment Report) November 2006 7-16
about the Roseate Tern, and to the above section on Sable Island for more discussion on the implications of defining critical habitat for a species at risk.
7.1.3 Onshore Environment
The proposed onshore pipeline corridor will likely change from that originally presented in the approved 2002 CSR due to future proposed land uses in the study area that have occurred since 2002. EnCana is currently in discussions with landowners to finalize the routing of the onshore pipeline and location of onshore facilities. A proposed corridor is presented in Figure 2.6. This revised corridor is located within the study area previously surveyed during field studies completed for the approved 2002 CSR (Figure 2.6).
7.1.3.1 Landform and Topography
The description of landform and topography provided in the approved 2002 CSR (Section 6.1.3.1) remains valid.
7.1.3.2 Geology and Soils
Despite the modification to the proposed onshore corridor, the description of geology and soils presented in the approved 2002 CSR (Section 6.1.3.2) remains valid. Since the approved 2002 CSR, however, there is new data available on the contamination of soil from past mining activities. Between 2003 and 2005, the Geological Survey of Canada (GSC) has been leading multidisciplinary research activities near abandoned gold mines throughout Nova Scotia. These studies focus mainly on the environmental implications of historical gold mining and milling practices. Some of the data collected in past-producing gold districts in the Goldboro area may be relevant to the onshore component of the Deep Panuke Project. In particular, the GSC has identified areas within the Goldboro Industrial Park that contain mine waste from past gold-mining activities. Much of this waste contains high concentrations of arsenic and mercury. The draft environmental assessment for the Keltic/Maple Project (AMEC 2006) indicates the presence of three mine tailings disposal sites on the proposed Keltic/Maple site. One of these sites is likely within the proposed corridor for the Deep Panuke Project.
Detailed maps showing the spatial distribution of metals in the Goldboro area is expected to be published by GSC in the near future. GSC further indicates that bedrock and surficial materials in the Goldboro area contain naturally elevated levels of arsenic associated with the abundant arsenopyrite in the mineralized rocks throughout the Goldboro gold district. Bedrock and surficial materials exposed during blasting and excavation may therefore contain high levels of reactive, arsenopyrite-bearing rock and must be disposed of in a manner that does not lead to accelerated leaching and release of arsenic.

Deep Panuke Volume 4 (Environmental Assessment Report) November 2006 7-17
Sediment samples were collected at five sites along Betty’s Cove Brook on September 7, 2006 and analyzed for total metals. Of particular interest are arsenic and mercury as these elements may be present at elevated levels in the study area due to past gold mining activities. Levels of arsenic and mercury in sediments were compared to CCME Interim Freshwater Sediment Quality Guidelines for the protection of aquatic life. The CCME limit for arsenic is 5.9 mg/kg. This level was exceeded in two of the five samples (7.6 and 21.0 mg/kg); however, these exceedances are relatively minor and considerably less than levels of arsenic reported in marine sediments sampled from Isaacs Harbour (i.e., 60 mg/kg). Levels of mercury were at or below the CCME limit (0.17 mg/kg) for each of the five samples. These levels of arsenic and mercury do not indicate contamination from past gold mining activities. Levels reported were expected given the surficial geology and water quality of the area. For example, the proximity of bedrock to the surface and the low pH of surface water in the study area (e.g., pH of 5.77 in Betty’s Cove Brook (AMEC 2006)) would aid in the liberation of metals from the surficial geology.
A geotechnical testing program will be conducted by EnCana during detailed pipeline design and routing including analysis of soil chemistry, to identify potential areas of contamination and/or acidic drainage. The EPP will include management practices to remove or contain any impacted soils or other excavated material. The EPP will also include mitigation similar to that included in M&NP’s Acid Drainage Construction Response Plan.
7.1.3.3 Vegetation
The description of vegetation in the study area obtained through field surveys conducted in 2001 and presented in the approved 2002 CSR (Section 6.1.3.3) remains valid in that it characterizes the general study area. This field survey identified a provincially rare (Pronych and Wilson 1993) plant species (northern commandra (Geocaulon lividum)) present in the study area. No new field surveys were conducted in 2006.
Since the approved 2002 CSR, it has been standard practice, during environmental assessment, to conduct a review of the Atlantic Canada Data Conservation Centre (ACCDC) database to obtain a list of provincially rare or sensitive wildlife species found within a 100 km radius of the Project area. ACCDC provides information on onshore species and ecological communities that require consideration for their conservation. The ACCDC listing and ranking system is useful since it provides a georeferenced outlook on rare or sensitive species and habitats. The ACCDC list, however, is generated on a radius that is considered to be in excess of the onshore ecological footprint of the Project. A model was therefore employed by the Study Team to determine the likelihood of the presence of the ACCDC ranked species within the onshore study area. Likelihood of presence was determined by cross-checking the habitat requirements of the ACCDC listed species with the habitat description within the onshore study area for the Project.

Deep Panuke Volume 4 (Environmental Assessment Report) November 2006 7-18
This rare plant modelling exercise gives direction for vegetation surveys in terms of habitat types and timing of surveys to identify rare plants. A detailed habitat survey will be conducted along the onshore pipeline route when the final routing has been determined. The results of the habitat modelling presented in Table 7.2 will be used to direct vegetation surveys at this time.
During surveys conducted in 2001, in support of the approved 2002 CSR, only one rare plant species was recorded: the northern commandra (Geocaulon lividum). The northern commandra is considered rare in Nova Scotia (Pronych and Wilson 1993), but is not considered to be nationally rare (COSEWIC 2006c; Argus and Pryer 1990).
A total of 91 Red or Yellow-listed species have been recorded within 100 km of the Project area. Based on the results of the habitat model, 27 Red or Yellow-listed species could potentially be present in the Project area. Table 7.2 lists these species along with their ACCDC and Nova Scotia Department of Natural Resources (NSDNR) rankings, and the habitats present in the study area where they could potentially be found.
Table 7.2 Rare and Sensitive Vascular Plant Species Potentially Present in the Project AreaBionomial Common Name Preferred Habitat Season for
Identification ACCDC
RankNSNDR
RankVaccinium boreale Northern Blueberry Exposed headlands
and barrens; has been found by JW team in drier open bog near Moose River Gold Mines
Not given for NS; likely identifiable in early summer on to October
S2 Red
Utricularia resupinata Northeastern Bladderwort Pond, lake and river shores
Flowers July to September, likely little noticeable or identifiable out of flower
S1 Red
Carex alopecoidea Foxtail Sedge Moist, overgrown clear-cut woods near the coast
Not given for NS; likely identifiable in early summer to October
S1 Red
Carex tenuiflora Sparse-Flowered Sedge Wet woods and bogs Not given for NS; most members of Heleonastesgroup flower June to August
S1 Red
Iris prismatica Slender Blue Flag Wet ground near the coast
Mid-July S1 Red
Listera australis Southern Twayblade Among the shaded sphagnum moss of bogs or damp woods
June; quickly senesces after flowering
S1 Red

Deep Panuke Volume 4 (Environmental Assessment Report) November 2006 7-19
Table 7.2 Rare and Sensitive Vascular Plant Species Potentially Present in the Project AreaBionomial Common Name Preferred Habitat Season for
Identification ACCDC
RankNSNDR
RankMalaxis brachypoda White Adder's-Mouth Moss cushions and
wet, mossy cliff-edges, where there is little competition from other plant species
Late May and June S1 Red
Selaginella selaginoides Low Spike-Moss Moist areas borderingbog tussocks, peat bogs, and stream margins
Produces spores in July and August; likely identifiable when not snow covered but very easily overlooked
S2 Red
Bidens connata Purple-Stem Swamp Beggar-Ticks
Boggy swales, and the borders of ponds, thickets and in ditches behind brackish shores
August and September; can be identified when not in flower
S3? Yellow
Megalodonta beckii Beck Water-Marigold Shallow, quiet waters, slow-moving streams, and ponds
August and September
S3 Yellow
Proserpinaca pectinata Comb-Leaved Mermaid-Weed
Wet savannas, sphagnous swales, and the sandy, gravelly, or muddy borders of lakes or ponds
June to October; can be identified when not in flower
S3 Yellow
Teucrium canadense American Germander Gravelly seashores, generally at crest of beach, above direct tidal influence
Flowers July to September when easiest to identify but identifiable from June to October
S2S3 Yellow
Utricularia gibba Humped Bladderwort Shallow lake margins, small pools and small ponds in quagmires or peaty situations
Late June to September; can be identified without flowers, but is very cryptic
S2 Yellow
Fraxinus nigra Black Ash Low ground, damp woods and swamps
May and June; can be identified without flowers
S3 Yellow
Epilobium coloratum Purple-Leaf Willow-Herb Low-lying ground, springy slopes and similar locations
July and October; seeds required for identification
S2? Yellow
Epilobium strictum Downy Willow-Herb Boggy areas and meadows
July to September S3 Yellow
Polygala sanguinea Field Milkwort Poor or acidic fields, damp slopes, and open woods or bush
Late June to October
S2S3 Yellow