
Constraining crustal rheology and lower crustal flow in the Tibetan plateau

A. LINDEQUE, M.J . DE WIT, T. RYBERG, M. WEBER AND L. CHEVALLIER 265
DEEP CRUSTAL PROFILE ACROSS THE SOUTHERN KAROO BASINAND BEATTIE MAGNETIC ANOMALY, SOUTH AFRICA: ANINTEGRATED INTERPRETATION WITH TECTONIC IMPLICATIONS
A. LINDEQUEAlfred Wegener Institute for Polar and Marine Research, Am Alten Hafen 26, 27568 Bremerhaven,GermanyAfrica Earth Observatory Network and Faculty of Science, Nelson Mandela Metropolitan University, 6031Port Elizabeth, South AfricaCouncil for Geoscience, Western Cape, P.O. Box 572, 7535 Bellville, Cape Town, South Africae-mail: [email protected]
M.J. DE WITAfrica Earth Observatory Network and Faculty of Science, Nelson Mandela Metropolitan University, 6031Port Elizabeth, South Africae-mail: [email protected]
T. RYBERG AND M. WEBERGerman Research Centre for Geosciences, 14473 Telegrafenberg, Potsdam, Germanye-mail: [email protected]; [email protected]
L. CHEVALLIERCouncil for Geoscience, Western Cape, P.O. Box 572, 7535 Bellville, Cape Town, South Africae-mail: [email protected]
© 2011 December Geological Society of South Africa
ABSTRACT
Two geophysical onshore-offshore lines on the southern margin of Africa form the Agulhas-Karoo Geophysical Transect (AKGT)
and cross prominent geological features such as the Karoo Basin, Cape Fold Belt (CFB) and the Beattie Magnetic Anomaly (BMA).
Geophysical data acquired along this AKGTransect between 2004 and 2007 within the Inkaba yeAfrica (lyA) framework, provide
the platform for constructing a deep crustal section (IyA-200501) for the centre 100 km of the western AKGT-transect in order to
resolve these features at depth. We present a detailed deep crustal model constructed from the joint interpretation of:
i. archive data comprising surface geology, aeromagnetic data, nearby deep boreholes, teleseismic receiver functions and regional
seismic reflection profiles, and
ii. line coincident newly acquired high-resolution geophysical data consisting of near vertical seismic reflection data, shallow P- and
S-wave velocity data, wide-angle refraction data, high resolution magnetotelluric data and impedance spectroscopy measurements
on borehole samples.
Our model differentiates four components in the up to 45 km thick crust:
1. a ~2 to 5 km thick folded Karoo Supergroup, disrupted by low-angle thrust faults rooted in a zone of local décollements in the
lower Ecca Group and resting paraconformably on
2. a continuous undeformed sub-horizontal ~1.5 to 10 km thick wedge of the Cape Supergroup (CSG). This CSG wedge stretches
from the Escarpment in the north to the tectonic front of the CFB in the south, and rests on an unconformity that dips about
three degrees to the south. The angular unconformity is interpreted as an erosional peneplain that separates the CSG wedge
from component
3. the ~13 to 21 km mid-crust basement below. The mid-crust contains a distinct north-dipping seismic fabric, here interpreted as
~1.4 to 1.0 Ga Mesoproterozoic Namaqua-Natal Metamorphic Belt (NNMB) crust. A south-dipping mid-crustal detachment,
interpreted as a ductile thrust zone, separates the mid-crust from component
4. a highly reflective ~10 to 24 km thick lower crust. The latter is interpreted as an older Palaeoproterozoic section of the NNMB
(or even Archean cratonic basement), and bounded by a ~2 to 5 km thick, highly reflective bottom layer below that lies sub-
parallel to a clear Moho. This bottom layer is interpreted as a mafic underplate, metasomatic reaction zone, or lower-crust to
mantle transition zone.
Collectively the seismic reflection and wide-angle refraction data support an interpretation that the NNMB mid-crustal layer
contains the BMA source, possibly connected to two zones of strong reflectivity: a ~10 to 12 km wide northern zone and a
~5 to 7 km wide southern zone, both about 5 km thick and 7 to 8 km below surface. We interpret the BMA source to be at least
in part, a Namaqua-like massive to disseminated, deformed/metamorphosed stratiform sulphide-magnetite ore body with
metasomatic overprint.
SOUTH AFRICAN JOURNAL OF GEOLOGY, 2011, VOLUME 114.3-4 PAGE 265-292
doi:10.2113/gssajg.114.3-4.265

Introduction Southernmost Africa is dominated by the Palaeozoic-Mesozoic Cape Fold Belt (CFB) and its flanking Cape-Karoo Basin underlain by Precambrian basement, whichincludes the world’s largest terrestrial magnetic anomaly,the Beattie Magnetic Anomaly (BMA) first detected overa century ago (Beattie, 1909). The deep crustalexpressions of these surface features remain essentiallyunknown for lack of geophysical information. Under theauspices of the Inkaba yeAfrica research initiative (de Wit and Horsfield, 2006; www.inkaba.org) theAgulhas-Karoo Geophysical Transect (AKGT) wasdesigned to investigate these, and other features throughdeep crustal geophysical data, with the aim of resolvingthe tectonic evolution of the southern continentalmargin of Africa further (e.g. Lindeque et al., 2006; 2007;Parsiegla et al., 2007; 2009; Stankiewicz et al., 2007;2008; Weckmann et al., 2007a; 2007b).
The AKGT consists of two roughly parallel north-south, amphibian onshore/offshore lines (Figure 1). We focus on a ca. 100 km segment of the western AKGTline, which traverses the Karoo Basin from the southernescarpment of South Africa to the northern frontalranges of the CFB, whilst crossing the ca. 1000 km longBMA close to the apparent bifurcation seen in theaeromagnetic data (Figure 1). Our work contributes the first high-resolution deep seismic reflection profileand deep crustal model through the Palaeozoic-Mesozoic sediments of the Cape-Karoo Basin and itsunderlying basement, both overprinted in the south bythe mid-Phanerozoic Cape Fold Belt deformation (Figure 2). The regional geology of the southern KarooBasin and CFB are well documented and not describedin detail here (e.g. Hälbich 1983a, b, c; Söhnge andHälbich, 1983; de Wit and Ransome, 1992; Hälbich,1993; Thomas et al., 1993; Veevers et al., 1994; Johnsonet al., 1996; 2006; Shone and Booth, 2005). Table 1 andFigure 2 summarise the stratigraphy compiled from thegeological field maps (CGS, 2000) and nearby boreholesSA-1/66 and KW-1/67 (PASA, 1966; 1967b).
Our derived crustal model is based on the analysesof all the available datasets shown in Figure 2 and leadsus to revise existing crustal models of the region (e.g. Hälbich, 1993). These datasets include: a nearvertical deep seismic reflection profile hereafter referredto as IyA-200501 (Lindeque et al., 2007); a coincidentshallow velocity Vs model (Bräuer et al., 2007); wide-
angle refraction data and derived tomography models(Stankiewicz et al., 2007; 2008); archive seismicreflection lines in the Karoo Basin from the 1960’s workof Soekor (now the Petroleum Agency of South Africa,(PASA), 1967a); teleseismic receiver function data(Harvey et al., 2001); high resolution magnetotelluricdata and models (Weckmann et al., 2007a); regionalaeromagnetic data (Council for Geoscience, (CGS),2000); BMA models (e.g. Quesnel et al., 2009); existinggeological data from surface mapping (CGS, 1979a; b;1983; 1992) and borehole logs (PASA, 1966; 1967b).
Finally, we evaluate how each dataset and modelprovide information on the crustal location, depth,extent and possible source(s) of the BMA, and thenpresent a simple model for the tectonic evolution of thissouthern most sector of Africa – a prominent componentin Gondwana and Rodinia supercontinent recon -structions.
MethodologyIn deriving a deep crustal model, we combined diversegeological and geophysical local, as well as regionaldatasets (Figure 2) to ensure consistent conservativeinterpretations. For example, the near vertical seismicreflection technique records changes in velocitybetween geological layers and not necessarily the actualstratigraphic contact between units. Therefore if theseismic data are viewed in isolation, apparentcorrelations with surface geology or aeromagnetic datacould be argued as a matter of coincidence, but if alldatasets are viewed collectively, the interpretationbecomes more robust. Our analyses are rooted in theIyA-200501 seismic image and a line interpretationthereof, shown in Figures 3 and 4a, respectively. Data acquisition, processing and interpretationprocedures of IyA-200501 are described elsewhere(Lindeque et al., 2006; 2007).
To derive an integrated model for the upper-crust,we first considered surface geology. A geological crosssection was constructed by hand exactly along theseismic profile IyA-200501, using information from the 1:250000 geological map sheets (CGS, 1979a, b;1983; 1992, Figure 2 and the extract in Figure 4b).Surface structure and field observations of Stowe (1980;1986), Albat (1984), Joubert (1971; 1986a, b), Macey(2000; 2001), and Macey et al. (2011) were incorporated.Particular attention was given to record the dip variation
SOUTH AFRICAN JOURNAL OF GEOLOGY
DEEP CRUSTAL PROFILE, SOUTHERN KAROO BASIN AND BEATTIE MAGNETIC ANOMALY266
The seismic reflection and -refraction data support an interpretation that a Pan-African suture zone at the BMA is absent and
that instead, the NNMB continues below the CFB tectonic front, probably up to the continental margin and the Agulhas Fracture
Zone. The seismic reflection data also supports a thin-skinned tectonic thrust model for the evolution of the CFB without significant
fore-deep stratigraphic thickening of the Karoo Basin strata. A compatible tectonic model implies a Palaeozoic collision orogen
setting, coupled to a south verging subduction zone much farther south of the CFB. Similarly, the geophysical data support a south
dipping subduction zone during the amalgamation of the NNMB in the Mesoproterozoic.
Current reconstructions of the Rodinia supercontinent link the NNMB and the Grenville Province of North America across the
Grenville-Kibaran orogen. Our seismic section tests this reconstruction through a direct comparison with seismic profiles on
the opposite flank of the orogen. Although the once adjacent continental blocks are now 1000s of kilometres apart, the seismic
images show a good correlation and support the reconstruction.

A. LINDEQUE, M.J . DE WIT, T. RYBERG, M. WEBER AND L. CHEVALLIER
SOUTH AFRICAN JOURNAL OF GEOLOGY
267
Figure 1. (a) Total field free-air aeromagnetic map of southern Africa (CGS, 2000) showing the regional West-East striking Beattie Magnetic
Anomaly (outlined and red arrow marked BMA), and the western and eastern lines comprising the Agulhas-Karoo Geophysical Transect
(AKGT, black lines). This research focuses on the centre ~100 km segment of the western transect (left black line and red block) and refer to
findings from boreholes QU-1/65 and KC-1/70 farther afield (white circles). (b) Close-up of the area of interest. Red dots = IyA-200501 seismic
reflection profile of Lindeque et al. (2007) 50 m shot spacing; thin black dashed lines = BMA maximum axes; shades of yellow to red
= ~30 km wide BMA extent. Note how the BMA bifurcates towards the West near Merweville, see text for discussion.

of fold limbs, location and orientation of fold axialplanes, and fold axes. The resulting cross section isshown in Figure 4c and Figure 8, with 5x verticalexaggeration for clarity.
This geological cross section (Figure 4c), dovetailswith the southernmost 50 km of the Vs shallow velocityimage (Figure 4d; Bräuer et al., 2007). Specifically, highvelocity regions in the Vs shallow velocity structurecorrelate to fold axes and folds in the cross-section, aswell as with the reflectivity patterns in the upper 1 to 2 km of the seismic reflection data. These observationsare useful to constrain the interpretation of the structuresand lithologies in the upper 1 to 2 km of the IyA-200501seismic profile, where much of the shallow sub-surfaceseismic data were lost due to noise from the blasts, andan instrument layout optimised to image the deepercrust.
Next, we considered stratigraphic control for the upper1.5 km from boreholes SA-1/66 and KW-1/67 to the eastand west of IyA-200501, respectively (Figure 2 andborehole logs in Table 1; PASA, 1966; 1967b; Winter andVenter, 1970; Rowsell and de Swart, 1976; Cole andMcLachlan, 1994). Each borehole was projected into theseismic image along strike of the regional geology(Figures 5 and 6, overview maps). This technique tiessurface geology to corresponding units in the boreholelogs, and then to particular primary seismic reflectorswhich represent the boundary of a specific geologicalunit (Figures 5c and 6c).
Borehole SA-1/66 is coincident with archive Soekorseismic line WK-01 (PASA, 1967a) ~40 km to the westand parallel to seismic profile IyA-200501 (Figure 2). We compared an extract of the WK-01 seismic line paperrecord and coincident borehole log SA-1/66 (Figure 5a)
SOUTH AFRICAN JOURNAL OF GEOLOGY
DEEP CRUSTAL PROFILE, SOUTHERN KAROO BASIN AND BEATTIE MAGNETIC ANOMALY268
Figure 2. Geological map of the study area shown in Figure 1b, overlain on the 20 m Digital Elevation Model (DEM); Seismic reflection
profile IyA-200501 within the AKGtransect (yellow and black line, Lindeque et al., 2007). Faults and folds on the 1:250000 scale geological
maps are not shown for the sake of clarity, but are meticulously annotated on the geological cross-section (Figure 8). Location of the BMA
maximum axes are demarcated by the east-west trending black dashed lines. Other geophysical data used to construct the new crustal model
include: triangles = wide-angle refraction experiment (Stankiewicz et al., 2007; 2008); squares = magnetotelluric measurements (Weckmann
et al., 2007a, b); blue triangle = nearby receiver function station SA05 (Harvey et al., 2001); red line = archive seismic reflection profile
WK-01 with coincident borehole SA-1/66, green circle; purple line = KL-12 and coincident borehole KW-1/67, green circle. IyA-200501
crosses the geological strike of the region at an angle of about 70°. Archive seismic profile SAGS-0392 (green line) and the position of the
Cape Fold Belt Front at the Witteberg Group shown for reference.

A. LINDEQUE, M.J . DE WIT, T. RYBERG, M. WEBER AND L. CHEVALLIER
SOUTH AFRICAN JOURNAL OF GEOLOGY
269
to the paper-to-SEGY converted record (Figure 5b).Paper-to-SEGY describes a process to transform scannedraster images of paper seismic records to geo-referencedbinary SEGY files, so one can view the data in standardseismic software and apply further data processing so asto enhance the seismic image (compare Figure 5a and bfor example). We compared these archive records inFigure 5a and b, with the higher resolution seismicprofile IyA-200501 (Figure 5c) to resolve the upper 1.5 km stratigraphy further. Similarly, borehole KW-1/67is coincident with archive Soekor seismic line KL-12(PASA, 1967a), ~30 km to the east and parallel to IyA-200501 (Figure 2). Again, we compared an extract of theseismic record, in this case KL-12 and borehole log KW-1/67 (Figure 6a), to the paper-to-SEGY converted record(Figure 6b), and the IyA-200501 extract (Figure 6c).Horizons were correlated with specific reflectors andtraced along the profile, thereby refining the litho- and chrono-stratigraphy (Figure 6c). Additionalmagnetotelluric- and tomography data (Figure 7) wereincorporated to test and constrain our final upper crustinterpretation (Figure 8).
In order to determine what the mid-crust imaged inIyA-200501 may represent, we combined ourobservations in the seismic reflection data with an earlierinterpretation (Lindeque et al., 2007), using far-field
boreholes QU-1/65 and KC-1/70 (Figure 1, Eglingtonand Armstrong, 2003; Eglington, 2006), regional fieldobservations from geological mapping (e.g. Joubert,1971; 1986a, b; Albat, 1984; Macey 2000; 2001; Macey et al., 2011), the high resolution magnetotelluric model (Weckmann et al., 2007) and the tomographymodel derived from the wide-angle refraction data(Stankiewicz, et al., 2007; 2008), partly illustrated inFigures 7b–d.
To constrain the extent and depth of the contentiousBeattie Magnetic Anomaly, the aeromagnetic data (CGS,2000) were clipped to the same length and scale as theseismic profile (Figure 7a), and the location of the twoaxes with maximum magnetic signatures (~250 nT)within the BMA, projected into the IyA-200501 seismicimage (Lindeque, et al., 2007; vertical black dashed lines in Figure 7b), as well as into the coincident high resolution magnetotelluric data (Weckmann, et al.,2007; Figure 7c), and the refraction tomography image (Stankiewicz et al., 2007; Figure 7d). We compared our BMA interpretation against previous models (Hälbich, 1993; Quesnel et al., 2009),an earlier interpretation (Lindeque et al., 2007) andregional geology (e.g. Naicker, 1993; Wilsher, 1995), totest our interpretation and postulate a possible BMAsource.
Table 1. Simplified stratigraphy from bolehole data.
SA-1/66, location: 21.3292°E, -32.6694°S, completed: 12/09/1967, total depth: 13679 ft (4169.4 m).
KW-1/67, location: 22.3367°E, -32.9847°S, completed: 15/08/1968, total depth: 18224 ft (5554.7 m).
Logs compiled from PASA (1966, 1967b), Winter and Venter (1970), Rowsell and De Swart (1976), Cole and McLachlan (1994), Chevallier et al., (2004).
Discrepancies may exist with depths in the 1994 logs due to the removal of dolerite thickness.
* all depths are converted from feet to metres using a factor of 3.28 and measured to the base of the formation.
Red dashed line = stratigraphic position of the local décollement between the Collingham and Whitehill Formations, see text for discussion.
Colours in the table correspond to the borehole logs for SA-1/66 and KW-1/67 illustrated in Figures 5 and 6, respectively.

SOUTH AFRICAN JOURNAL OF GEOLOGY
DEEP CRUSTAL PROFILE, SOUTHERN KAROO BASIN AND BEATTIE MAGNETIC ANOMALY270
A. LINDEQUE, M.J . DE WIT, T. RYBERG, M. WEBER AND L. CHEVALLIER
SOUTH AFRICAN JOURNAL OF GEOLOGY
271
The lower-crust interpretation (Figure 9), was mostlydetermined from the seismic reflection data (Lindeque et al., 2007), knowledge of regional geological mapping(e.g. Joubert, 1986a, b; Thomas et al., 1993; 1994; 1996;Eglington, 2006) and seismic models of conterminousGrenville terranes on the conjugate Rodinia margin (e.g.Cook et al., 2004; 2005; Evenchick et al., 2005).
Lastly, we tested the depth of the major crustaldivisions derived from the IyA-200501 seismic reflectiondata (i.e. upper-, middle-, lower crust and Moho depth)against crustal divisions recorded at the nearestteleseismic receiver function station (SA05 in Harvey et al., 2001, ~25 km east of IyA-200501, Figure 2), and inthe large scale regional Agulhas-Karoo onshore-offshorerefraction crustal model (Parsiegla et al., 2007; 2009;Stankiewicz et al., 2007; 2008).
We then compare and contrast our derived integratedcrustal model (Figure 8, fold-out and Figure 9) to previouscrustal models of southern South Africa (Figure 10;Hälbich, 1993, Chevallier et al., 2004; Lindeque et al.,2007; Figure 10). The collective analyses of all availabledata along the centre AKGT segment, allow us to:i. propose new models for the tectonic evolution of
southern Africa (Figures 11 and 12); and ii. test existing Mesoproterozoic Rodinia models that link
the Kibaran NNMB with the Grenville Mobile Belt ofNorth America (e.g. Li et al., 2008), for the first timevia direct comparison of corresponding seismicprofiles and subsequent crustal models in the Canadian Lithoprobe Abitibi-Grenville Transect(Figures 13 and 14).
Results and interpretationsSub-surface Geology (≤ 2 km)The sub-surface continuation of folds interpreted in theupper 1 km shallow velocity structure (Bräuer et al.,2007) correlates well with the surface location of fold axesand faults in the Karoo Supergroup, determined fromgeological mapping and boreholes (Figures 4, 5 and 6).In the Vs model (Figure 4d) high velocities of 2.82 to3.30 km/s correspond to anticlines, and lower velocitiesof 2.50 to 2.82 km/s to synclines. The Vs interpretationfits well with reflectors representing the KarooSupergroup structure in the IyA-200501 seismic profile(compare Figure 4d with 4c and Figure 3). The integrated interpretation for the upper 2 km resolvesthe sub-surface structure of the Karoo Supergroup andin particular that of the Abrahamskraal Formation(yellow in Figures 5c, 6c; line drawing in Figure 4a).
Four faults mapped at surface correlate to sub-surfacelow-angle listric faults in the seismic data (red dots,Figure 8) and several surface folds correlate to similarsub-surface structures in the seismic profile (Figure 8).Lateral variations of high- to low-velocities correspondto major listric faults in the IyA-200501 seismic data andto surface faults mapped in the Cape- and Karoo-Supergroups (compare Figure 4a, d and Figure 8).
Upper crust (<10 km)Borehole data and archive seismic profilesThe identification of lithologic contacts in the archiveboreholes SA-1/66 and KW-1/67 hold inherentuncertainties. The first uncertainty is introduced whenconverting depth from Cape feet to metre. A Cape footis a unit of length defined as 1.0330 English feet andequal to 0.314 metres. This uncertainty is compoundedby poorly documented criteria used to define thestratigraphy at the time of logging the boreholes,especially the Dwyka−Ecca contact. In the 1960’s whenthe boreholes were drilled, the Whitehill- and PrinceAlbert Formations were logged as part of the then“Upper Dwyka”, and the transitional Dwyka−Eccacontact ill-defined. In 1980, the revised stratigraphyincorporated the “Upper Dwyka” (i.e. the Whitehill- andPrince Albert Formations) into the Ecca Supergroup(SACS, 1980). The lithostratigraphic contacts from theold well data therefore have limited reliability in aregional correlation.
The second uncertainty pertains to matching two-way-travel-time (TWT) in the archive seismic records tothe borehole depths. A detailed velocity model isneeded to convert TWT of reflectors in the archive paperrecords, to accurate depths and match it with theborehole logs. We used regional velocities from the tomography model (Stankiewicz et al., 2007) andconstant velocity stacks from the IyA-200501 seismicreflection data processing (Lindeque et al., 2007) toconvert TWT to depth. We illustrate this uncertainty inFigure 5a. Different interpretations of the Ecca−Dwykacontact are possible depending if interval velocities wereused to convert the TWT of major reflectors to depth(Figure 5a, black lines), or if depths from the boreholelogs were applied (Figure 5a, red lines). In the end, wecollectively considered the borehole log depths, depthsfrom the seismic velocity model (Lindeque et al., 2007),prominent reflectors in the archive paper records (Figure 5a) and paper-to-SEGY converted record (Figure5b), as well as reflector positions in the 2007 seismic
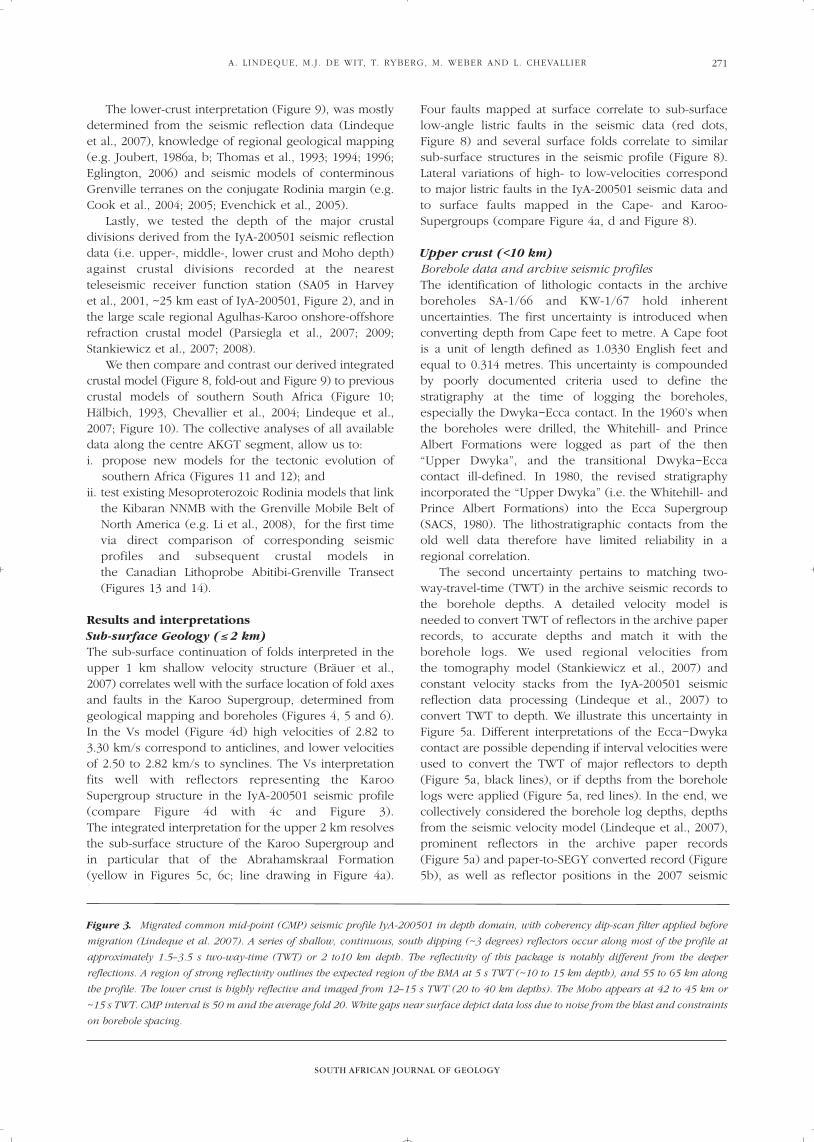
Figure 3. Migrated common mid-point (CMP) seismic profile IyA-200501 in depth domain, with coherency dip-scan filter applied before
migration (Lindeque et al. 2007). A series of shallow, continuous, south dipping (~3 degrees) reflectors occur along most of the profile at
approximately 1.5–3.5 s two-way-time (TWT) or 2 to10 km depth. The reflectivity of this package is notably different from the deeper
reflections. A region of strong reflectivity outlines the expected region of the BMA at 5 s TWT (~10 to 15 km depth), and 55 to 65 km along
the profile. The lower crust is highly reflective and imaged from 12–15 s TWT (20 to 40 km depths). The Moho appears at 42 to 45 km or
~15 s TWT. CMP interval is 50 m and the average fold 20. White gaps near surface depict data loss due to noise from the blast and constraints
on borehole spacing.

SOUTH AFRICAN JOURNAL OF GEOLOGY
DEEP CRUSTAL PROFILE, SOUTHERN KAROO BASIN AND BEATTIE MAGNETIC ANOMALY272

A. LINDEQUE, M.J . DE WIT, T. RYBERG, M. WEBER AND L. CHEVALLIER
SOUTH AFRICAN JOURNAL OF GEOLOGY
273
reflection data (Figure 5c) to determine a best fit for the stratigraphic contact. More weight was given to theprominent reflectors in the most recent seismic reflectiondata (Figure 5c) and the other records providedadditional information. A similar approach was used incomparing the seismic profile KL-12 paper record,coincident borehole KW-1/67 (Figure 6a) and convertedpaper-to-SEGY record (Figure 6b), to the IyA-200501extract (Figure 6c). Due to these depth-relateduncertainties, the interpreted Dwyka contact andposition of the Whitehill- and Prince Albert Formationsin our model can differ up to 100 metres (e.g. two orthree reflectors) from the borehole logs, archive paperand paper-to-SEGY records.
A third uncertainty relates to the distance ofboreholes SA-1/66 and KW-1/67 respectively ~40 km tothe west and 30 km to the east of lyA-200501 (Figure 2).When these boreholes are projected along strike intoIyA-200501, regional variations in dip and thickness ofthe intervening strata make an accurate match unlikely,thus limiting the interpretation to a best fit solution.
Despite these uncertainties, SA-1/66 and KW-1/67are the only boreholes near IyA-200501 therefore stillduly considered for stratigraphic control. In bothborehole logs, the base of the Beaufort- and EccaGroups correlates well with the first group of brokenreflectors at 1 to 2 km depth (Figures 5c and 6c). This isconsistent with surface geology outcrop and shallowvelocity sub-surface structure at 1.5 to 2 km depth(Figure 4). The Whitehill- and Prince Albert Formations(at 2754 m depth in SA-1/66, Figure 5c; and at 4361 mdepth in KW-1/67, Figure 6c) correlate with ourinterpreted décollement surface in the IyA-200501seismic image (Figures 8 and 9). In both archive seismicprofiles (WK-01 in Figure 5a-b; KL-12 in Figure 6a–b) a series of strong, continuous, gently south-dippingreflectors can be traced. The paper-to-SEGY records(Figures 5b and 6b) suggest that the top of the Dwykacould be coincident with the first prominent reflectorpackage (doublet, Figures 5c and 6c). However, thesuperimposed borehole logs show the top of the Dwykato occur just above this doublet (thick arrow, Figures 5band 6b). Contrary to the archive data, when theboreholes are projected into the IyA-200501 seismicsection, the top of the Dwyka Group lies ~700 m abovethe doublet (SA-1/66, Figure 5c) or at the next reflector
below the doublet (KW-1/67, Figure 6c). Since theDwyka contact remains inconclusive in the archiveseismic and borehole data, we look at field data to refinethe interpretation. In the field, the transitional Dwyka-Ecca contact often occurs within shales. Such atransitional chronostratigraphic boundary within thesame lithology (e.g. Ecca- and Dwyka shales) would notbe recorded as a seismic reflector as there is no changein velocity across the contact. This makes it nearimpossible to pin down a precise contact in the seismicdata without an IyA-200501 coincident borehole. It is therefore most likely that the first prominentreflector represents a transition from shale to the firstmassive tillite bed within the Dwyka Group. We incorporate knowledge from regional surfacegeology to further improve and test our Dwyka contactinterpretation.
In the field, the IyA-200501 profile crosses Dwykaoutcrops on surface twice, near the CFB front in thesouthern end of the seismic profile (Figures 2 and 4a, b).It is the only seismic line in the Karoo Basin to do so.Concentrating on this first 25 km of the profile and the regional geology (Figure 2) we can deduct thefollowing: If we assume the first strong horizontalreflector represents some part of the Dwyka andincorporate surface geology, the Dwyka at 2 to 5 kmdepths must break through all continuous reflectorsabove, along a fault close to the tectonic front of theCFB to match the surface outcrops (Figures 4a–c). The IyA-200501 seismic data, archive seismic dataprofiles WK-01 and KL-12 and mapped surface geologyallow the interpretation of a major thrust with duplexing,or a post-folding low-angle normal fault. Nearby fieldwork recorded a strong décollement at the base of theCollingham Formation, or top of the Whitehill Formation(Figure 34, p.44 in Knütter, 1994). Thus theinterpretation of a series of thrusts to bring the Dwykato surface seems to work on all accounts. We thereforeinterpret the first prominent doublet reflector as the firstmassive tillite unit(s) in the Dwyka Group and draw theDwyka−Ecca contact a few reflectors above the doublet(Figures 5c and 6c). Accordingly, the deeper packages ofcontinuous, gently south-dipping reflectors between thedoublet and the seismic discontinuity with theunderlying basement are interpreted to representlithologic units of the Cape Supergroup.
Figure 4. (a) Line drawing interpretation of the migrated seismic reflection profile IyA-200501 in Figure 3. Note the difference in seismic
fabric between the upper-, middle and lower crust: The upper crust fabric is mostly sub-horizontal with a series of low angle listric
thrusts/faults. The mid-crust fabric dips dominantly north, whereas the lower crust fabric is more complex, dip to the north and south, and
are bounded by a less reflective layer below. A highly reflective layer with dominantly horizontal fabric straddles the clearly defined Moho.
Blue dashed line = the upper crust/mid-crust unconformity; red dashed line = the mid-crustal detachment interpreted as a thrust/shear plane.
(b) Surface geology extract, legend same as in Figure 2: olive = Dwyka Group; yellow to orange = Ecca Group; grey = Beaufort Group; white
dashed lines = BMA maximum axes; yellow stars = shot points of IyA-200501. (c) Geological cross-section with 5x vertical exaggeration.
Brown = Dwyka Group; pale pink = Ecca Group; yellow = Beaufort Group. (d) Shallow velocity Vs-model for the upper ~1.5 km of the
IyA-200501 line (Bräuer et al., 2007) and geological fold structures superimposed (dashed lines). High Vs velocities (reds and yellows)
correspond to anticlines and low Vs velocities (greens) to synclines.

Magnetotelluric dataA distinct band of high conductivity in the upper crusthas previously been interpreted to image the WhitehillFormation (Weckmann et al., 2007a, b). Impedancespectroscopy measurements on samples from boreholesSA-1/66 and KW-1/67 showed that the high conductivityband also extends into the underlying Prince AlbertFormation (Branch et al., 2007). To further interpret thelower Ecca sequences and particularly pinpoint thepositions of the Whitehill- and Prince Albert Formations(Wh/PA), the magnetotelluric 2D conductivity model ofWeckmann et al. (2007a) is superimposed on seismicline IyA-200501 and the high conductivity bandannotated (red dotted line above the horizontalreflectors in Figure 7c). The high conductivity bandmatches our Wh/PA Formations interpretation in theborehole and seismic data (Figures 5c and 6c)reasonably well. In combining the regional surfacegeology, borehole data, archive- and new seismicreflection data with the magnetotelluric data, weidentified the depth of the Whitehill- and Prince AlbertFormations in our IyA-200501 upper crust model withsignificant confidence (Figure 8).
Refraction data – Tomography modelA tomography model derived from wide-angle seismicP-wave velocity experiments of Stankiewicz et al. (2007;2008) is coincident to line IyA-200501 (Figure 2). When the tomography model is superimposed on theIyA-200501 seismic reflection image (Figure 7d), the lowvelocities (4.6 to 5.3 km/s) imaged in the tomographymodel occur in and above the package of sub-horizontal reflectors of the Cape Supergroup, whilstvelocities increase rapidly below it (5.4 to 5.5 km/s).This downward increase in velocity occurs abruptlyacross the seismic discontinuity in IyA-200501,interpreted to define an apparent unconformity betweenthe upper crust (Cape- and Karoo Supergroup) and theunderlying mid-crust. An interpreted blind thrust fault inthe tomography model (Stankiewicz et al., 2007) may be
related to a series of low angle listric faults in the Cape-and Karoo Supergroup seen in the IyA-200501 seismicdata (compare Figure 7d to Figures 3, 4 and 8). Althoughthe blind thrust fault does not show up clearly in theseismic reflection image, the top of the thrust doescoincide with the top of the interpreted Wh/PAFormations and the local décollement surface within the Ecca Group (red dashed line at the base of theCollingham Formation in Table 1; and Figure 8).
In summary, the seismic data, borehole informationand magnetotelluric data collectively resolve the depthsof individual formations in the Cape- and Karoo-Supergroups along the entire profile length, therebyconcluding our interpretation of the upper-crust (Figure 8). The base of the Cape Supergroup is wellconstrained in all available datasets and marked by a flattruncating surface that dips slightly (at ~3 degrees) to thesouth. This erosional surface is labelled as an angularunconformity at the CSG base in Figures 3, 8 and 9 andis consistent with field observations throughout westernSouth Africa (e.g. Johnson et al., 2006). More accurateregional chronostratigraphy to test our upper-crustinterpretation against, can be only be obtained throughre-logging boreholes SA-1/66 and KW-1/67, and/or bydrilling new boreholes on line IyA-200501 with down-hole geophysical logging.
Mid-crust (~10 to 30 km)Along the entire length of IyA-200501, the seismic dataimaged reflectors in the mid-crust dipping north atapproximately 20 degrees (Figures 3 and 4). This isinterpreted as a tectonic fabric truncated abruptly by thestrong, slightly south-dipping reflectors of the CapeSupergroup above (Lindeque et al., 2007; Figures 4, 8and 9). The upper-crust/mid-crust interface is thereforerepresented by the sharp and near sub-horizontalunconformity. Boreholes farther afield ended in theNamaqua-Natal Metamorphic Belt (NNMB) gneissesbelow the Cape Supergroup (e.g. QU-1/65 and KC-1/70,Figure 1; Eglington and Armstrong, 2003; Eglington,
SOUTH AFRICAN JOURNAL OF GEOLOGY
DEEP CRUSTAL PROFILE, SOUTHERN KAROO BASIN AND BEATTIE MAGNETIC ANOMALY274
Figure 5. Borehole log compared to seismic data. Top left: overview map of borehole SA-1/66, thick red line = seismic line WK-01;
arrow = borehole projection along strike; yellow line= seismic profile IyA-200501; background image = 20 m DEM in Figure 2; white dashed
lines = BMA maximum axes. Top right: Migrated image of the upper 12 km of seismic reflection profile IyA-200501 and boreholes. Red block
= area shown in Figures 5a-c below. (a) Paper record extract of archive seismic line WK-01 and line coincident borehole SA-1/66
superimposed. From the compiled borehole log in Table 1: top of the Ecca Group (E) lie at ~0.5 s TWT; top of the Whitehill- and Prince Albert
Formations (Wh/PA) at ~1.1 s TWT; top of the Dwyka Group (D) just above the first reflector at ~1.2 s TWT; top of the Bokkeveld Group (Bo)
at ~1.47 s TWT; and top of the Nardouw Formation (N), in the Table Mountain Group (TMG) at ~1.67 s TWT. Black and red horizontal lines
mark the top of each group or formation, based on either using interval velocities to convert TWT to depth, or the depths in the borehole logs.
(b) Paper record in (a) converted to SEGY data and same horizons marked. Thick black arrow marks the interpreted top of the Dwyka Group
above the first horizontal reflector (c) IyA-200501 seismic data and projected borehole log SA-1/66 superimposed. Red vertical lines match
stratigraphic units in the seismic image to the corresponding borehole units. The Karoo Supergroup: B = Beaufort Group; E = Ecca Group;
Wh/PA = Whitehill- and Prince Albert Formations forming the base of the Ecca Group; D = Dwyka Group. The Cape Supergroup (CSG):
Witteberg Group absent and pinched out to the left of the borehole; Bo = Bokkeveld Group; N = Nardouw Formation and P = Peninsula
Formation forming part of the Table Mountain Group. Compare (a) and (b), to (c): pale pink = top of the Ecca Group; darker pink =
Whitehill- and Prince Albert Formations; brown = top of the Dwyka Group above the first prominent reflector. See text for discussion of the
Dwyka contact.

A. LINDEQUE, M.J . DE WIT, T. RYBERG, M. WEBER AND L. CHEVALLIER
SOUTH AFRICAN JOURNAL OF GEOLOGY
275
SOUTH AFRICAN JOURNAL OF GEOLOGY
DEEP CRUSTAL PROFILE, SOUTHERN KAROO BASIN AND BEATTIE MAGNETIC ANOMALY276
A. LINDEQUE, M.J . DE WIT, T. RYBERG, M. WEBER AND L. CHEVALLIER
SOUTH AFRICAN JOURNAL OF GEOLOGY
277
2006). The basement beneath IyA-200501 is thereforealso interpreted as NNMB crystalline basement and mostlikely, as stacked wedges of 1.0 to 1.4 Ga graniticgneisses of the Bushmanland terrane (Lindeque et al.,2007).
The north-dipping mid-crust fabric is concordantwith the typical east-west trending and north-dipping D2 planar fabric (S2) of the NNMB gneisses, mapped inthe field to the north of IyA-200501 (e.g. Joubert, 1971;1986a, b; Albat, 1984; Macey 2000; 2001; Macey et al.,2011). These field observations document polyphasedeformation events that resulted in complex, doubly-plunging basin-and-dome type interference structures,and refolded tight to isoclinal D2 folds with long limbsparallel to S2, generally represented by a strong gneissicbanding with intense linear fabrics.
The magnetotelluric model cut at 30 km depthidentified a number of high conductivity anomalies in the mid-crust (Weckmann et al., 2007). When superimposed on the IyA-200501 seismic profile,the seismic reflectors (black dashed lines, Figure 7c)appear to transect the boundaries of the highconductivity anomalies (red dashed lines in Figure 7c).The possible reason for this is discussed in the nextsection.
The tomography refraction model identified a highvelocity > 6.5 km/s, ~20 km wide region near the centreof the mid-crust (Stankiewicz et al., 2007; 2008; oval inFigure 7d and insert). Although this high velocity regionis 20 km north and 7 km deeper than regions of highreflectivity in IyA-200501, the latter identified as the Beattie Magnetic Anomaly (Lindeque et al., 2007),the southern part overlaps spatially with the seismic dataand high conductivity zone seen in the MT data (Figure7c and d). Regions of lower velocities ~6 to 6.5 km/s arecoincident with the rest of the mid-crust sector of IyA-200501.
The Beattie Magnetic Anomaly Two regions of high reflectivity in the IyA-200501seismic image occur directly below the two divergingBMA axes of maximum aeromagnetic values (CGS, 2000;Figures 1, 3, 4 and 7). The seismic character of the tworegions is complex and their internal reflectivity is
stronger than that of the adjacent NNMB seismic fabric.The northern region is ~10 km wide, and the southernregion 5 to 7 km wide, with an approximate gap of 6 kmbetween them. Combined, the two regions appear as a~24 km wide zone confined to the NNMB mid-crust at 7 to 12 km depth below surface, interpreted as thesource of the BMA (Lindeque et al., 2006; 2007; Figures 7 and 9). The interpretation is consistent withthe divergence of the BMA maximum axes seen in theaeromagnetic data (compare Figures 1 and 7). Anothercomplex reflectivity cluster occurs 12 km farther south,and although spatially coincident with a similar highconductivity anomaly, it does not have a clearexpression in the aeromagnetic data and falls outside the identified BMA region (dashed outlined region inFigure 1).
Apparent crossing reflectors in the mid-crust at 10 to30 km depth and at ~40 km along the line may beinterpreted as fold-like features resembling a flowerstructure, in which case strike-slip motion might explainthe “duplication” of the anomaly. However, we find nofurther supporting evidence for this and since no flowerstructures were identified in the magnetotelluric data(Weckmann et al., in press), we discard this idea. Themagnetotelluric data of Weckmann et al. (2007a) didimage a “bean-shaped” conductivity anomaly (lowresistivity of ca.1 ohm.m) in the mid-crust at kilometre55 to 66 km along IyA-200501 (Figure 7c). It coincideswith the northern maximum axis of the BMA, and thenorthern region of higher reflectivity in the seismic data(compare Figures 7a, b and c). Whilst the highconductivity anomaly is reasonably coincident with thecomplex reflectivity zone in the seismic data, it shouldbe noted that the outlines of the conductivity anomaliesapparently transgress the seismic reflectors (compareFigures 7b and c). We interpret this to indicate that theconductivity anomaly reflects, at least in part, asecondary metasomatic overprinting processes.
In summary, the southern part of the >20 km widehigh reflectivity zone coincides with the BMA regionidentified in the magnetotelluric data, and the verticaldownward projection of the northern BMA axis inaeromagnetic data. These observations are consistentwith our interpretation that this region of complex
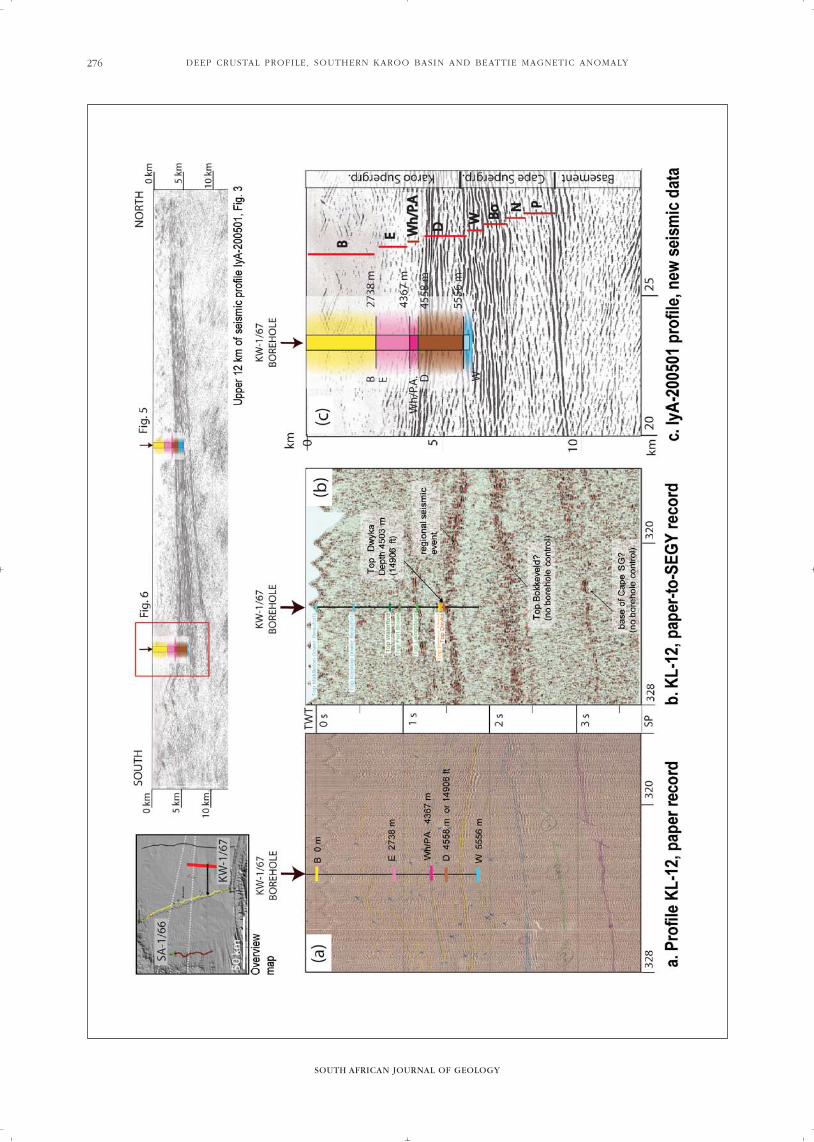
Figure 6. Borehole log compared to seismic data. Top left: overview map of borehole KW-1/67, thick red line = seismic line KL-12;
arrow = borehole projection; yellow line = seismic profile IyA-200501; background image = 20 m DEM in Figure 2; white dashed lines = BMA
maximum axes. (a) Extract from archive seismic line KL-12 paper record and line coincident borehole KW-1/67. From the compiled borehole
log in Table 1: top of the Ecca Group (E) lie at ~0.7 s TWT; top of the Whitehill- and Prince Albert Formations (Wh/PA) at ~1.25 s TWT; top
of the Dwyka Group (D) just at the first reflector (~1.5 s TWT in (a) and 4502 m depth in (b)); top of the Bokkeveld Group (Bo) at ~2.5 s
TWT; base of the Cape Supergroup (CSG) at 3.25 s TWT. Compare with the same horizons marked in the SEGY data (6b) derived from the
same paper record shown in (a). (c) Seismic data of IyA-200501 and projected borehole log KW-1/67. Red vertical lines match stratigraphic
units in seismic image to the corresponding borehole units. Compare (c) with the paper record (6a) and paper-to-SEGY record (6b) which
suggests the top of the Dwyka occurs at the first prominent reflector and not below as is the case when the borehole is projected into the IyA-
200501 seismic profile (6c). Borehole KW-1/67 ends in the Witteberg Group and a fault. The original log recorded that the Witteberg Group
pinches out farther north (PASA, 1967b). In contrast to Figure 5c, borehole SA-1/66 on the IyA-200501 seismic image (Figure 6c), suggests
the Prince Albert- and Whitehill Formations (purple) are represented by the first prominent reflector; the top of the Dwyka Formation lies just
below. Lettering as for figure 5, and W = Witteberg Formation.

SOUTH AFRICAN JOURNAL OF GEOLOGY
DEEP CRUSTAL PROFILE, SOUTHERN KAROO BASIN AND BEATTIE MAGNETIC ANOMALY278
Figure 7. Beattie Magnetic Anomaly (BMA) interpretation: (a) Total free air aeromagnetic data extracted from Figure 1 (CGS, 2000).
Red dots = IyA-200501 seismic profile; thin black dashed lines = surface expression of the BMA maximum axes; black solid lines = main
roads. Note the BMA divergence near the centre of the profile, 40 km from the south and 36 km from the north. Total estimated BMA width
in the profile, measured from maximum to maximum = 24 km. (b) Extract of the upper ~20 km from the IyA-200501 seismic reflection
profile. BMA maximum axes in (a) are projected into the seismic profile (b, thick black dashed lines) coinciding with two regions of greater
reflective density near the centre of the profile at kilometres 40 to 60 and ~7 to15 km depth. (c) 2D conductivity model of Weckmann et al.
(2007a) and migrated image of IyA-200501 superimposed for direct comparison. The northern BMA maximum axis aligns with a high
conductivity anomaly (yellows to reds). Seismic reflectors in the mid-crust, cut across the margins of the high conductivity anomalies (black
dot-dashed lines). The conductivity model best resolves the top of the conductors in the upper crust (red dotted lines). Insert: MT model and
forward model of aeromagnetic data superimposed (Weckmann et al., 2007a, b). An inferred south dipping fault in the aeromagnetic data
model (dashed white line) is not seen in the seismic data. (d) Tomography model and interpretation (thin black dot-dashed lines) from
Stankiewicz et al. (2007), with seismic reflection data of profile IyA-200501 superimposed for direct comparison. Insert: complete tomography
model of Stankiewicz et al. (2007).

A. LINDEQUE, M.J . DE WIT, T. RYBERG, M. WEBER AND L. CHEVALLIER
SOUTH AFRICAN JOURNAL OF GEOLOGY
279
seismic reflectivity designates the two-part NNMB, BMAsource. The presented interpretation agrees withprevious work (Lindeque et al. 2007) and with themodel of Quesnel et al. (2009) that recognizes twosimilar adjacent magnetized sheet-like prisms in the mid-crust at 9 to 12 km depth and 13 to 18 km depth,separated by a vertical offset of ~2 to 5 km.
The Lower crust (> 25 km) and Moho The transition from mid- to lower crust is marked by astrong change in seismic reflectivity at ~32 km depth inthe south and ~20 km depth in the north, interpreted asa tectonic break (e.g. a mid-crustal detachment; red linein Figure 4). Deflections of the north dipping seismicfabrics as it nears the detachment suggest it is a thrustzone, but parts of the deflections could also beinterpreted to reflect normal shear displacements.A previous interpretation of IyA-200501 indentified twocomponents in the lower crust: 1. a wedge with north and south dipping fabric
underlain and transposed by 2. a ~2 to 3 km thick layer near the 42 to 48 km deep
Moho (Lindeque et al., 2007). Detailed re-analysis of IyA-200501 reveals a morecomplex, possibly four-component lower crust model(Figures 3, 4 and 9). The four components are: i. ii. Two interlocked wedges with a complicated north
and south dipping fabric, interpreted as a series ofinterleaving slivers (greens, Figure 9). In a regionaltectonic context, these wedges could be interpretedas an extension of the ~2.0 to 1.3 Ga juvenile crustNNMB basement in the Areachap Terrane,Richtersveld Terrane and Kheis Province in theNamaqua sector of the NNMB (Joubert, 1986a, b;Thomas et al., 1993; 1994; 1996; Eglington, 2006) or,as a continuation of the 1166 Ma Achab Gneissbasement below the Central Bushmanland Terrane(Cornell and Pettersson, 2007; Pettersson et al.,2007).
iii. A lower, ~10 km thick layer at 38 to 40 km depthand less reflective than the two wedges above(Figure 4; light grey in Figure 9). The dominantfabric dips north and penetrates the thin higherreflectivity layer below (dark grey layer in Figure 9), suggesting that the two lowermost layers may be related and older than the NNMBwedge above.
iv. A highly reflective thin (~2 to 5 km thick) layer atapproximately 40 to 43 km depth lies parallel to theMoho (Figures 3 and 4; dark grey in Figure 9). Thisreflective layer may be interpreted as magmaticunderplating, similar to that recorded in many otherseismic sections globally and could be ofmetamorphic or metasomatic origin (e.g. Eaton,2005). Alternatively, the strong reflective layer couldbe interpreted as a decoupling- or transition zonebetween the lower crust and uppermost mantle,with a vertical extent of a few kilometres (Oueityand Clowes, 2010). A few north dipping reflectors
transect the underplated layer at two points, ~30 and60 kilometres along IyA-200501. We interpret theseas fault planes, but the cause for this Mohodisplacement is unclear. It could be argued that thetwo points are consistent with strike-slip motionnormal to the plane of the seismic line and resemblea flower structure of lithospheric scale. However,similar to the mid-crust, we have no furthersubstantial evidence for this idea and theinterpretation is left as discussed. The Moho depthsare in good agreement with receiver functionanalyses of Harvey et al. (2001; station SA05 inFigure 2), as well as results from the amphibianwide-angle refraction experiment along the entirewestern line of the AKGTransect (Figure 1; Parsieglaet al., 2007; 2009).
The reflectivity pattern seen in the lower crust is typicalof interwedging terranes in continental collision zones(e.g. Wever and Sadowiak, 1991) and consistent withreflectivity patterns and interpretations from theLithoprobe profiles across similar age Proterozoicterranes (e.g. Cook et al., 2004; 2005; Evenchick et al.,2005). The Abitibi-Grenville Transect (Winardi andMereu, 1997; Ludden and Hynes, 2000; Mereu, 2000;White et al., 2000) is of particular interest for thiscomparisson and discussed later on.
Discussion Our integrated crustal model in Figure 9 derived fromthe datasets discussed, contrasts distinctly with theprevious model of Hälbich (1993) and subsequentmodels based thereon (e.g. Catuneanu et al., 1998; 2002;Chevallier et al., 2004; Johnson et al., 2006; Tankard et al., 2009). The most obvious differences with some ofthese models and their implications are brieflysummarized, starting from the upper crust down to theMoho.
Karoo BasinThe Karoo Supergroup (yellow, pink and brown inFigures 8 and 9) retains a near constant thickness in theupper 2 to 3 km of IyA-200501, whereas the CapeSupergroup varies from 2.5 to 5 km thick. Previousmodels of Hälbich (1993), Chevallier et al. (2004) andJohnson et al. (2006) postulate a ~8 km thick KarooBasin and significant stratigraphic fore-deep thickeningat the Cape Fold Belt Front (Figure 10a–c). This is notseen in the seismic reflection data. The integrated crustalmodel presented here constrains a shallow Karoo Basin,with deformation of the Karoo Supergroup, at leastlocally, detached from the Cape Supergroup below. Lowangle thrusts appear rooted in the Whitehill- and PrinceAlbert Formations of the Ecca Group, which acted aslocal décollement surfaces.
The Cape Supergroup The Cape Supergroup continues all along IyA-200501(blues and purples in Figures 8 and 9). The seismic data
imaged the Cape Supergroup as a continuousundeformed sub-horizontal wedge, 1.5 km thick at theescarpment in the north and 10 km thick at the CFBfront in the south. This wedge continues below theescarpment and does not pinch out as previousgeological-based models suggest. However, theWitteberg Group still pinches out before borehole SA-1/66 (compare Figure 8 with Figure 10a–c). The base ofthe Cape Supergroup is defined by an angularunconformity dipping at ~3 degrees to the south. The crustal model presented here suggests the CapeSupergroup shortened via low-angle listric thrusting and thin-skinned tectonics beneath the Karoo Basin(Figure 8, fold-out). The northernmost limit of combinedlow angle thrusting and significant folding of the CapeSupergroup is restricted to the Cape Fold Belt front. The low angle faults do not appear to penetrate thebasement as the Hälbich (1993) model implied (compareFigures 10a and 10d).
Extent of the NNMB mid-crustIn our model, the regional NNMB mid-crust fabric dipsto the north at ~20 degrees (Figure 9). The mid-crustwedge thins to the north and consists of three units orblocks (shades of orange in Figure 9), each one madeup of stacked smaller wedges and a strong northdipping fabric terminating against the NNMB mid-crustdetachment and the older NNMB lower crust below(greens in Figure 9). The regional north-dipping fabricseen in the upper part of the mid-crust (orange in Figure 9) does not fit the major south dippingsubduction zone model advocated by Hälbich (1993). In previous models, the southernmost boundary of theNNMB was defined by a deep BMA (serpentinisedophiolite wedge in Figure 10a) and the Southern CapeConductive Belt, possibly abutting a Pan African(Neoproterozoic) suture zone beneath the CapeSupergroup (e.g. de Beer et al., 1982; de Beer andMeyer, 1983; 1984; Pitts et al., 1992; Eglington et al.,1993; Cornell et al., 2006; Eglington, 2006). The seismicdata do not support these models:
In our model, the top of the NNMB reflections(Figure 9) are truncated by a major angularunconformity at 5 km depth in the north, dipping to 12 km depth in the south and traceable along the fullprofile length. This unconformity, the flat CSG base andparticular seismic characteristics of the mid-crust below,collectively suggest that the NNMB continues beneaththe CFB and possibly farther south below the CFB up to
the Agulhas Bank (Figure 11). Contradictory to allprevious models, the seismic reflection image impliesthat Pan African Saldanian rocks are not present belowthe angular unconformity.
Our interpreted extension of the NNMB to thecontinental shelf and up to the Agulhas Falkland-Fracture Zone (AFZZ) as illustrated in Figure 11, is further supported by the seismic wide-angle refractionwork and subsequent tomography crustal models ofParsiegla et al., (2007; 2009) and Stankiewicz et al.(2007; 2008). Their data indicate that the mid- and lowercrust beneath the Cape-/Karoo Basin have similarseismic properties up to the continental boundary,thereby implying the nature of the crystalline basementbeneath the CFB, and beyond, is likely MesoproterozoicNNMB. In addition, magnetic crustal anomalies south ofthe BMA (Du Plessis and Thomas, 1991), borehole data(Eglington and Armstrong, 2003) and inherited ~2 Gazircons from the ~550 Ma Cape Granite Suite plutonswithin the Cape Fold Belt (unpublished data, Eglington,2006), are all consistent with an NNMB that extends muchfarther south, well beyond the BMA. Backeberg et al. (thisvolume) suggest that Mesoproterozoic crust, interpretedby them to be Bushmanland gneiss equivalents, isrequired to explain the crustal contamination of doleritedykes intruding the Cape Peninsula.
The position and age of the Cape Meredith complex,provides additional evidence that the NNMB extendsfarther south below the CFB. Many Gondwanareconstructions place the Falkland Islands andsurrounding plateau against the south coast of SouthAfrica, conterminous with the Cape-Karoo basin (e.g.Grantham et al., 1997; Jacobs et al., 1997; Thomas et al.,1997; Storey et al., 1999; Figure 11). The basement to theCape Supergroup equivalent rocks on the FalklandIslands are the ~1 Ga Mesoproterozoic amphibolitegrade meta-volcanic and mafic sequences of the CapeMeredith Complex (Thistlewood et al., 1997; Thomas etal., 1997). In the Gondwana reconstruction, thisMesoproterozoic Eastern Falkland basement lies southof the CFB front and the West Falkland a bit furthernorth (e.g. Figure 6 in Storey et al., 1999), supportingour interpretation that a Mesoproterozoic basementoccurs well south of the BMA and CFB.
In short, the crustal model presented here revealsthat the BMA is neither a southern boundary of theNNMB, nor a major Pan African suture, and calls for asignificant adjustment of the crustal model of southernAfrica as suggested in Figure 11.
DEEP CRUSTAL PROFILE, SOUTHERN KAROO BASIN AND BEATTIE MAGNETIC ANOMALY280
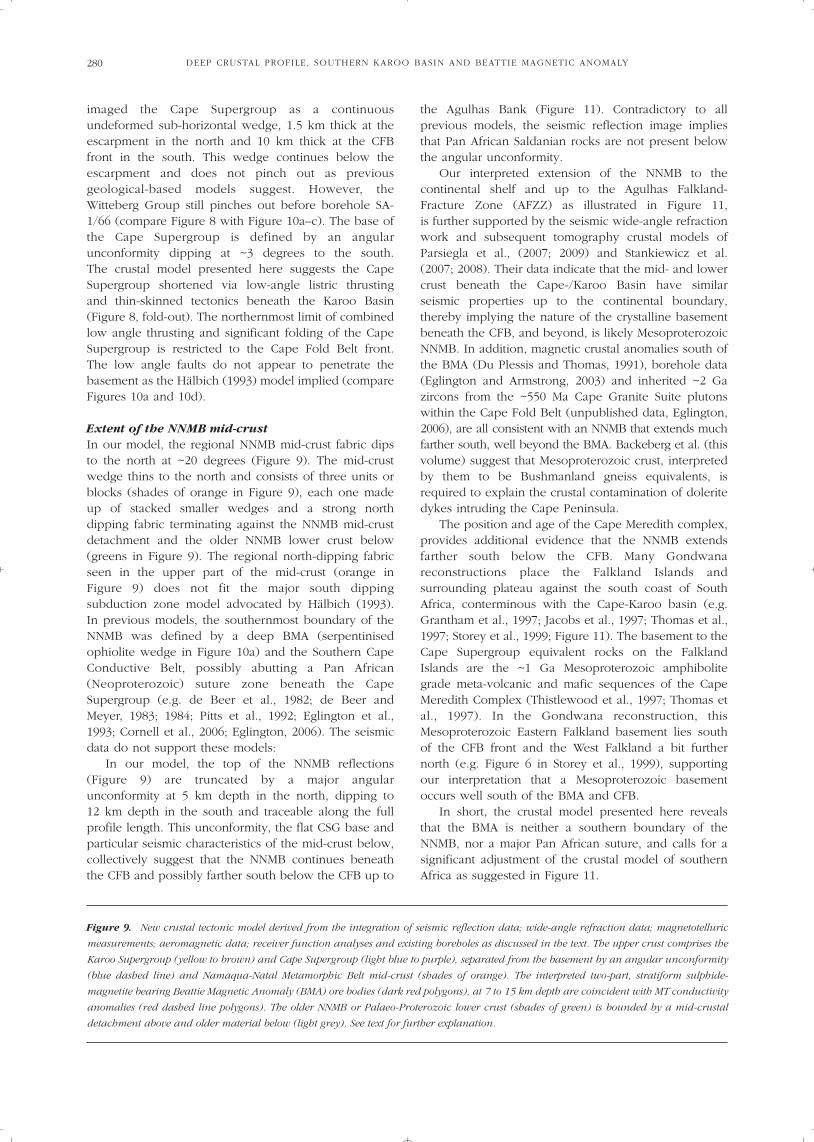
Figure 9. New crustal tectonic model derived from the integration of seismic reflection data; wide-angle refraction data; magnetotelluric
measurements; aeromagnetic data; receiver function analyses and existing boreholes as discussed in the text. The upper crust comprises the
Karoo Supergroup (yellow to brown) and Cape Supergroup (light blue to purple), separated from the basement by an angular unconformity
(blue dashed line) and Namaqua-Natal Metamorphic Belt mid-crust (shades of orange). The interpreted two-part, stratiform sulphide-
magnetite bearing Beattie Magnetic Anomaly (BMA) ore bodies (dark red polygons), at 7 to 15 km depth are coincident with MT conductivity
anomalies (red dashed line polygons). The older NNMB or Palaeo-Proterozoic lower crust (shades of green) is bounded by a mid-crustal
detachment above and older material below (light grey). See text for further explanation.

A. LINDEQUE, M.J . DE WIT, T. RYBERG, M. WEBER AND L. CHEVALLIER 281

Figure 10. Comparing models of the Cape- and Karoo Basins in the upper crust (< 15 km). (a) Hälbich et al. (1993) model:
Purple = ophiolite wedge/serpentinised palaeoceanic crust, their interpreted BMA source. A series of southward dipping low-angle thrusts cut
the upper and middle crustal regions. Thrust planes in the upper crust (e.g., Cape Fold Belt-Karoo Basin) have the same north-directed
tectonic vergence as those in the underlying Natal-Namaqua crystalline basement (arrows). (b) Chevallier et al. (2004) model: Karoo
Supergroup undifferentiated (light brown) and Cape Supergroup (in blues); (c) Johnson et al. (2006) model: Close-up from the regional
model (insert), stretched to the same vertical and horizontal scale as the IyA-200501 line. Red square = profile extent. Note significant folding
and deepening before the CFB compared to the new 2007–10 model. (d) 2007–10 model: legend same as in Figure 8 and 9: 2 to 5 km thick
Karoo Supergroup: yellow = Beaufort Group; pale pink = Ecca Group; dark pink = Whitehill- and Prince Albert Formations forming the base
of the Ecca Group; brown = Dwyka Group. Cape Supergroup below: light blue = Witteberg Group; blue = Bokkeveld Group; dark
blue = Nardouw Formation; purple = Peninsula Formation. Dashed lines = listric faults; finer black lines = reflectors from the IyA-200501
seismic image interpreted as a litho-tectonic fabric. Non-folded ~1.5 to 10 km thick Cape Supergroup continues beneath the Karoo Basin
along the entire length of the profile and rests unconformably on the Namaqua-Natal basement (orange) that hosts the two-part Beattie
Magnetic Anomaly (highlighted in red). In contrast, the older 1993, 2004 and 2006 models in (a–c) show: (i) interconnected folding of both
the Cape and Karoo Supergroups; (ii) significant thickening of the Karoo Supergroup before the Cape Fold Belt, interpreted as a fore-deep
basin; and (iii), a root below the Cape Fold Belt. Such features are not observed in the 2007–10 model (Figure 10c). See text for further
discussion.
SOUTH AFRICAN JOURNAL OF GEOLOGY
DEEP CRUSTAL PROFILE, SOUTHERN KAROO BASIN AND BEATTIE MAGNETIC ANOMALY282

The Beattie Magnetic Anomaly and its possiblesourceFrom the geological and geophysical data presented, wedescribed the apparent shape, depth and lateral extentof the two-part BMA hosted in mid-crustal rocks,interpreted as gneisses of the NNMB, at 7 to 15 kmbelow surface. Along IyA-200501, the BMA is a 10 to 22km wide zone, almost 6 km thick, with a distinctcomplex internal seismic character (Figures 7 and 9).The defined BMA region is coincident with the divergentmaximum axes seen in aeromagnetic data, and in broadagreement with the magnetotelluric data, but the sourceof the BMA remains under debate.
Previous work based magnetic interpretations andvertical magnetic fields of a large magnetometer array,suggested the BMA source may be a steeply dipping slabof serpentinised oceanic lithosphere, representing aNeoproterozoic suture zone (e.g. de Beer et al., 1982; deBeer and Meyer, 1983; Hälbich, 1993; Figure 10a). In
contrast, the new data show that the BMA appears to beconfined to the gneisses of the NNMB mid-crust and cantherefore not be a Neoproterozoic suture zone. Corner(1989) suggested magnetite enrichment of a graniticNNMB basement along low angle thrust faults, as apossible source for the BMA, but Weckmann et al.(2007a, b) concluded that unreasonably high magnetitecontents would be needed to account for such asignature. They alternatively ascribed the anomaloushigh conductivity zone near the middle of IyA-200501 at 20 km depth to graphite mineralized shear zones (oval, Figure 7c). Forward modelling of theaeromagnetic data proposed a resistive but magnetizedbody, possibly intersected by a south-dipping fault plane(Weckmann et al., 2007b). Such a fault plane is notimaged in the IyA-200501 seismic data and mineralizedshear zones in the NNMB fail to explain the extent orsource of the BMA feature. We therefore propose analternative explanation:
A. LINDEQUE, M.J . DE WIT, T. RYBERG, M. WEBER AND L. CHEVALLIER
SOUTH AFRICAN JOURNAL OF GEOLOGY
283
Figure 11. Simplified geologic basement map of southern Africa (modified after Cornell et al. 2006, and references therein). Light grey =
suggested revised extent of the Mesoproterozoic Namaqua-Natal Metamorphic Belt (NNMB) up to the Agulhas-Falkland Fracture Zone (AFFZ),
based on the geophysical data presented and referenced in this paper. Dotted polygon = Pan-African Saldanian Orogenic Belt restricted to
the west coast of southern Africa only and divided in the Gariep (Ga), Saldanian (S) and Agulhas-Columbine-Arch (ACA). The Falkland
Islands are shown in their Gondwana position after Jacobs et al. (1997), Thomas et al. (1997) and Storey et al. (1999). Namaqua-Natal
metamorphic terranes (NNMB): R = Richtersveld; G = Gordonia; B= Bushmanland of the Namaqua province; N = Natal province. Black =
Kango and Kaaimans tectonic inliers generally linked to the Saldanian orogeny, but recently dated to be older (de Wit et al., unpublished
data). Thick grey lines on the West coast = Seismic refraction and -reflection lines of Green and Durrheim (1990), Mahanyele et al. (2004),
Hirsch et al. (2008); Lines on the South coast: light grey line = onland seismic refraction line of Stankiewicz et al. (2007; 2008) and the longer
onshore-offshore seismic refraction line (Stankiewicz et al. 2008; Parsiegla et al. 2007; 2009); black line perpendicular to CFB front = IyA-
200501 seismic reflection profile, this work and Lindeque et al. (2007). BMA = Beattie magnetic anomaly maximum axes.

The regions with complex reflectivity patterns cross-cutby the high conductivity anomalies in the mid-crust(Figures 7 and 9) could also be interpreted as orebodies, since ore minerals such as Pyrrhotite and otheriron sulphides have a high conductivity. Impedancespectroscopy on samples from boreholes SA-1/66 andKW-1/67, proved high conductivity in the Wh/PAFormations, associated with pyrite and chalcopyrite(Branch et al., 2007). In the magnetotelluric model thehigh conductivity Wh/PA band show similar conductivityvalues as the identified BMA zone (Figure 7c). So it isplausible that part of the BMA source(s) can be bothmagnetic and conductive (i.e. the larger BMA polygon inFigure 9). Other anomalies imaged may be conductive,but without a corresponding high signature on theaeromagnetic data (i.e. high conductivity anomalies onthe edges of the IyA-200501 profile, compare Figures 7and 9) or vice versa (i.e. the smaller BMA polygon in theleft centre, Figure 7b, c and Figure 9).
Considering all of the above, we postulate that theanomalous two BMA regions in the mid-crust couldrepresent tectonically(?) disrupted stratabound oredeposits that may have been further remobilised throughmetasomatic processess of late stage hydrothermal fluidsduring NNMB orogenesis. We propose that the BMAmay have originated as a stratabound massive sulphide-magnetite deposit(s), now flanked by smaller depositswith overlapping metasomatic aureoles.
Similar large ore bodies are common in the ~1.0 to1.2 Ga Namaqua section of the NNMB, and havesignatures in the aeromagnetic data similar to that of theBMA (Figure 1) for example: the world-class massive orlaminated Pb-Zn-Cu-Ag sulphide-magnetite ore bodiesof the Aggeneys, Broken Hill and Gamsberg ore depositsin the Bushmanland Ore District, located ~450 km to thenorthwest of the IyA-200501 seismic profile presentedhere. These deposits are typically hosted in intenselydeformed gneisses and mafic to ultramafic supracrustalrocks, folded into nappes and isoclinal recumbent folds,subsequently refolded into late open synforms andantiforms (e.g. Ryan et al., 1986; Naicker, 1993; Reid et al., 1997; Colliston and Schoch, 2002; 2003; Bailie andReid, 2005; Stalder and Rozendaal, 2005; Bailie et al.,2007) or, in plug- and sheet-like bodies e.g. theKoperberg Suite gneisses of the Okiep Copper District(e.g. Gibson et al., 1996).
Large scale stratiform mineralization in regionalvolcaniclastic basins in the Kibaran (Grenville-like) beltsof Gondwana are common, and range from very high-grade to disseminated zones extending over 100s ofkilometres, including some in the Natal-Namaqua Belt of South Africa (Naicker, 1993; Wilsher, 1995). The nature and geometry of these zones followingintense deformation during the Kibaran Orogenyremains speculative, but the deformation is likely to have produced extensive stretching and redistributionof metallic elements. Whether the BMA and the SCCBmay be geophysical manifestations of suchmetamorphosed and disseminated deposits, as we
believe the case may be, remains to be tested by deepdrilling.
Tectonic implicationsThe tectonic events that formed the complex crustalarchitecture of southernmost Africa described in thisstudy are not fully understood, but some first order ideasare briefly explored:
Phanerozoic Tectonic SettingThe tectonic setting of the Karoo Basin is often modelledas a cordillera-type retro-arc foreland basin, on thecontinental side of a foreland fold-thrust belt (i.e. the~250 Ma CFB) and adjacent to magmatic arcs (e.g. Hälbich 1983a, b, c; 1993; Thomas et al., 1993;Catuneanu et al., 1998; 2002; Johnson et al., 2006;Tankard et al., 2009). Some models argue that tectonicsin the Cape Fold Belt are related to a strike-slipdominated environment (e.g. Tankard et al., 2009), butevidence to support strike-slip, such as persistent andpenetrative horizontal lineations in the CFB, has not yetbeen reported.
The related subduction zone is often modelleddipping north with subduction of the Palaeo-Pacific oceanic crust south of the CFB (Figure 12a). This interpretation is however oversimplified (e.g. Milaniand de Wit, 2008). The large distance between the CFB and the postulated subduction zone (> 1000 km)combined with the lack of ~300 Ma old granites andvolcanism in South Africa, is problematic in suchmodels. Frequently these issues are resolved byassuming flat plate subduction as originally suggested by Lock (1980). These northward subduction models do not fit the deep crustal seismic data presented here, because the latter do not image a deepsuture zone beneath the CFB and/or the Karoo Basin.
Alternatively, if subduction to the south is postulated,Palaeozoic oceanic crust and arc systems should bepresent to the south of the CFB (Figure 12b; Burke et al.,1977; Winter, 1984) which they are in a Gondwanaframework (e.g. de Wit et al., 1988). But this does notexplain how the Karoo Basin and CFB could haveformed relative to the long distance from the subductionzone. It has been repeatedly pointed out that the KarooBasin does not have the lithostratigraphic attributes of atypical foreland basin (Cloetingh et al., 1992; Turner,1999; Johnson et al., 2006; Milani and de Wit, 2008;Fildani et al., 2009). The IyA-200501 transect dataconfirm this. We therefore propose instead that the CFB-Karoo basin may represent a wide, upper crustalthin skinned Jura-type fold belt, formed in response tocontinent-continent-, arc collision, or suturing south ofthe CFB, with subduction to the south (Figure 12c). Thisseems perfectly feasible in a larger Gondwanaframework (Milani and de Wit, 2008) and as was alsosuggested for the Sierra de la Ventana in Argentina(Ramos 1988, 2008).
SOUTH AFRICAN JOURNAL OF GEOLOGY
DEEP CRUSTAL PROFILE, SOUTHERN KAROO BASIN AND BEATTIE MAGNETIC ANOMALY284

A. LINDEQUE, M.J . DE WIT, T. RYBERG, M. WEBER AND L. CHEVALLIER
SOUTH AFRICAN JOURNAL OF GEOLOGY
285
Figure 12. Schematic models of various tectonic settings. (a) Phanerozoic origin of the Cape Fold Belt and Karoo Basin through the
northward subduction of an oceanic plate below the continent. (b) Alternative continent-continent collision and subduction to the south
model, accounting for the lack of 300 Ma granites in the Cape Fold Belt, and the absence of a suture zone and palaeoceanic crust below the
Karoo Basin (e.g. Winter 1984). (c) Schematic model of the proposed Phanerozoic tectonic setting of the Cape- and Karoo Basins and the
associated Cape Fold Belt: subduction to the south and collision(s) with a crustal block farther to the south (e.g. Patagonia), now embedded
in South America (e.g. Ramos 1988; 2008). (d) Proposed Proterozoic tectonic setting of the Namaqua-Natal Metamorphic Belt: far-field flat
plate subduction to the south. (c) and (d) are our preferred models and considered the most conservative for explaining the north dipping
mid-crust tectonic fabric and thrust plane seen in IyA-200501. See text for further discussion.

PalaeozoicTraditionally, the Kaaimans and Kango inliers in the CFBhave been linked to the Pan African-age Saldanianbasement on the west coast of South Africa (e.g. Johnson et al., 2006; Figure 11). There is however,no substantial evidence for such a correlation. For example, the uppermost sequences of the Kangoinlier have been dated and correlated with coarse clasticsequences that overlie the Saldanian rocks along theWest coast (Barnett et al., 1997), whilst the lowermostsequences of the Kango inlier are much older than theSaldanian rocks, without evidence of any substantial PanAfrican tectonism (de Wit, unpublished).
Previous models presented a Pan African suture zoneat the BMA to account for the occurrence of these inliers(i.e. the Kango inlier and the Kaaimans inlier intrudedby the 538 Ma, George Granite). Instead, Pan Africanaged (520 to 650 Ma) outcrops are limited to the Gariep,Saldanian and the aligned Agulhas-Columbine Archunits on the West coast (Figure 11). On the South coast,the granite outcrops at George (latitude 34°S, longitude22.5°E) might imply a Saldanian suture farther south, but not at the CFB front as the previous modelsassumed.
Mesoproterozoic Tectonic Setting Many researchers suggested a Mesoproterozoic islandarc tectonic setting and subduction-related arc volcanismfor the formation of the NNMB juvenile crust, withsubsequent amalgamation between these arcs and oldercrustal domains, followed by accretion against theKaapvaal Craton and significant transpressional strike-slip deformation (e.g. Hartnady et al., 1985; Joubert,1986a, b; Cornell et al., 1992; 2006; Gibson et al., 1996;Thomas et al., 1994; 1996; Basson and Watkeys, 2003;Colliston and Schoch, 2002; 2003; Eglington andArmstrong, 2003; Raith et al., 2003; Eglington, 2006;Bailie et al., 2007; Cornell and Pettersson, 2007 andreferences therein).
These accretion models usually explicitly depict theNNMB mid-crust with a tectonic fabric that dips south(e.g. Figures 4 and 6 in Thomas et al., 1994). However,the regional tectonic fabric imaged in profile IyA-200501dips north and the shallow dipping décollementseparating the mid- and lower crust is not a deep suture.To satisfy a northward subduction model at the southernmargin of the Kaapvaal Craton (Figure 12a), a northdipping deep suture zone and thrusting to the south isrequired. Evidence for a northward subduction is notseen in the IyA-200501 seismic image (Figures 3, 4 and 9). Moreover, this geometry would predict thatMesoproterozoic granitoid intrusions should be presenton the craton margin, which they are not.
Collectively, our observations rather suggest anNNMB accretion model with subduction to the southand thrusting of the mid-crust to the north (Figure 12b).Whilst a model with subduction to the south mayexplain the north-dipping tectonic fabric in the mid-crust, the disposition of the décollement boundary
between the mid- and lower crust can only be explainedif the subduction zone lay much further to the south, asit is not preserved in the IyA-200501 seismic image. In such a scenario, the NNMB island arc wedges wouldhave accreted against each other and against theKaapvaal Craton, along the mid-crust thrust planewithout participation of the lower crust. If the mid-crustal detachment is a Mesoproterozoic thrust andrelated to the north dipping NNMB regional tectonicfabric above, we propose that a far-field southwardsubduction Mesoproterozoic tectonic model along anaccreting continent margin, fit the IyA-200501 seismicdata best (Figure 12d).
Rodinian connectionsThe IyA-200501 seismic reflection profile images part ofa Proterozoic passive continental margin across whichthe Cape Supergroup was deposited. By implication, a conterminous and as yet unidentified continental blockmust have rifted-off and drifted away from the southernAfrican Margin in Neoproterozoic times, perhaps duringthe continental break-up of the supercontinent Rodinia.If so, IyA-200501 can be used to identify thecomplementary block and reconstruct the largercontinental fragment of which South Africa – and morespecifically the Kalahari Craton – would have been apart. This can be achieved to a first degree with Rodiniamodels that place the NNMB terranes of the KalahariCraton against the Grenville terranes of the LaurentianCraton (e.g. Li et al., 2008), and because similargeophysical transects are now completed along boththese potentially conterminous margins or blocks(Figure 13 and 14).
The rocks of the NNMB and Grenville Province havea similar Mesoproterozoic age-range, crustal tectono-metamorphic evolution and metallogenesis (e.g. Mooreet al., 1986; Sangster et al., 1992; Thomas et al., 1994;Robb et al., 1999). However, no geophysicalcomparisons have been made because until recently, nocomplementary seismic profiles have been available.With the completion of the Abitibi-Grenville (AG)transect during the Lithoprobe program (e.g. Clowes et al., 1996, Carr et al., 2000; Ludden and Hynes, 2000;Martignole et al., 2000; White et al., 2000), and now theAKGTransect completed during the Inkaba yeAfricaproject, a direct comparison of the deep crustalstructures of these two areas can be attempted. For thepurpose of this brief analysis, AG lines 32 and 33 (Carret al., 2000; Ludden and Hynes, 2000; White et al., 2000)are the most appropriate lines for direct comparisonwith the IyA-200501 seismic transect (Figures 13 and 14).Some similarities and differences are briefly noted:
The migrated image of AG 33–32 shows a highlyreflective internal mid-crustal fabric with steeply dippingreflectors, similar to the mid-crust fabric seen in IyA-200501 (Figure 14). In both profiles, these reflectorstaper towards an apparent internal seismic discontinuity,interpreted as mid-crustal detachment thrusts, separatingthe mid- and lower crust. These detachments display a
SOUTH AFRICAN JOURNAL OF GEOLOGY
DEEP CRUSTAL PROFILE, SOUTHERN KAROO BASIN AND BEATTIE MAGNETIC ANOMALY286

A. LINDEQUE, M.J . DE WIT, T. RYBERG, M. WEBER AND L. CHEVALLIER
SOUTH AFRICAN JOURNAL OF GEOLOGY
287
similar geometry in both profiles, and in both sectionsthe mid-crustal reflectors end abruptly against the uppercrust at an angular unconformity. The three-part crust inIyA-200501 (a highly reflective upper crust, a transparentintermediate crust and a more reflective lower crustunderlain by a strong coherent lowermost reflectordefining the Moho), is also present in AG 32–33, albeitnot as clearly imaged (Figure 14). The Moho depth of~42 to 45 km is similar and both profiles seismicallytrack the transition of their respective high gradeMesoproterozoic gneisses across a thrust contact, to alow-grade Archean Craton (Figure 14b).
Some distinct differences occur between these twosections on either side of the Grenville-Kibaran Orogen,but none of these rule out their co-evolution. For example:
i. the continuous, horizontal package of reflectors thatrests unconformably on the mid-crust in IyA-200501 is not present in AG 32–33, only because the AGtransect does not cross the Palaeozoic platformsequences that overlie the Grenville elsewhere in theregion.
ii. The lower-crust of IyA-200501 is more reflective andhas a complex internal seismic fabric compared to themore transparent lower-crust imaged in AG 32–33.The lower crust of AG 32–33 cannot be subdividedinto separate interleaving units as is the case in IyA-200501.
iii. The Moho in IyA-200501 is underlain by a thin (~2 to5 km thick) lowermost highly reflective layer that isnot seen in AG 32–33. The most striking differencehowever is.
Tarim
Australia
South China
Siberia
NorthChina
Mawson
GreaterIndia
DronningMaudLand
Laurentia
NorthAlaska
Chukchi
Kalahari
Rayner
Afif-AbasLurioForeland
Azania
Bayuda
SaharaCongo
Hoggar
Sao Francisco
Sao Luis
Riode laPlata
ParanaPanema
Amazonia
Chortis
Oaxaquia
Baltica
RockallNorth Scotland
GreenlandEastSvalbard
Kara
Chukotka
Borborema
Paranaiba
WestAfrica
Laurentia Kalahari
Grenville Mobile Belt
Superiorcraton
Abitibi-Grenvilleprofile AG 32-33
Grenvillemarginal
belt
internalbelt
Kibaranmarginalbelt
Kaapvaalcraton
AKGtransectprofile IyA-200501
(a)
(b)
im
lialiaaliaustrustrAAA
arTTa
endi
A
aLM
uriofif- elan
yneyRa
dL
au
son
e
fifo
ha iiaalah
nia
ni
zani
Abasasaalaha
iaud
era
r
iond
A
orFrL
y
A-A
aLand
aRR
aharKKK
Maa dMMMDronnteaGrGr
waM
C na
lao
Nolask
son outh Chin
oo Grde la
a
A
S
China
albarv
a
chihich
Ea dnnl
a
ukkc
tha
kck
ra
Chu
aeenlandnl
Chukotk
aK
vSSast
Gr
laskor
thNor
yuyuBa
H ar
ancisc
P
da
H arar
ao
PP
orB
rFS
b)(
ao
Oaxaqu
uu
uiaquaq
oscscancis
aan
taa
ChoCh
at
aa
uuLuu
a
o
neman
nemana
anema
a
o
kkocks
az
anaP
ararPP
LLLLS
c
ville MenGr
ltica
thotland
Nor
al
alalall o
Ba
cSlr
eltobile Bville M
ontacrSuper
on beltbelt
ertin
G 32-33
inalgmarvilleenGr
ofile AprvilleenGrbitibi-A
iorSuper
cr
-200501
belt
yAofile IprtansecGtrAK
beltaapKinalgmar
anibarKnaler
ontacraalvaap
Figure 13. (a) Rodinia model modified after Li et al. (2008). Shades of green = Grenville Mobile Belt (GMB) outcrops; red dashed
lines = extent of the GMB; shades of grey = older cratons; black square = area of interest; pink block = IyA-200501 seismic reflection line and
our derived crustal model; yellow block = approximate position of the Abitibi-Grenville seismic line AG 32–33. The two seismic lines are
rotated 180 degrees to form a combined section (b), consistent with the present orientation of the Kalahari Craton (South Africa) and
Laurentia (North America). (b) Simplified section as a block diagram: South African IyA-200501 seismic line (pink block on the
right = pink block in a) and the comparative Abitibi-Grenville transect (yellow block on the left = yellow block in a). The seismic lines are
projected into this diagram to form a composite section drawn within the context of the Grenville Mobile Belt, thrust directions and the
respective cratons (Figure 14b).

SOUTH AFRICAN JOURNAL OF GEOLOGY
DEEP CRUSTAL PROFILE, SOUTHERN KAROO BASIN AND BEATTIE MAGNETIC ANOMALY288
Figure14. (a) LITHOPROBE Abitibi-Grenville transect line AG 32–33 migrated seismic reflection profiles (yellow block in Figure 13) and the
South African IyA-200501 profile (pink block in Figure 13), see comparison in text. (b) Simplified composite section of the GRENVILLE line
AG 32–33 tectonic model (Ludden and Hynes, 2000; White et al., 2000; yellow dashed box) and the SOUTH AFRICAN seismic profile
IyA-200501 (pink dashed box). The angular unconformity with upper Phanerozoic sediments in AG 32–33 is not shown as it occurs farther
north (yellows in Figure 13a, above the AG 32–33 block). Internal mobile belt in the middle of (b) interpreted. See text for explanation.

A. LINDEQUE, M.J . DE WIT, T. RYBERG, M. WEBER AND L. CHEVALLIER
SOUTH AFRICAN JOURNAL OF GEOLOGY
289
iv. the mid-crustal tectonic fabric of the AG 32–33 profiledips away from the craton (green and blue, Figure 14b) whereas the mid-crust fabric in IyA-200501 dips towards the craton (orange, Figure 14b). The origin for this difference can only bespeculated upon and will not be further pursuedhere.
Despite these differences, the seismic image and derived crustal model of both the IyA-200501 andAG 32–33 transects, generally fit the broader Rodiniareconstruction of Li et al. (2008). Both sections havesimilar deep crustal architecture, thrust across low gradecraton margins and are severed from their outboardmobile belt sections (middle block in Figure 12d and 14b).
Summary and conclusionsIntegration of archive borehole data, surface geology,and various geophysical datasets with the IyA-200501seismic data, yields a complex tectonic model of thecrust of southernmost Africa. Specific reflectivity regionsand reflector packages have been linked to thegeological formations of the Cape- and Karoo-Supergroups, sub-components of the NNMB mid-crust,and a possibly older lower crust. The integration ofthese datasets proved especially useful in resolving theupper 3 km. The seismic reflection data of IyA-200501show the sub-horizontal Cape Supergroup restingunconformably on a flat and shallow south-dippingpeneplain of NNMB basement for more than a 100 km,and likely much farther south.
The Phanerozoic-Mesozoic tectonic model presentedhere suggests: 1. Deformation along low angle listric faults rooted in
apparent local décollement surfaces of the Whitehill-and Prince-Albert Formations in the lower Ecca.These two formations correspond to a thin (~100 m thick) continuous sub-horizontal highconductivity band imaged in the magnetotelluricdata.
2. Absence of a notable fore-deep basin in the southernKaroo; and
3. shortening at the CFB tectonic-front through a seriesof low-angle listric thrusts and folds detached fromthe NNMB basement and the Karoo Supergroup.
For the Phanerozoic tectonic setting, the integrated datasupport a collisional tectonic setting and far-fieldsubduction to the south, with the Karoo Basindeveloping ahead of a thin-skinned Jura-type fold belt,not as a retro-arc or orogenic foreland basin as it isgenerally modelled. The absence of a thick crustal rootbeneath the CFB front substantiates this interpretationfurther.
The Mesoproterozoic tectonic model presentedsuggests that NNMB formation is related to arcaccretions at a subduction zone dipping to the south,followed by continental collision outboard of thepresent continental margin of southernmost Africa. This is supported by the general conclusion that the crust of the Namaqua-Natal Metamorphic Belt
likely continues below the Cape Fold Belt front,probably extending as far south as the continentalmargin of Africa up to the Agulhas-Falkland FractureZone.
Two regions of complex reflectivity in the mid-crust,at 7 to 15 km depth, coincide with the maximum axes ofthe Beattie Magnetic Anomaly (BMA) seen in theaeromagnetic data. These two regions lie within the NMMB high grade gneisses of the mid-crust and areinterpreted to represent the two-part BMA source. The high conductivity anomalies in the magnetotelluricdata correspond spatially to the two zones of higherreflectivity identified in the IyA-200501 seismic data, butappear to transect seismic reflectors and may in partrepresent a late metasomatic overprint. It seems likelythat the BMA source is related to conductive ore-bearingminerals. Such an interpretation would imply at least a 7 km thick by 10 km wide massive sulphide-magnetiteore deposit possibly with disseminated margins, belowthe maximum axes of the BMA imaged in theaeromagnetic data. This interpretation seems plausible,since the NNMB is known for extensive stratiform ore-bodies. It may also be that these complex seismiccharacteristics reflect duplication of the deposits throughthrust stacking and subsequent metasomatic modification.
Direct comparison of seismic reflection profiles IyA-200501 and AG 32–33 across similar and coeval terranesof the NNMB- and Grenville Province respectively, is consistent with the most recent Rodiniareconstructions.
AcknowledgementsFunding for the NVR seismic data acquisition wasprovided by the Helmholtz German Research Centre forGeosciences (GFZ), the Western Cape Unit of theCouncil for Geoscience (CGS), and the South AfricanNational Research Foundation (NRF) in Inkaba yeAfricaphase 1. The geophysical instruments were provided bythe Geophysical Instrument Pool Potsdam at the GFZ. We thank the Petroleum Agency of South Africa foraccess to archive materials, and Dr. G. Bada from TXMHU Oil and Gas Exploration Company, for access to thepaper-to-SEGY converted records and fruitfuldiscussions. Constructive and detailed reviews by R. Clowes and P. Booth improved the MS significantly.Constructive disagreements with reviewer K. Burkehelped us to sharpen our interpretations. We especiallythank R. Clowes, L. Brown, P. Tapponier, G. Uenzelmann-Neben and K. Gohl for their generousinputs at various stages of interpreting of the geologyand seismic sections. E. Sweet and C. Bremer arethanked for their editoral support. This is InkabayeAfrica contribution 41 and AEON contribution 96.
ReferencesAlbat, H.M., 1984. The Proterozoic Granulite Facies Terrane around Kliprand,
Namaqualand Metamorphic Complex. Precambrian Research Unit
Bulletin, 33, University of Cape Town, South Africa, 382pp.
Backeberg, N.R., Reid, D.L., Trumbull, R.B. and Romer, R.L., 2011,
Petrogenesis of the False Bay Dyke Swarm, Cape Peninsula. Evidence for

basement assimilation. South African Journal of Geology, 114, 335–352.
doi:10.2113/gssajg.114.3-4.335
Bailie, R.H. and Reid, D.L., 2005. Ore textures and possible sulphide partial
melting at Broken Hill, Aggeneys, South Africa I: Petrography. South
African Journal of Geology, 108, 51–70.
Bailie, R.H., Armstrong, R. and Reid, D.L., 2007. The Bushmanland Group
supracrustal succession, Aggeneys, Bushmanland, South Africa:
Provenance, age of deposition and metamorphism. South African Journal
of Geology, 110, 59–86.
Barnett, W., Armstrong, R. and de Wit, M.J., 1997. Stratigraphy of the upper
Neoproterozoic Kango and lower Palaeozoic Table Mountain Groups of
the Cape Fold Belt, revisited. South African Journal of Geology, 100,
237–250.
Basson, I.J. and Watkeys, M.K., 2003. Tectonic implications from the
geochemistry of Mfongosi Group metasediments, Natal Metamorphic
Province. South African Journal of Geology, 106, 265–280.
Beattie, J.C., 1909. Report of a magnetic survey of South Africa. Royal Society
of London Publication, Cambridge University Press, United Kingdom.
Branch, T., Ritter, O., Weckmann, U., Sachsenhofer, R.F. and Schilling, F.,
2007. The Whitehill Formation – a high conductivity marker horizon in the
Karoo Basin. South African Journal of Geology, 110, 465–476.
Bräuer, B., Ryberg, T. and Lindeque, A., 2007. Shallow seismic velocity
structure of the Karoo Basin, South Africa. South African Journal of
Geology, 110, 439–448.
Burke, K., Dewey, J.F. and Kidd, W.S.F., 1977. World distribution of sutures
– the sites of former oceans. Tectonophysics, 40, 69–99.
Carr, S.D., Easton, R.M., Jamieson, R.A. and Culshaw, N.G., 2000. Geologic
transect across the Grenville orogen of Ontario and New York. Canadian
Journal of Earth Science, 37, 193–216.
Catuneanu, O., Hancox, P.J. and Rubidge, B.S., 1998. Reciprocal flexural
behaviour and contrasting stratigraphies: a new basin development model
for the Karoo retro-arc foreland system, South Africa. Basin Research, 10,
417–439.
Catuneanu, O., Hancox, P.J., Cairncross, B. and Rubidge, B.S., 2002.
Foredeep submarine fans and forebulge deltas: orogenic off-loading in the
underfilled Karoo Basin. Journal of African Earth Sciences, 35, 489–502.
CGS, 1979a. Regional Geology 1:250 000, map sheet 3222, Beaufort West.
Compiled by: Marsh, A., Leaman, D.W., Johnson, M.R., from mapping by
Whittingham, J.K., Leaman, D.W., Caston, D.L., Karpeta, W.P., Dales, D.H.,
Rossouw, P.J., Gilbert, C., Johnson, M.R., Walmesley, W.D., Lindsay, R.G.,
Marsh, A. and De Villiers, J. Map out of print. Explanation by Johnson,
M.R. and Keyser, A.W., 1979. Council for Geoscience CGS, Pretoria, South
Africa. 14pp.
CGS, 1979b. Regional Geology 1:250 000, map sheet 3322, Oudtshoorn.
Compiled by: Toerien, D.K. and Roby, D.J. from 1:125 000 sheet
Gamkapoort – Prince Albert, 1:148 752 sheet Mossel Bay, and from
mapping by Rossouw, P.J. and Blignaut, J.J.G., 1939–40; Haughton, S.H.
and Frommurze, H.F., 1930–34; Du Plessis, P.G., 1944–47; Marlow, A.G.,
1973–74; Potgieter, C.T., 1946–47; Krynauw, J.R., 1975; Gresse, P.G., 1974.
Revised in part by Toerien, D.K., 1973–77. Explanation by Toerien, D.K.,
1979. Council for Geoscience CGS, Pretoria, South Africa. 13pp.
CGS, 1983. Regional Geology 1:250 000, map sheet 3220, Sutherland.
Compiled by: Wickens, H.deV., Dunlevey, J.N., Whittingham, J.K.,
Stewart, D.N., Rosewarne, P.N., Badings, M.F., De Wet, J.J., Hiller, N.,
1975–78. Revised by Wickens, H.deV. and Johnson, M.R., 1977–78.
Biostratigraphic information by Keyser, A.W. Stratigraphic borehole
localities. Map out of print Explanation by Theron, J.N. 1983. Council for
Geoscience CGS, Pretoria, South Africa. 18pp., 6pl.
CGS, 1992. Regional Geology 1:250 000, map sheet 3320, Ladismith.
Compiled by: Theron, J.N. from mapping by Wickens, H.deV.,
Whittingham, J.K., Theron, J.N., Hiller, N., Dunlevy, J.N., Siegfried, H.P.,
Le Roux, P.M., Grey, P.R, Gresse, P.G., Toerien, D.K., carried out from
1974–1981. Explanation by Theron, J.N., Wickens, H. de V. and Gresse,
P.G. 1991. Council for Geoscience CGS, Pretoria, South Africa. 99pp.
CGS, 2000 Regional Aeromagnetic data, 1:1 000 000 Total Magnetic Intensity
Map of the Republic of South Africa. Compiled by: Stettler, E.H., Fourie,
C.J.S., Cole, P. Council for Geoscience CGS, Pretoria, South Africa.
Chevallier, L., Cole, D., de Beer, C., Gibson, L., Macey, P., Nhleko, L.,
Oosthuizen, B., Siegfried, P., Viljoen, J., Goedhart, M., Majokweni, L. and
Rohwer, M., 2004. Geological cross sections across the Table Mountain
Group for Water Research Commission project no K5/1419/1. Internal
Report No. 2004–0119. Council for Geoscience, Pretoria, South Africa,
17pp.
Cloetingh, S., de Wit, M.J., Lankreijer, A. and Martinez, I., 1992. Subsidence
history analysis and forward modelling of the Cape- and Karoo
Supergroups. In: M.J. de Wit and I.G.D. Ransome (Editors). Inversion
Tectonics of the Cape Fold Belt, Karoo and Cretaceous Basins of Southern
Africa. Balkema, Rotterdam, the Netherlands, 239–248.
Clowes, R.M., Calvert, A.J., Eaton, D.W., Hajnal, Z., Hall, J. and Ross, G.M.,
1996. LITHOPROBE reflection studies of Archean and Proterozoic crust in
Canada. Tectonophysics, 264, 65–88.
Cole, D.I. and McLachlan, I.R., 1994. Oil Shale Potential and Depositional
Environment of the Whitehill Formation in the Main Karoo Basin. Internal
Report No. 1994–0213, Council for Geoscience, Pretoria, South Africa,
146pp.
Colliston, W.P. and Schoch, A.E., 2002. The structural development of the
Aggeneys Hills, Namaqua Metamorphic Complex. South African Journal of
Geology, 105, 301–324.
Colliston, W.P. and Schoch, A.E., 2003. A mid-Proterozoic Volcano-
Sedimentary sequence in the Aggeneys hills Duplex, Namaqua
Metamorphic Complex. South African Journal of Geology,
106, 343–360.
Cook, F.A., Clowes, R.M., Snyder, D.B., Van der Velden, A.J., Hall, K.,
Erdmer, P. and Evenchick, C.A., 2004. Precambrian crust and lithosphere
beneath the Mesozoic Northern Canadian Cordillera discovered by
LITHOPROBE seismic reflection profiling. Tectonics, 23, TC2010,
doi:10.1029/2002TC001412.
Cook, F.A., Hall, K.W. and Lynn, C.E., 2005. The edge of northwestern North
America at 1.8 Ga. Canadian Journal of Earth Science, 42, 983–997.
Cornell, D.H. and Pettersson, A., 2007. Ion probe dating of the Achab Gneiss,
a young basement to the Central Bushmanland Ore District? Journal of
African Earth Sciences, 47, 112–116.
Cornell, D.H., Humphreys, H., Theart, H.F.J. and Scheepers, D. J., 1992.
A collision-related pressure temperature-time path for Prieska copper
mine, Namaqua-Natal tectonic province, South Africa. Precambrian
Research, 59, 43–71.
Cornell, D.H., Thomas, R.J., Moen, H.F.G., Reid, D.L., Moore, J.M. and
Gibson, R.L., 2006. The Namaqua-Natal Province In: M. R. Johnson, C.R.
Anhaeusser and R. J. Thomas (Editors). The Geology of South Africa.
Geological Society of South Africa/Council for Geoscience, 325–379.
Corner, B., 1989. The Beattie anomaly and its significance for crustal
evolution within the Gondwana framework. Extended Abstracts, South
African Geophysical Association, First Technical Meeting, 15–17.
De Beer, J.H. and Meyer, R., 1983. Geo-electrical and gravitational
characteristics of the Namaqua-Natal Mobile Belt and its boundaries.
Special Publication Geology Society of South Africa, 10, 91–100.
De Beer, J.H. and Meyer, R., 1984. Geophysical characteristics of the
Namaqua-Natal Mobile Belt and its boundaries, South Africa. Journal of
Geodynamics, 1, 473–494.
De Beer, J., van Zijl, J. and Gough, D., 1982. The Southern Cape Conductive
Belt South Africa: Its Composition, Origin and Tectonic Significance.
Tectonophysics, 83, 205–225.
De Wit, M.J. and Ransome, I.D.G., 1992 (Editors). Inversion tectonics of the
Cape Fold Belt, Karoo and Karoo and Cretaceous basins of Southern
Africa, Balkema, Rotterdam, Netherlands, ISBN 9054100478.
De Wit, M.J. and Horsfield, B., 2006. Inkaba ye Africa Project Surveys Sector
of Earth from Core to Space. EOS, American Geophysical Union,
87, 113–117.
De Wit, M.J., Jeffery, M., Bergh, H. and Nicolaysen, L., 1988. Geological map
of sectors of Gondwana reconstructed to their disposition 150 Ma ago.
Scale 1:10 000 000. Lambert equal area projection. American Association
of Petroleum Geologists, Tulsa, Oklahoma.
Du Plessis, A.J. and Thomas, R.J., 1991. Discussion on the Beattie set of
magnetic anomalies. Extended Abstract, 2nd Annual Technical Meeting
of the South African Geophysical Association, Pretoria, 57–59.
Eaton, D.W., 2005. Multi-genetic origin of the continental Moho: insights
from LITHOPROBE. Terra Nova, 18, 1, 34–43.
Eglington, B.M., 2006. Evolution of the Namaqua-Natal Belt, southern Africa
– A geochronological and isotope geochemical review. Journal of African
Earth Sciences, 46, 93–111.
Eglington, B.M. and Armstrong, R.A., 2003. Geochronological and isotopic
constraints on the Mesoproterozoic Namaqua-Natal Belt: evidence from
SOUTH AFRICAN JOURNAL OF GEOLOGY
DEEP CRUSTAL PROFILE, SOUTHERN KAROO BASIN AND BEATTIE MAGNETIC ANOMALY290

A. LINDEQUE, M.J . DE WIT, T. RYBERG, M. WEBER AND L. CHEVALLIER
SOUTH AFRICAN JOURNAL OF GEOLOGY
291
deep borehole intersection in South Africa. Precambrian Research,
125, 179–189.
Eglington, B.M., De Beer, J.H., Pitts, B.E., Meyer, R., Geerthsen, K. and
Maher, M.J., 1993. Geological, geophysical and isotopic constraints on the
nature of the Mesoproterozoic Namaqua-Natal Belt of southern Africa.
In: J.W. Peters, G.O. Kesse, and P.C. Acquah (Editors). Proceedings of the
9th International Geological Conference of the Geological Society of
Africa. Geological Society of Africa, Accra, 114–135.
Evenchick C.A., Gabrielse, H. and Snyder, D., 2005. Crustal structure and
lithology of the northern Canadian Cordillera: alternative interpretations of
SNORCLE seismic lines 2a and 2b. Canadian Journal of Earth Science,
42, 1149–1161.
Fildani, A., Weislogel, A., Drinkwater, N.J., McHargue, T., Tankard, A.,
Wooden, J., Hodgson, D. and Flint, S., 2009. U-Pb zircon ages from the
southwestern Karoo Basin, South Africa – Implications for the Permian-
Triassic boundary. Geology, 37, 719–722. doi: 10.1130/G25685A.1
Gibson, R.L., Robb, L.J., Kisters, A.F.M. and Cawthorn, R.G., 1996. Regional
setting and geological evolution of the Okiep Copper District,
Namaqualand, South Africa. South African Journal of Geology,
99, 107–120.
Grantham, G.H., Storey, B.C., Thomas, R.J. and Jacobs, J., 1997. The pre-
breakup position of Haag nunataks within Gondwana: Possible
correlatives of Natal and Dronning Maud Land. In: C.A. Ricci, (Editor)
The Antarctic Region: Geological Evolution and Processes. Proceedings of
the VII International Symposium on Antarctic Sciences (ISAES), Siena,
13–20.
Green, R.W.E. and Durrheim, R.J., 1990. A seismic refraction investigation
of the Namaqualand Metamorphic Complex, South Africa. Journal of
Geophysical Research, 95, 19927–19932.
Hälbich, I.W., 1983a. A tectogenesis of the Cape Fold Belt CFB. 165–175.
Geological Society of South Africa, Special Publication, 12, 184pp.
Hälbich, I.W., 1983b. A geodynamic model for the Cape Fold Belt CFB.
177–184. Geological Society of South Africa, Special Publication,
12, 184pp.
Hälbich, I.W., 1983c. Geodynamics of the Cape Fold Belt in the Republic of
South Africa, a summary. 21–29. In: N. Rast, N. and Delany, F.M. (Editors).
Profiles of Orogenic Belts. Geodynamics Series, American Geophysical
Union/Geological Society of America, 10, 310pp.
Hälbich, I.W., 1993. (Compiler) Global Geoscience Transect 9. The Cape
Fold Belt - Agulhas Bank transect across Gondwana Suture, Southern
Africa. American Geophysical Union Special Publication, 202, 18pp.
Hartnady, C.J.H., Joubert, P. and Stowe, C.W., 1985. Proterozoic Crustal
evolution in Southwestern Africa. Episodes, 8, 236–244.
Harvey, J.D., de Wit, M.J., Stankiewicz, J. and Doucoure, C.M., 2001.
Structural variations of the crust in the southwestern Cape, deducted from
seismic receiver functions. South African Journal of Geology,
104, 231–242.
Hirsch, K.K., Bauer, K. and Scheck-Wenderoth, M., 2008. Deep structure of
the western South African passive margin – Results of a combined
approach of seismic, gravity and isostatic investigations. Tectonophysics,
doi:10.1016/j.tecto.2008.04.028.
Jacobs, J., Falter, M., Weber, K. and Jessberger, E.K., 1997. 40Ar-39Ar
evidence for the structural evolution of the Heimefront Shear Zone
Western Dronning Maud Land, East Antarctica. In: Ricci, C.A. (Editor)
The Antarctic Region: Geological Evolution and Processes. Proceedings of
the VII International Symposium on Antarctic Sciences (ISAES), Siena,
37–44.
Johnson, M.R., van Vuuren, C.J., Hegenberger, W.F., Key, R. and Shoko, U.,
1996. Stratigraphy of the Karoo Supergroup in southern Africa: an
overview. Journal of African Earth Sciences, 23, 3–15.
Johnson, M.R., van Vuuren, C.J., Visser, J.N.J., Cole, D.I., Wickens, H.deV.,
Christie, A.D.M., Roberts, D.L. and Brandl, G., 2006. Sedimentary Rocks of
the Karoo Supergroup. In: M.R. Johnson, C.R. Anhaeusser and R.J.
Thomas (Editors). The Geology of South Africa. Geological Society of
South Africa/Council for Geoscience, 461–499.
Joubert, P., 1971. The Regional Tectonism of the Gneisses of Part of
Namaqualand. Precambrian Research Unit Bulletin, 10, University of Cape
Town, South Africa, 220pp.
Joubert, P., 1986a. The Namaqualand Metamorphic Complex - A summary.
1395–1420. In: Anhaeusser, C.R., and Maske, S., (Editors). Mineral
Deposits of Southern Africa, Geological Society of South Africa, 2, 2376pp.
Joubert, P., 1986b. Namaqualand - A model of Proterozoic Accretion?
Transactions of the Geological Society of South Africa, 89, 79–96.
Knütter, R.C.K., 1994. Geologische Kartierung in der Umgebung von
Laingsburg. Diplomarbeit. Universität Bonn, Germany, 93pp.
Li, Z.X., Bogdanova, S.V., Collins, A.S., Davidson, A., De Waele, B., Ernst,
R.E., Fitzsimons, I.C.W., Fuck, R.A., Gladkochub, D.P., Jacobs, J.,
Karlstrom, K.E., Lu, S., Natapov, L. M., Pease, V., Pisarevsky, S.A.,
Thrane, K. and Vernikovsky, V., 2008. Assembly, configuration, and break-
up history of Rodinia: A synthesis. Precambrian Research, 160, 179–210.
Lindeque, A., Ryberg, T., Weber, M. and de Wit, M.J., 2006. Understanding
the Beattie Magnetic Anomaly, Karoo Basin and Deep Crustal Tectonics of
Southernmost Africa: Near Vertical Seismic Reflection Data of the Inkaba
yeAfrica Onshore-Offshore Agulhas-Karoo Geoscience Transect. American
Geophysical Union, EOS Transactions, 87, 52.
Lindeque, A., Ryberg, T., Stankiewicz, J., Weber, M. and de Wit, M.J., 2007.
Deep crustal seismic reflection experiment across the southern Karoo
Basin, South Africa. South African Journal of Geology, 110, 419–438.
Lock, B.E., 1980. Flat-plate subduction and the Cape Fold Belt of South
Africa. Geology, 8, 35–39.
Ludden, J. and Hynes, A., 2000. The Abitibi-Grenville Lithoprobe transect:
two billion years of crust formation and recycling in the Precambrian
shield of Canada. Canadian Journal of Earth Science, 37, 459–476.
Macey, P.H., 2000. The geology of the Kliprand Area, SE Namaqualand. Sheet
3018DA Kliprand. Council for Geoscience, South Africa, internal report,
unpublished, 57pp.
Macey, P.H., 2001. The geology of the region between Garies and Kliprand,
southern Namaqualand. 1:50 000 sheets 3018 CA Buffelsfontein, 3018 CB
Suurdam, 3018 DA Kliprand and 3018 DB Oubees. Council for
Geoscience, South Africa, internal report, unpublished. 123pp.
Macey, P.H., Minaar, H., Botha, P.M.W., Siegfried, P. and Almond, J., 2011.
The Geology of the Loeriesfontein area: Explanation to 1:250 000
mapsheets: 3018 Loeriesfontein, 2917 Springbok, 2918 Pofadder. Council
for Geoscience, Pretoria, South Africa. 118pp.
Mahanyele, P.J. Bauer, K. Franke, D. Schulze, A. Ryberg, T. De Beer, C.H.
Neben, S. Schreckenberger, B. and Stettler, E.H., 2004. How far to the
south does the volcanic margin of Southwest Africa extend? An initial
velocity model for the ocean-continent transition in the southern Cape
Basin. Poster at 64.Jahrestagung der Deutschen Geophysikalischen
Gesellschaft, Berlin, Germany.
Martignole, J., Calvert, A.J., Friedman, R. and Reynolds, P., 2000. Crustal
evolution along a seismic section across the Grenville Province western
Quebec. Canadian Journal of Earth Science, 37, 291–306.
Mereu, R.F., 2000. The complexity of the crust and Moho under the
southeastern Superior and Grenville provinces of the Canadian Shield
from seismic refraction-wide-angle refraction data. Canadian Journal of
Earth Science, 37, 439–458.
Milani, E.J. and de Wit, M.J., 2008. Correlations between the classic Paraná
and Cape-Karoo sequences of South America and southern Africa and
their basin infills flanking the Gondwanides: Du Toit revisited.
In: R.J. Pankhurst, R.A.J. Trouw, B. Brito Neves and M.J. de Wit, (Editors).
West Gondwana: Pre-Cenozoic Correlations Across the South Atlantic –
The Ties That Bind. The Geological Society, London, Special Publication.
294, 319-342. doi: 10.1144/SP294.17 0305-8719/08
Moore, J.M., Davidson, A. and Baer, A.J., 1986. The Grenville Province.
Geological Association of Canada, Special Publication, 31, 358pp.
Naicker, I., 1993. Geographic Information System GIS integration of
geological, geochemical and geophysical data from the Aggeneys base
metal province, South Africa. Unpublished MSc thesis, University of Cape
Town, South Africa, 98pp.
Oueity, J. and Clowes, R., 2010 Nature of the Moho transition in NW Canada
from combined near-vertical and wide-angle seismic reflection studies.
Lithosphere, 2, 5, 377–396.
Parsiegla, N., Gohl, K. and Uenzelmann-Neben, G., 2007. Deep crustal
structure of the sheared South African continental margin: first results
of the Agulhas-Karoo Geoscience Transect. South African Journal of
Geology, 110, 393–406.
Parsiegla, N., Stankiewicz, J., Gohl, K., Ryberg, T. and Uenzelmann-Neben,
G., 2009. Southern African continental margin: Dynamic processes of a
transform margin. Geochemistry, Geophysics, Geosystems, 10, Q03007,
doi:10.1029/2008GC002196.
PASA, 1966. Borehole log, well summary and completion report of SA-1/66.
Scanned paper records. Petroleum Agency of South Africa, Cape Town.
47pp.
PASA, 1967a. Seismic lines Klaarstroom KL-12 and West-Karoo WK-01 paper
prints of processed seismic data, two-way-time TWT migrated sections.
Petroleum Agency of South Africa, Cape Town, 3 sheets.
PASA, 1967b. Borehole log, well summary and completion report of
KW-1/67. Scanned paper records. Petroleum Agency of South Africa, Cape
Town, 55pp, 3 sheets.
Pettersson, A., Cornell, D.H., Moen, H.F.G., Reddy, S. and Evans, D., 2007.
Ion-probe dating of 1.2 Ga collision and crustal architecture in the
Namaqua-Natal Province of southern Africa. Precambrian Research,
158, 79–92.
Pitts, B.E., Maher, M.J., de Beer, J.H. and Gough, D.I., 1992. Interpretation of
magnetic, gravity and magnetotelluric data across the Cape Fold Belt and
Karoo Basin. In: M.J. De Wit and I.D.G. Ransome (Editors). Inversion
tectonics of the Cape Fold Belt, Karoo and Karoo and Cretaceous basins
of Southern Africa. Balkema, Rotterdam, Netherlands, 27–32.
Quesnel, Y., Weckmann, U., Ritter, O., Stankiewicz, J., Lesur, V., Mandea, M.,
Langlais, B., Sotin, C. and Galdeano, A., 2009. Simple models for the
Beattie Magnetic Anomaly in South Africa. Tectonophysics, 478, 111–118,
doi: 10.1016/j.tecto.2008.11.027.
Raith, J.G., Cornell, D.H., Frimmel, H.E.F. and de Beer, C.H., 2003. New
insights into the geology of the Namaqua Tectonic Province, South Africa,
from ion probe dating of detrital and metamorphic zircon. Journal of
Geology, 111, 347–366.
Ramos, V.A. 1988. Tectonics of the late Proterozoic–early Paleozoic: a
collisional history of Southern South America, Episodes, 11, 168–174.
Ramos, V.A. 2008. Patagonia: A Paleozoic continent adrift? Journal of South
American Earth Sciences, 26, 3, 235–251.
Reid, D.L., Smith, C.B., Watkeys, M.K.., Welke, H.J. and Betton, P.J., 1997.
Whole-rock radiometric age patterns in the Aggeneys-Gamsberg ore
district, central Bushmanland, South Africa. South African Journal of
Geology, 100, 11–22.
Robb, L.J., Armstrong, R.A. and Waters, D.J., 1999. The history of granulite-
facies metamorphism and crustal growth from single zircon U-Pb
geochronology: Namaqualand, South Africa. Journal of Petrology,
40, 12, 1747–1770.
Rowsell, D.M. and de Swart, A.M.J., 1976. Diagenesis in Cape and Karoo
sediments, South Africa and its bearing on hydrocarbon potential.
Transactions of the Geological Society of South Africa, 79, 1, 81–145.
Ryan, P.J., Lawrence, A.L., Lipson, R.D., Moore, J.M., Paterson, A., Stedman,
D.P. and Van Zyl, D., 1986. The Aggeneys base metal sulphide deposits,
Namaqualand district. In: C.R. Anhaeusser and S. Maske (Editors). Mineral
Deposits of Southern Africa. Geological Society of South Africa,
1447–1474.
SACS, 1980. Stratigraphy of South Africa, Handbook 8. Geological Survey of
South Africa. 690pp.
Sangster, A.L., Gauthier, M. and Gower, C.F., 1992. Metalogeny of structural
zones, Grenville Province, northeastern North America. Precambrian
Research, 58, 401–426.
Shone, R.W. and Booth, P.W.K., 2005. The Cape Basin, South Africa:
A review. Journal of African Earth Sciences, 43, 196–210.
Söhnge, A.P.G. and Hälbich, I.W. (Editors), 1983. Geodynamics of the Cape
Fold Belt. Special Publication of the Geological Society of South Africa,
12, 184pp.
Stalder, M. and Rozendaal, A., 2005. Distribution and geochemical
characteristics of barite and barium-rich rocks associated with the Broken
Hill-type Gamsberg Zn-Pb deposit, Namaqua Province, South Africa.
South African Journal of Geology, 108, 33–50.
Stankiewicz, J., Parsiegla, N., Ryberg, T., Gohl, K., Weckmann U., Trumbull,
R. and Weber, M., 2008. Crustal structure of the southern margin of the
African continent: Results from geophysical experiments. Journal of
Geophysical Research, 113, B10313, doi:10.1029/2008JB005612.
Stankiewicz, J., Ryberg, T., Schulze, A., Lindeque, A., Weber, M.H. and de
Wit, M.J., 2007. Initial Results from Wide-Angle Seismic Refraction Lines in
the Southern Cape. South African Journal of Geology, 110, 407–418.
Storey, B.C.; Curtis, M.L.; Ferris, J.K.; Hunter, M.A. and Livermore, R.A., 1999.
Reconstruction and break-out model for the Falkland Islands within
Gondwana. Journal of African Earth Science, 29, 153–l63.
Stowe, C.W., 1980. Preliminary report on geodynamics in the Upington
Geotraverse. Annual Report Precambrian Research Unit, University of
Cape Town, South Africa, 17, 24–48.
Stowe, C.W., 1986. Synthesis and interpretation of structures along the north-
eastern trending boundary of the Namaqua tectonic province, South
Africa. Transactions of the Geological Society of South Africa, 89, 182–198.
Tankard, A., Welsink, H., Aukes, P., Newton, R. and Stettler, E.,
2009. Tectonic evolution of the Cape and Karoo basins of
South Africa. Marine and Petroleum Geology, 26, 1379–1412.
doi:10.1016/j.marpetgeo.2009.01.022.
Thistlewood, L., Leat, P.T., Millar, I.L., Storey, B.C. and Vaughan, A.P.M., 1997.
Basement geology and Palaeozoic-Mesozoic mafic dykes from the Cape
Meredith Complex, Falkland Islands: a record of repeated intracontinental
extension. Geological Magazine, 134, 3, 355–367.
Thomas, R.J., Agenbacht, A.L.D., Cornell, D.H. and Moore, J.M., 1994.
The Kibaran of southern Africa: Tectonic evolution and metallogeny. Ore
Geology Reviews, 9, 131–160.
Thomas, R.J., De Beer, C.H., and Bowring, S.A., 1996. A comparative study
of the Mesoproterozoic late orogenic porphyritic granitoids of Southwest
Namaqualand and Natal, South Africa. Journal of African Earth Sciences,
23, 485–508.
Thomas, R.J., Jacobs, J. and Weber, K., 1997. Geology of the Mesoproterozoic
Cape Meredith Complex, West Falkland. In: Ricci, C.A. (Editor) The
Antarctic Region: Geological Evolution and Processes. Proceedings of the
VII International Symposium on Antarctic Sciences (ISAES), Siena, 21–30.
Thomas, R.J., von Veh, M.W. and McCourt, S., 1993. The tectonic evolution
of southern Africa: an overview. Journal of African Earth Sciences,
16, 1/2, 5–24.
Turner, B., 1999. Tectonostratigraphical development of the Upper Karoo
foreland basin: orogenic unloading versus thermally-induced Gondwana
rifting. Journal of African Earth Sciences, 28, 215–238.
Veevers, J.J., Cole, D.I. and Cowan, E.J., 1994. Southern Africa: Karoo Basin
and Cape Fold Belt. In: J.J. Veevers and C. McA. Powell (Editors).
Permian-Triassic Pangean Basins and Foldbelts along the Pathalassan
Margin of Gondwanaland. Boulder Colorado, Geological Society of
America Memoir, 184, 223–279.
Weckmann, U., Ritter, O., Jung, A., Branch, T. and de Wit, M.J., 2007a.
Magnetotelluric measurements across the Beattie magnetic anomaly and
the Southern Cape Conductive Belt, South Africa. Journal of Geophysical
Research, 112, doi:10.1029/2005JB003975.
Weckmann, U., Jung, A., Branch, T. and Ritter, O., 2007b. Comparison of
electrical conductivity structures and 2D magnetic modelling along two
profiles crossing the Beattie Magnetic Anomaly, South Africa. South
African Journal of Geology, 110, 449–464.
Weckmann, U., Ritter, O., Chen, X., Tietze, K. and de Wit, M.J., in press.
Magnetotelluric image across the Cape Fold Belt, South Africa. Terra
Nova.
Wever, T. and Sadowiak, P., 1991. Crustal Suture Zones: Seismic Signature
and Structural Interpretation. In: Continental Lithosphere: Deep Seismic
Reflections. Barazangi, M. and Brown, L. (Editors). Reflection Seismology
Geodynamics series. American Geophysical Union, 22, 371–375.
White, D.J., Forsyth, D.A., Asudeh, I., Carr, S.D., Wu, H., Easton, R.M. and
Mereu, R.F., 2000. A seismic-based cross section of the Grenville Orogen
in southern Ontario and western Quebec. Canadian Journal of Earth
Science, 37, 183–192.
Wilsher, W., 1996. The distribution of selected mineral deposits across
Gondwana with geodynamic implications. Unpublished Thesis, University
of Cape Town, South Africa.
Winardi, S. and Mereu, R.F., 1997. Crustal velocity structure of the Superior
and Grenville provinces of the southeastern Canadian Shield. Canadian
Journal of Earth Science, 34, 1167–1184.
Winter, H. de la R., 1984 Tectonostratigraphy, as applied to analysis of the
South African Phanerozoic basins. Transactions of the Geological Society
of South Africa, 87, 169–179.
Winter, H. de la R. and Venter, J.J., 1970. Lithostratigraphic correlation of
recent deep boreholes in the Karoo-Cape sequence, In: S.H. Haughton
(Editor). Proceedings of the 2nd Gondwana Symposium. Council for
Scientific and Industrial Research, South Africa, 395–408.
Editorial handling: R.B. Trumbull
SOUTH AFRICAN JOURNAL OF GEOLOGY
DEEP CRUSTAL PROFILE, SOUTHERN KAROO BASIN AND BEATTIE MAGNETIC ANOMALY292


![Upper crustal evolution across the Juan de Fuca ridge flanks · 4] The first to make the correlation between the change in upper crustal seismic velocities and crustal evolution were](https://static.fdocuments.net/doc/165x107/5f07f69e7e708231d41fa413/upper-crustal-evolution-across-the-juan-de-fuca-ridge-flanks-4-the-first-to-make.jpg)