Decreased glutathione biosynthesis contributes to EGFR ... · OPEN ARTICLE Decreased glutathione...
14
OPEN ARTICLE Decreased glutathione biosynthesis contributes to EGFR T790M-driven erlotinib resistance in non-small cell lung cancer Hongde Li 1,2,9 , William Stokes 3,9 , Emily Chater 3,9 , Rajat Roy 3,9 , Elza de Bruin 4,5 , Yili Hu 2 , Zhigang Liu 2 , Egbert F Smit 6 , Guus JJE Heynen 7 , Julian Downward 4 , Michael J Seckl 3 , Yulan Wang 2,8 , Huiru Tang 1,2 , Olivier E Pardo 3 1 State Key Laboratory of Genetic Engineering, Ministry of Education Key Laboratory of Contemporary Anthropology, Colla- borative Innovation Centre for Genetics and Development, Shanghai International Centre for Molecular Phenomics, Metabo- nomics and Systems Biology Laboratory, Department of Biochemistry, School of Life Sciences, Zhongshan Hospital, Fudan University, Shanghai, China; 2 Key Laboratory of Magnetic Resonance in Biological Systems, National Centre for Magnetic Resonance in Wuhan, State Key Laboratory of Magnetic Resonance and Atomic and Molecular Physics, Wuhan Institute of Physics and Mathematics, Chinese Academy of Sciences, Wuhan, China; 3 Division of Cancer, Department of Surgery and Cancer, Imperial College, Hammersmith Hospital, London, UK; 4 Signal Transduction Laboratory, CRUK London Research Institute, London, UK; 5 Personalised Healthcare & Biomarkers, Innovative Medicines and Early Development Biotech Unit, AstraZeneca, Cambridge, UK; 6 Department of Pulmonary Diseases, VU University Medical Centre, Netherlands Cancer Institute, Amsterdam, Netherlands; 7 Section of Molecular Carcinogenesis, Netherlands Cancer Institute, Amsterdam, Netherlands; 8 Collaborative Innovation Centre for Diagnosis and Treatment of Infectious Diseases, Hangzhou, China Epidermal growth factor receptor (EGFR) inhibitors such as erlotinib are novel effective agents in the treatment of EGFR- driven lung cancer, but their clinical impact is often impaired by acquired drug resistance through the secondary T790M EGFR mutation. To overcome this problem, we analysed the metabonomic differences between two independent pairs of erlotinib-sensitive/resistant cells and discovered that glutathione (GSH) levels were significantly reduced in T790M EGFR cells. We also found that increasing GSH levels in erlotinib-resistant cells re-sensitised them, whereas reducing GSH levels in erlotinib-sensitive cells made them resistant. Decreased transcription of the GSH-synthesising enzymes (GCLC and GSS) due to the inhibition of NRF2 was responsible for low GSH levels in resistant cells that was directly linked to the T790M mutation. T790M EGFR clinical samples also showed decreased expression of these key enzymes; increasing intra-tumoural GSH levels with a small-molecule GST inhibitor re-sensitised resistant tumours to erlotinib in mice. Thus, we identified a new resistance pathway controlled by EGFR T790M and a therapeutic strategy to tackle this problem in the clinic. Keywords: metabolomics; glutathione; lung cancer; drug resistance; TKI Cell Discovery (2016) 2, 16031; doi:10.1038/celldisc.2016.31; published online 27 September 2016 Introduction Lung cancer is the main cancer killer and non-small cell lung cancer (NSCLC) represents ~ 85% of such cases. About 10% and 30% of NSCLCs in Western and Asian populations, respectively, express an activated mutant epidermal growth factor receptor (EGFRm) and the vast majority (90%) of such patients respond to ATP-competitive EGFR tyrosine kinase inhibitors (TKIs) such as gefitinib or erlotinib [1–3]. Unfortunately, most patients can quickly acquire TKI Correspondence: Michael J Seckl Tel: +442033111421; E-mail: [email protected] or Huiru Tang Tel: +86-21-51630725; E-mail: [email protected] or Olivier E Pardo Tel: +442075942814; E-mail: [email protected] 9 These authors contributed equally to this work. Received 27 April 2016; accepted 14 July 2016 Citation: Cell Discovery (2016) 2, 16031; doi:10.1038/celldisc.2016.31 www.nature.com/celldisc
Transcript of Decreased glutathione biosynthesis contributes to EGFR ... · OPEN ARTICLE Decreased glutathione...
OPEN
ARTICLE
Decreased glutathione biosynthesis contributes to EGFRT790M-driven erlotinib resistance in non-small celllung cancer
Hongde Li1,2,9, William Stokes3,9, Emily Chater3,9, Rajat Roy3,9, Elza de Bruin4,5, Yili Hu2, Zhigang Liu2,Egbert F Smit6, Guus JJE Heynen7, Julian Downward4, Michael J Seckl3, Yulan Wang2,8, Huiru Tang1,2,Olivier E Pardo3
1State Key Laboratory of Genetic Engineering, Ministry of Education Key Laboratory of Contemporary Anthropology, Colla-borative Innovation Centre for Genetics and Development, Shanghai International Centre for Molecular Phenomics, Metabo-nomics and Systems Biology Laboratory, Department of Biochemistry, School of Life Sciences, Zhongshan Hospital, FudanUniversity, Shanghai, China; 2Key Laboratory of Magnetic Resonance in Biological Systems, National Centre for MagneticResonance in Wuhan, State Key Laboratory of Magnetic Resonance and Atomic and Molecular Physics, Wuhan Institute ofPhysics and Mathematics, Chinese Academy of Sciences, Wuhan, China; 3Division of Cancer, Department of Surgery andCancer, Imperial College, Hammersmith Hospital, London, UK; 4Signal Transduction Laboratory, CRUK London ResearchInstitute, London, UK; 5Personalised Healthcare & Biomarkers, Innovative Medicines and Early Development Biotech Unit,AstraZeneca, Cambridge, UK; 6Department of Pulmonary Diseases, VU University Medical Centre, NetherlandsCancer Institute, Amsterdam, Netherlands; 7Section of Molecular Carcinogenesis, Netherlands Cancer Institute, Amsterdam,Netherlands; 8Collaborative Innovation Centre for Diagnosis and Treatment of Infectious Diseases, Hangzhou, China
Epidermal growth factor receptor (EGFR) inhibitors such as erlotinib are novel effective agents in the treatment of EGFR-driven lung cancer, but their clinical impact is often impaired by acquired drug resistance through the secondary T790MEGFR mutation. To overcome this problem, we analysed the metabonomic differences between two independent pairs oferlotinib-sensitive/resistant cells and discovered that glutathione (GSH) levels were significantly reduced in T790M EGFRcells. We also found that increasing GSH levels in erlotinib-resistant cells re-sensitised them, whereas reducing GSH levels inerlotinib-sensitive cells made them resistant. Decreased transcription of the GSH-synthesising enzymes (GCLC and GSS)due to the inhibition of NRF2 was responsible for low GSH levels in resistant cells that was directly linked to the T790Mmutation. T790M EGFR clinical samples also showed decreased expression of these key enzymes; increasing intra-tumouralGSH levels with a small-molecule GST inhibitor re-sensitised resistant tumours to erlotinib in mice. Thus, we identified a newresistance pathway controlled by EGFR T790M and a therapeutic strategy to tackle this problem in the clinic.Keywords: metabolomics; glutathione; lung cancer; drug resistance; TKICell Discovery (2016) 2, 16031; doi:10.1038/celldisc.2016.31; published online 27 September 2016
Introduction
Lung cancer is the main cancer killer and non-smallcell lung cancer (NSCLC) represents ~ 85% of suchcases. About 10% and 30% of NSCLCs in Western andAsian populations, respectively, express an activatedmutant epidermal growth factor receptor (EGFRm)and the vast majority (90%) of such patientsrespond to ATP-competitive EGFR tyrosine kinaseinhibitors (TKIs) such as gefitinib or erlotinib [1–3].Unfortunately, most patients can quickly acquire TKI
Correspondence: Michael J SecklTel: +442033111421;E-mail: [email protected] Huiru TangTel: +86-21-51630725;E-mail: [email protected] Olivier E PardoTel: +442075942814;E-mail: [email protected]
9These authors contributed equally to this work.
Received 27 April 2016; accepted 14 July 2016
Citation: Cell Discovery (2016) 2, 16031; doi:10.1038/celldisc.2016.31www.nature.com/celldisc
resistance limiting the benefits of these drugs topatients' survival.
Resistance mechanisms include Met amplification(~5% of cases) [4] and more frequently (50% of cases) anadditional T790M gatekeeper mutation within theEGFRm [5–8]. The latter enhances kinase activity byincreasing the affinity of EGFR for ATP, competing outTKI binding [9]. This led to the development of com-pounds irreversibly interacting with EGFRm/T790M,such as afatinib, 324674 andmore recently AZD9291 andCO1696 [10–12]. However, thus far clinical trials of afa-tinib failed to demonstrate improved response inEGFRm/T790M patients [13], and although initial trialswith the irreversible inhibitor AZD9291 showed greatpromises, additional resistance mechanisms to theseinhibitors have already surfaced [14].
Changes in cellular metabolism accompanytumourigenesis and classical chemoresistance [15–17].Hence, changes in metabolite concentrations canspecifically reflect the onset of therapy resistance,providing response/outcome biomarkers and noveltherapeutic strategies to reverse resistance [18, 19].Both 1H-nuclear magnetic resonance (NMR) and massspectrometry are efficient tools to investigate thesemetabolic changes [20–23].
Here we used 1H-NMR to compare the metabolicsignatures of paired NSCLC cell lines expressingEGFRm without (erlotinib sensitive) or with theadditional T790M mutation (erlotinib resistant). Weshowed that glutathione (GSH) levels were reduced inerlotinib-resistant NSCLC cells in a T790M-dependentmanner due to the decreased expression ofGSH-synthesising enzymes. Correcting this defectre-sensitised resistant cells to erlotinib in vitro andin vivo. Moreover, ethacrynic acid (EA), a glutathione-S-transferase inhibitor, reversed erlotinib resistance inT790M NSCLC cells in vitro and in vivo by increasingGSH levels. As EA is a clinically used diuretic, it couldbe repurposed to reverse T790M-mediated erlotinibresistance in NSCLC patients. Overall, our workdemonstrated the power of metabonomic screening togenerate novel research hypotheses and discoverunexplored strategies to tackle drug resistance in lungcancer treatments.
Results
1H-NMR-based metabolic profiling reveals decreasedGSH levels in erlotinib-resistant NSCLC cells
Two pairs of cell lines were employed to obtaingeneric metabonomic phenotypes for the erlotinib-sensitive and erlotinib-resistant NSCLC cells. The
first pair were the isogenically matched PC9 (erlotinibsensitive) and PC9ER (erlotinib resistant) cells bothcontaining ΔE746-A750 EGFRm with an additionalT790M (EGFRm/T790M) mutation in PC9ER cells.The second pair included the H3255 and geneticallyunrelated erlotinib-resistant H1975 cell lines sharingL858R EGFRm, but with an additional T790Mmutation in the H1975. PC9ER and H1975 cells dis-played significant resistance to erlotinib as comparedwith their sensitive counterparts (SupplementaryFigure S1A). This resistance was limited to EGFRTKIs as PC9ER and PC9 cells were equally sensitive toconventional chemotherapeutic agents (SupplementaryFigure S1B). It has been suggested that the EGFRT790M-mediated TKI resistance is due to increasedaffinity of the receptor for ATP, which displaces com-petitive inhibitors such as erlotinib [24]. However, bothPC9ER and H1975 showed significant resistance evento the irreversible EGFR inhibitor 324674 comparedwith PC9 and H3255 cells, respectively (SupplementaryFigure S1C). This clearly suggests that otherunidentified molecular mechanisms also contribute toT790M-mediated TKI resistance.
To identify these, we comprehensively analysed the1H-NMR metabonomic profiles of our erlotinib-sensitive and -resistant cells. 1H-NMR analysis of cellextracts from our cell lines identified 36 metabolites(Figure 1a) for which unambiguous assignments wereobtained using various two-dimensional NMR meth-ods (Supplementary Table S1). Statistical analysis ofthe spectral data by orthogonal projections to latentstructures discriminant analysis (OPLS-DA) showedsignificant metabonomic differences between theerlotinib-resistant and -sensitive cells (Figure 1b and c).Changes in 14 metabolites mainly involved in GSH,amino acids, nucleotides and choline metabolism(Supplementary Figure S2A–C) correlated with resis-tance in both cell line pairs (Figure 1d; SupplementaryTable S2). Noticeably, a significant drop in the intra-cellular levels of GSH accompanied erlotinib resistance(Figure 1d; Supplementary Table S2). Such GSHdecrease observed by NMR was independently con-firmed using a colorimetric assay (Figure 1e and f).This was intriguing, as drug resistance was tradition-ally associated with increased GSH levels [25, 26].Nevertheless, GSH covalently binds somechemotherapeutic drugs leading to their glutathione-S-transferase-mediated extracellular export andresistance of cancer cells to these compounds [27, 28].Hence, the increased export of this metabolite incomplex with erlotinib could account for the lowerGSH levels in these resistant cell lines. 1H-NMR
GSH metabolism and erlotinib resistance
2
Cell Discovery | www.nature.com/celldisc
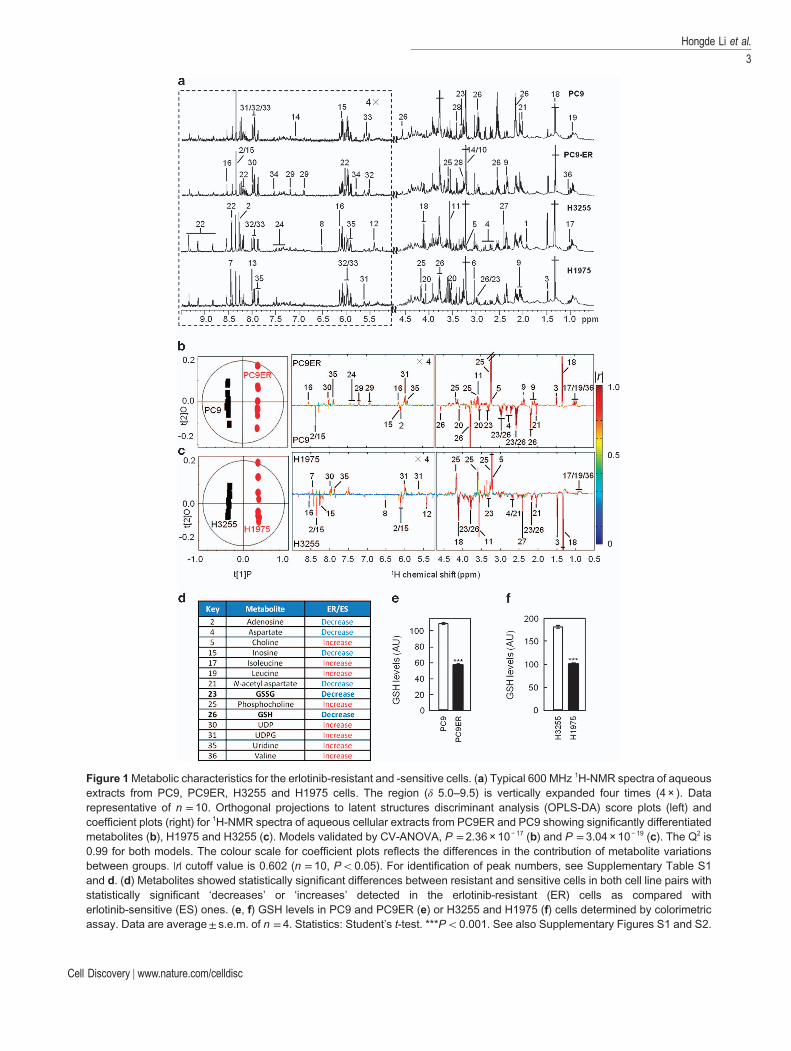
Figure 1Metabolic characteristics for the erlotinib-resistant and -sensitive cells. (a) Typical 600 MHz 1H-NMR spectra of aqueousextracts from PC9, PC9ER, H3255 and H1975 cells. The region (δ 5.0–9.5) is vertically expanded four times (4 × ). Datarepresentative of n = 10. Orthogonal projections to latent structures discriminant analysis (OPLS-DA) score plots (left) andcoefficient plots (right) for 1H-NMR spectra of aqueous cellular extracts from PC9ER and PC9 showing significantly differentiatedmetabolites (b), H1975 and H3255 (c). Models validated by CV-ANOVA, P = 2.36 × 10− 17 (b) and P = 3.04 × 10− 19 (c). The Q2 is0.99 for both models. The colour scale for coefficient plots reflects the differences in the contribution of metabolite variationsbetween groups. |r| cutoff value is 0.602 (n = 10, Po0.05). For identification of peak numbers, see Supplementary Table S1and d. (d) Metabolites showed statistically significant differences between resistant and sensitive cells in both cell line pairs withstatistically significant ‘decreases’ or ‘increases’ detected in the erlotinib-resistant (ER) cells as compared witherlotinib-sensitive (ES) ones. (e, f) GSH levels in PC9 and PC9ER (e) or H3255 and H1975 (f) cells determined by colorimetricassay. Data are average± s.e.m. of n = 4. Statistics: Student’s t-test. ***Po0.001. See also Supplementary Figures S1 and S2.
Hongde Li et al.
3
Cell Discovery | www.nature.com/celldisc
analysis of the culture medium from our four cell linesdisproved this possibility by showing no difference insecreted GSH between TKI-resistant and -sensitivecells (Supplementary Figure S2D). Hence, decreasedintracellular GSH levels in erlotinib-resistant cells arelikely due to the changes in GSH metabolism.
Erlotinib-resistant cells have lower expression ofGSH-synthesising enzymes
We investigated whether erlotinib-resistant cellsdiffered from their sensitive counterparts intheir GSH-metabolic enzymes expression pattern.Quantitative PCR analysis revealed lower messenger
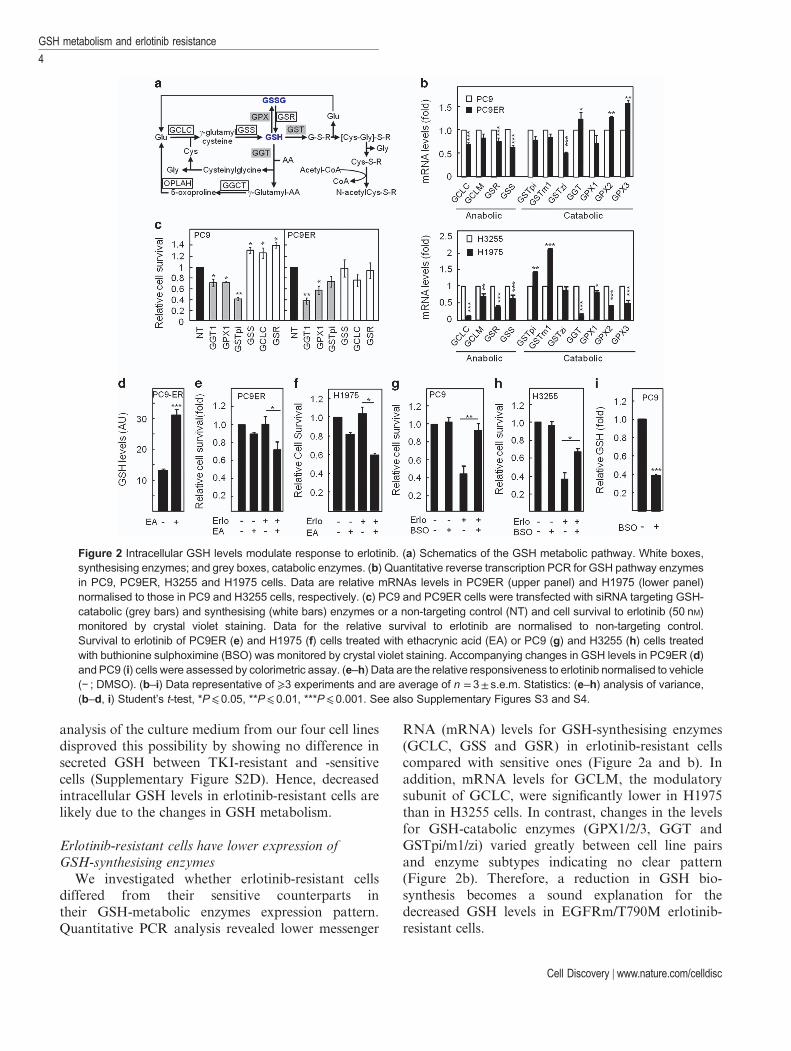
RNA (mRNA) levels for GSH-synthesising enzymes(GCLC, GSS and GSR) in erlotinib-resistant cellscompared with sensitive ones (Figure 2a and b). Inaddition, mRNA levels for GCLM, the modulatorysubunit of GCLC, were significantly lower in H1975than in H3255 cells. In contrast, changes in the levelsfor GSH-catabolic enzymes (GPX1/2/3, GGT andGSTpi/m1/zi) varied greatly between cell line pairsand enzyme subtypes indicating no clear pattern(Figure 2b). Therefore, a reduction in GSH bio-synthesis becomes a sound explanation for thedecreased GSH levels in EGFRm/T790M erlotinib-resistant cells.
Figure 2 Intracellular GSH levels modulate response to erlotinib. (a) Schematics of the GSH metabolic pathway. White boxes,synthesising enzymes; and grey boxes, catabolic enzymes. (b) Quantitative reverse transcription PCR for GSH pathway enzymesin PC9, PC9ER, H3255 and H1975 cells. Data are relative mRNAs levels in PC9ER (upper panel) and H1975 (lower panel)normalised to those in PC9 and H3255 cells, respectively. (c) PC9 and PC9ER cells were transfected with siRNA targeting GSH-catabolic (grey bars) and synthesising (white bars) enzymes or a non-targeting control (NT) and cell survival to erlotinib (50 nM)monitored by crystal violet staining. Data for the relative survival to erlotinib are normalised to non-targeting control.Survival to erlotinib of PC9ER (e) and H1975 (f) cells treated with ethacrynic acid (EA) or PC9 (g) and H3255 (h) cells treatedwith buthionine sulphoximine (BSO) was monitored by crystal violet staining. Accompanying changes in GSH levels in PC9ER (d)and PC9 (i) cells were assessed by colorimetric assay. (e–h) Data are the relative responsiveness to erlotinib normalised to vehicle(− ; DMSO). (b–i) Data representative of ⩾3 experiments and are average of n =3± s.e.m. Statistics: (e–h) analysis of variance,(b–d, i) Student’s t-test, *P⩽0.05, **P⩽0.01, ***P⩽0.001. See also Supplementary Figures S3 and S4.
GSH metabolism and erlotinib resistance
4
Cell Discovery | www.nature.com/celldisc
Targeting GSH metabolism modulates the cellularresponse to erlotinib
NMR results suggested that lower GSH levelsassociated with erlotinib resistance. To strengthen thislink, we employed small interfering RNAs (siRNAs)for GSH-metabolic enzymes to modulate GSH levelsin our cell lines. Silencing of GSH-catabolic enzymes(GGT1, GPX1 and GSTpi) increased the response
to erlotinib in both the EGFRm PC9 andEGFRm/T790M PC9ER and H1975 cells (Figure 2c;Supplementary Figure S3C). This correlated withefficient targets’ downregulation and a correspondingincrease in GSH levels (Supplementary Figure S3A andB). Conversely, silencing GSH-synthesising enzymes(GCLC, GSS and GSR) lowered cellular GSH levels(Supplementary Figure S3A and B) and rendered thesensitive PC9 cells erlotinib-resistant (Figure 2c).
To validate our siRNA data, we used small-molecule inhibitors targeting the activity of GSHpathway enzymes. Treatment with EA, a known GSTinhibitor, increased GSH levels in erlotinib-resistantcells (Figure 2d) causing re-sensitisation of PC9ER andH1975 cells to erlotinib (Figure 2e and f). Similarly,GPXs inhibition using mercaptosuccinate increasedintracellular GSH levels (Supplementary Figure S3D)and the response of H1975 cells to erlotinib(Supplementary Figure S3E). Conversely, GCLCinhibition using buthionine sulphoximine in sensitivecells made them erlotinib resistant (Figure 2g and h),an effect associated with decreased GSH levels(Figure 2i). Furthermore, EA was also able to sensitisePC9ER cells to gefitinib by increasing intracellularGSH (Supplementary Figure S4A–C). Taken together,these data suggest that manipulating GSH levelscontrols the responsiveness of our cell lines to erlotinib.
The NRF2 pathway controls GSH synthesis andresponsiveness to erlotinib
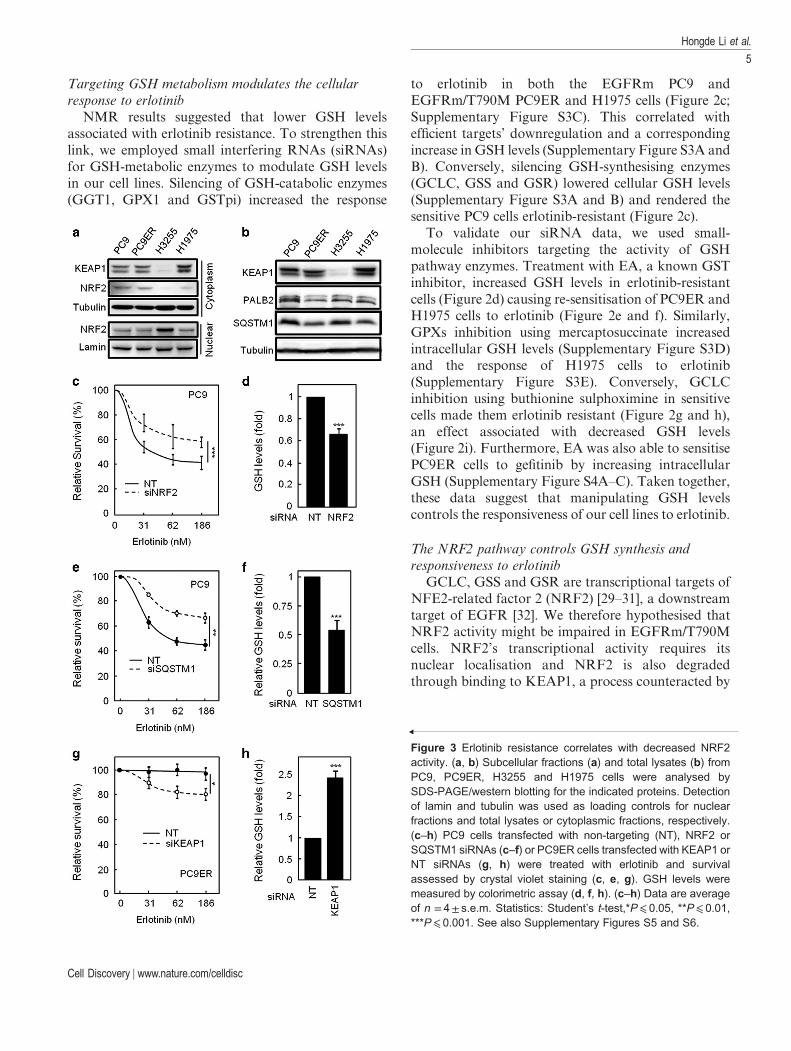
GCLC, GSS and GSR are transcriptional targets ofNFE2-related factor 2 (NRF2) [29–31], a downstreamtarget of EGFR [32]. We therefore hypothesised thatNRF2 activity might be impaired in EGFRm/T790Mcells. NRF2’s transcriptional activity requires itsnuclear localisation and NRF2 is also degradedthrough binding to KEAP1, a process counteracted by
Figure 3 Erlotinib resistance correlates with decreased NRF2activity. (a, b) Subcellular fractions (a) and total lysates (b) fromPC9, PC9ER, H3255 and H1975 cells were analysed bySDS-PAGE/western blotting for the indicated proteins. Detectionof lamin and tubulin was used as loading controls for nuclearfractions and total lysates or cytoplasmic fractions, respectively.(c–h) PC9 cells transfected with non-targeting (NT), NRF2 orSQSTM1 siRNAs (c–f) or PC9ER cells transfected with KEAP1 orNT siRNAs (g, h) were treated with erlotinib and survivalassessed by crystal violet staining (c, e, g). GSH levels weremeasured by colorimetric assay (d, f, h). (c–h) Data are averageof n = 4± s.e.m. Statistics: Student’s t-test,*P⩽ 0.05, **P⩽ 0.01,***P⩽ 0.001. See also Supplementary Figures S5 and S6.
Hongde Li et al.
5
Cell Discovery | www.nature.com/celldisc
competitive interaction of the latter protein withPALB2 and/or SQSTM1. Analysis of nucleocyto-plasmic fractions and total lysates from our four celllines revealed that NRF2 or KEAP1 localisation/expression had no differences between PC9 andPC9ER cells, whereas H3255 cells showed higher levelof nuclear NRF2 than H1975 cells (Figure 3a;Supplementary Figure S5A). This correlated withincreased KEAP1 expression in H1975 as comparedwith H3255 cells (Figure 3a; SupplementaryFigure S5B). Although these results alone mayexplain the difference in GSH pathway enzymesexpression between the latter two cell lines, they cannotaccount for that seen between PC9 and PC9ER cells.However, SQSTM1 was downregulated in bothPC9ER and H1975 cells as compared with theirerlotinib-sensitive counterparts (Figure 3b;Supplementary Figure S5C), whereas PALB2 levelswere lower in PC9ER as compared with PC9 cells(Figure 3b; Supplementary Figure S5D). Furthermore,NRF2 has been shown to be a transcriptional regulatorof SQSTM1 and, indeed, mRNA levels of SQSTM1were found to be significantly lower in both the resis-tant cell line pair (Supplementary Figure S5E and F).Hence, inhibition of NRF2 activity through variousmechanisms may be linked to erlotinib resistance inNSCLC cells.
To test this hypothesis, we silenced NRF2, SQSTM1,PALB2 and KEAP1 in our cells. siRNA-mediatedsilencing of NRF2 (Supplementary Figure S6A) ren-dered PC9 cells erlotinib resistant, a change associatedwith lower intracellular GSH (Figure 3c and d).Indeed, NRF2-silenced cells showed downregulation ofthe GSH-synthesising enzymes GCLC and GSR(Supplementary Figure S6B), demonstrating a directlink between NRF2 activity and GSH synthesis. Simi-larly, SQSTM1 silencing (Supplementary Figure S6Cand D) decreased the sensitivity of PC9 cells to erlotinib(Figure 3e) in association with a drop in GSH levels(Figure 3f). Conversely, KEAP1 downregulation(Supplementary Figure S6E) sensitised EGFRm/T790M PC9ER cells to erlotinib (Figure 3g), accom-panied by the increased GSH levels (Figure 3h) andincreased transcription of GSH-synthesising enzymesGCLC, GSR and GSS (Supplementary Figure S6F).Finally, despite the changes in PALB2 between PC9ERand PC9 cells (Figure 3b), silencing this protein in PC9cells failed to induce erlotinib resistance or alter GSHlevels (Supplementary Figure S7A and B). Hence, themodulation of NRF2 activity through KEAP1 andSQSTM1 regulates the sensitivity of NSCLC cells toerlotinib.
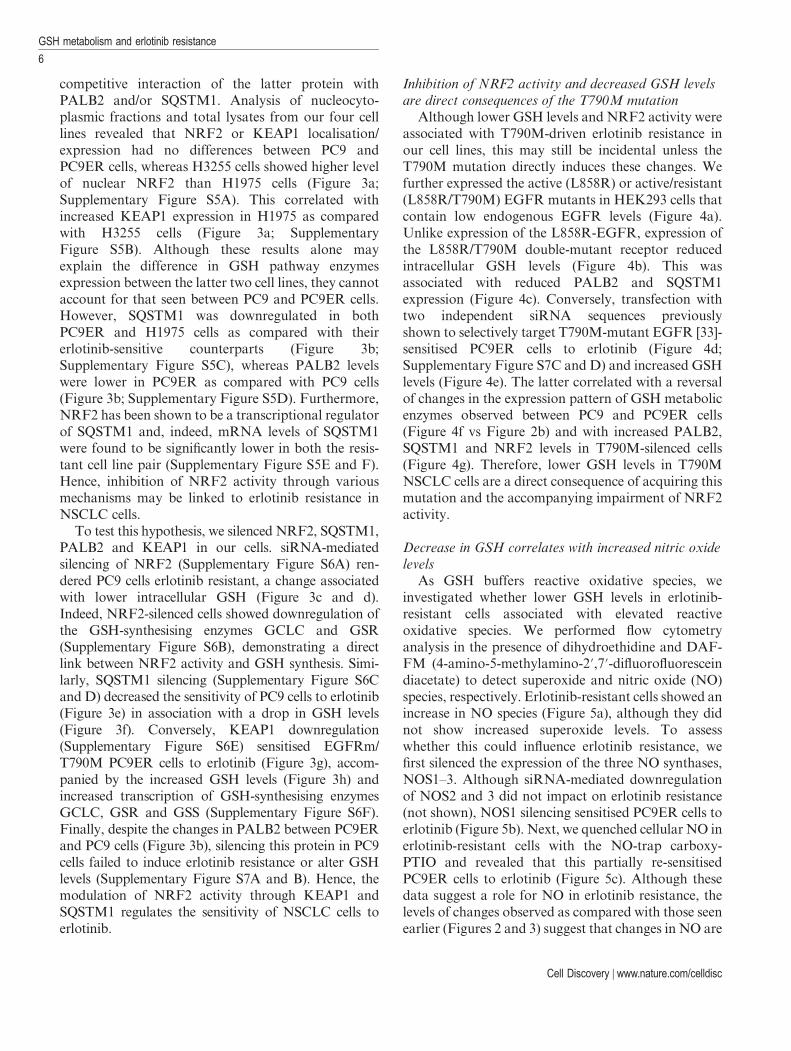
Inhibition of NRF2 activity and decreased GSH levelsare direct consequences of the T790M mutation
Although lower GSH levels and NRF2 activity wereassociated with T790M-driven erlotinib resistance inour cell lines, this may still be incidental unless theT790M mutation directly induces these changes. Wefurther expressed the active (L858R) or active/resistant(L858R/T790M) EGFR mutants in HEK293 cells thatcontain low endogenous EGFR levels (Figure 4a).Unlike expression of the L858R-EGFR, expression ofthe L858R/T790M double-mutant receptor reducedintracellular GSH levels (Figure 4b). This wasassociated with reduced PALB2 and SQSTM1expression (Figure 4c). Conversely, transfection withtwo independent siRNA sequences previouslyshown to selectively target T790M-mutant EGFR [33]-sensitised PC9ER cells to erlotinib (Figure 4d;Supplementary Figure S7C and D) and increased GSHlevels (Figure 4e). The latter correlated with a reversalof changes in the expression pattern of GSH metabolicenzymes observed between PC9 and PC9ER cells(Figure 4f vs Figure 2b) and with increased PALB2,SQSTM1 and NRF2 levels in T790M-silenced cells(Figure 4g). Therefore, lower GSH levels in T790MNSCLC cells are a direct consequence of acquiring thismutation and the accompanying impairment of NRF2activity.
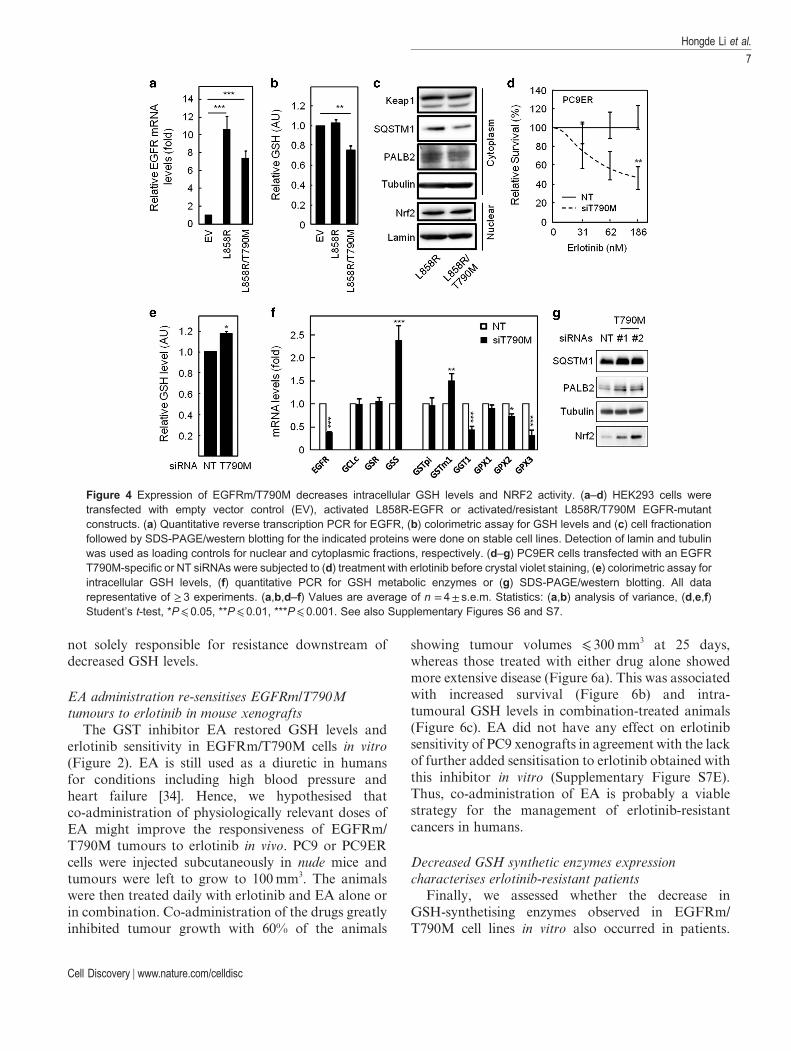
Decrease in GSH correlates with increased nitric oxidelevels
As GSH buffers reactive oxidative species, weinvestigated whether lower GSH levels in erlotinib-resistant cells associated with elevated reactiveoxidative species. We performed flow cytometryanalysis in the presence of dihydroethidine and DAF-FM (4-amino-5-methylamino-2′,7′-difluorofluoresceindiacetate) to detect superoxide and nitric oxide (NO)species, respectively. Erlotinib-resistant cells showed anincrease in NO species (Figure 5a), although they didnot show increased superoxide levels. To assesswhether this could influence erlotinib resistance, wefirst silenced the expression of the three NO synthases,NOS1–3. Although siRNA-mediated downregulationof NOS2 and 3 did not impact on erlotinib resistance(not shown), NOS1 silencing sensitised PC9ER cells toerlotinib (Figure 5b). Next, we quenched cellular NO inerlotinib-resistant cells with the NO-trap carboxy-PTIO and revealed that this partially re-sensitisedPC9ER cells to erlotinib (Figure 5c). Although thesedata suggest a role for NO in erlotinib resistance, thelevels of changes observed as compared with those seenearlier (Figures 2 and 3) suggest that changes in NO are
GSH metabolism and erlotinib resistance
6
Cell Discovery | www.nature.com/celldisc
not solely responsible for resistance downstream ofdecreased GSH levels.
EA administration re-sensitises EGFRm/T790Mtumours to erlotinib in mouse xenografts
The GST inhibitor EA restored GSH levels anderlotinib sensitivity in EGFRm/T790M cells in vitro(Figure 2). EA is still used as a diuretic in humansfor conditions including high blood pressure andheart failure [34]. Hence, we hypothesised thatco-administration of physiologically relevant doses ofEA might improve the responsiveness of EGFRm/T790M tumours to erlotinib in vivo. PC9 or PC9ERcells were injected subcutaneously in nude mice andtumours were left to grow to 100mm3. The animalswere then treated daily with erlotinib and EA alone orin combination. Co-administration of the drugs greatlyinhibited tumour growth with 60% of the animals
showing tumour volumes ⩽ 300mm3 at 25 days,whereas those treated with either drug alone showedmore extensive disease (Figure 6a). This was associatedwith increased survival (Figure 6b) and intra-tumoural GSH levels in combination-treated animals(Figure 6c). EA did not have any effect on erlotinibsensitivity of PC9 xenografts in agreement with the lackof further added sensitisation to erlotinib obtained withthis inhibitor in vitro (Supplementary Figure S7E).Thus, co-administration of EA is probably a viablestrategy for the management of erlotinib-resistantcancers in humans.
Decreased GSH synthetic enzymes expressioncharacterises erlotinib-resistant patients
Finally, we assessed whether the decrease inGSH-synthetising enzymes observed in EGFRm/T790M cell lines in vitro also occurred in patients.
Figure 4 Expression of EGFRm/T790M decreases intracellular GSH levels and NRF2 activity. (a–d) HEK293 cells weretransfected with empty vector control (EV), activated L858R-EGFR or activated/resistant L858R/T790M EGFR-mutantconstructs. (a) Quantitative reverse transcription PCR for EGFR, (b) colorimetric assay for GSH levels and (c) cell fractionationfollowed by SDS-PAGE/western blotting for the indicated proteins were done on stable cell lines. Detection of lamin and tubulinwas used as loading controls for nuclear and cytoplasmic fractions, respectively. (d–g) PC9ER cells transfected with an EGFRT790M-specific or NT siRNAs were subjected to (d) treatment with erlotinib before crystal violet staining, (e) colorimetric assay forintracellular GSH levels, (f) quantitative PCR for GSH metabolic enzymes or (g) SDS-PAGE/western blotting. All datarepresentative of ≥ 3 experiments. (a,b,d–f) Values are average of n = 4± s.e.m. Statistics: (a,b) analysis of variance, (d,e,f)Student’s t-test, *P⩽ 0.05, **P⩽ 0.01, ***P⩽ 0.001. See also Supplementary Figures S6 and S7.
Hongde Li et al.
7
Cell Discovery | www.nature.com/celldisc
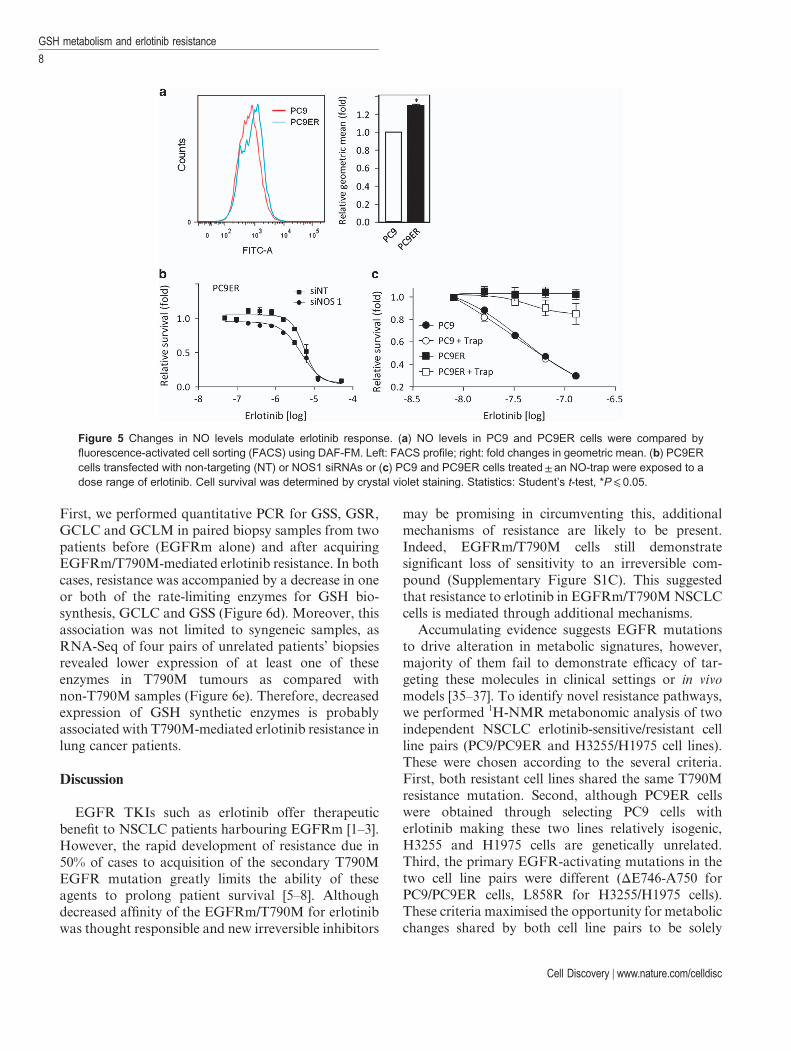
First, we performed quantitative PCR for GSS, GSR,GCLC and GCLM in paired biopsy samples from twopatients before (EGFRm alone) and after acquiringEGFRm/T790M-mediated erlotinib resistance. In bothcases, resistance was accompanied by a decrease in oneor both of the rate-limiting enzymes for GSH bio-synthesis, GCLC and GSS (Figure 6d). Moreover, thisassociation was not limited to syngeneic samples, asRNA-Seq of four pairs of unrelated patients’ biopsiesrevealed lower expression of at least one of theseenzymes in T790M tumours as compared withnon-T790M samples (Figure 6e). Therefore, decreasedexpression of GSH synthetic enzymes is probablyassociated with T790M-mediated erlotinib resistance inlung cancer patients.
Discussion
EGFR TKIs such as erlotinib offer therapeuticbenefit to NSCLC patients harbouring EGFRm [1–3].However, the rapid development of resistance due in50% of cases to acquisition of the secondary T790MEGFR mutation greatly limits the ability of theseagents to prolong patient survival [5–8]. Althoughdecreased affinity of the EGFRm/T790M for erlotinibwas thought responsible and new irreversible inhibitors
may be promising in circumventing this, additionalmechanisms of resistance are likely to be present.Indeed, EGFRm/T790M cells still demonstratesignificant loss of sensitivity to an irreversible com-pound (Supplementary Figure S1C). This suggestedthat resistance to erlotinib in EGFRm/T790MNSCLCcells is mediated through additional mechanisms.
Accumulating evidence suggests EGFR mutationsto drive alteration in metabolic signatures, however,majority of them fail to demonstrate efficacy of tar-geting these molecules in clinical settings or in vivomodels [35–37]. To identify novel resistance pathways,we performed 1H-NMR metabonomic analysis of twoindependent NSCLC erlotinib-sensitive/resistant cellline pairs (PC9/PC9ER and H3255/H1975 cell lines).These were chosen according to the several criteria.First, both resistant cell lines shared the same T790Mresistance mutation. Second, although PC9ER cellswere obtained through selecting PC9 cells witherlotinib making these two lines relatively isogenic,H3255 and H1975 cells are genetically unrelated.Third, the primary EGFR-activating mutations in thetwo cell line pairs were different (ΔE746-A750 forPC9/PC9ER cells, L858R for H3255/H1975 cells).These criteria maximised the opportunity for metabolicchanges shared by both cell line pairs to be solely
Figure 5 Changes in NO levels modulate erlotinib response. (a) NO levels in PC9 and PC9ER cells were compared byfluorescence-activated cell sorting (FACS) using DAF-FM. Left: FACS profile; right: fold changes in geometric mean. (b) PC9ERcells transfected with non-targeting (NT) or NOS1 siRNAs or (c) PC9 and PC9ER cells treated± an NO-trap were exposed to adose range of erlotinib. Cell survival was determined by crystal violet staining. Statistics: Student’s t-test, *P⩽ 0.05.
GSH metabolism and erlotinib resistance
8
Cell Discovery | www.nature.com/celldisc
Figure 6 Systemic EA administration re-sensitises PC9ER mouse xenografts to erlotinib. Nude mice (n = 10/condition) wereinjected subcutaneously with PC9ER cells and treatment started when tumours reached 100 mm3. (a) Tumour volume and (b)animals survival were monitored for 27 days. (a) Data are average± s.e.m. (b) End-point events occur when tumour volumes⩾ 300 mm3. Log-rank test, Pabo0.01, Pbco0.01. (c) Following the last treatment, intratumoral GSH levels were measuredex vivo by colorimetric assay. Statistics: (a) analysis of variance, (c) Student’s t-test, *Po0.05; **Po0.01. GSH-synthesisingenzymes expression is decreased in EGFRm/T790M patient tumours. mRNA levels for the indicated enzymes were compared byquantitative PCR in two patients before (pre-T790M) and after (post-T790M) the onset of T790M-mediated erlotinib resistance (d)or by RNA-Seq in four pairs of unrelated patients with (Pt1-4) or without (Pt5-8) T790M (e). Data in T790M samples arenormalised to those in the corresponding non-T790M samples. (f) Model of changes occurring downstream of T790M EGFR.
Hongde Li et al.
9
Cell Discovery | www.nature.com/celldisc
dependent on the T790M mutation. One of the moststriking differences highlighted by our analysis was adecrease in GSH levels in erlotinib-resistant cells(Figure 1). The GSH pathway has long been involvedin cancer drug resistance [27, 28]. However, this wastraditionally associated with increased GSH levels [25,26]. Indeed, GSH covalently binds to some drugmolecules in a GST-dependent manner leading to theircellular export and quenches reactive oxidative speciesoften requiring for these compounds to act[27, 28]. Therefore, an association between decreasedGSH levels and EGFR TKI resistance was surprisingand warranted further investigation of its relevance toerlotinib responses.
Our experiments demonstrated that inhibition ofGSH biosynthesis by either RNAi or small moleculesmade erlotinib-sensitive cells resistant to the drug(Figure 2d–i). Conversely, inhibition of GSH-degradation re-sensitised resistant cells to erlotinib(Figure 2d–f). Hence, changes in GSH levels alone canmodulate the response of NSCLC cells to this drug anddecreased GSH levels accounts for erlotinib resistancein PC9ER and H1975 cells. Comparative analysisrevealed a transcriptional downregulation of GSH-synthesising enzymes in T790M cells (Figure 2b)due to the impairment of NRF2, a downstream med-iator of EGFR responsible for transcription of theseenzymes (Figure 3a and b). This occurred via upregu-lation of the NRF2 inhibitor KEAP1 and/or down-regulation of PALB2 and SQSTM1, two proteinsinvolved NRF2 stabilisation. Indeed, siRNA-mediatedsilencing of KEAP1 in T790M cells sensitised them toerlotinib (Figure 3g and h), whereas that of SQSTM1or NRF2 made sensitive cells resistant to this drug(Figure 3c–f). Importantly, decreased NRF2 activityand GSH levels in resistant cells were a direct con-sequence of acquiring the T790M mutation as intro-ducing EGFRm/T790M in HEK293 cells, ratherthan EGFRm alone, reproduced the changes asso-ciated with erlotinib resistance (Figure 4a–c). Con-versely, silencing EGFRm/T790M in PC9ER cellsreverted the changes in GSH levels and metabolicenzymes seen upon acquisition of resistance by PC9cells (Figure 4d–g).
It is unclear by what mechanism(s) the T790Mmutation induces the observed transcriptional changesas the higher kinase activity of EGFRm/T790M [9]should further enhance NRF2 activity. However,mutant EGFRs differ from their wild-type counter-parts in their subcellular localisation [38], whichprobably results in the EGFRm/T790M havingdifferent signalling partners as EGFRm or wild-type
EGFR. Further research will be required to investigatethis possibility.
We next attempted to identify the mechanism bywhich decreased GSH levels cause erlotinib resistance.GSH is a major cellular antioxidant [39], and itsreduced expression could result in increased reactiveoxidative species. In addition, single-nucleotide poly-morphisms in antioxidant genes have been demon-strated to be associated with survival outcome inpatients receiving TKI therapy [40]. Although super-oxide levels were unchanged, NO levels were raised inPC9ER as compared with PC9 cells (Figure 5a) andNOS1 silencing or NO quenching sensitised PC9ERcells to erlotinib (Figure 5b and c). GSH is known toneutralise NO and protect against protein nitrosylation[41, 42]. It is worth noting that EGFR is a target ofS-nitrosylation [43], but the consequence of this onerlotinib response is currently unknown. However,although our data suggest that NO probably con-tributes to erlotinib resistance, this does not fullyexplain the effects of reduced GSH. Glutathionylationhas a role in disease state by modifying the function oftarget proteins [44] and assessing changes to the glu-tathionylation profile may identify proteins involved inEGFRm/T790M-mediated erlotinib resistance.
Regardless of the mechanism underlying erlotinibresistance downstream of decreased GSH levels, weshowed that the GSH pathway could be manipulatedfor therapeutic benefit. Indeed, systemic administrationof clinically relevant doses of EA, a GST inhibitor [45],increased the intra-tumoural GSH levels (Figure 6c)and re-sensitised EGFRm/T790M tumours to erlotinibin a cancer cell xenograft mice model (Figure 6a–c). AsEA is an orally available diuretic used in humans withlimited toxicity [34], our findings could rapidly trans-late into clinical practice if this sensitisation also occursin humans. Moreover, EA has already been usedtogether with classical chemotherapeutics such asalkylating agents to prevent their GST-mediatedcellular export [34], leading to improved clinicaloutcome. Therefore, EA may help manage erlotinibresistance in EGFRm-NSCLC patients and improveresponse to follow-on chemotherapeutic regimen.However, it is unclear whether decreased GSH levelsonly occurs downstream of the EGFRm/T790M or ifthis is a common feature of other erlotinib resistancepathways such as c-Met amplification. Answering thisbefore clinical exploitation of our findings will helpmore accurate patient selection for EA/erlotinibcombined trials.
Finally, we show our findings to be clinicallyrelevant using EGFRm and EGFRm/T790M lung
GSH metabolism and erlotinib resistance
10
Cell Discovery | www.nature.com/celldisc
cancer samples (Figure 6d and e). The reduced numberof samples analysed reflects the fact that repeatedbiopsy in NSCLC following the onset of EGFR TKIresistance is rare, although this practice is nowchanging. Nevertheless, we demonstrate in bothsyngenic and unrelated patient samples that mRNAlevels for GSH-synthesising enzymes are decreasedin T790M tumours. Hence, probing forGSH-synthesising enzymes may help, in a recurrentsetting, to predict the response to combinatorialtherapies of erlotinib and GSH level increasing agents.
To sum up, we demonstrate that decreased intra-cellular level of GSH could mediate T790M-drivenerlotinib resistance in NSCLC and highlight themolecular events involved (Figure 6f). Therapeuticstrategies that increase intra-tumoural GSH levels mayrevert erlotinib resistance in the clinic.
Materials and Methods
MaterialsMercaptosuccinic acid (used at 50 μM), buthionine
sulfoximine (used at 40 μM) and EA (used at 50 and 100 μM inPC9 and H1975 cells, respectively) were purchased from Sigma(St Louis, MO, USA), whereas EGFR Inhibitor 324674 wasfrom Santa Cruz (Dallas, TX, USA) and Merck (Kenilworth,NJ, USA), respectively. Antibodies against GSTpi, GPX1, GSS,GSR, GCLC, GSTpi, SQSTM1 and DPP3 were from Abcam(Cambridge, UK); antibodies targeting NRF2 and KEAP1 werefrom Santa Cruz and anti-PALB2 was from Novus (Abingdon,UK). The specificity of all antibodies employed here wasassessed by disappearance of the respective signal followingselective targeting of the expression of the corresponding proteinby siRNA treatment. Quantitect primers targeting GSTpi,GPX1, GPX1, GSS, GSR and GCLC were from Qiagen(Valencia, CA, USA). All other primers were synthesised bySigma. SiRNAs were purchased from Dharmacon (LittleChalfont, UK). Dihydroethidine was from Invitrogen(Waltham, MA, USA) and DAF-FM from Sigma.
Cell cultureAll cell lines were obtained from the CRUK cell line bank
where they were authenticated and mycoplasma status assessedthrough regular testing in our lab. Cell lines were grown inRoswell ParkMemorial Institute with 10% fetal bovine serum at37 °C, 5% CO2.
Extraction of the intracellular metabolitesIntracellular metabolites were extracted as reported
previously [46, 47] with some modifications. In brief, 107 cells percondition were trypsinised and washed thrice in ice-coldphosphate-buffered saline before metabolite extraction. Cellpellets were resuspended in 0.6 ml cold water/methanol (1:2) andsubjected to three freeze–thaw cycles before sonication in a wetice bath for 15 min (cycles: 1 min pulse followed by 1 min pause).Samples were then centrifuged (3200 g/4 °C, 10 min) and
supernatants transferred into cold Eppendorfs. The remainingpellets were extracted twice more by the same method.Supernatants from the three subsequent extractions werecombined, centrifuged (12 000 g/4 °C, 10 min) and freeze-driedfollowing vacuum-driven methanol evaporation. Lyophilisedsamples were stored at − 80 °C. Ten biological replicates wereused for each group of cells.
Cellular metabonomic analysis by 1H-NMRFreeze-dried intracellular metabolites extracts were dissolved
in 600 μl phosphate buffer 0.1 M (pH 7.4, 99.9%D2O) containing0.001% sodium 3-trimethylsilyl-1-[2,2,3,3-2H4] propionate aspreviously described [48]. All samples were centrifuged(12 000 g/4 °C, 10 min) after short vortexing and supernatantstransferred into the 5 mm NMR tubes for NMR detection. Allone-dimensional 1H-NMR spectra were acquired on a BrukerAVIII 600MHz NMR spectrometer equipped with a cryogenicprobe (BrukerBiospin, Rheinstetten, Germany) at 298 K. Thefirst increment of NOESY pulse sequence was employed withcontinuous wave irradiation on the water peak during recycledelay and mixing time for water suppression. Recycle delay of2 s and mixing time of 100 ms were set. The 90° pulse wasadjusted to 10 μs approximately and 64 scans were collected into32 k data points with the spectral width of 20 p.p.m. Formetabolite assignments, two-dimensional NMR spectraincluding 1H–1H COSY, 1H–1H TOCSY, 1H J-resolved, 1H–13CHSQC and 1H–13C HMBC for typical samples were acquiredand processed as described previously [49].
NMR data analysisThe spectral region at δ 0.5–9.5 was integrated into bins
with the width of 0.002 p.p.m. (1.2 Hz) using AMIX package(v3.8, BrukerBiospin). The range (δ 4.7–5.2) was removed toeliminate the effects of water peak suppression. Each bin areawas normalised to the total area of the respective spectrum.Multivariate data analysis was performed with the softwareSIMCA-P+ (v 12.0, Umetrics, Umea, Sweden). The model wasbuilt using the orthogonal projection to latent structure-discriminant analysis (OPLS-DA) [50] with Pareto variance(Par) scaling and sevenfold cross-validation. The parameter R2Xwas the variation of X explained by the model and Q2 repre-sented the predictability of the model. The validation of all themodels was further ensured by CV-analysis of variance(Po0.05) [51]. To assist the biological interpretation of theloadings generated from the models, the loadings was firstlyback-transformed [52] and then plotted with colour-codedOPLS-DA coefficients in MATLAB 7.1 using an in-housescript [53]. The colour code corresponded to the absolutevalue of the OPLS-DA coefficients (|r|), indicating the con-tribution of each variable to explain the intergroup differentia-tion. The value of |r|, 40.602, was considered to be significant(n = 10, Po0.05).
GSH colorimetric assayA GSH colorimetric assay kit was purchased from BioAssay
Systems (Hayward, CA, USA) and used according to themanufacturer’s instructions.
Hongde Li et al.
11
Cell Discovery | www.nature.com/celldisc
siRNA transfectionA total of 1 × 10⁴ PC9, PC9ER or H1975 cells per well in
six-well plates were transfected with siRNAs at 25 nM(Dharmacon) for 24 h using RNAiMax (Invitrogen) followingthe manufacturer’s protocol. Each protein was targeted with amix of four sequences. A total of 4 × 10³ cells were re-seeded andthen incubated at 37 °C/5% CO2 for 24 h for target silencingbefore further experiment steps.
Cell survival assayFor EA, buthionine sulfoximine and mercaptosuccinic acid,
cells were pretreated for 4 h before erlotinib addition (100 nM)for 48 h. Cells were then fixed and stained for 20 min with a 25%methanol/0.5% crystal violet solution. Plates were washed inrunning water, air-dried and the stain dissolved in 10% aceticacid on a shaker before absorbance at 595 nm.
Quantitative PCRTotal cellular mRNA was extracted using the RNeasy kit
(Qiagen) and converted to complementary DNA with aHigh Capacity cDNA Reverse Transcription Kit (AppliedBiosystems, Waltham, MA, USA). mRNA levels were quanti-fied using a Fast SYBRGreenMasterMix (Applied Biosystems)on a 7900HT Fast Real time PCR System (Applied Biosystems).qBase software (San Francisco, CA, USA) was used for dataanalysis using TATA-binding protein and β-actin as internalcontrols. The primers used were listed below (F, forward; R,reverse): GCLm: (F): 5′-GGCACAGGTAAAACCAAATAGTAAC-3′, (R): 5′-CAAATTGTTTAGCAAATGCAGTCA-3′; GPX2: (F): 5′-TAAGTGGGCTCAGGCCTCTCT-3′, (R):5′-GGTCATAGAAGGACTTGGCAATG-3′; GPX3: (F):5′-GACAAGAGAAGTCGAAGATG-3′, (R): 5′-CTTCCTGTAGTGCATTCAGTT-3′; GSTz1: (F): 5′-TCCTATTTCCGAAGCTCCTGC-3′, (R): 5′-TTCAGTGCCTGGAAGTCCTTAG-3′; GSTm1: (F): 5′-CTATGATGTCCTTGACCTCCACCGTATA-3′, (R): 5′-ATGTTCACGAAGGATAGTGGGTAGCTGA-3′; Beta-Actin: (F): 5′-TCCTCCTGAGCGCAAGTACTC-3′, (R): 5′-CTGCTTGCTGATCCACATCTG-3′;KEAP1: (F): 5′-CAGATTGGCTGTGTGGAGTT-3′, (R):5′-GCTGTTCGCAGTCGTACTTG-3′; SQSTM1: (F):5′-CTGGGACTGAGAAGGCTCAC-3′, (R): 5′-GCAGCTGATGGTTTGGAAAT-3′; TBP: (F): 5′-TGCACAGGAGCCAAGAGTGAA-3′, (R): 5′-CACATCACAGCTCCCCACCA-3′;NRF2 primers: (F): 5′-GAGAGCCCAGTCTTCATTGC-3′,(R): 5′-TGCTCAATGTCCTGTTGCAT-3′. Primers against theother targets were purchased fromQiagen: GCLc (QT00037310),GGT1 (QT00029470), GPX1 (QT00203392), GSTp1(QT00086401), GSS (QT00014413) and GSR (QT00038325).
Tissue mRNA extraction and quantitative PCRThe origin of tissues and techniques used are as previously
reported [54]. In short, samples were obtained from EGFR-mutant lung adenocarcinoma patients with acquired erlotinibresistance under Human Investigations Protocol #111000928(Yale Cancer Center, New Haven, CT). Those were reviewed bya pathologist to ensure adequate tumour content. Tumour areaswere circled and microdissection performed to enrich for tumourcontent.
Tissue mRNA extraction and RNA-SeqThe Illumina TruSeq RNA Sample Preparation Kit (Illu-
mina Cambridge Ltd, Essex, UK) was used for RNA tissueextraction and analysis done as previously described [55].
Western blottingCells were lysed using 0.5% Triton X-100, 150 mM NaCl,
2 mM EDTA, 10% glycerol supplemented with proteaseinhibitors cocktail tablets (Roche Diagnostics, Indianapolis, IN,USA), 10 mM β-glycerophosphate, 1 mM Na3VO4 and 10 mM
NaF. Equal protein amounts were analysed by SDS-PAGE/western blotting using the antibodies indicated.
Flow cytometry analysis of oxidative speciesCells (15 × 104/well in a six-well plate) were treated with
10 μM DAF-FM or dihydroethidine for 30 min, washed withphosphate-buffered saline, trypsinised, pelleted and resuspendedin 1 ml of phosphate-buffered saline before flow cytometryusing a BD FACSCalibur (DB Biosciences, Oxford, UK). Thegeometric mean intensity was determined using FlowJo (TreeStar Inc, Ashland, OR, USA).
Animal experimentsA total of 5x10⁶ PC9ER or PC9 cells were injected
subcutaneously into the flank of female BALB/c nude mice andthe tumours grew until they reached 100 mm3. Mice were thenrandomized into three groups (n = 10) and treated by intraper-itoneal injection of 25 mg kg− 1 per day erlotinib/0.5% w/vmethylcellulose and/or 6 mg kg− 1 per day EA/1% Tween 80 indistilled water. Such treatments were administered daily fromday 7 to 26. Tumours were measured by caliper and volumescalculated as V = 1/2*L*W2 (L; length, W; width of tumour).Data analysis was performed by an investigator blinded to theexperimental conditions. All experiments complied with ethicalregulations as enforced by the local committee.
Conflict of Interest
The authors declare no conflict of interest.
Acknowledgements
HRT/YLW acknowledges the financial supports from theMinistry of Science and Technology of China (2012CB934004),National Natural Science Foundation of China (81590953,81590950, 91439102 and 21375144). MJS/OP is funded bythe European Commission’s FP7 under the LungTargetconsortium, the AICR and CTRT. Also, MJS is supported byCRUK and UK Department of Health/NIHR Imperial ECMCand BRC.
Author contributions
MJS, OEP, YLW and HRT conceived and designed thestudy. HDL did the metabolomics data acquisition and analysis.HDL, YLH and ZGL conducted all the animal experiments anddata analysis. WS, EC and RR did the molecular biology data
GSH metabolism and erlotinib resistance
12
Cell Discovery | www.nature.com/celldisc
acquisition and analysis. EB, EFS, GJJEH and JD acquired themRNA data on gene expression in clinical samples. OEP, YLW,MJS and HRT did the overall data interpretation with othersand wrote the paper.
References
1 Mok TS, Wu YL, Yu CJ et al. Randomized, placebo-controlled, phase II study of sequential erlotinib andchemotherapy as first-line treatment for advanced non-small-cell lung cancer. J Clin Oncol 2009; 27: 5080–5087.
2 Lynch TJ, Bell DW, Sordella R et al. Activating mutationsin the epidermal growth factor receptor underlyingresponsiveness of non-small-cell lung cancer to gefitinib.N Engl J Med 2004; 350: 2129–2139.
3 Paez JG, Janne PA, Lee JC et al. EGFR mutations in lungcancer: correlation with clinical response to gefitinibtherapy. Science 2004; 304: 1497–1500.
4 Stewart EL, Tan SZ, Liu G, TsaoMS. Known and putativemechanisms of resistance to EGFR targeted therapies inNSCLC patients with EGFR mutations-a review. TranslLung Cancer Res 2015; 4: 67–81.
5 Kosaka T, Yatabe Y, Endoh H et al. Analysis of epidermalgrowth factor receptor gene mutation in patients withnon-small cell lung cancer and acquired resistance togefitinib. Clin Cancer Res 2006; 12: 5764–5769.
6 Balak MN, Gong Y, Riely GJ et al. Novel D761Y andcommon secondary T790M mutations in epidermalgrowth factor receptor-mutant lung adenocarcinomas withacquired resistance to kinase inhibitors. Clin Cancer Res2006; 12: 6494–6501.
7 Kobayashi S, Boggon TJ, Dayaram T et al. EGFRmutation and resistance of non-small-cell lung cancer togefitinib. N Engl J Med 2005; 352: 786–792.
8 Pao W, Miller VA, Politi KA et al. Acquired resistance oflung adenocarcinomas to gefitinib or erlotinib is associatedwith a second mutation in the EGFR kinase domain. PLoSMed 2005; 2: e73.
9 Yoshikawa S, Kukimoto-Niino M, Parker L et al.Structural basis for the altered drug sensitivities of non-small cell lung cancer-associated mutants of human epi-dermal growth factor receptor. Oncogene 2012; 32: 27–38.
10 Cross DA, Ashton SE, Ghiorghiu S et al. AZD9291, anirreversible EGFR TKI, overcomes T790M-mediatedresistance to EGFR inhibitors in lung cancer. CancerDiscov 2014; 4: 1046–1061.
11 Walter AO, Sjin RT, Haringsma HJ et al. Discoveryof a mutant-selective covalent inhibitor of EGFR thatovercomes T790M-mediated resistance in NSCLC. CancerDiscov 2013; 3: 1404–1415.
12 Zhang Q, Liu Y, Gao F et al.Discovery of EGFR selective4,6-disubstituted pyrimidines from a combinatorialkinase-directed heterocycle library. J Am Chem Soc 2006;128: 2182–2183.
13 Miller VA, Hirsh V, Cadranel J et al. Afatinib versusplacebo for patients with advanced, metastatic non-small-cell lung cancer after failure of erlotinib, gefitinib, or both,
and one or two lines of chemotherapy (LUX-Lung 1): aphase 2b/3 randomised trial.Lancet Oncol 2012; 13: 528–538.
14 Costa DB, Kobayashi SS. Whacking a mole-cule: clinicalactivity and mechanisms of resistance to third generationEGFR inhibitors in EGFR mutated lung cancers withEGFR-T790M. Transl Lung Cancer Res 2015; 4: 809–815.
15 Jones RG, Thompson CB. Tumor suppressors and cellmetabolism: a recipe for cancer growth. Genes Dev 2009;23: 537–548.
16 Cavill R, Kamburov A, Ellis JK et al. Consensus-phenotype integration of transcriptomic and metabolomicdata implies a role for metabolism in the chemosensitivityof tumour cells. PLoS Comput Biol 2011; 7: e1001113.
17 Jang M, Kim SS, Lee J. Cancer cell metabolism: implica-tions for therapeutic targets. Exp Mol Med 2013; 45: e45.
18 Zhao Y, Butler EB, Tan M. Targeting cellular metabolismto improve cancer therapeutics. Cell Death Dis 2013; 4: e532.
19 Sreekumar A, Poisson LM, Rajendiran TM et al.Metabolomic profiles delineate potential role for sarcosinein prostate cancer progression. Nature 2009; 457: 910–914.
20 Boros LG, Cascante M, Lee WN. Metabolic profiling ofcell growth and death in cancer: applications in drugdiscovery. Drug Discov Today 2002; 7: 364–372.
21 Wang YH, Zhang LM, Chen WL et al. Rapid diagnosisand prognosis of de novo acute myeloid leukemia by serummetabonomic analysis. J Proteome Res 2013; 12: 4393–4401.
22 Serkova NJ, Spratlin JL, Eckhardt SG. NMR-basedmetabolomics: translational application and treatmentof cancer. Curr Opin Mol Ther 2007; 9: 572–585.
23 Tian Y, Nie X, Xu S et al. Integrative metabonomics aspotential method for diagnosis of thyroid malignancy. SciRep 2015; 5: 14869.
24 Alama A, Orengo AM, Ferrini S, Gangemi R. Targetingcancer-initiating cell drug-resistance: a roadmap to anew-generation of cancer therapies? Drug Discov Today2012; 17: 435–442.
25 Brozovic A, Ambriovic-Ristov A, Osmak M. Therelationship between cisplatin-induced reactive oxygenspecies, glutathione, and BCL-2 and resistance to cisplatin.Crit Rev Toxicol 2010; 40: 347–359.
26 Bracht K, Boubakari, Grunert R, Bednarski PJ.Correlations between the activities of 19 anti-tumor agentsand the intracellular glutathione concentrations in a panelof 14 human cancer cell lines: comparisons with theNational Cancer Institute data. Anticancer Drugs 2006; 17:41–51.
27 Provost K, Bouvet-Muller D, Crauste-Manciet S et al.EXAFS structural study of platinum-based anticancerdrugs degradation in presence of sulfur nucleophilic species.Biochimie 2009; 91: 1301–1306.
28 Rappa G, Lorico A, Flavell RA, Sartorelli AC. Evidencethat the multidrug resistance protein (MRP) functions as aco-transporter of glutathione and natural product toxins.Cancer Res 1997; 57: 5232–5237.
29 Bell KF, Fowler JH, Al-Mubarak B, Horsburgh K,Hardingham GE. Activation of Nrf2-regulated glutathionepathway genes by ischemic preconditioning. Oxid Med CellLongev 2011; 2011: 689524.
Hongde Li et al.
13
Cell Discovery | www.nature.com/celldisc
30 Kato K, Takahashi K, Monzen S et al. Relationshipbetween radiosensitivity and Nrf2 target gene expression inhuman hematopoietic stem cells. Radiat Res 2010; 174:177–184.
31 Sekhar KR, Crooks PA, Sonar VN et al. NADPH oxidaseactivity is essential for Keap1/Nrf2-mediated induction ofGCLC in response to 2-indol-3-yl-methylenequinuclidin-3-ols. Cancer Res 2003; 63: 5636–5645.
32 Papaiahgari S, Zhang Q, Kleeberger SR, Cho HY,Reddy SP. Hyperoxia stimulates an Nrf2-ARE transcrip-tional response via ROS-EGFR-PI3K-Akt/ERK MAPkinase signaling in pulmonary epithelial cells. AntioxidRedox Signal 2006; 8: 43–52.
33 Chen G, Kronenberger P, Teugels E, Umelo IA,De Greve J. Effect of siRNAs targeting the EGFR T790Mmutation in a non-small cell lung cancer cell line resistant toEGFR tyrosine kinase inhibitors and combination withvarious agents. Biochem Biophys Res Commun 2013; 431:623–629.
34 Somberg JC, Molnar J. The pleiotropic effects ofethacrynic acid. Am J Ther 2009; 16: 102–104.
35 Makinoshima H, Takita M, Saruwatari K et al.Signaling through the phosphatidylinositol 3-kinase (pi3k)/mammalian target of rapamycin (mtor) axis is responsiblefor aerobic glycolysis mediated by glucose transporter inepidermal growth factor receptor (egfr)-mutated lungadenocarcinoma. J Biol Chem 2015; 290: 17495–17504.
36 Serizawa M, Kusuhara M, Zangiacomi V et al. Identifica-tion of metabolic signatures associated with erlotinibresistance of non-small cell lung cancer cells.Anticancer Res2014; 34: 2779–2787.
37 Xie C, Jin J, Bao X et al. Inhibition of mitochondrialglutaminase activity reverses acquired erlotinib resistance innon-small cell lung cancer. Oncotarget 2016; 7: 610–621.
38 Chung BM, Raja SM, Clubb RJ et al. Aberrant traffickingof NSCLC-associated EGFR mutants through theendocytic recycling pathway promotes interaction with Src.BMC Cell Biol 2009; 10: 84.
39 Schafer FQ, Buettner GR. Redox environment of thecell as viewed through the redox state of the glutathionedisulfide/glutathione couple. Free Radic Biol Med 2001; 30:1191–1212.
40 Xu Y, Pan Q, Wang C et al. Genetic polymorphisms inoxidative stress-related genes are associated with clinicaloutcome in patients with advanced non-small cell lungcancer receiving tyrosine kinase inhibitors. Am J CancerRes 2014; 4: 934–942.
41 Pedersen JZ, De Maria F, Turella P et al. Glutathionetransferases sequester toxic dinitrosyl-iron complexes incells. A protection mechanism against excess nitric oxide.J Biol Chem 2007; 282: 6364–6371.
42 Aquilano K, Baldelli S, Ciriolo MR. Glutathione is acrucial guardian of protein integrity in the brain upon nitricoxide imbalance. Commun Integr Biol 2011; 4: 477–479.
43 Switzer CH, Glynn SA, Cheng RY et al. S-nitrosylation ofEGFR and Src activates an oncogenic signaling network in
human basal-like breast cancer. Mol Cancer Res 2012; 10:1203–1215.
44 Ghezzi P. Protein glutathionylation in health and disease.Biochim Biophys Acta 2013; 1830: 3165–3172.
45 Ploemen JH, van Ommen B, Bogaards JJ, van Bladeren PJ.Ethacrynic acid and its glutathione conjugate asinhibitors of glutathione S-transferases. Xenobiotica 1993;23: 913–923.
46 Li HD, Zhu WD, Zhang LK et al. The metabolic responsesto hepatitis B virus infection shed new light on pathogenesisand targets for treatment. Sci Rep 2015; 5: 8421.
47 Zhang LM, Wang LM, Hu YL et al. Selective metaboliceffects of gold nanorods on normal and cancer cells andtheir application in anticancer drug screening. Biomaterials2013; 34: 7117–7126.
48 Jiang LM, Huang J, Wang YL, Tang HR. Eliminating thedication-induced intersample chemical-shift variations forNMR-based biofluid metabonomic analysis. Analyst 2012;137: 4209–4219.
49 AnYP, XuWX, Li HH et al.High-fat diet induces dynamicmetabolic alterations in multiple biological matrices of rats.J Proteome Res 2013; 12: 3755–3768.
50 Trygg J, Wold S. Orthogonal projections to latentstructures (O-PLS). J Chemom 2002; 16: 119–128.
51 Eriksson L, Trygg J, Wold S. CV-ANOVA for significancetesting of PLS and OPLS (R) models. J Chemom 2008; 22:594–600.
52 Cloarec O, Dumas ME, Craig A et al. Statistical totalcorrelation spectroscopy: an exploratory approach forlatent biomarker identification from metabolic 1H NMRdata sets. Anal Chem 2005; 77: 1282–1289.
53 Li D, Zhang LL, Dong FC et al. Metabonomic changesassociated with atherosclerosis progression for LDLR-/-mice. J Proteome Res 2015; 14: 2237–2254.
54 deBruin EC, Cowell C, Warne PH et al. Reduced NF1expression confers resistance to EGFR inhibition inlung cancer. Cancer Discov 2014; 4: 606–619.
55 Huang S, Holzel M, Knijnenburg T et al. MED12controls the response to multiple cancer drugs throughregulation of TGF-beta receptor signaling. Cell 2012; 151:937–950.
(Supplementary information is linked to the online version of thepaper on the Cell Discovery website.)
This work is licensed under a Creative CommonsAttribution 4.0 International License. The images or
other third party material in this article are included in the article’sCreative Commons license, unless indicated otherwise in thecredit line; if the material is not included under the CreativeCommons license, users will need to obtain permission from thelicense holder to reproduce the material. To view a copy of thislicense, visit http://creativecommons.org/licenses/by/4.0/
© The Author(s) 2016
GSH metabolism and erlotinib resistance
14
Cell Discovery | www.nature.com/celldisc