Decoupling Solar Variability and Instrument Trends using ...
19
Tom Woods Sun-Climate 2018 Meeting 1 Decoupling Solar Variability and Instrument Trends using the Multiple Same-Irradiance- Level (MuSIL) Analysis Technique Tom Woods, Frank Eparvier, Jerry Harder, and Marty Snow University of Colorado Laboratory for Atmospheric and Space Physics [email protected]
Transcript of Decoupling Solar Variability and Instrument Trends using ...

Tom WoodsSun-Climate 2018 Meeting 1
Decoupling Solar Variability and Instrument Trends using the Multiple Same-Irradiance-
Level (MuSIL) Analysis Technique
Tom Woods,Frank Eparvier, Jerry Harder, and Marty Snow
University of ColoradoLaboratory for Atmospheric and Space Physics

Tom WoodsSun-Climate 2018 Meeting 2
Key Goal is Creating Long-term Composite Record
• Woods & Rottman, J. Geophys. Res., 1997• Woods, Tobiska, Rottman, & Worden, J. Geophys. Res., 2000
http://lasp.colorado.edu/lisird/
Example of SSI Composite Record at H I Lyman-a (121.6 nm)

Tom WoodsSun-Climate 2018 Meeting 3
Challenges for Making SSI Composite Records
1) Different Levels of Irradiance
2) Incomplete Spectral and Temporal Coverage
3) Instrument Degradation Correction
SC-21 | SC-22 | SC-23 | SC-24 | SC-25
Figures are from Kopp & Lean (GRL, 2011) and LISIRD web site.

Tom WoodsSun-Climate 2018 Meeting 4
Challenge 3: Instrument Degradation Correction• Understanding instrument degradation is critical for
obtaining accurate solar cycle variations.
Measurement is SIM uncorrected data at 280 nm

Tom WoodsSun-Climate 2018 Meeting 5
In-flight Calibration Techniques
• Redundant Channels• One channel is used
daily, and others have low-duty cycle (weekly or monthly)
• Trending assumes exposure-related degradation
• Challenge is for non-exposure related degradation
• On-board Lamps• Calibrated lamps are
used with low-duty cycle during flight
• Trending assumes lamp is stable
• Challenge is that lamps can degrade and have often burned out in-flight
• UnderflightCampaigns
• Identical instrument has underflight with satellite
• Transfers fresh calibration to satellite instrument
• Limited to the EUV-FUV because of calibration accuracy

Tom WoodsSun-Climate 2018 Meeting 6
New Technique to Validate Time Series
• The Multiple Same-Irradiance-Level (MuSIL) analysis technique was developed to identify uncorrected instrument degradation trends.
Same-Irradiance-Level à solar cycle and instrument trends

Tom WoodsSun-Climate 2018 Meeting 7
New Technique to Validate Time Series• Combining the trends from 8
levels provides a trend that indicates an uncorrected instrument degradation trend.– This is NOT proxy model of the data.
• This trend is fit with piecewise linear fits (gold lines).
• Uncertainty is estimated to be 5-10% of solar cycle variability.
• Method weakness is that it leaves gap during solar cycle minimum.
Nor
mal
ize T
rend
s

Tom WoodsSun-Climate 2018 Meeting 8
Example Instrument Degradation Trends using MuSIL MethodSO
RCE
SO
LSTI
CE
SORC
E S
IM
Last Stellar Calibrations
Start PowerCycling

Tom WoodsSun-Climate 2018 Meeting 9
Example-2 Instrument Degradation Trends using MuSIL MethodTI
MED
SEE
EG
S
OM
I Sol
ar
Last CalibrationRocket for SEE V11

Tom WoodsSun-Climate 2018 Meeting 10
MuSIL Results are Less Than Degradation Uncertainties
• Average rates for uncorrected degradation trend are shown.
• Original data product’s estimated stability uncertainties are shown in red as 1-s, 2-s and 3-s levels.

Tom WoodsSun-Climate 2018 Meeting 11
SORCE TIM TSI Trend• MuSIL analysis of TIM TSI is used to validate the MuSIL
technique, but it does show an upward trend.– MuSIL Trend is within 2-ss of TIM’s stability estimate of 10 ppm/year
• DeWitte & Nevel [2016] suggest there is SORCE TSI trend in comparison to other TSI records.
DeWitte & Nevel TrendWoods MuSIL Trend
TIM TSI Stability Estimate

Tom WoodsSun-Climate 2018 Meeting 12
Pick 27-day Averages for Equivalent Maxima
• SC-23 Maximum– June 21, 2003
• Minimum– Jan. 1, 2009
• SC-24 Maximum– June 2, 2012
Expect SC-23 MAX and SC-24 MAX to have similar SSI variability

Tom WoodsSun-Climate 2018 Meeting 13
New Solar Cycle Variability Results: TIMED SEE
• TIMED SEE Extreme Ultraviolet (EUV) and Far Ultraviolet (FUV) at < 150 nm are consistent with other estimates.
• New MuSIL result has improved results for TIMED SEE solar cycle variability, primarily for wavelengths > 150 nm.
EUV FUV

Tom WoodsSun-Climate 2018 Meeting 14
New Solar Cycle Variability Results: SOLSTICE
• SORCE SOLSTICE Far Ultraviolet (FUV) and Middle Ultraviolet (MUV) are consistent with other estimates.
• New MuSIL result has improved results for SOLSTICE solar cycle variability, primarily for wavelengths > 210 nm.
FUV MUV

Tom WoodsSun-Climate 2018 Meeting 15
New Solar Cycle Variability Results: SORCE SIM
• SIM provides results in the Near Ultraviolet (NUV), Visible, and Near Infrared (NIR).
• The SIM NUV solar cycle variability at < 400 nm is consistent with other estimates.
• New MuSIL result has out-of-phase wavelengths for 800 nm to 1600 nm. This is more consistent with Harder et al. [2009] result than the models.
SC In-Phase
SC Out-of-Phase

Tom WoodsSun-Climate 2018 Meeting 16
Comparison of SORCE SIM and OMI Results
• SIM and OMI agree best for the Mg and Ca chromosphericemissions near 280 nm and 390 nm.
• Solar cycle variability longer than 400 nm are less certain.
SORCE SIM200-2400 nm
OMI solar265-500 nm

Tom WoodsSun-Climate 2018 Meeting 17
Comparisons of SORCE SIM and OMI Time Series
• SORCE SIM and SOLSTICE indicate more MUV variability
• SORCE & OMI agree well at some wavelengths
• OMI also has out-of-phase results
Tom WoodsSun-Climate 2018 Meeting 18
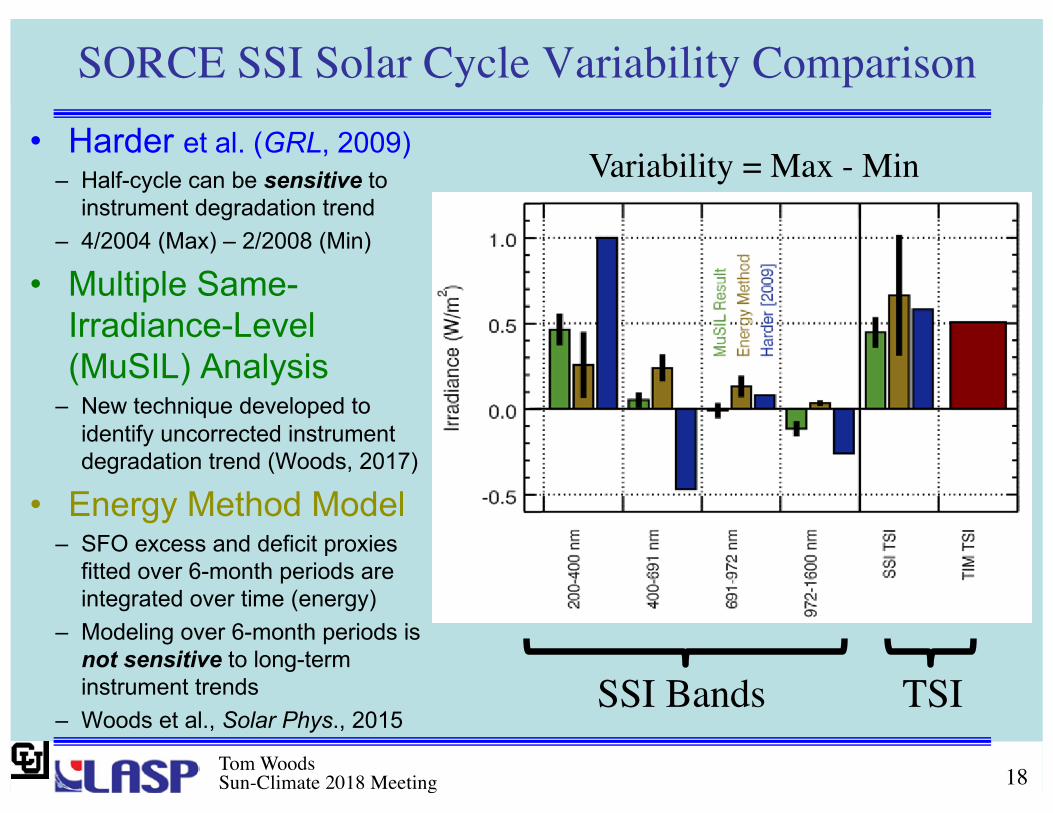
SORCE SSI Solar Cycle Variability Comparison• Harder et al. (GRL, 2009)
– Half-cycle can be sensitive to instrument degradation trend
– 4/2004 (Max) – 2/2008 (Min)
• Multiple Same-Irradiance-Level (MuSIL) Analysis
– New technique developed to identify uncorrected instrument degradation trend (Woods, 2017)
• Energy Method Model– SFO excess and deficit proxies
fitted over 6-month periods are integrated over time (energy)
– Modeling over 6-month periods is not sensitive to long-term instrument trends
– Woods et al., Solar Phys., 2015
Variability = Max - Min
TSISSI Bands

Tom WoodsSun-Climate 2018 Meeting 19
Summary of Results• New solar cycle variability results show better consistency
between different solar cycles and different measurements from 6 nm to 1600 nm for 2002-2017 (SC 23-24).
• Future work is to extend the MuSIL technique for other data sets during SC 21-22 and then to improve the SSI composite record from the 1970s to the present.
• More details about the MuSIL method are available in a paper:– Woods et al., Decoupling Solar Variability and Instrument Trends
using the Multiple Same-Irradiance-Level (MuSIL) Analysis Technique, Solar Physics, in review, 2018
Solar Cycle Instrument Spectral RangeSC 22 UARS SUSIM & SOLSTICE 117-410 nmSC 21 SME / SBUV 115-300 nm / 160-400 nm