
Decomposing rhythm processing: electroencephalography of perceived · PDF fileDecomposing...
12
Psychological Research (2011) 75:95–106 DOI 10.1007/s00426-010-0293-4 123 ORIGINAL ARTICLE Decomposing rhythm processing: electroencephalography of perceived and self-imposed rhythmic patterns Rebecca S. Schaefer · Rutger J. Vlek · Peter Desain Received: 26 January 2010 / Accepted: 31 May 2010 / Published online: 24 June 2010 © The Author(s) 2010. This article is published with open access at Springerlink.com Abstract Perceiving musical rhythms can be considered a process of attentional chunking over time, driven by accent patterns. A rhythmic structure can also be generated internally, by placing a subjective accent pattern on an isochronous stimulus train. Here, we investigate the event- related potential (ERP) signature of actual and subjective accents, thus disentangling low-level perceptual processes from the cognitive aspects of rhythm processing. The results show diVerences between accented and unaccented events, but also show that diVerent types of unaccented events can be distinguished, revealing additional structure within the rhythmic pattern. This structure is further inves- tigated by decomposing the ERP into subcomponents, using principal component analysis. In this way, the pro- cesses that are common for perceiving a pattern and self- generating it are isolated, and can be visualized for the tasks separately. The results suggest that top-down pro- cesses have a substantial role in the cerebral mechanisms of rhythm processing, independent of an externally presented stimulus. Introduction Many of the auditory patterns we perceive around us, such as speech and music, require the structuring of information over time for eYcient perception. Perceiving regularities is essential for interpretation of this information, and leads to predictive processing, which, in turn, is needed for goal- directed behavior (for a recent overview, see Winkler, Denham, & Nelken, 2009). In music listening, it is widely believed that the conWrmation and violation of expectations are crucial for a musical piece’s own characteristics and what makes it speciWc and enjoyable (Huron, 2006). Events in auditory patterns such as musical rhythms are believed to be processed more eYciently when their posi- tion in time can be predicted, described in dynamic attend- ing theory (Drake, Jones, & Baruch, 2000; Jones & Boltz, 1989) as well as other theories of Xuctuating expectation levels (Desain, 1992). The main premise is that expectancy levels can be manipulated by presenting temporal patterns varying in regularity, thus making impending events more or less predictable. This is also reXected in computational models of rhythm processing, such as the coupled oscillator model presented by Large and colleagues (Large & Jones, 1999; Large & Kolen, 1995), in which the percept of a rhythm is built up out of multiple oscillators with diVerent period lengths, related to diVerent hierarchical levels of the rhythm. These models include a feedback loop in which highly expected events raise the ‘conWdence’ of the oscilla- tor, contributing more to subsequent expectancy. Conse- quently, these models can predict how in a very simple train of stimuli (e.g. an isochronous rhythm) chunking of a number of events may occur, so that speciWc future events incur a higher expectancy. This continues even if the actual accent is no longer present in the stimulus, making the per- cept of a pulse in the event train quite robust (see Fig. 1 for a graphical representation of this process). In the concept of dynamic attending as proposed by Jones and Boltz (1989) and Drake et al. (2000), listeners willfully give more weight to the oscillator we choose, thus attending to diVerent hier- archical levels of the rhythmic structure (i.e. the beat, bar or R. S. Schaefer (&) · R. J. Vlek · P. Desain Donders Institute for Brain, Cognition and Behaviour, Centre for Cognition, Radboud University, Montessorilaan 3, 6525 HE Nijmegen, The Netherlands e-mail: [email protected]
Transcript of Decomposing rhythm processing: electroencephalography of perceived · PDF fileDecomposing...
Psychological Research (2011) 75:95–106
DOI 10.1007/s00426-010-0293-4ORIGINAL ARTICLE
Decomposing rhythm processing: electroencephalography of perceived and self-imposed rhythmic patterns
Rebecca S. Schaefer · Rutger J. Vlek · Peter Desain
Received: 26 January 2010 / Accepted: 31 May 2010 / Published online: 24 June 2010© The Author(s) 2010. This article is published with open access at Springerlink.com
Abstract Perceiving musical rhythms can be considereda process of attentional chunking over time, driven byaccent patterns. A rhythmic structure can also be generatedinternally, by placing a subjective accent pattern on anisochronous stimulus train. Here, we investigate the event-related potential (ERP) signature of actual and subjectiveaccents, thus disentangling low-level perceptual processesfrom the cognitive aspects of rhythm processing. Theresults show diVerences between accented and unaccentedevents, but also show that diVerent types of unaccentedevents can be distinguished, revealing additional structurewithin the rhythmic pattern. This structure is further inves-tigated by decomposing the ERP into subcomponents,using principal component analysis. In this way, the pro-cesses that are common for perceiving a pattern and self-generating it are isolated, and can be visualized for thetasks separately. The results suggest that top-down pro-cesses have a substantial role in the cerebral mechanisms ofrhythm processing, independent of an externally presentedstimulus.
Introduction
Many of the auditory patterns we perceive around us, suchas speech and music, require the structuring of informationover time for eYcient perception. Perceiving regularities is
essential for interpretation of this information, and leads topredictive processing, which, in turn, is needed for goal-directed behavior (for a recent overview, see Winkler,Denham, & Nelken, 2009). In music listening, it is widelybelieved that the conWrmation and violation of expectationsare crucial for a musical piece’s own characteristics andwhat makes it speciWc and enjoyable (Huron, 2006).
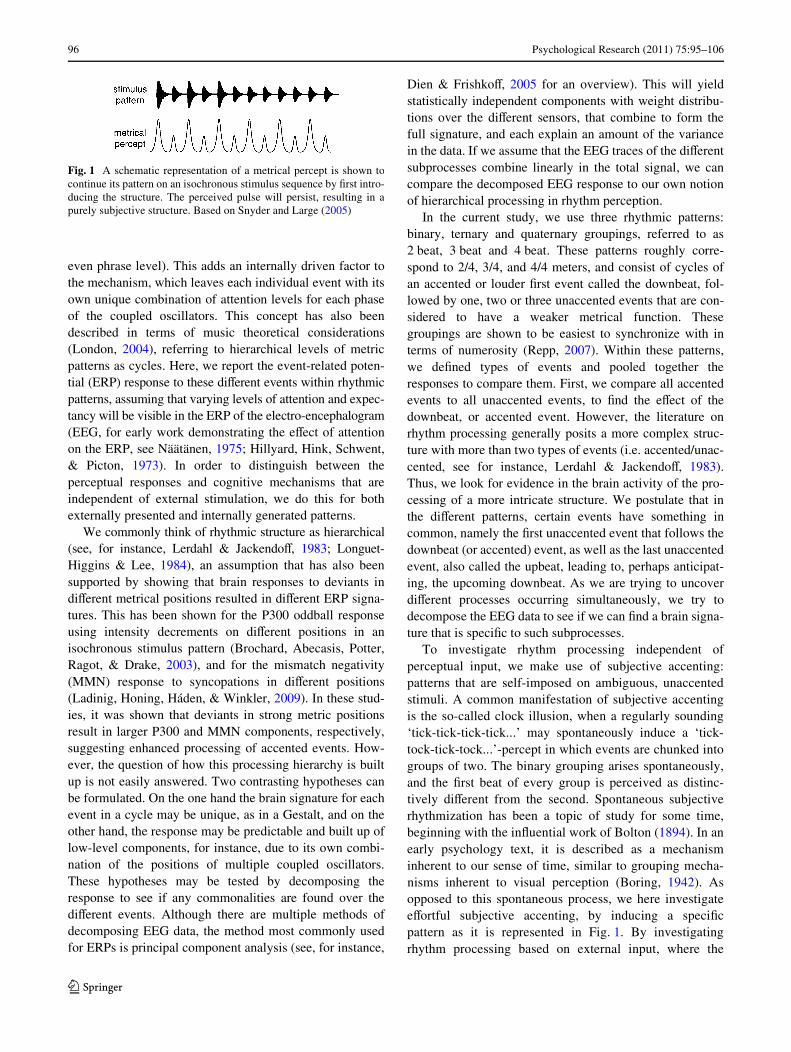
Events in auditory patterns such as musical rhythms arebelieved to be processed more eYciently when their posi-tion in time can be predicted, described in dynamic attend-ing theory (Drake, Jones, & Baruch, 2000; Jones & Boltz,1989) as well as other theories of Xuctuating expectationlevels (Desain, 1992). The main premise is that expectancylevels can be manipulated by presenting temporal patternsvarying in regularity, thus making impending events moreor less predictable. This is also reXected in computationalmodels of rhythm processing, such as the coupled oscillatormodel presented by Large and colleagues (Large & Jones,1999; Large & Kolen, 1995), in which the percept of arhythm is built up out of multiple oscillators with diVerentperiod lengths, related to diVerent hierarchical levels of therhythm. These models include a feedback loop in whichhighly expected events raise the ‘conWdence’ of the oscilla-tor, contributing more to subsequent expectancy. Conse-quently, these models can predict how in a very simpletrain of stimuli (e.g. an isochronous rhythm) chunking of anumber of events may occur, so that speciWc future eventsincur a higher expectancy. This continues even if the actualaccent is no longer present in the stimulus, making the per-cept of a pulse in the event train quite robust (see Fig. 1 fora graphical representation of this process). In the concept ofdynamic attending as proposed by Jones and Boltz (1989)and Drake et al. (2000), listeners willfully give more weightto the oscillator we choose, thus attending to diVerent hier-archical levels of the rhythmic structure (i.e. the beat, bar or
R. S. Schaefer (&) · R. J. Vlek · P. DesainDonders Institute for Brain, Cognition and Behaviour, Centre for Cognition, Radboud University, Montessorilaan 3, 6525 HE Nijmegen, The Netherlandse-mail: [email protected]
123
96 Psychological Research (2011) 75:95–106
even phrase level). This adds an internally driven factor tothe mechanism, which leaves each individual event with itsown unique combination of attention levels for each phaseof the coupled oscillators. This concept has also beendescribed in terms of music theoretical considerations(London, 2004), referring to hierarchical levels of metricpatterns as cycles. Here, we report the event-related poten-tial (ERP) response to these diVerent events within rhythmicpatterns, assuming that varying levels of attention and expec-tancy will be visible in the ERP of the electro-encephalogram(EEG, for early work demonstrating the eVect of attentionon the ERP, see Näätänen, 1975; Hillyard, Hink, Schwent,& Picton, 1973). In order to distinguish between theperceptual responses and cognitive mechanisms that areindependent of external stimulation, we do this for bothexternally presented and internally generated patterns.
We commonly think of rhythmic structure as hierarchical(see, for instance, Lerdahl & JackendoV, 1983; Longuet-Higgins & Lee, 1984), an assumption that has also beensupported by showing that brain responses to deviants indiVerent metrical positions resulted in diVerent ERP signa-tures. This has been shown for the P300 oddball responseusing intensity decrements on diVerent positions in anisochronous stimulus pattern (Brochard, Abecasis, Potter,Ragot, & Drake, 2003), and for the mismatch negativity(MMN) response to syncopations in diVerent positions(Ladinig, Honing, Háden, & Winkler, 2009). In these stud-ies, it was shown that deviants in strong metric positionsresult in larger P300 and MMN components, respectively,suggesting enhanced processing of accented events. How-ever, the question of how this processing hierarchy is builtup is not easily answered. Two contrasting hypotheses canbe formulated. On the one hand the brain signature for eachevent in a cycle may be unique, as in a Gestalt, and on theother hand, the response may be predictable and built up oflow-level components, for instance, due to its own combi-nation of the positions of multiple coupled oscillators.These hypotheses may be tested by decomposing theresponse to see if any commonalities are found over thediVerent events. Although there are multiple methods ofdecomposing EEG data, the method most commonly usedfor ERPs is principal component analysis (see, for instance,
Dien & FrishkoV, 2005 for an overview). This will yieldstatistically independent components with weight distribu-tions over the diVerent sensors, that combine to form thefull signature, and each explain an amount of the variancein the data. If we assume that the EEG traces of the diVerentsubprocesses combine linearly in the total signal, we cancompare the decomposed EEG response to our own notionof hierarchical processing in rhythm perception.
In the current study, we use three rhythmic patterns:binary, ternary and quaternary groupings, referred to as2 beat, 3 beat and 4 beat. These patterns roughly corre-spond to 2/4, 3/4, and 4/4 meters, and consist of cycles ofan accented or louder Wrst event called the downbeat, fol-lowed by one, two or three unaccented events that are con-sidered to have a weaker metrical function. Thesegroupings are shown to be easiest to synchronize with interms of numerosity (Repp, 2007). Within these patterns,we deWned types of events and pooled together theresponses to compare them. First, we compare all accentedevents to all unaccented events, to Wnd the eVect of thedownbeat, or accented event. However, the literature onrhythm processing generally posits a more complex struc-ture with more than two types of events (i.e. accented/unac-cented, see for instance, Lerdahl & JackendoV, 1983).Thus, we look for evidence in the brain activity of the pro-cessing of a more intricate structure. We postulate that inthe diVerent patterns, certain events have something incommon, namely the Wrst unaccented event that follows thedownbeat (or accented) event, as well as the last unaccentedevent, also called the upbeat, leading to, perhaps anticipat-ing, the upcoming downbeat. As we are trying to uncoverdiVerent processes occurring simultaneously, we try todecompose the EEG data to see if we can Wnd a brain signa-ture that is speciWc to such subprocesses.
To investigate rhythm processing independent ofperceptual input, we make use of subjective accenting:patterns that are self-imposed on ambiguous, unaccentedstimuli. A common manifestation of subjective accentingis the so-called clock illusion, when a regularly sounding‘tick-tick-tick-tick...’ may spontaneously induce a ‘tick-tock-tick-tock...’-percept in which events are chunked intogroups of two. The binary grouping arises spontaneously,and the Wrst beat of every group is perceived as distinc-tively diVerent from the second. Spontaneous subjectiverhythmization has been a topic of study for some time,beginning with the inXuential work of Bolton (1894). In anearly psychology text, it is described as a mechanisminherent to our sense of time, similar to grouping mecha-nisms inherent to visual perception (Boring, 1942). Asopposed to this spontaneous process, we here investigateeVortful subjective accenting, by inducing a speciWcpattern as it is represented in Fig. 1. By investigatingrhythm processing based on external input, where the
Fig. 1 A schematic representation of a metrical percept is shown tocontinue its pattern on an isochronous stimulus sequence by Wrst intro-ducing the structure. The perceived pulse will persist, resulting in apurely subjective structure. Based on Snyder and Large (2005)
123
Psychological Research (2011) 75:95–106 97
pattern is present in the stimulus, as well as generation of arhythmic pattern in the absence of any accent in the stimu-lus, we can Wnd processing mechanisms that take placeindependently of physical accenting patterns. Thoughthere will be many shared top-down processes active inboth tasks, we refer to the instructional phase as the‘perception’-task, and the latter as the ‘imagery’-task. Byperforming the PCA decomposition over the averagedresponse to both tasks, brain activity patterns that arecommon to the two tasks may be isolated and interpreted.In this way, the risk of an eVect of the instructional eVectadding to the perception task is minimized.
This leads us to a number of hypotheses of rhythm per-ception, the Wrst and most important one being that thediVerence between an accented and an unaccented event isdetectable in the brain signal. Secondly, we pose that not allunaccented events are equal, more speciWcally, we hypoth-esize that events with a similar function in the pattern willshow similarities in the EEG response. The unaccentedevent that follows an accented event (the Wrst unaccented)has a distinctly diVerent function than the upbeat leading upto an accented event (the last unaccented). The former mayhave some carry-over eVect from the downbeat, but is gen-erally considered a weak beat in the pattern, whereas thelatter may show some response reXecting the expectation ofthe downbeat that is approaching. Here, we may see a con-Xict of rhythmic function, in which the last position in thepattern is never hierarchically important, versus a morecognitive driven view that this event should get most of theanticipatory response leading to the accent. This cognitiveview would then result in a variation of the expectation-induced negative deXection in the EEG, the so-called con-tingent negative variation (CNV, Walter, Cooper, Aldridge,McCallum, & Winter, 1964). However, this is a slow com-ponent generally seen to start at up to 1,000 ms before theexpected stimulus (see, for instance, Hamano et al., 1997;but also Chen et al., 2010, for an example of an earlier man-ifestation). Even so, later (250–500 ms) negative responsesare often seen in ERPs in musical or rhythmic contexts(Pearce, Herrojo Ruiz, Kapasi, Wiggins, & Bhattacharya,2010; Jongsma et al., 2005). Another indication of thestrength of a metric event may be the presence of a process-ing negativity (Näätänen, 1982), an early negative responsethought to reXect the recruitment of extra attentionalresources. Finally, to investigate the role of external inputin rhythm processing, we look at both the externally cued(‘perceived’), and internally generated (referred to as‘imagined’ or subjective) patterns.
Previous work looking into ERP responses to events ina speciWc metrical context has focused mainly on intensitydecrement deviants in diVerent metric positions added toidentical or physically accented stimulus trains (Brochardet al., 2003; Abecasis, Brochard, Granot, & Drake, 2005),
resulting in diVerent P300-responses for diVerent metricpositions, namely larger P300 amplitudes for accentedevents in parietal regions. This conWrms the spontaneousnature of this process, as no instruction to superimpose astructure was given, and suggests enhanced processing foraccented events. This is supported by more recent workfrom this group, showing that an early, small processingnegativity may be seen at the left mastoid channel foraccented events in both standard and deviant forms (Potter,Fenwick, Abecasis, & Brochard, 2009). To disentangle thetask of deviancy processing from the mechanism of themetric cycle itself, we here look at responses to physicallyidentical sounds (except for the accent in the perceptiontask) in diVerent contexts. As such, no clear predictionscan be made for the ERP response to a pattern withoutdeviants. In a recent study, Fujioka, Zendel, and Ross(2010) investigated the brain response to diVerent subjec-tive metrical events as measured with magneto-encepha-lography (MEG), focusing on accented events (downbeats)and the last unaccented events (termed upbeats). Using2-beat and 3-beat patterns and spatial-Wltering source anal-ysis, they found that responses from hippocampus, basalganglia, and auditory and association cortices showed asigniWcant contrast between the up- and downbeats of thetwo patterns while listening to identical click stimuli.However, they did not combine events from diVerent pat-terns to Wnd any commonalities between them. Anotherstudy that also focused speciWcally on voluntary accentingof ambiguous stimuli, also using MEG, found no diVer-ence in the event-related Weld (ERF, presented as low-frequency content from 1–10 Hz) between subjectivelyaccented and non-accented events (Iversen, Repp, & Patel,2009).
Based on these studies, we expect the actual accents inthe stimulus to result in an increased N1 amplitude (Näätänen& Picton, 1987) due to the intensity diVerences caused bythe accent, not present in the unaccented events. Addition-ally, the diVerent spectral properties of the accent mayenhance the P2 response (Meyer, Baumann, & Jancke,2006). As for the subjective accents, the literature does notoVer a clear-cut prediction. Considering the diVerent typesof unaccented event, we expect that if an anticipatoryresponse for the accent is present in the last unaccentedevents, this will not be present in the other groups ofevents, thus predicting the Wrst unaccented event not toshow either the increased N1/P2 or any sign of anticipa-tion. As no previous work has, to our knowledge, directlycompared ERP-responses to diVerent unaccented events ina rhythmic pattern, this part of the work is still exploratory.By comparing events with similar functions we mayuncover common processes over diVerent rhythmic patterns,which can be further investigated by decomposing theresponses.
123
98 Psychological Research (2011) 75:95–106
Method
Participants
Ten volunteers, recruited at the Radboud University ofNijmegen, participated in the experiment. Each gave theirinformed consent to participate. All participants were right-handed and had normal or corrected-to-normal vision.None of them had a known history of neurological illness.Musical training was not a criterium for inclusion or exclu-sion in the study, three of the participants had received for-mal music training but none were professional musicians.Two datasets were rejected due to a disproportionate num-ber of artifacts (see below for procedure). The reportedanalyses were carried out for the remaining eight partici-pants (5 male, mean age 38.2, SD 11.6).
Stimuli and equipment
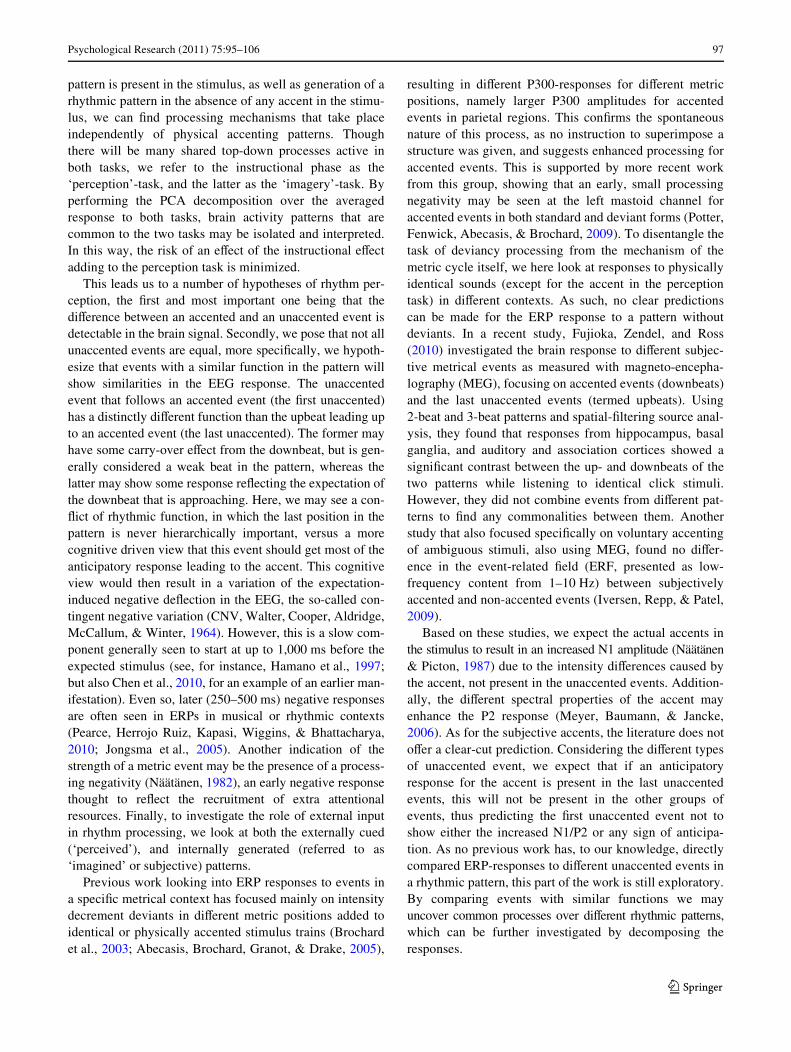
Three stimulus patterns were used: binary, ternary and qua-ternary rhythms, consisting of 2-, 3-, and 4-beat cycles. Aswe expected the imagery response to be much smaller thanthe perception response, twice as much data were collectedfor this task. The stimulus sequences were constructed tocollect a maximal amount of imagery data, and were madeup of four parts: a perception part that also functioned as aninstruction, a fade into the imagery part, the imagery partitself, and a probe accent as an attention check at the end,explained further in the procedure. A schematic example ofone of the sequences is shown in Fig. 2. For everysequence, the metronome tick was played throughout andfunctioned as the time-lock while keeping the tempo stable.The accents were positioned to establish a pattern, every 2,3 or 4 metronome beats. After three repeats there was onecycle in which the accent is played softly (fading) and afterthis no accents are sounded anymore. The subjects wereinstructed to imagine the accent pattern continuing. At theend of the sequence an extra accent (probe) was played.This probe accent could appear at any point in the pattern,and participants had to indicate whether this probe
coincided with an imagined accent or not. This task wasadded to control for attention and to check whether the sub-ject was still on track. While the stimulus played, a Wxationcross was shown on a screen. All sequences were con-structed this way, only diVering in the number of events percycle. The stimuli can be listened to at http://www.nici.ru.nl/mmm.
EEG was recorded using a Biosemi Active-Two systemwith 256 EEG channels mounted into an elastic cap, and sixauxiliary channels (double mastoids, horizontal and verticalEOG), and sampled at 512 Hz. The Wxation cross andinstructions were displayed on a 15�� TFT screen, and stim-uli were played through passive speakers (Monacor, typeMKS-28/WS) at a comfortable listening level, adjusted tothe preference of the participant. The stimuli were pro-grammed in POCO (Desain & Honing, 1992) and theresulting MIDI Wle was converted to audio by QuicktimeMusical Instruments using general MIDI commands forlow bongo (key 61), velocity 0.7 £ 127 as the metronomeand high wood block (key 76), velocity 0.8 £ 127 as theaccents. The sounds were presented with an inter-onsetinterval (IOI) of 500 ms and a duration of 200 ms. Theanalyses were performed in MATLAB (Mathworks,Natick, MA, USA), making use of the FieldTrip toolboxfor EEG/MEG-analysis (Donders Institute for Brain,Cognition and Behaviour, Radboud University Nijmegen, TheNetherlands. See http://www.ru.nl/neuroimaging/fieldtrip).
Procedure
Preceding the actual experiment, a practice session wascompleted, allowing participants to get used to the task andensure that they understood it. The practice trials weremade slightly easier, with a longer perception-phase andlonger fading period. To ensure good understanding of thetask, the practice procedure was determined as follows: acounter was set, which counted the correct answers to theprobe-tone task. Whenever a wrong answer was given, thecounter was set back two points, the practice block endedwhen the counter had a value of Wve. A Wxation cross waspresented at a varying interval before the start of every Wrstbeat, appearing between 1 and 1.8 s before the soundstarted, with a jittered duration to prevent the occurrence oftemporal expectation. This Wxation cross remained on thescreen for the entire sequence. Participants were instructedto neither move nor use motor imagery or inner speech, forinstance, by counting. Their speciWc instruction was toimagine the sound of the accent continuing after it hadfaded. The experimental task for the probe tone at the endof the sequence was to match it to the internally generatedpattern, and respond ‘yes’ to a congruent probe and ‘no’ toan incongruent probe accent through a button press. Oneblock in the experiment consisted of 12 sequences of each
Fig. 2 A schematic overview of a typical stimulus sequence, in thiscase a ternary beat pattern, with a probe on an unaccented position.With an IOI of 500 ms between events, the sequence consists of 3 per-ceived patterns or cycles, one transition or fade cycle, and Wve imagerycycles. As the Wrst cycle in each task is not used, two perception andfour imagery cycles per sequence are used for analysis. The sequencewas designed to induce an accenting pattern as is represented for abinary pattern in Fig. 1, but applicable to all the patterns used here
perception fade imagery response
0.5s
metronomeaccent
probe
time
123
Psychological Research (2011) 75:95–106 99
of these 2-, 3-, or 4-beat patterns, resulting in a total of 36randomized sequences. Four of these blocks were recordedper subject, yielding roughly 200 instances of every eventfor the imagery task and 100 for the perceptual task, nottaking into account any rejection of data due to artifacts.
Analyses
First, some preprocessing steps were taken. The raw EEGsignal, which was originally sampled at 512 Hz, was tem-porally down-sampled to a sampling frequency of 128 Hz.To segment the data, a time window of ¡50 to +450 mswas chosen around each metronome tick where 0 is thesound onset. These data segments of 500 s will from hereon be referred to as trials. Trials from a sequence with awrong answer to the probe accent task were rejected (onaverage 4 sequences per participant, amounting to 2.7% ofthe data). To avoid possible start-up or state-change eVects,the Wrst period of the perception or imagery pattern of asequence was not used for analyses (marked ‘start’ inFig. 2). Channels with poor signal quality were rejectedbased on the DC oVset, with a cut-oV of 35 mV, and a vari-ance of 500 �V)2. From the remaining data, the removedchannels were reconstructed by spherical spline interpola-tion (Perrin et al., 1989). After this a common average wassubtracted. If more than 25% of channels were rejected, thetrial was rejected as a whole. If more than 30% of trialswere rejected based on these criteria, the whole data set wasnot used. This resulted in exclusion of two participants andleft an average of 89 trials (SD 10.6) for every unique eventin the perception task, and 184 (SD 22.3) for imageryevents.
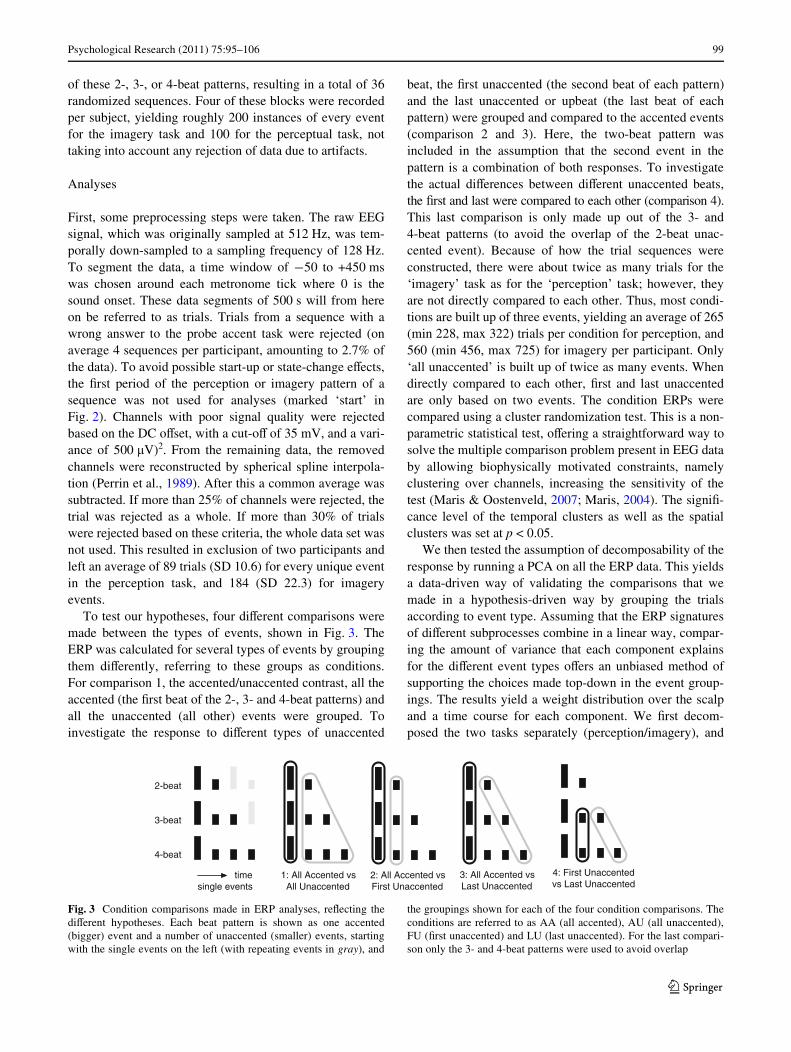
To test our hypotheses, four diVerent comparisons weremade between the types of events, shown in Fig. 3. TheERP was calculated for several types of events by groupingthem diVerently, referring to these groups as conditions.For comparison 1, the accented/unaccented contrast, all theaccented (the Wrst beat of the 2-, 3- and 4-beat patterns) andall the unaccented (all other) events were grouped. Toinvestigate the response to diVerent types of unaccented
beat, the Wrst unaccented (the second beat of each pattern)and the last unaccented or upbeat (the last beat of eachpattern) were grouped and compared to the accented events(comparison 2 and 3). Here, the two-beat pattern wasincluded in the assumption that the second event in thepattern is a combination of both responses. To investigatethe actual diVerences between diVerent unaccented beats,the Wrst and last were compared to each other (comparison 4).This last comparison is only made up out of the 3- and4-beat patterns (to avoid the overlap of the 2-beat unac-cented event). Because of how the trial sequences wereconstructed, there were about twice as many trials for the‘imagery’ task as for the ‘perception’ task; however, theyare not directly compared to each other. Thus, most condi-tions are built up of three events, yielding an average of 265(min 228, max 322) trials per condition for perception, and560 (min 456, max 725) for imagery per participant. Only‘all unaccented’ is built up of twice as many events. Whendirectly compared to each other, Wrst and last unaccentedare only based on two events. The condition ERPs werecompared using a cluster randomization test. This is a non-parametric statistical test, oVering a straightforward way tosolve the multiple comparison problem present in EEG databy allowing biophysically motivated constraints, namelyclustering over channels, increasing the sensitivity of thetest (Maris & Oostenveld, 2007; Maris, 2004). The signiW-cance level of the temporal clusters as well as the spatialclusters was set at p < 0.05.
We then tested the assumption of decomposability of theresponse by running a PCA on all the ERP data. This yieldsa data-driven way of validating the comparisons that wemade in a hypothesis-driven way by grouping the trialsaccording to event type. Assuming that the ERP signaturesof diVerent subprocesses combine in a linear way, compar-ing the amount of variance that each component explainsfor the diVerent event types oVers an unbiased method ofsupporting the choices made top-down in the event group-ings. The results yield a weight distribution over the scalpand a time course for each component. We Wrst decom-posed the two tasks separately (perception/imagery), and
Fig. 3 Condition comparisons made in ERP analyses, reXecting thediVerent hypotheses. Each beat pattern is shown as one accented(bigger) event and a number of unaccented (smaller) events, startingwith the single events on the left (with repeating events in gray), and
the groupings shown for each of the four condition comparisons. Theconditions are referred to as AA (all accented), AU (all unaccented),FU (Wrst unaccented) and LU (last unaccented). For the last compari-son only the 3- and 4-beat patterns were used to avoid overlap
2-beat
3-beat
4-beat
1: All Accented vs All Unaccented
4: First Unaccented vs Last Unaccented
2: All Accented vsFirst Unaccented
3: All Accented vs Last Unaccented
timesingle events
123
100 Psychological Research (2011) 75:95–106
then also decomposed the whole dataset as one task(rhythm processing). Running the PCA on the average ofthe perception and imagery data reveals the processes thatare common over the two tasks, again with the contributionof each condition to each component to see which compo-nent is active when. A cluster randomization test was per-formed on the contributions of each component to acondition ERP to see if the diVerence in contribution of acomponent to a condition was signiWcant.
Results
ERPs
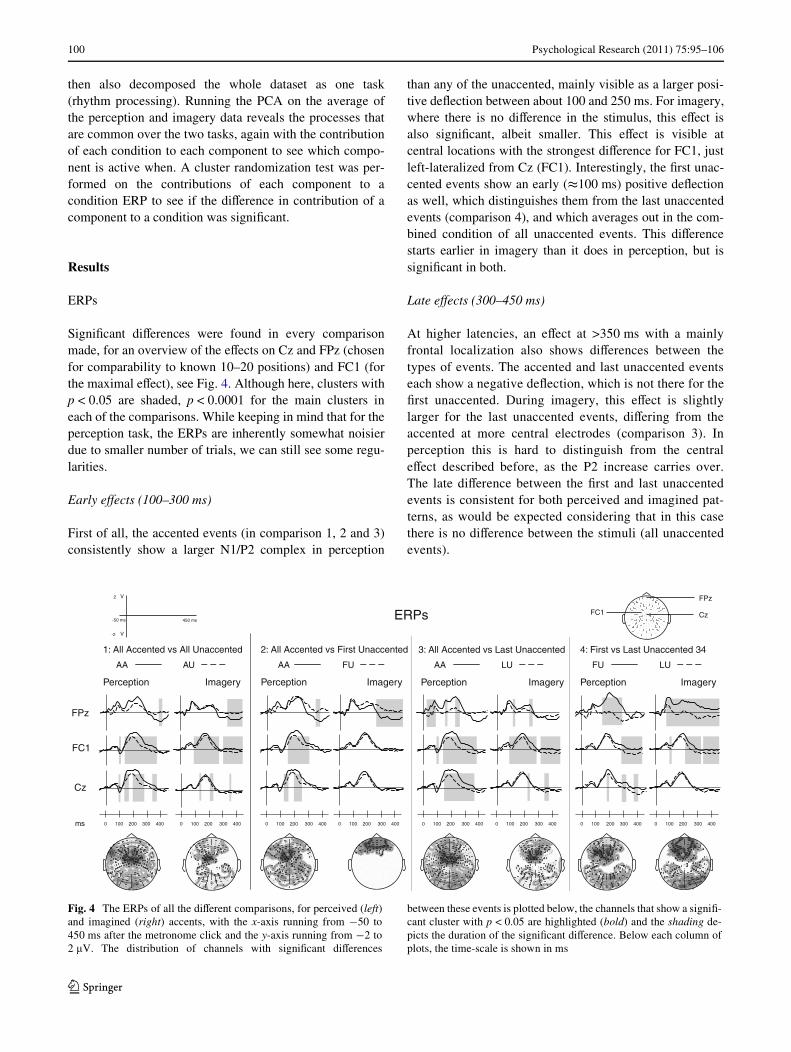
SigniWcant diVerences were found in every comparisonmade, for an overview of the eVects on Cz and FPz (chosenfor comparability to known 10–20 positions) and FC1 (forthe maximal eVect), see Fig. 4. Although here, clusters withp < 0.05 are shaded, p < 0.0001 for the main clusters ineach of the comparisons. While keeping in mind that for theperception task, the ERPs are inherently somewhat noisierdue to smaller number of trials, we can still see some regu-larities.
Early eVects (100–300 ms)
First of all, the accented events (in comparison 1, 2 and 3)consistently show a larger N1/P2 complex in perception
than any of the unaccented, mainly visible as a larger posi-tive deXection between about 100 and 250 ms. For imagery,where there is no diVerence in the stimulus, this eVect isalso signiWcant, albeit smaller. This eVect is visible atcentral locations with the strongest diVerence for FC1, justleft-lateralized from Cz (FC1). Interestingly, the Wrst unac-cented events show an early (t100 ms) positive deXectionas well, which distinguishes them from the last unaccentedevents (comparison 4), and which averages out in the com-bined condition of all unaccented events. This diVerencestarts earlier in imagery than it does in perception, but issigniWcant in both.
Late eVects (300–450 ms)
At higher latencies, an eVect at >350 ms with a mainlyfrontal localization also shows diVerences between thetypes of events. The accented and last unaccented eventseach show a negative deXection, which is not there for theWrst unaccented. During imagery, this eVect is slightlylarger for the last unaccented events, diVering from theaccented at more central electrodes (comparison 3). Inperception this is hard to distinguish from the centraleVect described before, as the P2 increase carries over.The late diVerence between the Wrst and last unaccentedevents is consistent for both perceived and imagined pat-terns, as would be expected considering that in this casethere is no diVerence between the stimuli (all unaccentedevents).
Fig. 4 The ERPs of all the diVerent comparisons, for perceived (left)and imagined (right) accents, with the x-axis running from ¡50 to450 ms after the metronome click and the y-axis running from ¡2 to2 �V. The distribution of channels with signiWcant diVerences
between these events is plotted below, the channels that show a signiW-cant cluster with p < 0.05 are highlighted (bold) and the shading de-picts the duration of the signiWcant diVerence. Below each column ofplots, the time-scale is shown in ms
ERPs
3: All Accented vs Last Unaccented
Perception Imagery
2: All Accented vs First Unaccented
Perception Imagery
1: All Accented vs All Unaccented
Perception Imagery
FPz
4: First vs Last Unaccented 34
Perception Imagery
2
-2
-50 ms 450 ms
FPz
FC1 Cz
AA LUAA FU
Cz
AA AU FU LU
FC1
0 100 200 300 400 0 100 200 300 400 0 100 200 300 400 0 100 200 300 400 0 100 200 300 400 0 100 200 300 400 0 100 200 300 400 0 100 200 300 400ms
µV
µV
123
Psychological Research (2011) 75:95–106 101
PCA
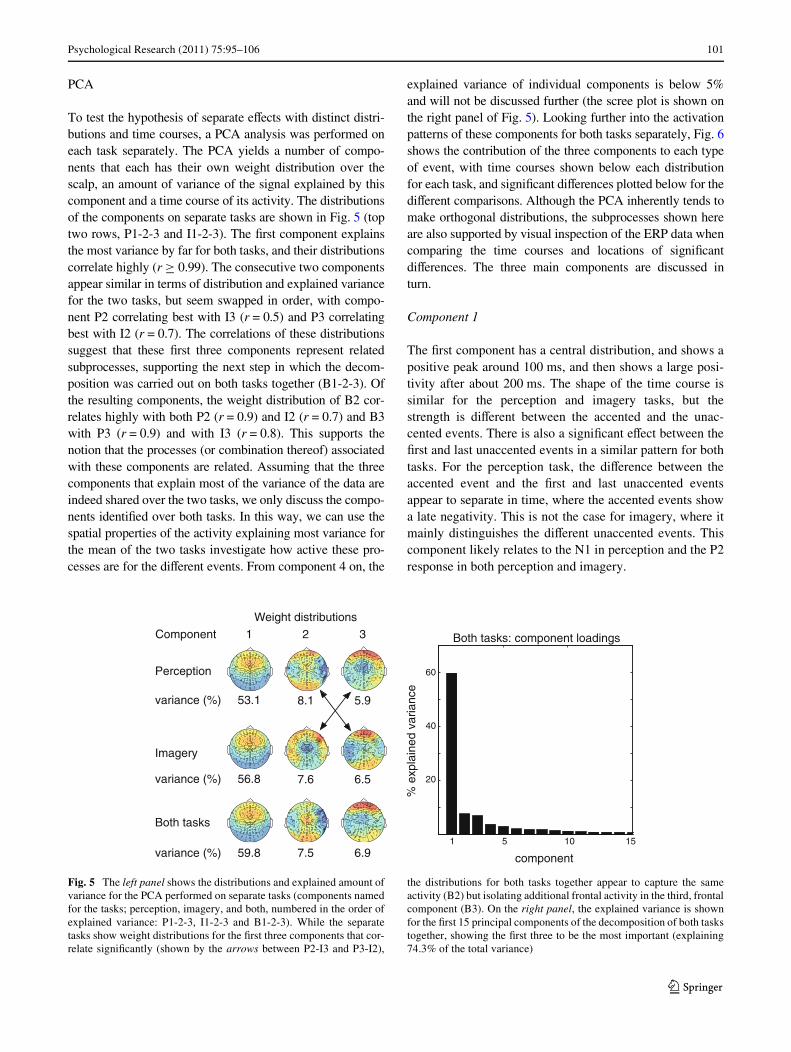
To test the hypothesis of separate eVects with distinct distri-butions and time courses, a PCA analysis was performed oneach task separately. The PCA yields a number of compo-nents that each has their own weight distribution over thescalp, an amount of variance of the signal explained by thiscomponent and a time course of its activity. The distributionsof the components on separate tasks are shown in Fig. 5 (toptwo rows, P1-2-3 and I1-2-3). The Wrst component explainsthe most variance by far for both tasks, and their distributionscorrelate highly (r ¸ 0.99). The consecutive two componentsappear similar in terms of distribution and explained variancefor the two tasks, but seem swapped in order, with compo-nent P2 correlating best with I3 (r = 0.5) and P3 correlatingbest with I2 (r = 0.7). The correlations of these distributionssuggest that these Wrst three components represent relatedsubprocesses, supporting the next step in which the decom-position was carried out on both tasks together (B1-2-3). Ofthe resulting components, the weight distribution of B2 cor-relates highly with both P2 (r = 0.9) and I2 (r = 0.7) and B3with P3 (r = 0.9) and with I3 (r = 0.8). This supports thenotion that the processes (or combination thereof) associatedwith these components are related. Assuming that the threecomponents that explain most of the variance of the data areindeed shared over the two tasks, we only discuss the compo-nents identiWed over both tasks. In this way, we can use thespatial properties of the activity explaining most variance forthe mean of the two tasks investigate how active these pro-cesses are for the diVerent events. From component 4 on, the
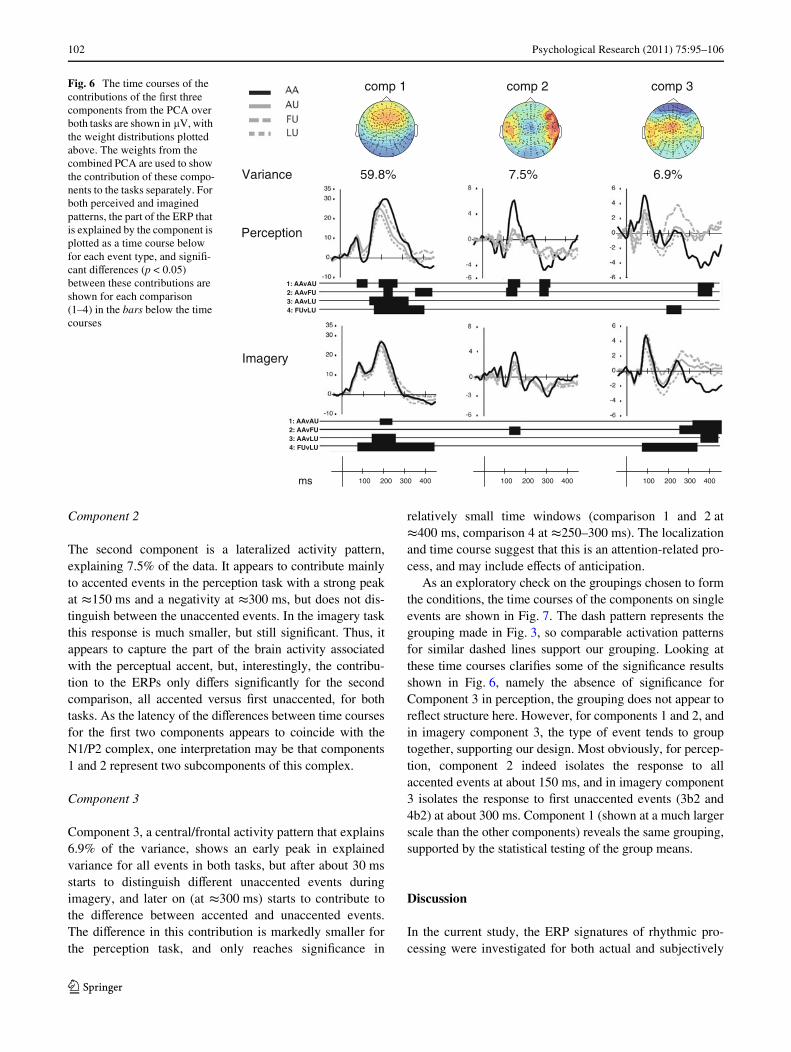
explained variance of individual components is below 5%and will not be discussed further (the scree plot is shown onthe right panel of Fig. 5). Looking further into the activationpatterns of these components for both tasks separately, Fig. 6shows the contribution of the three components to each typeof event, with time courses shown below each distributionfor each task, and signiWcant diVerences plotted below for thediVerent comparisons. Although the PCA inherently tends tomake orthogonal distributions, the subprocesses shown hereare also supported by visual inspection of the ERP data whencomparing the time courses and locations of signiWcantdiVerences. The three main components are discussed inturn.
Component 1
The Wrst component has a central distribution, and shows apositive peak around 100 ms, and then shows a large posi-tivity after about 200 ms. The shape of the time course issimilar for the perception and imagery tasks, but thestrength is diVerent between the accented and the unac-cented events. There is also a signiWcant eVect between theWrst and last unaccented events in a similar pattern for bothtasks. For the perception task, the diVerence between theaccented event and the Wrst and last unaccented eventsappear to separate in time, where the accented events showa late negativity. This is not the case for imagery, where itmainly distinguishes the diVerent unaccented events. Thiscomponent likely relates to the N1 in perception and the P2response in both perception and imagery.
Fig. 5 The left panel shows the distributions and explained amount ofvariance for the PCA performed on separate tasks (components namedfor the tasks; perception, imagery, and both, numbered in the order ofexplained variance: P1-2-3, I1-2-3 and B1-2-3). While the separatetasks show weight distributions for the Wrst three components that cor-relate signiWcantly (shown by the arrows between P2-I3 and P3-I2),
the distributions for both tasks together appear to capture the sameactivity (B2) but isolating additional frontal activity in the third, frontalcomponent (B3). On the right panel, the explained variance is shownfor the Wrst 15 principal components of the decomposition of both taskstogether, showing the Wrst three to be the most important (explaining74.3% of the total variance)
Imagery
Perception
variance (%)
variance (%)
1
56.8
53.1
2
7.6
8.1
3
6.5
5.9
59.8 7.5 6.9
Both tasks
variance (%)
Component
0 5 10 150
10
20
30
40
50
60
70
1 5 10 15
20
40
60
% e
xpla
ined
var
ianc
e
component
Both tasks: component loadings
Weight distributions
123
102 Psychological Research (2011) 75:95–106
Component 2
The second component is a lateralized activity pattern,explaining 7.5% of the data. It appears to contribute mainlyto accented events in the perception task with a strong peakat t150 ms and a negativity at t300 ms, but does not dis-tinguish between the unaccented events. In the imagery taskthis response is much smaller, but still signiWcant. Thus, itappears to capture the part of the brain activity associatedwith the perceptual accent, but, interestingly, the contribu-tion to the ERPs only diVers signiWcantly for the secondcomparison, all accented versus Wrst unaccented, for bothtasks. As the latency of the diVerences between time coursesfor the Wrst two components appears to coincide with theN1/P2 complex, one interpretation may be that components1 and 2 represent two subcomponents of this complex.
Component 3
Component 3, a central/frontal activity pattern that explains6.9% of the variance, shows an early peak in explainedvariance for all events in both tasks, but after about 30 msstarts to distinguish diVerent unaccented events duringimagery, and later on (at t300 ms) starts to contribute tothe diVerence between accented and unaccented events.The diVerence in this contribution is markedly smaller forthe perception task, and only reaches signiWcance in
relatively small time windows (comparison 1 and 2 att400 ms, comparison 4 at t250–300 ms). The localizationand time course suggest that this is an attention-related pro-cess, and may include eVects of anticipation.
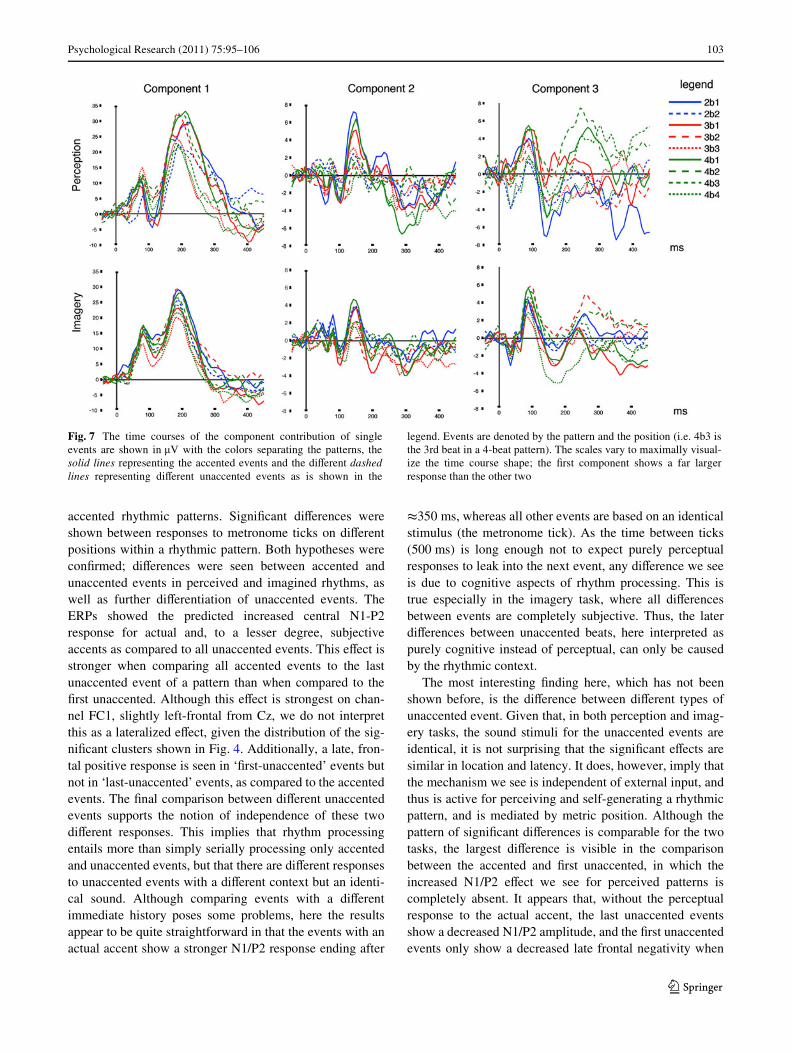
As an exploratory check on the groupings chosen to formthe conditions, the time courses of the components on singleevents are shown in Fig. 7. The dash pattern represents thegrouping made in Fig. 3, so comparable activation patternsfor similar dashed lines support our grouping. Looking atthese time courses clariWes some of the signiWcance resultsshown in Fig. 6, namely the absence of signiWcance forComponent 3 in perception, the grouping does not appear toreXect structure here. However, for components 1 and 2, andin imagery component 3, the type of event tends to grouptogether, supporting our design. Most obviously, for percep-tion, component 2 indeed isolates the response to allaccented events at about 150 ms, and in imagery component3 isolates the response to Wrst unaccented events (3b2 and4b2) at about 300 ms. Component 1 (shown at a much largerscale than the other components) reveals the same grouping,supported by the statistical testing of the group means.
Discussion
In the current study, the ERP signatures of rhythmic pro-cessing were investigated for both actual and subjectively
Fig. 6 The time courses of the contributions of the Wrst three components from the PCA over both tasks are shown in �V, with the weight distributions plotted above. The weights from the combined PCA are used to show the contribution of these compo-nents to the tasks separately. For both perceived and imagined patterns, the part of the ERP that is explained by the component is plotted as a time course below for each event type, and signiW-cant diVerences (p < 0.05) between these contributions are shown for each comparison (1–4) in the bars below the time courses
Perception
Imagery
comp 1 comp 2 comp 3
Variance 59.8% 7.5% 6.9%
1: AAvAU2: AAvFU3: AAvLU4: FUvLU
1: AAvAU2: AAvFU3: AAvLU4: FUvLU
100 200 300 400 100 200 300 400 100 200 300 400ms
123
Psychological Research (2011) 75:95–106 103
accented rhythmic patterns. SigniWcant diVerences wereshown between responses to metronome ticks on diVerentpositions within a rhythmic pattern. Both hypotheses wereconWrmed; diVerences were seen between accented andunaccented events in perceived and imagined rhythms, aswell as further diVerentiation of unaccented events. TheERPs showed the predicted increased central N1-P2response for actual and, to a lesser degree, subjectiveaccents as compared to all unaccented events. This eVect isstronger when comparing all accented events to the lastunaccented event of a pattern than when compared to theWrst unaccented. Although this eVect is strongest on chan-nel FC1, slightly left-frontal from Cz, we do not interpretthis as a lateralized eVect, given the distribution of the sig-niWcant clusters shown in Fig. 4. Additionally, a late, fron-tal positive response is seen in ‘Wrst-unaccented’ events butnot in ‘last-unaccented’ events, as compared to the accentedevents. The Wnal comparison between diVerent unaccentedevents supports the notion of independence of these twodiVerent responses. This implies that rhythm processingentails more than simply serially processing only accentedand unaccented events, but that there are diVerent responsesto unaccented events with a diVerent context but an identi-cal sound. Although comparing events with a diVerentimmediate history poses some problems, here the resultsappear to be quite straightforward in that the events with anactual accent show a stronger N1/P2 response ending after
t350 ms, whereas all other events are based on an identicalstimulus (the metronome tick). As the time between ticks(500 ms) is long enough not to expect purely perceptualresponses to leak into the next event, any diVerence we seeis due to cognitive aspects of rhythm processing. This istrue especially in the imagery task, where all diVerencesbetween events are completely subjective. Thus, the laterdiVerences between unaccented beats, here interpreted aspurely cognitive instead of perceptual, can only be causedby the rhythmic context.
The most interesting Wnding here, which has not beenshown before, is the diVerence between diVerent types ofunaccented event. Given that, in both perception and imag-ery tasks, the sound stimuli for the unaccented events areidentical, it is not surprising that the signiWcant eVects aresimilar in location and latency. It does, however, imply thatthe mechanism we see is independent of external input, andthus is active for perceiving and self-generating a rhythmicpattern, and is mediated by metric position. Although thepattern of signiWcant diVerences is comparable for the twotasks, the largest diVerence is visible in the comparisonbetween the accented and Wrst unaccented, in which theincreased N1/P2 eVect we see for perceived patterns iscompletely absent. It appears that, without the perceptualresponse to the actual accent, the last unaccented eventsshow a decreased N1/P2 amplitude, and the Wrst unaccentedevents only show a decreased late frontal negativity when
Fig. 7 The time courses of the component contribution of singleevents are shown in �V with the colors separating the patterns, thesolid lines representing the accented events and the diVerent dashedlines representing diVerent unaccented events as is shown in the
legend. Events are denoted by the pattern and the position (i.e. 4b3 isthe 3rd beat in a 4-beat pattern). The scales vary to maximally visual-ize the time course shape; the Wrst component shows a far largerresponse than the other two
123
104 Psychological Research (2011) 75:95–106
compared to accented events. Although their interpretationis not straightforward, the impression of two distinct pro-cesses is given.
This hypothesis was tested by decomposing the ERPdata with PCA. The distributions of the components of thediVerent tasks separately (perception and imagery) corre-late highly, which supports the validity of decomposing thetwo tasks together, namely rhythm processing, with orwithout external input. This is likely a composite process,including elements of mnemonic processing, tempo track-ing, regularity detection, expectancy generation and others.The Wrst three components explain almost 75% of the totalvariance. The distributions found for the diVerent subcom-ponents connect well with the existing literature. Kuck,Grossbach, Bangert, and Altenmüller (2003) found, whenresearching the distributions of rhythm and meter process-ing, that there was sustained cortical activation over bilat-eral frontal and temporal brain regions, that did not diVermuch for the two tasks. The diVerent subcomponents ofaccenting were obviously present in their stimuli as well,and perhaps may also be decomposed. In a study concern-ing speech rhythm, Geiser, Zaehle, Jancke, and Meyer(2008) found that adding an explicit rhythm judgementtask, thus directing attention to the rhythmicity of the(spoken) stimulus, increased activity in the supplementarymotor areas and the inferior frontal gyrus, both bilaterally.These sources, related to the explicitness (i.e. directedattention) of a rhythmical task, may well be implicatedhere. However, more work is needed to conWrm this. Evenso, Geiser, Ziegler, Jancke, and Meyer (2009) separated outmeter and rhythm deviants and found the ERP response torhythmic deviants to be maximal in frontal areas, anddependent on directed attention, while meter changeselicited a response more centrally and laterally distributed.
To asses the activity of the processes explaining mostvariance over both tasks for each task individually, theirdistributions were used to visualize the activity for the twotasks separately. The time courses of the components showspeciWc activations for speciWc aspects of the rhythmicpatterns. The Wrst and biggest component contributes to theN1/P2 activity, also showing the Wrst unaccented event tobe more like an accented event than the last unaccentedevent. As this component explains around Wve times asmuch variance as the other two, for both tasks, the fact thata diVerence between the conditions is visible here providesthe main support for the grouping into event categories thatwas decided on. The second component appears to respondmainly to perceived accents, but does not distinguishbetween the accented events and the last unaccented events,likely also contributing to the increased N1/P2 complexseen in the ERP in perception. Then Wnally, the third com-ponent contributes to the later, more frontal eVect, distin-guishing well between unaccented events only in the
imagery task at a relatively early latency (t100 ms) andbetween the accented and all unaccented events a bit later(at t350 ms). Inspection of the contributions of singleevents to the diVerent components supports the groupingsof events used here, according to metric context, save forcomponent 3 in perception. This diVerence may be inter-preted as a result of increased focus or eVort during the self-generation of the rhythmic pattern in imagery which is notnecessarily there during perception. Alternatively, it maybe due to the smaller number of trials for the perceptiontask. The Wnding that decomposing both tasks together asone still yields interpretable results was unexpected, andindicates that the cognitive processing of rhythms, be theyexternally presented or internally generated, shares a com-mon mechanism. The relevance of the decomposition isobviously dependent on the assumption that the EEG tracesof the components combine linearly to form the total signal.Other methods (that make the same assumption) can also beused to decompose EEG data into subprocesses, such asICA (Makeig, Jung, Bell, Ghahremani, & Sejnowski, 1997)or linear regression (Hauk, Pulvermüller, Ford, Marslen-Wilson, & Davis, 2008; Schaefer, Desain, & Suppes,2009), and a solid comparison of these diVerent methodsmay be a subject of future work.
A number of assumptions made in the design may haveconsequences for the interpretation of the results. First, theassumption that the second event in a 2-beat patternincludes characteristics of both Wrst and last unaccentedevents in a pattern may have inXuenced the contrast withthe accented events. More detailed analyses are needed totest this, but as this would not exaggerate the diVerence butinstead diminish it, the eVect may actually be a bit largerthan demonstrated here. The decomposed time courses perevent shown in Fig. 7, however, support our assumption.Then, considering that imagery is never completely con-trolled we must allow for the possibility that participantswere in fact using inner speech or imagery after all, in con-trary to explicit instructions. Also, as we were interested incollecting a maximal amount of imagery data, the stimuliwere constructed to always have perception precedingimagery. Although the Wrst cycle of each sequence wasnever used and treated as an instruction cycle, there was aWxed order of tasks in the design. However, as it is notpossible to ‘continue a pattern internally’ that is notpresented Wrst, this opportunity was used to extend this pre-sentation to a series of perception trials. Finally, there weresubtle diVerences between the tasks that involve more thanthe task itself. As previously mentioned, the fact that the‘perception’ part of the sequence also includes an elementof instruction, and preparation for imagery, has to be keptin mind. However, by decomposing the data based on themean over both tasks the risk of these processes causing thefound eVects is minimal. Moreover, if these eVects would
123
Psychological Research (2011) 75:95–106 105
be present, the increase in variance would again cause anunderestimation of the eVect instead of an overestimation.
Considering the literature cited earlier, we can say thatthe N1/P2 eVect that was expected for the accented eventsis actually aVecting the unaccented events as well, althoughthe diVerence is found mostly in the P2-part of the com-plex, in a similar time window as where Fujioka et al.(2010) found an eVect of accenting. Interestingly, this com-ponent has been found to be aVected by spectral aspects (ortimbre) of an auditory stimulus (Shahin, Roberts, Pantev,Trainor, & Ross, 2005; Meyer et al., 2006). Given that thestimuli were identical in the imagery task, in this case thepercept is completely self-generated. This is even moreinteresting in the comparison between Wrst and last unac-cented events, where even in the Perception task the stimu-lus is identical. The later, frontal eVect is harder tointerpret. The reduced negativity seen in the Wrst unac-cented events may support the interpretation of a CNV-likeresponse for the last unaccented events, however the factthat it is also present in the accented events contradicts this.To a certain extent, there is of course anticipation for everyevent, as the stimulus is intentionally rhythmic. Also, as theWrst unaccented events all lead to events with diVerentfunctions the level of anticipation, the levels of anticipationwould likely diVer. Again, the decomposed time coursesper type of event shown in Fig. 7 tend to support the group-ing we made here in terms of how components contribute toeach event, especially for the primary component explain-ing most of the variance. If however we interpret theabsence of the positivity in the accented events as extraanticipation for the Wrst unaccented beat, this would lendnew importance to this event in the cycle, not suggested byeither music theory or cognitive theory. On the other hand,if we interpret this as a somewhat late processing negativitypresent for the accented and the last unaccented, this wouldWt quite well. Although not explicitly discussed as a com-ponent related to rhythmic processing, a frontal componentwith a similar latency is seen in other studies that involverhythmic musical stimuli (for instance Pearce et al., 2010;Jongsma et al., 2005), and further work is called for to elu-cidate this response. If we consider this negativity a default,then its absence for the Wrst unaccented events may beinterpreted as reduced processing, which is supported bythe lack of information present in the stimulus at this posi-tion (i.e. no accent and no anticipation). The early process-ing negativity found by Potter et al. (2009) was not seenhere for the accented events, in either perception or imag-ery. Looking back at the coupled oscillator models, thedecomposition results do not support the view of multipleprocesses resulting in the responses to the rhythmic events.The diVerence between the two types of unaccented eventsis captured mostly in the main PCA component, as is thediVerence between accented events and the Wrst unaccented
events. Thus, the interplay between varying levels of atten-tion, expectation and processing is not separable by statisti-cal decomposition in our study.
To conclude, the current report shows processing ofmetronome clicks in a diVerent metric context to result indiVerent ERP responses, and thus to be heavily inXuencedby attention levels, even without diVerences in the percep-tual input. The decomposition through PCA yields an infor-mative look at the subprocesses involved, oVering adecomposition that at least partly relates to the hierarchicallevels of rhythm processing. By identifying components thatwere active over both tasks (perception and imagery), wefound support for the notion that similar cerebral sources areactive in perceived and self-imposed patterns, although theyare clearly not identical. The time courses of these compo-nents could be interpreted to separate a more low-level eVecton the N1/P2 complex for the perception task, distinguish-ing accented from unaccented events, from a later, morefrontal eVect that distinguishes diVerent types of unaccentedevents in both tasks. As the current data are based only onsimple, regular metre, further work is needed to clarify thenature of these responses in the framework of processingmodels such as coupled oscillators. Also, other IOIs mayproduce diVerent responses. Even so, a strong case has beenmade to distinguish between diVerent types of unaccentedevents within one rhythmic pattern when researching cere-bral mechanisms of rhythm processing. Additionally, in theabsence of any externally driven process, self-generated orimagined rhythms were shown to be measurable in EEG,diVerentiating responses based on the rhythmic context.
Acknowledgments Thanks to Justin London for comments on anearlier version of the manuscript, and Jason Farquhar for helpfuldiscussions. The authors gratefully acknowledge the support of theBrainGain Smart Mix Programme of the Netherlands Ministry ofEconomic AVairs and the Netherlands Ministry of Education, Cultureand Science, and the Dutch Technologiestichting STW.
Open Access This article is distributed under the terms of the Crea-tive Commons Attribution Noncommercial License which permits anynoncommercial use, distribution, and reproduction in any medium,provided the original author(s) and source are credited.
References
Abecasis, D., Brochard, R., Granot, R., & Drake, C. (2005). DiVeren-tial brain response to metrical accents in isochronous auditory se-quences. Music Perception, 22(3), 549–562.
Bolton, T. L. (1894). Rhythm. American Journal of Psychology, 6,145–238.
Boring, E. G. (1942). Sensation and perception in the history of experi-mental psychology. New York: Appleton-Century.
Brochard, R., Abecasis, D.,Potter, D., Ragot, R., & Drake, C. (2003).The “ticktock” of our internal clock: Direct brain evidence of sub-jective accents in isochronous sequences. Psychological Science14(4), 362–366.
123
106 Psychological Research (2011) 75:95–106
Chen, Y., Huang, X., Yang, B., Jackson, T., Peng, C., Yuan, H., & Liu,C. (2010). An event-related potential study of temporal informa-tion encoding and decision making. NeuroReport 21, 152–155.
Desain, P. (1992). A (de)composable theory of rhythm perception.Music Perception, 9(4), 439–454.
Desain P., & Honing, H. (1992) Music, Mind and Machine: Studies inComputer Music, Music Cognition and ArtiWcial Intelligence.Amsterdam: Thesis Publishers.
Dien J., & FrishkoV, G. A. (2005). Principal components analysis ofevent-related potential datasets. In T. Handy (Eds.), Event-relatedpotentials: A methods handbook. Cambridge. MA: MIT Press.
Drake, C., Jones, M. R., & Baruch, C. (2000). The development ofrhythmic attending in auditory sequences: attunement, referentperiod, focal attending. Cognition, 77, 251–288.
Fujioka, T., Zendel, B. R., & Ross, B. (2010). Endogenous neuromag-netic activity for mental hierarchy of timing. Journal of Neurosci-ence, 30(9), 3458–3466.
Geiser, E., Zaehle, T., Jancke, L., & Meyer, M. (2008). The neural cor-relate of speech rhythm as evidences by metrical speech process-ing. Journal of Cognitive Neuroscience, 20(3), 541–552.
Geiser, E., Ziegler, E., Jancke, L., & Meyer, M. (2009). Early electro-physiological correlates of meter and rhythm processing in musicperception. Cortex, 45, 93–102.
Hamano, T., Lüders, H. O., Ikeda, A., Collura, T. F., Comair, Y. G., &Shibasaki, H. (1997). The cortical generators of the contingentnegative variation in humans: a study with subdural electrodes.Electroencephalography and Clinical Neurophysiology,104:257–268.
Hauk, O., Pulvermüller, F., Ford, M., Marslen-Wilson, W. D., &Davis, M. (2008). Can I have a quick word? early electrophysio-logical manifestations of psycholinguistic processes revealedby event-related regression analysis of the EEG. BiologicalPsychology, 80(1), 64–74.
Hillyard, S. A., Hink, R. F., Schwent, V. L., & Picton, T. W. (1973).Electrical signs of selective attention in the human brain. Science,182, 177–180.
Huron, D. (2006). Sweet anticipation: music and the psychology ofexpectation. Cambridge, MA: MIT Press.
Iversen, J. R., Repp, B. H., & Patel, A. D. (2009). Top-down control ofrhythm perception modulates early auditory responses. Annals ofthe New York Academy of Sciences, 1169, 58–73.
Jones, M. R., & Boltz, M. (1989). Dynamic attending and responses totime. Psychological Review, 96(3), 459–491.
Jongsma, M. L. A., Eichele, T., Quian Quiroga, R., Jenks, K. M.,Desain, P., Honing, H., & van Rijn, C. M. (2005). ExpectancyeVects on omission evoked potentials in musicians and non-musi-cians. Psychophysiology, 42(2), 191–201.
Kuck, H., Grossbach, M., Bangert, M., & Altenmüller, E. (2003).Brain processing of meter and rhythm in music: electrophysiolog-ical evidence of a common network. Annals of the New YorkAcademy of Sciences, 999, 244–253.
Ladinig, O., Honing, H., Háden, G., & Winkler, I. (2009). Probingattentive and preattentive emergent meter in adult listeners with-out extensive music training. Music Perception, 26(4), 377–386.
Large, E. W., & Jones, M. R. (1999). The dynamics of attending: Howpeople track time-varying events. Psychological Review, 106(1),119–159.
Large, E. W., & Kolen, J. F. (1995). Resonance and the perception ofmusical meter. Connection Science, 6, 177–208.
Lerdahl, F., & JackendoV, R. (1983). A generative theory of tonal mu-sic. Cambridge, MA: MIT Press.
London, J. (2004). Hearing in time: Psychological aspects of musicalmeter. Oxford: Oxford University Press.
Longuet-Higgins, H. C., & Lee, C. S. (1984). The rhythmic interpreta-tion of monophonic music. Music Perception, 1, 424–441.
Makeig, S., Jung, A., Bell, D., Ghahremani, A. J., & Sejnowski, T. J.(1997). Blind separation of auditory event-related brain responsesinto independent components. Proceedings of the National Acad-emy of Sciences of the United States of America, 94:10979–10984.
Maris, E. (2004). Randomization tests for ERP topographies and wholespatiotemporal data matrices. Psychophysiology, 41(1), 142–151.
Maris, E., & Oostenveld, R. (2007). Nonparametric testing of EEG-and MEG-data. Journal of Neuroscience Methods, 164, 177–190.
Meyer, M., Baumann, S., & Jancke, L. (2006). Electrical brain imagingreveals spatio-temporal dynamics of timbre perception in hu-mans. NeuroImage, 32, 1510–1523.
Näätänen, R. (1975). Selective attention and evoked potentials in hu-mans–a critical review. Biological Psychology, 2, 237–307.
Näätänen, R. (1982). Processing negativity: An evoked-potentialreXection of selective attention. Psychological Bulletin, 92(3),605–640.
Näätänen, R., & Picton, T. (1987). The N1 wave of the human electricand magnetic response to sound: a review and an analysis of thecomponent structure. Psychophysiology, 24(4), 375–425.
Pearce, M. T., Herrojo Ruiz, M., Kapasi, S., Wiggins, G. A., &Bhattacharya, J. (2010). Unsupervised statistical learningunderpins computational, behavioral, and neural manifestationsof musical expectation. NeuroImage, 50, 302–313.
Perrin, F., Pernier, J., Bertrand, O., & Echallier, J. F. (1989). Sphericalsplines for scalp potential and current mapping. Electroencepha-lography and Clinical Neurophysiology, 72(2), 184–187.
Potter, D., Fenwick, M., Abecasis, D., & Brochard, R. (2009). Perceiv-ing rhythm where none exists: Event-related potential (ERP)correlates of subjective accenting. Cortex, 45, 103–109.
Repp, B. H. (2007). Perceiving the numerosity of rapidly occurringauditory events in metrical and nonmetrical contexts. Perceptionand Psychophysics, 69(4), 529–543.
Schaefer, R. S., Desain, P., & Suppes, P. (2009). Structural decompo-sition of EEG signatures of melodic processing. BiologicalPsychology, 82, 253–259.
Shahin, A., Roberts, L. E., Pantev, C., Trainor, L. J., & Ross, B. (2005).Modulation of p2 auditory-evoked responses by the spectralcomplexity of sounds. NeuroReport, 16(16), 1781–1785.
Snyder, J. S., & Large, E. W. (2005). Gamma-band activity reXects themetric structure of rhythmic tone sequences. Cognitive BrainResearch, 24, 117–126.
Walter, W. G., Cooper, R., Aldridge, V. J., McCallum, W. C., &Winter, A. L. (1964). Contingent negative variation: an electricsign of sensorimotor association and expectancy in the humanbrain. Nature, 203, 380–384.
Winkler, I., Denham, S. L., & Nelken, I. (2009). Modeling the auditoryscene: predictive regularity representations and perceptualobjects. Trends in Cognitive Sciences, 13(12), 532–540.
123